Embed Size (px)
Citation preview
1
POWER SUPPLY TO INDUSTRIES– Pros and Cons of Available Options
BYEngr. Prof. DAVID A. ADERIBIGBE
MANAGING DIRECTORi3M POWER SYSTEMS LTD
PLOT 1E, LIGALI AYORINDE STREETVICTORIA ISLAND
A Presentation at the one-day conference of the Nigerian Society of Chemical Engineers( a Division of NSE), held at the Ikeja Sheraton Hotel and Towers, Lagos .
(07/10/10)
2
OUTLINE OF PRESENTATION
• Introduction• Historical Background & Performance of the Supply of Electricity in Nigeria
- Background- Energy Resources in Nigeria- Electricity Supply Situation & Need for Action
• Reform of the Nigerian Electricity Supply Industry- Objective of the Power Sector Reform Bill
• Electric Power Sector Reform Act, 2005- Organization,Roles & Functions of Government Stakeholders
(MOP,PHCN, NERC)- The Nigerian Electricity Regulatory Commission (NERC)- NERC Regulatory Instruments- Rural Electrification Agency (REA)
• Emergence & Role of Independent Power Producers (IPPs)• Power Supply Need of the Manufacturers Association of Nigeria• Roadmap for Power Sector reform in Nigeria• Options Available to Industries in Nigeria
3
INTRODUCTION
• Nigeria is presently faced with the challenge of providing sustainable, adequate, reliable and efficient electricity supplyto residential, commercial and industrial consumers. This situation has adversely affected the social and economic life of the citizenry.
• Electricity is a cornerstone on which the economy and the daily lives of Nigerians depend. This essential commodity has no substitute. Unlike most commodities, electricity cannot easily be stored, so it must be produced (by the Generating Plants using any of the available energy resources – Coal, Gas, Oil, Hydro, Solar, Wind or Nuclear) at the same instant that it is consumed.
• The electricity delivery system (i.e. Transmission and Distribution networks) must therefore be robust and flexible enough, every second of the day and every day of the year, to accommodate the nation’s demand for electricity and deliver regular, reliable and affordable electricity especially in our production economy.
4
OBJECTIVE
The objective in this presentation is basically fourfold, viz;i) Review of the Performance of the Electric Power Supply Industry in Nigeria and the need for Reform.
ii) Discuss the Electric Power Supply Situation of the Nigerian Industries from the considerations of power demand, available energy resources and the factors that determine Industrial Tariff for Electricity.
iii) Review the current Federal Government Roadmap for Power Sector Reform with emphasis on the implications for the Nigerian industries.
iv) Discuss the options available to the Nigerian Industries within the context of the Federal Government Roadmap for power sector reform
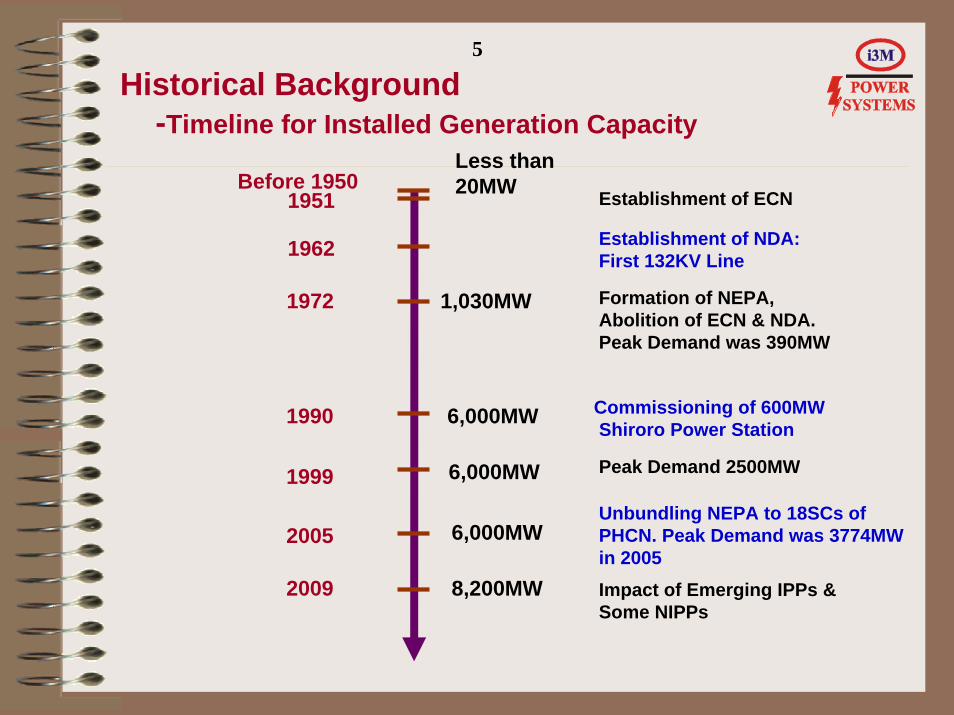
Historical Background-Timeline for Installed Generation Capacity
5
Less than 20MWBefore 1950
1972 1,030MW
2005
2009
6,000MW
8,200MW
Formation of NEPA,Abolition of ECN & NDA.Peak Demand was 390MW
Unbundling NEPA to 18SCs of PHCN. Peak Demand was 3774MW in 2005Impact of Emerging IPPs &Some NIPPs
1999 6,000MW Peak Demand 2500MW
1990 6,000MW Commissioning of 600MWShiroro Power Station
1951
1962
Establishment of ECN
Establishment of NDA: First 132KV Line
6
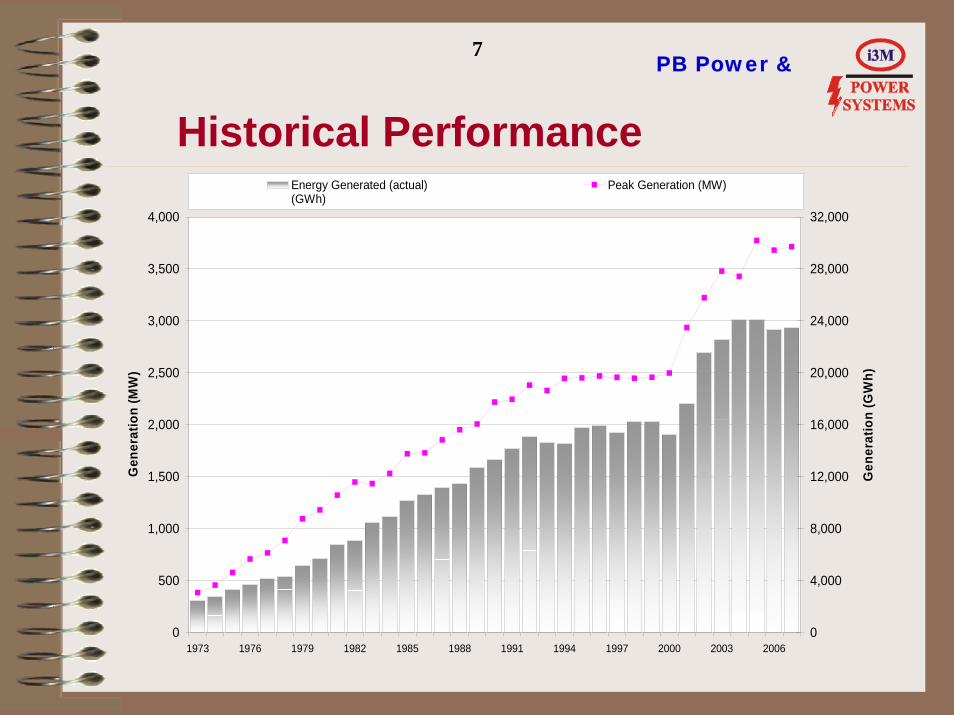
Historical Performance• From 1973-1992 electricity generation increased at a rate of
approximately 10 per cent per annum.
• The rate of growth fell significantly during the 1990s due to lack of investment.
• Trend reversed from 2001 with steady rehabilitation of generating plant and the introduction of private sector investment in generating plant. On August 8, 2005, the peak generation was 3774 MW and energy produced was 24 077 GWh. This was about 95% of the available generation of 4000MW (after the rehabilitation of NEPA electricity supply facilities in 2004 by the Technical Board).
• Continued lack of investment combined with poor maintenance/management practice resulted in reductions in available capacity. Current peak generation (as at April 19, 2010) is about 3666.7 MW. This is only 61% of the 6000MW target for expected available generation in December 2009.
7PB Power &
Historical Performance
0
500
1,000
1,500
2,000
2,500
3,000
3,500
4,000
1973 1976 1979 1982 1985 1988 1991 1994 1997 2000 2003 2006
Gen
erat
ion
(MW
)
0
4,000
8,000
12,000
16,000
20,000
24,000
28,000
32,000
Gen
erat
ion
(GW
h)
Energy Generated (actual)(GWh)
Peak Generation (MW)
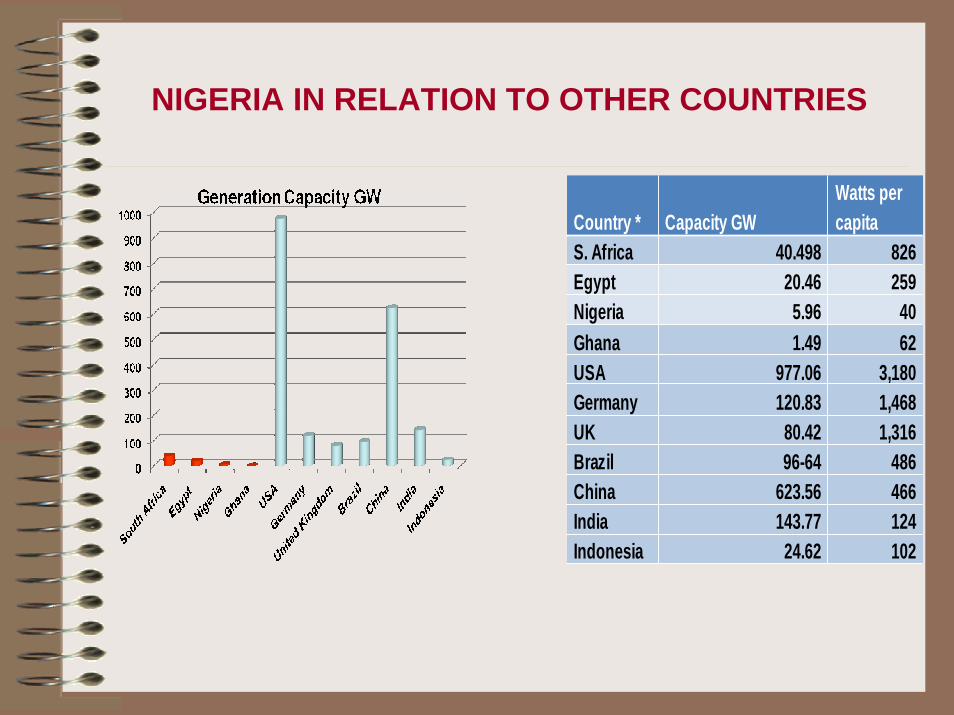
NIGERIA IN RELATION TO OTHER COUNTRIES
Country * Capacity GWWatts per capita
S. Africa 40.498 826Egypt 20.46 259Nigeria 5.96 40Ghana 1.49 62USA 977.06 3,180Germany 120.83 1,468UK 80.42 1,316Brazil 96-64 486China 623.56 466India 143.77 124Indonesia 24.62 102
Country * Capacity GWWatts per capita
S. Africa 40.498 826Egypt 20.46 259Nigeria 5.96 40Ghana 1.49 62USA 977.06 3,180Germany 120.83 1,468UK 80.42 1,316Brazil 96-64 486China 623.56 466India 143.77 124Indonesia 24.62 102
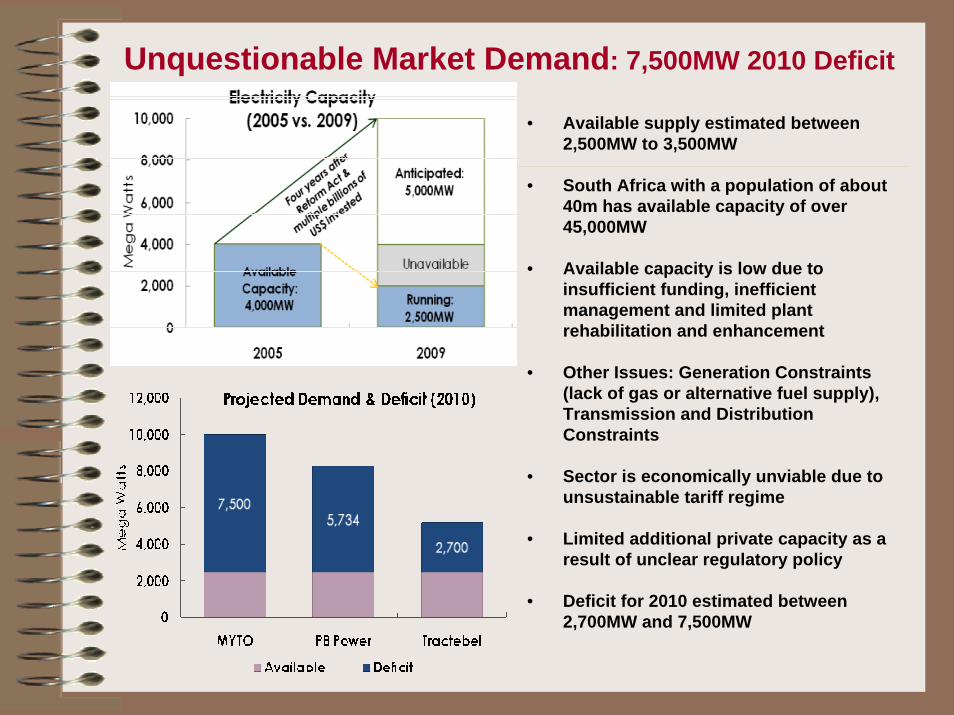
Unquestionable Market Demand: 7,500MW 2010 Deficit
• Available supply estimated between2,500MW to 3,500MW
• South Africa with a population of about 40m has available capacity of over 45,000MW
• Available capacity is low due to insufficient funding, inefficient management and limited plant rehabilitation and enhancement
• Other Issues: Generation Constraints (lack of gas or alternative fuel supply), Transmission and Distribution Constraints
• Sector is economically unviable due to unsustainable tariff regime
• Limited additional private capacity as a result of unclear regulatory policy
• Deficit for 2010 estimated between 2,700MW and 7,500MW
10
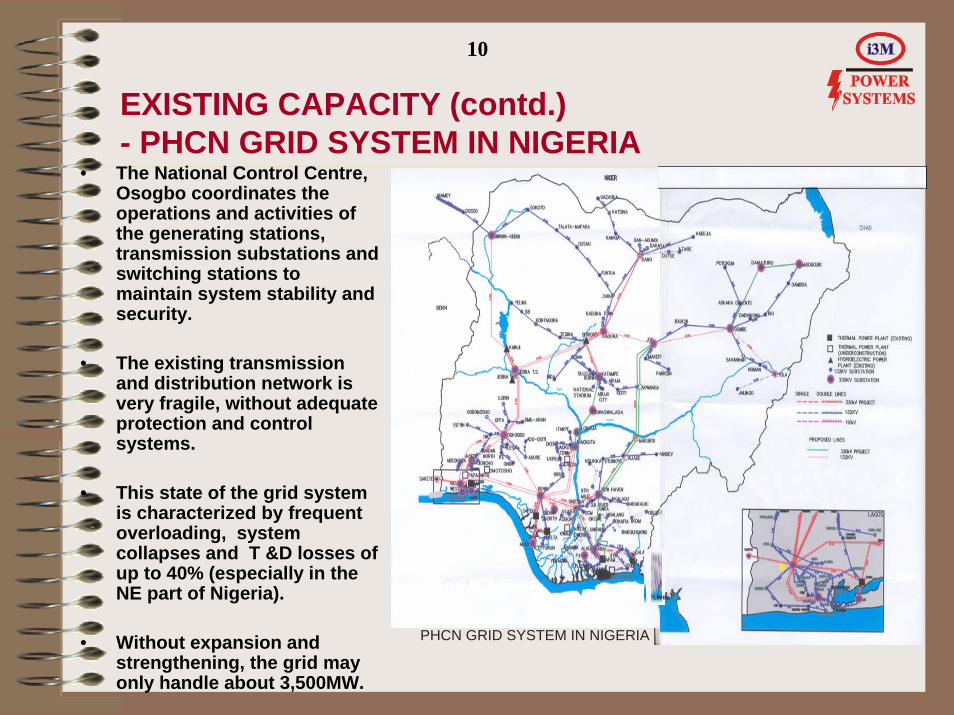
EXISTING CAPACITY (contd.) - PHCN GRID SYSTEM IN NIGERIA
• The National Control Centre, Osogbo coordinates the operations and activities of the generating stations, transmission substations and switching stations to maintain system stability and security.
• The existing transmission and distribution network is very fragile, without adequate protection and control systems.
• This state of the grid system is characterized by frequent overloading, system collapses and T &D losses of up to 40% (especially in the NE part of Nigeria).
• Without expansion and strengthening, the grid may only handle about 3,500MW.
LIMBE
PHCN GRID SYSTEM IN NIGERIA
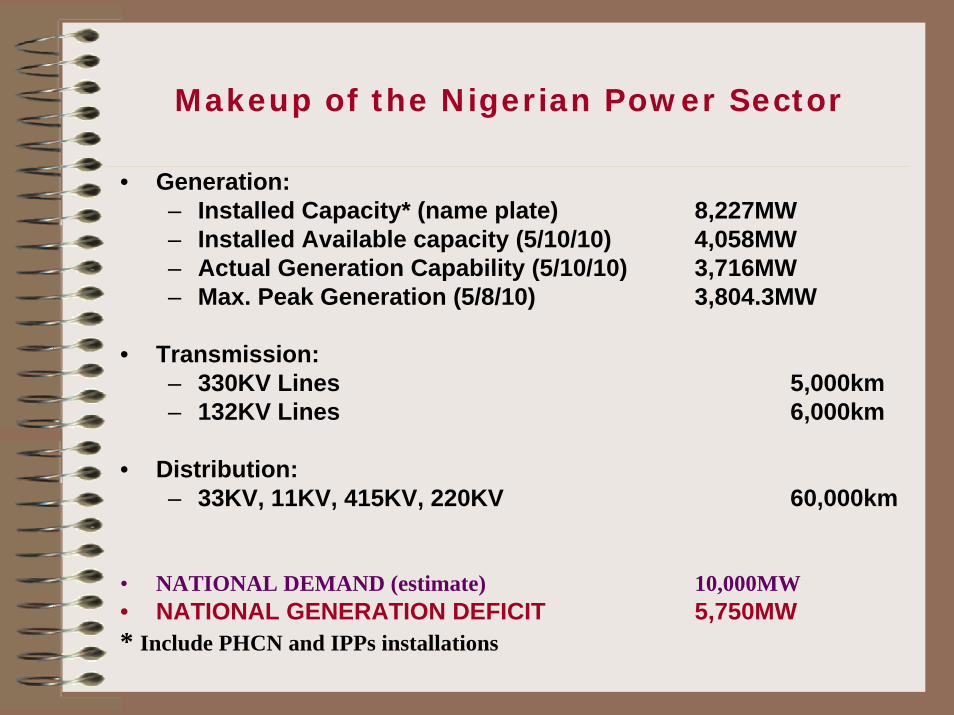
Makeup of the Nigerian Power Sector
• Generation:– Installed Capacity* (name plate) 8,227MW– Installed Available capacity (5/10/10) 4,058MW– Actual Generation Capability (5/10/10) 3,716MW– Max. Peak Generation (5/8/10) 3,804.3MW
• Transmission:– 330KV Lines 5,000km– 132KV Lines 6,000km
• Distribution:– 33KV, 11KV, 415KV, 220KV 60,000km
• NATIONAL DEMAND (estimate) 10,000MW• NATIONAL GENERATION DEFICIT 5,750MW* Include PHCN and IPPs installations
12
ENERGY RESOURCES IN NIGERIA
• Renewable- Hydro (Kainji, Shiroro, Jebba,Gurara etc.)- Solar- Wind
• Non Renewable- Coal ( Enugu,Onyeama,Ogboyoga,Okaba,
Orukpa,Ezimo) - Oil & Gas ( Afam, Egbin,Ughelli, Sapele,
NIPP projects etc.)
13
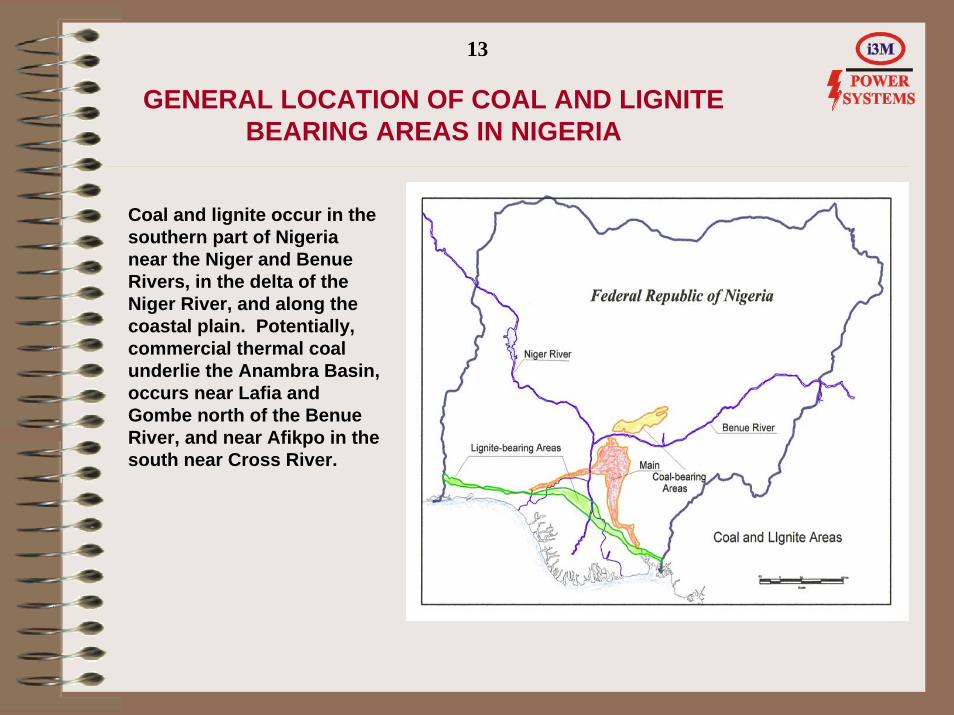
GENERAL LOCATION OF COAL AND LIGNITE BEARING AREAS IN NIGERIA
Coal and lignite occur in the southern part of Nigeria near the Niger and BenueRivers, in the delta of the Niger River, and along the coastal plain. Potentially, commercial thermal coal underlie the Anambra Basin, occurs near Lafia and Gombe north of the BenueRiver, and near Afikpo in the south near Cross River.
14
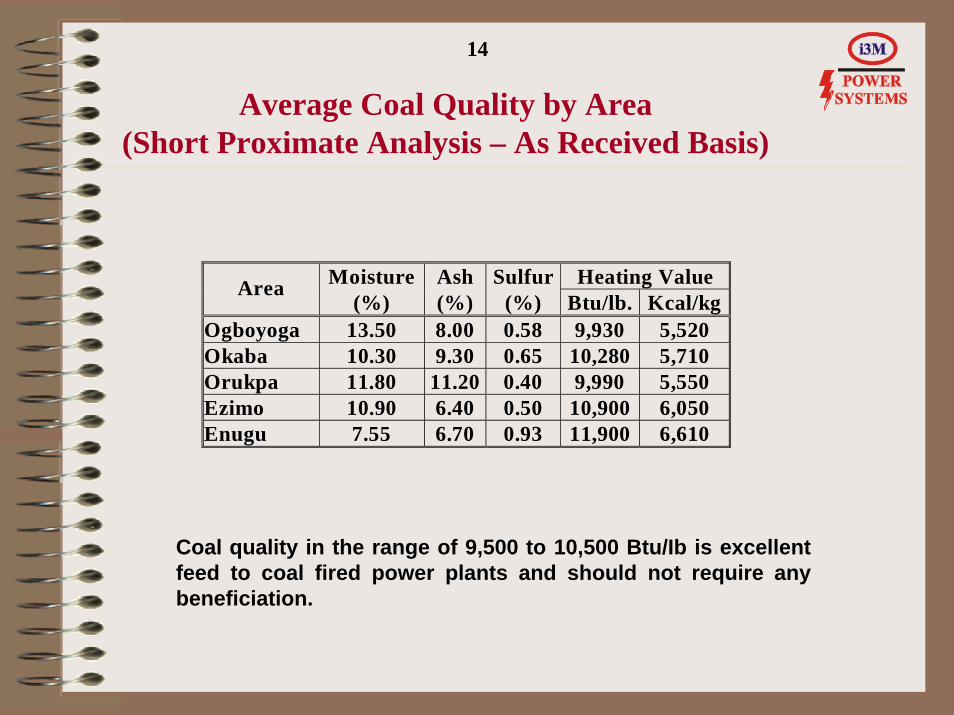
Average Coal Quality by Area(Short Proximate Analysis – As Received Basis)
Moisture Ash Sulfur Heating Value Area (%) (%) (%) Btu/lb. Kcal/kg
Ogboyoga 13.50 8.00 0.58 9,930 5,520 Okaba 10.30 9.30 0.65 10,280 5,710 Orukpa 11.80 11.20 0.40 9,990 5,550 Ezimo 10.90 6.40 0.50 10,900 6,050 Enugu 7.55 6.70 0.93 11,900 6,610
Coal quality in the range of 9,500 to 10,500 Btu/Ib is excellent feed to coal fired power plants and should not require any beneficiation.
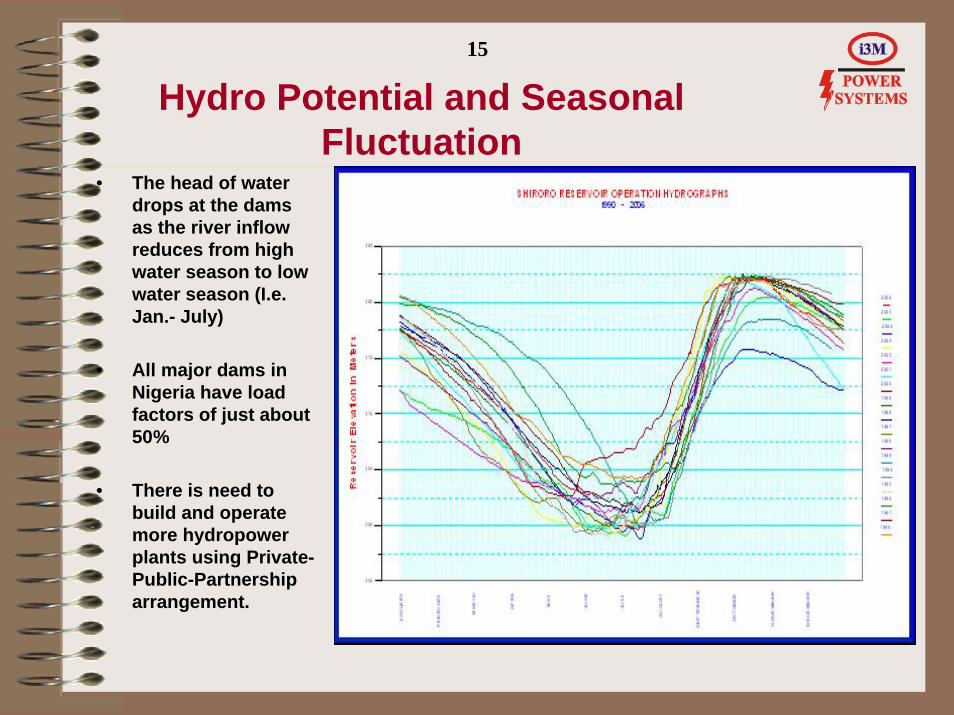
Hydro Potential and Seasonal Fluctuation
• The head of water drops at the dams as the river inflow reduces from high water season to low water season (I.e. Jan.- July)
• All major dams in Nigeria have load factors of just about 50%
• There is need to build and operate more hydropower plants using Private-Public-Partnership arrangement.
15
16
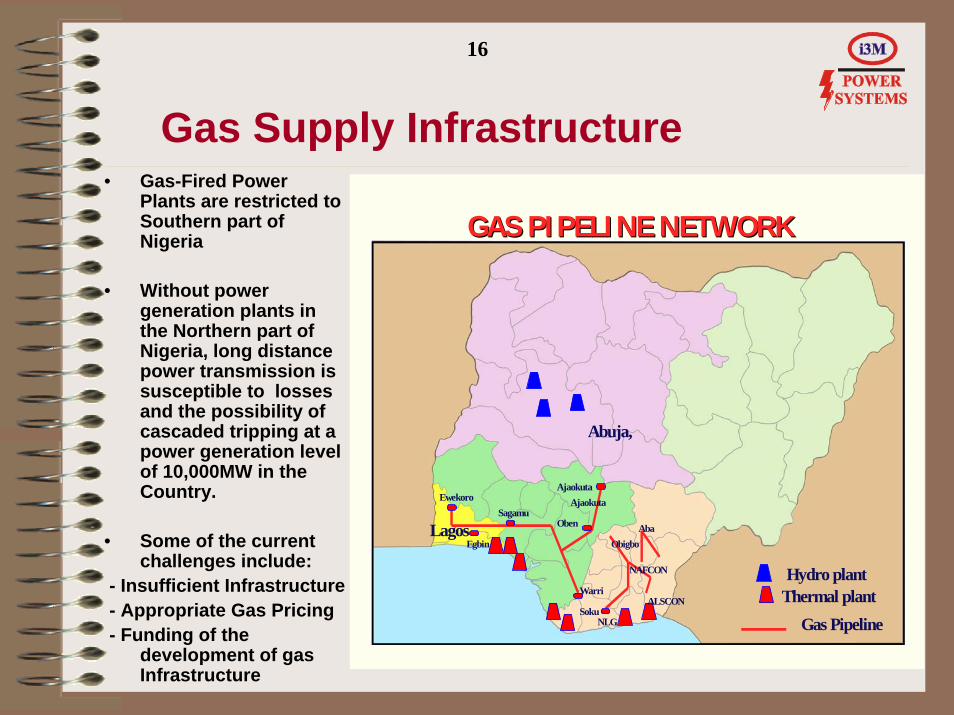
Gas Supply Infrastructure• Gas-Fired Power
Plants are restricted to Southern part of Nigeria
• Without power generation plants in the Northern part of Nigeria, long distance power transmission is susceptible to losses and the possibility of cascaded tripping at a power generation level of 10,000MW in the Country.
• Some of the current challenges include:
- Insufficient Infrastructure- Appropriate Gas Pricing- Funding of the
development of gas Infrastructure
Hydro plantThermal plant
GAS PIPELINE NETWORKGAS PIPELINE NETWORK
Lagos
Abuja,
Gas Pipeline
Ajaokuta
Oben
Ewekoro
Egbin
Sagamu
Warri
Soku
NAFCON
ObigboAba
NLG
ALSCON
Ajaokuta
17
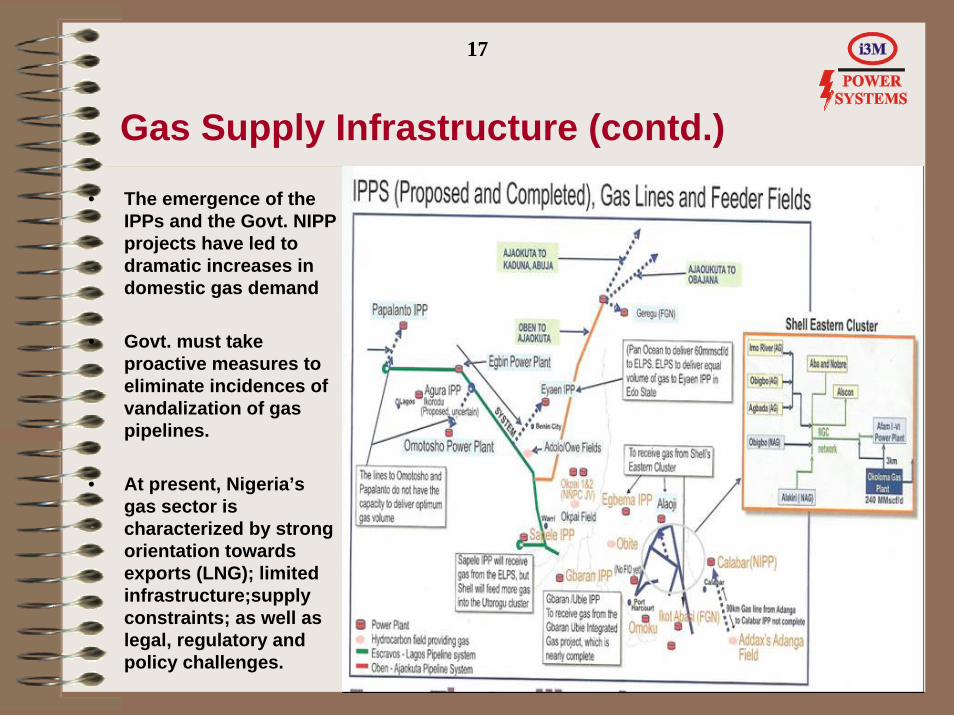
Gas Supply Infrastructure (contd.)
• The emergence of the IPPs and the Govt. NIPP projects have led to dramatic increases in domestic gas demand
• Govt. must take proactive measures to eliminate incidences of vandalization of gas pipelines.
• At present, Nigeria’s gas sector is characterized by strong orientation towards exports (LNG); limited infrastructure;supply constraints; as well as legal, regulatory and policy challenges.
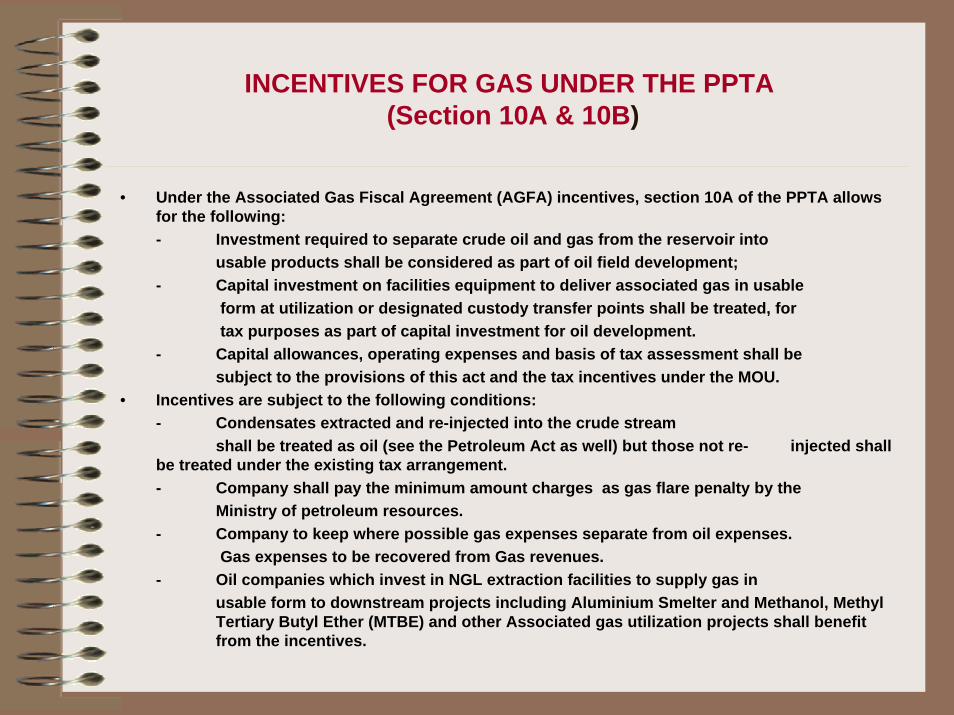
INCENTIVES FOR GAS UNDER THE PPTA(Section 10A & 10B)
• Under the Associated Gas Fiscal Agreement (AGFA) incentives, section 10A of the PPTA allows for the following:- Investment required to separate crude oil and gas from the reservoir into
usable products shall be considered as part of oil field development;- Capital investment on facilities equipment to deliver associated gas in usable
form at utilization or designated custody transfer points shall be treated, fortax purposes as part of capital investment for oil development.
- Capital allowances, operating expenses and basis of tax assessment shall be subject to the provisions of this act and the tax incentives under the MOU.
• Incentives are subject to the following conditions:- Condensates extracted and re-injected into the crude stream
shall be treated as oil (see the Petroleum Act as well) but those not re- injected shall be treated under the existing tax arrangement. - Company shall pay the minimum amount charges as gas flare penalty by the
Ministry of petroleum resources.- Company to keep where possible gas expenses separate from oil expenses.
Gas expenses to be recovered from Gas revenues.- Oil companies which invest in NGL extraction facilities to supply gas in
usable form to downstream projects including Aluminium Smelter and Methanol, Methyl Tertiary Butyl Ether (MTBE) and other Associated gas utilization projects shall benefit from the incentives.
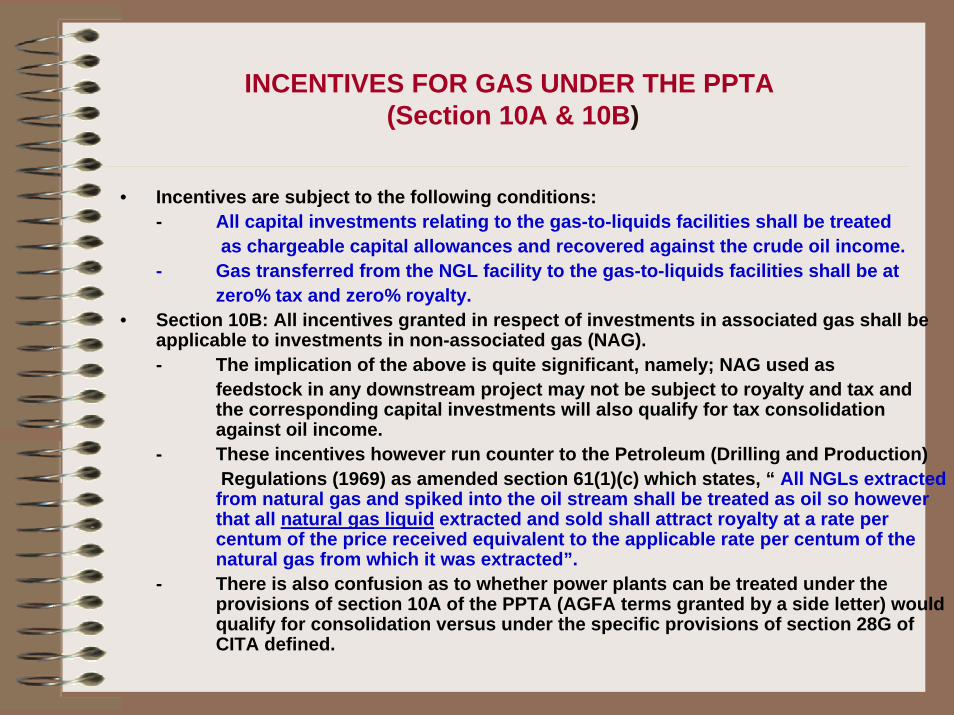
INCENTIVES FOR GAS UNDER THE PPTA(Section 10A & 10B)
• Incentives are subject to the following conditions:- All capital investments relating to the gas-to-liquids facilities shall be treated
as chargeable capital allowances and recovered against the crude oil income.- Gas transferred from the NGL facility to the gas-to-liquids facilities shall be at
zero% tax and zero% royalty.• Section 10B: All incentives granted in respect of investments in associated gas shall be
applicable to investments in non-associated gas (NAG).- The implication of the above is quite significant, namely; NAG used as
feedstock in any downstream project may not be subject to royalty and tax and the corresponding capital investments will also qualify for tax consolidation against oil income.
- These incentives however run counter to the Petroleum (Drilling and Production)Regulations (1969) as amended section 61(1)(c) which states, “ All NGLs extracted
from natural gas and spiked into the oil stream shall be treated as oil so however that all natural gas liquid extracted and sold shall attract royalty at a rate per centum of the price received equivalent to the applicable rate per centum of the natural gas from which it was extracted”.
- There is also confusion as to whether power plants can be treated under the provisions of section 10A of the PPTA (AGFA terms granted by a side letter) would qualify for consolidation versus under the specific provisions of section 28G of CITA defined.
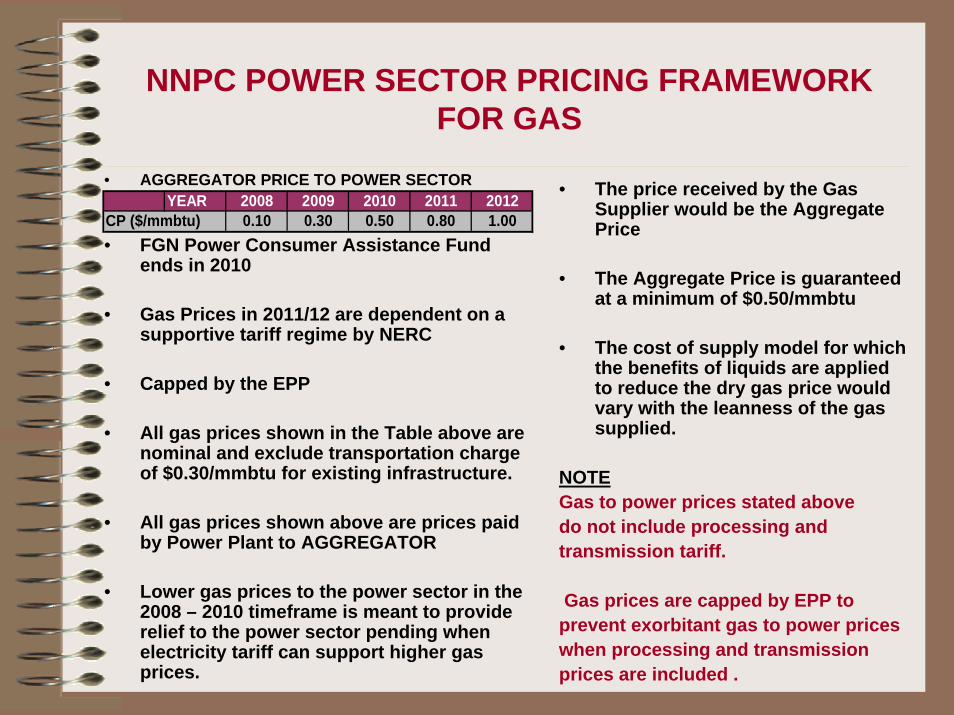
NNPC POWER SECTOR PRICING FRAMEWORK FOR GAS
• AGGREGATOR PRICE TO POWER SECTOR
• FGN Power Consumer Assistance Fund ends in 2010
• Gas Prices in 2011/12 are dependent on a supportive tariff regime by NERC
• Capped by the EPP
• All gas prices shown in the Table above are nominal and exclude transportation charge of $0.30/mmbtu for existing infrastructure.
• All gas prices shown above are prices paid by Power Plant to AGGREGATOR
• Lower gas prices to the power sector in the 2008 – 2010 timeframe is meant to provide relief to the power sector pending when electricity tariff can support higher gas prices.
• The price received by the Gas Supplier would be the Aggregate Price
• The Aggregate Price is guaranteed at a minimum of $0.50/mmbtu
• The cost of supply model for which the benefits of liquids are applied to reduce the dry gas price would vary with the leanness of the gas supplied.
NOTEGas to power prices stated above do not include processing and transmission tariff.
Gas prices are capped by EPP to prevent exorbitant gas to power prices when processing and transmission prices are included .
YEAR 2008 2009 2010 2011 2012CP ($/mmbtu) 0.10 0.30 0.50 0.80 1.00
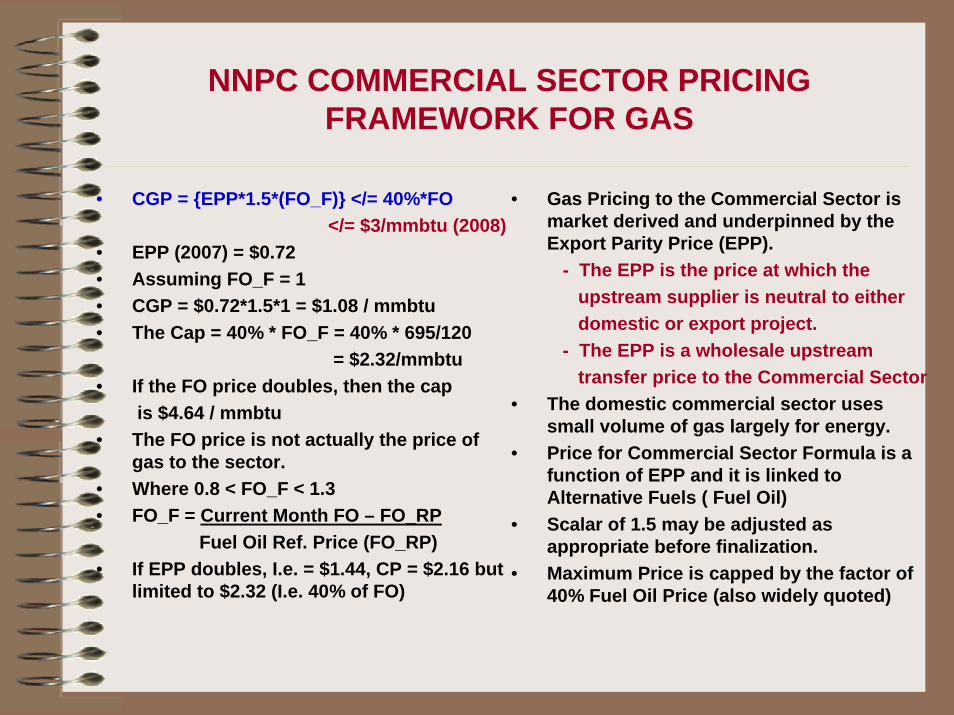
NNPC COMMERCIAL SECTOR PRICING FRAMEWORK FOR GAS
• CGP = {EPP*1.5*(FO_F)} </= 40%*FO</= $3/mmbtu (2008)
• EPP (2007) = $0.72• Assuming FO_F = 1• CGP = $0.72*1.5*1 = $1.08 / mmbtu• The Cap = 40% * FO_F = 40% * 695/120
= $2.32/mmbtu• If the FO price doubles, then the cap
is $4.64 / mmbtu• The FO price is not actually the price of
gas to the sector.• Where 0.8 < FO_F < 1.3• FO_F = Current Month FO – FO_RP
Fuel Oil Ref. Price (FO_RP) • If EPP doubles, I.e. = $1.44, CP = $2.16 but
limited to $2.32 (I.e. 40% of FO)
• Gas Pricing to the Commercial Sector is market derived and underpinned by the Export Parity Price (EPP).
- The EPP is the price at which the upstream supplier is neutral to either domestic or export project.
- The EPP is a wholesale upstream transfer price to the Commercial Sector
• The domestic commercial sector uses small volume of gas largely for energy.
• Price for Commercial Sector Formula is a function of EPP and it is linked to Alternative Fuels ( Fuel Oil)
• Scalar of 1.5 may be adjusted as appropriate before finalization.
• Maximum Price is capped by the factor of 40% Fuel Oil Price (also widely quoted)
22
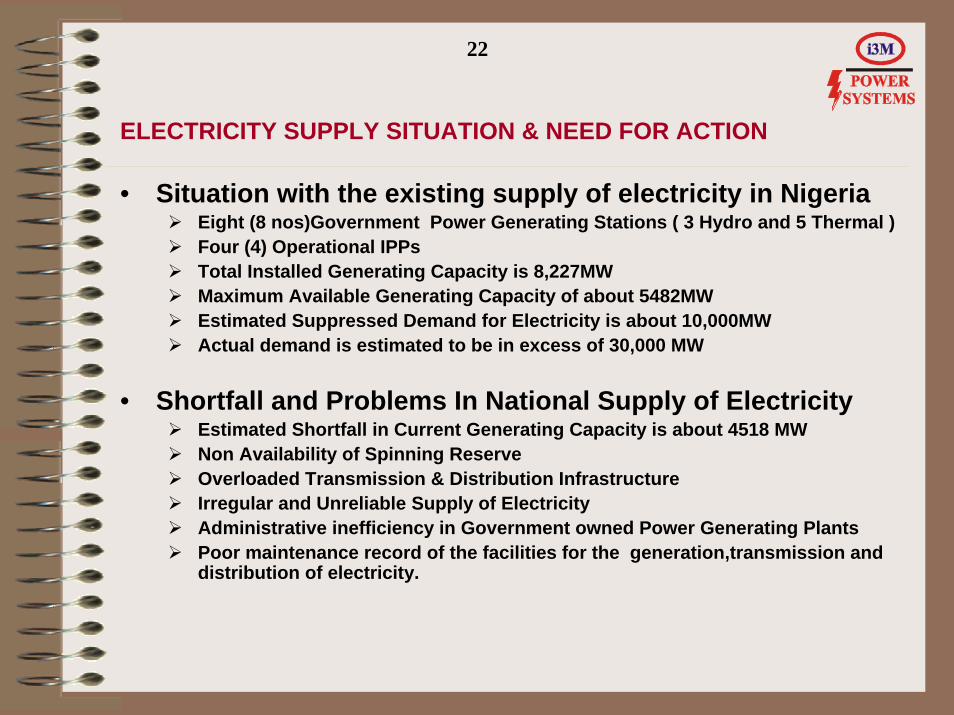
ELECTRICITY SUPPLY SITUATION & NEED FOR ACTION
• Situation with the existing supply of electricity in NigeriaEight (8 nos)Government Power Generating Stations ( 3 Hydro and 5 Thermal ) Four (4) Operational IPPsTotal Installed Generating Capacity is 8,227MWMaximum Available Generating Capacity of about 5482MWEstimated Suppressed Demand for Electricity is about 10,000MW Actual demand is estimated to be in excess of 30,000 MW
• Shortfall and Problems In National Supply of ElectricityEstimated Shortfall in Current Generating Capacity is about 4518 MWNon Availability of Spinning ReserveOverloaded Transmission & Distribution InfrastructureIrregular and Unreliable Supply of ElectricityAdministrative inefficiency in Government owned Power Generating Plants Poor maintenance record of the facilities for the generation,transmission and distribution of electricity.
23
REFORM OF THE NIGERIAN ELECTRICITY SUPPLY INDUSTRY
• This was carried out through the Electric Power Sector Reform Act, 2005. The EPSR Act provides for two stages of market development viz: pre-privatization stage and post privatization stage. Pre-Privatization is also known as the transition period.
• Pre-privatization stage of the electric power sector reform in Nigeria has, in addition to policy formulation, involved:
– Restructuring NEPA to give higher level autonomy to its 6 generating stations,one transmission/dispatch sector and the 11 distribution zones
– Legal and regulatory framework review leading to the promulgation of the new sector reform law (Electric Power Sector Act) in March 2005
– EPSR Act also provides for creation of an independent sector regulator (NERC) inaugurated in October 31, 2005
24
REFORM OF THE NIGERIAN ELECTRICITY SUPPLY INDUSTRY (Contd.)
Transformation of NEPA into :• An initial holding company, PHCN • Creation of a number of successor companies (six in generation,
one transmission and eleven distribution companies) to which the assets and liabilities of PHCN are to be transferred
• Creation of the Nigerian Electricity Liability Management Company (NELMCO).
The development of a competitive electricity market for Nigeria with multiple operators and limited entry barriers
• Successor companies along with the temporary bulk purchase & resale licensee and IPPs will operate in the market during the transition period
• Full competition will follow after privatization of SCs(SuccessorCompanies) and declaration by Minister (upon NERC’s advice) that the market is ready for full competition
25
ORGANIZATION, ROLES AND FUNCTIONS OF GOVERNMENT STAKEHOLDERS IN THE ELECTRICITY SUPPLY INDUSTRY
IN NIGERIA• The Ministry of Power is responsible for the development of electricity
policy in Nigeria.• The Minister may give general policy directions which NERC shall take
into consideration provided such directions are not in conflict with the Act and the Constitution.
• The roles of NERC in the restructured industry are to:– Provide a formal independent regulatory framework for the electricity
industry– Ensure sustainable growth, development and stability of the sector– Boost investor confidence while protecting the interests of
consumers.– Promote competition within the industry– Oversee the licensing and regulation of generation, transmission,
distribution and supply of electricity .– Set and enforce such matters as performance standards, consumer
rights and obligations. – Carry out the function of tariff management.– Enforce consumer service obligations– Provide all necessary regulatory functions for the electricity industry
26
NERC REGULATORY INSTRUMENTS
• Effective Regulation is the key to effective reform of the powersector in Nigeria.
• As sector regulator, NERC undertakes technical and economic regulation of the sector
• The major instruments of regulatory control adopted by NERC in carrying out its regulatory functions include:
– Primary and subsidiary Legislations– licences, – price regulation, – Industry Codes, Rules and Orders of the Commission
27
NERC REGULATORY INSTRUMENTS (Contd.)
• Primary Instrument – The EPSR Act No.6 , 2005• Secondary Instruments:-
– Subsidiary Legislations (Rules &Regulations) S.96 of the EPSR Act provides for drafting of the following Regulations:Administration of affairs of the Commission**Rights, obligations and duties of Licensees**License application, modification and cancellation procedures**Standards**Information required from LicenseesTariffs determination procedures**Fees, levies and other charges payable by Licensees**
Allowable Licensee assets, properties and investmentsCustomer-related matters**Licensee mergers, acquisition, affiliate relationshipsProcedures for market power monitoringTerms and conditions of system access by Licensees to other entitiesFines and penalties payable by LicenseesSuch other regulations as may be required
– ** Regulations already enacted by NERC
28
NERC REGULATORY INSTRUMENTS (Contd.)- Licenses
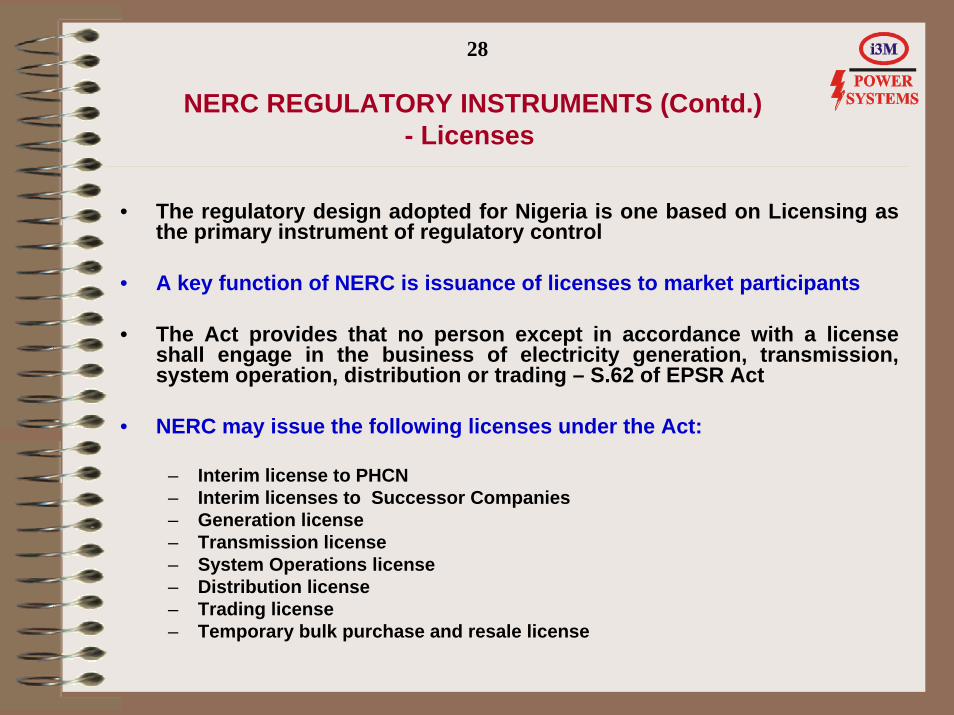
• The regulatory design adopted for Nigeria is one based on Licensing as the primary instrument of regulatory control
• A key function of NERC is issuance of licenses to market participants
• The Act provides that no person except in accordance with a license shall engage in the business of electricity generation, transmission, system operation, distribution or trading – S.62 of EPSR Act
• NERC may issue the following licenses under the Act:
– Interim license to PHCN– Interim licenses to Successor Companies– Generation license– Transmission license– System Operations license– Distribution license– Trading license– Temporary bulk purchase and resale license
29
NERC REGULATORY INSTRUMENTS (Contd.)- Licenses
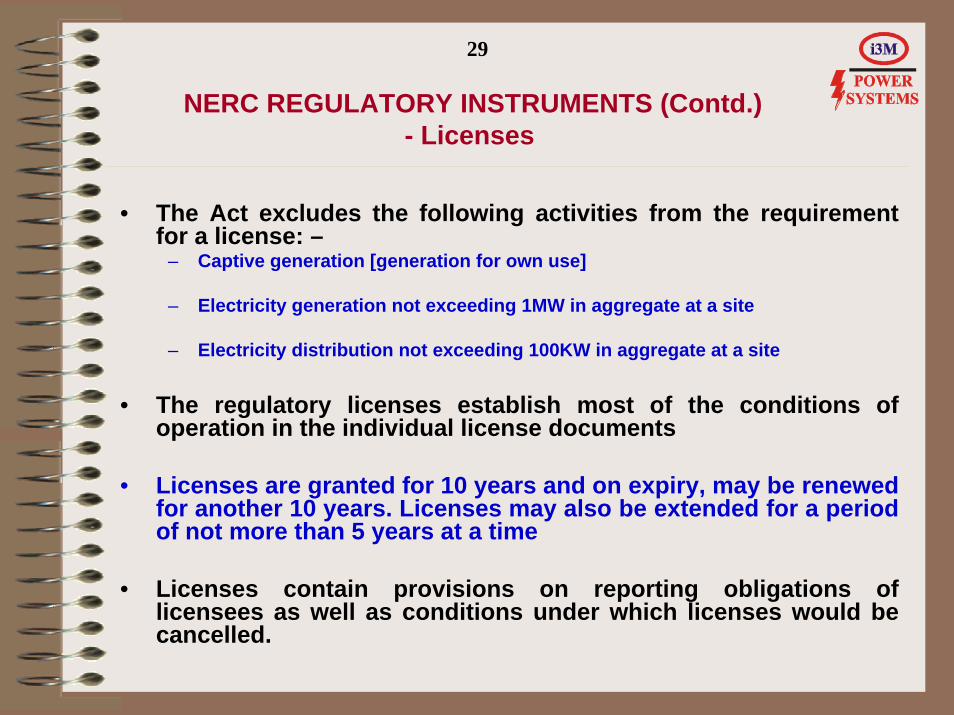
• The Act excludes the following activities from the requirement for a license: –
– Captive generation [generation for own use]
– Electricity generation not exceeding 1MW in aggregate at a site
– Electricity distribution not exceeding 100KW in aggregate at a site
• The regulatory licenses establish most of the conditions of operation in the individual license documents
• Licenses are granted for 10 years and on expiry, may be renewed for another 10 years. Licenses may also be extended for a periodof not more than 5 years at a time
• Licenses contain provisions on reporting obligations of licensees as well as conditions under which licenses would be cancelled.
30
NERC REGULATORY INSTRUMENTS (Contd.) - MARKET RULES
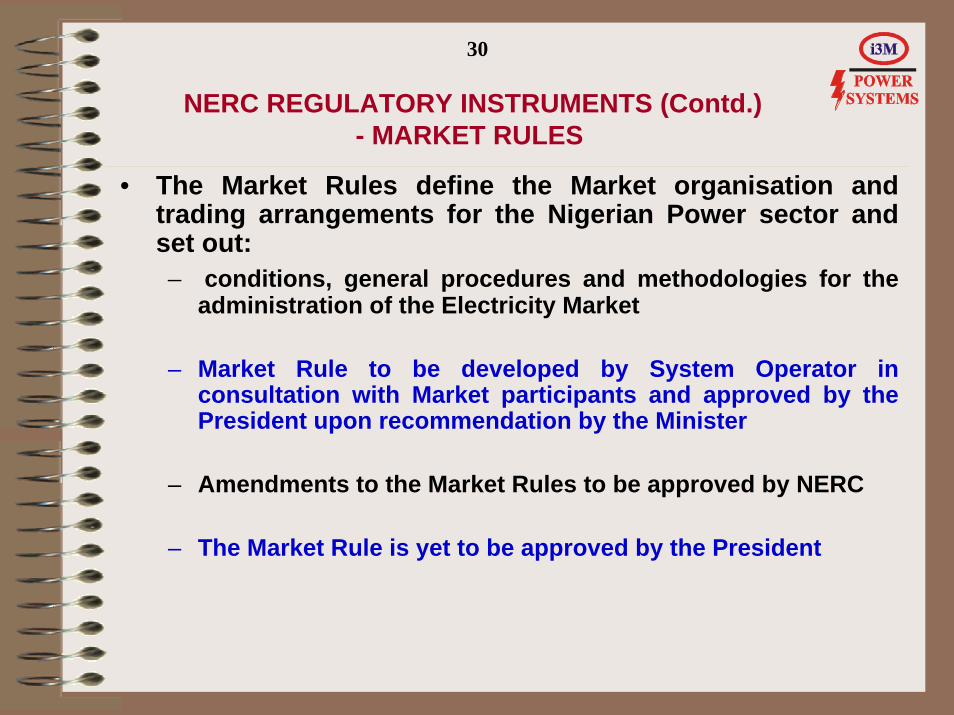
• The Market Rules define the Market organisation and trading arrangements for the Nigerian Power sector and set out:– conditions, general procedures and methodologies for the
administration of the Electricity Market
– Market Rule to be developed by System Operator in consultation with Market participants and approved by the President upon recommendation by the Minister
– Amendments to the Market Rules to be approved by NERC
– The Market Rule is yet to be approved by the President
31
NERC REGULATORY INSTRUMENTS (Contd.) - INDUSTRY CODES
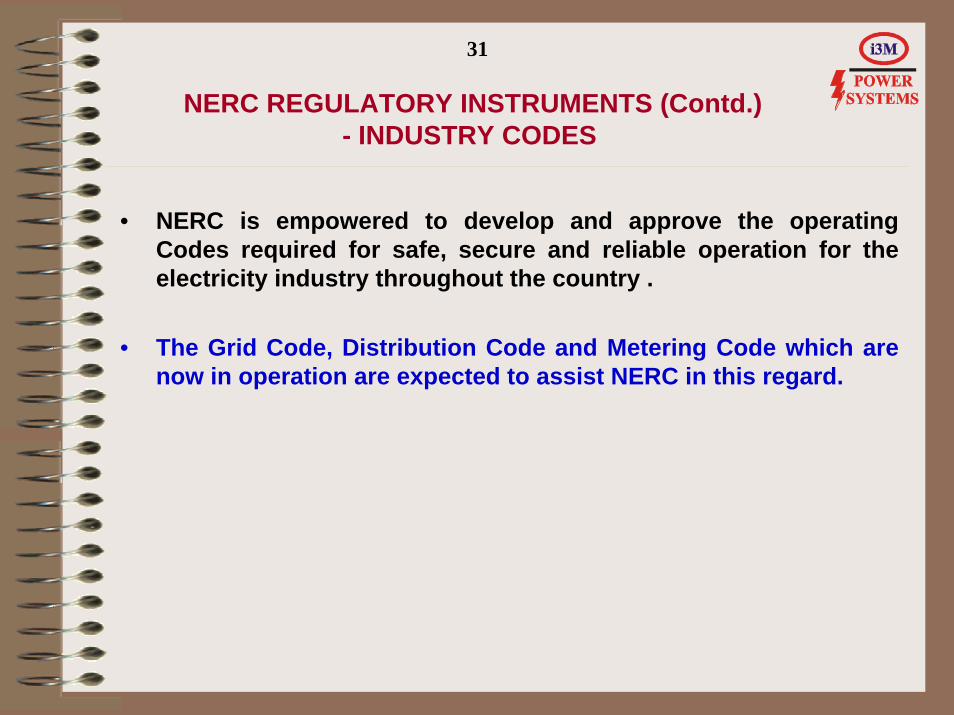
• NERC is empowered to develop and approve the operating Codes required for safe, secure and reliable operation for the electricity industry throughout the country .
• The Grid Code, Distribution Code and Metering Code which are now in operation are expected to assist NERC in this regard.
32
Emergence of Independent Power Producers (IPP)
• Consequent on the new government policy,a number of IPPs have started operation;- 270MW AES project in Lagos State,- 450MW ENI/Agip Okpai project in Delta State- Omoku project in Rivers State.- 474MW Shell Afam VI in Rivers State
• IPPs are privately financed , green-field generation projects supported by non-recourse or limited recourse loans with long-term power purchase agreement (PPA) with the off-taker.
• As at the first quarter of 2009, twenty nine (29) IPPs have been given licenses by NERC to establish generation plants.
33
THE ROLE OF INDEPENDENT POWER PRODUCERS (IPPs)
• Meeting Growing Energy Demand• Serve to bench-mark Government-owned generating plants.• Stimulate the development of local Capital Markets• Capacity Building in Manpower development,Better
management skills and Access to efficient technologiesthat will ensure reliable and affordable supply of electricity.
• Allow Government to allocate scarce resources to other priority areas such as health, poverty alleviation, education and agriculture.
• Contribute to reduction in Gas flaring.
34
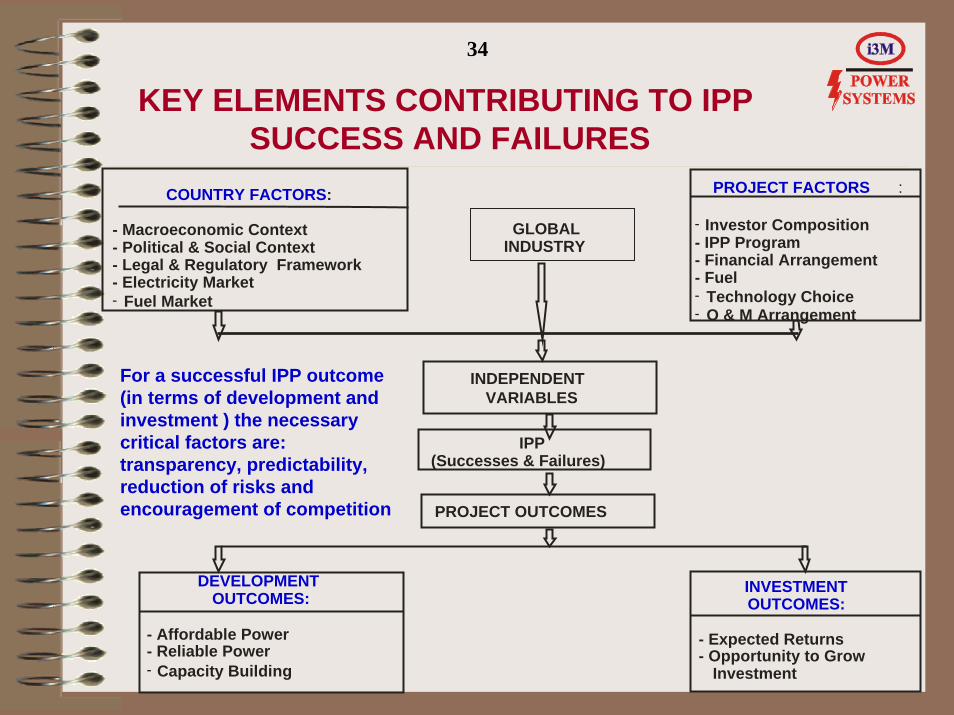
KEY ELEMENTS CONTRIBUTING TO IPPSUCCESS AND FAILURES
GLOBAL INDUSTRY
PROJECT FACTORS
Investor Composition- IPP Program- Financial Arrangement- Fuel
Technology ChoiceO & M Arrangement
:
-
--
COUNTRY FACTORS:
- Macroeconomic Context- Political & Social Context- Legal & Regulatory Framework- Electricity Market
Fuel Market-
IPP (Successes & Failures)
PROJECT OUTCOMES
INDEPENDENT VARIABLES
INVESTMENT OUTCOMES:
- Expected Returns- Opportunity to Grow
Investment
DEVELOPMENT OUTCOMES:
- Affordable Power- Reliable Power
Capacity Building-
For a successful IPP outcome (in terms of development and investment ) the necessary critical factors are: transparency, predictability, reduction of risks and encouragement of competition
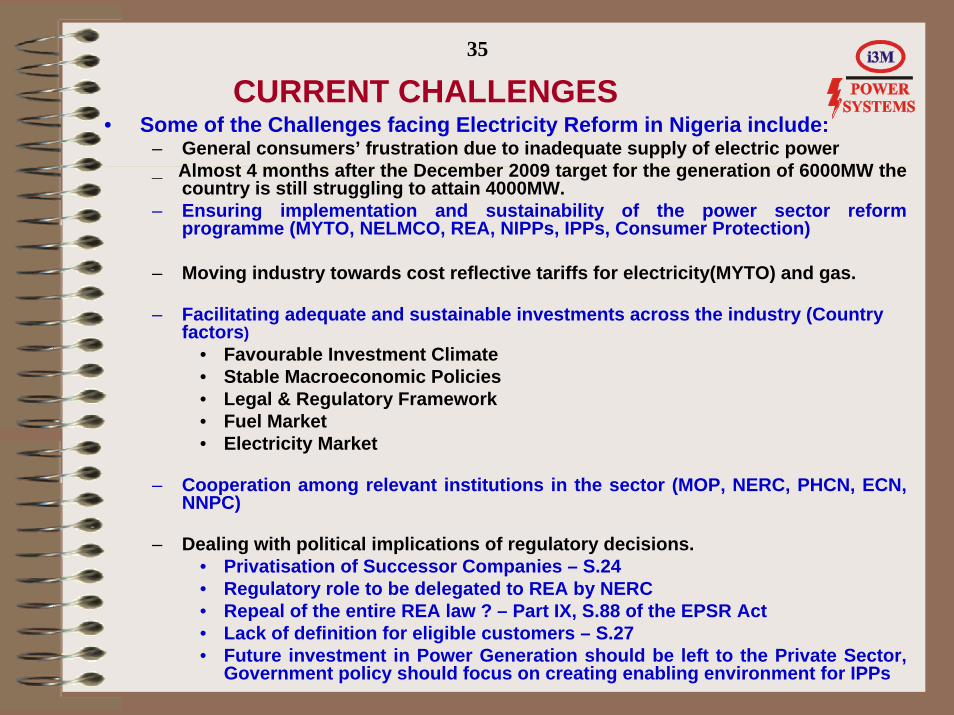
CURRENT CHALLENGES• Some of the Challenges facing Electricity Reform in Nigeria include:
– General consumers’ frustration due to inadequate supply of electric power_ Almost 4 months after the December 2009 target for the generation of 6000MW the
country is still struggling to attain 4000MW.– Ensuring implementation and sustainability of the power sector reform
programme (MYTO, NELMCO, REA, NIPPs, IPPs, Consumer Protection)
– Moving industry towards cost reflective tariffs for electricity(MYTO) and gas.
– Facilitating adequate and sustainable investments across the industry (Country factors)
• Favourable Investment Climate• Stable Macroeconomic Policies• Legal & Regulatory Framework• Fuel Market• Electricity Market
– Cooperation among relevant institutions in the sector (MOP, NERC, PHCN, ECN, NNPC)
– Dealing with political implications of regulatory decisions.• Privatisation of Successor Companies – S.24• Regulatory role to be delegated to REA by NERC• Repeal of the entire REA law ? – Part IX, S.88 of the EPSR Act• Lack of definition for eligible customers – S.27• Future investment in Power Generation should be left to the Private Sector,
Government policy should focus on creating enabling environment for IPPs
35
36
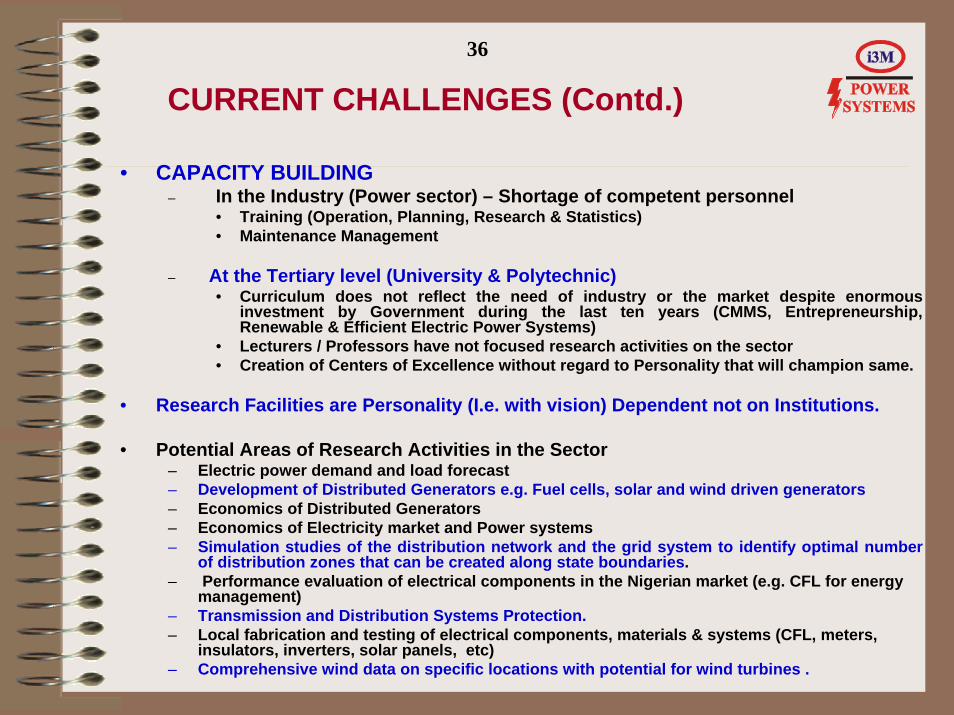
CURRENT CHALLENGES (Contd.)
• CAPACITY BUILDING– In the Industry (Power sector) – Shortage of competent personnel
• Training (Operation, Planning, Research & Statistics)• Maintenance Management
– At the Tertiary level (University & Polytechnic)• Curriculum does not reflect the need of industry or the market despite enormous
investment by Government during the last ten years (CMMS, Entrepreneurship, Renewable & Efficient Electric Power Systems)
• Lecturers / Professors have not focused research activities on the sector • Creation of Centers of Excellence without regard to Personality that will champion same.
• Research Facilities are Personality (I.e. with vision) Dependent not on Institutions.
• Potential Areas of Research Activities in the Sector– Electric power demand and load forecast– Development of Distributed Generators e.g. Fuel cells, solar and wind driven generators– Economics of Distributed Generators– Economics of Electricity market and Power systems– Simulation studies of the distribution network and the grid system to identify optimal number
of distribution zones that can be created along state boundaries.– Performance evaluation of electrical components in the Nigerian market (e.g. CFL for energy
management)– Transmission and Distribution Systems Protection.– Local fabrication and testing of electrical components, materials & systems (CFL, meters,
insulators, inverters, solar panels, etc)– Comprehensive wind data on specific locations with potential for wind turbines .
THE ROADMAP TO POWER SECTOR REFORM
• The Roadmap for Power Sector Reform is a set of policy plans that are expected to ensure a more reliable electric power sector that guarantees stable power supply to homes and businesses in Nigeria.
• The Roadmap does not, in essence, introduce new policies but rather sets strategies to fast-track actions for achieving the objectives of the National Electric Power Policy (2002) as enshrined in the Electric Power Sector Reform Act (EPSRA) 2005. With the primary objective of creating a private-sector-driven electricity supply industry.
• The Roadmap outlines actions on the following strategies:i) removing the existing obstacles to private investment in the
power sector.ii) setting a clearer strategy for divestiture of the PHCN successor
companies (11 Discos and 6 Gencos)iii) reforming the fuel-to-power policies at the upstream energy sector
which affect power generation, especially gas.
THE ROADMAP TO POWER SECTOR REFORM:REMOVING OBSTACLES TO PRIVATE SECTOR INVESTMENT
• The Establishment of an appropriate pricing regime- End-user tariff must be at cost-reflective level
a) Current regulated tariff is N8.50/kwhb) Poor currently pay more than N80/kwh burning candles and Kerosene.c) Manufacturers pay in excess of N60/Kwh on diesel or LPFO generation.d) As from 2011, consumers to pay average cost-reflective tariff of N22/Kwh?
• Establishment of the Nigerian Bulk Electricity Trading (NBET)Company Plc.- To carry out contract management and bulk trading on behalf of Discos during transition period to fully developed state- will negotiate appropriate PPA
• Provision of FGN Credit Enhancement to NBET until Discos are commercially viable and credit – worthy
• Contracting out the management of the Transmission Company of Nigeria (TCN)
• Strengthening the Nigerian Electricity Regulatory Commission(NERC)
39
THE WAY FORWARD: Action Plan (contd.)
Realistic Market Clearing Price for Gas:- Through discussion between Ministry of Power and the Ministry of Petroleum Resources a critical look at the Export Parity Pricing Model of NNPC for Gas can result in a realistic Market Clearing Price that will be satisfactory to both the IOCsand the bulk consumers such as the PHCN power plants, NIPPsand IPPs without significant change in electricity tariff.
- Newspaper Reports of Friday May 28, 2010 indicate that the Fed. Govt. in order to boost investment in gas infrastructure and the power sector has fixed the following new prices for NATURAL GAS :
a) $1.00 / MMBtu = $1.03/ mscf in 2011b) $2.00/ MMBtu = $2.06/ mscf in 2013
- The new tariff has significant implications for Consumer Electricity Tariff and the attendant Fed. Govt. Subsidy
40
THE WAY FORWARD: Action Plan (contd.)
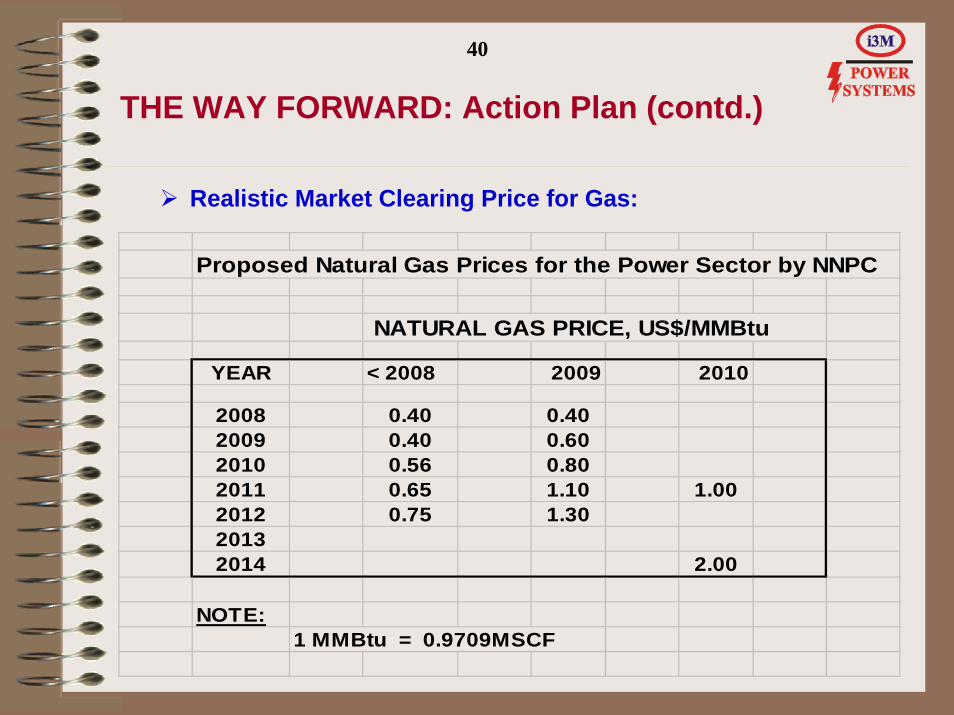
Realistic Market Clearing Price for Gas:
Proposed Natural Gas Prices for the Power Sector by NNPC
NATURAL GAS PRICE, US$/MMBtu
YEAR < 2008 2009 2010
2008 0.40 0.402009 0.40 0.602010 0.56 0.802011 0.65 1.10 1.002012 0.75 1.3020132014 2.00
NOTE:1 MMBtu = 0.9709MSCF
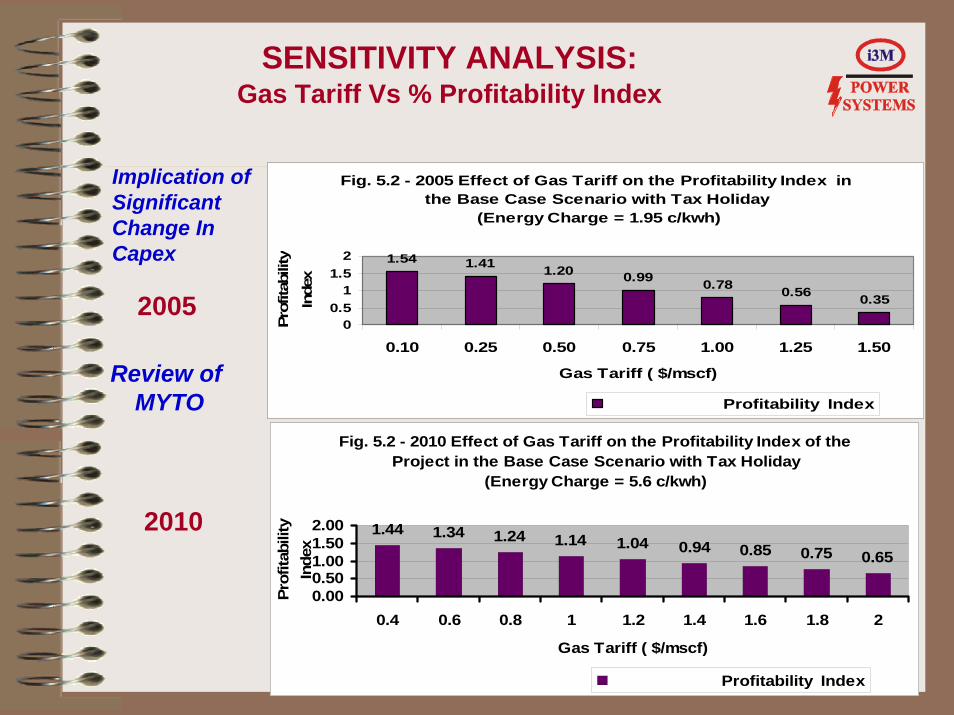
SENSITIVITY ANALYSIS:Gas Tariff Vs % Profitability Index
Implication of Significant Change In Capex
Fig. 5.2 - 2010 Effect of Gas Tariff on the Profitability Index of the Project in the Base Case Scenario with Tax Holiday
(Energy Charge = 5.6 c/kwh)
1.44 1.34 1.24 1.14 1.04 0.94 0.85 0.75 0.65
0.000.501.001.502.00
0.4 0.6 0.8 1 1.2 1.4 1.6 1.8 2
Gas Tariff ( $/mscf)
Prof
itabi
lity
Inde
x
Profitability Index
Fig. 5.2 - 2005 Effect of Gas Tariff on the Profitability Index in the Base Case Scenario with Tax Holiday
(Energy Charge = 1.95 c/kwh)
1.54 1.41 1.20 0.99 0.78 0.56 0.35
00.5
11.5
2
0.10 0.25 0.50 0.75 1.00 1.25 1.50
Gas Tariff ( $/mscf)
Prof
itabi
lity
Inde
x
Profitability Index
2005
Review of MYTO
2010
42
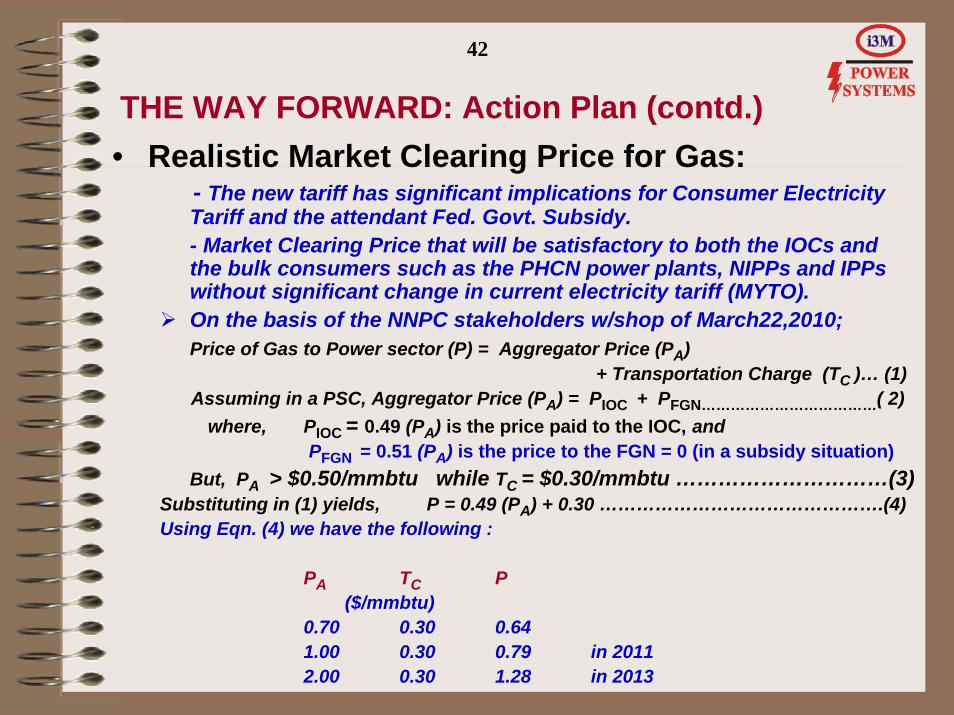
THE WAY FORWARD: Action Plan (contd.)• Realistic Market Clearing Price for Gas:
- The new tariff has significant implications for Consumer Electricity Tariff and the attendant Fed. Govt. Subsidy.- Market Clearing Price that will be satisfactory to both the IOCs and the bulk consumers such as the PHCN power plants, NIPPs and IPPswithout significant change in current electricity tariff (MYTO).On the basis of the NNPC stakeholders w/shop of March22,2010; Price of Gas to Power sector (P) = Aggregator Price (PA)
+ Transportation Charge (TC )… (1)Assuming in a PSC, Aggregator Price (PA) = PIOC + PFGN………………………………( 2)
where, PIOC = 0.49 (PA) is the price paid to the IOC, and PFGN = 0.51 (PA) is the price to the FGN = 0 (in a subsidy situation)
But, PA > $0.50/mmbtu while TC = $0.30/mmbtu …………………………(3)Substituting in (1) yields, P = 0.49 (PA) + 0.30 ……………………………………….(4)Using Eqn. (4) we have the following :
PA TC P($/mmbtu)
0.70 0.30 0.641.00 0.30 0.79 in 20112.00 0.30 1.28 in 2013
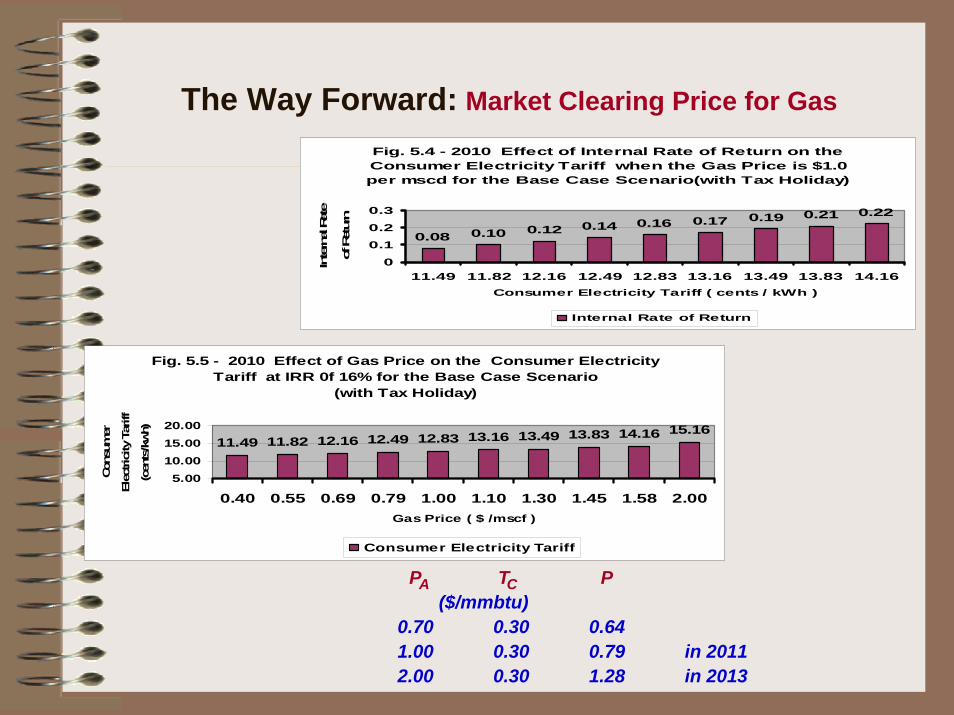
The Way Forward: Market Clearing Price for GasFig. 5.4 - 2010 Effect of Internal Rate of Return on the Consumer Electricity Tariff when the Gas Price is $1.0 per mscd for the Base Case Scenario(with Tax Holiday)
0.08 0.10 0.12 0.14 0.16 0.17 0.19 0.21 0.22
00.10.20.3
11.49 11.82 12.16 12.49 12.83 13.16 13.49 13.83 14.16Consumer Electricity Tariff ( cents / kWh )
Intern
al R
ate
of R
etur
n
Internal Rate of Return
Fig. 5.5 - 2010 Effect of Gas Price on the Consumer Electricity Tariff at IRR 0f 16% for the Base Case Scenario
(with Tax Holiday)
11.49 11.82 12.16 12.49 12.83 13.16 13.49 13.83 14.16 15.16
5.0010.0015.0020.00
0.40 0.55 0.69 0.79 1.00 1.10 1.30 1.45 1.58 2.00Gas Price ( $ /mscf )
Con
sum
er
Elec
trici
ty T
ariff
(cen
ts/k
wh)
Consumer Electricity Tariff
PA TC P($/mmbtu)
0.70 0.30 0.641.00 0.30 0.79 in 20112.00 0.30 1.28 in 2013
The Way Forward: Market Clearing Price for Gas
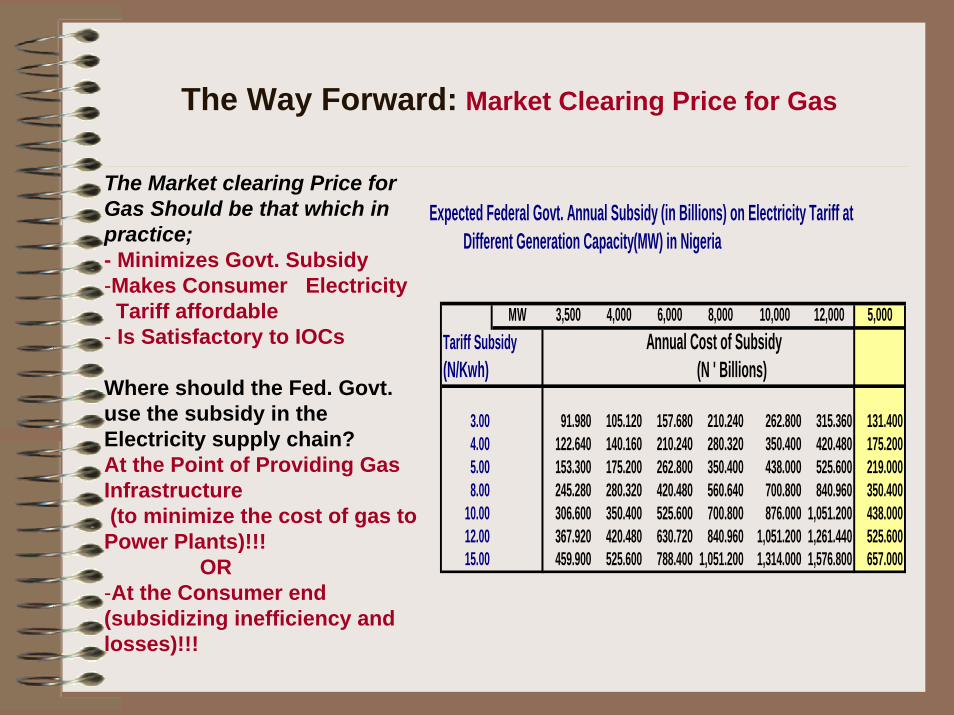
The Market clearing Price for Gas Should be that which in practice;- Minimizes Govt. Subsidy-Makes Consumer Electricity
Tariff affordable- Is Satisfactory to IOCs
Where should the Fed. Govt. use the subsidy in the Electricity supply chain?At the Point of Providing Gas Infrastructure(to minimize the cost of gas to
Power Plants)!!!OR
-At the Consumer end (subsidizing inefficiency and losses)!!!
Ex
pected Federal Govt. Annual Subsidy (in Billions) on Electricity Tariff at Different Generation Capacity(MW) in Nigeria
MW 3,500 4,000 6,000 8,000 10,000 12,000 5,000Tariff Subsidy Annual Cost of Subsidy(N/Kwh) (N ' Billions)
3.00 91.980 105.120 157.680 210.240 262.800 315.360 131.4004.00 122.640 140.160 210.240 280.320 350.400 420.480 175.2005.00 153.300 175.200 262.800 350.400 438.000 525.600 219.0008.00 245.280 280.320 420.480 560.640 700.800 840.960 350.400
10.00 306.600 350.400 525.600 700.800 876.000 1,051.200 438.00012.00 367.920 420.480 630.720 840.960 1,051.200 1,261.440 525.60015.00 459.900 525.600 788.400 1,051.200 1,314.000 1,576.800 657.000
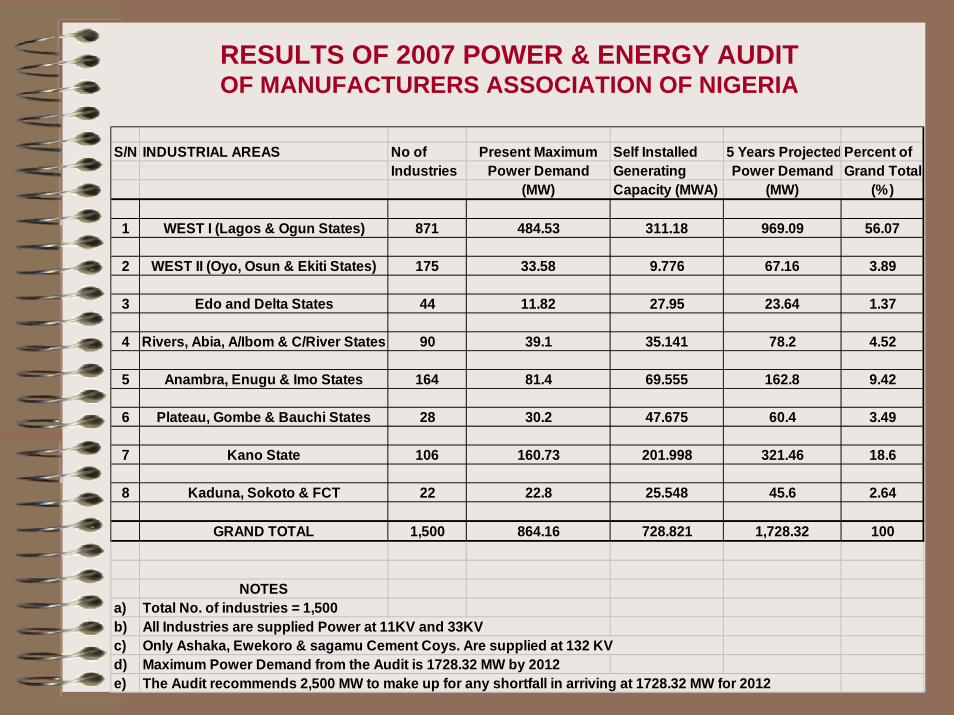
RESULTS OF 2007 POWER & ENERGY AUDITOF MANUFACTURERS ASSOCIATION OF NIGERIA
S/N INDUSTRIAL AREAS No of Present Maximum Self Installed 5 Years ProjectedPercent of Industries Power Demand Generating Power Demand Grand Total
(MW) Capacity (MWA) (MW) (%)
1 WEST I (Lagos & Ogun States) 871 484.53 311.18 969.09 56.07
2 WEST II (Oyo, Osun & Ekiti States) 175 33.58 9.776 67.16 3.89
3 Edo and Delta States 44 11.82 27.95 23.64 1.37
4 Rivers, Abia, A/Ibom & C/River States 90 39.1 35.141 78.2 4.52
5 Anambra, Enugu & Imo States 164 81.4 69.555 162.8 9.42
6 Plateau, Gombe & Bauchi States 28 30.2 47.675 60.4 3.49
7 Kano State 106 160.73 201.998 321.46 18.6
8 Kaduna, Sokoto & FCT 22 22.8 25.548 45.6 2.64
GRAND TOTAL 1,500 864.16 728.821 1,728.32 100
NOTESa) Total No. of industries = 1,500b) All Industries are supplied Power at 11KV and 33KVc) Only Ashaka, Ewekoro & sagamu Cement Coys. Are supplied at 132 KVd) Maximum Power Demand from the Audit is 1728.32 MW by 2012e) The Audit recommends 2,500 MW to make up for any shortfall in arriving at 1728.32 MW for 2012
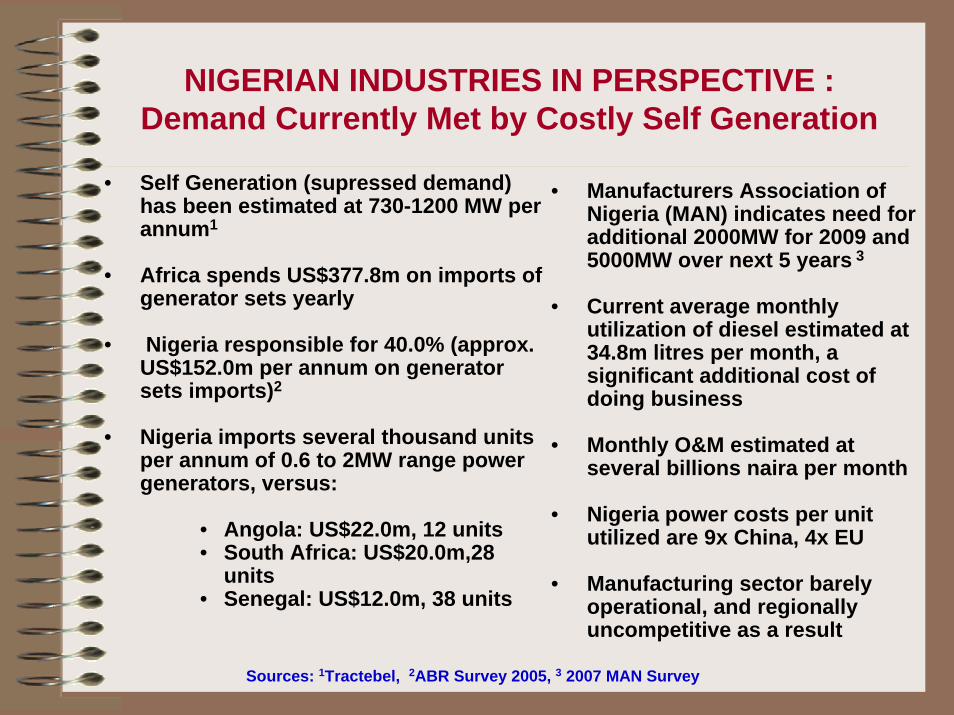
NIGERIAN INDUSTRIES IN PERSPECTIVE :Demand Currently Met by Costly Self Generation
• Self Generation (supressed demand) has been estimated at 730-1200 MW per annum1
• Africa spends US$377.8m on imports of generator sets yearly
• Nigeria responsible for 40.0% (approx. US$152.0m per annum on generator sets imports)2
• Nigeria imports several thousand units per annum of 0.6 to 2MW range power generators, versus:
• Angola: US$22.0m, 12 units• South Africa: US$20.0m,28
units• Senegal: US$12.0m, 38 units
• Manufacturers Association of Nigeria (MAN) indicates need for additional 2000MW for 2009 and 5000MW over next 5 years 3
• Current average monthly utilization of diesel estimated at 34.8m litres per month, a significant additional cost of doing business
• Monthly O&M estimated at several billions naira per month
• Nigeria power costs per unit utilized are 9x China, 4x EU
• Manufacturing sector barely operational, and regionally uncompetitive as a result
Sources: 1Tractebel, 2ABR Survey 2005, 3 2007 MAN Survey
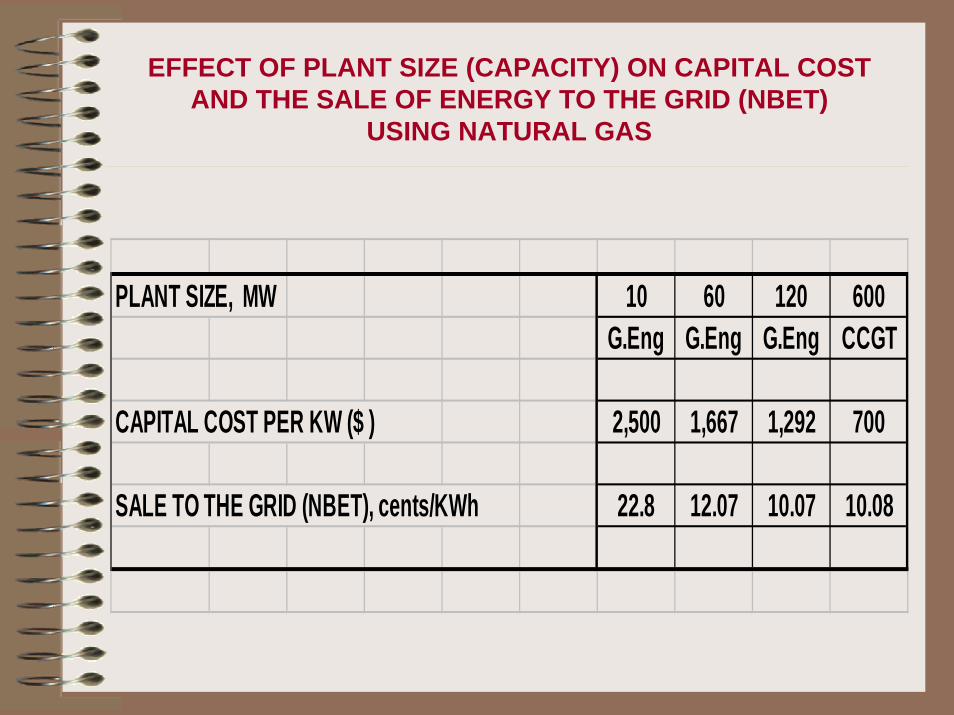
EFFECT OF PLANT SIZE (CAPACITY) ON CAPITAL COST AND THE SALE OF ENERGY TO THE GRID (NBET)
USING NATURAL GAS
PLANT SIZE, MW 10 60 120 600G.Eng G.Eng G.Eng CCGT
CAPITAL COST PER KW ($ ) 2,500 1,667 1,292 700
SALE TO THE GRID (NBET), cents/KWh 22.8 12.07 10.07 10.08
OPTIONS AVAILABLE TO INDUSTRIESOwn Power Generating Plant?- Consider Economy of Scale (in Plant capacity)- Choice of Fuel Source (LPFO, Diesel or Natural Gas)?- Cost Implication for total Operating cost of business?- Reliability of Electric Power Supply for business?- Require effective Maintenance Management System
Create Island of Industries to be supplied by IPP?- Require PPA- Embedded Generation- Cost-reflective tariff - Reliability of Electric Power Supply.- O & M arrangement of IPPCreate Island of Industries to be supplied by DIsco?- Require PPA- Distributed Generation- Load Characteristics of Industry- Network ProtectionSupply through the Transmission Network?- Require PPA- Reliability of Supply?- Electricity Tariff?
48

49
Thank you allfor your
attention !!!