Embed Size (px)
Citation preview

THE ROLE OF LOCAL AND PERIPHERAL ANTIOXIDANTS IN THE PATHOGENESIS OF
CHRONIC PERIODONTITIS IN SMOKERS
by
NICOLA ANN LING-MOUNTFORD
A thesis submitted to The University of Birmingham
for the degree of MASTER OF PHILOSOPHY
School of Dentistry The University of Birmingham
October 2009

University of Birmingham Research Archive
e-theses repository This unpublished thesis/dissertation is copyright of the author and/or third parties. The intellectual property rights of the author or third parties in respect of this work are as defined by The Copyright Designs and Patents Act 1988 or as modified by any successor legislation. Any use made of information contained in this thesis/dissertation must be in accordance with that legislation and must be properly acknowledged. Further distribution or reproduction in any format is prohibited without the permission of the copyright holder.

ABSTRACT
Chronic periodontitis is one of the most common chronic inflammatory diseases
of man and accounts for 60% of tooth loss. It is initiated by the subgingival
biofilm and in susceptible individuals an abnormal inflammatory-immune
response fails to resolve the inflammation and leads to destruction of the
supporting tissues and the teeth. Risk factors for periodontitis may be systemic
or local and of the systemic risk factors the most significant is smoking.
Periodontitis patients appear to express a hyper-inflammatory phenotype
involving excess or prolonged production of enzymes and reactive oxygen
species (ROS) from cells of the innate immune response (primarily neutrophils).
Neutrophil hyper-reactivity and hyperactivity, with respect to ROS production, has
been demonstrated by several authors. Consistent with the exaggerated ROS
production is the depletion of antioxidant defences against ROS within the
periodontal pockets. Cigarette smoke is also reported to increase the oxidative
burden and deplete antioxidant defences, but no data are available on gingival
crevicular (GCF) antioxidant levels in smokers compared to non-smokers. This
thesis explores the total antioxidant capacity (TAOC) of GCF and plasma in
smokers and non-smokers with periodontitis and analyses the impact of smoking
on the outcomes of periodontal therapy and upon local and peripheral antioxidant
status in both groups. The working hypothesis is that an important mechanism
underpinning the increased prevalence of periodontitis in smokers involves
reduction of antioxidant defences due to smoking and thus increased oxidative
stress and tissue damage. The cross-sectional data presented here suggest that
smokers with periodontitis have a further compromise in GCF TAOC compared
to age-, gender- and disease-matched non-smokers with periodontitis. The
longitudinal data presented within this thesis suggest that the compromised GCF
TAOC concentration seen in periodontitis irrespective of smoking status is likely
to result from the inflammatory lesion, rather than predisposing to it. Moreover,
the impact of the periodontal inflammation upon TAOC compromise appears
more dominant than the effects of smoking.

DEDICATION
This thesis is dedicated to my husband, Rich, for all his unfailing support and
love during this period of study and to my newly arrived daughter, Isobel, for
giving me the sense of urgency to complete this work.
Nic Ling-Mountford
October 2009

ACKNOWLEDGEMENTS
I would like initially to thank my supervisor, Professor Iain Chapple, for his
preliminary research and continued enthusiasm for chemiluminescence and for
his continual support and encouragement, without which this thesis would not
have been possible. I would also like to thank Dr John Matthews and his team
for their invaluable assistance with the laboratory element of this thesis, in
particular Dr Kevin Carter. Their meticulous attention to detail and scientific
principles in the instruction of the assay, storage and running of samples,
ensured this research was carried out successfully.
I would like to extend my thanks to all the staff of the Unit of Periodontology and
the Birmingham Dental Hospital, particularly to those who were willing to be
volunteers and provide blood and gingival crevicular fluid samples. The support
in recruitment and screening of periodontal patients from the dental staff,
especially Mr Paul Weston, Mr Mike Milward and Dr Gareth Brock, was
invaluable. My special thanks also to the nursing staff the Periodontal
Department, particularly Miss Keeley Askey, for their clinical assistance with
recording data.
I gratefully acknowledge the financial support received from The Oral & Dental
Research Trust in association with Colgate-Palmolive in the form of the “Colgate-
Palmolive PCD Research Award 2004”, which aided the laboratory fees.
Finally I would like to thank Mr Mike Milward for his friendship, encouragement
and for being a good listener, which was much appreciated.
CONTENTS:
Page
Introduction
1.1. Inflammatory periodontal disease 2
1.2. Classification of inflammatory periodontal diseases 3
1.3. The aetiology and pathogenesis of gingivitis and periodontitis 4
1.4. Dental plaque and the microbiology of periodontitis 5
1.4.1. Putative pathogens 6
1.4.2. Microbial virulence factors 8
1.5. Host response and its contribution to the aetiology of 10
periodontitis
1.5.1. Mechanisms of tissue damage 12
1.6. The threat of oxygen 13
1.6.1 Basic free radical reactions 14
1.6.2. Atomic and molecular oxygen 15
1.6.3. Origins and formation of reactive oxygen species 17
1.6.4. Reactive oxygen species 18
1.6.4.1. Singlet oxygen 19
1.6.4.2. Superoxide 19
1.6.4.3. Hydrogen peroxide 20
1.6.4.4. Hydroxyl radical 22
1.6.5. Sources of Fenton-reactive metal iron in vivo 23
1.6.6. Nitrogen-derived free radicals 23
1.6.6.1. Nitric oxide 24
1.6.6.2. Peroxynitrite 24
1.6.7. Sulphur derived free radicals 25
1.7. The role of ROS in tissue damage 25
1.7.1. Lipid peroxidation 25
1.7.2. Protein oxidation 27
1.7.3. Nucleic damage 28
1.7.4. Carbohydrate damage 28
1.8. Role of ROS in periodontal disease 29
1.8.1. Direct actions of ROS in periodontal destruction 29
1.8.2. Indirect action of ROS in periodontal destruction 30
1.8.3. ROS produced by neutrophils 31
1.8.4. Other sources of ROS in the periodontal tissues 32
1.9. Host defence against free radicals – Antioxidants 33

1.9.1. Superoxide dismutase 37
1.9.2. Catalase 37
1.9.3. Glutathione 38
1.9.4. Ascorbic acid (vitamin C) 39
1.9.5. α-Tocopherol (vitamin E) 40
1.9.6. Carotenoids (vitamin A) 41
1.9.7. Co-enzymes Q10 42
1.9.8. Uric acid 42
1.9.9. Polyphenols 43
1.10. Concept of “total antioxidant capacity” 43
1.11. Smoking 44
1.11.1. Smoking as a risk factor for periodontitis 44
1.11.2. The effects of smoking on ROS production from neutrophils 47
1.11.3 The effects of smoking on antioxidant status 47
1.12. Measuring ROS and antioxidant status in biological samples 48
1.12.1. Total antioxidant capacity methodology 49
1.12.1.2. Assays for measuring water-soluble TAOC 50
1.12.1.3. Assays for measuring lipid-soluble TAOC 52
1.13. Gingival crevicular fluid 53
1.14. Immediate background and aim of the study 54
1.14.1. Objectives 55
Materials & Methods
Materials 57
2.1. Standard solutions and equipment for antioxidant assay 57
2.1.1. Phosphate buffered saline containing bovine serum albumin 57
(PBS-BSA) – Running buffer
2.1.2. Synthesis and preparation of signal reagent 57
2.1.2.1. Signal reagent powder constituents 57
2.1.2.2. Signal reagent buffer preparation 58
2.1.2.3. Preparation of working signal reagent 58
2.1.3. Horseradish peroxidase stick solution 50lU/ml 59
2.1.4. Standard ECL assay mix 59
2.1.5. Trolox standards (80µM) for assay calibration 60
2.1.6. BioOrbit 1250 Luminometer 60
2.2. Classification and categorisation of patients 61
2.2.1. Indices of health & disease 61
2.2.1.1. Periodontal probing depths 61

2.2.1.2. Recession 61
2.2.1.3. Clinical attachment levels 62
2.2.1.4. Bleeding scores 62
2.2.1.5. Plaque scores 62
2.2.1.6. Radiographs 63
2.2.2. Volunteer groups 63
2.2.2.1. Smokers with chronic periodontitis 63
2.2.2.2 Inclusion criteria 64
2.2.2.3. Exclusion criteria 64
2.2.2.4. Non-smokers with chronic periodontitis – Group A 64
2.2.2.4.1. Non-smokers with chronic periodontitis – Group B 65
2.2.2.5. Periodontally healthy subjects – Group A 65
2.2.2.5.1. Periodontally healthy subjects – Group B 65
Methods 67
2.3. Treatment regime 67
2.3.1. Smoking cessation 67
2.4. Clinical sample collection protocols 68
2.4.1. Plasma 68
2.4.2. GCF sampling 68
2.4.2.1. Index sites 69
2.4.2.2. Deep sites 70
2.4.2.3. Shallow sites 70
2.4.2.4. GCF volume determination 70
2.4.2.5. Periotron 8000 operating procedure 71
2.4.2.6. GCF sample elution and storage 72
2.5. Total antioxidant capacity (TAOC) assay methodology 73
2.5.1. Introduction to chemiluminescence as a diagnostic tool 73
2.5.2. Enhanced chemiluminescence assays 74
2.5.2.1. Mechanism of enhanced chemiluminescence 74
2.5.2.2. Application of the ECL system as an antioxidant assay: 75
inhibition by radical scavengers
2.5.2.3. BioOrbit 1250 Luminometer protocol 76
2.5.2.4. Preparation of working solution for the assay 76
2.5.2.5. Influence of the test solution (GCF & Plasma) upon ECL 77
2.5.2.6. Definition of T10% 77
2.5.2.7. Total antioxidant assay calibration and sample volumes 78
2.5.2.8 Calculation of total antioxidant capacity 78
2.6. Statistical analysis of results 79

Results & Discussion
3. Cross-sectional investigations: 81
Local and peripheral total antioxidant capacity (TAOC)
3.1. Context 81
3.2. Clinical and demographic data 82
3.3. GCF samples 84
3.3.1. Smokers with periodontitis versus group A (index sites - 84
patient as unit of analysis)
3.3.2. Smokers with periodontitis versus group B (deep sites - 86
diseased site as unit of analysis)
3.4. Total antioxidant capacity (TAOC) 87
3.4.1. GCF TAOC per 30 second sample of smokers with 87
periodontitis versus group A (patient as unit of analysis)
3.4.1.2. GCF TAOC concentration of smokers with periodontitis 87
versus group A (patient as unit of analysis)
3.4.2. GCF TAOC per 30 second sample of smokers with 88
periodontitis versus group B (diseased site as unit of analysis)
3.4.2.1. GCF TAOC concentration of smokers with periodontitis 88
versus group B (diseased site as unit of analysis)
3.4.3. Plasma TAOC 89
3.5. Summary of findings 92
3.6. Discussion 92
4. Longitudinal investigations: 97
Local and peripheral total antioxidant capacity
4.1. Context 97
4.2. Clinical and demographic data 97
4.3. Total antioxidant capacity (TAOC) 104
4.3.1. GCF TAOC per 30 second sample of smokers with 104
periodontitis versus group A (patient as unit of analysis)
4.3.1.2 GCF TAOC concentration of smokers with periodontitis 105
versus group A (patient as unit of analysis)
4.3.2. GCF TAOC per 30 second sample of smokers with 106
periodontitis versus group B (diseased site as unit of analysis)
4.3.2.1 GCF TAOC concentration of smokers with periodontitis 106
verses group B (diseased site as unit of analysis)
4.3.3. Plasma TAOC 107
4.4. Summary of findings 109
4.5. Discussion 109
5. Site specific longitudinal investigations: 115
Local total antioxidant capacity
5.1. Context 115
5.2. Clinical and demographic data 115
5.3. Total antioxidant capacity (TAOC) 118
5.3.1. GCF TAOC per 30 second 118
5.3.2 GCF TAOC concentration 119
5.4. Discussion 121
General Discussion and conclusions
6. General Discussion and conclusions 124
Appendices after page 129
Periotron calibration – volumes “look-up” table
Publications arising directly from this thesis
Publication arising indirectly from this thesis
References

LIST OF FIGURES:
Figure Annotation Page
1.1 Microbial complexes in subgingival plaque as described by 7
Socransky et al 1998
1.2. Schematic representation of how periodontal micro-organism may 9
cause tissue damage
1.3 The organisation of electrons within the shells and orbitals of 16
di-oxygen. Two oxygen atoms (Atom A & Atom B) are shown on either side of the molecule of di-oxygen (O2) which results from their
combination
1.4. The lipid peroxidation chain reaction initiated by hydroxyl radicals 26
1.5. A schematic representation of the possible effects of ROS on 27
proteins
1.6. Schematic diagram showing the role of ROS in generating chronic 30
inflammation and tissue damage in response to periodontal
pathogens
1.7 The biological effects of shifts in the balance of activity between 34
reactive oxygen species (ROS) and antioxidant (AO) species
1.8. Schematic diagram of the action of the antioxidant when 52
incorporated into the liposomes or when added exogenously
2.1. Standard Enhanced Chemiluminescence assay mix 60
2.2. Periotron calibration curve 71
2.3. A comparision of unenhanced and enhanced chemiluminescence 75
2.4. Light emission kinetics prior to and following addition of 10µL of 77
Trolox standard
2.5. A typical Trolox standard calibration plot, including beginning, mid 78
and end of day standards
3.1. Mean GCF volume (SEM) from smokers and non-smokers with 85
periodontitis group A at index sites and age- and gender-matched
healthy controls
3.2. Mean GCF volume (SEM) from smokers and non-smokers with 86
periodontitis group B at deep sites and age- and gender-matched
healthy controls
3.3. Mean GCF TAOC µM Trolox equivalents per litre (SEM) from 88
smokers and non-smokers with periodontitis group A at index sites
and age- and gender-matched healthy controls
3.4. Mean GCF TAOC µM Trolox equivalents per litre (SEM) from 89

smokers and non-smoker with periodontitis group B at deep sites
and age- and gender-matched healthy controls
3.5. Mean plasma TAOC µM Trolox equivalents per litre (SEM) from 90
smokers and non-smoker with periodontitis and age- and gender-
matched healthy controls
3.6. Total antioxidant concentrations in plasma and GCF (patient as unit 91
of analysis): stratified for gender (mean SEM)
3.7. Total antioxidant concentrations in plasma and GCF (deep site as 91
unit of analysis): stratified for gender (mean SEM)
4.1. Mean reduction in whole mouth probing pocket depths (PPD +SEM) 99
following non-surgical therapy & 3 months healing period
4.2. Mean change in whole mouth recession (REC +SEM) following non- 99
surgical therapy & 3 months healing period
4.3. Mean whole mouth clinical attachment gain (+SEM) flowing non- 100
surgical therapy & 3 months healing period
4.4. Mean reduction in whole mouth bleeding on probing (SEM) following 101
non-surgical therapy & 3 months healing period
4.5. Mean reduction in whole mouth sites with plaque (SEM) following 101
non-surgical therapy & 3 months healing period
4.6. Mean decrease in GCF volume (SEM) in sites sampled following 103
non-surgical therapy & 3 months healing period
4.7. Mean GCF TAOC µM Trolox equivalent per litre (SEM) from 105
smokers and non-smokers with periodontitis group A at baseline
and 3 months review following non-surgical therapy plus differences
4.8. Mean GCF TAOC µM Trolox equivalent per litre (SEM) from 107
smokers and non-smokers with periodontitis group B at baseline
and 3 months review following non-surgical therapy plus differences
4.9. Mean changes in Plasma TAOC µM Trolox equivalents per litre 108
(SEM) from smokers and non-smokers with periodontitis following
non-surgical therapy
4.10. Mean baseline & post non-surgical therapy management with 3 108
months healing period Plasma TAOC µM Trolox equivalents per litre
(SEM) from smokers and non-smokers compared to age- and gender-matched healthy controls
5.1. Mean reduction on probing pocket depth (PPD +SEM) following 116
non-surgical therapy & 3 months healing period
5.2. Mean changes in recession (REC +SEM) following non-surgical 117
therapy & 3 months healing period
5.3. Mean gain in clinical attachment loss (CAL +SEM) following non- 117
surgical therapy & 3 months healing period

5.4. Mean reduction in GCF volumes per 30 seconds (+SEM) following 118
non-surgical therapy & 3 months healing period
5.5. Mean GCF TAOC µM Trolox equivalents per litre (SEM) from 119
smokers with periodontitis at baseline and 3 months review following
non-surgical therapy
5.6. Mean GCF TAOC µM Trolox equivalents per litre (SEM) from 120
healthy control groups A and B plus smokers with periodontitis
(baseline)

LIST OF TABLES:
Table Annotation Page
1.1. Classification of Periodontal Diseases 3
1.2. Putative periodontal pathogens 6
1.3. Table of reactive oxygen species modified from Battino et al 1999 18
1.4. Period of half-life of reactive oxygen species modified Bergendi et al 22
1999
1.5. Antioxidants classified by mode of action 35
1.6. Example of key antioxidants classified by location 35
1.7. Key antioxidants classified by solubility 35
1.8. Antioxidants classified by structure they protect 36
1.9. Some key antioxidants classified by their origin 36
2.1. Comparison summary of GCF sampling of all volunteer groups 66
3.1. Clinical demographic for the experimental groups 83
3.2. Clinical demographic data for Deep and Index sites that were 85
sampled for GCF TAOC analysis , plus TAOC nM Trolox equivalent
per 30 second sample
4.1. Clinical demographic data for experimental groups at exit from study 98
4.2. Mean whole mouth clinical measurements at Baseline & 3months 98
post therapy
4.3. Clinical demographic data for Deep and Index sites that were 102
sampled for GCF TAOC analysis, plus the TAOC nM Trolox
equivalent per 30 second sample sampled at pre- and post-
non-surgical therapy
5.1. Clinical demographics for the smokers with periodontitis plus the 116
TAOC nM Trolox equivalent per 30 second sample for sites sampled

ABBREVIATIONS:
A.a - Aggregatibacter actinomycetemcomitans
AAPH - 2,2’-azobis (2,4-amidinopropane) dihydrochloride
ABST - 2.2’-azinobis (3-ethylbenzothiazoline-6-sulfonate)
AMVN - 2,2’-azinobis (2,4-dimethylvaleronitrile)
ANOVA - Analysis of variance
ANUG - Acute necrotising ulcerative gingivitis
AO - Antioxidant
AP- - Activating protein
APC - Antigen presenting cells
ATP - Adenosine tri-phosphate
BOP - Bleeding on probing
BSA - Bovine serum albumin
-•C- - Carbon centred radical
Ca2+ - Calcium
CAL - Clinical attachment levels
COPD - Chronic obstructive pulmonary disease
CoQ10 - Co-enzyme Q10 (ubiquinone)
DCFH - 2’.7’-dichlorodihydrofuorescein
DNA - Deoxyribosenucleic acid
ECL - Enhanced chemiluminescence
ELAM - Endothelium leucocyte adhesion molecule
fMLP - Formyl-methionyl-leucyl-phenylalanine
FRAP - Ferric reducing ability of plasma
GCF - Gingival crevicular fluid
GPx - Glutathione peroxidase
GR - Glutathione reductase
GSH - Reduced glutathione
GSSG - Oxidized glutathione

H• - Hydrogen radical
HOCI - Hypochlorous acid
H2O2 - Hydrogen peroxide
HO2•- - Perhydroxyl radical
HOO• - Alkoloxyl
HRP - Horseradish peroxidase
H2S - Hydrogen sulphide
ICAM - Intercellular adhension molecule
Ig- - Immunoglobulin
IL- - Interleukin
IPS - Initial peak signal
K+ - Potassium
L•- - Luminol radical
LDL - Low-density lipoprotein
LSP - Lipopolysaccharides
LTB - Leukotrienes
MHC - Major histocompatibility complex
MMPs - Matrix metalloproteinases
NADPH - Nicotinamide adenine di-nucleotide phosphate
NETs - Neutrophil extracellular traps
NO• - Nitric oxide
1O2 - Singlet oxygen
O2 - Molecule of di-oxygen
O2•- - Superoxide anion
O3 - Ozone
•OH - Hydroxyl radical
OH- - Hydroxide ion
ONOO- - Peroxynitrite
ORAC - Oxygen radical absorbance capacity
PBS - Phosphate buffered saline
PGE - Prostaglandin

PMNL - Polymorphonulear leucoctye
PPD - Periodontal probing depth
PUFA - Polyunsaturated fatty acids
RCOO• - Acryloxyl
RCOOO• - Acrylperoxyl
REC - Recession
Redox - Reduction oxidation
RNS - Reactive nitrogen species
RO• - Aryloxyl
ROO• - Peroxyl
ROOH - Lipid hyroperoxide
ROS - Reactive oxygen species
R-Pe - Dichlorofluorescein-diacetate phycoerythrin
RSS - Reactive sulphur species
SOD - Superoxide dismutase
TAOC - Total antioxidant capacity
TEAC - Trolox equivalent antioxidant capacity
TIMP - Tissue inhibitors of matrix metalloproteinases
TNF - Tumour necrosis factor
TRAP - Trapping antioxidant parameter
Trolox - 6-hydroxy-2,5,7,8-tetramethylchroman-2-carboxylix
UV - Ultraviolet

INTRODUCTION

2
1. Introduction
1.1. Inflammatory periodontal diseases
Inflammatory periodontal diseases represent a range of inflammatory
disorders that affect the supporting tissues of the teeth, namely the gingivae,
periodontal ligament, cementum and alveolar bone and which ultimately lead
to tooth loss. They arise due to complex interactions between the pathogenic
bacteria of the subgingival biofilm and the host‟s inflammatory-immune
response. Chronic periodontitis is still a major cause of tooth loss in the
developed world (Papapanou 1999). In the UK 54% of the population
examined in the Adult Dental Health Survey of 1998 had evidence of
periodontitis, with 8% of adults suffering from advanced disease (Morris et al
1998). Current evidence indicates that the disease occurs in predisposed
individuals that have an aberrant inflammatory/immune response to the
microbial plaque adjacent to the gingival margin (Frederiksson et al 1998).
The excessive or prolonged release of neutrophil enzymes and reactive
oxygen species (ROS) is responsible for the majority of host-tissue
destruction in periodontitis (Gustafsson et al 1997). To combat excessive
ROS production the body possesses a variety of antioxidant (AO) defence
mechanisms, which act in concert. Their role is to protect vital cell and tissue
structures and bio-molecules from host-derived ROS as well as those of
parasitic origin (Chapple et al 1996), by removing them as they form and
repairing the damage they cause. A delicate balance exists between
antioxidant defence and repair systems and pro-oxidant mechanisms of
tissue destruction, and if the balance is tipped in favour of ROS activity,
significant tissue damage ensues (Chapple et al 2002). Recent research into
antioxidant defence in patients with periodontal disease has demonstrated
both a reduced peripheral (plasma) and local (gingival crevicular fluid, GCF)
total antioxidant capacity (TAOC) (Brock et al 2004). This thesis explores
whether the compromised antioxidant defence systems predispose to chronic
periodontitis or result from the inflammatory process and also what the impact
of smoking is upon the TAOC of periodontitis patients.

3
1.2. Classification of inflammatory periodontal disease
Table 1 illustrates the nomenclature of periodontal diseases proposed by the
International Workshop for Classification of Periodontal Diseases and
Conditions in 1999.
Table 1.1: Classification of Periodontal Diseases
† Can be further classified on the basis of extent and severity. As a general guide, extent can
be characterized as Localised = ≤30% of sites involved and Generalised = ≥30% of sites
involved. Severity can be characterized on the basis of the amount of clinical attachment
loss (CAL) as follows: Slight = 1 or 2 mm CAL, Moderate = 3 or 4 mm CAL and Severe = ≥5
mm CAL
Classification of Inflammatory Periodontal Diseases (Armitage et al 1999)
1. Gingival Disease a. Dental plaque induced gingival disease b. Non-plaque induced gingival lesion
2. Chronic Periodontitis†
a. Localised b. Generalised
3. Aggressive Periodontitis†
a. Localised b. Generalised
4. Periodontitis as a manifestation of systemic disease a. Associated with haematological disorders b. Associated with genetic disorders
5. Necrotising Periodontal Disease a. Necrotising ulcerative gingivitis b. Necrotising ulcerative periodontitis
6. Abscesses of the Periodontium a. Gingival abscess b. Periodontal abscess c. Pericoronal abscess
7. Periodontitis associated with Endodontic Lesions a. Combined periodontic-endodontic lesions
8. Developmental or Acquired Deformities and Conditions a. Localised tooth-related factors that modify or predispose to
plaque-induced gingival disease/periodontitis b. Mucogingival deformities and conditions around teeth c. Mucogingival deformities and conditions on edentulous ridges d. Occusal trauma
4
Plaque induced gingivitis and chronic periodontitis are the most prevalent of
the inflammatory periodontal conditions encountered in clinical practice and
will be the only conditions discussed in this thesis.
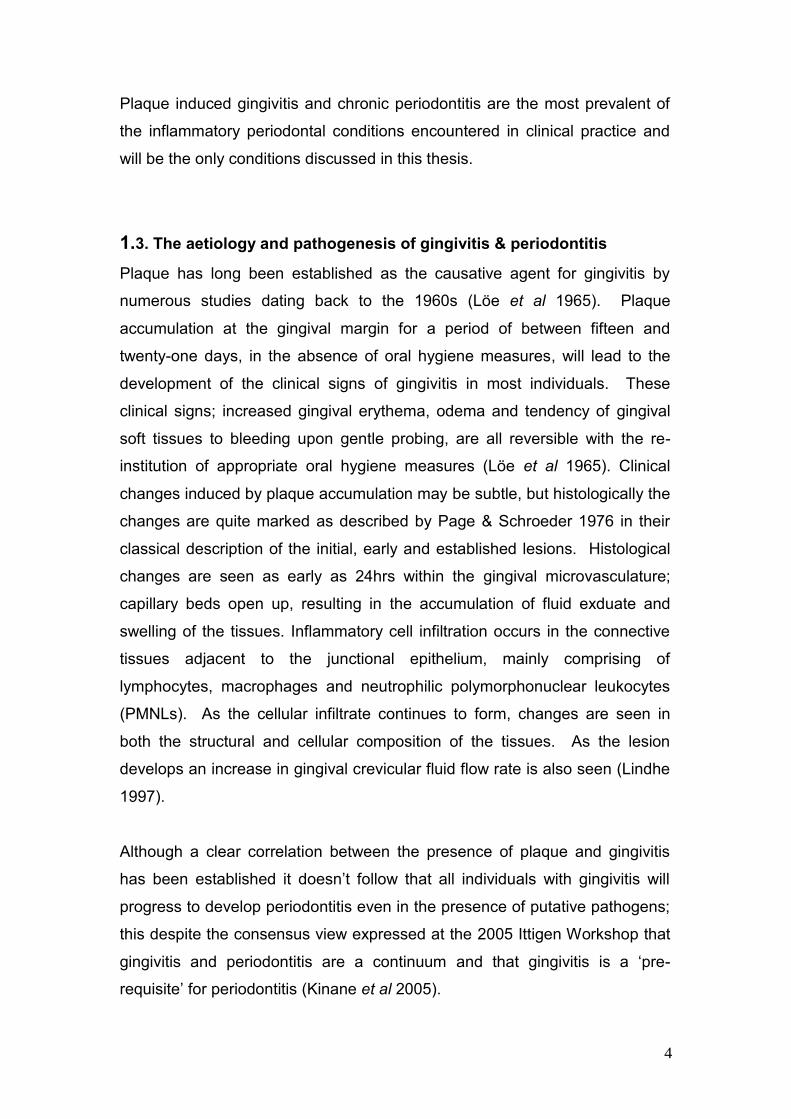
1.3. The aetiology and pathogenesis of gingivitis & periodontitis
Plaque has long been established as the causative agent for gingivitis by
numerous studies dating back to the 1960s (Löe et al 1965). Plaque
accumulation at the gingival margin for a period of between fifteen and
twenty-one days, in the absence of oral hygiene measures, will lead to the
development of the clinical signs of gingivitis in most individuals. These
clinical signs; increased gingival erythema, odema and tendency of gingival
soft tissues to bleeding upon gentle probing, are all reversible with the re-
institution of appropriate oral hygiene measures (Löe et al 1965). Clinical
changes induced by plaque accumulation may be subtle, but histologically the
changes are quite marked as described by Page & Schroeder 1976 in their
classical description of the initial, early and established lesions. Histological
changes are seen as early as 24hrs within the gingival microvasculature;
capillary beds open up, resulting in the accumulation of fluid exduate and
swelling of the tissues. Inflammatory cell infiltration occurs in the connective
tissues adjacent to the junctional epithelium, mainly comprising of
lymphocytes, macrophages and neutrophilic polymorphonuclear leukocytes
(PMNLs). As the cellular infiltrate continues to form, changes are seen in
both the structural and cellular composition of the tissues. As the lesion
develops an increase in gingival crevicular fluid flow rate is also seen (Lindhe
1997).
Although a clear correlation between the presence of plaque and gingivitis
has been established it doesn‟t follow that all individuals with gingivitis will
progress to develop periodontitis even in the presence of putative pathogens;
this despite the consensus view expressed at the 2005 Ittigen Workshop that
gingivitis and periodontitis are a continuum and that gingivitis is a „pre-
requisite‟ for periodontitis (Kinane et al 2005).
5
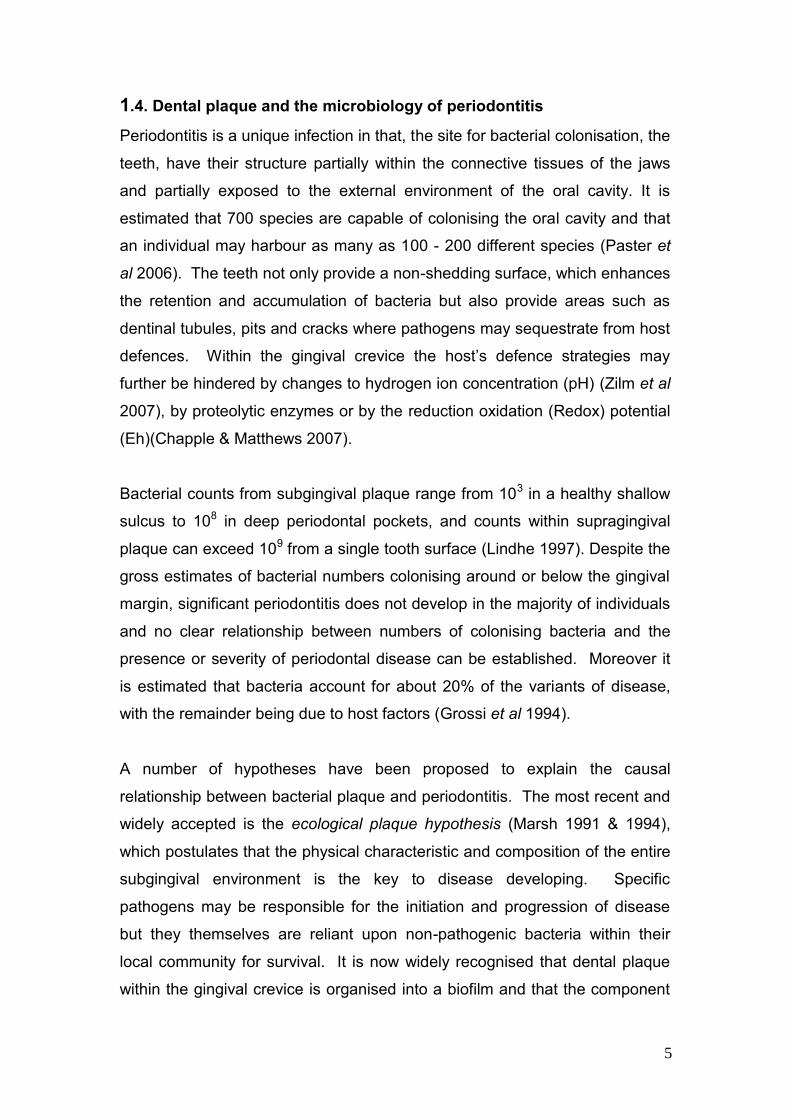
1.4. Dental plaque and the microbiology of periodontitis
Periodontitis is a unique infection in that, the site for bacterial colonisation, the
teeth, have their structure partially within the connective tissues of the jaws
and partially exposed to the external environment of the oral cavity. It is
estimated that 700 species are capable of colonising the oral cavity and that
an individual may harbour as many as 100 - 200 different species (Paster et
al 2006). The teeth not only provide a non-shedding surface, which enhances
the retention and accumulation of bacteria but also provide areas such as
dentinal tubules, pits and cracks where pathogens may sequestrate from host
defences. Within the gingival crevice the host‟s defence strategies may
further be hindered by changes to hydrogen ion concentration (pH) (Zilm et al
2007), by proteolytic enzymes or by the reduction oxidation (Redox) potential
(Eh)(Chapple & Matthews 2007).
Bacterial counts from subgingival plaque range from 103 in a healthy shallow
sulcus to 108 in deep periodontal pockets, and counts within supragingival
plaque can exceed 109 from a single tooth surface (Lindhe 1997). Despite the
gross estimates of bacterial numbers colonising around or below the gingival
margin, significant periodontitis does not develop in the majority of individuals
and no clear relationship between numbers of colonising bacteria and the
presence or severity of periodontal disease can be established. Moreover it
is estimated that bacteria account for about 20% of the variants of disease,
with the remainder being due to host factors (Grossi et al 1994).
A number of hypotheses have been proposed to explain the causal
relationship between bacterial plaque and periodontitis. The most recent and
widely accepted is the ecological plaque hypothesis (Marsh 1991 & 1994),
which postulates that the physical characteristic and composition of the entire
subgingival environment is the key to disease developing. Specific
pathogens may be responsible for the initiation and progression of disease
but they themselves are reliant upon non-pathogenic bacteria within their
local community for survival. It is now widely recognised that dental plaque
within the gingival crevice is organised into a biofilm and that the component

6
organisms are not merely passive neighbours, but that they are involved in a
wide range of physical, metabolic and molecular interactions, which may be
essential for attachment, growth, survival and virulence expression of the
species at a particular site (Marsh 2005).
1.4.1. Putative pathogens
As plaque matures during the development of gingivitis and periodontitis, the
subgingival biofilm exhibits a shift from a Gram positive and predominantly
non-motile flora to a gram negative motile and anaerobic flora. These Gram
negative bacteria within the biofilm possess a plethora of structural and
secreted components (virulence factors) that are able to cause either direct
destruction of host periodontal tissue or indirect damage via stimulation of an
inappropriate host response. Extensive work on the periodontal microflora in
chronic periodontitis has been carried out over several decades. Table 1.2
provides a list of the putative periodontal pathogens most frequently
associated with active periodontitis.
Table 1.2: Putative Periodontal Pathogens
More recent work by Sockransky and colleagues using cluster analysis and
community ordination techniques examined the relationships amongst
bacterial species within subgingival plaque and related these “complexes”
Pathogenic Periodontal Species (Haffajee & Socransky 1994)
Aggregatibacter actinomycetemcomitans (A.a) Porphromonas gingivalis
Tanerella forsythus Campylobacter rectus Eubacterium nodatum
Fusobacterium nucleatum Peptostreptococcus micros
Prevotella intermedia Prevotella nigrescens
Streptococcus intermedius
Treponema spp (e.g. T. denticola)
7
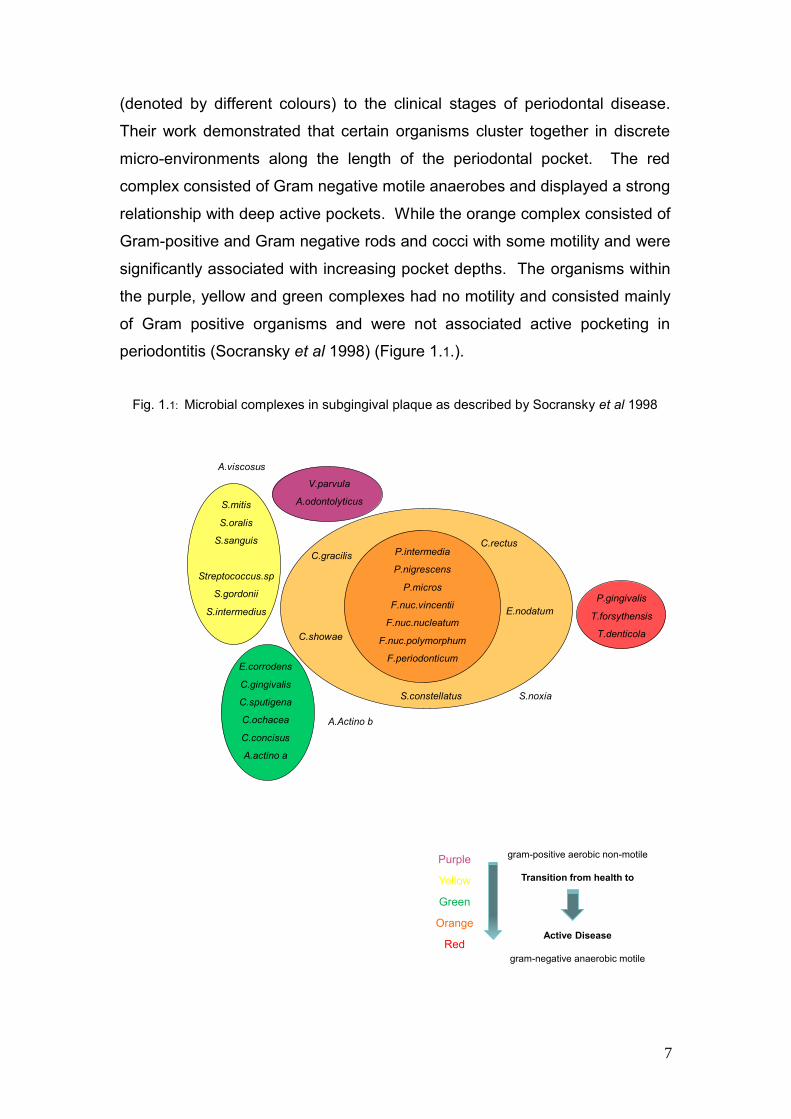
(denoted by different colours) to the clinical stages of periodontal disease.
Their work demonstrated that certain organisms cluster together in discrete
micro-environments along the length of the periodontal pocket. The red
complex consisted of Gram negative motile anaerobes and displayed a strong
relationship with deep active pockets. While the orange complex consisted of
Gram-positive and Gram negative rods and cocci with some motility and were
significantly associated with increasing pocket depths. The organisms within
the purple, yellow and green complexes had no motility and consisted mainly
of Gram positive organisms and were not associated active pocketing in
periodontitis (Socransky et al 1998) (Figure 1.1.).
Fig. 1.1: Microbial complexes in subgingival plaque as described by Socransky et al 1998
A.viscosus
V.parvula
A.odontolyticusS.mitis
S.oralis
S.sanguis
Streptococcus.sp
S.gordonii
S.intermedius
P.intermedia
P.nigrescens
P.micros
F.nuc.vincentii
F.nuc.nucleatum
F.nuc.polymorphum
F.periodonticum
P.gingivalis
T.forsythensis
T.denticola
E.corrodens
C.gingivalis
C.sputigena
C.ochacea
C.concisus
A.actino a
C.gracilis
C.showae
C.rectus
E.nodatum
S.constellatus
A.Actino b
S.noxia
Purple
Yellow
Green
Orange
Red
gram-positive aerobic non-motile
Transition from health to
Active Disease
gram-negative anaerobic motile

8
In order for a pathogen to be causally linked with periodontitis, certain criteria
need to be satisfied:
The pathogen must be of a virulent clonal type
The pathogen must possess the chromosomal and extra-chromosomal
genetic factors to initiate disease
The host must be susceptible to the pathogen
The pathogen must be present in numbers sufficient to exceed the
threshold of the host
The pathogen must be located in the right place
Other bacterial species must foster, or at least not inhibit, the process
The local environment must be one which is conducive to the expression
of the species‟ virulence properties
(Socransky & Haffafajee 1992)
1.4.2. Microbial virulence factors
Bacterial virulence factors fall into three broad categories:
Enzymes, such as collagenase and hyaluronidase, are capable of
breaking down the epithelial inter-cellular cement, thus allowing invasion
into the connective tissues where greater damage can be effected than
from within the external environment of the gingival crevice.
Toxins may modulate inflammatory responses by direct killing of host cells
or by potentiating the release of excess pro-inflammatory cytokines and
chemoattractants. They also have the ability to prevent phagocytosis and
are cytotoxic to leucocytes (Madianos et al 2005). They are elaborated as
either endotoxins or exotoxins.
Endotoxins are released from the cell wall of gram negative bacteria upon
death, but a degree of slow release also occurs within vesicular or soluble
forms. Endotoxins are also termed lipopolysaccharides (LPS) and are
amongst the most potent stimulants of the inflammatory and immune
response of the host.

9
Exotoxins are released during the bacterial life cycle and include
“leucotoxin”, capable of destroying polymorphonulcear leucocytes (PMNLs
or neutrophils) and epitheliotoxin.
Metabolic waste products such as ammonia, volatile fatty acids, indole,
hydrogen sulphide (H2S) and butyric acid may also damage host cells and
tissues. Some putative pathogens are capable of metabolising protective
anti-inflammatory and antioxidant peptides to form toxic compounds such
as H2S. (Chapple & Gilbert 2002). In addition ammonia provides a rise at
the low pH of periodontal pockets due to alterations in microbial metabolic
pathways (Zilm 2007).
Fig. 1.2: Schematic representation of how periodontal micro-organisms may cause tissue
damage (Adapted from Chapple & Gilbert 2002)
Microbial plaque
Quantity + Quality
Virulence factors
Metabolic
products
Toxins
Hydrogen
sulphide
Ammonia
Volatile fatty
acids
Exo-
toxins
Endo-
toxins
Enzymes
Collagenases
Hyaluronidase
Elastase
Trypsin-like proteases
Antibody proteases
Complement
proteases
Microbial contribution to gingival inflammation
Non-
susceptible hostPeriodontally
susceptible host
Appropriate inflammatory-
immune response
Inappropriate inflammatory-
immune response
Gingivitis Progression to
periodontal tissue
damage

10
These virulence factors are capable of causing direct damage to the tissues
of the periodontium and stimulate host cells to activate a wide range of
inflammatory and immune responses; the latter, although designed to
eliminate the bacterial infection, may in fact, also cause tissue damage when
dysregulated.
1.5. Host response and its contribution to the aetiology of periodontitis
The presence of the bacterial biofilm within the gingival crevice or periodontal
pocket will in the first instance initiate the innate (non-specific) immune
response. One of the innate immune system‟s primary lines of defence is the
physical barrier created by the rapid turnover of junctional epithelium, plus it‟s
permeability to gingival crevicular fluid (GCF) and neutrophilic
polymorphonuclear leucocytes (PMNL). As well as forming a physical barrier,
the junctional epithelium releases cell signalling molecules, to establish the
initial inflammatory response. Inflammatory cytokines such as interleukin-1
(IL-1), interleukin-6 (IL-6), intereukin-8 (IL-8) and tumour necrosis factor α
(TNFα) initiate the inflammatory response in the underlying connective tissues
and induce neutrophil and macrophage chemotaxis as a second line of
defence to antigens localised within the gingival crevice. These pro-
inflammatory cytokines from the epithelial cells, together with bacterial
virulence factors that diffuse into the connective tissues, stimulate resident
host cells such as dendritic cells, tissue macrophages, fibroblasts and mast
cells to produce and release more of the same pro-inflammatory cytokines
(IL-1β, TNF-α, IL-6, prostaglandin (PGE2)), leukotrienes (LTB4) and
histamine, which in turn activate the endothelial cells of the micro-vascular
beds to express surface adhesion molecules that are important in leukocyte
extravasation (Madianos et al 2005).
Intercellular adhesion molecule 1 (ICAM-1) and endothelium leucocyte
adhesion molecule 1 (ELAM-1) are expressed on the vascular endothelial
cells and are important adhesion molecules, which bind to complimentary
PMNL receptors (selectins and integrins) aiding the migration of PMNLs
through the epithelium and into the gingival crevice (Moughal et al 1992).

11
Histamine and PGE2 cause vasodilatation allowing more blood cells and
plasma proteins (e.g. complement) to be brought to the area of infection. The
presence of bacterial lipopolysaccharides also initiates the alternative
pathway of the complement cascade, C3a and C5a enhance the inflammatory
response by causing further histamine release from mast cells and C3b
facilitates PMNL adhesion to bacteria, further aiding phagocytosis
(opsonisation).
PMNLs are the predominant leukocytes within the periodontal lesion (Van
Dyke et al 1985) and once at the area of infection can either phagocytose
opsonised bacteria or degranulate extracellulary thereby releasing their
enzymes, antimicrobial peptides and ROS prior to undergoing programmed
cell death (apoptosis) in order to the eliminate the pathogen. The monocytes,
which enter the tissues as Langerhans cells, act as scavengers
phagocytosing the dead bacteria and PMNLs. They also play an important
role in activating the acquired immune response by acting as antigen
presenting cells (APC) (Chapple & Gilbert 2002).
When macrophages encounter pathogens they phagocytose them and
release onto their surface antigenic material that binds to the host cell‟s major
histocompatible complex (MHC) class II receptors, allowing recognition by
effector T-cells. These T-cells proceed to mount a specific immune response,
including memory cell production, lymphokine production, direct lysis of
bacteria (T-cell cytotoxicity) and assisting in B-cell function (CD4 T-helper
cells). B-cells differentiate into plasma cells which produce immunoglobulins,
that are released into the blood stream and tissues where they „home in‟ on
and bind to target bacteria, and with the help of the complement system,
phagocytose and destroy them. IgG is the most important immunoglobulin in
periodontal disease and the Fcγ-RII receptors of PMNLs show a strong
avidity to IgG-opsonised bacteria (Kobayashi et al 2000), thus binding the
antigen/antibody complex and facilitating phagocytosis and downstream
killing.

12
The early inflammatory lesion is dominated by PMNLs, but with time the
mature lesion changes and T & B lymphocytes are activated providing
specifically targeted and controlled killing of bacteria through the acquired
immune response. The innate immune response continues at the same time
providing a less specific and less effective defence mechanism. If left
untreated the size of the inflammatory lesion exceeds a certain threshold
within each host and tissue damage ensues particularly if the host‟s enzyme-
inhibitor (e.g. tissue inhibitors of matrix metalloproteinases TIMPs) and
antioxidant defences are compromised.
1.5.1. Mechanisms of tissue damage
There are many mechanisms of tissue damage that result from the presence
of bacterial plaque within the gingival crevice/pocket and their antigenic
products that diffuse through the junctional epithelium. They can be
summarised as:
Direct damage by the bacteria
Indirect damage via bacterial-induced inflammatory process
Indirect damage by the acquired immune response (largely though the B-
cell/plasma cell systems where PMNLs are the effector cells)
Periodontal pathogens posses a wide array of virulence factors as discussed
previously, such as proteolytic enzymes, which are capable of degrading the
extra-cellular components of the periodontium, such as collagen, elastin, fibrin
and fibronectin. A.a produces a leucotoxin, which can lyse neutrophils and
macrophages, while P.gingivalis produces an array of proteases including
gingipains and those capable of destroying complement and
immunoglobulins. The LPS cell walls of gram-negative bacteria are capable
of invoking both innate and acquired host immune responses.
In generating an inflammatory exduate the resident host cells exude not only
cytokines but also matrix metalloproteinases (MMPs), which degrade collagen
within the connective tissues thereby creating room for the inflammatory

13
exduate and facilitating the movement of immune cells within the connective
tissues. The balance between the production of the family of matrix
metalloproteinases and their inhibitors (TIMPs) may be tipped by pro-
inflammatory cytokines such as Il-1β in favour of excessive damage of all the
components of the extracellular matrix (Page et al 1997). Additionally,
pathological levels of PGE2, IL-1β, TNFα and IL-6 produced by resident
fibroblasts and leukocytes mediate alveolar bone loss (Schwartz et al 1997).
During the PMNLs respiratory burst, molecular oxygen is reduced via the
NADPH-oxidase to form superoxide and other reactive oxygen species
(ROS). Lyosomal antimicrobial compounds are then discharged into the cell‟s
vacuole and activated by the ROS to kill the ingested organism within
(Ahluwalia et al 2004, Segal 1993). Before apoptosis is completed, these
biologically active products may be released into the external environment
allowing extracellular killing of micro-organisms but also causing damage to
surrounding host cell and tissue structures (Lindhe 1997).
1.6. The threat of oxygen
Oxygen is essential for life but breathing pure oxygen at atmospheric
conditions for more than 48 hours will lead to respiratory distress and even
death (Acworth & Bailey 1995). An adult exposed to pure oxygen at 1atm
pressure for as little as 6 hours will show signs of oxygen stress; chest
soreness, cough and a sore throat, whilst longer exposure leads to alveolar
damage (Halliwell 1994a). The potentially toxic effects of oxygen have long
been recognised but not fully understood. Research by Binger in the late
1920s on oxygen toxicity in mammals identified experimental work in the
previous century on respiratory problems induced by altered levels of oxygen
consumption. The most conclusive of these studies were those of Bert in
1878, who documented, “oxygen at high tension is a powerful poison” (Binger
et al 1927). However, it was not until the late 1940s - 1950s that oxygen
toxicity was fully appreciated by the medical community, when retrolenral
fibroplasias in premature babies were attributed to the high O2 concentration

14
of the incubator in 1954 (Halliwell 1994a). In the late 1960s and early 1970s
studies of newborn bronchopulmonary dysplasia and adult respiratory
distress syndrome confirmed the association (Knight 1998).
It is not the molecular oxygen per se that is toxic more the highly reactive
reduced adducts of oxygen. The presence of free radicals in biological
systems was not generally considered likely until 1954 when R. Gershman
and D. Gilbert proposed that many of the damaging effects of oxygen could
be attributed to oxygen free radicals (Halliwell 1984). The discovery of
superoxide dismutase in 1969 by McCord and Fridovich lead to affirmation
and further development of this hypothesis (McCord & Fridovich 1969).
Oxygen radicals and other oxygen-derived species are constantly generated
either by “accidents of chemistry” or for specific metabolic purposes in vivo
(Halliwell 1994a). It has been calculated that for every 100 tons of oxygen
metabolised approximately two tons form reactive oxygen species, and for
every oxygen molecule crossing into a cell each day 1 in 100 will damage
proteins and 1 in 200 damage DNA. These ROS are also capable of
damaging lipid and it is the damage to these biological molecules that renders
excess ROS release dangerous, especially when the body‟s natural
antioxidant defences are compromised (Acworth & Bailey 1995).
1.6.1. Basic free radical reactions
Free radicals have been defined as “any species capable of independent
existence that contain one or more unpaired electrons, an unpaired electron
being one that is alone in an orbital” (Halliwell 1991). Free radicals may be
formed in three ways: i) by the addition of a single electron to a molecule, ii)
by the loss of a single electron, iii) by homolytic cleavage of a covalent bond.
A + e- → A•- electron transfer
X:Y → X• + Y• homolytic fission

15
Electron transference is the most common mechanism in biological systems
as it requires less energy input than homolytic cleavage. In heterolytic fission
the electrons of the covalent bond are retained by only one of the fragments
of the parent molecules and this results in ion formation, the ions being
charged, rather than free radicals (Cheeseman et al 1993).
Free radicals can be positively charged, negatively charged or neutral and the
unpaired electron is symbolised by a superscripted dot in the chemical
symbol. Electrons are more stable when paired together in orbitals and free
radicals are more reactive than non-radical species. When two radicals meet
(resulting in their disappearance) a termination reaction occurs whereby their
unpaired electrons combine via a covalent bond.
O2•- (superoxide) + NO• (nitric oxide) → ONOO-
(peroxynitrite) Reaction 1
However most molecules in the body are not radicals, and when a radical
meets a non-radical molecule it will reduce, oxidise or simply add to the non-
radical resulting in the other molecule involved becoming a radical itself.
Therefore, the important feature in radical reactions is that they proceed in a
chain reaction, one radical begets another and so on (Halliwell 1989 &
1994b).
By their nature, free radicals are highly reactive and diverse species including
not only oxygen species but also nitrogen and sulphur species, while the
hydrogen radical (H• the same as the hydrogen atom) is the simplest free
radical containing only one proton and one electron (Halliwell 1994b). This
thesis will focus on the oxygen derived reactive species (ROS) but some
mention of the other species is necessary due to interactions between
different classes (see reaction 1).
1.6.2. Atomic and molecular oxygen
Atoms have shells containing negatively charged electrons, which require
energy to prevent them being pulled into the nucleus. Each shell can have up

16
to four orbital patterns around the nucleus, spinning in either direction.
Orbitals are filled in order of increasing energy and may hold only two
electrons with opposite spins (the Pauli Exclusion Principle). Atomic oxygen
has eight electrons distributed 1s2, 2s
2, 2p4. In the first shell the electrons are
paired in an s-orbital, in the second shell one pair of electrons are also in an
s-orbital while the remaining four electron pairs are in p-orbitals. In the p-
orbitals there is only one paired electron group, while the other two p-orbitals
contain individual electrons (Webster & Nunn 1987). Molecular di-oxygen is
formed from the joining of two oxygen atoms and is regarded as a stable bi-
radical, as it has sixteen electrons occupying two atomic shells, but the outer
2e- are unpaired with a parallel spin (see Fig.1.3).
Fig 1.3: The organisation of electrons within the shells and orbitals of di-oxygen. Two oxygen
atoms (Atom A & Atom B) are shown on either side of the molecule of di-oxygen (O2) which
results from their combination. (Adapted from Webster & Nunn 1987)
Atom A Molecule of
di-oxygen (02)
Atom B
1s
1s
1s
1s
2s 2s
2s
2s
8e-
2p
16e-
2p 2p
2p 2p
2p
8e-
2p
The result of this arrangement is a molecule with the desire to pair up its outer
unpaired electrons, making it a powerful oxidising agent, but because of the
spin restriction caused by the parallel spin of the outer unpaired 2e- it can not

17
accept electron pairs, as 2e- do not exist in isolation with parallel spins, this
spin restriction forces molecular oxygen to only accept one electron at a time
(Webster & Nunn 1987, Chapple & Matthews 2007).
The removal of an electron constitutes oxidation, while the substance
receiving the electron becomes reduced. Thermodynamically oxygen wants
to take on additional electrons (two per atom, four per molecule) to produce a
water molecule which has much lower free energy, but due to its stepwise
acceptance of a single electron at a time, oxygen free radical formation
occurs. The addition of the first electron (e-) to an oxygen molecule results in
the formation of the superoxide anion:
O2 + e- → O2•- Reaction 2
The addition of a second electron (e-) results in the formation of the ROS
hydrogen peroxide (H2O2), although not a radical, it will readily receive two
more electrons (reaction 4 & 5) thereby making it a cytotoxic oxidant:
O2•- + e- 2H+ → H2O2 Reaction 3
The addition of a third electron (e-) results in the formation of the hydroxyl
radical, one of the most potent free radicals known, which can indiscriminately
oxidise virtually any organic molecule:
H2O2 + e- → •OH + OH- Reaction 4
The addition of a fourth electron (e-) results in the formation of water:
•OH + e- + H+ → H2O. Reaction 5
(McCord 2000, Chapple & Matthews 2007)
1.6.3. Origins and formation of reactive oxygen species
ROS are generated by a wide variety of sources, and are formed in all living
organisms either as a result of normal metabolism (endogenous sources) or
18
accidentally and as a consequence of exposure to external environmental
stimuli (exogenous sources) such as ionizing radiation, UV light, therapeutic
drugs and pollutants such as vehicle exhaust fumes. Behavioural activities
such as tobacco smoking or beetle nut use will also add to oxidative damage
by ROS. Endogenous sources are from two main processes:
as a bi-product of metabolic pathways
functional generation by host cells, primarily defence cells (phagocytes)
plus cells of the connective tissues (osteoblasts and fibroblasts).
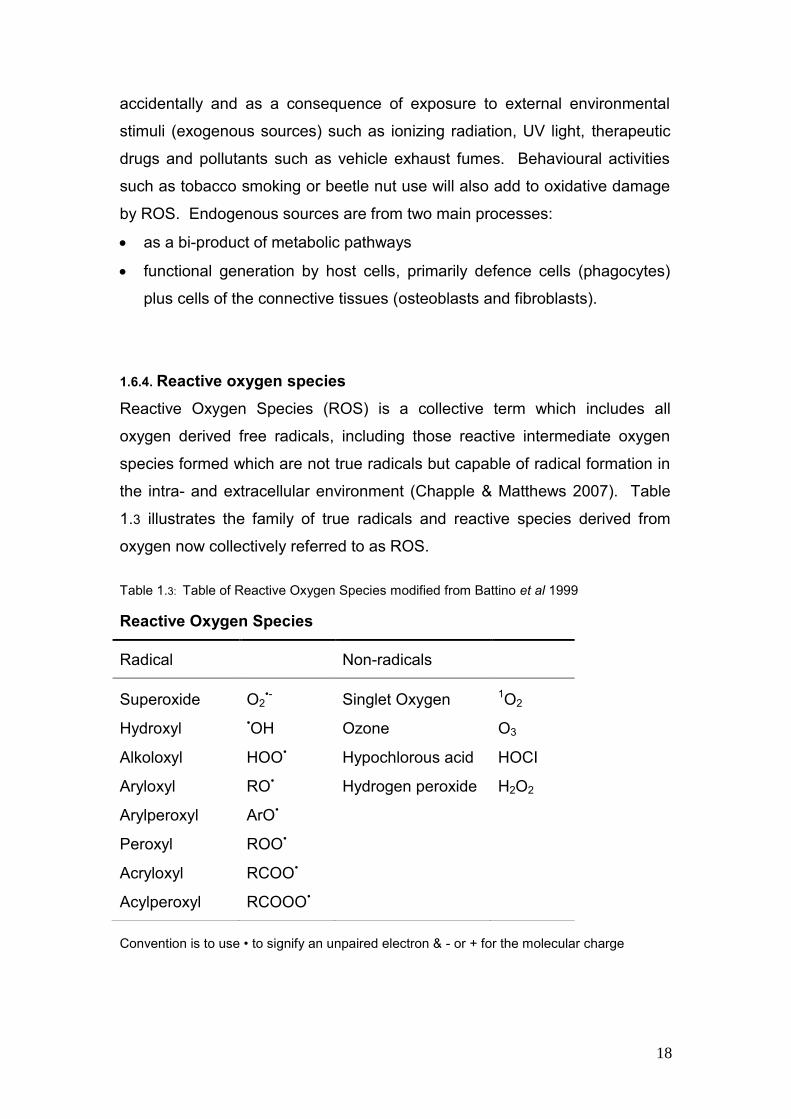
1.6.4. Reactive oxygen species
Reactive Oxygen Species (ROS) is a collective term which includes all
oxygen derived free radicals, including those reactive intermediate oxygen
species formed which are not true radicals but capable of radical formation in
the intra- and extracellular environment (Chapple & Matthews 2007). Table
1.3 illustrates the family of true radicals and reactive species derived from
oxygen now collectively referred to as ROS.
Table 1.3: Table of Reactive Oxygen Species modified from Battino et al 1999
Reactive Oxygen Species
Radical Non-radicals
Superoxide O2•- Singlet Oxygen 1O2
Hydroxyl •OH Ozone O3
Alkoloxyl HOO• Hypochlorous acid HOCI
Aryloxyl RO• Hydrogen peroxide H2O2
Arylperoxyl ArO•
Peroxyl ROO•
Acryloxyl RCOO•
Acylperoxyl RCOOO•
Convention is to use • to signify an unpaired electron & - or + for the molecular charge

19
1.6.4.1. Singlet oxygen (1O2)
Two singlet oxygen states exist, by removal of one electron and alleviation of
the spin restriction from molecular oxygen. Singlet oxygen O21∆g is not a true
radical as it has no unpaired electrons, but has great importance in biological
systems, whereas singlet oxygen O21Ʃg
+ has a short life span and decays to
∆g rapidly (Halliwell et al 1984, Darr et al 1994). Singlet oxygen O21∆g is
highly reactive in lipid membranes but little is known of its role in tissue
damage and any possible role in periodontal inflammation has yet to be
identified (Chapple 1997).
1.6.4.2. Superoxide (O2•-)
If a single electron is added to molecular oxygen the superoxide (O2•-) anion
is formed (see reaction 2). This reaction is brought about as an accidental bi-
product of metabolism within the mitochondria, the main sites of oxygen
metabolism during ATP production. During the mitochondrial electron
transport system, electrons leak at a constant rate and reduce oxygen to O2•-.
At least two sites have been identified in the electron transport chain,
Complex I and ubisemiquinone, where leakage may occur and superoxide
formation results (McCord 2000). It is estimated the 1-2% of the oxygen
consumed by the mitochondria is only partially reduced by leaked electrons
and converted to O2•- (Cadenas et al 2000). Since we consume large
quantities of oxygen even at rest, it is estimated that we may produce over
2kg of superoxide per year, this figure increases in those with chronic
inflammation (Halliwell 1994a & 1994b). Hence the mitochondria contain a
specific enzyme system, mitochondrial superoxide dismutase, to reduce O2•-
back to the less reactive H2O2 and ultimately water (via a second enzyme
called catalase).
However, the most important source of O2•- is the functional generation by
phagocytic cells (neutrophils, monocytes, macrophages and esinophils) to
inactivate invading bacteria or viruses (Halliwell 1994a). Its production occurs
within the hexo-monophosphate (nicotinamide adrenine di-nucleotide
phosphate, NADPH-oxidase) shunt, that shunts glucose-6-phosphate from

20
the glycolysis pathway and utilizes molecular oxygen and NADPH to form the
superoxide radical anion O2•- (Chapple & Matthews 2007). NADPH-oxidase
consists of a number of subunits at rest between the cytosol and the
intercellular vesicle membrane, when the PMNL is stimulated by an antigen,
cytokine or other mediator, the respiratory burst ensues and the cytobolic
subunits migrate to the vacuole or cell membrane and assemble into the
active oxidase, resulting in the delivery of O2•- into the phagocytic vacuole.
Although superoxide may contribute to the microbial killing process other
more potent ROS are rapidly generated from this precursor (Bergendi et al
1999).
Superoxide can act as both an oxidant and a reductant, undergoing a
dismutation reaction in which one O2•- acts as a reductant while the other as
an oxidant. This spontaneous dismutation occurs rapidly at a neutral pH (K2
= 1 x 10⁵ M-1 second-1) (Darr et al 1994). O2•- is considered a weakly
reactive radical by comparison with the hydroxyl radical but nevertheless can
attack a number of biological targets and it‟s ability to spontaneously
dismutate to hydrogen peroxide and singlet oxygen leads to damage by these
radicals (Chapple 1997).
O2•- + O2
•- + 2H+ → 1O2 + H2O2 Reaction 6
Via a complex reaction with hydrogen peroxide catalysed by metal ions
(Haber-Weis reaction) superoxide may be converted to the highly reactive
hydroxyl radical (Cheeseman et al 1993, Chapple 1997).
O2•- + H2O2.
Fe or Cu ions •OH + OH- + O2 Reaction 7
Superoxide can also interact with nitric oxide to form the highly potent
peroxynitrite anion (reaction 1) (Chapple 1997).
1.6.4.3. Hydrogen peroxide (H2O2)
Although not a true radical and being formed following the two electron
reduction of ground oxygen (reaction 3), hydrogen peroxide has widely been

21
reported as cytotoxic in mammalian cells at levels of ≥50µM (Halliwell et al
2000). Hydrogen peroxide is generated by the dismutation of superoxide O2•-
(mostly from active phagocytes) in vivo, both non-enzymatically and catalysed
by superoxide dismutase (SOD). It resembles water in its molecular structure
and is able to diffuse across cell and nuclear membranes unlike O2•- (Halliwell
1994a). H2O2 is however poorly reactive, it can only act as a mild oxidising or
reducting agent and does not oxidise most biological molecules readily. The
greater threat from H2O2 comes from its indiscriminate conversion to the
hydroxyl radical (•OH) either by exposure to ultraviolet light or through
interaction with transition metal ions, most importantly in the classical Fenton
reaction (Halliwell et al 2000). In the presence of iron II or copper I it is
reduced and the hydroxide ion (OH-) and hydroxyl radical (•OH) are formed
via Fenton chemistry (Blake et al 1987).
Fe2+ + H2O2 → Fe3+ + •OH + OH- Reaction 8
More recently (and of high significance in biological systems) it has been
recognised that H2O2 is a key cell signalling molecule and is involved in the
up-regulation of the expression of certain genes through redox-regulated
gene transcription factors for example IL triggers the displacement of an
inhibitory subunit from the cytoplasmic transcription factor NF-κB (Halliwell
1994a), facilitating nuclear translocation of free NF-κB and down-stream
transcription of pro-inflammatory cytokine genes e.g.IL-1 and IL-8. It also
plays a role in the promotion of epithelial cell electrolyte transport (Conner et
al 1996), and where inflammation is present it may increase adhesion
molecule expression, cause proliferation of cells, induce apoptosis and
modulate aggregation of platelets (Chapple & Matthew 2007).
Hydrogen peroxide is removed primarily by the antioxidant enzyme catalase,
which acts predominately intracellularly, by glutathione peroxidase within the
mitochondria and extracellularly, and the thioredoxin-linked peroxidases
(Chapple & Matthew 2007). Although most cells are exposed to some levels
of H2O2 from mitochondrial and phagocytic sources, some tissues especially
in the oral cavity may be exposed to higher concentrations due to other

22
exogenous sources. Beverages, such as green or black tea and coffee,
contain concentrations of H2O2 above 100µm, which may diffuse into the cells
(Halliwell et al 2000). Oral bacteria are also a source of H2O2 and salivary
peroxidise, by its conversion to hypothiocyanite, is able to stop this bacterial
production and protect the epithelial cells in contact with the pathogens
(Carlsson 1987).
1.6.4.4. Hydroxyl radical (•OH)
The hydroxyl radical (•OH) or related perhydroxyl radical (HO2•-) are the most
potent ROS and are known to cause damage and destruction to a variety of
cellular and tissue components (Chapple & Matthews 2007). It may be
formed from superoxide via a Haber-Weiss reaction with hydrogen peroxide
(reaction 7), or from hydrogen peroxide via Fenton reactions (reaction 8).
However formed, the hydroxyl radical is extremely reactive, attacking and
damaging almost every molecule within living cells while persisting for less
than a microsecond (Halliwell 1991) (Table 1.4).
Table 1.4: Period of Half-life of Reactive Oxygen Species modified from Bergendi et al 1999
Period of Half-life of Free Radical & Intermediates
ROS Half-life (sec)
Singlet oxygen 1O2 1 x 10⁻⁵
Superoxide O2•- Enzyme decomposition
Hydrogen peroxide H2O2 Enzyme decomposition
Hydroxyl •OH 1 x 10⁻⁹
Nitric oxide NO• 1 to 10
Peroxynitrite ONOO- 0.05 to 1.0
Alcoxyl RO• 1 x 10⁻⁶
Peroxyl ROO• 7
23
Whilst some radicals are stable enough to diffuse some distance from their
site of generation, •OH is so reactive that it is believed to react within 1-5
molecular diameters of its site of formation (Pryor 1986). Thus, it will react at
the site of formation and has been shown to oxidise proteins and promote
DNA strand scission (Conner et al 1996). Reactions of •OH with biological
molecules, most of which are non-radicals, set off chain reactions. The best
characterised of these is the lipid peroxidation reaction, which occurs when
•OH is generated near to membranes and attacks the fatty acid side chain of
the membrane phospholipid, creating a lipid peroxyl radical and lipid
hydroperoxides. If lipid peroxidation progresses unchecked it can lead to cell
necrosis.
1.6.5. Sources of Fenton-reactive metal iron in vivo
Since the formation of the majority of hydroxyl radicals is through a metal-
dependant reduction of hydrogen peroxide via Fenton chemistry, the damage
and significance of •OH radical activity depends upon its locus of formation
and the availability of metal ions. Cells and organisms handle iron salts very
carefully to ensure “free iron” rarely occurs. Iron is always bound to proteins,
membranes, nucleic acids or low-molecular weight chelating agents.
However, ferritin-bound iron can be mobilised from proteins by superoxide
and •OH formation occurs. Whilst at pH of 5.6 iron maybe mobilised from
transferrin, which is achievable in the microenvironments of adherent
phagocytes (Halliwell et al 1986) and by certain bacteria (Roberts et al 2005).
The majority of iron is stored in haemoglobin and around 10% in myoglin
(Halliwell et al 1984) but there is no clear evidence to suggest whether these
may serve as Fenton catalysts.
1.6.6. Nitrogen-derived free radicals
The bulk of free radical knowledge and research to date has focused on
reactive oxygen intermediates, brief mention of the nitrogen derived free

24
radicals is included due to the interactions between the two groups, and in
particular peroxynitrite formation (ONOO-).
1.6.6.1. Nitric oxide (NO•)
Nitric oxide is synthesised from the amino acid L-arginine within vascular
endothelial cells, by macrophages and certain brain cells (Halliwell 1994a), it
is a small lipophilic molecule, which is able to cross cell membranes. NO•
activity is regulated by cytokines and during inflammation it regulates several
humoral and cellular responses, having both anti-inflammatory and pro-
inflammatory properties, dependant on the phase and type of inflammation
(Moilanen et al 1995). When present in low concentrations nitric oxide acts
as a vasodilator helping regulate blood flow and pressure, as well as a
neurotransmitter for the central nervous system. It also plays a part in the
neuroendocrine system. At high concentrations the nitric oxide radical may
act as a cytostatic and is cytotoxic for bacterial, fungal and protozoal
organisms as well as tumour cells (Darr et al 1994, Bergendi et al 1999,
Cuzzocrea et al 2001).
Simultaneous production of NO• and O2•- can lead to the production of the
highly reactive peroxynitrite anion (ONOO-), while not a true radical it is
believed to be responsible for many of the reactions originally attributed to the
radicals which produced it (Chapple & Matthews 2007).
1.6.6.2. Peroxynitrite (ONOO-)
Peroxynitrite is a selective oxidant reacting slowly with most biological
molecules (Beckman & Koppenol 1996). Peroxynitrite is formed by a
diffusion-limited reaction between NO• and O2•-, it has a half-life of 1.9
seconds at pH7.4, which permits its diffusion over several cell diameters
(Beckman et al 1990). Once near or inside a cell ONOO- is able to damage or
deplete a number of vital cell components, such as DNA strand scission,
lipids by peroxidation and antioxidant availability (Cuzzocrea et al 2001).

25
1.6.7. Sulphur derived free radicals (reactive sulphur species; RSS)
ROS may frequently react with cellular thiols to form disulphides, which are
considered only mildly oxidising under physiological conditions but, under
conditions of oxidative stress, sulphur maybe oxidised beyond this disulphide
state to form disulphide S-monoxides and disulphide S-dioxide. These
reactive sulphur species inhibit the function of thiol-dependent proteins and
increase the reactivity of some of their parent compounds, especially H2O2
and disulphides (Giles et al 2002).
1.7. The role of ROS in tissue damage
Whilst reactivity does not equate to toxicity, it is clear that many of the
reactions involving ROS can produce damage in vivo, oxidant by-products of
normal metabolism cause extensive damage to lipid, protein and DNA. Ames
and co-workers estimate that each human cell receives as many as 10,000
radical „hits‟ per day (Ames et al 1993).
1.7.1. Lipid perioxidation
The polyunsaturated fatty acids (PUFA) located in biological cell membranes,
such as cytoplasmic cell membranes and mitochondrial membranes are
prime targets for ROS (Çanakçi et al 2005). Most polyunsaturated fatty acids
have their double bond conjugated and separated by a methylene group. The
presence of this double bond next to the methylene group, makes the
methylene C-H bond weaker and susceptible for hydrogen abstraction (Blake
et al 1987). The hydroxyl radical and peroxynitrite anion are most effective at
activating this process, which gives rise to the lipid peroxidation chain
reaction, the events of which have been simplified into three major stages by
Halliwell (1991): initiation, propagation and termination. The hydroxyl or
perynitirite species attacks the PUFA side chains (e.g. arachidonic acid and
decosachexaenoic acid) of the lipid membrane and abstracts the hydrogen
atom (initiation) forming a carbon-centred radical (-•C-) in the membrane.
These carbon centred radicals may either undergo molecular rearrangement

26
to give a conjugated diene structure or may combine with another such
radical forming a covalent bond and creating cross-linking and disruption of
the membrane structure. More commonly the carbon-centred side chain
radical combines with oxygen creating yet another radical, the peroxyl radical
(ROO•). The peroxyl radical is reactive enough to attack adjacent PUFA side
chains (propagation), abstracting hydrogen and generating another carbon-
centred radical and a lipid hydroperoxide (ROOH). The carbon-centred side
chain radical goes on to form another peroxyl radical in the presence of
oxygen, which in turn attacks another PUFA side chain and thus a self-
perpetuating chain reaction occurs in which hundreds of lipid hydroperoxides
are formed (see fig.1.4).
Fig. 1.4: The lipid peroxidation chain reaction initiated by hydroxyl radicals.
(Adapted from Chapple & Matthews 2007)
CH•OH
-•C- + H2O
+
O2
ROO•
CH
-•C- + ROOH
+
O2
ROO•
-•C- = carbon centred radical
ROO• = lipid peroxyl radical
ROOH = lipid hydroperoxide
PUFA‟se.g. arachadonic
acid
The accumulation of lipid hydroperoxides in the cell membrane can have a
serious effect on the membranes‟ fluidity, affecting the activity of
transmembrane enzymes, receptors, transporters and other membrane
proteins. This results in changes in membrane selectivity and permeability
and may even cause it to collapse (Halliwell et al 1991, Çanakçi et al 2005).

27
Lipid hydroperoxides can also decompose into highly cytotoxic secondary
products such as aldehydes, which are also able to cause damage to
membrane proteins, inactivating receptors and membrane-bound enzymes
(Halliwell 1991).
The lipid-soluble radical scavenger vitamin E (α-tocopherol) is the most
effective agent in the termination of the lipid peroxidation chain reaction and is
vital to ensure membrane integrity (Chapple & Matthews 2007).
1.7.2. Protein oxidation
Proteins are the most abundant cell constituents, making them an important
target for ROS, as even minor structural modification of a single protein can
lead to changes in biological activity within the cell (Çanakçi et al 2005).
Oxidized proteins are often functionally inactive and are more susceptible to
proteinases due to their unfolding, however certain oxidized proteins are
poorly handled by cells and together with an altered rate of production from
ROS, their accumulation and damaging effect can be seen during aging and
in certain chronic conditions such as diabetes (Dean et al 1997).
Fig 1.5: A schematic representation of the possible effects of ROS on proteins.
(Adapted from Dean et al 1997)
Radical generation
Protein oxidation
Protein bound ROS
Secondary radicals
Stable end products of
protein oxidation
AldehydesProtein radical
28
Oxidation of amino acid residue side chains, formation of protein-protein
cross-linkage and oxidation of the protein backbone leading to protein
fragmentation are all seen as a result of ROS exposure (Berlett & Stadtman
1997). Hydroxyl radicals (•OH) are the predominant species to initiate protein
oxidation but the course of the oxidation process is governed by the
availability of O2 and O2•- or its protonated form (HO2
•). Work has shown that
transition metal ions can substitute for certain radicals in some reactions
(Berlett & Stadtman 1997).
1.7.3. Nucleic damage (DNA)
Both nuclear and mitochondrial DNA are susceptible to damage from
endogenous ROS. Damage to DNA is predominantly by •OH and NOO-,
which are able to generate a multitude of products from all four bases, while
1O2 attacks guanine preferentially and O2•- does not attack DNA (Halliwell
1994a, Cuzzocrea et al 2001). H2O2 is relatively unreactive with DNA in
isolation but able to cause damage via the generation of oxidants from iron-
mediated Fenton reactions (Imlay & Linn 1988, Henle & Linn 1997).
DNA damage by ROS/RNS can cause structural alterations such as nicking,
deletion, rearrangement, insertions, sequence amplifications and base-pair
mutations. One of the most common base lesions is the base-pair mutation
of purine and pyrimidine, which can convert guanine to 8-hydroxyguanine,
which is often measured as an index marker of DNA damage (Cuzzocrea et
al 2001, Chapple & Matthews 2007). As well as causing damage to DNA,
ROS have been recognised as key activators of gene transcription factors
and therefore play a role in the regulation of genes encoding for pro-
inflammatory or protective actions (Battino et al 1999).
1.7.4. Carbohydrate damage
Oxidative damage by radicals on carbohydrates is known to occur to a lesser
extent. Glucose, whether free or bound to protein, can oxidize to produce
reactive oxidants, O2•- and H2O2 (Hunt et al 1993). Sugars such as glucose,

29
deoxy sugar and nucleotides readily react with •OH, while some radicals are
capable of causing fragmentation of carbohydrates, e.g. hyaluronic acid
resulting in a drop in viscosity (Blake et al 1987).
1.8. Role of ROS in periodontal disease
The role of ROS in the pathogenesis of a variety of inflammatory diseases
and tissue damage, both direct and indirect, has become a major area of
research over the last decade. Halliwell devised postulates, similar to those of
Koch in 1884, which stated the criteria to be fulfilled before ROS can be
concluded as the primary mediator of tissue damage for a given disease: -
“the ROS or the oxidative damage must always be demonstrated at the
site of injury”
“the time course of formation of ROS or of the oxidative damage it causes
should be consistent with the time course of the tissue injury, preceding or
accompanying it”
“direct application of the ROS over a relevant time course to the tissue at
concentrations within range found in vivo should reproduce most or all of
the tissue injury and oxidative damage observed”
“removing the ROS or inhibiting formation should diminish the tissue injury
to an extent related to the degree of inhibition of the oxidative damage
caused by the ROS”
(Halliwell 2000, Halliwell & Whiteman 2004)
These postulates assume levels of ROS generated are large enough to cause
direct tissue damage, but are limiting and do not relate to potential for ROS-
mediated indirect damage through redox-sensitive signalling pathways
(Chapple & Matthews 2007).
1.8.1. Direct actions of ROS in periodontal destruction
Excessive production of ROS principally by PMNLs in periodontal disease
causes indiscriminate damage to cellular, DNA molecules, lipid membranes
and proteins, as well as extracellular matrix components of the periodontal

30
tissues (Çanakçi et al 2005). Studies have shown ROS degradation of a
number of extracellular components including proteoglycans and their
constituent glycosaminoglycans including hyluronan. ROS have also been
demonstrated to be capable of degrading bone proteoglycans and collagen
degradation, resulting in a reduction of collagen gelation, increased
aggregation, cross-linking and collagen insolubility (Waddington et al 2000,
Çanakçi et al 2005).
Fig 1.6: Schematic diagram showing the role of ROS in generating chronic inflammation and
tissue damage in response to periodontal pathogens (Chapple & Matthews 2007).
Periodontal Pathogens
Inflammatory
cytokines,
chemokines,
adhesion molecules
etc. e.g. TNFα, IL-1
IL-8
Fibroblast
generation of
ROS
PNML
generation of
ROS
Recrutment &
activation of
hyper-responsive
PMNLs
Crevicular/junctional
epithelium + other PDL cells
Receptor mediated
Activation of NF-κB & AP-1
Non-receptor mediated
TIMPs ↓
MMPs ↑
Osteoclast
activation/
differentiation
OXIDATIVE
STRESS
TISSUE
DAMAGE
Releasing of traditional
inflammatory mediators
Generation of oxidation
products – lipid peroxides,
oxidase proteins
Inactivation of TIMPs
Cell Wall
Components
IL-8
GM-CFS
E-selectins
LPS
TNFα
TNFα
LPS
TNFα
LPS
DNA
1.8.2. Indirect action of ROS in periodontal destruction
In addition to direct intracellular and extracellular damage, ROS are capable
of causing cell injury indirectly by enhancing pro-inflammatory gene
expression, including cytokines (e.g. TNFα. IL-1), chemokines (e.g. IL-8) and
cellular adhesion molecules. The transcription factors NF-κB and activating
protein-1 (AP-1) are redox sensitive and ROS are thought to modulate their

31
activity. ROS are also believed to increase apoptosis. Induction of apoptosis
may be seen in response to DNA damage, which occurs through ROS,
particularly NO•. An increase in NO• has been reported in both experimental
and human models of periodontitis (Çanakçi et al 2005, Chapple & Mathews
2007).
1.8.3. ROS produced by neutrophils
PMNLs are widely believed to be the initial and predominant host defence cell
against the pathogenic bacteria of periodontal disease. When primed by an
antigen, bacterial or otherwise, the PMNL undergoes a respiratory burst,
whereby an uptake of oxygen arises through the activation of NADPH-
oxidase within the part of the plasma membrane which forms the phagosome.
The NADPH oxidase catalyses the oxidisation of NADPH to NADP, which
releases two electrons resulting in the reduction of oxygen to superoxide,
which serves as a precursor for further ROS formation (Halliwell 2006).
NADPH + 2O2 → NADP+ + H+ + 2O2•-
Reaction 9
The O2•- initially formed spontaneously dismutates or is converted to
hydrogen peroxide H2O2 via one of the three superoxide dismutase enzymes.
O2•- + O2
•- + 2H+ +SOD 1O2 + H2O2 Reaction 10
The hydrogen peroxide formed from this reaction acts as a substrate for
neutrophil myeloperoxidase and is converted to hydrocholorous acid (HOCI) a
highly biologically active ROS (Chapple & Mathews 2007). The H2O2 may
also undergo Fenton reactions in the presence of Fe2+ or Cu2+ ions to form
the hydroxyl radical (•OH) (reaction 8).
These ROS, along with lyosomal antimicrobial compounds (myeloperoxidase,
lysozyme, lactoferrin, cationic proteins etc) are discharged into the cell‟s
vacuole to kill the ingested organism within. Before apoptosis is completed,
these biologically active products may be released into the external
environment allowing extracellular killing of micro-organisms (Lindhe 1997).

32
However in more recent years research has indicated the production of ROS
within neutrophils may not be directly responsible for the destruction of the
engulfed microbe, but may act indirectly through the activation of the
lysosomal proteases. The release of ROS into the phagosome induces a
charge across the membrane which must be compensated for. The
movement of compensating K+ ions through a Ca2+ channels produced
conditions within the phagosome conducive with microbial killing and
digestion by enzymes release from the cytoplasmic granules (Ahluwalia et al
2004, Segal 1993).
PMNLs require an optimum oxygen tension (1% O2 concentration) and
suitable pH (approximately 7.0 – 7.5) for sufficient O2•- production. Studies on
the environment within the periodontal pocket have demonstrated an average
O2 tension of 1.8% and average pH of 6.92, such levels are acceptable to
accommodate the production O2•- by PMNLs (Waddington et al 2000). Other
research has demonstrated in chronic periodontal disorders that peripheral
neutrophils are both hyper-responsive to FCγ-receptor stimulation and hyper-
reactive, releasing excessive ROS (Gustafsson et al 2006, Matthews et al
2006, Matthews et al 2007).
Another way in which ROS have been implicated in microbial killing is the
release of neutrophil extracellular traps (NETs), which are released as the
PMNL‟s membrane breaks. This cell death, known as „netosis‟, is believed to
be distinct from apoptosis and necrosis and is dependent on the production of
ROS from the NADPH oxidase (Fuchs et al 2007). NETs allow the PNMLs to
fulfil their antimicrobial function even beyond their lifespan and maybe
another way in which collateral tissue damage ensues.
1.8.4. Other cellular sources of ROS in the periodontal tissues
All cells produce ROS as part of normal physiological functions. The prime
source in periodontal disease is from the mononuclear and neutrophilic
polymorphonuclear phagocytes, but there is evidence that other cells of the
periodontal tissues may contribute to local oxidative stress (Chapple &

33
Matthews 2007). Fibroblasts have been shown to produce superoxide (O2•-)
in response to bacterial cell wall components and cytokines such as IL-1 and
TNF (Meier et al 1989, Skaleric et al 2000). The production of ROS by
fibroblasts has been shown to be further increased in the presence of calcium
(Ca2+) (Skaleric et al 2000). Calcium levels are high in the Howship‟s lacunae
(Silver 1988) and the activity of the osteoclast at the alveolar crest may also
increase Ca2+ levels perpetuating further fibroblast ROS release.
Gingival epithelial cells have been shown to express an NADPH oxidase
(Nox) distinct from the phox isoforms of phagocytes, although its activity is 20
fold less than those reported for phagocytes. Sustained production within a
periodontal pocket may represent a significance source of local ROS
(Chamulitrat et al 2004).
ROS have also been reportedly produced by osteoclasts at the ruffle
border/bone interface suggesting a direct role in bone resorption (Chapple
1997). However, other research suggests, ROS, such as O2•- and H2O2 are
also involved in the activation of the osteoclasts via activation of the
transcription factor NF-κB, prior to bone resorption taking place rather than
though direct degradation of the bone matrix (Hall et al 1995). Finally, type-1
interferon has been recently implicated in the hyperactive PMNLA phagocyte,
implying either a priming role for viruses or an autoimmune compound to
periodontitis pathogenesis (Wright et al 2008).
1.9. Host defence against free radicals - Antioxidants
Reactive oxygen species possess two main roles: the redox regulation of cell
signalling/functions and the detrimental effect on certain substrates, the link
between these two distinct functions is the body‟s antioxidant defence
systems, which evolved to limit free radicals in biological systems. The
human body possess a plethora of antioxidants to defend against free radical
activities and in normal physiology there is a dynamic equilibrium between the
two, the so-called „redox balance‟. It is only when ROS activity exceeds

34
antioxidant defence capabilities or antioxidant defences are reduced that the
balance shifts in favour of the ROS, resulting in oxidative stress and possible
tissue damage (Chapple & Matthews 2007) see fig 1.7.
Fig 1.7: The biological effect of shifts in the balance of activity between reactive oxygen
species (ROS) and antioxidant (AO) species. (Adapted from Chapple & Matthews 2007)
ROS AO
R E D O X S T A T E
Excess AO
vs ROS
Inhibition of
Redox-sensitive
transcription
factors
Activation of
Redox-sensitive
transcription
factors
ROS
exceeds AO-
defences
Antioxidant
state
Anti-
inflammatory
state
Pro-
inflammatory
state
Oxidative
stress
Tissue
repair
Cell/tissue
protection
Indirect tissue
damage
Direct tissue
damage
Antioxidants may be regarded as “those substances which when present at
low concentrations, compared to those of an oxidisable substrate, will
significantly delay or inhibit oxidation of that substrate” (Halliwell & Gutteridge
1989). Antioxidants may be classified in several ways: -
according to their mode of function into either preventative or scavenging
antioxidants (table 1.5)
according to their location of action, intracellular, extracellular or
membrane associated (table 1.6)
with regard to their solubility, lipid or water (table 1.7)
by their structural dependents (table 1.8)
by their source/origins, dietary or non-dietary (table 1.9)

35
Table 1.5. Antioxidants classified by mode of action
Mode of Action Examples
Preventative Antioxidants Enzymes: superoxide dismutase (SOD 1,2 and 3), catalase,
glutathione peroxidise, DNA repair enzymes e.g. poly(ADP-
ribose) polymerase
Metal ion sequestrators: albumin, lactoferrin, transferrin,
hapoglobin, ceruloplasmin, hexpexin, carotenoids, SOD,
catalase, glutathione peroxidise, glutathione reductase, uric
acid, polyphenolic flavenoids
Scavenging (chain
breaking) antioxidants
Ascorbate, carotenoids, uric acid, α-tocopherol, polyphenols
(flavenoids), bilirubin, albumin, ubiquinone (reduced form),
reduced glutathione and other thiols
Table 1.6. Example of key antioxidants classified by location
Location Examples
Intracellular Superoxide dismutase 1 and 2, catalase, glutathione peroxidise,
DNA repair enzymes e.g. poly(ADP-ribose) polymerase, others,
reduced glutathione, ubiquinone (reduced form)
Extracellular Superoxide dismutase 3, selenium-glutathione peroxidise,
reduced glutathione, lactoferrin, transferring, hapoglobin,
ceruloplasmin, albumin, ascorbate, carotenoids, uric acid
Membrane associated α-tocopherol
Table 1.7. Key antioxidants classified by solubility
Solubility Examples
Water soluble Hatoglobin, ceruloplasmin, albumin, ascorbate, uric acid,
polyphenolic flavenoids, reduced glutathione and other thiols,
cysteine, transferrin
Lipid soluble α-tocopherol, carotenoids, bilirubin, quinines (e.g. reduced
ubiquinone)

36
Table 1.8. Antioxidants classified by structure they protect
Structure Examples
DNA protective
antioxidants
Superoxide dismutase 1 and 2, glutathione peroxidise, DNA
repair enzymes e.g. poly(ADP-ribose) polymerase, reduced
glutathione, cysteine
Protein protective
antioxidants
Sequestration of transition metals by preventative antioxidants
Scavenging by competing substrates
Antioxidant enzymes
Lipid protective
antioxidants
α-tocopherol, ascorbate, carotenoids (including retinol), reduced
ubiquinone, reduced glutathione, glutathione peroxidase,
bilirubin
Table 1.9. Some key antioxidants classified by their origin
Location Examples
Exogenous antioxidants
(diet only)
Carotenoids, ascorbic acid, tocopherol (α, γ, β, δ), polyphenols
(e.g. flavenoids, catechins) folic acid, cysteine
Endogenous antioxidant
(synthesised by the
body)
Catalase, superoxide dismutase, glutathione peroxidise,
glutathione-S-transferase, reduced glutathione, ceruloplasmin,
transferrin, ferritin, glycosylase, peroxisomes, proteases
Synthetic e.g. N-acetylcysteine, penicillamine, tetracyclines
All tables taken from Chapple & Matthews 2007.
The preventative antioxidants function by enzymatic elimination of superoxide
and hydrogen peroxide or by sequestration of metal ions, preventing Fenton
reactions and subsequent hydroxyl radical formation (Halliwell & Gutteridge
1990). The scavenging/chain breaking antioxidants are the most important in
extracellular fluids, inhibiting chain initiating and chain propagating radicals as
they form (Brock 2005). The lipid soluble antioxidants act at the cell
membrane and protect against lipid peroxidation, while water-soluble
antioxidants are more important within extracellular tissue fluids. Several

37
antioxidants have dual or triple actions such as ascorbate (vitamin C), which
acts as a chain breaking/scavenging antioxidant as well as a preventative
antioxidant by its ability recycle α-tocopherol (vitamin E) from its oxidised form
(Niki 1987) and to bind metal ions, thus making classification to some extent
limited due to the multilayered defence systems that exist (Chapple &
Matthews 2007).
1.9.1. Superoxide Dismutase (SOD)
The general acceptance of free radicals in biological systems was brought
about by the discovery of the enzyme superoxide dismutase (SOD) in 1969
by McCord and Fridovich. This enzyme catalyses the conversion of O2•- to
H2O2 (reaction 10) via a dismutation reaction making use of the fact that
superoxide (O2•-) is both an oxidant and a reductant, keen to take on or
release its extra electron. Superoxide dismutase uses one O2•- radical to
oxidize another (McCord 2000).
Three different types of SOD exist, all of which are able to activate the
dismutation reaction up to 10,000 times faster than the spontaneous
dismutation of O2•- (Battino et al 1999). SOD1 is a Cu2+/Zn2+ enzyme present
within the cytosol, SOD2 is a Mn2+ dependant enzyme located in the
mitochondria and SOD3 is an extracellular enzyme found at low levels at the
extracellular surface (Cuzzocrea et al 2001).
Since all the SOD enzymes accelerate H2O2 production, which yields •OH a
more volatile radical than O2•-, SOD must work in conjunction with other
enzymes to remove H2O2 from human biological systems. This is achieved
by two enzyme families – the catalases and the glutathione peroxidises
(Battino et al 1999).
1.9.2. Catalase
Catalase is found within the peroxisomes and acts intracellularly, because
H2O2 is a weak reductant as well as an oxidant, catalase dismutates it to form

38
water and oxygen (reaction 11) or uses it as an oxidant when working as a
peroxidase (reaction 12) (McCord 2000, Battino et al 1999).
H2O2 + H2O2 → 2H2O + O2 Reaction 11
H2O2 + RH2 →2H2O + R Reaction 12
Although catalase removes H2O2 with great efficacy, the most important H2O2
removing enzyme within mammalian cells is the selenoprotein glutathione
peroxidise (Halliwell 1994a), and together they maintain intracellular levels of
H2O2 at 10-9 – 10-7m (Blake et al 1987).
1.9.3. Glutathione
Glutathione is a ubiquitous tri-peptide, which can be synthesised within the
cell, although it‟s component amino acids are essential and obtained from the
diet (Chapple & Matthews 2007). It represents the most prominent low
molecular weight thiol (up to 5 – 10mM) present in the cell and exists in
oxidized (GSSG) and reduced (GSH) forms (Cnubben et al 2001). GSH
plays a essential role in the glutathione peroxidase (GPx) antioxidant enzyme
system. GPx utilises the reducing power of GSH to remove hydrogen
peroxide, converting two GSH molecules to one GSSG molecule and water
(reaction 13) (Meister & Anderson 1983).
2GSH + H2O2 → GSSG + 2H2O Reaction 13
Whilst GSH acts as the substrate for removal of H2O2 via GPx, it is also
reconstituted from GSSG by glutathione reductase (GR) at the expense of
NADPH, permitting the continuous action of glutathione peroxidase (Cnubben
et al 2001).
GSSG + H+ + NADPH → 2GSH + NADP+ Reaction 14
GSH also plays an important role in maintaining intracellular redox balance,
regulating pathways that are affected by oxidative stress, acting as a
neurotransmitter, aiding in the preservation and restoration of other

39
antioxidant species, such as vitamin C & E and it can effect inflammatory
cytokine production by regulating expression/activation of redox sensitive
transcription factors e.g. nuclear factor-κB (Chapple & Matthews 2007).
The preventative enzyme based antioxidants illustrate the
compartmentalisation that exists between intra- and extracellular antioxidants,
since the mid 1980‟s it was concluded that the action of SOD, catalase or
glutathione peroxidase in the removal of O2•- or H2O2 contributed little to any
antioxidant activity in extracellular fluids (Halliwell & Gutteridge 1986). The
extracellular levels of GSH are indeed low, approximately 1 – 4µM (Svardal et
al 1990), however recent work has detected millimolar levels of GSH in
gingival crevicular fluid (Chapple et al 2002) and high levels contributing to
the total antioxidant status of cervical epithelium (Cope et al 1999), which
may indicate a fundamental defence role for GSH at exposed epithelial
surfaces (Chapple et al 2002). Indeed GCF GSH levels appear severely
compromised in periodontitis relative to health (Chapple et al 2002).
1.9.4. Ascorbic acid (vitamin C)
Ascorbic acid (vitamin C) has a multitude of antioxidant properties. It is a
powerful scavenger of O2•-, HO2
•, •OH, HOCl, and able to scavenge water-
soluble peroxyl radicals (RO2•), as well as scavenge and quench 1O2 in
aqueous solutions (Halliwell & Gutteridge 1990). Ascorbic acid repairs and
therefore prevents damage by radicals arising from the •OH radicals‟ actions
on uric acid. It is also able to prevent Fenton reactions by decreasing heme
breakdown and the subsequent release of Fe2+ (Chapple & Matthews 2007).
Carcinogenic nitrosamines can be reduced to inactive products and protection
afforded against oxidants present in tobacco smoke by ascorbic acid
(Halliwell & Gutteridge 1990). Ascorbate has also been shown to decrease
pro-inflammatory gene expression via effects on NF-κB activation (Griffiths &
Lunec 2001).
Ascorbic acid is able to regenerate α-tocopherol (vitamin E) by reducing the
α-tocopherol radical that forms at membrane surfaces (Chapple 1996). It is
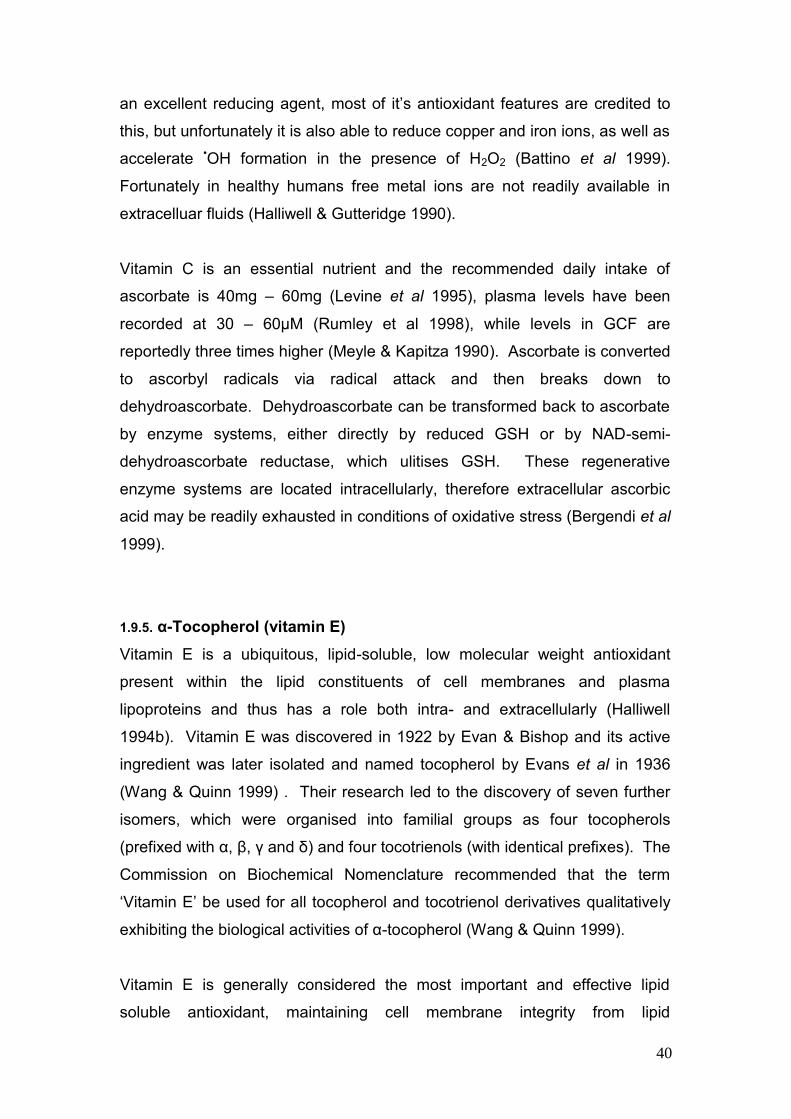
40
an excellent reducing agent, most of it‟s antioxidant features are credited to
this, but unfortunately it is also able to reduce copper and iron ions, as well as
accelerate •OH formation in the presence of H2O2 (Battino et al 1999).
Fortunately in healthy humans free metal ions are not readily available in
extracelluar fluids (Halliwell & Gutteridge 1990).
Vitamin C is an essential nutrient and the recommended daily intake of
ascorbate is 40mg – 60mg (Levine et al 1995), plasma levels have been
recorded at 30 – 60µM (Rumley et al 1998), while levels in GCF are
reportedly three times higher (Meyle & Kapitza 1990). Ascorbate is converted
to ascorbyl radicals via radical attack and then breaks down to
dehydroascorbate. Dehydroascorbate can be transformed back to ascorbate
by enzyme systems, either directly by reduced GSH or by NAD-semi-
dehydroascorbate reductase, which ulitises GSH. These regenerative
enzyme systems are located intracellularly, therefore extracellular ascorbic
acid may be readily exhausted in conditions of oxidative stress (Bergendi et al
1999).
1.9.5. α-Tocopherol (vitamin E)
Vitamin E is a ubiquitous, lipid-soluble, low molecular weight antioxidant
present within the lipid constituents of cell membranes and plasma
lipoproteins and thus has a role both intra- and extracellularly (Halliwell
1994b). Vitamin E was discovered in 1922 by Evan & Bishop and its active
ingredient was later isolated and named tocopherol by Evans et al in 1936
(Wang & Quinn 1999) . Their research led to the discovery of seven further
isomers, which were organised into familial groups as four tocopherols
(prefixed with α, β, γ and δ) and four tocotrienols (with identical prefixes). The
Commission on Biochemical Nomenclature recommended that the term
„Vitamin E‟ be used for all tocopherol and tocotrienol derivatives qualitatively
exhibiting the biological activities of α-tocopherol (Wang & Quinn 1999).
Vitamin E is generally considered the most important and effective lipid
soluble antioxidant, maintaining cell membrane integrity from lipid
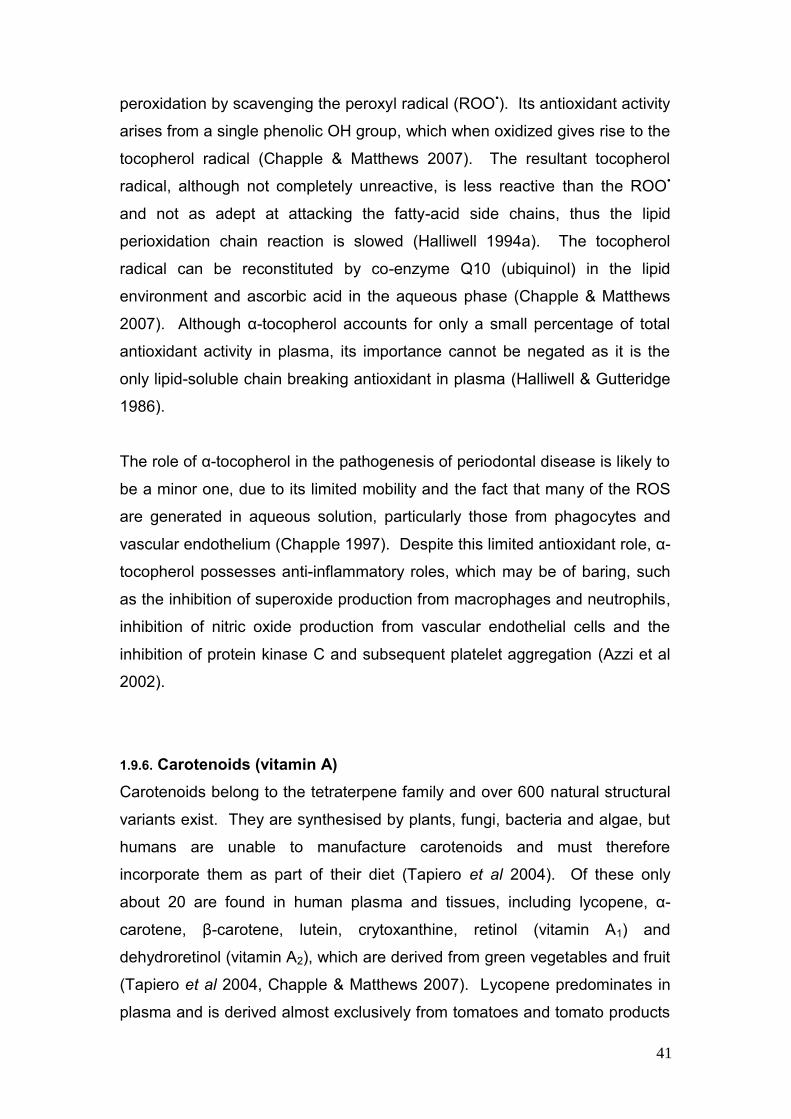
41
peroxidation by scavenging the peroxyl radical (ROO•). Its antioxidant activity
arises from a single phenolic OH group, which when oxidized gives rise to the
tocopherol radical (Chapple & Matthews 2007). The resultant tocopherol
radical, although not completely unreactive, is less reactive than the ROO•
and not as adept at attacking the fatty-acid side chains, thus the lipid
perioxidation chain reaction is slowed (Halliwell 1994a). The tocopherol
radical can be reconstituted by co-enzyme Q10 (ubiquinol) in the lipid
environment and ascorbic acid in the aqueous phase (Chapple & Matthews
2007). Although α-tocopherol accounts for only a small percentage of total
antioxidant activity in plasma, its importance cannot be negated as it is the
only lipid-soluble chain breaking antioxidant in plasma (Halliwell & Gutteridge
1986).
The role of α-tocopherol in the pathogenesis of periodontal disease is likely to
be a minor one, due to its limited mobility and the fact that many of the ROS
are generated in aqueous solution, particularly those from phagocytes and
vascular endothelium (Chapple 1997). Despite this limited antioxidant role, α-
tocopherol possesses anti-inflammatory roles, which may be of baring, such
as the inhibition of superoxide production from macrophages and neutrophils,
inhibition of nitric oxide production from vascular endothelial cells and the
inhibition of protein kinase C and subsequent platelet aggregation (Azzi et al
2002).
1.9.6. Carotenoids (vitamin A)
Carotenoids belong to the tetraterpene family and over 600 natural structural
variants exist. They are synthesised by plants, fungi, bacteria and algae, but
humans are unable to manufacture carotenoids and must therefore
incorporate them as part of their diet (Tapiero et al 2004). Of these only
about 20 are found in human plasma and tissues, including lycopene, α-
carotene, β-carotene, lutein, crytoxanthine, retinol (vitamin A1) and
dehydroretinol (vitamin A2), which are derived from green vegetables and fruit
(Tapiero et al 2004, Chapple & Matthews 2007). Lycopene predominates in
plasma and is derived almost exclusively from tomatoes and tomato products
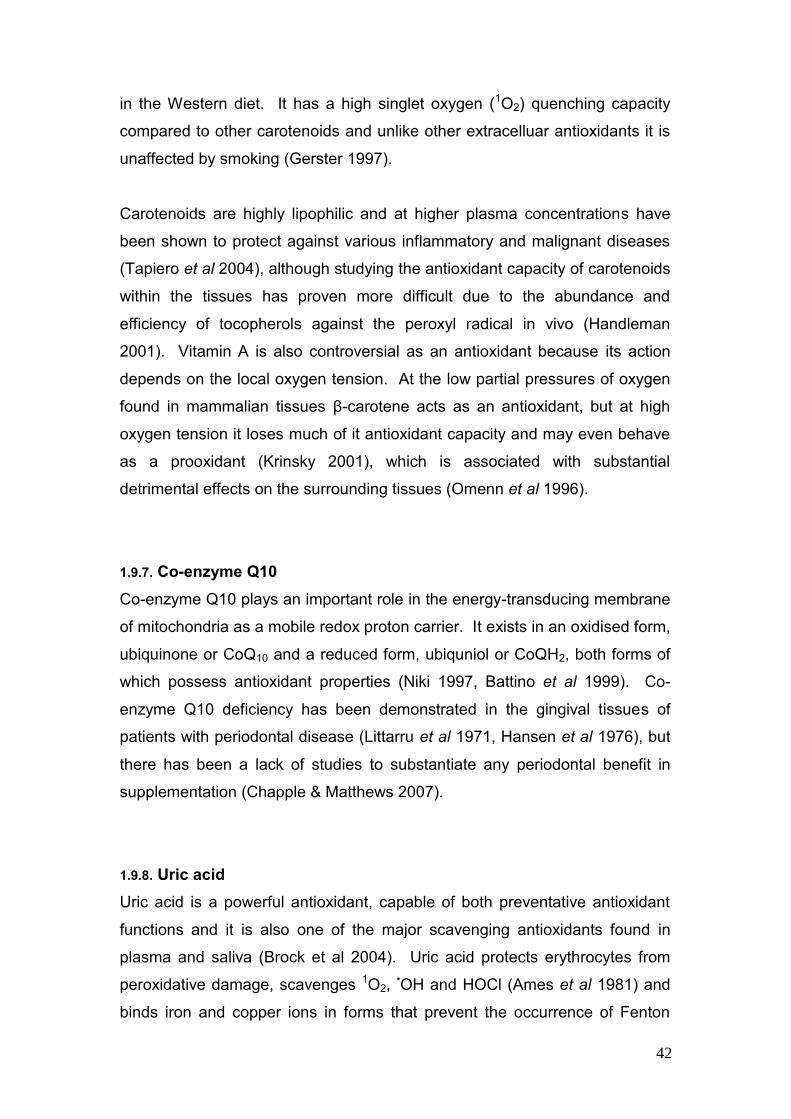
42
in the Western diet. It has a high singlet oxygen (1O2) quenching capacity
compared to other carotenoids and unlike other extracelluar antioxidants it is
unaffected by smoking (Gerster 1997).
Carotenoids are highly lipophilic and at higher plasma concentrations have
been shown to protect against various inflammatory and malignant diseases
(Tapiero et al 2004), although studying the antioxidant capacity of carotenoids
within the tissues has proven more difficult due to the abundance and
efficiency of tocopherols against the peroxyl radical in vivo (Handleman
2001). Vitamin A is also controversial as an antioxidant because its action
depends on the local oxygen tension. At the low partial pressures of oxygen
found in mammalian tissues β-carotene acts as an antioxidant, but at high
oxygen tension it loses much of it antioxidant capacity and may even behave
as a prooxidant (Krinsky 2001), which is associated with substantial
detrimental effects on the surrounding tissues (Omenn et al 1996).
1.9.7. Co-enzyme Q10
Co-enzyme Q10 plays an important role in the energy-transducing membrane
of mitochondria as a mobile redox proton carrier. It exists in an oxidised form,
ubiquinone or CoQ10 and a reduced form, ubiquniol or CoQH2, both forms of
which possess antioxidant properties (Niki 1997, Battino et al 1999). Co-
enzyme Q10 deficiency has been demonstrated in the gingival tissues of
patients with periodontal disease (Littarru et al 1971, Hansen et al 1976), but
there has been a lack of studies to substantiate any periodontal benefit in
supplementation (Chapple & Matthews 2007).
1.9.8. Uric acid
Uric acid is a powerful antioxidant, capable of both preventative antioxidant
functions and it is also one of the major scavenging antioxidants found in
plasma and saliva (Brock et al 2004). Uric acid protects erythrocytes from
peroxidative damage, scavenges 1O2, •OH and HOCl (Ames et al 1981) and
binds iron and copper ions in forms that prevent the occurrence of Fenton
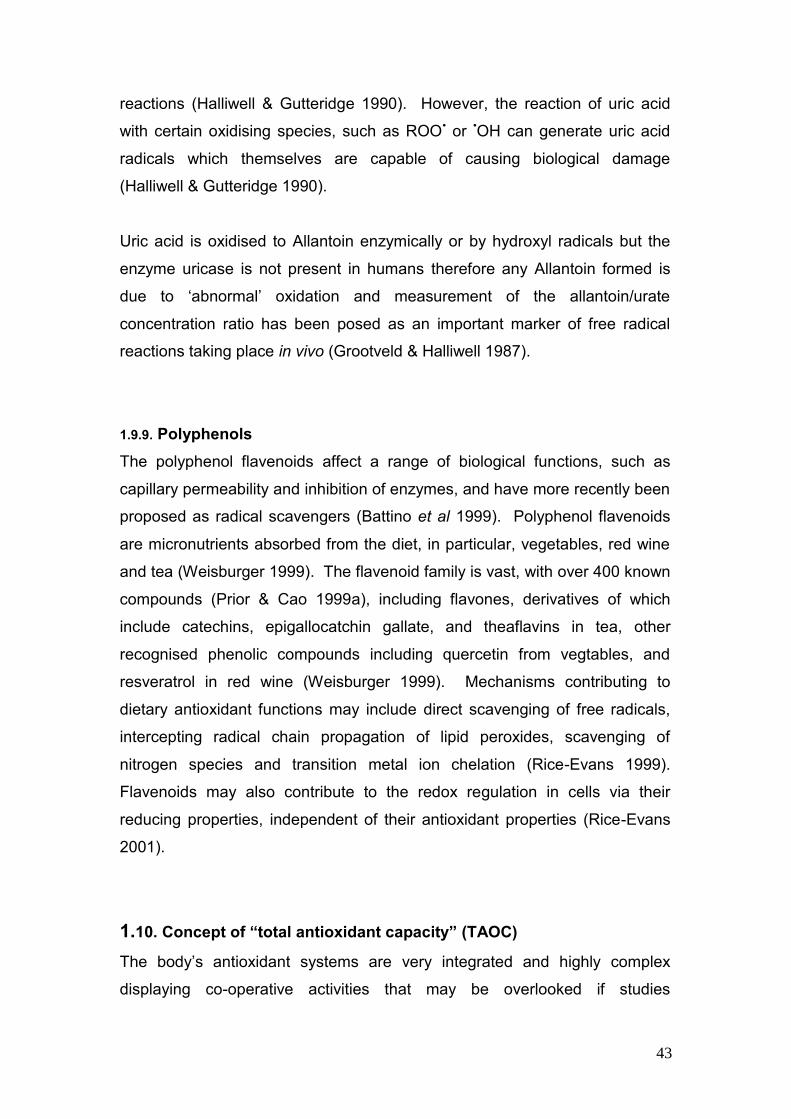
43
reactions (Halliwell & Gutteridge 1990). However, the reaction of uric acid
with certain oxidising species, such as ROO• or •OH can generate uric acid
radicals which themselves are capable of causing biological damage
(Halliwell & Gutteridge 1990).
Uric acid is oxidised to Allantoin enzymically or by hydroxyl radicals but the
enzyme uricase is not present in humans therefore any Allantoin formed is
due to „abnormal‟ oxidation and measurement of the allantoin/urate
concentration ratio has been posed as an important marker of free radical
reactions taking place in vivo (Grootveld & Halliwell 1987).
1.9.9. Polyphenols
The polyphenol flavenoids affect a range of biological functions, such as
capillary permeability and inhibition of enzymes, and have more recently been
proposed as radical scavengers (Battino et al 1999). Polyphenol flavenoids
are micronutrients absorbed from the diet, in particular, vegetables, red wine
and tea (Weisburger 1999). The flavenoid family is vast, with over 400 known
compounds (Prior & Cao 1999a), including flavones, derivatives of which
include catechins, epigallocatchin gallate, and theaflavins in tea, other
recognised phenolic compounds including quercetin from vegtables, and
resveratrol in red wine (Weisburger 1999). Mechanisms contributing to
dietary antioxidant functions may include direct scavenging of free radicals,
intercepting radical chain propagation of lipid peroxides, scavenging of
nitrogen species and transition metal ion chelation (Rice-Evans 1999).
Flavenoids may also contribute to the redox regulation in cells via their
reducing properties, independent of their antioxidant properties (Rice-Evans
2001).
1.10. Concept of “total antioxidant capacity” (TAOC)
The body‟s antioxidant systems are very integrated and highly complex
displaying co-operative activities that may be overlooked if studies

44
concentrate on individual antioxidant systems leading to an inaccurate picture
of the in vivo situation. Antioxidants also work in concert through redox
cycling reactions, regenerating each other from their respective radical
species, an example being the recycling of α-tocopherol by vitamin C
(Chapple 1996). For these reasons research has now focused on measuring
the global antioxidant defence or “total antioxidant capacity” of biological
fluids. These assays provide information on the combined effect of the
individual antioxidants and may account for the influence of antioxidant
substances as yet undiscovered or those that are technically difficult to
analyse (Chapple & Matthews 2007).
1.11. Smoking
Smoking has long been established as a major environmental risk factor for
periodontal disease (Palmer et al 2005). Smokers are exposed to over
40‟000 chemicals from their cigarette smoke and the combustion of tobacco
also creates free radicals, 1 x 10¹⁶ radicals per cigarette or 1 x 10¹⁴ per puff
(Pryor et al 1983). Several studies have demonstrated lower plasma
concentrations of antioxidants in smokers in vivo (Alberg 2002) and a
decrease in serum antioxidant concentration has been negatively associated
with the prevalence of inflammatory periodontitis (Chapple et al 2006).
1.11.1. Smoking as a risk factor for periodontitis
The first association between tobacco smoking and periodontal disease came
from the studies of Pindborg in 1947, which recognised that many of the
individuals affected by acute necrotising ulcerative gingivitis (ANUG) were
smokers (Palmer et al 2005). Since then a great deal of research into the
detrimental effects of tobacco smoking has concluded it has widespread
systemic effects, many of which may provide mechanisms that increases the
individual susceptibility to periodontal disease and affect their response to
treatment, by stimulating destructive/inflammatory responses and impairing
protective/reparative responses (Ryder 2007).

45
Smokers of tobacco can be seen to be exposed to two levels of tobacco
products, „acute and chronic‟ exposure. Chronic low level tobacco products
can be found in serum, saliva, gingival crevicular fluid, (GCF) and within the
cell and extracellular matrix of the periodontal tissues. These low chronic
concentrations will have an effect on the host response but during the act of
smoking, the concentration of tobacco products is increased several hundred
to a thousand times in these tissues and fluids, which may produce different
effects compared to those of long-term chronic levels (Ryder 2007).
The effects of tobacco use on the microflora within the oral cavity have been
studied extensively and data are somewhat contradictory, while many
research groups have found no significant differences in the incidence and
distribution in selected periodontal pathogens (Preber et al 1992, Stoltenberg
et al 1993, Darby et al 2000, Bostrom et al 2001), others have shown
changes in the prevelance of pathogenic bacteria within the biofilm (Haffajee
& Socransky 2001) and discovered significant differences in recovery rates of
these pathogens (Zambon et al 1996). More recent work has reported less of
a reduction on periodontal pathogens in smokers compared to non-smokers
following non-surgical management of periodontal disease, scaling and root
surface debridment (Van der Velden et al 2003, Darby et al 2005). The later
studies implicate smoking in changes to the local environment, promoting
growth of certain pathogenic bacteria which may result in an altered host
response.
Smoking has a long term chronic effect of impairing the vasculature of the
periodontal tissues. Bleeding on probing is reduced in smokers (Bergstrom &
Bostrom 2001) as is gingival redness and levels of GCF (Preber & Bergstrom
1985). The vascularity of the periodontal tissues changes in those individuals
who smoke. Histological comparisons between smokers and non-smokers
have revealed significantly larger numbers of vessels in inflamed tissues of
non-smokers than smokers and that the total number of vessels expressing
ICAM-1 was also reduced (Rezavandi et al 2002), which could affect the
emigration of neutrophils into the tissues. Tobacco smoke exposure
increased general circulating neutrophil numbers (Sørensen et al 2004), yet
46
numbers of neutrophils reaching the gingival sulcus appears reduced in
smokers (Pauletto et al 2000), again demonstrating the impairment of
transmigration from the periodontal microvasculature and the potential for
PMNL accumulation in periodontal tissues.
Neutrophil receptors may also be affected by smoking. Neutrophils express
functional receptors for several components and metabolites of tobacco, such
as nicotine and cotinine (Benhammou et al 2000) and the numbers of these
receptors is increased in smokers and declines post cessation (Lebargy et al
1996). Neutrophils also express receptors for endogenous factors such as IL-
8, ICAM-1 and TNF-α. Smoking has been shown to deregulate systemic
concentrations of soluble ICAM-1, a circulating adhesion molecule with
immunomodulatory potential (Palmer et al 2002) and deregulate the release
of IL-8 and TNF-α from peripheral neutrophils in periodontitis patients
(Fredriksson et al 2002). Smokers with periodontitis also show impairment in
granulocyte function, when challenged with bacterial products they release,
such as serine proteases, elastase and MMPs which degrade connective
tissues (Söder et al 2002).
Smoking has a detrimental effect on healing following both non-surgical and
surgical modalities of periodontal treatment (Palmer et al 2005), which may
be due to the increased levels and/or activity of proteolytic enzymes on the
structural components of the periodontium, the elevation of destructive
inflammatory cytokines, and/or the suppression of regenerative function
(Ryder 2007). The cytokine IL-1β has been found to be at higher levels
following non-surgical debridment in smokers (Goutoudi et al 2004), while
higher levels of MMPs and relatively low levels of the enzyme inhibitors
alpha-1-antitrypson and alpha-2-Macroglobulin were found in smokers
following surgical management (Persson et al 2003). Studies on the effects
of smoking on periodontal fibroblasts are difficult to assess as most use
doses of nicotine or cotinine at much higher levels than would be expected in
plasma, but overall the evidence does suggest smoking may inhibit fibroblast
function, recruitment and adhesion to the root surface (Palmer et al 2005).
47
1.11.2. The effect of smoking on ROS production from neutrophils
The phagocytotic ability of neutrophils has been shown to be hindered by
aqueous-phase smoke extracts, as well as suppression of the oxidative burst
(Zappacosta et al 2001). Whilst a significantly lower level of ROS production
has been shown, some research has also indicated higher chemotaxis
(Sørensen et al 2004). The research on the effects of tobacco products on
neutrophil expression of ROS is rather inconsistent and other researchers
have suggested that tobacco constituents can exacerbate aspects of the
respiratory burst, enhancing the production of ROS, particularly peroxynitirite
ONOO- (Iho et al 2003). Components of tobacco smoke can have a profound
effect on neutrophils increasing their formyl-methionyl-leucyl-phenylalanine
(fMLP) receptors and leaving them „primed‟, resulting in a two-fold increase in
the release of elastase and superoxide in response to fMLP (Keothe et al
2000). An increased priming effect of TNF-α has also been demonstrated in
smokers with periodontitis accompanied by an increased generation of
radicals and up-regulated neutrophil function (Gustafsson et al 2000).
1.11.3. The effect of smoking on antioxidant status
There is compelling evidence to suggest that the antioxidant status of
smokers is reduced, cigarette smoke may result in an increased metabolic
turnover, due to the greater expenditure of antioxidant micronutrients from
increased oxidative stress caused by the tobacco products, or alternatively
smoking could decrease micronutrient absorption (Alberg 2002). Cigarette
smokers have a significantly lower plasma antioxidant status compared to
non-smokers independent of their dietary antioxidant intake (Dietrich et al
2003).
Smokers have been observed to have circulating concentrations of
dehydroascorbate, a marker of vitamin C depletion at much higher levels than
those of non-smokers (Lykkesfedlt et al 1997). Plasma levels of vitamin C
and carotenoids are depressed in smokers (Chow et al 1986), despite a
reduced consumption of vitamin C rich foods generally seen in individuals
who smoke (Zondervan et al 1996). The lowered levels of dietary

48
antioxidants found in their plasma is seen independent of their dietary intake
(Schectman et al 1989). Plasma levels of α-tocopherol are also significantly
reduced in smokers particularly in the individual greater than thirty five years
of age (Lui et al 1998).
Smoking even a single cigarette will significantly reduce salivary glutathione
(GSH) concentrations (Zappacosta et al 1999 & 2002) and similar data exist
for plasma concentrations (Rahman & MacNee 1999). Reduction in GSH
levels in the local tissue in periodontitis patients who smoke has been
reported, and a dose dependant reduction in GSH within the periodontal
ligament has been described as a result of smoking (Chang et al 2003). GSH
has been shown to protect against the cytotoxic activities of nicotine on
periodontal ligament fibroblasts (Chang et al 2002).
1.12. Measuring ROS and antioxidant status in biological samples
There are currently no „gold standard‟ methods for measuring ROS-mediated
damage in human tissues or the antioxidant capacity of the individual
(Chapple & Matthews 2007). Most free radicals and other reactive species
persist for only a very short time in vivo, having an extremely short half life,
10-6–10-9s and therefore cannot be measured directly (Chapple & Matthews
2007). There are two approaches to detecting ROS (Halliwell & Whiteman
2004): -
attempting to „trap’ the species and measure the levels of trapped
molecules
measuring the levels of oxidative damage incurred by ROS
The spin traps/probes currently available cannot be used on humans because
of unknown toxicity at the high levels required in vivo. Therefore they are
used on body fluids or tissue samples. These ex-vivo spin traps include
ascorbic acid, urate and aromatic traps, such as salicylates (Halliwell &
Whiteman 2004). The majority of clinical research has examined the levels of
oxidative damage caused by ROS by measuring the biomarkers of lipid

49
peroxidation, DNA or protein damage, rather than utilising spin traps. All
have been extensively reviewed by Halliwell & Whiteman in 2004 and all have
confounders leading to the need for careful interpretation of results.
The approach to measuring endogenous antioxidant defences in bodily fluids
is either to assay a single compound in isolation, in groups or to measure the
total antioxidant capacity (TAOC) (Woodford & Whitehead 1998). Antioxidant
species predominate differentially in compartments of the body. In plasma a
variety of antioxidant assays have been developed either focusing on the
aqueous compartment (e.g. ascorbic acid, uric acid, proteins) or in isolated
fractions of plasma, such as low-density lipoproteins (e.g. carotenoids, α-
tocopherol) (Yeum et al 2004). However there are co-operative interactions
between the two compartments and antioxidants do not work in isolation;
therefore the sum of individual antioxidant activities will not represent the
global capacity against ROS. Hence the development and use of assays
measuring total antioxidant capacity are preferable to those measuring
individual species, though careful interpretation is required as not all measure
both the aqueous and lipophilic phase antioxidants and may differ in their
sensitivity towards different species within the compartment (Chapple &
Matthews 2007).
1.12.1. Total antioxidant capacity methodology
The published methods for estimating the total antioxidant capacity of bodily
fluids all measure the inhibition of an artificially generated oxidative process.
A free radical is generated in the solution containing a target for oxidation and
the antioxidant within the sample quenches the target response by interacting
with the radical species. The assays differ in their choice of free radical
generator, target of oxidation and means of measuring the oxidized product
(Woodford & Whitehead 1998).
In some methodologies it may be argued that reductants are being measured
rather than antioxidants; clarification of these terms is therefore required. A
reductant or reducing agent is a substance that donates electrons, causing a

50
reactant to be reduced. An oxidant or oxidizing agent accepts electrons,
causing a reactant to be oxidized. Reductants and oxidants are chemical
terms, while the terms antioxidant and pro-oxidant have meaning in the
context of biological systems and not all reductants are antioxidants (Prior &
Cao 1999b). An antioxidant is defined as “a substance which when present
at low concentrations, compared to those of an oxidasable substrate, will
significantly delay or inhibit oxidation of that substrate” (Halliwell & Gutteridge
1989). The term „pro-oxidant‟ is a synonym for reactive species which are
toxic substances able to cause oxidative damage to lipids, proteins and DNA,
thus, chemically, a pro-oxidant is an oxidant of pathological importance. An
antioxidant antagonises the pro-oxidant, resulting in products that have no or
low toxicity (Prior & Cao 1999).
1.12.1.2. Assays for measuring water-soluble TAOC
There are two main approaches to measuring the total antioxidant capacity of
hydrophilic compartment of plasma. The first involves using oxidants that act
as pro-oxidants or radical inducing species, such as 2,2‟-azobis (2,4-
amidinopropane) dihydrochloride (AAPH). AAPH spontaneously decomposes
at 37°C at a known rate constant, giving rise to a carbon-centred radical that
reacts with oxygen to produce peroxyl radicals (Yeum et al 2004). It can be
monitored by hydrophilic substrates such as: -
DCFH (2‟,7‟-dichlorodihydrofluorescein), which provides a fluorescent
signal used in the total radical trapping antioxidant parameter (TRAP)
assay or with the oxygen radical absorbance capacity (ORAC) assay
(Prior & Cao 1999).
R-Pe (dichlorofluorescein-diacetate phycoerythrin), which is a fluorescent
protein also used with the TRAP assay (Prior & Cao 1999).
Crocin, which interacts with the peroxyl radical leading to a bleaching
reaction that is measured as an absorbance change (Tubaro et al 1998)

51
The oxidation of these hydrophilic substrates is inhibited by the antioxidant
present in the plasma during an induction period and the antioxidant capacity
measured by the delay or profile (e.g. area under the curve) of the reaction.
The longer the delay in the substrates activity and signal generation, the
greater the antioxidant capacity (Chapple & Matthews 2007).
The second approach to measuring TAOC in the aqueous phase of plasma is
to use systems that generate a free radical chain reaction using an oxidant
such as hydrogen peroxide rather than a pro-oxidant. An oxidisable substrate
is used (e.g. luminol) and the ability of the antioxidants within the plasma to
scavenge the radicals produced is measured by assessing the delay in signal
or time for which the signal is absent. This measurement is then calibrated
against a known/standard antioxidant species, most commonly the water
soluble vitamin E analogue, 6-hydroxy-2,5,7,8-tetramethylchroman-2-
carboxylix acid (Trolox) (Chapple & Matthews 2007). Assays which use this
system include: -
Ferric reducing ability of plasma (FRAP) assay, which measures the
reduction of ferric ion (Fe3+) to the ferrous ion (Fe2+) at low pH, which
causes a coloured complex, ferrous-tripyridyltriazine to be formed (Benzie
& Strain 1996).
Trolox equivalent antioxidant capacity (TEAC) assay, which measures the
ability of plasma to quench the radical cation of ABTS (2,2‟-azinobis (3-
ethylbenzothiazoline-6-sulfonate) ) (Miller et al 1993).
Enhanced chemiluminescence (ECL) assay, which measures the ability of
the antioxidants in the fluid sample to inhibit the enhanced light signal
produced by the oxidation of the luminescent substrate luminal by
hydrogen peroxide, using horseradish peroxidase as the catalyst.
(Whitehead et al 1992, Chapple et al 1997a) A point in the light recovery
curve is used to assess the total antioxidant capacity, of the sample
added, as the return of light signals the exhaustion of the antioxidants
within the sample added, an early point in the curve would signal the most

52
efficient antioxidant but the end point would include less efficient
antioxidants (Chapple & Matthews 2007).
1.12.1.3. Assays for measuring lipid-soluble TAOC
The general approach to measuring the antioxidant capacity in the lipid
compartment of plasma is to assess the oxidizability of isolated low-density
lipoprotein (LDL) using a pro-oxidant radical inducer e.g. AMVN (2,2‟-azobis
(2,4-dimethylvaleronitrile)) to produce a lipid-soluble peroxyl radical. The lipid
peroxidation is then measured by assessing the production of conjugated
dienes (Nikki 1990).
Figure 1.8. Schematic diagram of the action of the antioxidant when incorporated into the
liposomes or when added exogenously.
Our laboratory has produced a novel „in house‟ method to measure the
scavenging capacity of selected compounds in a lipid peroxidation prevention
assay. The peroxyl radical generator AAPH is used to initiate a lipid
peroxidation cascade and the inclusion of potential antioxidants in the assay
AAPH
OH-
2H+ +
3I-
LOH + H2O + I3
AOX Liposome
AAPH
OH-
2H+ +
3I-
LOH + H2O + I3
AOX
AOX
AOX
Lipophilic antioxidant
Hydrophilic antioxidant
Antioxidant added endogenously
Antioxidant incorporated into the liposome
HO OL OH LO

53
devopled by el-Saadani et al (1989), based on lipoprotein (LDL) oxidation.
The modification alters the lipid source from LDL to proprietary radical
formation. The antioxidant capacity is measured against lipid hydroperoxyl
radical formation. By using liposome either with or without antioxidants
incorporated into their structure, both the hydrophilic and lipophilic nature of
the test compound to be assessed (figure 1.8.).
1.13. Gingival crevicular fluid (GCF)
Gingival crevicular fluid (GCF) is a plasma derived fluid which bathes the
epithelial cells of the gingival crevice, continuously flowing at very slow rates
(0.24-1.56µl/min) at non-inflamed sites (Chapple et al 2002a). GCF is a
serum transudate in health and is formed by serum moving passively from the
gingival capillaries, through the connective tissue of the gingiva and into the
gingival crevice. During periodontal disease the flow rate and volume are
seen to significantly increase, its composition changes to reflect the state of
disease within the periodontal tissues becoming more like an inflammatory
exudate and containing all the constituents of the local inflammatory response
(Chapple et al 2002b). These constituents broadly fall into three overlapping
categories; enzymes and ROS released by inflammatory or constitutive
connective tissue cells, products of cellular or tissue degradation and
inflammatory cytokines, mediators and other products secreted by activated
leucocytes (Offenbacher et al 1993).
Few studies have examined the TAOC of GCF as a marker of local oxidative
stress due to the difficulty in using such small volumes available for assay
compared to saliva (Chapple 2007). Brock et al demonstrated the TAOC of
GCF to be both qualitatively and quantitatively distinct from that of saliva,
serum and plasma (Brock et al 2004) with GSH predominating in GCF
(Chapple et al 2002a) and uric acid predominating in saliva (Moore et al
1994) and serum (Maxwell et al 2006).
54
1.14. Immediate background and aim of the study
Chronic periodontitis persists as major cause of tooth loss in the developed
world (Papapanou 1999), and arises due to the complex interactions between
the pathogenic bacteria within the subgingival biofilm and the host‟s
inflammatory-immune response. One of the key elements in the host defence
response is the presence of local neutrophil activity. Although the role of
PMNLs is primarily protective, the majority of host tissue damage incurred
during periodontitis results from an excessive or prolonged release of
neutrophil enzymes and ROS, (Gustafsson et al 1997), rather than from the
pathogenic bacterial products themselves.
The body protects itself from the potentially damaging effects of these ROS
via its endogenous antioxidant defence mechanisms, which are able to
scavenge or prevent the formation of these radical species. The oxidant-
antioxidant balance may be tipped in favour of tissue destruction as a result of
excessive ROS production and/or a diminished antioxidant defence capacity.
Our current knowledge on oxidative damage in periodontal disease outweighs
that of the antioxidant defences. Investigation into the total antioxidant
capacity would provide a clearer picture of the extent of pro-oxidant
contribution to disease pathogenesis and about deficiencies in these systems
which may place the individual at greater risk (Chapple 1997). Work by Brock
et al into antioxidant defence in patients with periodontal disease has
demonstrated both a reduced peripheral (plasma) and local (GCF) total
antioxidant capacity (Brock et al 2004). Whether the compromised
antioxidant defence systems predispose to chronic periodontitis or result from
the inflammatory process has been investigated in non-smoking individuals
only by the same group (Chapple et al 2007) but despite the pro-oxidant
effects of smoke constituents, the impact of smoking upon the TAOC of
periodontitis patients has not yet been explored. The present research was
therefore undertaken to investigate: -
The local (GCF) and peripheral (plasma) total antioxidant capacity in
smokers with chronic periodontitis both before (baseline) and after (post-
55
treatment) conventional non-surgical therapy for the management of their
periodontitis.
The clinical and blood-borne markers of inflammation and plaque levels of
smoking subjects at both baseline and post-therapy
Antioxidant data will be analysed both at the subject level and compared with
previous reported non-smokers with and without periodontitis, and also at the
site level within the periodontal patients who smoke (deep verses shallow).
1.14.1. Objectives:
The objective of this research is:
To explore the impact of smoking upon TAOC in periodontitis patients
To assess healing response clinically in smokers with periodontitis
following conventional non-surgical therapy and to equate this with
changes in the local and peripheral antioxidant defence status
The author acted as the therapist for all the patients, both the smokers
reported within this thesis and the non-smokers, that formed the basis of
previous publications (Brock et al 2004, Chapple et al 2007, Wright et al
2008).

56
MATERIALS & METHODS

57
Materials
2.1. Standard solutions and equipment for antioxidant assay
2.1.1. Phosphate buffered saline containing bovine serum albumin (PBS-
BSA) - Running Buffer
Phosphate buffered saline was prepared by dissolving 7.5g NaCl, 100mg
KH2PO4 and 750mg K2HPO4 in 900ml of water and the pH adjusted to 7.6 by
drop wise addition of 0.5M sodium hydroxide. Once prepared 50mg of bovine
serum albumin (BSA; Cohn fraction V, minimum 96% purity) was added in
layers until it dissolved and the volume was made up to 1litre with deionised
water. The PBS-BSA was stored at 4°C for a maximum of four weeks.
2.1.2. Synthesis and preparation of signal reagent
In research carried out using the Enhanced Chemiluminescence (ECL)
antioxidant assay within our laboratory pre-2000, a commercial signal reagent
called Amerlite™ was used (Johnson and Johnson Clinical Diagnostic Ltd;
Amersham, UK). This consisted of a signal reagent buffer (pH 8.5, 30mls)
and tablets A (containing luminol and para-iodophenol) and B (containing
sodium perborate; which when dissolved in an aqueous solution yields
hydrogen peroxide). The manufacture of the Amerlite reagent ceased in
1999, since which time we have synthesised our own “in-house” signal
reagent according to the original patented formulation.
2.1.2.1. Signal reagent powder constituents
Signal reagents A and B (equivalent to tablets A and B in the Amerlite™
system) were prepared using the below formulations, the chemicals were
mixed and ground to a fine powder and 1g aliquots were then transferred to
foil-wrapped, sterile 1.5ml Eppendorf tubes and stored in a vacuum dessicator
at 4°C.
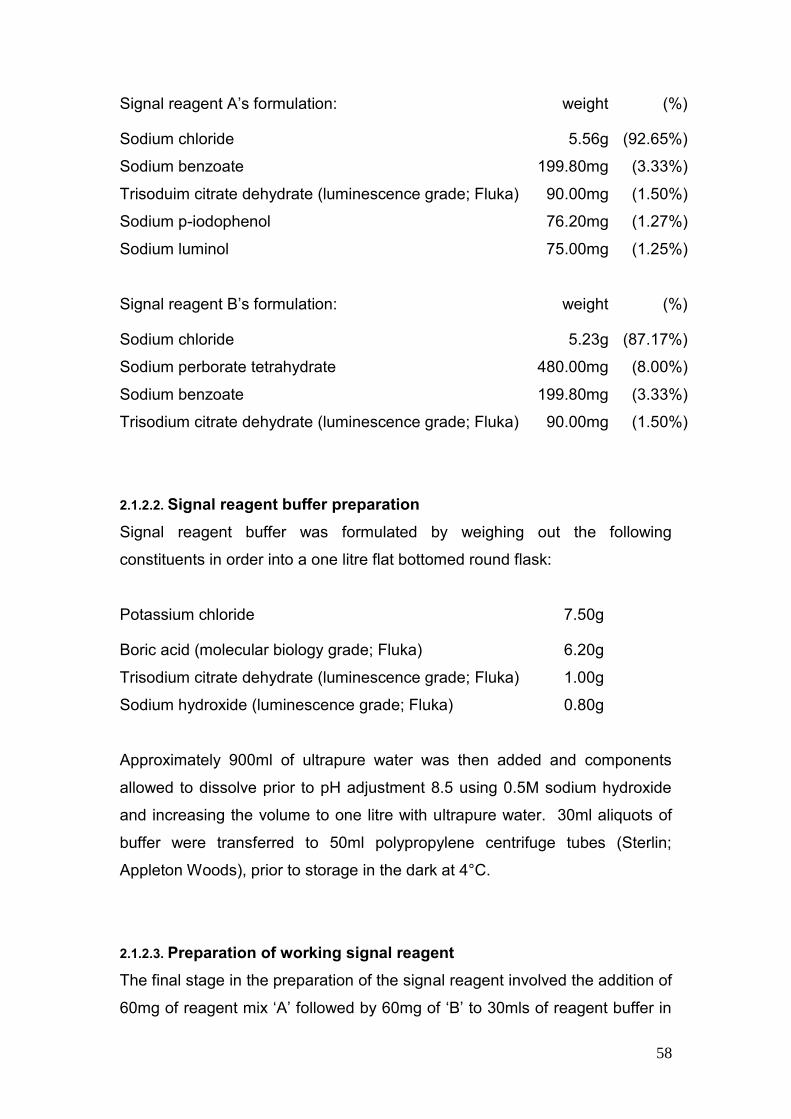
58
Signal reagent A‟s formulation: weight (%)
Sodium chloride 5.56g (92.65%)
Sodium benzoate 199.80mg (3.33%)
Trisoduim citrate dehydrate (luminescence grade; Fluka) 90.00mg (1.50%)
Sodium p-iodophenol 76.20mg (1.27%)
Sodium luminol 75.00mg (1.25%)
Signal reagent B‟s formulation: weight (%)
Sodium chloride 5.23g (87.17%)
Sodium perborate tetrahydrate 480.00mg (8.00%)
Sodium benzoate 199.80mg (3.33%)
Trisodium citrate dehydrate (luminescence grade; Fluka) 90.00mg (1.50%)
2.1.2.2. Signal reagent buffer preparation
Signal reagent buffer was formulated by weighing out the following
constituents in order into a one litre flat bottomed round flask:
Potassium chloride 7.50g
Boric acid (molecular biology grade; Fluka) 6.20g
Trisodium citrate dehydrate (luminescence grade; Fluka) 1.00g
Sodium hydroxide (luminescence grade; Fluka) 0.80g
Approximately 900ml of ultrapure water was then added and components
allowed to dissolve prior to pH adjustment 8.5 using 0.5M sodium hydroxide
and increasing the volume to one litre with ultrapure water. 30ml aliquots of
buffer were transferred to 50ml polypropylene centrifuge tubes (Sterlin;
Appleton Woods), prior to storage in the dark at 4°C.
2.1.2.3. Preparation of working signal reagent
The final stage in the preparation of the signal reagent involved the addition of
60mg of reagent mix „A‟ followed by 60mg of „B‟ to 30mls of reagent buffer in

59
the 50ml centrifuge tubes. The top was replaced and sealed with Parafilm
(Appleton Wood). The tube was then covered with aluminium foil and placed
on a roller mixer for 20mins at 4°C, prior to storage in the dark at the same
temperature. Once the final signal reagent was prepared it was stored for a
maximum of two weeks.
2.1.3. Horseradish peroxidase stock solution 50IU/ml
A 500IU bottle of type XII horseradish peroxidase (hydrogen peroxide
oxidoreductantase, EC 1.11.1.7 - HRP) was dissolved in 10ml PBS-BSA
(containing 5mg/ml BSA). 100µl aliquots were placed in foil-covered 500µl
Eppendorf tubes (Appleton Woods) and stored at -20°C until required. Prior
to assay the HRP solution was thawed at room temperature and a working
HRP solution for that days testing made from this stock and kept in a foil
wrapped Bijou container while the remainder was stored at 4°C for a
maximum of two days.
Throughout the course of the study it became necessary to revert to a
conjugated HRP (anti-RB IgGs with a binding site AP 311), similar to that
used by Whitehead et al 1992, in order to improve HRP stability. The HRP-
conjugate was therefore used in the later assays. However, given that
calibrations curves were performed daily, this did not affect derived
antioxidant measures.
2.1.4. Standard ECL assay mix
All chemiluminescence reactions were carried out in plastic cuvettes (12 x
75mm, Starstedt, Leicester, UK). In preparation for the assay 1ml of PBS-
BSA running buffer (2.1.1.) was added to the cuvette and allowed to equilibrate
in a tube cooler (Grant Boekel PCB2; Wolf Laboratories Ltd., Pocklington, UK)
set at 19°C + 0.5°C for a minimum of 30mins. Immediately prior to assay,
100µl signal reagent and 20µl working HRP solution were added to the PBS-
BSA running buffer (figure 2.1.).

60
Fig. 2.1. Standard Enhanced Chemiluminescence assay mix
2.1.5. Trolox standards (80µM) for assay calibration
The external standard/calibrant for the assay was a water soluble tocopherol
analogue „Trolox‟ (6-hyroxy-2,5,7,8-tetramethylchroman-2-carboxylic acid).
An 80µM Trolox stock solution was prepared by dissolving 20.02mg Trolox
(Aldrich Chemical Co.) in one litre of deionised water (12-18h with stirring at
4°C). The solution was then aliquotted into 1.5ml Eppendorf tubes and stored
for maximum of 18months at -80°C. As required a stock aliquot was thawed
at room temperature and the required dilution made up by adding PBS-BSA;
all standards were prepared from a single stock for use on that day and kept
at 4°C between calibrations.
2.1.6. BioOrbit 1250 Luminometer
The enhanced Chemiluminescence (ECL) assays were performed using a
luminometer (BioOrbit 1250 Luminonmeter; Labtech International, Sussex,
UK). The luminometer is a single-sampling unit, comprising of a measuring
head containing a photomultiplier tube and an electronic unit that amplifies the
signal, which is expressed in mV. The luminometer is interfaced with an IBM-
compatible computer and the output controlled using the 1250 Luminometer
Program® software package. The software permits simultaneous recording
and display of data; up to 5000 data points over the desired time period of up
to one hour.

61
2.2. Classification and categorisation of patients
2.2.1. Indices of health & disease
2.2.1.1. Periodontal probing depth (PPD)
Full mouth periodontal pocket probing depths (PPD) were assessed by two
examiners; N Ling-Mountford (NLM) and G Brock (GB). NLM examined the
smokers with periodontitis (2.2.2.1.) and both control groups B (2.2.2.4.1. and
2.2.2.5.1.) using a Hu-Friedy UNC-PCP15 probe (Claudius Ash & Sons, Potters
Bar Herts., UK) adapted to fit into a Brodontic handle to ensure constant
probing force of no greater than 20g (0.2N). While GB examined both control
groups A (2.2.2.4. and 2.2.2.5.) using a Hu-Friedy UNC-PCP15 probe without
any adaption. Probing depths, defined as the measurement from the base of
the pocket/crevice to the gingival margin, were recorded at six sites per tooth
(mesio-buccal, mid-buccal, disto-buccal, mesio-palatal, mid-palatal and disto-
palatal) in millimetres (mm). In order to reduce inter-examiner variability (as
there was no formal examiner calibration) all PPD measurements were
recorded in duplicate and where a difference of ≥1mm existed between
readings a third measurement was taken. The mean of the closest two PPD
measures per site were taken as the PPD of for that site. Each examiner
assessed the same patients throughout the study, with no mixing of
examiners within patient or control groups.
2.2.1.2. Recession (REC)
Full mouth recession charts (REC) were carried out by NLM using the
adapted UNC-PCP15 probe in the smokers with periodontitis group (2.2.2.1.)
and both control groups B (2.2.2.4.1. and 2.2.2.5.1.). Recession was measured
at the same six points per tooth simultaneously with the PPD measurement.
Recession was defined as the measurement/distance (in mm) from the
gingival margin to the cemento-enamel junction (CEJ). All REC
measurements were recorded in duplicate and where a difference of ≥1mm
existed between readings a third measurement was taken. The mean of the

62
duplicated measures was used as the recession score for each site. Where
the gingival margin lay coronally to the CEJ the recession distance was
recorded as a negative value for attachment loss calculations.
2.2.1.3. Clinical attachment levels (CAL)
Full mouth clinical attachment levels were calculated by the addition of the
PPD and the REC duplicate measurements in the smokers with periodontitis
(2.2.2.1.) and both controls groups B (2.2.2.4.1. and 2.2.2.5.1.). The mean from
these duplicate measures were recorded for each site (where a negative
recession value indicated a gingival margin situated coronal to the CEJ).
2.2.1.4. Bleeding scores
Bleeding was assessed for the whole mouth by NLM in the smokers with
periodontitis (2.2.2.1.) and both control groups B (2.2.2.4.1. and 2.2.2.5.1.), while
GB assessed bleeding in both control groups A (2.2.2.4. and 2.2.2.5.). Each
tooth was probed using a WHO 621 probe (Hu-Friedy – Claudius Ash) with no
greater than 20g (0.2N) of pressure and scored dichotomously for the
presence or absence of bleeding at four sites (mesial, distal, buccal and
palatal). All teeth were probed and assessed in this manner and the total
number of bleeding points was totalled and divided by four times the number
of units probed, this figure was then multiplied by one hundred to give a whole
mouth percentage (% BOP).
2.2.1.5. Plaque scores
Plaque levels were assessed by NLM in the smokers with periodontitis
(2.2.2.1.) and both control groups B (2.2.2.4.1. and 2.2.2.5.1.). Plaque was
recorded dichotomously full mouth at four sites per tooth (mesial, distal,
buccal and palatal). All teeth were disclosed using a commercially available
two tone disclosing liquid agent, Plaqsearch, (Oraldent - Kimbolton,
Cambridgeshire UK) and assessed for the presence or absence of plaque.
The total number of sites bearing plaque was totalled and divided by four

63
times the number of units viewed, this figure was then multiplied by one
hundred to give a whole mouth percentage.
2.2.1.6. Radiographs
As part of the patient‟s initial consultation process, prior to entry into the study
and clinical sampling, the radiographers at Birmingham Dental Hospital
performed radiographs for each subject with chronic periodontitis. For the
majority of subjects full mouth periapical radiographs were taken using a
standard paralleling technique with film holders. In some cases however,
orthopantanograms were recorded instead for logistical reasons.
Radiographs were used to confirm diagnostic criteria and not as outcome
measures.
2.2.2. Volunteer groups
Volunteers fell into three patient groups; a single test group of patients who
smoked and had periodontitis, two positive control groups of non-smokers
with periodontitis and two negative control groups of periodontally healthy
patients. All three patient groups were used for the longitudinal clinical study
to determine local (GCF) and peripheral (plasma) total antioxidant capacity
(TAOC). Volunteers were allowed to withdraw from the study at any point
without explanation or compromise to their care. Ethical approval was
provided for the different study groups under separate applications (smokers
with chronic periodontitis (2.2.2.1.) LREC5521, both control groups A (2.2.2.4.
and 2.2.2.5.) LREC0405 and both control groups B (2.2.2.4.1. and 2.2.2.5.1.)
LREC5643).
2.2.2.1. Smokers with chronic periodontitis
Volunteers (n= 21), who currently smoked ≥10 cigarettes per day and had
been diagnosed with chronic periodontitis, were recruited from patients
referred to the Unit of Periodontology, Birmingham Dental Hospital for
diagnosis and treatment. The patients had to be current smokers at

64
recruitment and during the active treatment phase plus have a smoking
history of a minimum of 10yrs.
2.2.2.2. Inclusion criteria
A diagnosis of chronic periodontitis had to have been established by the
referring clinician within the Unit of Periodontology of the Birmingham Dental
Hospital. The patients had to have:
At least 20 standing teeth
Probing depths of ≥5mm at >30% of sites
Radiographic evidence of generalised bone loss of ≥30% at 30% of sites
2.2.2.3. Exclusion criteria
Recruitment and participation into the study were not permitted if the patients:
Took vitamin or mineral supplements
Were pregnant
Had an incompatible medical history, such as a condition requiring
antibiotic prophylaxis for invasive procedures
Took medication which may affect outcomes of periodontal therapy
Took medication affecting neutrophil function
Took non-steroidal anti-inflammatory drugs
2.2.2.4. Non-smokers with chronic periodontitis – Group A
Volunteers (n=17) were used for comparisons employing the patient as a unit
of analysis for TAOC. (in this group sampling sites were selected on the basis
of index sites irrespective of PPD) Summary data from this group have been
previously published (Brock et al 2004, Chapple et al 2007). These
volunteers were patients within the Unit of Periodontology of the Birmingham
Dental Hospital, and were age and gender matched to the smokers. Inclusion
and exclusion criteria were the same as for smokers (2.2.2.2. and 2.2.2.3.) with
the exception of their smoking status; they must not have been a current

65
smoker or a reformed smoker and must have been smoking habit free for a
minimum period of 10 yrs.
2.2.2.4.1. Non-smokers with chronic periodontitis – Group B
A second non-smokers group of periodontitis volunteers (n=18) were also
recruited from patients referred to the Unit of Periodontology, Birmingham
Dental Hospital for diagnosis and treatment (in this group sampling sites were
selected on the basis of deep sites). These patients were age and gender
matched to the smokers. Their recruitment followed the same inclusion and
exclusion criteria as group A (2.2.2.4.).
2.2.2.5. Periodontally healthy subjects – Group A
Volunteers (n=17) were recruited from staff of the School of Dentistry and
South Birmingham Primary Care Trust who worked at the Birmingham Dental
Hospital. They were employed for comparison with the periodontitis non-
smokers (2.2.2.4., index sites). These subjects were age and sex matched to
the smoking subjects and to the non-smoking periodontitis group A. In order
to be included in the study as a healthy control subject, the volunteer was
required to have a minimum of 20 teeth, with no probing depths of >3mm or
evidence of attachment loss due to periodontal disease. Subjects were non-
smokers or ex-smokers of ≥10years. Summary data from this group have
been previously published (Brock et al 2004, Chapple et al 2007).
2.2.2.5.1. Periodontally healthy subjects – Group B
A second healthy control group of volunteers (n=18) were also recruited from
the staff of the School of Dentistry and South Birmingham Primary Care Trust
who worked at the Birmingham Dental Hospital and followed the same
inclusion and exclusion criteria as the other healthy control group (2.2.2.5.).
The purpose of this control group was to enable deep and shallow sites to be
sampled for comparison with the deep and shallow sites in the non-smokers
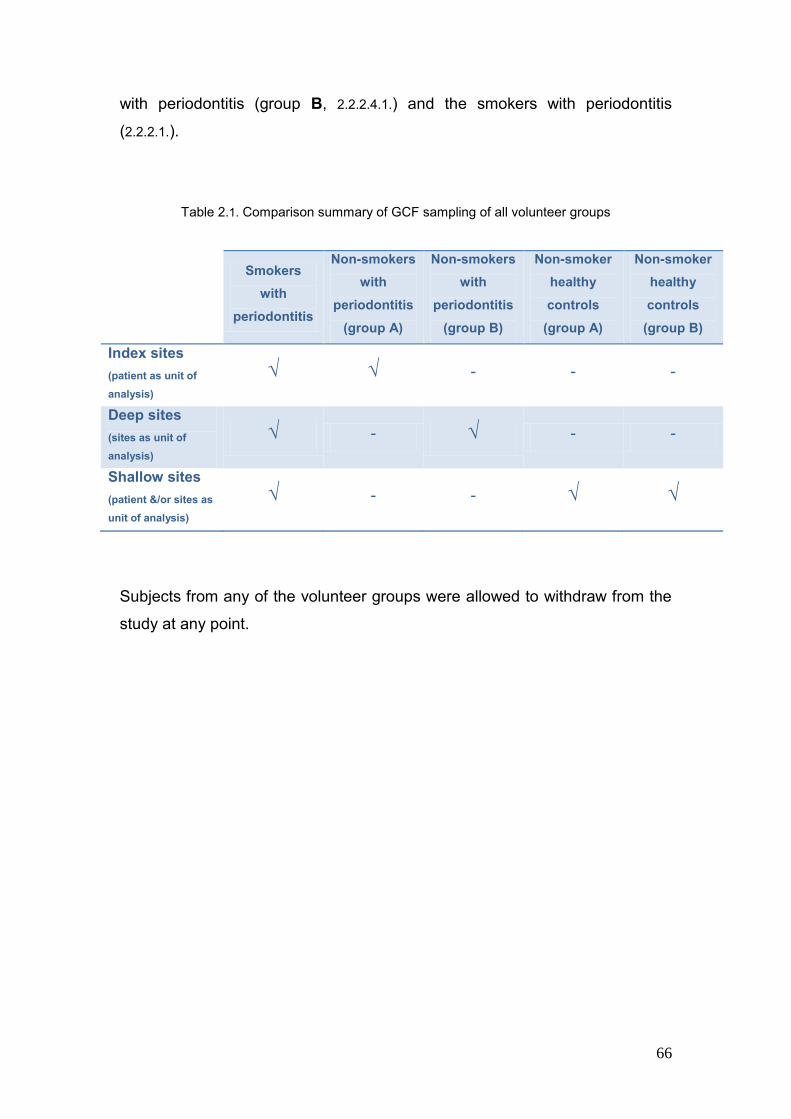
66
with periodontitis (group B, 2.2.2.4.1.) and the smokers with periodontitis
(2.2.2.1.).
Table 2.1. Comparison summary of GCF sampling of all volunteer groups
Smokers
with
periodontitis
Non-smokers
with
periodontitis
(group A)
Non-smokers
with
periodontitis
(group B)
Non-smoker
healthy
controls
(group A)
Non-smoker
healthy
controls
(group B)
Index sites
(patient as unit of
analysis)
√ √ - - -
Deep sites
(sites as unit of
analysis)
√ - √ - -
Shallow sites
(patient &/or sites as
unit of analysis)
√ - - √ √
Subjects from any of the volunteer groups were allowed to withdraw from the
study at any point.
67
Methods
2.3. Treatment regime
The indices and sampling for the periodontitis groups were recorded at the
recruitment visits (baseline), to assess levels of disease, inflammation and
oral hygiene levels. These were repeated three months after non-surgical
periodontal management (review). The non-surgical periodontal therapy was
performed over five treatment sessions; gross scaling and introduction of oral
hygiene measures was followed by quadrant fine scaling and root surface
debridment with both hand (Gracy curettes; LM Dental, J&S Davies, Potters
Bar, Herts. UK) and ultrasonic (Dentsply UK Ltd, Addlestone, Weybridge,
Surry, UK) instruments and under local analgesia with reinforcement of oral
hygiene measure as required. The healthy control patients were sampled at
baseline only and received a subsequent scaling and prophylaxis as required.
2.3.1. Smoking cessation
All smokers with periodontitis (2.2.2.1.) received a brief smoking intervention
based on the “Four A‟s Approach” to smoking cessation. This included
assessment of their smoking history, advice on the impact of smoking on their
periodontitis, assessing their current interest in quitting smoking and review of
any past attempts. Those smokers who showed interest in quitting their
tobacco habit were offered support from the lead clinician (NLM), including
motivational and behavioural advice plus information on the use of
pharmacological aids (Nicotine replacement therapies, Zyban or Champix) in
their quit attempt to reduce withdrawal symptoms. If the volunteer required a
more intensive support system than could be offered during treatment, referral
to the NHS Stop Smoking Services was offered. Smoking status and interest
in cessation was assessed prior to treatment and following treatment at the
three month review appointment if cessation has not occurred prior to this
time.
68
2.4. Clinical sample collection protocols
2.4.1. Plasma
Volunteers were asked not to eat or drink anything with the exception of
bottled water, plus to refrain from using any form of oral hygiene product from
midnight the evening before the sampling visit. Venous blood was collected
into 7ml Vacutainers™ tubes (two lithium heparin (119 I.U.) and one plain
tube; Becton Dickinson, Cowley Oxon, UK) following venipuncture of one of
the veins in the ante-cubital fossa. Plasma was then obtained from the
heparinised samples, whilst the blood collected in the plain Vacutainers™
tube was sent to the laboratory of the Queen Elizabeth Hospital, Birmingham
for analysis to establish constituent blood cell counts.
The heparinised venous blood samples, collected in the two lithium heparin
Vacutainers™ tubes, were left to stand at room temperature for 30mins prior
to centrifugation (Centra CL3R refrigerated bench Centrifuge, Thermo Quest
Scientific Equipment Group Ltd, Basingstoke, Hampshire, UK) at 1000g for a
further 30 minutes at 4°C. Subsequently plasma was retrieved using a
Pasteur pipette (Appleton Woods), aliquotted into 1.5ml cryogenic vials and
frozen at -80°C until required. The samples were defrosted by hand and used
immediately when required.
2.4.2. GCF sampling
Gingival crevicular fluid (GCF) samples were collected using Periopaper strips
(Oraflow Inc., Plainview, New York, USA) and measured using a pre-
calibrated Periotron 8000® (Oraflow Inc.; methods 2.4.2.4.). The Periotron
8000® is an instrument designed to quantify submicrolitre volumes of fluid
samples using “periopaper strips” and has been reported as a precise
instrument when used with a standardised protocol. The same machine was
calibrated and used throughout the study (Chapple et al 1999, Ciantar et al
1998). The Periotron consists of a pair of upper and lower counterparts or
“jaws”, which close to hold a periopaper strip between them and a digital

69
display screen. Each jaw has an electrical charge, one positive, the other
negative, and when a dry strip is inserted no electrical charge can flow.
However, when a strip containing moisture is placed between the jaws, the
charge is able to flow in direct proportion to the volume of fluid present, and is
displayed as a digital reading. GCF volumes were determined from a look up
table (Appendix 1).
Sampling was performed as previously described (Chapple et al 1993, 1997).
Sterile Periopaper strips were mounted on the holders provided taking care
not to touch the strips prior to use. Individual strips were placed into an “index
site” (2.4.2.1.), a known deep pocket (2.4.2.2.) or shallow crevice (2.4.2.3.) of the
test tooth by one of the three operators (NLM, GB, and MM). Isolation was
achieved by placing cotton wool rolls in the buccal vestibule and drying the
site with air using a 3-in-1 syringe; care was taken to ensure air was directed
from the vestibule coronally to avoid disturbing the fluid within the gingival
crevice. The periopaper strip was placed in the gingival crevice or pocket
using college tweezers until gentle resistance was felt, taking care to ensure
the entire leading edge of the strip was inserted rather than just one corner.
Each strip was left in situ for 30 seconds then recovered and the GCF volume
determined using a pre-calibrated Periotron 8000 (2.4.2.4.).
Volunteers were asked to follow the same overnight starving protocols as for
blood sampling. Throughout the GCF sampling the patients were requested
to refrain from talking or closing their mouths and the operator prevented
contamination of the strip by the lips, tongue or cheeks with retraction of these
tissues. Prior to storage, samples visibly displaying blood contamination were
rejected and an alternative site chosen for sampling. The same GCF
collection sites were used at baseline and post-operatively (Table 2.1).
2.4.2.1. Index sites
Six mesio-buccal sites, unless otherwise stated, were chosen in the maxillary
arch, ideally the first molars, first pre-molars and canines. Neighbouring teeth
were used as an alternative if necessary and mirrored in the opposing side of

70
the arch. Index sites were sampled in the smokers with periodontitis and non-
smokers with periodontitis group A prior to a full periodontal assessment,
therefore each site‟s periodontal status was at the time unknown. These
samples were taken to enable statistical analysis using patient as the unit of
analysis and reduce confounding by site characteristics, and were to be
compared to control data from a previous clinical trial (periodontitis non-
smokers 2.2.2.4. and periodontally healthy non-smokers 2.2.2.5.) in which the
author had also been involved (Brock et al 2004, Chapple et al 2007).
2.4.2.2. Deep sites
Known deep pockets were sampled in both the smokers and non-smokers
with periodontitis group B following a full periodontal assessment (2.3.1.1. and
2.2.1.4.), with greater than a 24 hours period for the gingiva to recover from
probing. Four deep sites, defined as a site of “active” disease displaying
bleeding on probing and with a probing depth of ≥5mm, were sampled per
subject in the maxillary arch. This was to enable site-specific, rather than
patient-based analysis, by comparing deep sites in the smokers and non-
smoker periodontitis groups and also deep verses shallow sites (2.4.2.3.) within
the smokers.
2.4.2.3. Shallow sites
Four shallow sites were sampled in the periodontitis smokers and the healthy
control groups; a shallow site being defined as having a probing depth of
≤3mm with no bleeding on probing. These sites were sampled following the
full periodontal measures with a minimum of 24 hours for gingival recovery.
Shallow sites were sampled to enable comparison with deep sites in the
smokers in a site-based analysis.
2.4.2.4. GCF volume determination
GCF volumes were determined with a pre-calibrated Periotron 8000.
Calibration was performed using known volumes of serum (from a single

71
donor) diluted 1:5 with physiological saline as described by Chapple et al
(1999). Briefly, increasing incremental volumes of 0.01µl of 20% serum were
delivered onto periopaper strips using a Hamilton microsyringe (Aldrich
Chemical Co., Poole, UK) from 0.01 to 1.2µls and the Periotron reading
recorded. Measurements were taken in triplicate for each volume and
between each reading the Periotron was re-set to zero using the same dry
strip throughout. A graph of volumes against Periotron readings was
formulated and a calibration line produced that was described using a 4th
order polynomial regression equation (figure 2.2). Based on this equation a
“look-up” table (appendix one) was produced in order to determine volumes of
samples obtained clinically from the Periotron display against calculated
sample volumes.
Fig. 2.2. Periotron calibration curve
y = -12.882x4 + 31.806x3 - 68.328x2 + 183.31x + 4.2279
R2 = 0.995
0
50
100
150
0 0.5 1 1.5 2 2.5
Strip volume ul
Peri
otr
on
Read
ing
2.4.2.5. Periotron 8000 operating procedure
The same Periotron 8000 was used throughout the entire study. Before each
sampling session the Periotron was switched on for a minimum period of
30mins prior to use, with a blank periopaper strip between the jaws and the
digital reader set to zero. Immediately following a GCF sample collection the

72
periopaper strip was inserted between the jaws and left in place until a
reading was produced. Once the Periotron volume was obtained the strip
was immediately removed and placed in the relevant cryogenic vial, the
Periotron jaws were dry-wiped, or cleaned using isopropyl alcohol wipes
(Sterets™, Seton Healthcare Group, Oldham UK) and dried prior to
reinsertion of a blank strip and re-zeroing. Care was taken to insert the
sample and blank strip in the same orientation and to the same length
between the jaws (Chapple et al 1999).
2.4.2.6. GCF sample elution and storage
Each periopaper strip was immediately transferred from the Periotron to the
relevant “cryotube” containing 600µls or 400µls of PBS-BSA (50mg/L).
Samples were stored in the cryotubes in multiples according to the nature of
the site sampled (i.e. index, deep or shallow), with 100µl of PBS-BSA per
strip. Elution was carried out over a 30min period at room temperature, as
previously described as the optimal technique (Chapple et al 1997). The
cryotubes were then “snap” frozen and stored in liquid nitrogen with the strips
retained “in situ”.
Before use the stored elutes were defrosted by hand, vortexed for 2 seconds
and assayed immediately. For quantitative determinations, a known volume
of eluate was used in conjunction with Trolox standards whose volumes
matched those of the sampled eluate.
GCF samples were collected at baseline and 3 months following treatment for
the periodontitis patients, so were all PPD, REC, CAL and indices
measurements.
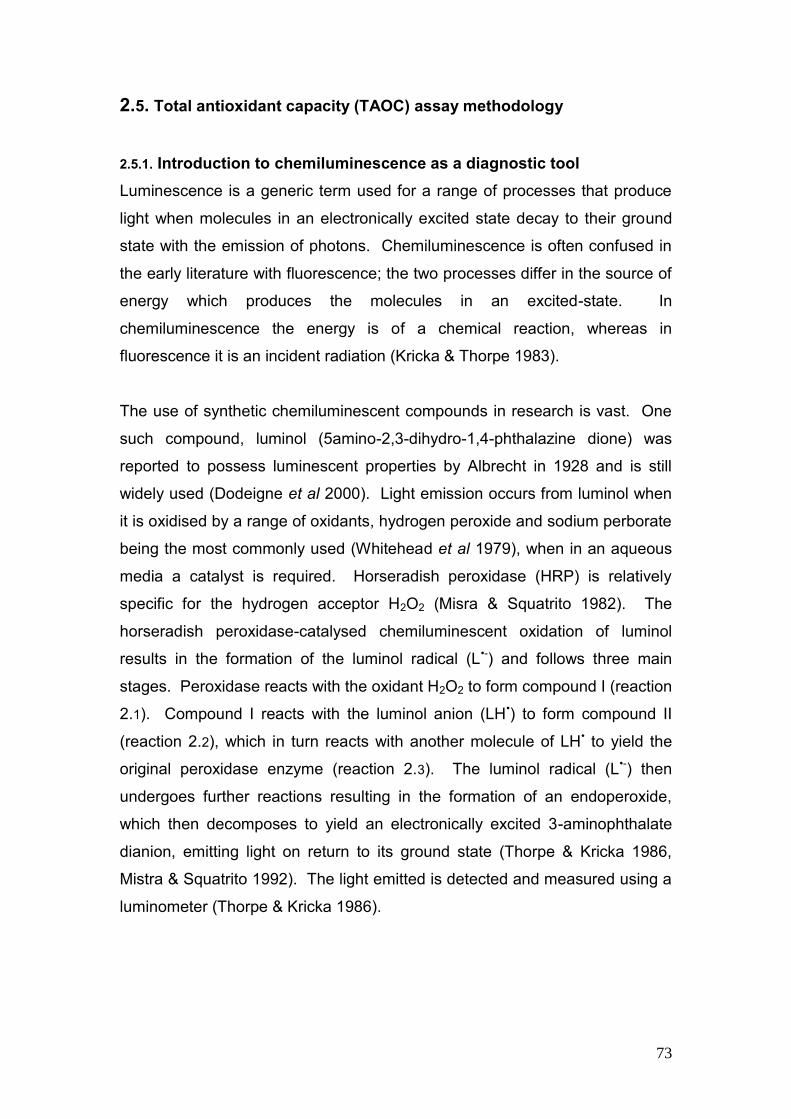
73
2.5. Total antioxidant capacity (TAOC) assay methodology
2.5.1. Introduction to chemiluminescence as a diagnostic tool
Luminescence is a generic term used for a range of processes that produce
light when molecules in an electronically excited state decay to their ground
state with the emission of photons. Chemiluminescence is often confused in
the early literature with fluorescence; the two processes differ in the source of
energy which produces the molecules in an excited-state. In
chemiluminescence the energy is of a chemical reaction, whereas in
fluorescence it is an incident radiation (Kricka & Thorpe 1983).
The use of synthetic chemiluminescent compounds in research is vast. One
such compound, luminol (5amino-2,3-dihydro-1,4-phthalazine dione) was
reported to possess luminescent properties by Albrecht in 1928 and is still
widely used (Dodeigne et al 2000). Light emission occurs from luminol when
it is oxidised by a range of oxidants, hydrogen peroxide and sodium perborate
being the most commonly used (Whitehead et al 1979), when in an aqueous
media a catalyst is required. Horseradish peroxidase (HRP) is relatively
specific for the hydrogen acceptor H2O2 (Misra & Squatrito 1982). The
horseradish peroxidase-catalysed chemiluminescent oxidation of luminol
results in the formation of the luminol radical (L•-) and follows three main
stages. Peroxidase reacts with the oxidant H2O2 to form compound I (reaction
2.1). Compound I reacts with the luminol anion (LH•) to form compound II
(reaction 2.2), which in turn reacts with another molecule of LH• to yield the
original peroxidase enzyme (reaction 2.3). The luminol radical (L•-) then
undergoes further reactions resulting in the formation of an endoperoxide,
which then decomposes to yield an electronically excited 3-aminophthalate
dianion, emitting light on return to its ground state (Thorpe & Kricka 1986,
Mistra & Squatrito 1992). The light emitted is detected and measured using a
luminometer (Thorpe & Kricka 1986).

74
2.5.2. Enhanced chemiluminescence assays
Limitations in chemiluminescence, such as the relatively low intensity of light
emission, which gives a poor signal to background ratio and the initial brief
peak in light emission which decays rapidly, have been overcome by the use
of chemical enhancers (Brock 2005).
2.5.2.1. Mechanism of enhanced chemiluminescence
Light emission in an unenhanced HRP-catalysed oxidation of luminol is rate
limited by the relatively slow reaction of compound II with luminol. Enhancers
are believed to increase light emission by increasing the conversion of
compound II back to active HRP because it acts as a more favourable
substrate than the luminol for oxidation. The enhancer radical thus formed
can oxidise the luminol itself producing a further luminol radical and increases
light emission and in the process is reduced back to its ground state (reaction
2.4) (Thorpe & Kricka 1987).

75
The consequent light emission intensity may be increased by 500-1000 fold at
pH 7 – 9.6 and is prolonged and stable (Thorpe et al 1985b, Thorpe & Kricka
1987; figure 2.3).
Fig. 2.3. A comparision of unenhanced and enhanced chemiluminescence
Several compounds may act as enhancers, although certain substituted
phenol derivatives, including para-iodophenol (p-iodophenol) are particularly
potent enhancers. Emission spectra of phenol-enhanced and unenhanced
reactions are similar, confirming that the luminol is the emitting species rather
than the enhancer (Thorpe et al 1985a).
2.5.2.2. Application of the ECL system as an antioxidant assay: inhibition
by radical scavengers
The light emission in ECL, produced and driven by the continuous production
of free radicals from the p-iodophenol enhancer, luminol and reactive oxygen
species, may be almost totally suppressed by adding chain-breaking (radical
scavenging) antioxidants to the assay (Whitehead et al 1992). Once all the
added antioxidant has been quenched the luminol oxidation continues and the
light output returns to its original level. As the radicals are constantly
generated, the time period of suppression is linearly related to the quantity of
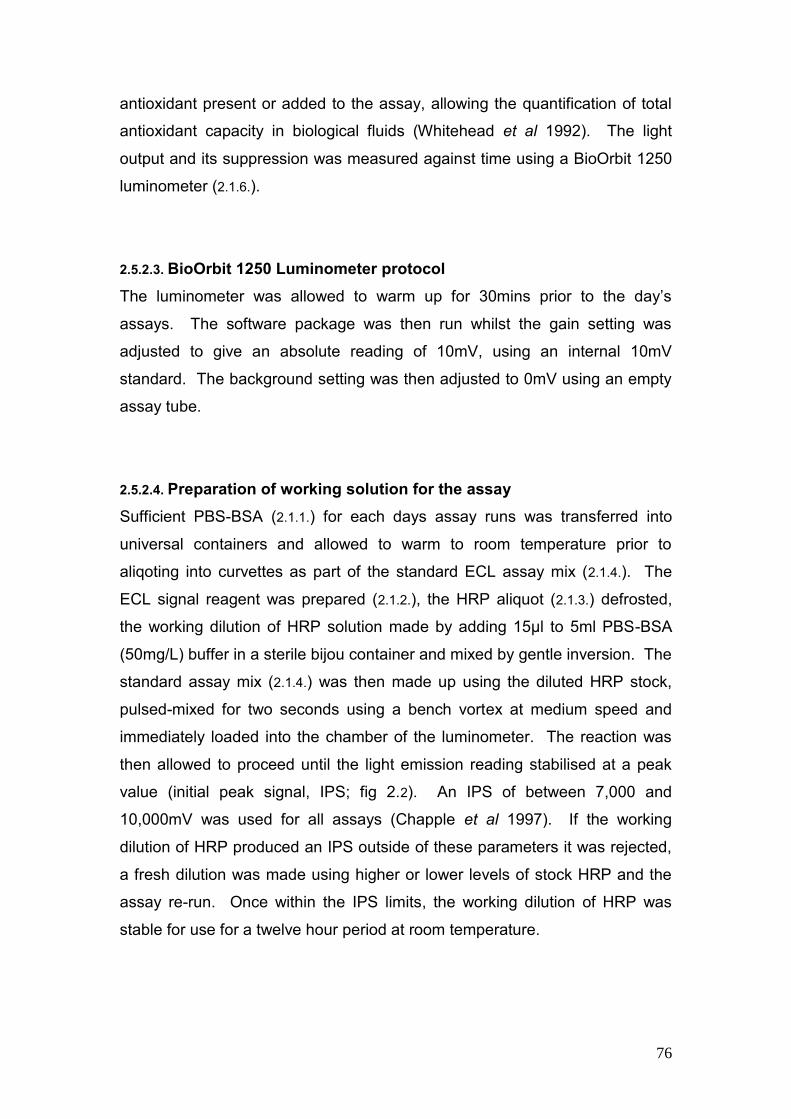
76
antioxidant present or added to the assay, allowing the quantification of total
antioxidant capacity in biological fluids (Whitehead et al 1992). The light
output and its suppression was measured against time using a BioOrbit 1250
luminometer (2.1.6.).
2.5.2.3. BioOrbit 1250 Luminometer protocol
The luminometer was allowed to warm up for 30mins prior to the day‟s
assays. The software package was then run whilst the gain setting was
adjusted to give an absolute reading of 10mV, using an internal 10mV
standard. The background setting was then adjusted to 0mV using an empty
assay tube.
2.5.2.4. Preparation of working solution for the assay
Sufficient PBS-BSA (2.1.1.) for each days assay runs was transferred into
universal containers and allowed to warm to room temperature prior to
aliqoting into curvettes as part of the standard ECL assay mix (2.1.4.). The
ECL signal reagent was prepared (2.1.2.), the HRP aliquot (2.1.3.) defrosted,
the working dilution of HRP solution made by adding 15µl to 5ml PBS-BSA
(50mg/L) buffer in a sterile bijou container and mixed by gentle inversion. The
standard assay mix (2.1.4.) was then made up using the diluted HRP stock,
pulsed-mixed for two seconds using a bench vortex at medium speed and
immediately loaded into the chamber of the luminometer. The reaction was
then allowed to proceed until the light emission reading stabilised at a peak
value (initial peak signal, IPS; fig 2.2). An IPS of between 7,000 and
10,000mV was used for all assays (Chapple et al 1997). If the working
dilution of HRP produced an IPS outside of these parameters it was rejected,
a fresh dilution was made using higher or lower levels of stock HRP and the
assay re-run. Once within the IPS limits, the working dilution of HRP was
stable for use for a twelve hour period at room temperature.

77
2.5.2.5. Influence of the test solution (GCF & Plasma) upon ECL
The standard ECL (2.1.4.) mix was loaded into the luminometer chamber and
luminol oxidation proceeded until the desired IPS was attained. The process
was then stopped momentarily. The curvette was removed and a known
volume of test solution (GCF or plasma) added and briefly vortexed for 2secs
before returning to the luminometer chamber. The process was allowed to
continue and data collection resumed immediately. The assay was
terminated once the antioxidant capacity of the test sample was exhausted
and the chemiluminescence intensity passed a fixed recovery value (10% of
the IPS; figure 2.4.). The data collected were saved for subsequent analysis.
Fig. 2.4. Light emission kinetics prior to and following addition of 10µL
of Trolox standard. (Adapted from Chapple et al 1997)
2.5.2.6. Definition of T10%
The 10% value was required to compare the total antioxidant capacity of the
test samples (GCF and plasma) with the Trolox calibrant. It was taken as the
time in seconds between the addition of the test sample to the ECL mix and
the recovery to 10% of the IPS (Whitehead et al 1992, Chapple et al 1997).

78
2.5.2.7. Total antioxidant assay calibration and sample volumes
External Trolox calibrations were performed in triplicate, for each dilution, at
the beginning and end of the working session, with an additional standard
curve measure if a prolonged working day was required. 20µl volumes of a
range of Trolox standards (20µM - 80µM) were used, except for the GCF
samples where 100µl volumes were required using 0.625µM - 10µM Trolox
solutions. A graph of T10% (time – secs) against Trolox concentrations (µM)
was plotted and a calibration line derived, which was described by a linear
regression equation (Fig. 2.5)
Fig. 2.5. A typical Trolox standard calibration plot, including
begining, mid and end of day standards
Test sample volumes were always matched with those of the calibration. The
GCF eluates were undiluted while plasma samples were diluted 1 in 10 with
PBS-BSA to ensure a T10% value within the range of standards and also a
workable assay time.
2.5.2.8. Calculation of total antioxidant capacity
Using the linear regression equation, calculated for the day, the T10% value
of a test sample could be used to describe the total antioxidant concentration

79
in µM Trolox equivalents (Fig. 2.4). A multiplication factor was required to
allow for dilution of plasma samples to determine the final Trolox equivalent
values, as the plasma sample volumes were matched with those of the
standard. For example, if the T10% value of the test plasma sample gave a
total antioxidant concentration of 32.56µM Trolox equivalents, as this was a 1
in 10 dilution, then the final Trolox equivalent concentration was 325.6µM.
The total antioxidant capacity per 30-seconds sample (nmoles Trolox) could
also be calculated for the GCF test samples.
2.6. Statistical analysis of results
All data was analysed using a personal computer running Minitab™ version
15. P values of ≤0.05 were considered significant. Parametric data were
analysed by analysis of variance (ANOVA) and where appropriate by paired T
test (for paired data). As all the data were not normally distributed, statistical
significance was verified using non-parametric test (Mann Whitney U-test).

80
RESULTS & DISCUSSION
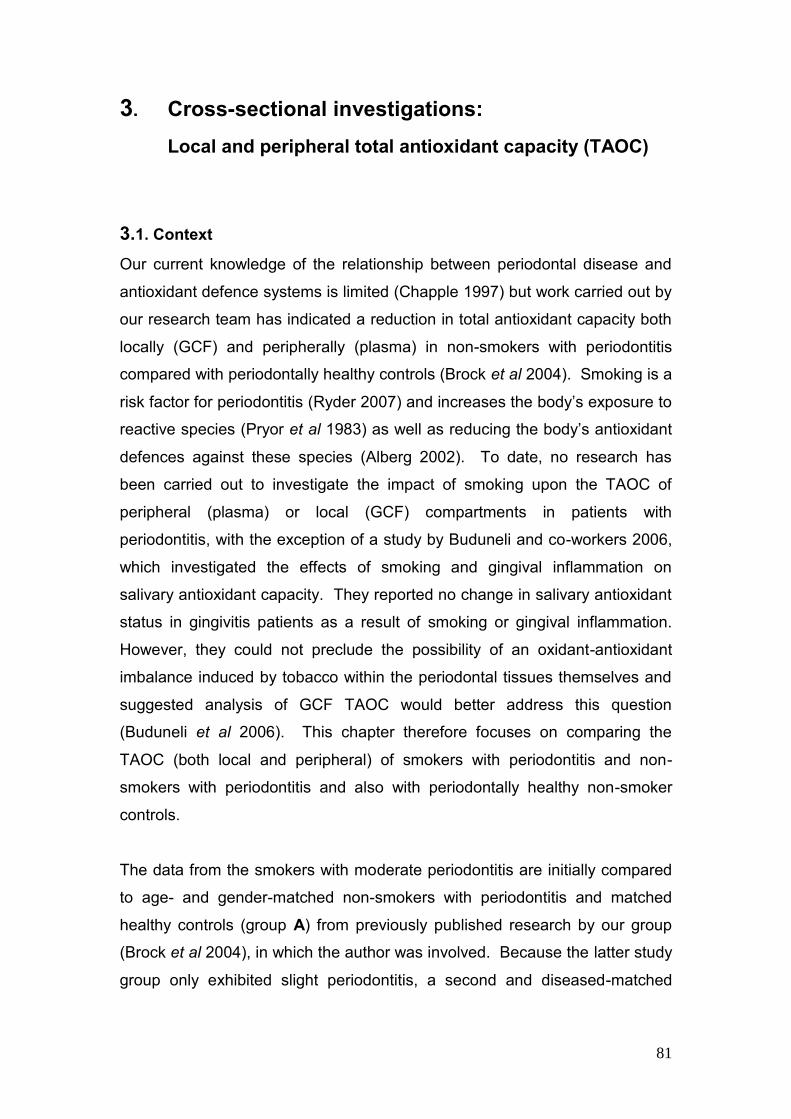
81
3. Cross-sectional investigations:
Local and peripheral total antioxidant capacity (TAOC)
3.1. Context
Our current knowledge of the relationship between periodontal disease and
antioxidant defence systems is limited (Chapple 1997) but work carried out by
our research team has indicated a reduction in total antioxidant capacity both
locally (GCF) and peripherally (plasma) in non-smokers with periodontitis
compared with periodontally healthy controls (Brock et al 2004). Smoking is a
risk factor for periodontitis (Ryder 2007) and increases the body‟s exposure to
reactive species (Pryor et al 1983) as well as reducing the body‟s antioxidant
defences against these species (Alberg 2002). To date, no research has
been carried out to investigate the impact of smoking upon the TAOC of
peripheral (plasma) or local (GCF) compartments in patients with
periodontitis, with the exception of a study by Buduneli and co-workers 2006,
which investigated the effects of smoking and gingival inflammation on
salivary antioxidant capacity. They reported no change in salivary antioxidant
status in gingivitis patients as a result of smoking or gingival inflammation.
However, they could not preclude the possibility of an oxidant-antioxidant
imbalance induced by tobacco within the periodontal tissues themselves and
suggested analysis of GCF TAOC would better address this question
(Buduneli et al 2006). This chapter therefore focuses on comparing the
TAOC (both local and peripheral) of smokers with periodontitis and non-
smokers with periodontitis and also with periodontally healthy non-smoker
controls.
The data from the smokers with moderate periodontitis are initially compared
to age- and gender-matched non-smokers with periodontitis and matched
healthy controls (group A) from previously published research by our group
(Brock et al 2004), in which the author was involved. Because the latter study
group only exhibited slight periodontitis, a second and diseased-matched
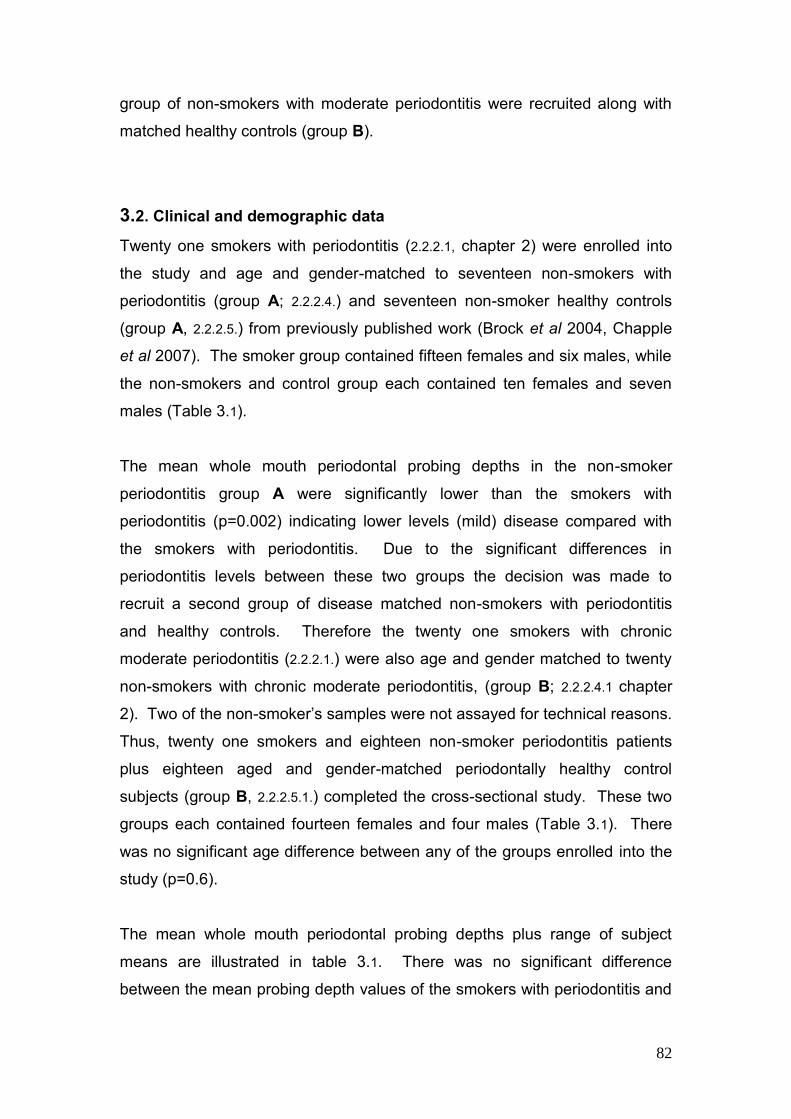
82
group of non-smokers with moderate periodontitis were recruited along with
matched healthy controls (group B).
3.2. Clinical and demographic data
Twenty one smokers with periodontitis (2.2.2.1, chapter 2) were enrolled into
the study and age and gender-matched to seventeen non-smokers with
periodontitis (group A; 2.2.2.4.) and seventeen non-smoker healthy controls
(group A, 2.2.2.5.) from previously published work (Brock et al 2004, Chapple
et al 2007). The smoker group contained fifteen females and six males, while
the non-smokers and control group each contained ten females and seven
males (Table 3.1).
The mean whole mouth periodontal probing depths in the non-smoker
periodontitis group A were significantly lower than the smokers with
periodontitis (p=0.002) indicating lower levels (mild) disease compared with
the smokers with periodontitis. Due to the significant differences in
periodontitis levels between these two groups the decision was made to
recruit a second group of disease matched non-smokers with periodontitis
and healthy controls. Therefore the twenty one smokers with chronic
moderate periodontitis (2.2.2.1.) were also age and gender matched to twenty
non-smokers with chronic moderate periodontitis, (group B; 2.2.2.4.1 chapter
2). Two of the non-smoker‟s samples were not assayed for technical reasons.
Thus, twenty one smokers and eighteen non-smoker periodontitis patients
plus eighteen aged and gender-matched periodontally healthy control
subjects (group B, 2.2.2.5.1.) completed the cross-sectional study. These two
groups each contained fourteen females and four males (Table 3.1). There
was no significant age difference between any of the groups enrolled into the
study (p=0.6).
The mean whole mouth periodontal probing depths plus range of subject
means are illustrated in table 3.1. There was no significant difference
between the mean probing depth values of the smokers with periodontitis and

83
those of the non-smoker periodontitis group B (p=0.4). However, as already
stated, the mean whole mouth probing pocket depths in the non-smoker
periodontitis group A were significantly lower than the smokers (p=0.002), but
also significantly lower than the non-smoker periodontitis group B (p=0.004).
Table 3.1.: Clinical demographic data for the experimental groups
Group A Group B
Periodontitis
(moderate)
smokers
Periodontitis
(mild)
non-smokers
Health
Periodontitis
(moderate)
non-smokers
Health
Gender 15♀ & 6♂ 10♀ & 7♂ 10♀ & 7♂ 14♀ & 4♂ 14♀ & ♂4
Age yrs – mean +SD
(range)
44.8 +8.5
(23 – 65)
43.0 +9.3
(23 – 58)
44.3 +10.6
(24 – 63)
47.1 +6.4
(36 – 61)
46.6 +6.1
(37 – 62)
Probing depths (mm)
FM mean +SD 3.79 +0.72 3.05 +0.54 ≤3.0 3.63 +0.50 ≤3.0
Recession (mm)
FM mean +SD 0.72 +0.49 Not recorded - 0.35 +0.31 -
CAL (mm)
FM mean +SD 4.06 +0.83 Not recorded - 3.99 +0.70 -
% BOP FM
+SD 49.19 +17.65 22.55 +7.26 ≤10.0 65.17 +13.73 ≤10.0
% Plaque FM
+SD 64.48 +15.49 Not recorded - 78.89 +9.00 ≤10.0
Whole mouth recession (REC) measures are also documented in table 3.1.
Recession was significantly lower (p=0.008) in the non-smokers with
periodontitis group B relative to the smokers with periodontitis. However,
when clinical attachment loss (CAL) was calculated for these two groups no
significant difference was found (p=0.7). Recession measurements were not
taken in group A and therefore CAL measurements could not be calculated
for this group.
The mean whole mouth percentage of sites bleeding on probing (% BOP)
varied greatly between the different groups (Table 3.1). These differences in

84
BOP scores were significant, consistent with previous literature reports,
between the smokers with periodontitis and the non-smokers with
periodontitis groups A (p<0.00001) and B (p=0.014). However, a significant
difference was also seen between the two non-smoker periodontitis groups A
and B (p<0.00001), reflecting lower levels of disease in group A relative to
group B.
The mean whole mouth percentage of sites noted with plaque present was
recorded in both the smokers group (64.48%) and non-smokers with
periodontitis group B (78.89%), these scores were significantly different
(p<0.002, table 3.1). Plaque levels were not assessed in the non-smokers
periodontitis group A and therefore no comparison could be made with the
other groups.
3.3. GCF samples
Gingival crevicular fluid samples were taken from either index sites (2.4.2.1),
employing the patient as the unit of analysis, or deep sites (2.4.2.2.), allowing
site specific analysis of TAOC. Mean pocket probing depths for all sites
sampled were also calculated (Table 3.2).
As expected, GCF volumes (per 30 second sample) were significantly higher
in all the periodontitis groups compared to the both the healthy control groups
A and B (p<0.0001) (Table 3.2).
3.3.1. Smokers with periodontitis versus group A (index sites – patient as
unit of analysis)
The GCF volumes for smokers were significantly greater 0.45µl (range 0.21µl-
0.77µl) when compared to the non-smokers with periodontitis group A 0.27µl
(range 0.12µl-0.59µl) (p<0.0001) (Table 3.2, Fig 3.1). The mean probing
pocket depths of these index sites were also significantly higher (p=0.017) in
the smokers with periodontitis 4.63mm (range; 2.67-6.83mm) than group A

85
3.79mm (range 1.83-6.17mm), which was expected as group A demonstrated
only mild periodontitis.
Tablet 3.2.: Clinical demographic data for Deep and Index sites that were sampled for GCF
TAOC analysis, plus the TAOC nM Trolox equivalent per 30 second sample
Group A Group B
Periodontitis
smokers
Periodontitis
non-smokers Health
Periodontitis
non-smokers Health
PPD – Index sites mm
(mean +SD) 4.63 +1.01 3.91 +1.82 ≤3.0 - -
GCF vol µl – Index sites
(mean +SD) 0.45 +0.18 0.27 +0.12 0.14 +0.03 - -
TAOC nM/30sec – Index
site (mean +SD) 0.29 +0.27 0.14 +0.06 0.17 +0.08 - -
PPD – Deep sites mm
(mean +SD) 6.04 +0.66 - - 6.42 +0.97 ≤3.0
GCF vol µl – Deep sites
(mean +SD) 0.59 +0.21 - - 0.44 +0.22 0.20 +0.06
TAOC nM/30sec – Deep
site (mean +SD) 0.25 +0.23 - - 0.28 +0.13 0.23 +0.11
Fig. 3.1 Mean GCF volume (SEM) from smokers and non-smokers with periodontitis group A
at index sites and age- and gender-matched healthy controls
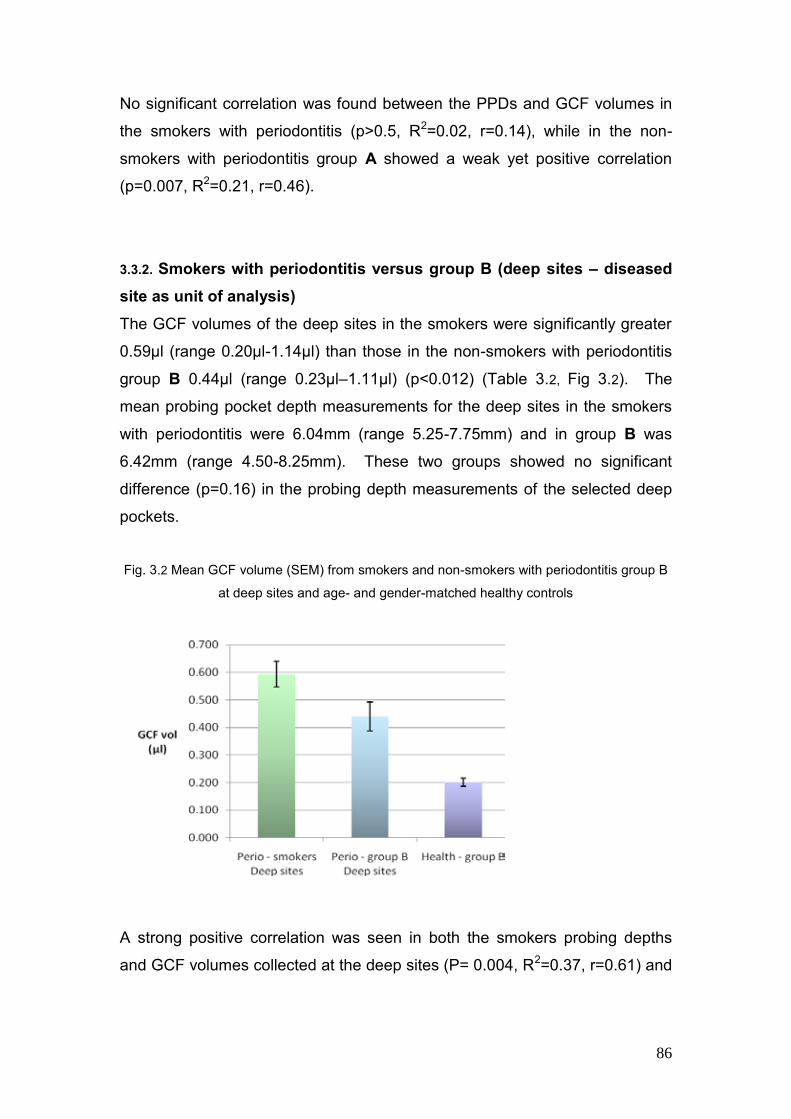
86
No significant correlation was found between the PPDs and GCF volumes in
the smokers with periodontitis (p>0.5, R2=0.02, r=0.14), while in the non-
smokers with periodontitis group A showed a weak yet positive correlation
(p=0.007, R2=0.21, r=0.46).
3.3.2. Smokers with periodontitis versus group B (deep sites – diseased
site as unit of analysis)
The GCF volumes of the deep sites in the smokers were significantly greater
0.59µl (range 0.20µl-1.14µl) than those in the non-smokers with periodontitis
group B 0.44µl (range 0.23µl–1.11µl) (p<0.012) (Table 3.2, Fig 3.2). The
mean probing pocket depth measurements for the deep sites in the smokers
with periodontitis were 6.04mm (range 5.25-7.75mm) and in group B was
6.42mm (range 4.50-8.25mm). These two groups showed no significant
difference (p=0.16) in the probing depth measurements of the selected deep
pockets.
Fig. 3.2 Mean GCF volume (SEM) from smokers and non-smokers with periodontitis group B
at deep sites and age- and gender-matched healthy controls
A strong positive correlation was seen in both the smokers probing depths
and GCF volumes collected at the deep sites (P= 0.004, R2=0.37, r=0.61) and

87
with the non-smokers with periodontal disease group B (p<0.0001, R2=0.58,
r=0.76).
3.4. Total antioxidant capacity (TAOC)
3.4.1. GCF TAOC per 30 second sample of smokers with periodontitis
versus group A (patient as unit of analysis)
Technical problems with the assay resulted in a loss of one sample during the
testing of the index sites and therefore results for the smokers with
periodontitis were based on twenty of the volunteers. The GCF samples were
taken over a 30 second time frame and assessed for TAOC within the
sample. The mean TAOC per 30 second sample was significantly lower in
the non-smokers with periodontitis group A (0.14 +0.06 nmoles/sample)
compared to the smokers with periodontitis (0.29 +0.27 nmoles/sample,
p=0.05). However the lower TAOC in the non-smokers with periodontitis
group A did not reach significance when compared to the healthy control
group A (0.17 +0.08 nmoles/sample, p=0.17), despite the larger volumes
collected from the former periodontally involved group. The smokers with
periodontal disease showed greater GCF TAOC per 30 second sample
compared to the non-smoking healthy group A but this did not reach
significance (p=0.2), despite the significantly larger volume of GCF samples in
the smokers.
3.4.1.2. GCF TAOC concentration of smokers with periodontitis versus
group A (patient as unit of analysis)
To allow for differences in volume collection of GCF, TOAC was also
expressed as a GCF concentration (TAOC µM Trolox equivalents per litre) for
all groups. There was no significant difference in the mean GCF TAOC of the
index sites between the smokers with periodontitis 632.81µM (+459.59µM)
and the non-smokers with periodontitis group A 632.39µM (+343.24µM)
(p>0.9). However, the mean GCF TAOC of the index sites in the control
group A 1287.43µM (+696.10µM) was significantly higher than both the

88
smokers (p=0.0002) and the non-smokers with periodontitis group A
(p=0.0003) (Fig 3.3).
Fig. 3.3 Mean GCF TAOC µM Trolox equivalents per litre (SEM) from smokers and non-
smokers with periodontitis group A at index sites and age- and gender-matched healthy
controls
3.4.2. GCF TAOC per 30 second sample of smokers with periodontitis
versus group B (diseased site as unit of analysis)
The greatest mean TAOC per 30 second sample of the deep sites was seen
in the non-smoking periodontitis group B (0.27 +0.13 nmoles/sample), which
was not significantly higher than the smokers with periodontitis (0.25 +0.23,
p=0.15). While the lowest mean TAOC per 30 second sample of the sites
sampled seen in the healthy control group B (0.22 +0.11 nmoles/sample),
which may reflect the lower level of GCF retrieved from the healthy site over
the 30 second time period.
3.4.2.1. GCF TAOC concentration of smokers with periodontitis versus
group B (diseased site as unit of analysis)
The mean TAOC of the GCF of the deep sites were then calculated as µM
Trolox equivalent per litre. The deep site samples for the smokers with
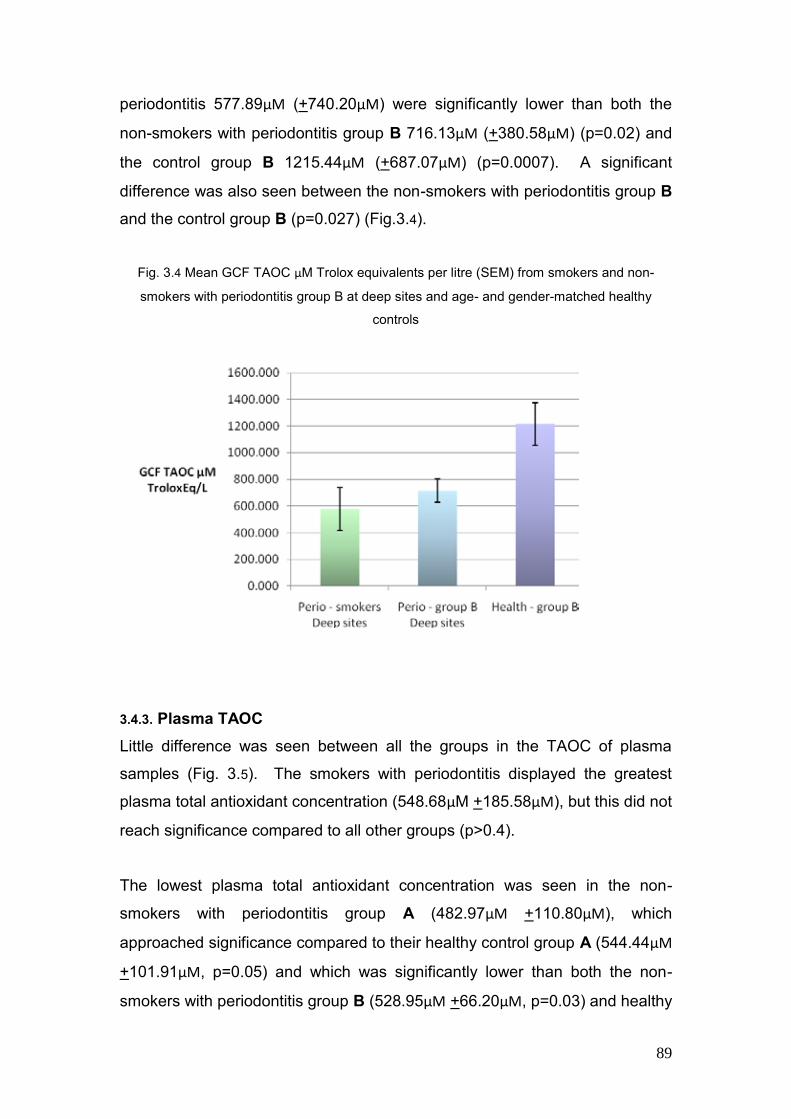
89
periodontitis 577.89µM (+740.20µM) were significantly lower than both the
non-smokers with periodontitis group B 716.13µM (+380.58µM) (p=0.02) and
the control group B 1215.44µM (+687.07µM) (p=0.0007). A significant
difference was also seen between the non-smokers with periodontitis group B
and the control group B (p=0.027) (Fig.3.4).
Fig. 3.4 Mean GCF TAOC µM Trolox equivalents per litre (SEM) from smokers and non-
smokers with periodontitis group B at deep sites and age- and gender-matched healthy
controls
3.4.3. Plasma TAOC
Little difference was seen between all the groups in the TAOC of plasma
samples (Fig. 3.5). The smokers with periodontitis displayed the greatest
plasma total antioxidant concentration (548.68µM +185.58µM), but this did not
reach significance compared to all other groups (p>0.4).
The lowest plasma total antioxidant concentration was seen in the non-
smokers with periodontitis group A (482.97µM +110.80µM), which
approached significance compared to their healthy control group A (544.44µM
+101.91µM, p=0.05) and which was significantly lower than both the non-
smokers with periodontitis group B (528.95µM +66.20µM, p=0.03) and healthy

90
group B (496.79µM +95.50µM, p=0.03). However this lowered plasma TAOC
did not reach significance compared to the smokers (p>0.3).
Fig. 3.5 Mean plasma TAOC µM Trolox equivalents per litre (SEM) from smokers and non-
smokers with periodontitis and age- and gender-matched healthy controls
Peripheral (plasma) total antioxidant concentration was lower than local
(GCF) total antioxidant concentrations and showed a gender bias towards
being significantly higher in male subjects than females regardless of
periodontal health or disease status (p<0.013, Fig 3.5 & 3.6). In the non-
smokers with periodontitis group B the difference between the plasma total
antioxidant concentration in males to females failed to reach significance
(p=0.07).
By contrast the GCF samples showed no significant gender bias (p>0.1),
despite the mean total antioxidant concentrations in female subjects (with or
without periodontitis) appearing higher than those from male subjects (Fig
3.6). This gender bias is consistent with that found in our earlier work (Brock
et al 2004). Within the smokers the same gender bias was found with the
exception of the male smokers at index sites (Fig 3.6), which was higher than
in the females at index sites, but again this difference between the genders
failed to reach significance (p>0.4).

91
Fig.3.6. Total antioxidant concentrations in plasma and GCF (patient as unit of analysis):
stratified for gender (mean SEM)
Fig.3.7. Total antioxidant concentrations in plasma and GCF (deep site as unit of analysis):
stratified for gender (mean SEM)

92
3.5. Summary of findings
GCF volumes were higher in smokers with periodontitis than non-smokers
with periodontitis
GCF TAOC concentrations were lower in both the smokers and the non-
smokers with periodontitis groups compared to healthy control groups
In disease matched subjects, the smokers showed a lower GCF TAOC
concentration than non-smokers with periodontitis (group B)
Little difference was seen in plasma TAOC in the periodontitis groups and
the healthy controls
3.6. Discussion
This is the first study to quantify local (GCF) and peripheral (plasma) total
antioxidant capacity in smokers with periodontal disease in order to compare
them with non-smokers with equivalent levels of periodontal disease and
periodontally healthy non-smokers.
The demographics of the patient groups were evenly matched and the
decision to use only non-smokers as healthy controls rather than periodontally
healthy smokers, was taken due to the difficulty in assessing periodontal
health based on BOP, which is altered in smokers due to the long term
chronic effect smoking has upon the vasculature of the periodontal tissues
(Palmer et al 2005). However, the levels of periodontal disease were not
comparable between the smokers and group A; group A displaying only mild
periodontitis compared to moderate periodontitis in the smokers group.
Therefore a second non-smokers control group, group B, were recruited in
order to more closely match periodontal disease experience between smoker
and non-smoker groups. In the second group, to further compare disease,
both current disease (PPD) and historical disease (CAL levels) were
assessed and analysis confirmed that there was no significant difference in
disease levels between the smokers and non-smokers in group B (p=0.7).

93
The significantly lower levels of BOP found in the smokers with periodontal
disease compared to both the non-smoking groups, is in agreement with
previous research (Preber & Bergstrom 1985, Lie et al 1998, Bergstrom &
Bostrom 2001). However, the difference in percentage of sites BOP between
the two non-smoker groups may be explained by the lower disease
experience in group A.
The percentage of sites with plaque recorded was lower in the smokers with
periodontal disease compared to group B (plaque scores were not recorded in
group A). Early research indicated higher levels of plaque accumulation in
smokers (Kristoffersen 1970), but subsequent work dispelled this as an
explanation for the increased disease prevalence in smokers and indicated
similar levels of plaque accumulation, when controlling for other factors, in
both smokers and non-smokers (Bergstrom 1981, Bergstrom & Preber 1986,
Lie et al 1998). The lower plaque levels recorded in the smokers with
periodontal disease within our study may be explained possibly by
motivational factors, but its lack of impact upon level of periodontal disease
experienced in this group may be due to the trend for smokers to harbour
greater levels of periodontal pathogens compared to non-smokers without an
increased level of plaque (Palmer et al 2005) i.e. the quality rather than the
quantity of plaque.
GCF volumes were higher in the smokers, which was unexpected as reduced
resting rates of GCF flow are reported in smokers (Persson et al 1999).
However some research has reported an increase in GCF volumes during
experimental gingivitis in smokers (Bergstrom & Preber 1986) and a transient
increase is seen during an episode of smoking (McLaughlin et al 1993).
These conflicting data may reflect differences arising due to the differential
effects of acute and chronic smoking upon the gingival vasculature (Palmer et
al 2005). In the long term, smoking impairs the vasculature of the periodontal
tissues; however Baab & Öberg (1987) demonstrated an increase in gingival
blood flow during smoking of approximately 25%. This increase was
maintained for 5mins and then gradually declined to baseline flow levels.
Meekin et al (2000) also found changes in the gingival blood flow rate of
94
light/occasional and heavier smokers after smoking a single cigarette, though
these were not statistically significant. The smokers within the current
research project were not restricted from smoking prior to GCF collection,
which occurred at the beginning of the sampling appointment, this may
therefore have had a confounding influence upon the gingival blood flow rates
and in turn GCF volumes at the time of sampling.
The significantly reduced local (GCF) TAOC concentration in both the
smokers with periodontitis and non-smokers with periodontitis compared to
age- and gender-matched healthy controls is in broad agreement with
preliminary observations by Chapple et al (2002). While the data demonstrate
lowered local GCF TAOC in the periodontitis groups, the mechanism
underlying the difference and whether the difference predisposed to, or results
from periodontal inflammation remains unclear. Increased GCF volumes as a
consequence of the inflammatory process itself may cause a dilution of
antioxidant concentrations, but the data do not support this theory. The
amount of TAOC sampled in 30 seconds appears unrelated to the volume
collected (smokers r=0.4, non-smokers group A r=0.2). The data indicate that
the index sites from periodontitis subjects yielded lower overall amounts of
antioxidants despite the GCF volumes collected being double those of the
non-smokers group A and treble those of the smokers with periodontitis
compared to the healthy group A.
Analysis of the deeper sites in both the smokers and non-smokers with
periodontitis group B also demonstrated a significantly reduced TAOC
concentration in GCF samples compared to the healthy group B. Again the
data demonstrate increases in GCF volumes, consistent with the higher levels
of disease, but this did not appear to dilute the antioxidant concentration in the
30 second samples (smokers r=0.3, non-smokers group B r=0.04). The GCF
volumes were again double in the non-smokers and treble in the smokers
compared to the healthy control group, yet still reflected a reduced TAOC.
When the patient was utilised as the unit of analysis GCF TAOC
concentration in the periodontitis groups were lower compared to healthy

95
groups but no difference was seen between the smokers and non-smokers
with periodontitis group A, who were not disease matched. However, in the
analysis of the diseased matched groups at deep sites, the smokers showed
a significantly reduced total antioxidant concentration in GCF compared to the
non-smokers with periodontitis group B. This further reduction in the amount
of antioxidant present may be as a result of the additional load of ROS
production from the use of tobacco, both chronically and acutely (Palmer et al
2005, Pryor et al 1983), as patients were not restrained from smoking prior to
sampling.
The plasma TAOC showed little difference between all volunteer groups, with
the exception of the smokers, who showed the highest TAOC but this was
only significant compared to the non-smokers with periodontitis group A, who
had the lowest TAOC of all the groups. These findings are in broad
agreement with previous research that suggested higher levels in healthy
subjects (Chapple et al 2002). Within the current study, the non-smokers with
periodontitis group A displayed a lower plasma TAOC than both healthy
control groups. Indeed in large scale epidemiological studies an increased
serum antioxidant concentration was associated with a reduced relative risk of
periodontitis even in never smokers (Chapple et al 2007). The increased
plasma TAOC in smokers with periodontitis, relative to non-smokers with
periodontitis was unexpected but may reflect up regulation of antioxidant
defence systems in smokers as a compensatory physiological protective
mechanism.
The plasma samples from male subjects possessed greater TAOC than those
from females, whether periodontal status was considered or not, which is in
agreement with previous findings (Brock et al 2004, Maxwell et al 2006). This
gender bias is believed to be due to higher uric acid levels in males than in
females (Woodford & Whitehead 1998), a major antioxidant in plasma. By
contrast this gender bias was not evident in GCF TAOC, the female
volunteers, with the exception of female smokers at index sites, displayed
higher levels of TAOC than their male counterparts regardless of periodontal
status. Since GCF is derived from plasma it is logical to assume the

96
composition would be similar; however the GCF profile to plasma seems to
undergo significant modification, both quantitatively and qualitatively within the
tissues, as the emerging GCF has a different antioxidant profile regardless of
gender and uric acid is not the major component. Data by Chapple and co-
workers (2002) support this concept and indicate that thiol-containing
antioxidants, particularly reduced glutathione, are present in high
concentrations in GCF. Research by Brock et al (2004) demonstrated that the
levels of glutathione (reduced, oxidised and total) found within the GCF of
periodontitis patients is reduced compared to healthy controls, which may
have implications for the pathogenesis of periodontal disease and possibly it‟s
management.
In conclusion, the cross sectional data reported here suggest a reduced
protective effect of local (GCF) antioxidant capacity in volunteers with
periodontal disease, particularly those who use tobacco, compared to
matched healthy control subjects. While the potential consequences of a
compromised local antioxidant concentration could be significant, the
temporal relationship between reduced GCF TAOC and the development of
periodontal inflammation cannot be elucidated due to the cross sectional
nature of this analysis. The next chapter reports data from a longitudinal
interventional study and aims to define more clearly the potential role of this
reduced local antioxidant concentration in the pathobiology of periodontitis.

97
4. Longitudinal investigations:
Local and peripheral total antioxidant capacity
4.1. Context
Whilst the cross-sectional data described in chapter 3 demonstrate both a
compromised local and peripheral total antioxidant capacity as a feature of
inflammatory periodontitis and to a greater extent locally within the smoking
group, the data could not differentiate between whether this predisposed to
the periodontal inflammation or was a consequence of increased levels of
reactive oxygen species (ROS) (i.e. oxidative stress) generated during the
inflammatory process itself. Longitudinal investigation into both local and
peripheral TAOC following root surface decontamination should help
determine the temporal relationship between the reduced antioxidant capacity
and the periodontal inflammation. This could help in the development of novel
antioxidant therapies for adjunctive use in “at risk” patients. Furthermore, the
longitudinal study should help to elucidate whether the additional reduction in
TAOC in smokers remains significant once the inflammation has been
reduced by non-surgical intervention. The aim of this longitudinal intervention
study was therefore to determine the effect of a single course of conventional
non-surgical periodontal therapy on local (GCF) and peripheral (plasma) total
antioxidant capacity in previously untreated chronic periodontitis patients, who
were current smokers.
4.2. Clinical and demographic data
Twenty of the smokers with periodontitis (2.2.2.1) and thirty five of the non-
smokers with periodontitis (2.2.2.4 and 2.2.2.4.1) recruited for the cross-
sectional study completed the longitudinal intervention study (table 4.1). One
female volunteer from the smokers with periodontitis group withdrew from the
longitudinal study just prior to the three month review appointment, due to
work commitments. The reduction in number of volunteers in the smokers
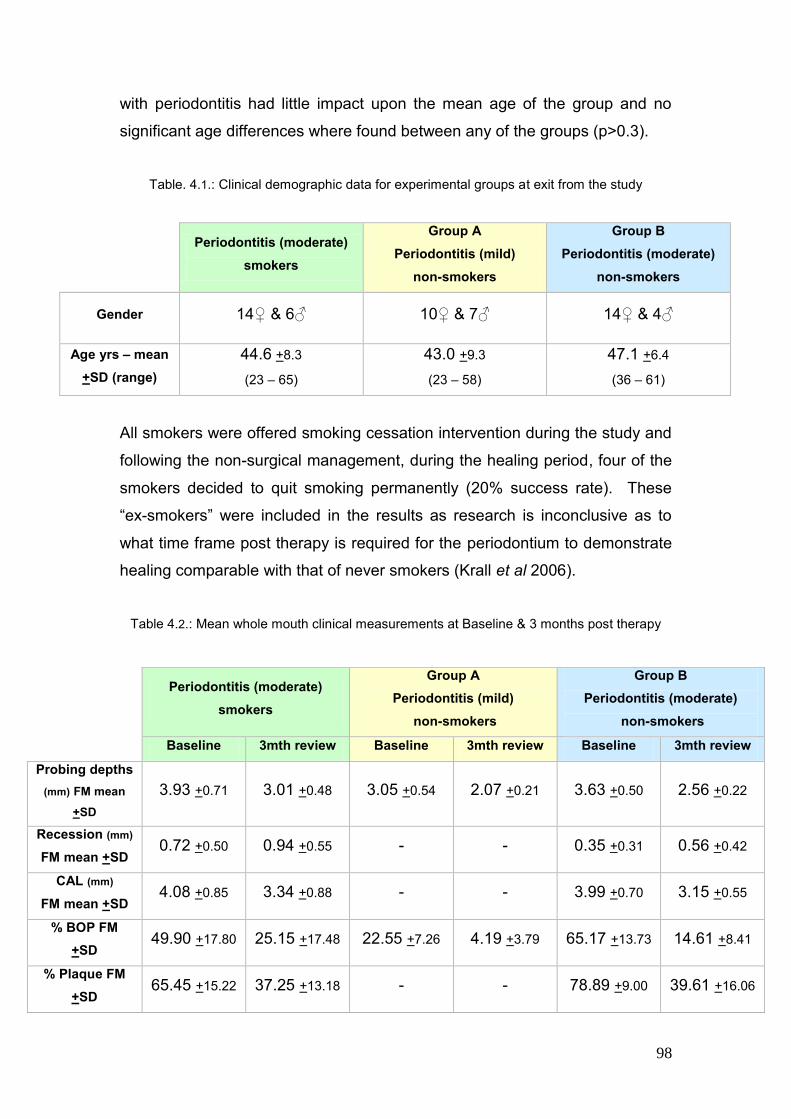
98
with periodontitis had little impact upon the mean age of the group and no
significant age differences where found between any of the groups (p>0.3).
Table. 4.1.: Clinical demographic data for experimental groups at exit from the study
Periodontitis (moderate)
smokers
Group A
Periodontitis (mild)
non-smokers
Group B
Periodontitis (moderate)
non-smokers
Gender 14♀ & 6♂ 10♀ & 7♂ 14♀ & 4♂
Age yrs – mean
+SD (range)
44.6 +8.3
(23 – 65)
43.0 +9.3
(23 – 58)
47.1 +6.4
(36 – 61)
All smokers were offered smoking cessation intervention during the study and
following the non-surgical management, during the healing period, four of the
smokers decided to quit smoking permanently (20% success rate). These
“ex-smokers” were included in the results as research is inconclusive as to
what time frame post therapy is required for the periodontium to demonstrate
healing comparable with that of never smokers (Krall et al 2006).
Table 4.2.: Mean whole mouth clinical measurements at Baseline & 3 months post therapy
Periodontitis (moderate)
smokers
Group A
Periodontitis (mild)
non-smokers
Group B
Periodontitis (moderate)
non-smokers
Baseline 3mth review Baseline 3mth review Baseline 3mth review
Probing depths
(mm) FM mean
+SD
3.93 +0.71 3.01 +0.48 3.05 +0.54 2.07 +0.21 3.63 +0.50 2.56 +0.22
Recession (mm)
FM mean +SD 0.72 +0.50 0.94 +0.55 - - 0.35 +0.31 0.56 +0.42
CAL (mm)
FM mean +SD 4.08 +0.85 3.34 +0.88 - - 3.99 +0.70 3.15 +0.55
% BOP FM
+SD 49.90 +17.80 25.15 +17.48 22.55 +7.26 4.19 +3.79 65.17 +13.73 14.61 +8.41
% Plaque FM
+SD 65.45 +15.22 37.25 +13.18 - - 78.89 +9.00 39.61 +16.06

99
Following non-surgical management of the periodontal inflammation and a
three month healing period, all three groups showed significant (p<0.0001)
reductions in their mean full mouth probing pocket depths (Table 4.2, Fig 4.1);
smokers with periodontitis 0.82mm (+0.40), non-smokers with periodontitis
group A 0.98mm (+0.48) and non-smokers with periodontitis group B 1.07mm
(+0.44). The greatest improvement was seen in the non-smokers with
periodontitis Group B, though the improvements were not significantly
different between any of the groups (p>0.2).
Fig 4.1.: Mean reduction in whole mouth probing pocket depths (PPD + SEM) following non-
surgical therapy & 3 months healing period
The full mouth recession measurements following periodontal management
increased in both the smokers with periodontitis (0.22mm, +0.17) and the non-
smokers with periodontitis group B (0.21mm, +0.26). Little difference was
seen in the amount of recession between the two groups (p>0.9) (Table 4.2,
Fig 4.2).
Fig 4.2.: Mean change in whole mouth recession (REC +SEM) following non-surgical therapy
& 3months healing period

100
The full mouth mean clinical attachment loss was seen to reduce significantly
in both the smokers with periodontitis 0.74mm (+1.18, p=0.012) and the non-
smokers with periodontitis group B 0.84mm (+0.31, p<0.0001). The greatest
clinical attachment gain was seen in the non-smokers with periodontitis group
B, but this was not significantly different from the smoker group (p>0.8) (Table
4.2, Fig 4.3). Recession and clinical attachment loss were not calculated for
the non-smokers with periodontitis group A.
Fig 4.3: Mean whole mouth clinical attachment gain (+SEM) following non-surgical therapy &
3 months healing period
Given the large variance in CAL gain amongst the smokers, a correlation was
performed between CAL gain and smoking habit, expressed as cigarettes per
day and pack years respectively. The correlations were negative at -0.37
(R2=0.14) and at -0.33 (R2=0.11) and approached significance (p=0.08).
Removal of the ex-smokers (the four newly quit subjects) from the statistical
analysis had little impact on these data.
Full mouth percentage of sites bleeding on probing (% BOP) reduced
significantly post-periodontal therapy in all three experimental groups (Table
4.2, Fig 4.4); smokers with periodontitis 24.75% (+22.59, p<0.0001), in the
non-smokers with periodontitis group A 18.37% (+5.99, p<0.0001) and non-
smokers with periodontitis group B 50.56% (+15.01, p<0.0001). The greatest
reduction in bleeding on probing was seen in the non-smokers with
periodontitis group B, which was significantly greater than in the other two

101
experimental groups (p<0.0003). The smallest improvement in bleeding on
probing following periodontal therapy was seen in the non-smokers with
periodontitis group A.
Fig 4.4.: Mean reduction in whole mouth bleeding on probing (SEM) following non-surgical
therapy & 3 months healing period
Full mouth percentage sites with plaque reduced significantly (Table 4.2, Fig
4.5) following non-surgical management of the periodontal disease in both the
smokers 28.20% (+18.71, p<0.0001) and in the non-smokers group B 39.28%
(+16.38, p<0.0001). The greatest improvement in plaque score was seen in
the non-smokers with periodontitis group B, but this was not a significantly
greater improvement than that seen in the smokers with periodontitis
(p=0.14).
Fig 4.5.: Mean reduction in whole mouth sites with plaque (SEM) following non-surgical
therapy & 3 months healing period
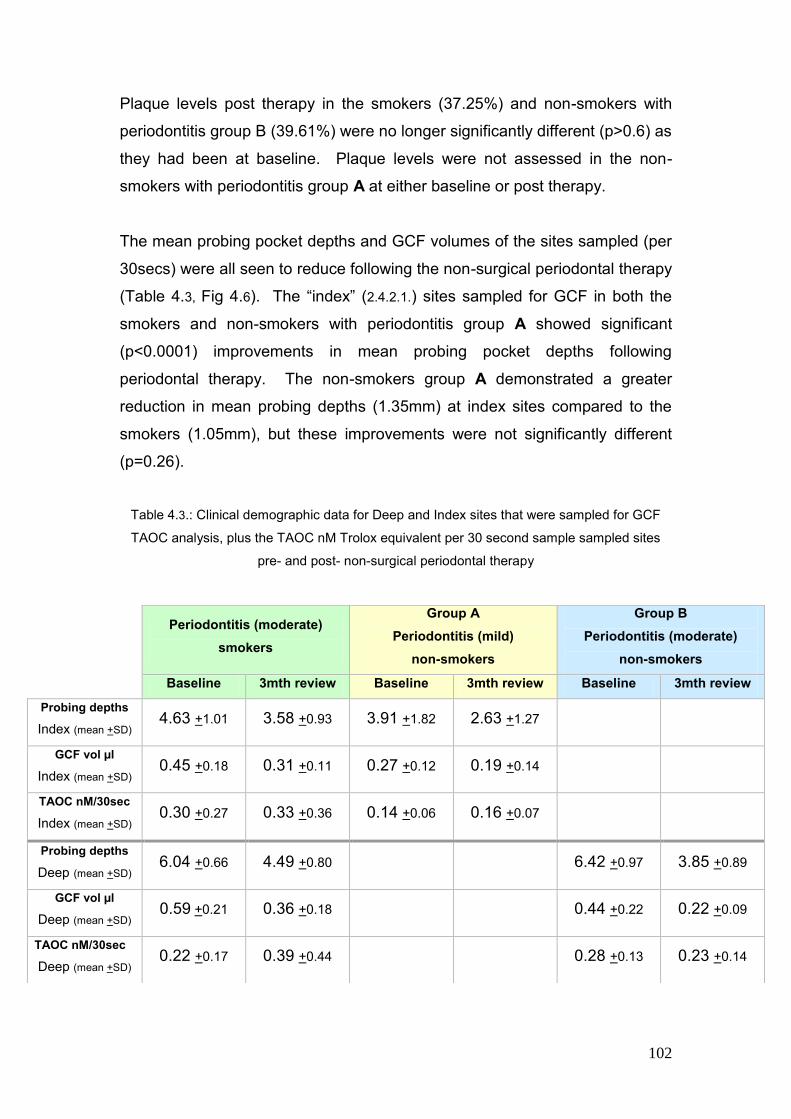
102
Plaque levels post therapy in the smokers (37.25%) and non-smokers with
periodontitis group B (39.61%) were no longer significantly different (p>0.6) as
they had been at baseline. Plaque levels were not assessed in the non-
smokers with periodontitis group A at either baseline or post therapy.
The mean probing pocket depths and GCF volumes of the sites sampled (per
30secs) were all seen to reduce following the non-surgical periodontal therapy
(Table 4.3, Fig 4.6). The “index” (2.4.2.1.) sites sampled for GCF in both the
smokers and non-smokers with periodontitis group A showed significant
(p<0.0001) improvements in mean probing pocket depths following
periodontal therapy. The non-smokers group A demonstrated a greater
reduction in mean probing depths (1.35mm) at index sites compared to the
smokers (1.05mm), but these improvements were not significantly different
(p=0.26).
Table 4.3.: Clinical demographic data for Deep and Index sites that were sampled for GCF
TAOC analysis, plus the TAOC nM Trolox equivalent per 30 second sample sampled sites
pre- and post- non-surgical periodontal therapy
Periodontitis (moderate)
smokers
Group A
Periodontitis (mild)
non-smokers
Group B
Periodontitis (moderate)
non-smokers
Baseline 3mth review Baseline 3mth review Baseline 3mth review
Probing depths
Index (mean +SD) 4.63 +1.01 3.58 +0.93 3.91 +1.82 2.63 +1.27
GCF vol µl
Index (mean +SD) 0.45 +0.18 0.31 +0.11 0.27 +0.12 0.19 +0.14
TAOC nM/30sec
Index (mean +SD) 0.30 +0.27 0.33 +0.36 0.14 +0.06 0.16 +0.07
Probing depths
Deep (mean +SD) 6.04 +0.66 4.49 +0.80 6.42 +0.97 3.85 +0.89
GCF vol µl
Deep (mean +SD) 0.59 +0.21 0.36 +0.18 0.44 +0.22 0.22 +0.09
TAOC nM/30sec
Deep (mean +SD) 0.22 +0.17 0.39 +0.44 0.28 +0.13 0.23 +0.14

103
The GCF volumes per 30sec samples at index sites also reduced in both the
smokers (0.14µls, p<0.001) and the non-smokers with periodontitis group A
(0.07µls, p<0.01). The reduction in GCF volume within the index sites
following treatment in the smokers was slightly higher, but this was not
significant (p=0.12). No correlation was seen in the reduction in pocket
probing depth and GCF volume at index sites in the smokers (p=0.56,
R2=0.02, r=0.14). However a significant correlation was seen in the non-
smokers with periodontitis group A between the reduction in probing pocket
depths and the reduction in GCF volume (p=0.03, R2=0.26, r=0.51).
Fig 4.6: Mean decrease in GCF volumes (SEM) in sites sampled following non-surgical
therapy & 3months healing period
When comparing the disease matched groups, the non-smokers with
periodontitis group B experienced a significantly (p=0.002) greater reduction
in mean probing depth in “deep” (2.4.2.2.) pockets (2.56mm, p<0.0001)
compared to the deep sites sampled in the smokers with periodontitis
(1.54mm, p<0.0001). Although the non-smokers group B displayed a
significant reduction in GCF volume (0.214µls, p=0.002), this reduction was
not as great as that reported in the smokers (0.245µls, p<0.0001), but the
difference between groups was not significant (p=0.6). Post therapy, despite
the greater reduction in GCF volumes in the smokers, the GCF volume
remained significantly higher in the smokers 0.36µls (+0.18µls) compared to

104
the non-smokers with periodontal disease group B 0.22µls (+0.09µls)
(p=0.007), implying greater residual inflammation in the smokers.
A significant positive correlation was seen between the reduction in mean
probing pocket depths and GCF volumes in the non-smokers with
periodontitis group B (p=0.009, R2=0.36, r=0.6) and a non-significant weak
correlation was seen in deep sites sampled in the smokers with periodontitis
(p=0.106, R2=0.14, r=0.37) following periodontal treatment.
When the ex-smokers (four recently quit smokers) were removed from the
analysis of the GCF volume changes for the smokers, it had little impact
(0.251µls) nor was it a significant reduction compared to the non-smokers
group B (p=0.6). The post treatment GCF volumes also remained significantly
higher in the smokers (0.39µls +0.18µls) without the ex-smokers than the non-
smokers group B (p=0.002).
4.3. Total antioxidant capacity (TAOC)
4.3.1. GCF TAOC per 30 second sample of smokers with periodontitis
versus group A (patient as unit of analysis)
Due to a technical problem with the baseline assay of an index site sampled
only nineteen of the smoker‟s samples were also run for longitudinal
differences. Following non-surgical management of the periodontal disease
and a three month healing period, the mean GCF TAOC per 30 second
sample were seen to improve in both the smokers and the non-smokers with
periodontitis group A at index sites, although these improvements were not
significant (p>0.1) (Table 4.3). The greater improvement was seen in the
smokers with periodontitis (0.03 +0.05 nmoles/sample) compared with the
non-smokers with periodontitis group A (0.02 +0.01 nmoles/sample), although
again this difference was not significant (p>0.8) between the groups.

105
4.3.1.2. GCF TAOC concentration of smokers with periodontitis versus
group A (patient as unit of analysis)
The TAOC was also expressed as a GCF concentration (TAOC µM Trolox
equivalents per litre) to allow for differences in volume collection. At the index
sites the GCF TAOC concentration was seen to significantly improve in both
the smokers with periodontitis (516µM, +1078µM, p=0.05) and in the non-
smokers with periodontitis group A (383µM, +468µM, p=0.004) (Fig 4.7).
However, the greatest improvement in the index sites GCF TAOC
concentration was seen in the smokers, which was almost double, however,
this was not significantly greater than the improvement seen in the non-
smoking group A (p>0.6). The resultant increase in both the smokers with
periodontitis to 1176.41µM (+122.57µM) and the non-smokers with
periodontitis group A to 1014.90µM (+548.77µM) following treatment resulted
in a higher TAOC concentration in the smokers, but this was not significant
(p>0.6).
Fig. 4.7 Mean GCF TAOC µM Trolox equivalents per litre (SEM) from smokers and non-
smokers with periodontitis group A at baseline and 3months review following non-surgical
therapy plus differences
Both the smokers and non-smokers GCF TAOC concentration increased to
similar levels of the non-smokers healthy control group A 1287.43µM, in the
106
smokers the GCF TAOC was non-significantly higher (p>0.2) and in the non-
smokers group A it was significantly lower (p=0.04).
4.3.2. GCF TAOC per 30 second sample of smokers with periodontitis
versus group B (diseased sites as unit of analysis)
The mean GCF TAOC per 30 second sample of the deep sites was seen to
improve in the smokers with periodontitis (0.18 +0.09 nmoles/sample,
p=0.62), although not significantly. There was no change in the TAOC per
30sec sample in disease matched non-smokers with periodontitis group B
(-0.05 +0.16 nmoles/sample, p=0.2) following non-surgical management and
3 months healing time (Table 4.3).
4.3.2.1. GCF TAOC concentration of smokers with periodontitis versus
group B (diseased sites as unit of analysis)
When the GCF TAOC was expressed as a concentration (µM Trolox
equivalents per litre) at the deep sites following treatment (and a 3 month
healing period), there was a significant improvement in both the smokers with
periodontitis (1076µM +1896µM, p=0.02) and non-smokers with periodontitis
group B (461µM, +894µM, p=0.04) (Fig 4.8). The greater improvement in
GCF TAOC concentration was seen in the smokers but this was not
significant compared with the improvement seen in the non-smokers group B
(p>0.2). However, the post-healing increase in GCF TAOC concentration in
the smokers with periodontal disease (1528.85µM, +1966.27µM), was
threefold that of the baseline concentration, but was not significantly different
to the post-therapy GCF TAOC concentration in the non-smokers with
periodontal disease group B (1177.20µM, +847.24µM) (p=0.4).
Both the smokers and non-smokers GCF TAOC concentration increased to
similar levels of the non-smokers healthy control group B 1215.44µM, in the
smokers the GCF TAOC was non-significantly higher (p>0.4) and in the non-
smokers group B it was non-significantly lower (p>0.6).

107
Removal of the ex-smokers from the analysis had no bearing on the GCF
TAOC concentrations data for any comparisons performed.
Fig. 4.8 Mean GCF TAOC µM Trolox equivalents per litre (SEM) from smokers and non-
smokers with periodontitis group B at baseline and 3 months review following non-surgical
therapy plus differences
4.3.3. Plasma TAOC
In all three study groups a small and insignificant increase in plasma TAOC
concentration was seen following periodontal therapy and a three month
healing period; smokers with periodontal disease (20.79µM +65.09µM, p>0.1),
non-smokers with periodontitis group A (5.49µM +31.00µM, p>0.4) and non-
smokers with periodontitis group B (10.35µM +109.01µM, p>0.6).
The greatest increase in plasma TAOC concentration was seen in the
smokers with periodontitis, while the smallest increase was seen in the non-
smokers with periodontitis group A, but the differences between the groups
were not significant (p>0.2, Fig 4.9). When the plasma concentrations were
calculated without the ex-smokers, the difference between all groups still
failed to reach significance (P>0.4).

108
Fig. 4.9 Mean change in Plasma TAOC µM Trolox equivalents per litre (SEM) from smokers
and non-smokers with periodontitis following non-surgical therapy
Post therapy and healing, the plasma TAOC of all the periodontitis groups
were seen to reach levels similar to the healthy control groups (p>3, Fig 4.10).
The non-smokers with periodontitis group A‟s plasma TAOC was no longer
significantly lower than the control group A (p>0.1).
Fig. 4.10 Mean baseline & post non-surgical management with 3months healing period
Plasma TAOC µM Trolox equivalents per litre (SEM) from smokers and non-smokers
compared to age- and gender-matched health controls
109
4.4 Summary of findings
Following non-surgical management of the periodontitis and a 3 month
healing period: -
Reductions in BOP, PPD and CAL gain were seen in the smokers with
periodontitis compared to the non-smokers
GCF volumes remained higher in smokers with periodontitis than the non-
smokers with periodontitis post-therapy
The GCF TAOC concentrations of all periodontitis groups recovered to
levels similar to those of the non-smoking periodontally healthy control
groups
Little difference was seen in plasma TAOC between the periodontitis
groups pre- and post-therapy
4.5. Discussion
This is the first longitudinal study to investigate how local (GCF) and
peripheral (plasma) total antioxidant capacity in smokers with periodontal
disease is influenced by a reduction in periodontal inflammation following non-
surgical therapy.
The longitudinal study demonstrated healing following non-surgical
management of the periodontitis in all three volunteer groups; these results
were in broad agreement with previous research (reviewed by Cobb 1996 &
2002). The lesser reduction in probing pocket depth and clinical attachment
gain following treatment within the smokers also agrees with previous
research, which concludes that smoking influences healing and regeneration,
and that, although improvements are seen following non-surgical
management, they are reduced in extent relative to non-smokers (Kinane &
Chestnutt 2000). The four subjects, from within the smokers with periodontitis
group, who quit their tobacco habit during the healing phase had no influence
on the resultant clinical attachment gain in this group.

110
Bleeding on probing, a clinical sign of inflammation, was seen to significantly
reduce in all three groups as was expected. The limited reduction in mean
BOP in non-smokers with periodontitis group B compared to the other
periodontitis groups likely reflects the milder disease status seen in that
group. Although the BOP in the smokers with periodontitis following non-
surgical management reduced significantly (p>0.0001), at review it remained
higher than both of the non-smoking periodontitis groups, which may be
explained by residual inflammation as a result of a poor response to treatment
(Palmer et al 2005).
The mean PPDs of the smokers did not reduce as much as the other
periodontitis groups following therapy and a three month healing period.
Indeed this difference between the disease matched groups (the smokers and
non-smokers with periodontitis group B at deep sites) reached significance
(p=0.002).
The mean full mouth CAL gain was seen to be greater in the non-smokers
with periodontitis group B compared with the smokers but this did not reach
significance. A large variance in the smokers CAL gain was reported and a
negative correlation was seen between CAL gain and number of cigarettes
smoked (R2= 0.14, r=0.37) and with pack years (R2=0.11, r=0.33), which
almost reached statistical significance (p=0.08). Studies have shown a dose
dependent relationship with attachment loss in the amount of cigarettes
smoked and pack years (Grossi et al 1994, Alpagot et al 1996). Within the
current study, 30% of the group smoked 10 or fewer cigarettes per day (light
smokers) and if the group had consisted of large numbers of volunteers the
variance may well have reached significance.
The reduced clinical healing response, including BOP, PPD and CAL gain,
found in the current study within the smokers is in line with previous research
which suggests that the detrimental effects of smoking on clinical healing
following non-surgical therapy for periodontitis has a multi-factorial biological
basis, as smoking affects the vasculature, revascularization, the inflammatory
response and fibroblast function (Palmer et al 2005). Periodontal ligament

111
fibroblast attachment following root planing is seen to be significantly reduced
in heavy smokers compared with non-smokers and healthy controls (Gamal &
Bayomy 2003). Smoking also negatively influences the capacity of the
periodontal tissues to regenerate, particularly bone (Kinane & Chestnutt
2000).
GCF volumes in the smokers were higher at baseline and remained higher
following therapy (and the healing period) despite a non-significant greater
reduction in volume compared to both the non-smokers with periodontitis
groups A & B (p>0.1). Cessation of smoking has been shown to have an
impact on gingival blood flow rate, which is seen to significantly increase over
the first 3 days, and further smaller increases are seen to occur over the
following 4-8 weeks. This in turn influences GCF flow rate, which is seen to
be greater at 5 days post cessation (Morozumi et al 2004). However, despite
a 20% quit rate in the smokers with periodontitis group during the healing
phase, when these ex-smokers were removed from the statistical analysis,
the GCF volumes in the smokers remained significantly higher post healing
than the disease matched group B (p=0.002). The higher GCF volumes seen
in the smokers with periodontal disease following therapy may therefore also
be attributed to residual inflammation, as a result of a poor response to
healing following the non-surgical management, which is in line with the other
parameters of clinical healing discussed above.
GCF TAOC concentrations were seen to increase in all periodontitis groups
following non-surgical management and the 3 months healing period. As
discussed in the cross-sectional study, the simplest explanation for this would
be due to the decrease in GCF volume following resolution of the
inflammation. However, this increase in concentration is not entirely
explained by the reduction in GCF volume in the unmatched diseased groups.
No significant correlation was found in the smokers (R2=0.001, r=0.04, p>0.8)
between the amount of GCF TAOC sampled in 30 seconds and the GCF
volumes collected at index sites. Furthermore, GCF TAOC per 30 second
sample actively increased in the smokers and in the non-smokers group A
(non-significantly), demonstrating an increase in TAOC irrespective of
112
volumes collected. Thus the results show a true increase in antioxidant levels
following treatment in the periodontitis groups, irrespective of smoking status.
Within this study the GCF TAOC concentration in all groups, with the
exception of the non-smokers with periodontitis group A, increased to similar
levels found in the periodontally healthy control groups A & B, suggesting that
the total antioxidant compromise seen at baseline may result from the
inflammatory lesion, rather than predispose to it. These data are consistent
with the literature (Chapple et al 2007).
At baseline the GCF TAOC concentrations in the smokers with periodontitis
were significantly lower than the non-smokers with periodontitis group B
(p=0.02) and the control group B (p=0.007). It is logical to contend that the
further reduction in the smokers compared with the non-smokers with
periodontitis, is due to the local impact of the additional ROS created through
their use of tobacco both chronically and acutely (Pryor et al 1983, Palmer et
al 2005). However, the GCF TAOC concentration in the smokers recovered
to the same level as the healthy control group, implying that the main
contributor for the reduced local TAOC was the periodontal inflammation and
that the increased ROS exposure locally did not impact on the recovery of the
local antioxidant status. It may therefore be that smokers may have a
compensatory protective mechanism to deal with the additional local oxidative
stress, whereby antioxidant systems are up-regulated. The removal of the
inflammation and associated oxidative stress, results in a stronger recovery of
TAOC locally in smokers, despite apparently greater residual inflammation
post-therapy.
Care must be taken when interpreting the results as the enhanced
chemiluminescence assay used within the current study has been shown to
be sensitive to uric acid, vitamins A, C and E with proteins having a low
influence on derived TAOC (Maxwell et al 2006). The importance of the
compartmental nature of the body‟s antioxidant defences must also not be
over looked. Brock et al (2004) highlighted that the most influential
antioxidants in GCF were not the same as in serum or saliva, with uric acid

113
predominating in the latter, while reduced glutathione predominates in the
former (Chapple et al 2002, Brock et al 2004). The temptation is to
investigate the potential protective effect of individual antioxidant species, but
the analysis of isolated antioxidants from the TAOC could lead to
misinterpretation of results (Chapple et al 2006). The use of assays
assessing TAOC are advantageous as they analyse the combined
effectiveness of the contributing species and may take into account the
activities of hitherto undiscovered antioxidants or antioxidants that are difficult
to measure, whilst being more efficient, cheaper and less time consuming to
perform (Maxwell et al 2006). However, their failing is their sensitivity to
individual species and they may therefore not reflect the activities of certain
antioxidants within a particular body system, for example the ECL assay used
in the current study is poorly sensitive to GSH (Maxwell et al 2006) a major
antioxidant in GCF.
The plasma TAOC concentrations were similar pre-treatment and post-
treatment (p=NS). The periodontitis group A‟s plasma TAOC concentration
almost reached significantly lower levels than their respective healthy control
group A at baseline, demonstrating a mild antioxidant compromise in plasma
in the periodontitis cohort. Other studies by Pavlica et al 2004 and Baltacioğlu
et al 2006, also demonstrated significantly lowered plasma or serum TAOC
concentration, however these studies were possibly under powered as they
only involved small numbers of volunteers and did not take gender into
account, Baltacioğlu‟s study only involved female subjects (Chapple et al
2006). The small and insignificant changes seen in the current study are
likely to lack clinical relevance, given their low concentrations relative to those
of GCF in health.
In conclusion, the longitudinal data reported here suggest the reduced
protective effect of local (GCF) antioxidant capacity in volunteers with
periodontal disease, particularly those who use tobacco, results from the
periodontal inflammatory lesion, rather than predisposing to it, and following
successful therapy GCF TAOC concentrations returns to levels seen in
healthy controls. Smokers may in fact have an up-regulated antioxidant

114
defence system to act as a compensatory protective mechanism to deal with
the additional local oxidative stress. However these data can not preclude the
possibility that constitutional deficiencies in individual antioxidant species not
assessed by the ECL assay may underpin damage in periodontitis, nor can it
determine whether boosting levels of specific antioxidant may afford
protection against tissue damage medicated by oxidative stress in the
periodontal inflammatory lesion.

115
5. Site specific longitudinal investigations:
Local total antioxidant capacity
5.1. Context
The longitudinal data in chapter 4 demonstrated a possible compensatory
mechanism, up-regulation of antioxidant defences, in smokers to protect
against the additional oxidative stress caused by the periodontal inflammatory
response compared to non-smokers with periodontitis. Due to the site
specific nature of periodontitis further investigation was warranted into the
differences in antioxidant capacity between initially deep versus initially
shallow sites following a course of non-surgical periodontal therapy within the
smokers group. The environment of deep pockets is more anaerobic than
shallow pockets. Research also suggests that smokers are exposed to more
free radicals from their smoking habit (Pryor et al 1983) as well as possessing
reduced antioxidant defences (Alberg 2002).
5.2. Clinical and demographic data
The twenty smokers with periodontitis (2.2.2.1) from the longitudinal study were
assessed to analyse differences in TAOC in sites with deeper periodontal
probing depths relative to clinically shallow and healthy sites. This volunteer
group contained 14 females and 6 males, with a mean age of 44.6yrs (+8.3)
and a range of 23 – 65 yrs.
Significant changes were seen in all the clinical parameters measured in the
smokers as a result of the non-surgical periodontal therapy after a three
month healing period (table 5.1). All probing depth measurements were seen
to significantly decrease; 0.82mm +0.40 Full mouth (p<0.0001), 1.05mm
+0.86 Index sites (2.4.2.1, p<0.0001), 1.54mm +0.84 Deep sites (2.4.2.2,
p<0.0001) and 0.31mm +0.35 Shallow sites (2.4.2.3, p=0.001). The Deep sites
showed a significantly greater resolution in probing pocket measurements, as

116
would be expected, compared to the Full mouth measures (p=0.004), Index
sites (p=0.069) and Shallow sites (p<0.0001) (Fig 5.1).
Table 5.1.: Clinical demographics for the smokers with periodontitis plus the TAOC nM Trolox
equivalent per 30second sample for sites sampled
Full Mouth Index sites Deep sites Shallow sites
Baseline Review Baseline Review Baseline Review Baseline Review
Probing depths
(mm) mean +SD
3.83
+0.71
3.01
+0.48
4.63
+1.04
3.58
+0.93
6.04
+0.68
4.49
+0.80
2.58
+0.28
2.26
+0.43
Recession (mm)
mean +SD
0.72
+0.50
0.94
+0.55
0.45
+0.51
0.73
+0.68
0.56
+0.63
0.93
+0.82
0.96
+0.80
1.11
+0.91
CAL (mm)
mean +SD
4.08
+0.85
3.34
+0.88
5.08
+1.11
4.32
+1.07
6.61
+0.78
5.42
+0.92
3.56
+0.87
3.39
+0.96
GCF vol (µl)
mean +SD - -
0.45
+0.18
0.31
+0.11
0.61
+0.21
0.36
+0.18
0.16
+0.08
0.16
+0.07
TAOC (nM
Trolox/30sec)
mean +SD
- - 0.30
+0.27
0.33
+0.36
0.22
+0.17
0.39
+0.44
0.16
+0.10
0.27
+0.37
Fig 5.1.: Mean reduction in probing pocket depth (PPD, +SEM) following non-surgical therapy
& 3 months healing period
The recession measurements were seen to significantly increase at all sites
measured (table 5.1, fig 5.2); 0.21mm +0.16 Full mouth (p<0.0001), 0.28mm

117
+0.30 Index sites (p<0.0001), 0.36mm +0.39 Deep sites (p<0.001) and
0.15mm +0.34 Shallow sites (p<0.07). The deep sites showed non-
significantly greater recession following treatment compared to the full mouth
means (p=0.126) and the shallow sites (p=0.65), but the recession increase
seen in these sites was not significantly different to the index sites (p=0.65).
Fig 5.2: Mean changes in recession (REC, +SEM) following non-surgical therapy & 3 months
healing period
When probing pocket depths and recession were examined in combination as
“clinical attachment loss”, significant improvements were seen in all sites
measured as would be expected following successful non-surgical therapy
(table 5.1, fig 5.3); 0.73mm +1.18 full mouth (p=0.012), 0.76mm +0.73 index
sites (p<0.0001), 1.19mm +0.69 deep sites (p<0.0001) and 0.17mm +0.39
shallow sites (p=0.064).
Fig 5.3: Mean gain in clinical attachment loss (CAL, +SEM) following non-surgical therapy & 3
months healing period

118
The greatest improvement in clinical attachment level was seen at deep sites,
as expected, this improvement exceeded that for full mouth means (p<0.015),
index sites (p=0.063) and shallow sites (p<0.0001).
The GCF volumes per 30 second sample were seen to significantly reduce in
both the index sites 0.14µls +0.15 (p<0.001) and the deep sites 0.24µls +0.19
(p<0.0001), whereas no change was seen in the shallow sites, despite the
small but significant reduction in probing pocket depth within these sites. The
reduction in GCF volumes was however not significantly different between the
deep sites compared to the index sites (p=0.68).
Fig 5.4: Mean reduction in GCF volumes per 30 seconds (+SEM) following non-surgical
therapy & 3 months healing period
No correlation was seen between the reduction in pocket probing depth and
GCF volumes at the index sites (p=0.56, R2=0.02, r=0.14) or at the deep sites
(p=0.106, R2=0.14, r=0.37).
5.3. Total antioxidant capacity (TAOC)
5.3.1. GCF TAOC per 30 second sample
All sites sampled for GCF were assayed for TAOC, with the exception of one
of the volunteer‟s index sites due to a technical problem with the baseline
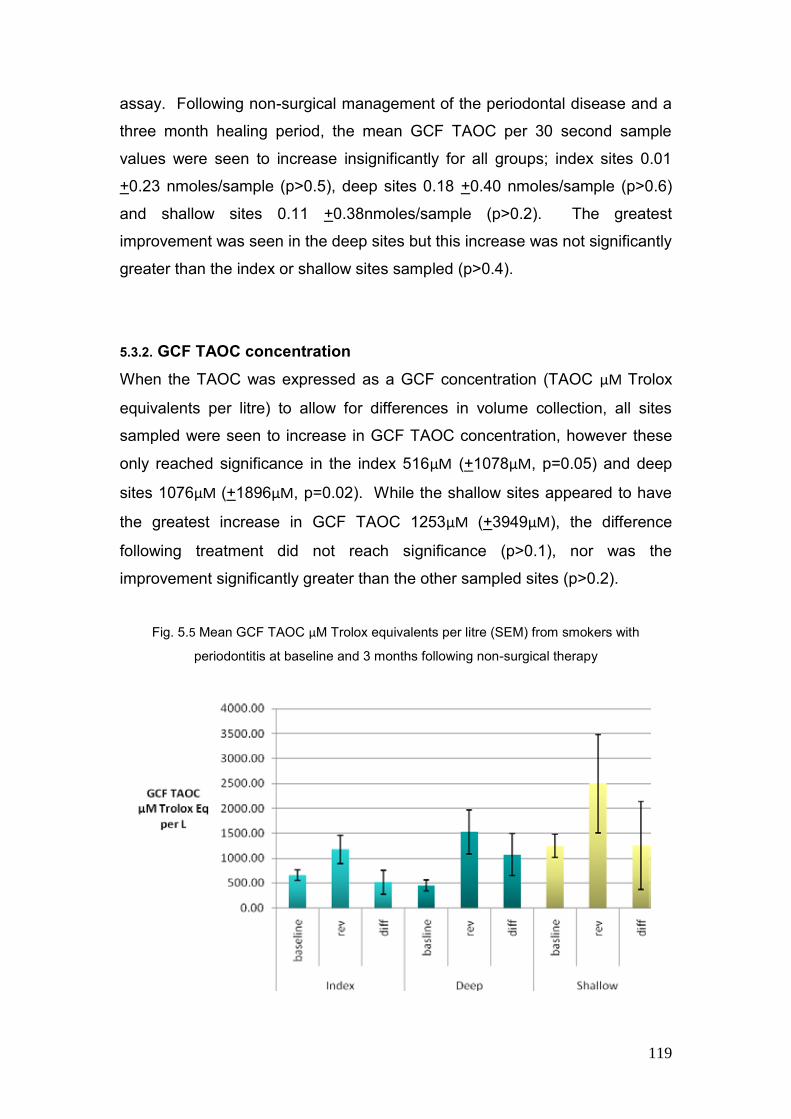
119
assay. Following non-surgical management of the periodontal disease and a
three month healing period, the mean GCF TAOC per 30 second sample
values were seen to increase insignificantly for all groups; index sites 0.01
+0.23 nmoles/sample (p>0.5), deep sites 0.18 +0.40 nmoles/sample (p>0.6)
and shallow sites 0.11 +0.38nmoles/sample (p>0.2). The greatest
improvement was seen in the deep sites but this increase was not significantly
greater than the index or shallow sites sampled (p>0.4).
5.3.2. GCF TAOC concentration
When the TAOC was expressed as a GCF concentration (TAOC µM Trolox
equivalents per litre) to allow for differences in volume collection, all sites
sampled were seen to increase in GCF TAOC concentration, however these
only reached significance in the index 516µM (+1078µM, p=0.05) and deep
sites 1076µM (+1896µM, p=0.02). While the shallow sites appeared to have
the greatest increase in GCF TAOC 1253µM (+3949µM), the difference
following treatment did not reach significance (p>0.1), nor was the
improvement significantly greater than the other sampled sites (p>0.2).
Fig. 5.5 Mean GCF TAOC µM Trolox equivalents per litre (SEM) from smokers with
periodontitis at baseline and 3 months following non-surgical therapy

120
The GCF TAOC concentration for the shallow sites sampled in the smokers
with periodontitis at baseline were not significantly different from those of the
non-smoking healthy control groups A and B (p>0.9). Following non-surgical
management of the periodontal disease the GCF TAOC doubled in the
shallow sites of the smokers, but this was still not significantly greater than the
healthy control groups A and B (p>0.2).
Fig. 5.6 Mean GCF TAOC µM Trolox equivalents per litre (SEM) from healthy control groups
A and B plus smokers with periodontitis (baseline)
The GCF TAOC concentration of the smokers with periodontitis at index sites
was significantly lower than the healthy control group A (p<0.0001) and
returned to similar levels to those of the control group following non-surgical
management of the periodontal disease. The GCF TAOC concentrations at
deep sites were significantly lower at baseline than both the non-smokers with
periodontitis group B and the healthy control group B (p<0.02). These deep
sites also returned to levels similar as the control groups following non-
surgical management.
Removal of the four ex-smokers, who quit during the healing phase, from the
analysis had no bearing on any of the GCF TAOC concentration data for any
of the comparisons.

121
5.4. Discussion
This is the first longitudinal study to investigate how local (GCF) total
antioxidant capacity in smokers with periodontal disease is influenced by a
reduction in periodontal inflammation following non-surgical therapy with
particular attention to the site specific nature of the disease.
All clinical parameters assessed were seen to improve in the smokers with
periodontal disease following non-surgical management of the periodontitis
but to a lesser extent than the non-smokers with periodontitis as would be
expected (Kinane & Chestnutt 2000). The four subjects that quit smoking
during the healing phase of treatment had no influence on the resultant
clinical improvements. The 20% cessation rate within the smokers with
periodontal disease group is greater than normally seen in the dental setting
with brief interventions and exceeds figures normally achieved by the
intensive support of the NHS Stop Smoking Service (West et al 2000). This
may be explained by the close and regular contact with the volunteers
throughout treatment and the nature of the secondary care referral for their
periodontal disease, which may equate to a greater level of motivation.
Within this study the GCF TAOC concentration at deep or index sites in the
smokers with periodontitis increased to similar levels found in the
periodontally healthy control groups A & B, suggesting that the total
antioxidant compromise seen at baseline may result from the inflammatory
lesion, rather than predispose to it. These data are consistent with the
literature (Chapple et al 2007). Furthermore, the significantly lower GCF
TAOC concentration seen in smokers at baseline compared to disease
matched non-smokers with periodontitis group B (p=0.02), indicated a further
compromise of GCF TAOC possibly due to the local impact of the additional
ROS created through their use of tobacco both chronically and acutely
(Palmer et al 2005, Pryor et al 1983). As the GCF TAOC concentration in the
smokers recovered to the same level as the healthy control groups, it is
proposed that the main contributor for this antioxidant reduction was the
additional oxidative stress from the periodontal lesion and that the recovery of

122
local antioxidant status was not influenced by the increased ROS exposure
locally created from their tobacco habit. It was hypothesised in chapter four
that smokers may have a compensatory protective mechanism to deal with
the additional local oxidative stress, whereby antioxidant systems are up-
regulated. This theory may be further strengthened as the shallow sites
sampled within the smokers displayed similar GCF TAOC concentrations to
the healthy control groups and, following non-surgical management, levels
increased to non-significantly higher levels. This type of compensatory factor
is seen in individuals with chronic obstructive pulmonary disease (COPD),
where smoking is a major factor in the pathogenesis of the disease, yet
increased levels of glutathione (GSH) as seen in the lung epithelial lining fluid
in chronic smokers, whereas in acute smoking levels are depleted (Rahman &
MacNee 1999).
In conclusion, the longitudinal data reported here suggest the reduced
protective effect of local (GCF) antioxidant capacity in volunteers with
periodontal disease who use tobacco results from the periodontal
inflammatory lesion. Smoker‟s antioxidant defences return to the levels seen
in healthy individuals following successful therapy and suggest a possible up-
regulation of antioxidant defence systems as a compensatory protective
mechanism to deal with the additional local oxidative stress inflicted by their
smoking habit.

123
GENERAL DISCUSSION AND
CONCLUSION

124
6. General discussion and conclusions
In periodontitis the host response to microbial plaque is designed to protect
the individual; however some collateral tissue damage is unavoidable. The
persistence of plaque at or below the gingival margin results in a chronic
inflammatory response, which in the susceptible host, results in tissue
damage if it remains unresolved. A central feature of the inflammatory
process is the recruitment of phagocytic cells, such as neutrophils and
macrophages. The activity of these cells results in production of superoxide
and other reactive oxygen species (ROS) during a non-mitochondrial
respiratory burst via NADPH oxidase. It follows that most inflammatory
diseases are accompanied by an increase in ROS (Halliwell 1991),
nonetheless the presence of ROS in inflamed tissues does not mean they
play a role in the pathogenesis and disease progression, but they may simply
be a consequence of the inflammatory process. However, research suggests
that excessive or prolonged release of neutrophil enzymes and ROS are
believed to be responsible for the majority of host-tissue destruction in
periodontitis (Gustafsson et al 1997). While more recent studies have
demonstrated that peripheral neutrophils are both hyper-reactive to FCγ-
receptor stimulation and hyper-active even when unstimulated, releasing
excessive ROS in chronic periodontal disorders (Gustafsson et al 2006,
Matthews et al 2006, Matthews et al 2007).
To combat disproportionate ROS production the body possesses a variety of
antioxidant defence mechanisms, which act in concert. Their role is to protect
vital cell and tissue structures and bio-molecules from host-derived ROS as
well as those of parasitic origin (Chapple et al 1996), by removing them as
they form and repairing the damage they cause. A delicate balance exists
between antioxidant defence and repair systems and pro-oxidant mechanisms
of tissue destruction, and if the balance is tipped in favour of ROS activity,
significant tissue damage ensues (Chapple et al 2002).
125
Smoking has long been recognised as a risk factor for periodontal disease
and a great deal of research into the detrimental effects of tobacco smoking
have concluded that it has widespread systemic effects, many of which may
provide mechanisms that increase the individual patients susceptibility to
periodontal disease and affect their response to treatment, by stimulating
destructive/inflammatory responses and impairing protective/reparative
responses (Ryder 2007). Combustion of tobacco creates great numbers of
ROS in the oral cavity and may also affect systemic production from
inflammatory cells. The research on the effects of tobacco products on
neutrophil expression of ROS is rather inconsistent and some researchers
have suggested that tobacco constituents can exacerbate aspects of the
respiratory burst, enhancing the production of ROS (Iho et al 2003). An
increased priming effect has also been demonstrated increasing the
generation of oxygen radicals as well as up-regulation of other neutrophil
functions (Gustafsson et al 2000). Several studies have demonstrated lower
plasma concentrations of antioxidants in smokers in vivo (Alberg 2002) and a
decrease in serum antioxidant concentration has been negatively associated
with the prevalence of inflammatory periodontitis (Chapple et al 2006).
This thesis attempted to follow on from recent research into antioxidant
defences in patients with periodontal disease that demonstrated both a
reduced peripheral (plasma) and local (GCF) total antioxidant capacity (Brock
et al 2004). It utilises the same ECL assay (2.2.6.) to quantify TAOC both in
GCF and plasma to discover whether the compromised antioxidant defence
systems predispose to chronic periodontitis or result from the inflammatory
process, in both smokers and non-smokers with periodontitis.
The increased oxidative stress may be a primary result of ROS production or
a secondary consequence of decreased antioxidant protection. The cross-
sectional data presented here suggested a compromised GCF TAOC seen in
subjects with periodontitis, regardless of smoking status. These results were
comparable with the preliminary work carried out by Chapple et al (2002) and
Brock et al (2004), who both utilised the same sampling, storage and ECL
assay techniques as the current study. Only two other studies have

126
investigated the GCF TAOC GCF, while the research by Pavlica et al (2004)
on a breed of miniature dogs confirmed the above data, finding a significant
correlation between serum and GCF TAOC and gingival inflammation. The
work by Guarnieri and colleagues (1991) demonstrated spontaneous
generation of superoxide in GCF of periodontal subjects, but could not
demonstrate a difference in antioxidant scavenging capacity between subjects
with chronic adult periodontitis and healthy controls. Their collection method
for GCF, by crevice washing, plus storage of the samples at -20°C, both
oxygenated and allowed for rapid loss of scavenging antioxidants (Chapple et
al 1997), which may explain their difference in findings compared to the
subsequent research.
No studies have been carried out on GCF TAOC in smokers with
periodontitis, while minimal research has been carried out on some individual
antioxidants in GCF samples and reductions have been reported. Seri et al
(1999) demonstrated lower levels of vitamin C and non-significantly vitamin A
in periodontally healthy smokers. A single study by Bunduneli et al (2006) on
smoking and gingival inflammation on salivary antioxidant capacity, found no
change in salivary status and they suggested that analysis of GCF TAOC
would better address any imbalance in oxidants-antioxidants within the
periodontal tissues. The cross-sectional data presented here suggest that
smokers with periodontitis have a further compromised GCF TAOC compared
to age-, gender- and disease-matched non-smokers with periodontitis. This
further reduction in GCF TAOC may be explained by the additional local and
systemic ROS production associated with the tobacco habit, both chronically
and acutely (Pryor et al 1983, Palmer et al 2005).
The longitudinal data presented within this thesis suggest that the
compromised GCF TAOC concentration seen in periodontitis, regardless of
smoking status, is likely to be a secondary effect of the inflammatory lesion,
rather than predisposing to it, as following non-surgical management of the
periodontal inflammation GCF TAOC concentrations were seen to return to
levels similar to that of healthy controls. This work is in broad agreement with
the longitudinal data by Brock (2005) and Chapple et al (2007) on non-

127
smokers with periodontitis. Furthermore, the current data suggests an up-
regulated antioxidant defence system to act as a compensatory protective
mechanism in the smokers with periodontitis, as following therapy their GCF
TAOC was seen to recover and exceed that of the healthy controls despite
greater residual inflammation (as a poorer healing response was achieved as
would be expected due to their continued smoking habit). Though no studies
have been carried out on GCF TAOC longitudinally, parallels can be drawn
between the fluid lining the gingival crevice and that of the alveolar epithelial
lining fluid in the lungs, where increased levels of the antioxidant GSH are
seen in chronic smokers with COPD (Rahman & MacNee 1999).
The data for the peripheral (plasma) TAOC displayed a mild (insignificant)
reduction in antioxidant concentration within the non-smokers with
periodontitis. This is broadly in agreement with those studies that analysed
individual antioxidant scavengers in plasma, which indicate only mildly
compromised levels in periodontitis subjects compared to healthy control
subjects, with the exception of vitamin C in smokers which is further
compromised (Chapple & Matthews 2007). The limited studies on plasma
TAOC also indicate a mild antioxidant compromise in periodontitis subjects
(Brock et al 2004, Pavlica et al 2004 and Baltacioğlu et al 2006). However, no
research has been carried out on the plasma TAOC of smokers with
periodontitis. While individual antioxidants have been seen to be reduced, in
the current study the smokers with periodontitis were seen to have a non-
significantly higher plasma TAOC concentration than the control groups.
Following non-surgical management the small and insignificant changes seen
in the current study are likely to lack clinical relevance, given their low
concentrations relative to those of GCF in health.
The choice of total antioxidant assay within the current study must also be
considered, as there is a complex array of global antioxidant assays, all with
different specificities for different biological molecules in different tissue or
fluid compartments. While all assays assess either in vitro oxidative stress,
it‟s onset or the inhibition by antioxidants within the test sample, they all
produce different measures and differ in sensitivity to the known major

128
antioxidants. The ECL assay used within the current study is sensitive to uric
acid, vitamin A, C and E with proteins having a low influence on the derived
TAOC (Maxwell et al 2006). This sensitivity may lead to misinterpretation of
results as it may not reflect the activities of certain antioxidants within a
particular body system. GSH is a major antioxidant in GCF (Chapple et al
2002, Brock et al 2004) and the ECL assay used in the current study is poorly
sensitive to GSH (Maxwell et al 2006), therefore the choice of the ECL assay
may have impacted on our understanding of the pathogenic process induced
by tobacco smoking and the potential for possible future therapeutic
strategies.
In conclusion, the longitudinal data reported within this thesis indicate the
compromised local (GCF) antioxidant capacity seen in volunteers with
periodontal disease, principally those who use tobacco, results from the
periodontal inflammatory lesion and following successful therapy GCF TAOC
concentrations return to levels seen in healthy controls. It also indicates that
smokers with periodontitis may have up-regulated antioxidant defence
systems to act as a compensatory protective mechanism to deal with the
additional local oxidative stress. However, these data can not preclude the
possibility that constitutional deficiencies in individual antioxidant species not
assessed by the ECL assay may underpin damage in periodontitis, nor can it
determine whether boosting levels of specific antioxidants with therapeutic
interventions may afford protection against tissue damage mediated by
oxidative stress with the periodontal tissues.

APPENDICES: Periotron calibration – volumes “look-up” table
Publications arising directly from this thesis:
Brock et al 2004 Journal of Clinical Periodontology
Chapple et al 2007 Journal of Clinical Periodontology
Publications arising indirectly from this thesis:
Matthews et al 2007 Journal of Dental Research
Wright et al 2008 Journal of Immunology

Periotron Calibration - volume "look-up" table
Periotron Working Periotron Working Periotron Working Periotron Working
Reading Volume µl Reading Volume µl Reading Volume µl Reading Volume µl
1 0.004 51 0.27 101 0.688 151 1.09
2 0.008 52 0.28 102 0.7 152 1.1
3 0.012 53 0.287 103 0.707 153 1.243
4 0.016 54 0.293 104 0.714 154 1.386
5 0.02 55 0.3 105 0.721 155 1.529
6 0.026 56 0.303 106 0.728 156 1.672
7 0.033 57 0.306 107 0.735 157 1.815
8 0.039 58 0.309 108 0.742 158 1.985
9 0.04 59 0.312 109 0.749 159 1.2
10 0.046 60 0.315 110 0.756 160 1.23
11 0.052 61 0.318 111 0.763 161 1.26
12 0.058 62 0.32 112 0.77 162 1.3
13 0.06 63 0.34 113 0.777 163 1.33
14 0.064 64 0.35 114 0.784 164 1.36
15 0.068 65 0.36 115 0.791 165 1.4
16 0.072 66 0.37 116 0.798 166 1.45
17 0.076 67 0.38 117 0.8 167 1.5
18 0.08 68 0.39 118 0.807
19 0.086 69 0.4 119 0.814
20 0.092 70 0.42 120 0.821
21 0.098 71 0.427 121 0.828
22 0.1 72 0.437 122 0.835
23 0.103 73 0.44 123 0.842
24 0.106 74 0.447 124 0.849
25 0.109 75 0.454 125 0.856
26 0.112 76 0.46 126 0.863
27 0.115 77 0.47 127 0.87
28 0.12 78 0.48 128 0.877
29 0.13 79 0.487 129 0.884
30 0.14 80 0.494 130 0.891
31 0.144 81 0.5 131 0.898
32 0.148 82 0.51 132 0.9
33 0.152 83 0.52 133 0.91
34 0.156 84 0.53 134 0.92
35 0.16 85 0.54 135 0.93
36 0.17 86 0.55 136 0.94
37 0.18 87 0.56 137 0.95
38 0.184 88 0.57 138 0.96
39 0.188 89 0.58 139 0.97
40 0.192 90 0.6 140 0.98
41 0.196 91 0.608 141 0.99
42 0.2 92 0.616 142 1
43 0.21 93 0.624 143 1.01
44 0.22 94 0.632 144 1.02
45 0.226 95 0.64 145 1.03
46 0.232 96 0.648 146 1.04
47 0.24 97 0.656 147 1.05
48 0.246 98 0.664 148 1.06
49 0.253 99 0.672 149 1.07
50 0.26 100 0.68 150 1.08

REFERENCES: Acrwoth IN, Bailey B (1995). The Handbook of Oxidative Metabolism. Pub
ESA, Inc.
Ahluwalia J, Tinker A, Clapp LH, Duchen MR, Abramov AY, Pope S, Nobles M, Segal AW (2004). The large-conductance of Ca2+-actived K+
Channel is essential for innate immunity. Nature; 427: 853-858
Alberg A (2002). The influence of cigarette smoking on circulating
concentrations of antioxidant micronutrients. Toxicol; 180: 121-137
Alpagot T, Wolf LF, Smith QT, Tran SD (1996). Risk indicators for
periodontal disease in a racially diverse urban population. J. Clin.
Periodontol.; 23:982-988
Ames BN, Cathcart R, Schwiers, Hochstein P (1981). Uric acid an
antioxidant defence in humans against oxidant- and radical-caused aging and
cancer: a hypothesis. Proc. Natl. Acad. Sci.; 78: 6858-6862
Ames BN, Shigenaga MK, Hagen TM (1993). Oxidants, antioxidants and
the degenerative diseases of aging. Proc Natl Acad Sci; 90: 7915-7922
Armitage GC (1999). Development of a classification system for periodontal
disease and conditions. Ann Periodontol; 4: 1-6
Azzi A, Ricciarelli R, Zingg JM (2002). Non-antioxidant molecular functions
of α-tocopherol (vitamin E). FEBS Lett; 519: 8-10
Baab DA, Oberg PA (1987). The effects of cigarette smoking on gingival
blood flow in humans. J. Clin. Perio.; 14: 418-424
Baltacioğlu E, Akalin FA, Alver A, Balaban F, Ünsal M, Karabulut E (2006). Total antioxidant capacity and superoxide dismutase activity levels in
serum and gingival crevicular fluid in post-menopausal women with chronic
periodontitis. J. Clin. Perio.; 33: 385-392
Battino M, Bullon P, Wison M, Newman H (1999). Oxidative injury and
inflammatory periodontal disease: The challenge of anti-oxidants to free
radical and reactive oxygen species. Oral Biol. Med.; 10: 458-476
Beckman JS, Beckman TW, Chen J, Marshall PA, Freeman BA (1990). Apparent hydroxyl radical production by peroxynitrite: Implications for
endothelial injury from nitric oxide and superoxide. Med Sci.; 87: 1620-1624
Beckman JS, Koppenol WH (1996). Nitric oxide, superoxide and perynitrite:
the good, the bad and ugly. Am. J. Physiol.; 271: 1424-1437
Benhammou K, Lee M, Strook M, Sullivan B, Logel J, Raschen K, Gotti C, Leonard S (2000). Nicotine binding in peripheral blood cells of smoker is
correlated with the number of cigarettes smoked per day. Neuropharmacol.; 39: 2818-2829
Benzie IF, Stain JJ (1996). The ferric reducing ability of plasma (FRAP) as a
measure of “antioxidant power”: the FRAP assay. Anal. Biochem.; 239: 70-76
Bergendi L, Beneŝ L, Ďuračková Z, Ferenčik M (1999). Chemistry,
physiology and pathology of free radicals. Life Sci.; 65: 1865-1874
Bergstrom J (1981). Short-term investigation on the influence of cigarette
smoking upon plaque accumulation. Scand. J. Dent. Res.; 89: 235-238
Bergstrom J, Bostrom L (2001). Tobacco smoking and peripheral
hemorrhagic responsiveness. J. Clin. Perio.; 28: 680-685

Bergstrom J, Preber H (1986). Influence of cigarette smoking on the
development of experimental gingivitis. J. Perio. Res.; 21: 668-676
Berlett BS Stadtman ER (1997). Protein oxidation in aging, disease and
oxidative stress. J. Biol. Chem.; 272: 20313-20316
Binger CAL, Fauklner JM, Moore RL (1927). Oxygen Poisoning in
Mammals. J. Exp. Med. 45: 849-864
Blake DR, Allen RE, Lunec J (1987). Free radicals in biological systems – a
review orientated to inflammatory process. Brit. Med. Bull.; 43: 371-385
Bostrom L, Bergstrom J, Dahlen G, Linder LE (2001). Smoking and
subgingival microflora in periodontal disease. J. Clin. Perio.; 28: 212-219
Brock G (2005). The role of antioxidants in the inflammatory periodontal
diseases. PhD Thesis
Brock G, Matthews JB, Butterworth CJ, Chapple ILC (2004). Local and
systemic total antioxidant capacity in periodontits and health. J. Clin. Perio.;
31: 515-521
Buduneli N, Kardeşler L, Işik H, Willis CS, Hawkins SI, Kinane DF, Scott DA (2006). The effects of smoking and gingival inflammation on salivary
antioxidant capacity. J. Clin. Perio.; 33: 159-164
Cadenas E, Davies KJA (2000). Mitochondrial free radical generation,
oxidative stress and aging. Free Rad. Biol. Med.; 29: 222-230
Çanakçi CF, Çiçeki Y, Çanakçi V (2005). Reactive oxygen species and
human inflammatory periodontal diseases. Biochem. (Moscow); 70: 619-628
Carlsson J (1987). Salivary peroxidise: an important part of our defence
against oxygen toxicity. J. Oral Path.; 16: 412-416

Chamulitrat W, Strmmel W, Kawahara T, Rokutan K, Fujii H, Wingler K, Schmidt HHHW, Schmidt R (2004). A constitutive NADPH Oxidase-like
system containing gp91phox homologs in human keratinocytes. J. Invest.
Dermatol.; 122: 1000-1009
Chang YC, Hseih YS, Lii CK, Huang, FM, Tai KW, Chou MY (2003). Induction of c-fos expression by nicotine in human periodontal ligament
fibroblasts is related to cellular thiol levels. J. Perio.. Res.; 38: 44-50
Chang YC, Huang FM, Tai KW, Yang LC, Chou MY (2002). Mechanism of
cytotoxicity of nicotine in human periodontal fibroblast cultures in vitro. J.
Perio. Res.; 37: 279-285
Chapple ILC (1996). Role of free radical and antioxidants in the pathogenisis
of inflammatory periodontal disease. J. Clin. Pathol.: Mol Pathol.; 49: M247-
M255
Chapple ILC (1997). Reactive oxygen species and antioxidants in
inflammatory disease. J. Clin. Periodontol.; 24: 287-296
Chapple ILC, Brock G, Eftimiadi C, Matthews JB (2002). Glutathione in
gingival crevicular fluid and it’s relationship to local antioxidant capacity in
periodontal health and disease. J. Clin. Pathol.: Mol. Pathol.; 55: 367-373
Chapple ILC, Brock GR, Milward MR, Ling N, Matthews JB (2007). Compromised GCF total antioxidant capacity in periodontitis: cause or effect?
J. Clin. Perio.; 34: 103-110
Chapple ILC, Gilbert A (2002). Understanding Periodontal Disease:
Assesssment and Diagnostic Procedure in Practice. Pub:Quintessence
Publishing Co. Ltd

Chapple ILC, Landini G, Griffiths GS, Patel NC (1999). Calibration of the
Periotron 8000® and 6000® by polynomial regression. J. Perio. Res.; 34: 79-
86
Chapple ILC, Mason GI, Garner I, Matthews JB, Thorpe GH, Maxwell SR, Whitehead TP (1997). Enhanced chemiluminescent assay for measuring the
total antioxidant capacity of serum, saliva and crevicular fluid. Annals Clin.
Biochem.; 34: 412-421
Chapple ILC, Matthews JB (2007). The role of reactive oxygen and
antioxidant species in periodontal tissue destruction. Periodontol. 2000; 42: 1-
73
Chapple ILC, Milward MR, Deitrich T (2006). The prevalence of
inflammatory periodonitis is negatively associated with serum antioxidant
concentrations. J. Nutr.; 137: 657-664
Cheeseman KH, Slater TF (1993). An introduction to free radical
biochemistry. Brit. Med. Bull.; 3: 481-493
Chow CK, Thacker RR, Changchit C, Bridges RB, Rehm SR, Humble J, Turbek J (1986). Lower levels of vitamin C and carotenes in plasma of
cigarette smokers. J. Am. Coll. Nutr.; 5: 305-312
Cnubben NHP, Rietjens IMCM, Wortelboer H, van Zander J, van Bladeren PJ (2001). The interplay of glutathione-related processes in antioxidant
defense. Env. Tox. Pharma.; 10: 141-152
Cobb CM (1996). Non-surgical pocket therapy: mechanical. Ann
Periodontol.; 1: 443-490
Cobb CM (2002). Clinical significance of non-surgical periodontal therapy: an
evidence-based perspective of scaling and root planning. J. Clin. Perio.; 29
(supp 2): 6-16
Conner EM, Grisham MB (1996). Inflammation, free radical and
antioxidants. Nutrition; 12: 274-277
Cope G, Thorpe G, Holder R, Luesley D, Jordan J (1999). Serum and
tissue antioxidant capacity in cervical intra-epithelial neoplasia investigated
using enhanced chemiluminescent reaction. Ann. Clin. Biochem.: 36: 86-93
Cuzzocrea S, Riley DP, Caputi AP, Salvemini D (2001). Antioxidants
Therpay: A new pharmacological approach in shock, inflammation and
ischemia/reperfusion injury. Pharmacol. Rev.; 53: 135-159
Darby IB, Hodge PJ, Riggio MP, Kinane DF (2000). Microbial comparison
of smokers and non-smokers adult and early-onset periodontitis patients by
polymerase chain reaction. J. Clin. Perio.; 27: 417-424
Darby IB, Hodge PJ, Riggio MP, Kinane DF (2005). Clinical and
microbiological effect of scaling and root planning in smoker and non-smoker
chronic and aggressive periodontitis patients. J. Clin. Perio.; 32: 200-206
Darr D, Fridovich I (1994). Free radicals in cutaneous biology. J Invest.
Dermatol.; 102: 671-675
Dean RT, Shanlin FU, Stocker R, Davis MJ (1997). Biochemistry and
pathology of radical-mediated protein oxidation. Biochem J.; 324: 1-18
Dietrich M, Block G, Norkus EP, Hudes M, Traber MG, Cross CE, Packer L (2003). Smoking and exposure to environmental tobacco smoke decrease
some plasma antioxidants and increases γ-tocopherol in vivo after adjustment
for dietary antioxidant intakes. Am. J. Clin. Nutr.;77: 160-166
Dodeigne C, Thunus L Lejeune R (2000). Chemiluminescence as a
diagnostic tool. A review. Talanta; 51: 415-439
el-Saadani M, EsterbauerH, el-Sayed M, Goher M, Nasser AY, Jürgens G (1989). A spectrophotometric assay for lipid peroxides in serum lipoproteins
using a commercially available reagent. J. Lipid Res.;30: 627-630
Fredriksson M, Gustafsson A, Åsam B (2002). Il-8 and TNF-alpha from
peripheral neutrophils and acute-phase proteins in periodontitis. J. Clin.
Perio.; 29: 123-128
Fredriksson M, Gustafsson A, Åsam B, Bergstrom K (1998). Hyper-
reactive peripheral neutrophils in adult periodontitis: generation of
chemiluminescence and intracellular hydrogen peroxide after in vitro priming
and FcgammaR-stimulation. J. Clin. Perio.; 25: 394-398
Fuchs TA, Abed U, Goosmann C, Hurtwitz R, Schulze I, Wahn V, Weinraunch Y, Brinkmann V, Zychlinsky A (2007). Novel cell death
program leads to neutrophil extracellular traps. J. Cell Biol.; 176: 231-241
Gamal AY, Bayomy MM (2003). Effect of cigarette smoking on human PDL
fibroblasts attachement to periodontally involved root surface in vitro. J. Clin.
Perio.; 29: 123-128
Gerster H (1997). The potential role of lucopene for human health. J. Am.
Coll. Nutr.; 16: 109-126
Giles GI, Tasker KM, Collins C, Giles NM, O’Rourke E, Jacob C (2002). Reactive sulphur species: an in vitro investigation of the oxidation properties
of disulphide S-oxides. Biochem. J.; 364: 579-585
Goutoudi P, Diza E, Arvanitidou M (2004). Effect of periodontal therapy on
crevicular fluid interleukin-1beta and interkeukin-10 levels in chronic
periodontitis. J. Dent.; 32: 511-520
Griffiths HR, Lunec J (2001). Ascorbic acid in the 21st century – more than a
simple antioxidant. Envir. Toxi. Pharmacol.; 10: 173-182

Grootveld M, Halliwell B (1987). Measurement of allantoin and uric acid in
human body fluids. Biochem. J.; 243: 803-808
Grossi SG, Zambon JJ, Ho AW, Koch G, Dunford RG, Machtei EE, Norderyd OM, Grenco RJ (1994). Assessment of risk for periodontal
disease. I. Risk indicators for attachment loss. J. Perio.; 65: 260-267
Guarnieri C, Zucchelli G, Bernardi F, Csheda M, Valentini AF, Calandriello M (1991). Enhanced superoxide production with no changes of
antioxidant activity in gingival fluid of patients with chronic adult periodontitis.
Free Rad. Res. Comm.; 15: 11-16
Gustafsson A, Åsam B, Bergstrom K (1997). Priming response to
inflammatory mediators in hyperactive peripheral neutrophils from adult
periodontits. Oral Dis.; 3: 167-171
Gustafsson A, Åsam B, Bergstrom K (2000). Cigarette smoking as an
aggravating factor in inflammatory tissue-destructive disease. Increase in
tumor necrosis factor-alpha priming of peripheral neutrophils measured as
generation of oxygen radicals. Inter. J. Clin. Lab. Res.; 30: 187-190
Gustafsson A, Åsam B, Bergstrom K (2006). Hyper-reactive mononuclear
cells and neutrophils in chronic periodontitis. J. Clin. Perio.; 33: 126-129
Haffajee AD, Sockransky SS (2001). Relationship of cigarette smoking to
subgingival microbiota. J. Clin. Perio.; 28: 377-388
Haffajee AD, Sockransky SS, Smith C, Dibart S (1991). Microbial risk
indicators for periodontal attachment loss. J. Perio. Res.; 26: 293-296
Hall TJ, Schaeublin M, Jeker H, Fuller K, Chambers TJ (1995). The role of
reactive oxygen intermediates in osteoclastic bone resorption. Biochem.
Biophys. Res. Comm.; 207: 280-287

Halliwell B (1984). Oxygen toxicity, oxygen radicals, transition and metals
and disease. Biochem. J.; 219: 1-14
Halliwell B (1989). Tell me about free radicals, doctor: a review. J. Royal
Soc. Med.; 82: 747-752
Halliwell B (1991). Reactive oxygen species in living systems: source,
biochemistry and role in human disease. Am. J. Med.; 91: 14S-22S
Halliwell B (1994a). Free radicals and antioxidants: A personal view. Nutr.
Rev.; 52: 253-265
Halliwell B (1994b). Free radical, antioxidants and human disease: curiosity,
cause or consequence? The Lancet; 344: 721-724
Halliwell B (2000). Oral inflammation and reactive species: a missed
opportunity? Oral Dis.; 6: 136-137
Halliwell B (2006). Phagocyte-derived reactive species: salvation or suicide?
Trends in Biochem. Sci.; 31: 509-515
Halliwell B, Clement MV, Long LH (2000). Hydrogen peroxide in the human
body. FEBS Lett; 486: 10-13
Halliwell B, Gutteridge JMC (1986). Oxygen free radicals and iron in
relation to biology and medicine: some problems and concepts. Arch.
Biochem. Biophy.; 2: 501-514
Halliwell B, Gutteridge JMC (1989). Free radical biology and medicine, 2nd
edition. Oxford: Clarendon Press
Halliwell B, Gutteridge JMC (1990). The antioxidants of human extracellular
fluids. Arch. Biochem. Biophsy.; 280: 1-8

Halliwell B, Whiteman M (2004). Measuring reactive species and oxidative
damage in vivo and in cell cultures: how should you do it and what do the
results mean? Br. J. Pharmacol.; 142: 231-255
Handelman H (2001). The evolving role of carotenoids in human
biochemistry. Nutrition; 17: 818-822
Hansen IL, Iwamoto Y, Kishi T, Flokers K, Thompson LE (1976). Bioenergtics in clinincal medicine. IX. Gingival and leucocytic deficiencies of
coenzyme Q10 in patient with periodontal disease. Res. Comm. Chem.
Pathol. Pharmacol.; 14: 729-738
Henle ES, Linn S (1997). Formation, prevention and repair of DNA damage
by iron/hydrogen peroxide. J. Biol. Chem.; 272: 19095-19098
Hunt JV, Bottoms MA, MItchinson MJ (1993). Oxidative alterations in the
experimental glycation model of diabetes mellitus are due to protein-glucose
adduct oxidation. Some fundamental differences in proposed mechanisms of
glucose oxidation and oxidant production. Biochem. J.;291: 529-535
Iho S, Tanaka Y, Takauji R, Kobayashi C, Muramatsu I, Iwasaki H, Nakamura K, Sasaki Y, Nakao K, Takahashi T (2003). Nicotine induces
human neutrophils to produce IL-8 through the generation of peroxynitrite and
subsequent activation of NF-κB. J. Leukocyte Biol.; 74: 942-951
Imlay JA, Linn S (1988). DNA damage and oxygen radical toxicity. Science;
240: 1302-1309
Kinane DF, Attström R (2005). Advances in the pathogenesis of periodontits
consensus report of the fifth European workshop in periodontology. J. Clin.
Perio.; 32: 130-131
Kinane DF, Chestnutt IG (2000). Smoking and periodontal disease. Crit.
Rev. Oral Biol. Med.; 11: 356-365

Keothe S, Kuhnmuench JR, Becker CG (2000). Neutrophil priming by
cigarette smoke condensate and a tobacco anti-idiotypic antibody. Am. J.
Pathol.; 157: 1735-1743
Knight JA (1998). Free radicals: their history and current status in aging and
disease. Annals of Clin. Lab. Sci.: 26: 331-346
Kobayashi T, van der Pol–L, van der Winkel JGJ, Hara K, Sugits N, Westerdaal NAC, Yoshie H, Horigome T (2000). Relevance of IgG receptor
IIIb (CD16) polymorphism to handling of Porphoromonas gingivalis:
implication for pathogenesis of adult periodontitis. J. Perio. Res.; 35: 65-73
Krall EA, Dietrich T, Nunn ME, Garcia RI (2006). Risk of tooth loss after
cigarette smoking cessation. Prev. Chronic Dis.; 3(4): A115
Kricka LJ, Thorpe GHG (1983). Chemiluminescence and bioluminescence
methods in analytical chemistry. Analyst; 108: 1274-1296
Krinsky N (2001). Carotenoids as antioxidants. Nutrition; 17: 815-817
Kristoffersen T (1970). Periodontal conditions in Norwegian soldiers. An
epidemiological and experimental study. Scan. J. Den. Res.; 78: 34-53 Lebargy F, Benhammou K, Morin D, Zini R, Urien S, Bree F, Bignon J, Branellec A, Lagrue G (1996). Tobacco smoking induces expression of
very-high-affinity nicotine binding sites on blood polymorphonuclear cells.
Am. J. Repsir. Crit. Care Med.; 153: 1056-1063
Levine M, Dhariwal KR, Welch RW, Wang Y, Park JB (1995). Determination of optimal vitamin C requirements in humans. Am. J. Clin.
Nutr.; 62: 1347s-1356s

Lie MA, Timmerman MF, Van der Velden U, Van der Weijden GA (1998). Evaluation of 2 methods to assess gingival bleeding in smokers and non-
smokers in natural and experimental gingivitits. J. Clin. Perio.; 25: 695-700
Lindhe J (1997). Clinical Periodontology and Implant Dentistry, 3rd edition.
Pub:Munkskgaard
Littarru GP, Nakamura R, Ho L, Folkes K, Kuzell WC (1971). Deficiency of
Coenzyme Q10 in gingival tissue form patients with periodontal disease.
Proc. Nat. Acad. Sci.; 68: 2332-2335
Löe H, Theilade E, Jensen SB (1965). Experimental gingivitis in man. J.
Periodontol.; 36: 177-187
Lui CS, Chen HW, Lii CK, Chen SC, Wei YH (1998). Alteration of small-
molecular-weight antioxidants in the blood of smokers. Chemico-Biol.
Interactions; 116: 143-154
Lykkesfeldt J, Loft S, Neilson JB, Poulsen HE (1997). Ascorbic acid and
dehydroascorbic acid as biomarker of oxidative stress caused by smoking.
Am. Soc. Clin. Nutr.; 65: 959-963
Madianos PN, Bobetsis YA, Kinane DF (2005). Generation of inflammatory
stimuli: how bacteria set up inflammatory responses in the gingiva. J. Clin.
Perio.; 32: 57-71
Marsh PD (1991). Sugar, fluoride, pH and microbial homeostasis in dental
plaque. Proc. Finn. Dent. Soc.; 87: 515-525
Marsh PD (1994). Microbial ecology of dental plaque and its significance in
health and disease. Adv. Dent. Res.; 8: 263-271
Marsh PD (2005). Dental plaque: biological significance of a biofilm and
community life-style. J. Clin. Perio..; 32: 7-15

Matthews JB, Wright HJ, Roberts A, Cooper PR, Chapple ILC (2006). Hyperactivity and reactivity of peripheral neutrophils in chronic periodontitis.
Clin. Exp. Immunol.; 147: 255-264
Matthews JB, Wright HJ, Roberts A, Ling-Mountford N, Cooper PR, Chapple ILC (2007). Neutrophil hyper-responsiveness in periodontitis. J.
Dent. Res.; 86: 718-722
Maxwell SR, Dietrich T, Chapple ILC (2006). Prediction of serum total
antioxidant activity from concentration of individual serum antioxidants. Clin.
Chim. Acta.; 372: 188-194
McCord JM (2000). The evolution of free radical and oxidative stress. Am. J.
Med.; 108: 652-659
McCord JM, Fridovich I (1969). Superoxidase dismutase: an enzyme
function for erythrocuprein (hemocuprein). J. Biol. Chem; 244: 6049-6055 McLaughlin WS, Lovat FM, Macgregor ID, Kelly PJ (1993). The immediate
effects of smoking in gingival fluid flow. J. Clin. Perio.;20: 488-451
Meekin TN, Wilson RF, Scott DA, Ide M, Palmer RM (2000). Laser
Doppler flowmeter measurement of relative gingival and forehead skin blood
flow in light and heavy smokers during and after smoking. J. Clin. Perio.; 27: 236-242
Meier B, Radeke HH, Selle S, Younes M, Sies H, Resch K, Habermehl GG (1989). Human fibroblast release reactive oxygen species in response to
interleukin-1 or tumour necrosis factor-α. Biochem. J.; 263: 539-545
Meister A, Anderson ME (1983). Glutathoine. Ann. Rev. Biochem.; 52: 711-
760

Meyle J, Kapitza K (1990). Assay of ascorbic acid in human crevicular fluid
from clinically healthy gingival site by high performance liquid
chromatography. Arch. Oral Bio.; 35: 319-328
Miller NJ, Rice-Evans C, Davies MJ, Gopinathan V, Milner A (1993). A
novel method for measuring antioxidant capacity and its application to
monitoring the antioxidant status in premature neonates. Clin. Sci.; 84: 407-
412
Misra HP, Squatrito PM (1982). The role of superoxide in peroxidase-
catalysed chemiluminescence of luminol. Arch. Biochem. Biophys.; 215: 59-
65
Moilanen E, Vapaatalo H (1995). Nitric oxide in inflammation and immune
response. Ann. Med.; 27: 359-367
Moore S, Calder KA, Miller NJ, Rice-Evans CA (1994). Antioxidant activity
of saliva and periodontal disease. Free Rad. Res.; 21: 417-425
Morozumi T, Kubota T, Sato T, Okuda K, Yoshie H (2004). Smoking
cessation increases gingival blood flow and gingival crevicular fluid. J. Clin.
Perio.; 31: 267-272
Morris A, Steele J, White D (2001). The oral cleanliness and periodontal
health of UK adults in 1998. Brit. Dent. J.; 191: 186-192
Moughal NA, Adonogianaki E, Thornhill MH, Kinane DF (1992). Endothelial cell leucocyte adhesion molecule-1 (ELAM-1) and intercellular
adhesion molecule-1 (ICAM-1) expression in gingival tissue during health and
experimentally-induced gingivitis. J. Perio.. Res.: 27: 623-630
Niki E (1987). Interaction of ascorbate and α-tocopherol. Ann. NY Acad.
Sci.; 498: 186-199

Niki E (1990). Free radical initiators as source of water- or lipid-soluble
peroxyl radical. Methods Enzymol.; 186: 100-108
Niki E (1997). Mechanism and dynamic of antioxidant action of ubiquinol.
Molec. Asp. Med.; 18: s63-s70
Offenbacher S, Collins JG, Heasman PA (1993). Diagnostic potential of
host response mediators. Adv. Dent. Res.; 7: 175-181
Omenn GS, Goodman GE, Thornquist MD, Balmes J, Cullen MR, Glass A, Keogh JP, Meyskens FL, Valanis B, Williams JH, Barnhart S, Hammar S (1996). Effects of a combination of beta carotene and vitamin A on lung
cancer and cardiovascular disease. New Eng. J. Med.; 334: 1150-1155
Page RC, Offenbacher S, Schroeder HE, Seymour GJ, Korman K (1997). Advances in pathogenesis of periodontitis: summary of developments, clinical
implications and future directions. Periodontol. 2000, 14: 216-248
Page RC, Schroeder HE (1976). Pathogenesis of inflammatory periodontal
disease. A summary of current work. Lab. Invest.;34: 235-249
Palmer RM, Stapleton JA, Sutherland G, Coward PY, Wilson RF, Scott DA (2002). Effect of nicotine replacement and quitting smoking on circulating
adhesion molecule profiles (sICAM-1, sCD44v5, sCD44v6). Euro. J. Clin.
Invest.; 32: 852-857
Palmer RM, Wilson RF, Hasan HS, Scott DA (2005). Mechanism of action
of environmental factors – tobacco smoking. J. Clin. Perio.; 32: 180-195
Papapanou P (1999). Epidemiology of periodontal disease: an update. J.
Int. Acad. Periodontol.; 1: 110-116
Paster BJ, Olsen I, Aas JA, Dewhirst FE (2006). The breadth of bacterial
diversity in the human periodontal pocket and other oral sites. Peridontol.
2000; 42:80-87
Pauletto NC, Liede K, Nieminen A, Larjava H, Uitto VJ (2000). Effect of
cigarette smoking on oral elastase activity in adult periodontitis patients. J.
Periodontol.; 71: 58-62
Pavlica Z, Petelin M, Nemec A, Erzen D, Skaleric U (2004) Measurement
of total antioxidant capacity in gingival crevicular fluid and serum in dogs with
periodontal disease. Am. J. Vet. Res.; 65: 1584-1588
Persson L, Bergstrom J, Gustafsson A, Asman A (1999). Tobacco
smoking and gingival neutrophil activity in young adults. J. Clin. Perio.: 26: 9-
13
Persson L, Bergstrom J, Gustafsson A (2003). Effect of tobacco smoking
on neutrophil activity following periodontal surgery. J. Perio.: 74: 1475-1482
Preber H, Bergström J (1985). Occurrence of gingival bleeding in smoker
and non-smoker patients. Acta. Odontol. Scand.; 43: 315-320
Prior RL, Cao C (1999a). Antioxidant capacity and polyphenolic components
of teas: implications for altering in vivo antioxidant status. Proc. Soc. Exp.
Bio. Med.; 220: 255-261
Prior RL, Cao C (1999b). In vivo total antioxidant capacity: comparison of
different analytical methods. Free Rad. Biol. Med.; 27: 1173-1181
Pryor WA (1986). Oxy-radicals and related species: Their formation, lifetimes
and reactions. Ann. Rev. Physiol.; 48: 657-667

Pryor WA, Prier DG, Church DF (1983). Electron-spin resonance study of
mainstream and sidestream cigarette smoke: nature of the free radicals in
gas-phase smoke and in cigarette tar. Environ. Health Persp; 47: 345-355
Rahman I, MacNee W (1999). Lung glutathione and oxidative stress:
implications in cigarette smoke-induced airway disease. Am. J. Physiol.; 277:
L1067-L1088
Rice-Evans C (1999). Implication of the mechanisms of action of tea
polyphenols as antioxidants in vitro for chemoprevention in humans. Proc.
Soc. Exp. Biol. Med.; 220: 262-266
Rice-Evans C (2001). Flavonoid antioxidants. Current Med. Chem.; 8: 797-
807
Roberts A, Matthews JB, Socransky SS, Freestone PP, Williams PH, Chapple ILC (2005). Stress and the periodontal diseases: growth responses
of periodontal bacteria to Escherchia coli stress-associated autoinducer and
exogenous Fe. Oral Microbiol. Immunol.; 20: 147-153
Rumley AG, Peterson JR (1998). Analytical aspects of antioxidants and free
radicals activity in clinical biochemistry. Ann. Clin. Biochem.; 35: 181-200
Ryder MI (2007). The influence of smoking on host responses in periodontal
infections. Periodontol. 2000; 43: 267-277
Schectman G, Byrd JC, Gruchow HW (1989). The influence of smoking on
vitamin C status in adults. Am. J. Pub. Health; 79:158-162
Schwartz Z, Goultschin J, Dean DD, Boyan BD (1997). Mechanisms of
alveolar bone destruction in periodontitis. Periodontol 2000; 14: 158-172
Segal AW, Abo A (1993). The biochemical basis of the NADPH oxidase of
phagocytes. Trends Biochem. Sci.; 18: 43-47

Seri M, D’Alessandro A, Seri S (1999). The effects of cigarette on vitamin C
and vitamin E levels in gingival crevicular fluid. Boll. Soc. Ital. Biol. Sper.; 75:
21-25
Silver IA, Murrills RJ, Etherington DJ (1988). Microelectrode studies on
acid microenvironment beneath adherent macrophages and osteoclasts. Exp
Cell Res.; 175: 266-276
Skaleric U, Manthey CM, Mergenhagen SE, Gaspirc B, Wahl SM (2000). Superoxide release and superoxide dismutase expression by human gingival
fibroblasts. Eur. J. Oral Sci.; 108: 130-135
Socransky SS, Haffajee AD (1992). The bacterial aetiology of destructive
periodontal disease: current concepts. J. Periodontol; 63: 322-331
Socransky SS, Haffajee AD, Cugini MA, Smith C, Kent Jr. RL (1998). Microbial complexes in subgingival plaque. J. Clin. Perio., 25: 134-144
Söder B, Jin LJ, Wickholm S (2002). Granulocyte elastase, matrix
metalloproteinase-8 and prostaglandin E2 in gingival crevicular fluid in
matched clinical sites in smokers and non-smokers with persistent
periodontitis. J. Clin. Perio.; 29: 384-391
Sørensen LT, Neilsen HB, Kharazmi A, Gottrup F (2004). Effect of
smoking and abstention on oxidative burst and reactivity of neutrophils and
monocytes. Surg; 136: 1047-1053
Stoltenberg JL, Osborn JB, Pihlstrom BL, Herzberg MC, Aeppli DM, Wolff LF, Fischer GE (1993). Association between cigarette smoking,
bacterial pathogens, and periodontal status. J. Periodontol.;64:1225-1230
Svardal AM, Mansoor MA, Ueland PM (1990). Determination of reduced,
oxidized, and protein-bound glutathione in human plasma with percolumn

derivatization with mono-bromobimane and liquid chromatography. Ann.
Biochem.; 184: 338-346
Tapiero H, Townsend DM, Tew K (2004). The role of carotenoids in the
prevention id human pathologies. Biomed. Pharmacotherapy; 58: 100-110
Thorpe GHG, Kricka LJ (1986). Enhanced chemiluminescents reactions
catalysed by horseradish peroxidase. Methods Enzymol.; 133: 331-353
Thorpe GHG, Kricka LJ (1987). Enhanced chemiluminescence assay for
horseradish peroxidase; characteristics and applications. In Bioluminescence
and chemiluminescence, new perspectives (Schomerich J, Andreesen R,
Kapp A, Ernst M, Wood WG, Eds.). John Wiley & Sons, Chichester
Thorpe GHG, Kricka LJ, Moseley SB, Whitehead TP (1985a). Phenols as
enhancers of the chemiluminescents horseradish peroxidase-luminol-
hydrogen peroxide reaction; application in luminescence-monitored enzyme
immunoassays. Clin. Chem.;31: 1335-1341
Thorpe GHG, Moseley SB, Kricka LJ, Scott RA, Whitehead TP (1985b). Enhanced luminescence determination of horseradish peroxidase conjugates.
Anal. Chim. Acta; 170: 101-107
Tubaro F, Ghiselli A, Rapuzzi P, Maiorino M, Ursini F (1998). Analysis of
plasma antioxidant capacity by competition kinetics. Free Rad. Biol. Med.; 24:
1228-1234
Van Dyke TE, Levine MJ, Genco RJ (1985). Neutrophil function and oral
disease. J. Oral Pathol.; 14: 95-120
Waddington RJ, Moseley R, Embery G (2000). Reactive oxygen species: a
potential role in the pathogenesis of periodontal diseases. Oral Dis.; 6: 138-
151
Wang X, Quinn PJ (1999). Vitamin E and its function in membranes.
Progress in Lipid Res.; 38: 309-336
Webster NR, Nunn JF (1987). Molecular structure of free radicals and their
importance in biological reactions. Brit. J. Anaesth.; 60: 98-108
Weisburger JH (1999). Mechanisms of action of antioxidants as exemplified
in vegetables, tomatoes and teas. Food & Chem. Toxico.; 37: 943-948
West R, Mc Neill A, Raw M (2000) Smoking cessation guidelines for health
professionals: an update. Thorax; 55: 987-999 Whitehead TP, Kricka LJ, Carter TJN, Thorpe GHG (1979). Analytical
luminescence; it’s potential in clinical laboratory. Clin. Chem.; 25: 1531-1546
Whitehead TP, Thorpe GHG, Maxwell SRJ (1992). Enhanced
chemiluminescent assay for antioxidant capacity in biological fluids. Annal.
Chim. Acta.; 226: 265-277
Woodford F P, Whitehead T P (1998). Is measuring serum antioxidant
capacity clinically useful? Ann. Clin. Biochem.; 35: 48-56
Wright HJ, Matthews JB, Chapple ILC, Ling-Mountford N, Cooper PR (2008). Periodontitis associates with a type 1 IFN signature in peripheral
blood neutrophils. J. Immunol.; 181: 5775-5784
Yeum KJ, Russell RM, Krinsky NI, Aldini G (2004). Biomarkers of
antioxidant capacity in hydrophilic and lipophilic compartments of human
plasma. Arch. Biochem. Biophy.; 430: 97-103
Zappcosta B, Persichilli S, Minucci A, Di Stasio E, Carlino P, Pagliari G, Giardina B, De Sole P (2001). Effect of aqueous cigarette smoke extract on
the chemiluminescence kinetics of polymorphonuclear leukocytes and on their
glycolytic and phagocytic activity. Luminescence; 16: 315-319

Zappcosta B, Persichilli S, Mordente A, Minucci A, Lazzaro D, Meucci E, Giardina B (2002) Inhibition of salivary enzymes by cigarette smoke and the
protective role of glutathione. Human Exp. Toxicol.; 21: 7-11
Zappcosta B, Persichilli S, De Sole P, Mordente A, Giardina B (1999). Effect of smoking one cigarette on antioxidant metabolites in the saliva of
healthy smokers. Arch. Oral Biol.; 44: 485-488
Zilm PS, Bagely CJ, Rogers AH, Milne IR, Gully NJ (2007). The proteomic
profile of Fusobacterium nucleatum is regulated by growth pH. Microbiol.;
153: 148-159
Zondervan KT, Ocké MC, Smit HA, Seidell JC (1996). Do dietary and
supplementary intake of antioxidant differ with smoking status? Inter. J.
Epidemiol.; 25: 70-79


![Oxidative Stress and the Use of Antioxidants or Idiopathic ... · the causes remain unknown [ 3 ] . Oxidative stress (OS) is implicated in pathogenesis of 30 80% of male factor subfertility](https://img.pdfslide.net/doc/110x75/5e77928095677d46966f24b7/oxidative-stress-and-the-use-of-antioxidants-or-idiopathic-the-causes-remain.jpg)


![14] Antioxidants](https://img.pdfslide.net/doc/110x75/577ccfa61a28ab9e78904327/14-antioxidants.jpg)