Embed Size (px)
Citation preview

ELSEVIER Earth and Planetary Science Letters 125 (1994) 221-234
EPSL
The role of mantle-depletion and melt-retention buoyancy in spreading-center segmentation
Kopal Jha a, E.M. Parmentier a, Jason Phipps Morgan b a Department of Geological Sciences, Brown University, Providence, RI 02912, USA
b IGPP, University of California, San Diego, CA 92093, USA
Received November 30, 1993; revision accepted April 12, 1994
Abstract
Numerical experiments are used to examine the structure of mantle flow beneath the axis of a spreading center. Buoyancy results from the depletion of residual mantle in iron relative to magnesium as melt is extracted (mantle-depletion buoyancy) and from the presence of low-density melt (melt-retention buoyancy). 3-D buoyant mantle flow arises spontaneously from an initially 2-D solution for low mantle viscosity and low spreading rate. At high viscosity and high spreading rate, initially 2-D solutions remain 2-D. This may explain the fundamentally different structure of fast and slow spreading centers.
In a uniform viscosity halfspace, the along-axis wavelength of 3-D buoyant upwelling scales with the maximum depth of melting, the only length scale in this system. For reasonable maximum depths of melting (60-90 km), along-axis wavelengths of 200-300 km are preferred, longer than the 50-100 km segmentation length of slow spreading centers. In a viscosity-layered halfspace, the thickness of the asthenosphere introduces another length scale. A wavelength of segmentation comparable to the asthenosphere thickness also develops in our numerical experiments. This suggests the possibility that a wavelength corresponding to the spacing between gravity lows may be controlled by the asthenosphere thickness, while the spacing of major fracture zones corresponds to the longer wavelength (= 3 times the maximum depth of melting) intrinsic to the melting region.
The along-axis structure of 3-D flow varies from narrow, focused upwellings, at low spreading rates and mantle viscosities, to broad regions of upwelling at high spreading rates and mantle viscosity. To allow an along-axis crustal thickness variation no larger than that which is observed (= 3-4 km), the highly focused upwelling and crustal production predicted at slow spreading rates requires appreciable along-axis transport of melt.
1. Introduct ion
The character of along-axis variations in spreading center s tructure is spreading-rate de-
[uc]
penden t [1-3]. In general, fast spreading centers have much less along-axis variability in topogra- phy, much smaller gravity anomalies, and fewer axial discontinuities than slow spreading centers. The development of axial discontinuities has been at tr ibuted to stresses in a brittle-elastic litho- sphere [4,5], to the buoyant rise of melt [6,7] and
0012-821X/94/$07.00 © 1994 Elsevier Science B.V. All rights reserved SSDI 0012-821X(94)00081-9

222 K. Jha et al. /Earth and Planetary Science Letters 125 (1994) 221-234
buoyant flow in the solid mantle [8,9]. In this study we further examine the role of buoyant mantle flow in spreading center segmentation to determine more accurately the predicted charac- ter and length of segmentation and its depen- dence on spreading rate and mantle viscosity.
Mantle flow beneath spreading centers can be considered the sum of flow contributions due to plate spreading, mantle compaction associated with melt extraction and buoyancy. Plate spread- ing generates a large-scale flow field, upon which flow due to buoyancy and compaction are super- imposed. As melt is extracted from the mantle, the solid mantle compacts to take up the lost volume. This results in dilatational flow of the solid mantle at a rate equal to the volume-rate of melt extracted. Since the scale of dilatational flow depends on the size of the region over which melt is extracted, it is localized to a region surrounding that in which melting occurs.
Buoyant flow is driven by density differences arising from variations in the amount of melt present in the mantle (melt-retention), mantle composition due to melt extraction (mantle-de- pletion) and thermal expansion due to tempera- ture variations (thermal). The presence of low- density melt in the mantle creates melt-retention buoyancy forces localized to the scale of the melting region. The role of melt-retention buoy- ancy has been examined in the 2-D spreading center models of Buck and Su [10], Scott and Stevenson [11], Scott [12], and Cordery and Phipps Morgan [13,14]. Mantle depletion buoyancy arises due to the extraction of melt from the mantle, primarily resulting from the decreased F e / M g ratio of the residual mantle [15]. The buoyant layer of depleted residual mantle created beneath the spreading axis results in a stably stratified mantle away from the axis. Beneath the spread- ing axis, it inhibits the recirculation of previously melted mantle through the melting region [11,16].
Two-dimensional models including both ther- mal buoyancy and mantle-depletion buoyancy show that thermal buoyancy becomes more im- portant as the thermal boundary layer at the top of the spreading mantle thickens away from the spreading axis [16]. Thermal instabilities develop as cooling penetrates through the buoyant de-
pleted mantle layer created beneath the spread- ing center. In contrast to melt-retention buoy- ancy, thermal buoyancy is not localized beneath the spreading axis. Therefore, the scale of flow driven by thermal buoyancy is strongly influenced by factors other than the size of the melting region, such as the depth dependence of mantle viscosity. In numerical experiments, which must be carried out in a region of finite size, it is important to ensure that the size of the region does not control the scale of thermal convection. A recent study of 3-D mantle flow including both mantle-depletion and thermal expansion buoy- ancy [9] shows that at low and intermediate spreading rates, thermal density variations within a low-viscosity asthenosphere create convective rolls perpendicular to the spreading axis. The distance from the axis at which these rolls form depends on the spreading rate. For a reasonable mantle viscosity, the onset distance of the rolls increases from 200 to 800 km as spreading rate increases from 2 to 6 cm/yr .
The present study focuses on the role of melt- retention and mantle-depletion buoyancy. We ne- glect the contribution of thermal buoyancy to flow because, except at slow spreading rates, along-axis variations due to thermal buoyancy develop away from the spreading axis. We ex- plore the spreading rate, mantle viscosity and melt migration permeability conditions under which these melting-related sources of buoyancy lead to along-axis variations in upwelling and crustal production. This follows an earlier study [8] which showed that buoyant flow due solely to mantle-depletion causes strong along-axis varia- tions in upwelling to develop beneath the axis at low spreading rates.
2. Basic equations
The equations we solve conserve energy (Eq. 1) and mass (Eq. 2), enforce mechanical equilib- rium (Eq. 3), and create and advect depletion (Eq. 4):
aT p C p - ~ = k V 2 T - p C p u " V T - p L ~ l (1)

1~ Jha et al. / Earth and Planetary Science Letters 125 (1994) 221-234 223
V "~ = - /~/ (2)
. v 2 ~ = Vp + p ( ~ , ~)~, (3) a~ - - + ~" V~ = f i t (4) at
where p and Cp = density and specific heat at constant pressure; T - t e m p e r a t u r e ; t = time; = mantle velocity; k = thermal conductivity; L = latent heat of melting; fit = melting rate; 7p = the pressure gradient; ~ - - t h e acceleration due to gravity; and ~ = the degree of mantle depletion resulting from melt extraction.
Eq. (1) states that the rate of change in tem- perature depends on advection and conduction of heat and on the contribution of heat to melting. Eq. (2) requires that the volume of solid mantle lost by melt extraction be replaced by surround- ing mantle. Eq. (3) balances forces arising from viscous stresses and the pressure gradient with buoyancy forces. Eq. (4) says that the material derivative of depletion in a parcel of mantle is equal to its melting rate. The depletion parame- ter ~ thus records the volume fraction of melt that has been extracted from a parcel of mantle. The rate of melt production is given by:
D T - T s o | i d u s " fit = - - (5)
D t L / C v
where:
Tsolidus D / D t =
l l00(°C) + 3.25 -z(km) (6)
the material derivative; L = the latent heat of melting (600 kJ/kg); and Cp = specific heat (1 k J /kg °C). Density depends on both the amount of melt extracted and the amount of melt present:
p = p0(1 - fl~:) - Ap~b (7)
where P0 = the density of primitive (unmelted) mantle (3300 kg/m3); p0/3~ = the density change due to mantle depletion; apq5 = t h e density change due to melt retention; Ap = the density difference between the mantle and melt (330 kg/m3); and & = the amount of melt present in the mantle. The factor/3 determines the variation in density with mantle depletion, primarily ac- counting for the change in F e / M g of peridotite
with melt extraction. The value o f /3 used in our calculations is 0.024 [15], which makes the density reduction due to 25% melt extraction equivalent to that due to a 200°C temperature increase.
Our numerical experiments treat the mantle as a constant viscosity or viscosity-layered halfspace. Mantle viscosity could be affected by melting, but the magnitude of this effect remains unresolved. Large reductions in viscosity are possible when the melt fraction present is large enough to re- duce intergranular contact within the solid ma- trix. Buck and Su [10] show that reduced viscosity due to the presence of melt would enhance and focus mantle upwelling beneath a spreading cen- ter. However, laboratory studies suggest that small melt fractions reduce mantle viscosity only by a factor of 2-5 [17-20]. The highest melt fractions obtained in our numerical experiments are on the order of 5%, for which the viscosity reduction expected is only about a factor of 5. Karato [21] suggests that the fractionation of water from min- eral grains into melt strengthens mantle rock, which could compensate for the weakening effect of melt. If so, the largest viscosity variation may not be a reduction within the region of melting but an increase in the dry residual mantle left after melt is extracted.
3. Melt migration
The amount of melt present in partially melt- ing, upwelling mantle is determined by balancing the rate of melt production with the rate of melt migration. In our models, we assume that melt is transported by porous flow [22,23]. The D'Arcy velocity for buoyancy driven vertical flow through a porous media is given by:
K w = - - A p g (S)
/x
where K = permeability; /x = melt viscosity; and Ap = the density difference between the fluid and the solid matrix [23]. Note that the D'Arcy velocity is the differential melt flux with respect to the matrix flow.

224 K. Jha et al. / Earth and Planetary Science Letters 125 (1994) 221-234
For melt flow through a network of tubes along the edges of cubic grains the permeabili ty- porosity relation is:
b 2 ff9 2
K - 727r (9)
where b = grain size (length of the grain edge). The melt geometry affects this relation. For ex- ample, if melt wets grain faces, K is proportional to b2d) 3. At steady state, all the melt generated is transported by porous flow and the vertical ad- vection of the matrix, so:
~(w/4, - uz) = ~ I dz (10)
where uz = the vertical velocity of the solid ma- trix. Combining Eqs. (8), (9) and (10) yields an equation that can be solved for the melt fraction, 6- The integral in Eq. (10) is numerically evalu- ated by summing the melting rate in vertical columns.
Eq. (8) neglects the effect of mantle viscosity on the rate of compaction. This may not be a good assumption for high mantle viscosities (_> 10 22 Pa s [12,24,25]). However, mantle viscosity beneath spreading centers is generally thought to be significantly less than this value.
The melt fraction present (and therefore the magnitude of melt retention buoyancy) varies in- versely with the grain size, b. Field studies of slightly deformed peridotite sequences in the Samail Ophiolite [26] and of the Dun mountain ophiolite [27] report olivine grain sizes between 1 and 5 mm. To study the effects of grain size on buoyant flow, our calculations consider 0.3 mm and 3 mm grain sizes and a melt viscosity of 10 Pa s [28]. For these values, as will be seen, our models span the range from negligible to highly significant amounts of melt retention buoyancy.
4. Numerical formulation
The numerical method used is based on the finite difference formulation of Parmentier and Phipps Morgan [8]. Buoyant and dilatational vis- cous flow are computed using a spectral (FFT) flow solver with the Green's functions obtained
from analytical solutions for a uniform viscosity halfspace [29] or a propagator matrix solution for a viscosity-layered halfspace [30]. Upwind and central finite differences are used to approximate heat advection and diffusion terms, respectively, in Eq. (1). The method used to advect depletion is based on the formulation of Sotin and Parmen- tier [16]. To track depletion, the velocity field at the present time is used to calculate the location at the previous time step of material now at grid points. Stability requires that the material now at a grid point lay within a quadrilateral sharing this grid point at the previous time step. The value of the property at the previous time is then tri-lin- early interpolated between the eight surrounding nodal values. Mantle depletion is modified to account for additional melting over the time step; these modified values are the updated grid point values at the present time.
We solve Eqs. (1) and (4) iteratively because temperature change over a time step and melting rate are not independent. The temperature of material at a grid point at the present time step is the value advected from its previous position, altered to account for conduction and the heat of melting over the time step. The amount of melt- ing that takes place, however, depends on the values of temperature at the beginning and end of the time step. Therefore, we solve iteratively for the temperature, depletion, and melting-rate fields at each time step. The solution is consid- ered converged when the change in the maximum melting rate between consecutive iterations is less than 0.1% of its maximum value.
5. 2-D models
We begin by examining flow structure and its dependence on spreading rate, mantle viscosity and melt migration permeability in 2-D models. 2-D models of this type have been previously reported by Scott [12] and Cordery and Phipps Morgan [14]. The results reported here empha- size the effect of varying the melt migration per- meability and provide initial conditions for 3-D numerical experiments described later. Calcula- tions are performed for a region with dimensions

K. Jha et aL / Earth and Planetary Science Letters 125 (1994) 221-234 225
0
-40
-80
-40
-80
{a)
0 50 100 150 200 250 300
3 cm/yr
0 50 1 O0 150 200 250 300
A 3 cm/yr
Fig. 1.2-D models showing the effect of mantle-depletion and melt-retention buoyancy on flow in a vertical plane perpendic- ular to the spreading axis. Shaded contours show the degree of depletion, arrows show velocities, white contours are isotherms, and black contours show melt-fraction present. Half-spreading rate = 3 cm/yr, mantle viscosity = 5 × 10¹⁸ Pa s. (a) 3 mm grain size, maximum degree of depletion = 17%, maximum melt fraction present = 0.3%, maximum upwelling velocity = 2.72 cm/yr. (b) 0.3 mm grain size, maximum melt fraction present = 5.3%, maximum upwelling velocity = 8.52 cm/yr.
of 600 and 100 km in the spreading and vertical directions, respectively. An upwelling mantle temperature of 1350°C, chosen to produce crustal thicknesses between 5 and 9 kin, is prescribed at the bottom of this region. These calculations have 51 and 129 uniformly spaced grid points in the vertical and horizontal directions, respectively, and are numerically very well resolved. A typi- cally 60 km high, 65 km wide region of melting (Fig. lb) will contain 3l grid points vertically and 15 grid points horizontally.
We first examine a case where the effects of melt-retention buoyancy on flow structure are small. For a mantle grain size of 3 mm, melt migration by porous flow is rapid, and the maxi- mum melt fraction present is low (0.3% maxi- mum). Results for this grain size are shown in Fig. la. Depleted mantle created in the melting region extends to a depth controlled by the depth of initial melting. Far enough off the axis that
buoyant flow is small, the depleted mantle is advected away at the half-spreading rate. It forms a stably stratified layer with a thickness that is determined by the spreading rate and the rate of melt production. For buoyant flow driven solely by mantle depletion buoyancy, the upwelling and rate of melt production is low enough that the depleted mantle layer away from the axis is thin- ner than the initial depth of melting. Therefore, a dynamically maintained buoyant root is present beneath the spreading axis, providing buoyancy to drive upwelling. Although the velocities are higher, the resulting flow qualitatively resembles that generated by plate spreading alone.
We next consider a case where the melt migra- tion permeability is low (grain size = 0.3 mm). Melt migration is slow and the melt fraction present is high (5.3% maximum), increasing the importance of melt-retention buoyancy relative to that at the larger grain size. Results for this smaller grain size are shown in Fig. lb. The buoyant, melt-rich zone present here has a ten- dency to create a closed, small-scale mantle circu- lation beneath the ridge axis [31]. However, this circulation entrains depleted mantle from the melting region, whose buoyancy opposes down- ward motion. This suppresses the recirculation of previously melted mantle through the region of melting. Depleted material is dragged downwards by the melt-retention driven circulation until the driving and resisting forces balance, at which point depleted material stops moving downwards and is carried away from the axis by the plate- spreading flow. The higher rate of upwelling and melt production results in a thicker depleted mantle layer away from the axis. In this case the thinner, low-density depleted layer beneath the axis relative to that off-axis opposes the upwelling driven by melt-retention buoyancy. Melt-reten- tion buoyancy focuses upwelling and creates a narrower region of melting, particularly at low spreading rates. This is similar to the flow pat- terns described by Scott and Stevenson [11] and by Cordery and Phipps Morgan [13].
Buoyant flow structure depends on spreading rate and mantle viscosity. In order to study buoy- ant flow where both mantle-depletion and melt- retention buoyancy are important, a mantle grain
226 K. Jha et al. / Earth and Planetary Science Letters 125 (1994) 221-234
size of 0.3 mm is considered. Models for a range of spreading rates at a mantle viscosity of 5 × 1 0 1 9
Pa s, and for a range of mantle viscosities at a half-spreading rate of 3 c m / y r are examined. In the cases with viscosity held fixed, the half- spreading rate is varied between 1 and 9 cm/yr . At low spreading rates, buoyant flow has a large effect on flow geometry and upwelling rate. The region of melting is narrow, compared to that created by passive flow, and the upwelling veloci- ties are increased by a factor of 4-6. At high spreading rates, buoyant velocities are small rela- tive to passive upwelling velocities, and the region of melting is wide. In the cases with the spread- ing-rate held fixed, mantle viscosity is varied over the range of 5 × 10¹⁸ Pa s and 1 × 1 0 20 Pa s. Buoyant flow governs upwelling velocities and the shape of the melting region at low mantle viscosi- ties. At high mantle viscosities, buoyant flow is dominated by plate-spreading flow, and the shape of the melting region is like that created by plate-spreading flow alone.
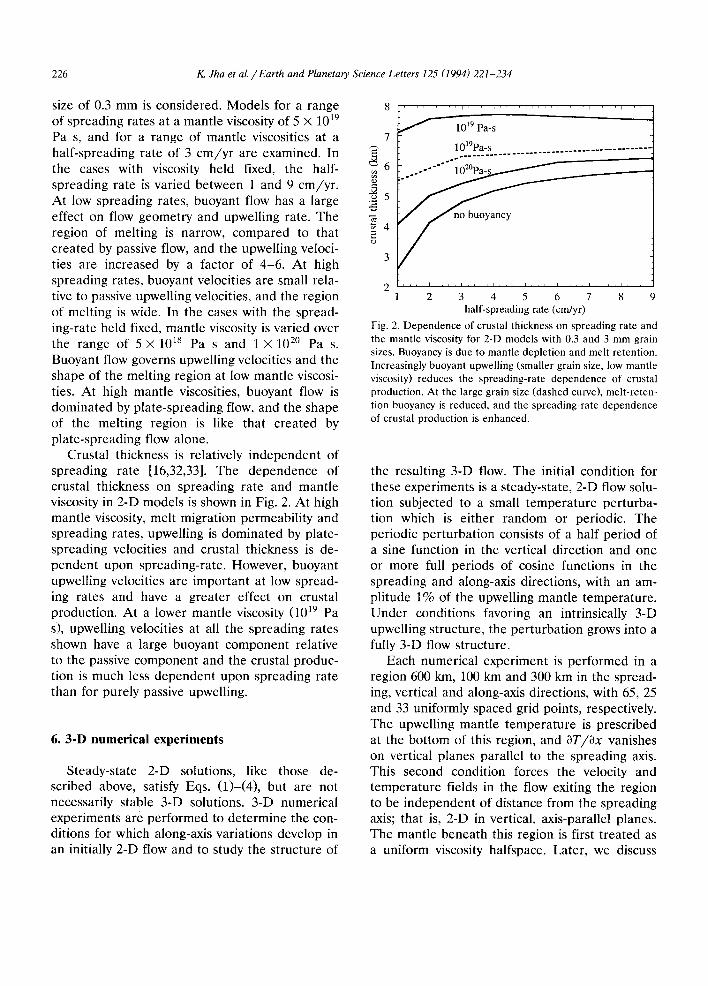
Crustal thickness is relatively independent of spreading rate [16,32,33]. The dependence of crustal thickness on spreading rate and mantle viscosity in 2-D models is shown in Fig. 2. At high mantle viscosity, melt migration permeability and spreading rates, upwelling is dominated by plate- spreading velocities and crustal thickness is de- pendent upon spreading-rate. However, buoyant upwelling velocities are important at low spread- ing rates and have a greater effect on crustal production. At a lower mantle viscosity ( 1 0 1 9 Pa s), upwelling velocities at all the spreading rates shown have a large buoyant component relative to the passive component and the crustal produc- tion is much less dependent upon spreading rate than for purely passive upwelling.
6. 3-D numerical experiments
Steady-state 2-D solutions, like those de- scribed above, satisfy Eqs. (1)-(4), but are not necessarily stable 3-D solutions. 3-D numerical experiments are performed to determine the con- ditions for which along-axis variations develop in an initially 2-D flow and to study the structure of
7
~ 6
0 :;al . . . . . . . . . . . . . ......... t o20Ooo . . . . . . . . . . . . . . . . . . . . . . . . . . . . . . . . . .
2 . . . . ' . . . . q . , , , i , , , , i , , i , i , , , i i , , b , i , , , , 1 2 3 4 5 6 7 8 9
h a l f - s p r e a d i n g ra te ( c m / y r )
F ig . 2. D e p e n d e n c e o f c r u s t a l t h i c k n e s s o n s p r e a d i n g r a t e a n d t h e m a n t l e v i s c o s i t y f o r 2 - D m o d e l s w i t h 0 .3 a n d 3 m m g r a i n s i zes . B u o y a n c y is d u e to m a n t l e d e p l e t i o n a n d m e l t r e t e n t i o n . I n c r e a s i n g l y b u o y a n t u p w e l l i n g ( s m a l l e r g r a i n s ize , l ow m a n t l e v i s c o s i t y ) r e d u c e s t h e s p r e a d i n g - r a t e d e p e n d e n c e o f c r u s t a l p r o d u c t i o n . A t t h e l a r g e g r a i n s i ze ( d a s h e d c u r v e ) , m e l t - r e t e n - t i on b u o y a n c y is r e d u c e d , a n d t h e s p r e a d i n g - r a t e d e p e n d e n c e o f c r u s t a l p r o d u c t i o n is e n h a n c e d .
the resulting 3-D flow. The initial condition for these experiments is a steady-state, 2-D flow solu- tion subjected to a small temperature perturba- tion which is either random or periodic. The periodic perturbation consists of a half period of a sine function in the vertical direction and one or more full periods of cosine functions in the spreading and along-axis directions, with an am- plitude 1% of the upwelling mantle temperature. Under conditions favoring an intrinsically 3-D upwelling structure, the perturbation grows into a fully 3-D flow structure.
Each numerical experiment is performed in a region 600 km, 100 km and 300 km in the spread- ing, vertical and along-axis directions, with 65, 25 and 33 uniformly spaced grid points, respectively. The upwelling mantle temperature is prescribed at the bottom of this region, and OT/Ox vanishes on vertical planes parallel to the spreading axis. This second condition forces the velocity and temperature fields in the flow exiting the region to be independent of distance from the spreading axis; that is, 2-D in vertical, axis-parallel planes. The mantle beneath this region is first treated as a uniform viscosity halfspace. Later, we discuss
K. Jha et al. / Earth and Planetary Science Letters 125 (1994) 221-234 227
experiments with a low-viscosity asthenosphere layer. The buoyant and dilatational components of flow vanish at the surface and are periodic in the along-axis direction. Symmetry conditions on the temperature are imposed on the vertical, axis-perpendicular planes at the ends of this re- gion. Along with our spectral flow solver, this requires solutions periodic in the along-axis di- rection. The longest possible wavelength is Ly but any periodic solution with an integral number of along-axis wavelengths within Ly will satisfy these boundary conditions.
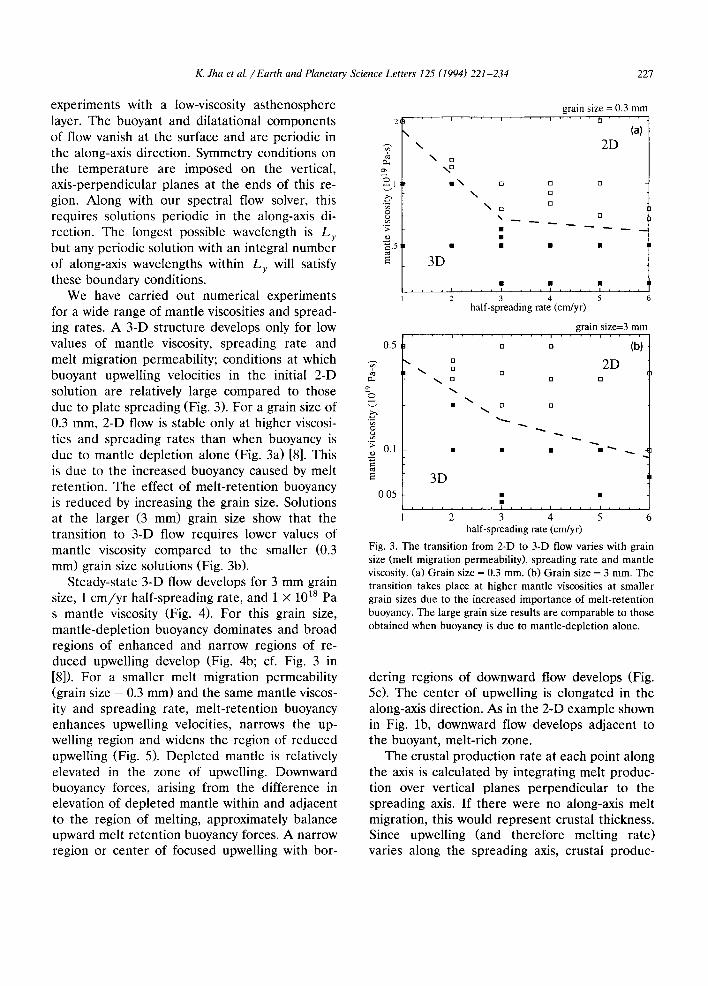
We have carried out numerical experiments for a wide range of mantle viscosities and spread- ing rates. A 3-D structure develops only for low values of mantle viscosity, spreading rate and melt migration permeability; conditions at which buoyant upwelling velocities in the initial 2-D solution are relatively large compared to those due to plate spreading (Fig. 3). For a grain size of 0.3 mm, 2-D flow is stable only at higher viscosi- ties and spreading rates than when buoyancy is due to mantle depletion alone (Fig. 3a) [8]. This is due to the increased buoyancy caused by melt retention. The effect of melt-retention buoyancy is reduced by increasing the grain size. Solutions at the larger (3 mm) grain size show that the transition to 3-D flow requires lower values of mantle viscosity compared to the smaller (0.3 mm) grain size solutions (Fig. 3b).
Steady-state 3-D flow develops for 3 mm grain size, 1 cm/yr half-spreading rate, and 1 × 10¹⁸ Pa s mantle viscosity (Fig. 4). For this grain size, mantle-depletion buoyancy dominates and broad regions of enhanced and narrow regions of re- duced upwelling develop (Fig. 4b; cf. Fig. 3 in [8]). For a smaller melt migration permeability (grain size = 0.3 mm) and the same mantle viscos- ity and spreading rate, melt-retention buoyancy enhances upwelling velocities, narrows the up- welling region and widens the region of reduced upwelling (Fig. 5). Depleted mantle is relatively elevated in the zone of upwelling. Downward buoyancy forces, arising from the difference in elevation of depleted mantle within and adjacent to the region of melting, approximately balance upward melt retention buoyancy forces. A narrow region or center of focused upwelling with bor-
o
8
~.5 E
0.5
"F. 0.1 o
E
grain size = 0.3mm I . . . . { . . . . ' . . . . ' . . . . 0 . . . .
\ (a) \
\ o
g \
3D
2D
\ O [ ] O
[ ]
\ o []
. . . . . . . . . ? . . . . ; . . . . ; . . . . 2 3 4 5
half-spreading rate (cm/yr)
grain size=3 mm
o o (b)
° 2 D o o [] 0 0
• o o
......
3D 0.05 ~ ,,
i , , L { . . . . . , , , I , , , , { , , , ,
2 3 4 5 6 half-spreading rate (cm/yr)
Fig. 3. The transition from 2-D to 3-D flow varies with grain size (melt migration permeability), spreading rate and mantle viscosity. (a) Grain size = 0.3 mm. (b) Grain size = 3 mm. The transition takes place at higher mantle viscosities at smaller grain sizes due to the increased importance of melt-retention buoyancy. The large grain size results are comparable to those obtained when buoyancy is due to mantle-depletion alone.
dering regions of downward flow develops (Fig. 5c). The center of upwelling is elongated in the along-axis direction. As in the 2-D example shown in Fig. lb, downward flow develops adjacent to the buoyant, melt-rich zone.
The crustal production rate at each point along the axis is calculated by integrating melt produc- tion over vertical planes perpendicular to the spreading axis. If there were no along-axis melt migration, this would represent crustal thickness. Since upwelling (and therefore melting rate) varies along the spreading axis, crustal produc-

228 K. Jha et aL / Earth and Planetary Science Letters 125 (1994) 221-234
t i o n v a r i e s f r o m n e a r ze ro , a b o v e t h e z o n e s o f r e d u c e d u p w e l l i n g , to a b o u t 25 k m a b o v e t h e r e g i o n o f h i g h e s t u p w e l l i n g , w i t h a n a v e r a g e v a l u e c lo se to 6 km. T h e w i d t h a n d i n t e n s i t y o f t h e u p w e l l i n g v a r i e s w i t h s p r e a d i n g r a t e , m a n t l e vis-
(a) 0
-40
-80
0 5O
6 cm/yr (b)
100 150 200 250 300
-40
-80
300
250
200
150
1 O0
50
0
~ _ i , , , ,t i ~ AI it A A A & I It It lI It It it tt Ji it J, J~ k k ~. ~
0 50 1 O0 150 200 250 300
6 cm/yr
(c)
0 100 200
6 cm/yr
300
1 cm~r
0
-1
-2
-3
-4
Fig. 4. Planes from a 3-D numerical experiment with both mantle-depletion and melt-retention buoyancy. Contours, shading and arrows show the same variables as in Fig. 1. (a) Vertical across-axis plane where upwelling is a maximum. (b) Vertical along-axis plane. (c) Horizontal plane at 20 km depth where shading shows vertical velocities. Negative values corre- spond to upward flow, Grain size = 3 mm, half-spreading rate = 1 cm/yr, mantle viscosity = i x 1018 Pa s, maximum degree of depletion = 16.5%, maximum upwelling velocity = 7.29 cm/yr, maximum melt fraction = 0.5%. The large grain size allows melt to migrate rapidly, so that melt-retention buoyancy is small relative to mantle-depletion buoyancy [cf. 8].
0
-40
-80
(a)
0 50
6 cm/yr (b)
100 150 200 250 300
-40
-80
0 5O
A 6 cm/yr
(c)
100 150 200 250 300
3O0 1 cm/yr
250 o
200 -1 -2
150 -3
-4 1 O0 -5
50 -6 -7
0 -8 0 1 O0 200 300
6 cm/yr
Fig. 5. 3-D flow structure in a numerical experiment with grain size = 0.3 mm, half-spreading rate = 3 cm/yr, mantle viscosity = 5 x 10 ~s Pa s, maximum upwelling velocity = 16.9 cm/yr, maximum degree of depletion = 17%, maximum melt fraction present = 7%. Contours show same variables as in Fig. 4. Compared with the example in Fig. 4, the smaller grain size reduces the efficiency of melt transport, increasing the importance of melt-retention buoyancy. This narrows the re- gion of enhanced upwelling. The focussed zone of upwelling is bordered by regions of downwelling. (a) Vertical across-axis plane. (b) Vertical along-axis plane. (c) Horizontal plane at a depth of 20 km. Regions of downwelling are seen as dark bands adjacent to the central zone of upwelling.
cos i ty a n d g r a i n size. F o r a 0.3 m m g r a i n size, low s p r e a d i n g r a t e s a n d low m a n t l e v i scos i t i e s , u p - w e l l i n g a n d m e l t i n g b e c o m e s s t r o n g a n d h i g h l y f o c u s e d (Fig . 5), r e s u l t i n g in a l a r g e v a r i a t i o n in
K~ Jha et al. / Earth and Planetary Science Letters 125 (1994) 221-234 229
crustal production along-axis. For a 3 mm grain size, higher spreading rates and higher mantle viscosities, upwelling is not as localized, so the along-axis crustal production is more uniform, except in the small regions of strongly reduced upwelling (Fig. 4).
If observed mantle Bouguer anomalies are at- tributed to variations in crustal thickness, crustal thickness variations only on the order of a few kilometers are required [1,3,34,35]. Since melt retention buoyancy produces strongly localized mantle upwelling, either large along-axis varia- tions in crustal thickness must be present or a mechanism for shallow-level redistribution of melt along the spreading axis is required.
6.1. Segmentation length for constant viscosity
These results indicate that a wavelength of 300 km is preferred relative to wavelengths of 150, 200, 400, 600 and 1200 km. A 300 km wavelength is, however, long compared to typical segmenta- tion lengths of spreading centers. It is, therefore, important to identify mechanisms that control the preferred or dominant along-axis wavelength. A preferred along-axis wavelength requires the exis- tence of a scaling length. In our numerical experi- ments described thus far, the mantle is idealized as a uniform viscosity halfspace, which provides no length scale for the flow segmentation. Since the only length scale in this case is the depth of melting, we expect the along-axis flow wavelength to scale with this depth. Wavelengths of segmen- tation of 100 km or less in our model with a uniform viscosity mantle would require unreason- ably shallow depths of melting.
Spreading center segmentation by transform faults and other ridge-axis discontinuities occurs at wavelengths of 50 to several hundreds of kilometers. It is, therefore, important to identify the preferred along-axis wavelength of buoyant flow. In our numerical experiments, boundary conditions at the ends of the spreading axis re- quire an integral number of along-axis wave- lengths, as discussed above. With Ly = 300 km and 33 grid points in the along-axis direction, boundary conditions would allow wavelengths of 50, 100, 150 and 300 km. For Ly = 300 km, a 300 km wavelength of along-axis flow develops from initial perturbations with wavelengths of 50, 100, 150 and 300 km, as well as a random perturba- tion. For L y = 6 0 0 and 1200 km, at the same resolution and with initial conditions containing a random perturbation, a wavelength of 300 km is still preferred.
To test the dominance of the 300 km wave- length further, we first create an initial condition by setting Ly = 150 km, so that a 150 km wave- length solution develops. Reflecting this solution at its end about a vertical across-axis plane in- creases the total along-axis length to 300 km. Using this as an initial condition for a numerical experiment with Ly = 300 km, the 150 km wave- length is not preserved but rather is replaced by a 300 km wavelength.
7. Layered viscosity
A layered mantle, represented by a low-viscos- ity asthenosphere overlying a higher viscosity halfspace, is expected, based on the pressure and temperature dependence of thermally activated creep [36], and is inferred from geophysical con- straints on mantle viscosity [37]. The thickness of a low-viscosity asthenosphere can provide an ad- ditional length scale governing the convective seg- mentation of spreading centers. To explore the control of viscosity layering on buoyant flow structure, particularly its wavelength, we compare numerical experiments with a uniform viscosity mantle and a viscosity-layered mantle.
These experiments were carried out for a 3 c m / y r half-spreading rate, a 5.5 × 10¹⁸ Pa s as- thenosphere viscosity and a 0.3 mm grain size. In the uniform viscosity case, the mantle halfspace has the same viscosity as the asthenosphere, while in the layered viscosity case the viscosity of the halfspace beneath the asthenosphere is 5.5 × 10¹⁹ Pa s. The asthenosphere extends from z = 0 (top boundary) to depth L z. The numerical experi- ments comparing these two mantle structures have L y = 3 0 0 kin, L x = 6 0 0 km, and L z = 1 0 0 km, with 65, 65 and 25 grid points, respectively. Steady state solutions from uniform viscosity
230 K. Jha et aL / Earth and Planetary Science Letters 125 (1994) 221-234
models are used as initial conditions for the lay- ered models.
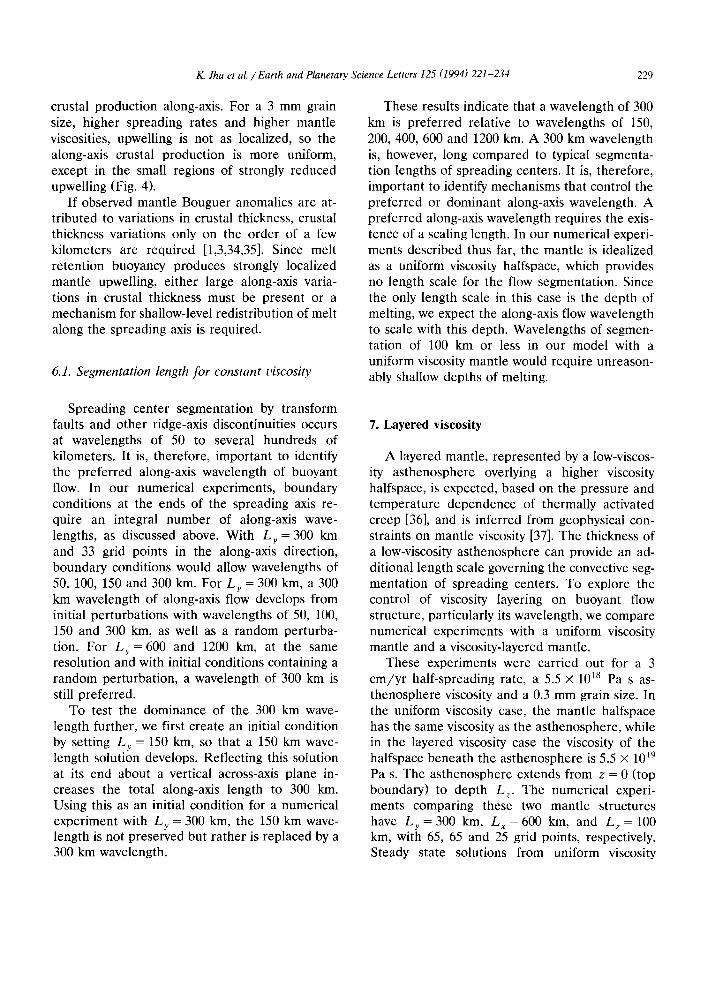
For flow with an initial along-axis wavelength of 300 km, horizontal and vertical along-axis and axis-perpendicular planes in the final steady-state solution are shown in Fig. 6. Along-axis segmen- tation of the melt-production region at a wave- length shorter than the primary along-axis flow wavelength is present. The along-axis segmenta- tion in the melt-production region results in an along-axis variation in crustal production (Fig. 7).
For the same spreading rate and viscosity structure and an initial along-axis flow wave- length of 150 kin, a different steady-state solution is obtained (Fig. 8). In this solution the 150 km along-axis wavelength persists, but a longer, 300 kin, wavelength of variation in the melt produc- tion region is also present. This can be seen in the different depths to which depleted mantle extends at ends and center in the vertical along- axis plane (Fig. 8b).
Magnitudes of crustal production variation along-axis calculated for uniform and layered vis- cosity have large amplitudes (between 10 and 25 km, see Fig. 7). If there is no along-axis melt migration, melt production variations should be reflected in crustal thickness. Crustal thickness variations calculated using gravity anomalies [34] and seismic refraction measurements [35] show variations only of the order of a few kilometers. This argues for the presence of a shallow-level redistribution of melt or crustal material.
Assuming that all the melt produced is dis- tributed uniformly along the spreading axis, the crustal thickness would have along-axis average values of 7.6, 5.5 and 5.7 km, corresponding to the cases in Figs. 7a, b and c, respectively. The average crustal thickness is relatively unaffected by the along-axis wavelength of the viscosity- layered calculations. However, crustal thickness is reduced for the viscosity-layered mantle relative to the uniform viscosity mantle. This is a conse- quence of a high viscosity mantle beneath the asthenosphere, which retards mantle upwelling.
To understand the factors governing the along-axis wavelength of segmentation more clearly, we increased the asthenosphere thickness to 150 km. For an initial along-axis wavelength of
0
-40
-80
0
-40
-80
300
250
200
150
1 O0
50
(a)
0 50
A 6 cm/yr (b)
100 150 200 250 300
~1~ ~ ~ ~ ~ ; l ~ ~ I ~ l l I A A A IA A A i L I k k ~
0 50 1 O0 150 200 250 300
A 6 cm/yr (c)
0
A 6 cm/yr
100 200 300
0.5 cm/yr
-0.5
-1.5
-2.5
-3.5
-4.5
-5.5
Fig. 6. 3-D flow structure in a numerical experiment with a 100 km thick asthenosphere underlain by a 10 times more viscous halfspace. Contours show same variables as in Fig. 4. An initial 300 km along-axis wavelength persists in the final steady-state solution. A secondary flow segmentat ion with a shorter wavelength is observed in the melting-rate contours. Grain size = 0.3 mm, half-spreading rate = 3 cm/y r , astheno- sphere viscosity = 5.5 × 10¹⁸ Pa s, maximum upwelling velocity = 8.7 cm/y r , maximum degree of depletion = 24%, maximum melt fraction present = 5.1%. (a) Vertical across-axis plane through the region of highest along-axis upwelling. (b) Verti- cal along-axis plane. (c) Horizontal plane at a depth of 20 km.
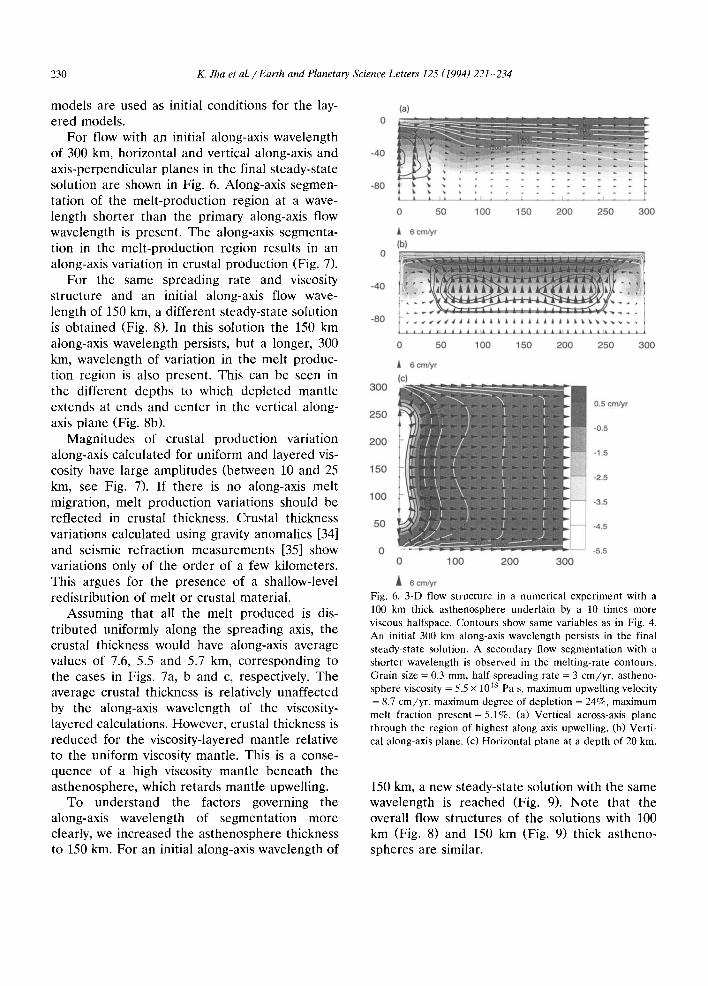
150 kin, a new steady-state solution with the same wavelength is reached (Fig. 9). Note that the overall flow structures of the solutions with 100 km (Fig. 8) and 150 km (Fig. 9) thick astheno- spheres are similar.

K. Jha et aL /Earth and Planetary Science Letters 125 (1994) 221-234 231
The 3-D flow structures in these experiments evolve to a nearly time-independent steady state. In some cases a weak periodic time dependence persists, but only with very low amplitude (crustal thickness variation on the order of 100 m). This is consistent with our steady-state melt migration assumption (Eq. 8). At sufficiently slow spreading rates, both 2-D and 3-D experiments are strongly time-dependent, with large periodic fluctuations in crustal thickness. At least in 2-D models, this time-dependence appears to be associated with the finite width of the region in which buoyant flow solutions are obtained. Doubling the width of the computational region doubles the period of the time dependence. If the region is sufficiently wide that the buoyant flow is truly isolated from the outflow boundary, the 2-D time dependence disappears.
8. Discussion
Two-dimensional numerical experiments show that mantle-depletion buoyancy enhances up- welling beneath the spreading axis and causes stable stratification of depleted material away from the spreading axis. Melt-retention buoyancy
grain size = 0.3 mm 30 . . . . , , , . . . .
25
"~ 20 O
,~ 15 2 e-~
5
- (a)
- - (b) ,," ", . . . . . . (c) ' /
/
x ' /
50 100 150 200 250 300 distance along axis (kin)
Fig. 7. Crustal production in vertical across-axis planes along the spreading axis expressed as a crustal thickness, assuming no along-axis migration of melt. a, b and c = the numerical experiments shown in Figs. 5, 6 and 8, respectively. The average crustal thicknesses for these cases are: a = 7.6 km; b = 5.7 kin; and c = 5.5 kin. The presence of a higher viscosity mantle halfspace reduces the rate of upwelling and therefore the crustal thickness in b and c relative to that in a.
(a) 0
-40
-80
o 50
6 cm /y r
(b )
100 150 200 250 300
-40
-80 /
1 A A J A IA A A A },~J, k }, & A A A ~ J / AIJ[ A A A A IA A & l A
0 50 100 150 200 250 300
6 cm/yr ( c )
300
1 cm /y r
250 0
200 -1
- 2
150 -3
1 O0 -4
-5 50
- 6
0 -7 0 1 O0 200 300
A 6 cm/yr Fig. 8. 3-D flow structure in a numerical experiment with a 100 km thick asthenosphere underlain by a 10 times more viscous halfspace. Contours show same variables as in Fig. 4. The initial condition has a 150 km along-axis wavelength, which persists in the final solution. Maximum upwelling veloc- ity = 10.1 cm/yr , maximum degree of depletion = 25%, maxi- mum melt fraction present = 5.4%. (a) Vertical across-axis plane through the region of strongest upwelling. (b) Vertical along-axis plane. (c) Horizontal plane at a depth of 20 kin.
focuses and enhances upwelling, while mantle-de- pletion buoyancy inhibits the remelting of previ- ously melted material. The combined effect of these two types of buoyancy shapes mantle flow beneath spreading centers. For porous flow melt migration, the contribution of melt-retention to buoyant flow is sensitive to the melt migration permeability: more melt is retained at smaller grain sizes where the permeability is lower.
232 K. Jha et al. / Earth and Planetary Science Letters 125 (1994) 221-234
0
-40
-80
-120
0
-40
-80
-120
(a)
0 50 1 O0 150 200 250 300
6 cm/yr (b)
0 50
A 6 cm/yr (c)
100 150 200 250 300
300
1 cm/yr 250
o
200 -1
-2 150
-3
1 O0 -4
-5 50
-6
0 -7 0 1 O0 200 300
A 6 cm/yr
Fig. 9. 3-D flow structure in a numerical experiment with a 150 km thick as thenosphere underlain by a 10 times more viscous halfspace. Contours show same variables as in Fig. 4. The initial condition has a 150 km wavelength. Maximum upwelling velocity = 12.5 cm/y r , maximum degree of deple- t i on=16 .3%, maximum melt fraction p r e s e n t = 6 . 1 % . (a) Vertical across-axis plane. (b) Vertical along-axis plane. (c) Horizontal plane at a depth of 20 kin.
Therefore, for a given spreading rate and mantle viscosity, smaller grain size results in stronger buoyant upwelling. When buoyant upwelling is
important, crustal thickness is relatively indepen- dent of spreading rate.
3-D uniform viscosity numerical experiments show that along-axis variations in upwelling, melt- ing and crustal production develop at low viscosi- ties and low spreading rates. Narrow regions of strong upwelling, more focused than if buoyancy were due to mantle-depletion alone, separated by wide regions of extremely weak upwelling, de- velop along-axis. At the same spreading rate, 3-D flow exists at higher viscosities than when buoy- ancy is due to mantle-depletion alone.
In the absence of an asthenosphere, buoyant flow in a uniform halfspace has a preferred along-axis flow wavelength that must scale with the initial depth of melting. The presence of a low-viscosity asthenosphere imposes a shorter length scale to the flow (seen in Figs. 6-8). Flow structure in layered-viscosity calculations is also dependent on initial conditions. In a numerical experiment that has a 300 km along-axis length, randomly perturbed 2-D solutions evolve into a 300 km wavelength of flow. However, initially introduced, shorter along-axis flow wavelengths (~ 150 km) are stable and persist.
Wavelengths of along-axis variation as small as segmentation lengths on slow spreading centers such as the Mid-Atlantic Ridge (50-100 km) would be difficult to obtain by the mechanisms studied here if the mantle viscosity were depth- independent. A low-viscosity asthenosphere can introduce a shorter wavelength of segmentation. Multiple wavelengths of segmentation in our nu- merical experiments may correspond to features observed on the Mid-Atlantic Ridge. The long wavelength that seems to be controlled by the maximum depth of melting could correspond to long-lived, widely spaced, fracture zones (defining the tectonic corridors of Kane and Hayes [38]). The shorter wavelength of short offset transforms and Bouguer gravity lows along the axis [34,39,40] may correspond to the wavelength controlled by the asthenosphere thickness.
A 2-D-3-D transition in upwelling structure is a possible explanation for the fundamental differ- ences in axial morphology and segmentation be- tween "slow" and "fast" spreading ridges. In addition to the spreading rate, this transition is a
K. Jha et al. / Earth and Planetary Science Letters 125 (1994) 221-234 233
strong function of both viscosity and the rate of melt migration. Based on the activation energy for creep in olivine ( ~ 300 kJ /mol ) a 50°C change in upwelling mantle temperature would change the viscosity by a factor of 2. In Fig. 3a, reducing a mantle viscosity of 1019 Pa s by a factor of 2 would change the half-spreading rate of the 2-D- 3-D transition from about 2 c m / y r to nearly 6 cm/yr . Small amounts of water also increase the creep rate of polycrystalline olivine significantly [36,41,42]. Thus, while spreading rate is a directly measurable variable affecting the 2-D-3-D tran- sition, other, less easily observed, factors may also be important. Crustal thickness may be controlled both by mantle temperature, through its influ- ence on the initial depth of melting [43] and by the amount of buoyant upwelling [12,14,16]. While not directly observable, a higher temperature or greater water content of upwelling mantle should correspond to a lower mantle viscosity with in- creased rates of crustal production. Thus, at a given spreading rate, greater crustal production would favor a 3-D pattern of upwelling.
In our uniform-viscosity and viscosity-layered numerical experiments, crustal production varies greatly along-axis, dropping to zero above the zones of reduced upwelling. Observations of along-axis crustal thickness inferred from gravity anomalies [34] or seismic refraction measure- ments [35] show variations only on the order of a few kilometers, suggesting that along-axis migra- tion of melt is important. Rapid along-axis trans- port of melt might also explain the relatively smooth along-axis morphology at faster spreading rates. The 2-D-3-D transition, due to buoyant mantle flow, is a discrete bifurcation. This dis- creteness, as suggested from satellite altimetry data [44], may provide a basis for evaluating whether 2-D mantle flow or a more uniform distribution of crust along-axis is a better expla- nation for the 2-D character of fast spreading ridges.
Acknowledgements
We are grateful for NSF grants and the re- viewers' comments.
References
[1] D.W. Forsyth, Geophysical constraints on mantle flow and melt generation beneath mid ocean ridges, in: Man- tle Flow and Melt Migration beneath mid-ocean ridges, Geophys. Monogr. 71, 1-65, 1992.
[2] J. Phipps Morgan, Mid-ocean ridge dynamics: observa- tions and theory, in: Contrib. Tectonophys., U.S. Natl. Rep. to IUGG 1987-1990, pp. 807-822, AGU, 1991.
[3] J. Lin and J. Phipps Morgan, The spreading rate depen- dence of three-dimensional mid ocean ridge gravity struc- ture, Geophys. Res. Lett. 19(1), 13-16, 1992.
[4] D.T. Sandwell, Thermal stress and the spacings of trans- form faults, J. Geophys. Res. 91, 6405-6417, 1986.
[5] E.M. Parmentier and W.F. Haxby, Thermal stresses in the oceanic lithosphere: evidence from geoid anomalies at fracture zones, J. Geophys. Res. 91(B7), 7193-7204, 1986.
[6] K. Crane, The spacing of ridge-axis highs: dependence upon diapiric processes in the underlying asthenosphere, Earth Planet. Sci. Lett. 72, 405-414, 1985.
[7] H. Schouten, K.D. Klitgord and J.A. Whitehead, Seg- mentation of mid-ocean ridges, Nature 317, 225-229, 1985.
[8] E.M. Parmentier and J. Phipps Morgan, Spreading rate dependence of three-dimensional structure in oceanic spreading centres, Nature 348, 325-328, 1990.
[9] D.W. Sparks and E.M. Parmentier, The structure of three-dimensional convection beneath oceanic spreading centres, Geophys. J. Int. 112, 81-91, 1993.
[10] W.R. Buck and W. Su, Focused mantle upwelling below mid-ocean ridges due to feedback between viscosity and melting, Geophys. Res. Lett. 16(7), 641-644, 1989.
[11] D.R. Scott and D. Stevenson, A self-consistent model of melting, magma migration and buoyancy-driven circula- tion beneath mid-ocean ridges, Geophys. Res. Lett. 18, 1131-1134, 1989.
[12] D.R. Scott, Small-scale convection and mantle melting beneath mid-ocean ridges, in: Mantle Flow and Melt Migration beneath mid-ocean ridges, AGU Geophys. Monogr. 71,327-352, 1992.
[13] M.J. Cordery and J. Phipps Morgan, Melting and mantle flow beneath a mid-ocean spreading center, Earth Planet. Sci. Lett. 111,493-516, 1992.
[14] M.J. Cordery and J. Phipps Morgan, Convection and melting at mid-ocean ridges, J. Geophys. Res. 98, 19477- 19503, 1993.
[15] E.R. Oxburgh and E.M. Parmentier, Compositional and density stratification in the oceanic lithosphere--causes and consequences, J. Geol. Soc. London 133, 343-354, 1977.
[16] C. Sotin and E.M. Parmentier, Dynamical consequences of compositional and thermal density stratification be- neath spreading centers, Geophys. Res. Lett. 16(8), 835- 838, 1989.
[17] R.F. Cooper and D.L. Kohlstedt, Solution-precipitation enhanced diffusional creep of partially molten olivine-

234 K. Jha et al. /Earth and Planetary Science Letters 125 (1994) 221-234
basalt aggregates during hot-pressing, Tectonophysics 107, 207-233, 1984.
[18] R.F. Cooper and D.L. Kohlstedt, Rheology and structure of olivine-basalt partial melts, J. Geophys. Res. 91, 9315-9323, 1986.
[19] G. Hirth and D.L. Kohlstedt, Experimental constraints on the rheology of the partially molten upper mantle, EOS Trans. AM, Geophys. Union 74(16), 282-283, 1993.
[20] M.L. Beeman and D.L. Kohlstedt, Deformation of fine- grained aggregates of olivine plus melt at high tempera- tures and pressures, J. Geophys. Res. 98, 6443-6452, 1993.
[21] S. Karato, Does partial melting reduce the creep strength of the upper mantle?, Nature 319, 309-310, 1986.
[22] N.H. Sleep, Formation of oceanic crust: some thermal constraints, J. Geophys. Res. 80, 4037-4042, 1975.
[23] J.L. Ahem and D. Turcotte, Magma migration beneath an ocean ridge, Earth Planet. Sci. Lett. 45, 115-122, 1979.
[24] J. Phipps Morgan, Melt migration beneath mid-ocean spreading centers, Geophys. Res. Lett. 14, 1238-1241, 1987.
[25] M.W. Spiegelman and D.P. McKenzie, Simple 2-D mod- els for melt extraction at mid-ocean ridges and island arcs, Earth Planet. Sci. Lett. 83, 137 152, 1987.
[26] F. Boudier and R.G. Coleman, Cross section through the peridotite in the Samail ophiolite, southeastern Oman Mountains, J. Geophys. Res. 86(B4), 2573-2592, 1981.
[27] T.E. Davis et al., The Dun mountain ophiolite belt in East Nelson, New Zealand, in: Ophiolites: Proc. Int. Ophiolite Syrup., Printco, Cyprus, 1979.
[28] 1. Kushiro, Viscosity of partial melts in the upper mantle, J. Geophys. Res. 91, 9343-9350, 1986.
[29] Jha, K., Ph.D. Thesis, Brown University, in prep. [30] D.W. Sparks, E.M. Parmentier and J. Phipps Morgan,
Three-dimensional mantle convection beneath a seg- mented spreading center: implications for along-axis vari- ations in crustal thickness and gravity, J. Geophys. Res. 98, 21977-21995, 1993.
[31] M. Rabinowicz, A. Nicolas and J.L. Vigneresse, A rolling mill effect in asthenosphere beneath oceanic spreading centers, Earth. Planet. Sci. Lett. 67, 97-108, 1991.
[32] Y.J. Chen, Oceanic crustal thickness versus spreading rate, Geophys. Res. Lett. 19, 753-756, 1992.
[33] R.S. White, D. McKenzie and R.K. O'Nions, Oceanic crustal thickness from seismic measurements and rare earth inversions, J. Geophys. Res. 97(B13), 19683-19715, 1992.
[34] B.Y. Kuo and D.W. Forsyth, Gravity anomalies of the ridge-transform system in the South Atlantic between 31 ° and 34.5 ° S: Upwelling centers and variation in crustal thickness, Mar. Geophys. Res. 10, 205-232, 1988.
[35] M. Tolstoy, A.J. Harding and J.A. Orcutt, Crustal thick- ness on the mid-Atlantic ridge: bull's-eye gravity anoma- lies and focused accretion, Science 262, 726-729, 1993.
[36] P.N. Chopra and M.S. Paterson, The role of water in the deformation of dunite, Geophys. Res. Lett. 89, 7861- 7876, 1984.
[37] F. Sigmundsson, Post-glacial rebound and asthenospheric viscosity in Iceland, J. Geophys. Res. 91, 6405-6417, 1991.
[38] K.A. Kane and D.E. Hayes, Tectonic corridors in the South Atlantic: evidence for long-lived mid-ocean ridge segmentation, J. Geophys. Res. 97, 17317-17330, 1992.
[39] J. Lin, G.M. Purdy, H. Schouten, J.C. Sempere and C. Zervas, Evidence from gravity data for focused magmatic accretion along the Mid-Atlantic Ridge, Nature 344, 627-632, 1991.
[40] D.K. Blackman and D.W. Forsyth, Isostatic compensa- tion of tectonic features of the Mid-Atlantic ridge: 25 °- 27 ° 30'S, J. Geophys. Res. 96, 11741-11758, 1991.
[41] S. Karato, M.S. Paterson and J.D. Fitzgerald, Rheology of synthetic olivine aggregates: influence of grain size and water, J. Geophys. Res. 91, 8151-8176, 1986.
[42] S.J. Mackwell, D.L. Kohlstedt and M.S. Paterson, The role of water in the deformation of olivine single crystals, J. Geophys. Res. 90, 11319-11333, 1985.
[43] E.M. Klein and C.H. Langmuir, Global correlations of ocean ridge basalt chemistry with axial depth and crustal thickness, J. Geophys. Res. 92, 8089-8115, 1987.
[44] C. Small and D.T. Sandwell, An abrupt change in ridge axis gravity with spreading rate, J. Geophys. Res. 94, 17383-17392, 1989.