Embed Size (px)
Citation preview

Kiel Institute of World Economics Duesternbrooker Weg 120
24105 Kiel (Germany)
Kiel Working Papers No. 1069
The Role of Multinational Enterprises in Globalization:
An Empirical Overview
by
Jörn Kleinert
August 2001
The responsibility for the contents of the working papers rests with the author, not the Institute. Since working papers are of a preliminary nature, it may be useful to contact the author of a particular working paper about results or caveats before referring to, or quoting, a paper. Any comments on working papers should be sent directly to the author.

The Role of Multinational Enterprises in Globalization: An
Empirical Overview∗
Abstract
The activities of multinational enterprises drive the economic globalization process to a very large degree. This paper lists some facts about their dominant role in all channels of globalization. Therefore, the importance of multinational enterprises in foreign direct investment and production abroad is examined as well as their contributions to the international transfer of knowledge and technology and to foreign trade. It is argued that economic theory must account for multinationals’ activities in the analysis of the globalization process.
Keywords: Multinational Enterprise, Globalization, Foreign Direct Investment, International Technology Transfer, Foreign Trade
JEL-Classification: F23, F10, F02
Jörn Kleinert Kiel Institute of World Economics 24100 Kiel, Germany Telephone: ++49 431 8814-325 Fax: ++49 431 85853 E-mail: [email protected]
∗ Financial support from the Thyssen Foundation is gratefully acknowledged. The author thanks Marco Oestmann for research assistance. All remaining errors are mine. Comments should be directed to: [email protected]

1
The process of economic integration has accelerated remarkably in the last
15 years. All three main channels of economic globalization, trade, foreign
direct investment (FDI) and the international transfer of knowledge and
technology, have developed very dynamically. Amongst them, the strong
rise of FDI has attracted the most attention, but the increase of international
technology transfers is as impressive. International trade continues to grow
stronger than world output. The degree of openness has surpassed the pre
World War One record levels in many countries.
Multinational Enterprises (MNEs) stand at the center of all of these
developments. FDI, which is by definition bound to MNEs, is analyzed in
the first part of this paper. Long-term developments are characterized as
well as sectoral and regional distributions. The second part deals with the
international transfer of knowledge and technology. MNEs are the main
vehicle of this transfer as can be seen by the 80% of the payments for
royalties and license fees, which flew between foreign affiliates and their
parent companies in 1995 (UNCTAD 1997). The third part will focus on
international trade, especially MNE related international trade. Two
phenomena will be of special interest: the large and increasing intra-firm
trade and the role of MNEs in trade of intermediate goods. The fourth part
concludes from this empirical analysis the need to make the enterprise, not
2
the country, the basic unit of analysis. Economic globalization must be
examined in a theoretical framework of imperfect competition.
1. Foreign Direct Investment
The deepening of world wide economic integration has depended
increasingly on rising FDI flows, especially in the last two decades. Up to
the mid-nineteen eighties, foreign trade was the most dynamic channel of
economic integration. Exports grew much stronger than FDI in the 1950s,
60s and 70s. In the 1980s this pattern changed. 16.3% FDI growth exceeded
the 6.2% export growth per year by far (Hillebrandt and Welfens 1998). The
increasing integration through stronger growth in trade relative to
production and the impressive rise of FDI after 1985 is documented in
Figure 1. World real industrial production has risen by 60% over this 24
years period. That is an annual growth rate of 2%. International trade, here
shown by the export figures, has increased by 210% over the whole period,
or 4.8% annually, more than twice as fast as industrial production. An even
more dynamic contribution to economic integration came from FDI. From
1973 to 1997, FDI has increased by 780%. That is an impressive annual
growth rate of 9.5%, twice as large as the export growth rate.
3
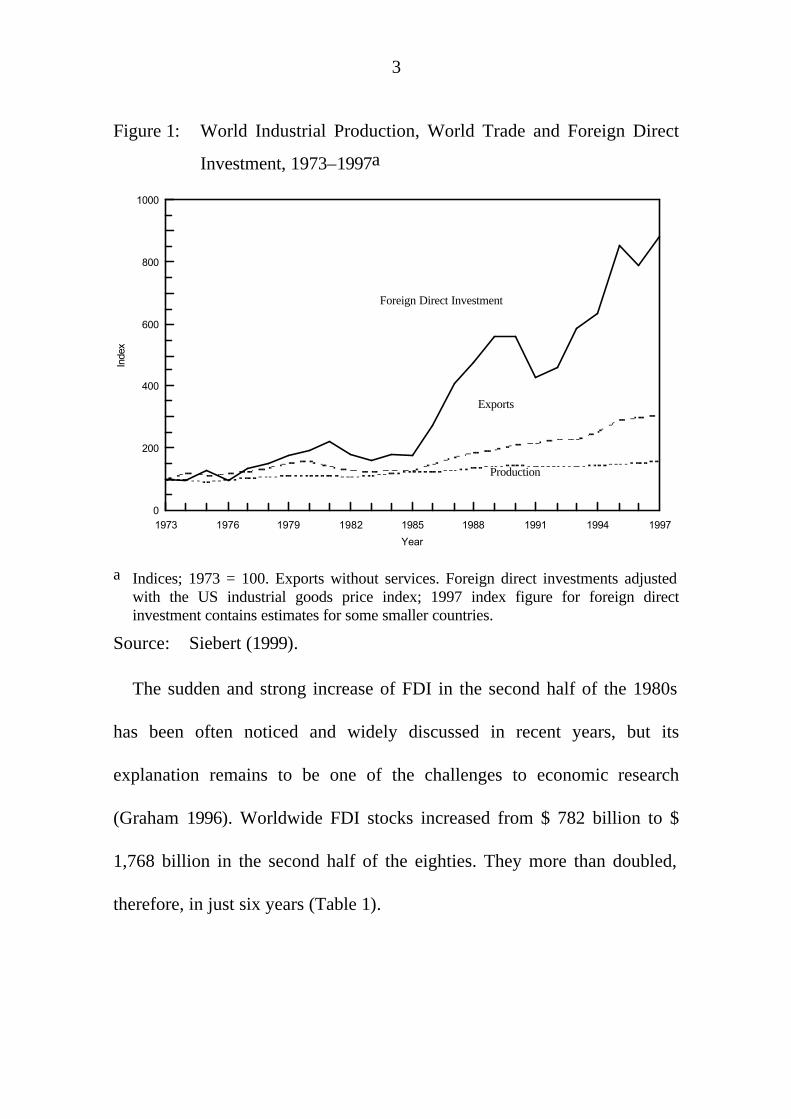
Figure 1: World Industrial Production, World Trade and Foreign Direct
Investment, 1973–1997a
1973 1976 1979 1982 1985 1988 1991 1994 19970
200
400
600
800
1000
Year
Inde
x
a Indices; 1973 = 100. Exports without services. Foreign direct investments adjusted with the US industrial goods price index; 1997 index figure for foreign direct investment contains estimates for some smaller countries.
Source: Siebert (1999).
The sudden and strong increase of FDI in the second half of the 1980s
has been often noticed and widely discussed in recent years, but its
explanation remains to be one of the challenges to economic research
(Graham 1996). Worldwide FDI stocks increased from $ 782 billion to $
1,768 billion in the second half of the eighties. They more than doubled,
therefore, in just six years (Table 1).
Foreign Direct Investment
Exports
Production

4
Table 1: Inward FDI Stocks 1980-1998 (Mill. $, Current Prices)
World Developed countries USA EU Developing countries
1980 506 602 373 658 83 046 185 336 132 945
1985 782 298 545 060 184 615 236 228 237 239
1990 1 768 456 1 394 853 394 911 737 932 370 644
1998 4 088 068 2 785 449 875 026 1 486 237 1 219 271
Source: UNCTAD (1999).
Worldwide FDI continued to grow in the 1990s. In 1998 the world FDI
stock reached $ 4,088 Billion. Roughly three quarter were invested in
developed countries. Especially the FDI boom in the second half of the
1980s was an OECD countries phenomenon. Approximately 85% of the
flows had developed countries as source and as host of FDI (Table 2). In
the last decade the share of FDI received by developing countries has been
somewhat higher. This higher share results from a FDI boom in China and
South-East Asia in the first half of the 1990s. China alone received 12% of
all FDI inflows world wide, or one third of all inflows in the developing
countries in 1996, South-East Asia another third. After the Asian crisis the
strong increase of FDI was mainly driven by a cross-border merger and
acquisition wave among developed countries, which increased their share of
total FDI inflows to 73.5% in 1999 (UNCTAD 2000).

5
Table 2: Accumulated Inward FDI Flows (Mill. $, Percentage)
World Developed countries
United States
United Kingdom
France Germany Canada
1971–76 92 766 66 460 16 851 8 496 6 879 9 084 3 763
1985–90 790 572 672 535 283 680 105 151 43 014 24 823 17 338
1993–98 2 254 450 1 448 320 542 849 177 493 133 296 51 684 59 570
85–90 / 71–76 8.5 10.1 16.8 12.4 6.3 2.7 4.6
Share 1971–76 71.6 18.2 9.2 7.4 9.8 4.1
Share 1985–0 85.1 39.9 13.3 5.4 3.1 2.2
Share 1993–98 64.2 24.1 7.9 5.9 2.3 2.6
Source: IMF (various issues), own calculations.
The share of FDI inflows in the United States increased from 18% in the
early 1970s to 40% in the late 1980s1. The U.S. experienced the most
impressive increase and became by far the largest host country. An
interesting picture emerged in the second half of the 1980s with one
dominant host country and many large home countries of FDI (Table 3).
That was the opposite of the situation in the 1960s and the early 1970s when
U.S. companies dominated FDI outflows by investing heavily in other
developed countries. The share of world FDI outflows coming from U.S.
companies dropped from more than half in the early 1970s to 15% in the
second half of the 80s. It recovered again in the 1990s, without regaining its
dominant position of the 60s. In the last decade, U.S. outward FDI share has
1 The differences in the growth rates of inward FDI reflected in Table 1 and 2 result from the devaluation of the U.S. $ after 1985. For FDI statistics’ problems compare Klodt (1999).

6
risen again to 26%. And, the country has continued to be the most important
host of FDI although the dominance faded a bit, mostly due to the
emergence of China as a large recipient of FDI in the 1990s.
Table 3: Accumulated Outward FDI Flows (Mill. $, Percentage)
World Developed countries
United States
United Kingdom
France Germany Japan
1971–76 126 179 123 613 71 573 17 721 5 914 10 726 8 610
1985–90 917 493 886 751 142 470 150 337 72 793 85 004 166 870
1993–98 2 242 993 2 107 937 585 284 309 856 167 507 251 029 128 551
85–90 / 71–76 7.3 7.2 2.0 8.5 12.3 7.9 19.4
Share 1971–76 98.0 56.7 14.0 4.7 8.5 6.8
Share 1985–90 96.7 15.5 16.4 7.9 9.3 18.2
Share 1993–98 94.0 26.1 13.8 7.5 11.2 5.7
Source: IMF (various issues), own calculations.
Note that U.S. outward FDI flows experienced only a relative decline in
the 1980s, U.S. companies outward FDI flows doubled the early seventies to
the late eighties. However, the increase in other developed countries, most
notable Japan and the United Kingdom was much larger. The relative fall of
U.S. outward FDI would be even larger when adjusted for the higher rate of
reinvested earnings in U.S. outflows in the 1980s (Table 4). The high share
of reinvested earnings in FDI outflows of the U.S. and the U.K. points to
the longer history of internationalization of production of companies in
these countries as compared to Japan, Germany and France. Germany’s
drop in the reinvested earnings ratio can be explained by the strong increase

7
of outflows which could not have been financed by reinvested earnings
alone.
Table 4: Reinvested Earnings Ratioa
United States United Kingdom Germany World
1971–1976 55.9 60.2 21.5
1985–1990 82.2 48.8 9.3 22.7
1993–1998 54.9 46.0 6.1 25.2 a Reinvested earnings relative to FDI outflows
Source: IMF (various issues), own calculations.
The reason for the change in relative positions in FDI among developed
countries is not well understood. The drastic change in the U.S. current
account does not seem to be the cause, since net FDI flows and the balance
of the current account are not correlated for the United States as well as for
the other analyzed countries with the possible exception of Japan (Table 5).
Table 5: Correlation Coefficient of Current Account Balance and Net FDI Flows (1960-1997)
United States Canada United Kingdom France Germany Japan
0.197 -0.183 0.0 0.16 -0.055 0.659
Number of observations: 38 Critical value: 0.324
Source: IMF (various issues), own calculation.
Tables 1 to 4 and Figure 2 point to another phenomenon, too: the cyclical
behavior of FDI flows. Knickerbocker (1973) was the first to notice that
FDI tends to occur in sectoral and temporal clusters. Flowers (1976), while
testing Knickerbockers theory of oligopolistic reaction, found country-
8
specific temporal and sectoral FDI clusters. Investments from different
countries occur at different times. The clustering of investments disappeared
when various countries were examined. Investors only seem to react to
activities of their national competitors.
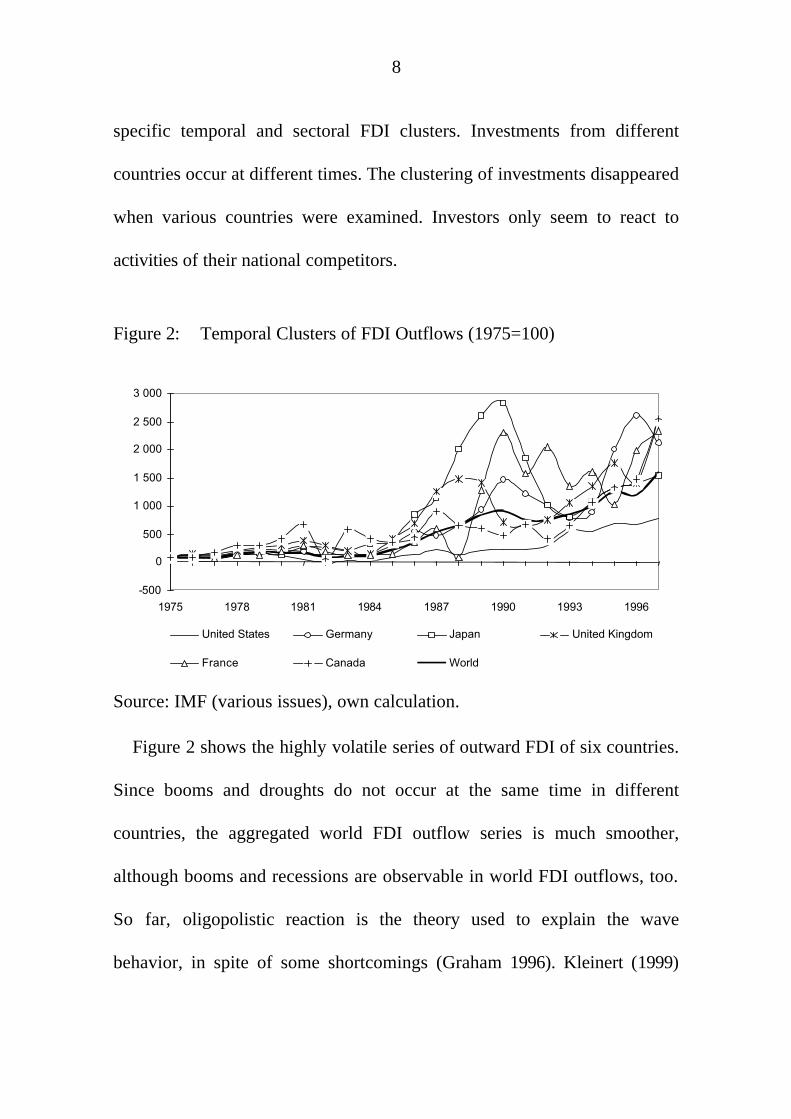
Figure 2: Temporal Clusters of FDI Outflows (1975=100)
-500
0
500
1 000
1 500
2 000
2 500
3 000
1975 1978 1981 1984 1987 1990 1993 1996
United States Germany Japan United Kingdom
France Canada World
Source: IMF (various issues), own calculation.
Figure 2 shows the highly volatile series of outward FDI of six countries.
Since booms and droughts do not occur at the same time in different
countries, the aggregated world FDI outflow series is much smoother,
although booms and recessions are observable in world FDI outflows, too.
So far, oligopolistic reaction is the theory used to explain the wave
behavior, in spite of some shortcomings (Graham 1996). Kleinert (1999)

9
gives another explanation for the wave behavior within a general
equilibrium model of the emergence of MNEs. According to his work,
waves result from changes in the competitive conditions induced by FDI of
a national competitor. Although this approach receives some support from
the empirical results of Flowers (1976), it has not been tested empirically
yet.
The large share of intra-industry FDI is another striking phenomenon.
Cantwell and Sanna Randaccio (1992) presented large and increasing shares
of intra-industry direct investment in the EU. Furthermore, they show that
FDI often takes place in technology-intensive industries. This points to
imperfect competition models (Brainard 1993; Markusen and Venables
1998) as explanation for FDI activity, rather than perfect competition
models (Helpman 1984).
2. International Transfer of Knowledge and Technology
The international transfer of knowledge and technology, measured here as
payments for royalties and licensing fees, rose at about the same rate as FDI
flows in the last two decades. Technology payments increased from $ 12
billion in 1983 to $ 65 billion in 1999 (UNCTAD 1997, 2000). The annual
growth rate of 11.1% in the 1990s even exceeded FDI outflow growth

10
(9.9%). The parallel increase could be a first hint to the dominant role of
MNEs in the international transfer of knowledge and technology.
The regional distribution of royalties and license fees payments (Table 6)
is more strongly dominated by developed countries than the regional
structure of inward FDI stocks (Table 1). This is not surprising, given the
advantage of MNEs in the production of technology intensive goods and
their larger capacity to develop and absorb new technologies. A large share
of all payments for the use of imported technology comes from developed
countries. The regional concentration is even stronger on the receipts side of
royalties and license fees. The U.S. alone received about 58% of all royalties
and license fees in the 1990s, Japan, the U.K., Germany and France 10%,
9%, 6% and 4%, respectively. These large players hold strong positions in
payments as well as in receipts of royalties and license fees. According to
UNCTAD data, international transfer of technology takes place almost
without developing countries. Developed countries account for 98,3% of all
receipts and 88.3% of all payments. Among the developing countries, South
Korea holds the highest shares, with one third of the payments and one fifth
of the receipts within the developing countries group.

11
Table 6: Accumulated Payments of Royalties and Fees (Mill. $, per cent)
World Developed countries
United Statesa
United Kingdom
France Germany Japanb
1980–1989 12 470 17 358
1990–1997 308 756 272 696 47 400 22 530 16 600 37 970 57 610
90–97 / 80–89 3.80 2.19
Share 90–97 88.3 15.4 7.3 5.4 12.3 18.6 a 1982-89 BEA (1999), b1991-1997
Source: IMF (various issues), Bureau of Economic Analysis (1999), own calculations.
A high share of technology flows are intra-firm flows (Table 7). Using
data from the U.S., Japan and Germany, UNCTAD (1997) calculated this
share to be about 80% of all flows. That shows the important role of MNEs
to overcome market imperfections on markets for information goods.
Further, this 80% share documents the internalization advantage, which,
according to the OLI paradigm (Dunning 1980), is necessary for a MNE to
be superior to a licensing agreement with an independent foreign company.
The intra-firm share in Table 7 is biased downwards, because the
numbers of cross-border royalties and license fees include payments for
copyright of software, books, film, live entertainment and other consumer
to

12
Table 7: Cross-Border Royalties and License Fees Receipts (Mill. $)
U.S. Receipts
Intra-Firm Intra-Firm Share
Germany Receipts
Intra-Firm Intra-Firm Share
1982 5 603 3 377 60.3
1990 16 634 13 251 79.7 1 990
1998 36 808 26 761 72.7 3 250 2 454 75.5
Source: Bureau of Economic Analysis (various issues), Deutsche Bundesbank (2000), IMF (various issues), own calculations.
business fees, which cannot be internalized within a firm. The intra-firm
share in business-to-business knowledge transfers is larger than 80% and
did not fall in the 1990s. The falling share in the last decade which is given
in Table 7 results exclusively from increasing importance of technology
payments in the business-consumer-relationship.
Table 6 shows the rise of international technology flows in the
globalization era. New knowledge and technology is spread almost
immediately to other developed countries. This phenomenon can also be
observed from patent applications given in Table 8. Increasingly, patents are
applied for not only to the authorities of the “home country“ but to external
authorities, too. However, patent applications are costly. Therefore,
applications in foreign countries point to a reduction of other sources which
used to protect knowledge as information asymmetries between companies
from different countries. Furthermore, it may point to a faster penetration of

13
foreign markets not only by exports but also by production in foreign
countries.
Table 8: Patent Applications
Germany Japan United States
Year Resident App.
Foreign Sharea (%)
External Ratiob
Resident App.
Foreign Share (%)
External Ratio
Resident App.
Foreign Share
External Ratio
1980 30 582 54.2 2.70 165 730 14.5 0.27 106 218 41.5 1.87
1985 32 708 56.8 2.87 274 348 10.2 0.27 120 589 47.2 2.35
1990 30 928 67.5 5.08 332 952 11.5 0.39 175 333 48.3 3.26
1994 37 199 64.5 5.36 319 344 13.6 0.44 207 255 48.1 5.97
1997 45 105 66.5 9.61 349 211 16.0 1.09 230 336 48.1 13.26 a (Non-resident patent applications / National patent applications)*100
National patent applications = Non-resident patent applications + Resident patent applications. b External patent applications / Resident patent applications.
Source: OECD (2000), own calculations.
The importance of knowledge production, here proxied by the number of
resident patent applications, has increased in all three economies over the
last two decades. This fact and the internationalization of the use of this
knowledge have led to a rising internationalization of knowledge protection.
In 1997, an U.S. company applied (on average) for a patent in the United
States and in 13 other countries, compared to two other countries in 1980.
In the same vein, the foreign share of national applications has grown in all
three countries. Increasing international technology flows are protected by a
rising number of patents given by foreign countries authorities.
14
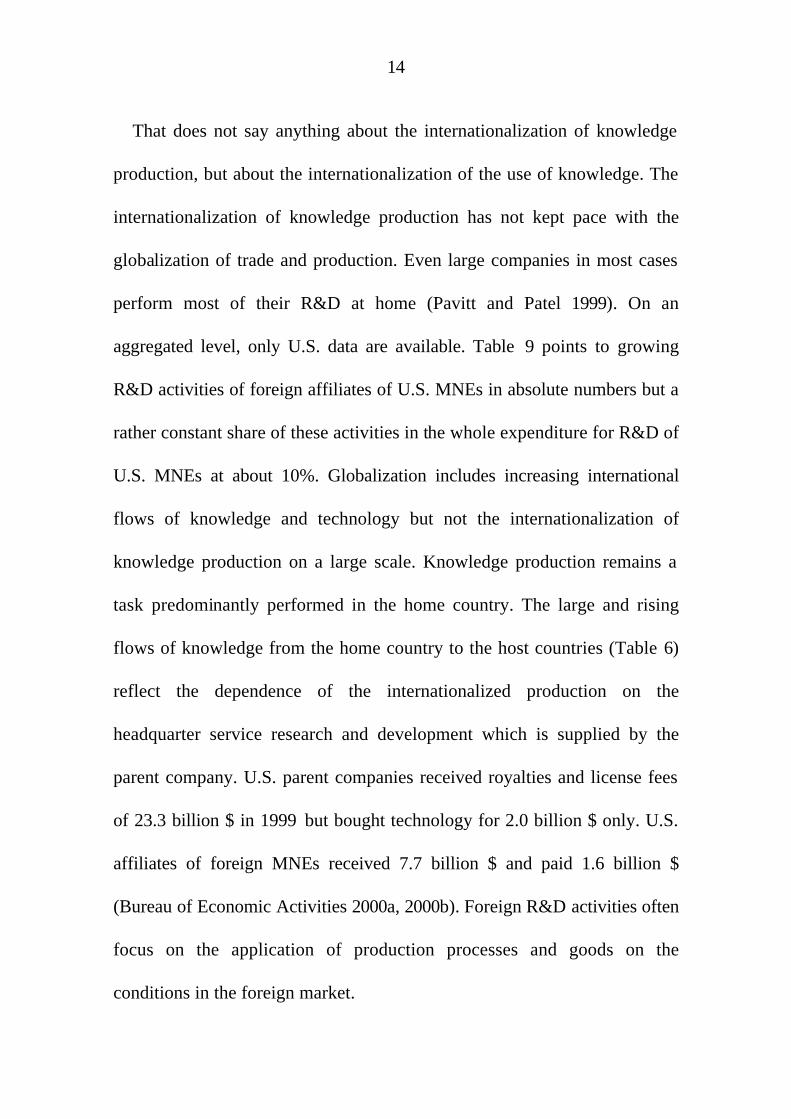
That does not say anything about the internationalization of knowledge
production, but about the internationalization of the use of knowledge. The
internationalization of knowledge production has not kept pace with the
globalization of trade and production. Even large companies in most cases
perform most of their R&D at home (Pavitt and Patel 1999). On an
aggregated level, only U.S. data are available. Table 9 points to growing
R&D activities of foreign affiliates of U.S. MNEs in absolute numbers but a
rather constant share of these activities in the whole expenditure for R&D of
U.S. MNEs at about 10%. Globalization includes increasing international
flows of knowledge and technology but not the internationalization of
knowledge production on a large scale. Knowledge production remains a
task predominantly performed in the home country. The large and rising
flows of knowledge from the home country to the host countries (Table 6)
reflect the dependence of the internationalized production on the
headquarter service research and development which is supplied by the
parent company. U.S. parent companies received royalties and license fees
of 23.3 billion $ in 1999 but bought technology for 2.0 billion $ only. U.S.
affiliates of foreign MNEs received 7.7 billion $ and paid 1.6 billion $
(Bureau of Economic Activities 2000a, 2000b). Foreign R&D activities often
focus on the application of production processes and goods on the
conditions in the foreign market.

15
Table 9: R&D Expenditure of U.S. MNEs and U.S. Affiliates of Foreign MNEs (Million U.S.$, current prices, %)
Year U.S. parents Foreign affiliates of U.S. MNEs
Foreign affiliates Sharea (%)
U.S. affiliates of foreign MNEs
1982 38 157 3 647 8.72 3 744
1989 59 925 7 048 10.52 9 465
1991 67 457 9 358 12.18 11 772
1995 96 500 14 075 12.02 17 500
1998 114 201 14 986 11.60 19 690 b a R&D expenditure of foreign affiliates of U.S. MNEs / (R&D expenditure of U.S. parent +
foreign affiliates of U.S. MNEs)*100, b 1997
Source: Bureau of Economic Activity (various issues), own calculations.
One phenomenon of globalization is the rising speed at which new know
how and technology spreads over national borders, especially among
developed countries. MNEs are the most important vehicle of international
knowledge transfer. Intra-firm transfers of technology account for a very
large share of technology flows. However, the internationalization of
knowledge production has not increased significantly over the last two
decades. The headquarter service knowledge is produced at home and
exported to the foreign affiliates of a MNE. Growing trade in headquarter
services contributes to the rise in trade in services.
3. International Trade
Traditionally, trade has been the most important channel of the integration
of the world economy. It has been only very recently, that the strong rise in
FDI challenges the role of trade in goods and services as the most important

16
aspect of globalization. Since the end of World War II, international trade
has pushed world economic integration. Its growth rates have exceeded
production growth rates by far, pointing to a deepening of integration
(Figure 1).
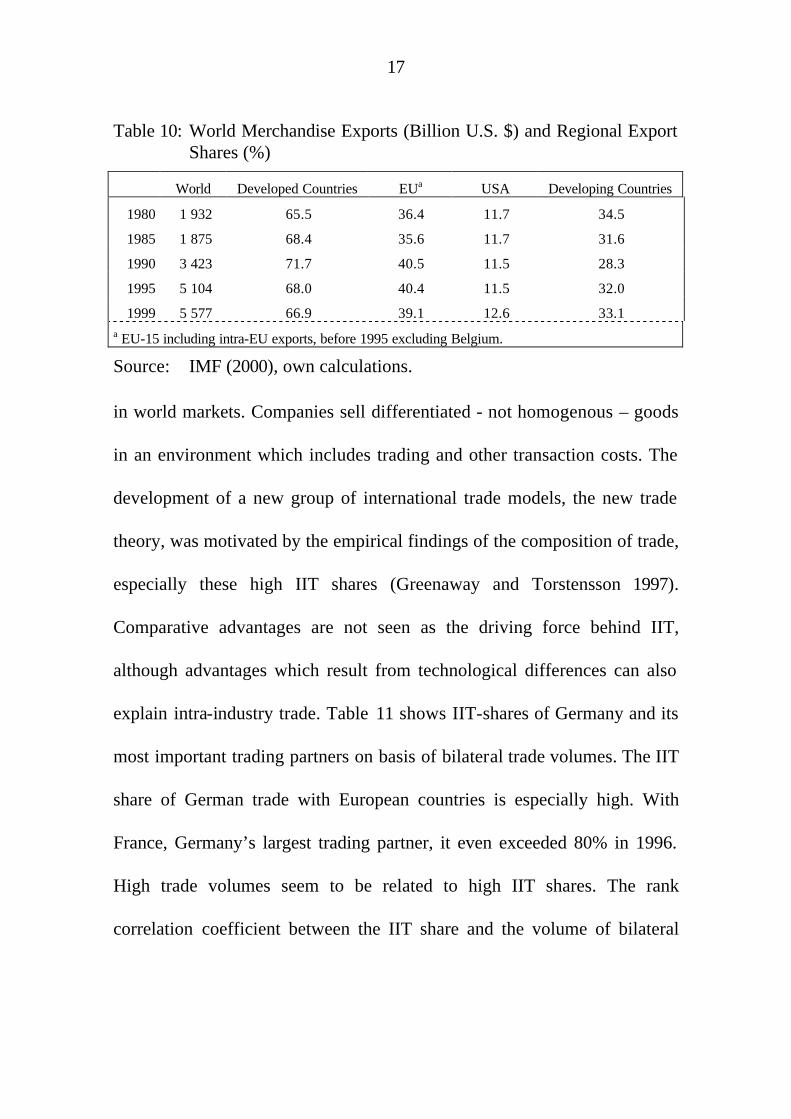
Merchandise exports have almost tripled in nominal terms since 1980.
Like FDI flows and the transfer of know how and technology, trade takes
place mostly among developed countries (Table 10). Their merchandise
export share have remained relatively stable at about two third over the last
two decades. The emergence of the Asian exporting countries has not
changed this dominance of the developed countries. Trade in services has
grown a bit faster than trade in goods. Its share in total trade has risen
marginally to about 20% (WTO various issues) in 1999.
A large share of trade especially between developed countries takes place
within the same industry (Grubel and Lloyd 1971). These high intra-
industry trade (IIT) shares are mainly explained by imperfect competition
17
Table 10: World Merchandise Exports (Billion U.S. $) and Regional Export Shares (%)
World Developed Countries EUa USA Developing Countries
1980 1 932 65.5 36.4 11.7 34.5
1985 1 875 68.4 35.6 11.7 31.6
1990 3 423 71.7 40.5 11.5 28.3
1995 5 104 68.0 40.4 11.5 32.0
1999 5 577 66.9 39.1 12.6 33.1 a EU-15 including intra-EU exports, before 1995 excluding Belgium.
Source: IMF (2000), own calculations.
in world markets. Companies sell differentiated - not homogenous – goods
in an environment which includes trading and other transaction costs. The
development of a new group of international trade models, the new trade
theory, was motivated by the empirical findings of the composition of trade,
especially these high IIT shares (Greenaway and Torstensson 1997).
Comparative advantages are not seen as the driving force behind IIT,
although advantages which result from technological differences can also
explain intra-industry trade. Table 11 shows IIT-shares of Germany and its
most important trading partners on basis of bilateral trade volumes. The IIT
share of German trade with European countries is especially high. With
France, Germany’s largest trading partner, it even exceeded 80% in 1996.
High trade volumes seem to be related to high IIT shares. The rank
correlation coefficient between the IIT share and the volume of bilateral
18
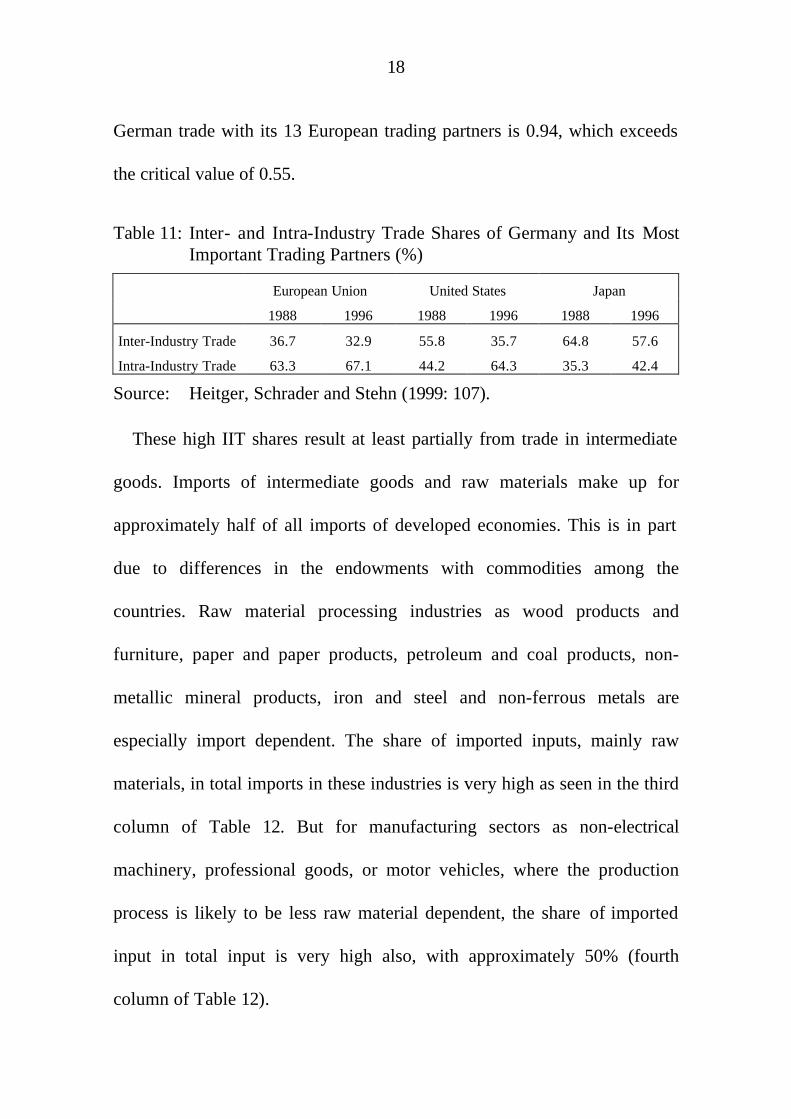
German trade with its 13 European trading partners is 0.94, which exceeds
the critical value of 0.55.
Table 11: Inter- and Intra-Industry Trade Shares of Germany and Its Most Important Trading Partners (%)
European Union United States Japan
1988 1996 1988 1996 1988 1996
Inter-Industry Trade 36.7 32.9 55.8 35.7 64.8 57.6
Intra-Industry Trade 63.3 67.1 44.2 64.3 35.3 42.4
Source: Heitger, Schrader and Stehn (1999: 107).
These high IIT shares result at least partially from trade in intermediate
goods. Imports of intermediate goods and raw materials make up for
approximately half of all imports of developed economies. This is in part
due to differences in the endowments with commodities among the
countries. Raw material processing industries as wood products and
furniture, paper and paper products, petroleum and coal products, non-
metallic mineral products, iron and steel and non-ferrous metals are
especially import dependent. The share of imported inputs, mainly raw
materials, in total imports in these industries is very high as seen in the third
column of Table 12. But for manufacturing sectors as non-electrical
machinery, professional goods, or motor vehicles, where the production
process is likely to be less raw material dependent, the share of imported
input in total input is very high also, with approximately 50% (fourth
column of Table 12).

19
Table 12: Share of Imported Inputs in Total Imports 1990
Country Agriculture, Mining and Manufacturing
Raw Material Intensive Industriesa
Technology Intensive Industriesb
Australia 52.4 80.5 45.5
Canada 55.4 72.4 53.5
Denmark 57.6 86.6 46.5
France 56.5 84.4 47.7
Germany 53.0 77.4 44.8
Japan 70.8 91.7 48.0
Netherlands 63.5 88.5 52.8
United Kingdom 58.2 86.1 53.4
United States 48.4 71.4 40.5 a Wood products and furniture, paper, paper products and printing, petroleum and coal products, non-metallic mineral products, iron and steel, non-ferrous metals. b Industrial chemicals, drugs and medicine, rubber and plastic products, metal products, non-electrical machinery, office & computing machinery, electrical apparatus, radio, TV & communication equipment, shipbuilding & repairing, motor vehicles, aircraft, other transport, professional goods.
Source: OECD (1997), own calculations.
The most interesting group for this paper is the one which is called here
technology intensive industries. The largest share of inputs in the
production of goods in these industries usually comes from the same
industry. Their production process involves many different stages, with
different requirements. Reasons for the import of intermediates can be
manifold. Of course, availability is a motive for trade. Differences in factor
content could be a reason to import some parts from countries with
comparative advantages for the production of this input. Technological
leadership of a company in a foreign country can be another reason to
import the intermediate input. Furthermore, established networks can be the
20
source of increasing intermediate trade when companies internationalize
their production.
Table 13 shows the change of the imported inputs share of the
technology intensive sectors over the 1970s and 1980s.2 The share of
imported inputs to total imports of these technology intensive sectors kept
stable at about 50% over the 1970s and 80s. Only in the United Kingdom the
share increased noticeable from the lowest level of all countries. It
converged to levels of other OECD countries. The trade in intermediate
goods in these sectors increased, therefore, as fast as total trade.
Since total trade has experienced a strong increase in the last three
decades and has grown faster than production, imported inputs used in
production have increased relative to domestic inputs. Table 14 shows
imported intermediate inputs as share of total intermediate goods which are
used in production, compared to its share in total imports which was shown
in Table 12 and 13.
2 More recent data is not available from this OECD Input-Output Dataset.

21
Table 13: Imported Inputs Share in Total Imports of the Technology Intensive Sectors (1970-1990)
Country 1970 1975 1980 1985 1990
Australia 50.7 a 50.2 b 51.7 c 45.5 d
Canada 53.1 e 49.9 f 47.7 g 51.0 c 53.5
Denmark 45.7 h 45.9 i 47.5 47.4 44.3
France 51.6 h 51.6 i 52.6 52.3 47.7
Germany 52.1 j 50.6 c 44.8
Japan 43.3 53.7 60.0 60.1 48.0
Netherlands 54.3 52.3 58.8 g 52.8 c
United Kingdom 35.0 a 48.7 41.3 53.4
United States 40.5 h 41.1 i 40.9 k 44.2 40.5 a 1968, b 1974, c 1986, d 1989, e 1971, f 1976, g 1981, h 1972, i 1977, j 1978, k 1982
Source: OECD (1997), own calculations.
Table 14: Share of Imported Intermediate Goods in Total Intermediates Used in Technology Intensive Sectors
Country 1970 1975 1980 1985 1990
Australia 17.8 a 20.3 b 24.1 c 23.7 d
Canada 31.5 e 33.9 f 34.6 g 40.8 c 40.0
Denmark 45.7 h 45.9 i 47.5 47.4 44.3
France 18.3 h 20.0 i 21.1 24.4 24.6
Germany 15.2 j 16.9 c 16.8
Japan 3.4 3.8 5.0 4.9 5.2
Netherlands 47.4 47.1 52.4 g 49.9 c
United Kingdom 12.6 a 22.8 28.0 30.7
United States 5.1 h 6.3 i 7.5 k 9.3 11.0 a 1968, b 1974, c 1986, d 1989, e 1971, f 1976, g 1981, h 1972, i 1977, j 1978, k 1982
Source: OECD (1997), own calculations.
Table 14 shows large national differences. Small countries tend to rely
much more on imported inputs than large countries do. Due to economies
of scale, large countries can support every stage of production in many

22
differentiated goods more easily than small countries (Hummels et al. 1998).
This could explain the low import shares of intermediate goods used in
production in the United States, Japan and Germany. Especially Germany’s
low share is surprising since it is situated in an integrating area with
generally high trade volumes and a distinct separation of labor. Australia
suffers from its geographical ‘isolation’, which lowers the degree of
openness.
The import share of intermediate goods used by companies in these nine
countries has increased from 14.2% in the early 1970s to 19.3% in 1990.
That is an increase of 36 per cent in 20 years. This figure indicates a higher
integration of these countries into the world economy in the 1990s than in
the 1970s. Larger imports of intermediate goods could be the link between
larger foreign production and larger international trade (Kleinert 2000).
With increasing FDI stocks, the share of production which takes place in
foreign affiliates of MNE has been on the rise, too. Affiliates’ sales in
foreign countries overtook exports in the late 1970s and have continued to
grow at higher rates (Figure 3). Sales of foreign affiliates give the upper
bound of “foreign production“ since they include sales of “pure“ sales units,
which import finished goods and sell them to local consumers. Sales minus
intra-firm exports give the lower bound. All intra-firm exports are thought

23
of as finished goods’ exports, value added generated by processing intra-
firm intermediated exports by foreign affiliates is not accounted for.
Figure 3: Exports and Sales of Foreign Affiliates 1982-1998 (Billion $)
0
2 000
4 000
6 000
8 000
10 000
12 000
14 000
1982 1984 1986 1988 1990 1992 1994 1996 1998
Exports Sales of Foreign Affiliates Sales - Intra-Firm Exports
Source: UNCTAD (1998, 1999).
The expanding MNE network, connected through intense trade relations
between parent companies and affiliates and among the affiliates, could be
the explanation for growing trade and growing production abroad.
Substitution of exports by foreign production may occur but new trade
opportunities are also opened up with the internationalization of production.
In 1994, more than half of all U.S. American MNEs intra-firm exports were
exports in intermediate goods (Bureau of Economic Analysis 1998), the
intermediate goods share of about two-thirds of total exports of Swedish
MNEs in 1990 was even higher (Andersson and Fredriksson 2000).

24
The increase in intra-firm trade volume is well-documented fact.
UNCTAD (1998) estimated the intra-firm trade share of total trade to be
about one third. Table 15 shows the rising share of U.S. MNE intra-firm
trade in the last 20 years. In contrast, intra-firm exports of U.S. affiliates of
foreign MNEs decreased in its share in the total U.S. exports from 11.6% in
1982 to 8.4% in 1998. That slowed the increase in the total intra-firm export
share. In 1998 35.6% of U.S. exports were intra-firm exports compared to
33.5% in 1982 (Bureau of Economic Analysis various issues). However, the
role of MNEs in trade is larger than the 35% intra-firm trade. About 65% of
total U.S. exports in 1998 have been related to U.S. MNEs, i.e. at least one
of the trading partners belonged to an U.S. MNE. Adding the 8% U.S.
exports which are due to foreign MNEs intra-firm trade gives the lower
bound of the role of MNEs on U.S. exports. The role of U.S. and foreign
MNEs in U.S. imports with at least 61% in 1998 is almost as important.
MNEs hold an important position in international trade. Approximately a
third of world wide trade takes place within MNEs, about 80% involve at

25
Table 15: U.S. MNE-related U.S. Exports (Mill. US $, current prices, %)
Year Total Exports U.S. MNE-Related Exports
Intra-U.S. Firm Exports
Share (Intra-Firm/ Total Exports)*100
1982 212 275 163 383 46 559 21.9
1985 218 815 171 904 57 567 26.3
1989 363 836 236 371 86 050 23.7
1991 421 763 262 005 115 258 27.3
1993 465 090 274 666 113 762 24.5
1995 584 742 362 610 149 740 25.6
1997 689 182 441 272 183 062 26.6
1998 682 138 438 292 185 372 27.2
Source: Bureau of Economic Analysis (various issues), own calculations.
least one MNE at one side of the transaction. This trade is increasingly intra-
industry trade and consists to a half of intermediate goods trade.
International trade is concentrated on the developed countries which
intensified their trade relations as can be seen by a stronger rise of trade
relative to production.
4. Conclusion
Globalization is a process which converts separate national economies into
an integrated world economy. This includes a deepening and a widening of
economic integration. The widening results from the inclusion of new
countries like the developing countries of Latin America or the former
socialist countries in Central and Eastern Europe in the global economic
system. The deepening, on which this paper is focused, predominantly takes
place among the developed countries. The intensive use of three channels

26
gave economic integration in the era of globalization a new quality:
international trade, foreign direct investment and international technology
flows.
Internationalization of economic activity is driven to a large extent by
MNEs. At least 80% of all international trade is related to at least one MNE.
A third takes place within MNEs. A large share of it is intra-industry trade
between developed countries. That includes a large share of trade in
intermediate goods. The same holds for FDI, which is strongly concentrated
on developed countries. Intra-industry investment is also large and
concentrated in some industries. FDI flows are more volatile than trade
flows. FDI occurs in waves with different cycles for different countries.
The concentration on developed countries is strongest in technology flows.
Their increase, driven by intra-MNEs flows, which account for 80% of all
flows of technology, points to the internationalization of knowledge and
technology use. However the internationalization of knowledge production
remains rather modest. Research and development remains a headquarter
service which is supplied by the parent company and applied by foreign
affiliates.
The dominant role of large players in the globalization process calls for
an explicit modeling of MNEs in the globalization process. The existence

27
and importance of large players with room for strategic decisions about
trade, FDI, foreign production and technology transfers must be accounted
for in analyses of economic globalization. Therefore, an imperfect
competition framework is needed. Market imperfections, which are essential
for the understanding of MNEs, must be incorporated. Hence, an analysis of
globalization should be based rather on proximity-concentration models à la
Brainard (1993) and Markusen and Venables (1998) than on factor-
proportion theories.

28
Reference List
Andersson, T., and T. Fredriksson (2000). Distinction between intermediate and finished products in intra-firm trade. International Journal of Industrial Organization 18: 773–792.
Brainard, S.L. (1993). A Simple Theory of Multinational Corporations and Trade with a Trade-off between Proximity and Concentration. NBER Working Paper Series 4269. National Bureau of Economic Research, Cambridge, Mass.
Bureau of Economic Analysis of the U.S. Department of Commerce (1999). Survey of Current Business. Washington, D.C.
— (2000). Foreign Direct Investment in the United States. Survey of Current Business 80 (9): 31–60.
Bureau of Economic Analysis of the U.S. Department of Commerce (various issues). Survey of Current Business. Washington, DC.
— (2000). U.S. Direct Investment Abroad. Survey of Current Business 80 (9): 61–90.
Bureau of Economic Analysis of the U.S. Department of Commerce (1998). U.S. Direct Investment Abroad: 1994 Benchmark Survey, Final Results. Washington, DC.
Cantwell, J.A., and F. Sanna Randaccio (1992). Intra-Industry Direct Investment in the European Community: Oligopolistic Rivalry and Technological Competition. Discussion Papers in International Investment and Business Studies, Series B 160. Univ. of Reading, Dep. of Economics, Reading.
Deutsche Bundesbank (2000). Technologische Dienstleistungen in der Zahlungsbilanz. Statistische Sonderveröffentlichung 12. Frankfurt am Main.
Dunning, J.H. (1980). Towards an Eclectic Theory of International Production: Some Empirical Tests. Journal of International Business Studies (11): 9–31.
Flowers, E.B. (1976). Oligopolistic Reaction in European and Canadian Direct Investment in the United States. Journal of International Business Studies (7): 43–55.

29
Graham, E.M. (1996). The (not Wholly Satisfactory) State of the Theory of Foreign Direct Investment and the Multinational Enterprise. Economic Systems 20 (2/3): 183–206.
Greenaway, D., and J. Torstensson (1997). Back to the Future: Taking Stock on Intra-Industry Trade. Weltwirtschaftliches Archiv 133 (2): 249–269.
Grubel, H.G., and P.G. Lloyd (1971). The Empirical Measurement of Intra-Industry Trade. The Economic Record 47: 494–517.
Heitger, B., K. Schrader, and J. Stehn (1999). Handel, Technologie und Beschäftigung. Kieler Studie 298. Tübingen: Mohr Siebeck.
Helpman, E. (1984). A Simple Theory of International Trade with Multinational Corporations. Journal of Political Economy 92 (3): 451–471.
Hillebrand, R., and P.J. Welfens (1998). Globalisierung der Wirtschaft. In D. Cassel (ed.), 50 Jahre Soziale Marktwirtschaft, Vol. 57. Stuttgart.
Hummels, D.L., D. Rapoport, and K.-M. Yi (1998). Vertical Specialization and the Changing Nature of World Trade. Economic Policy Review 4 (2): 79–99.
IMF (International Monetary Fund) (various issues). Balance of Payments Statistics Yearbook. Washington, D.C.
— (2000). International Financial Statistics . Washington.
Kleinert, J. (2000). Growing Trade in Intermediate Goods: Outsourcing, Global Sourcing or Increasing Importance of MNE Networks? Kiel Working Papers 1006. The Kiel Institute of World Economics, Kiel.
— (1999). Temporal Clusters in Foreign Direct Investment. Kiel Working Papers 930. The Kiel Institute of World Economics, Kiel.
Klodt, H. (1999). International Direct Investment: Export of Headquarter Services or Export of Jobs? In W. Filc, and C. Köhler (ed.), Macroeconomic Causes of Unemployment: Diagnosis and Policy Recommendations. Berlin: Dunker&Humblot.
Knickerbocker, F.T. (1973). Oligopolistic Reaction and Multinational Enterprise. Boston: Havard University.
Markusen, J.R., and A.J. Venables (1998). Multinational Firms and the New Trade Theory. Journal of International Economics 46 (2): 183–203.
OECD (2000). Basic Science and Technology Statistics. MAXDATA CD-ROM. Paris.

30
OECD (1997). The OECD Input-Output Database. Paris.
Pavitt, K., and P. Patel (1999). Global Corporations and National Systems of Innovation: Who Dominates Whom? In D. Archibugi, J. Howells, and J. Michie (ed.), Innovation Policy in a Global Economy. Cambridge: University Press.
Siebert, H. (1999). The World Economy. London: Routledge.
UNCTAD (1997). World Investment Report 1997. New York.
— (1998). World Investment Report 1998. New York.
— (1999). World Investment Report 1999. New York.
— (2000). World Investment Report 2000. New York.
World Trade Organization (various issues). Annual Report. Geneva.