Embed Size (px)
Citation preview

Wayne State University
Wayne State University Dissertations
1-1-2011
The role of organizational climate and culture inservice encountersBeth Ann HeyartWayne State University,
Follow this and additional works at: http://digitalcommons.wayne.edu/oa_dissertations
Part of the Business Administration, Management, and Operations Commons, and theCommunication Commons
This Open Access Dissertation is brought to you for free and open access by DigitalCommons@WayneState. It has been accepted for inclusion inWayne State University Dissertations by an authorized administrator of DigitalCommons@WayneState.
Recommended CitationHeyart, Beth Ann, "The role of organizational climate and culture in service encounters" (2011). Wayne State University Dissertations.Paper 240.

THE ROLE OF ORGANIZATIONAL CLIMATE AND CULTURE IN SERVICE ENCOUNTERS
by
BETH HEYART
DISSERTATION
Submitted to the Graduate School
of Wayne State University,
Detroit, Michigan
in partial fulfillment of the requirements
for the degree of
DOCTOR OF PHILOSOPHY
2011
MAJOR: COMMUNICATION
Approved by: _______________________________ Advisor Date _______________________________
_______________________________
_______________________________

© COPYRIGHT BY
BETH HEYART
2011
All Rights Reserved

ii
DEDICATION
I would like to dedicate this dissertation to the following people:
to my immediate family
My husband Rob has supported me throughout this long endeavor. Without his understanding and guidance I would never have been able to complete this project. My children, Robert,
Justin, and Tori have also given me hugs and encouragement when needed. They have been a source of motivation by asking “Mommy is your paper done yet?” I can now say “Yes!”
to my cousin, friend and colleague, Dave Cichocki
Dave has been very supportive of my work throughout the entire process. He has offered guidance and encouragement. His support of my work is very much appreciated.
to my sister, Tricia Molnar
Tricia has always achieved excellence in her academic pursuits. Her determination and perseverance to obtain advanced degrees has motivated me to achieve my own academic goals.
to my father, Frank Olszewski
My dad has always been an inspiration in my life. He has always assured me that, “Education is an opportunity.” I heard this phrase throughout my academic career but it has never had more
meaning than now at the end of this dissertation process.
and to my mom, Marie Olszewski
My mom has always been someone who was there with a shoulder to cry on or to provide words of encouragement. However, now her strength and determination with her own challenges has
proven to me that courage comes from within and obstacles must be faced head on.

iii
ACKNOWLEDGMENTS
I would like to acknowledge the following people who contributed to this project.
Without the help of these individuals, the project would never have been completed. I sincerely
appreciate all their time, attention, and hard work.
First, I would like to acknowledge my committee. Dr. Matt Seeger, who is chair of my
committee, has spent countless hours reviewing many drafts and offering his suggestions and
guidance. He has always made time for me and was able to keep me moving forward throughout
the process even though he had many other demands on his time. Dr. Ed Riordan, my outside
committee member, has been with the committee from the start. His continued support,
feedback and dedication to the project are very much appreciated. A special note of thanks is
given to Dr. Julie Novak and Dr. Pradeep Sopory for joining the committee mid-way. Their
willingness to support an additional doctoral candidate and to dedicate significant time to the
completion of my study has been a blessing.
I’d also like to acknowledge two members of my original committee who have since
moved on to other endeavors: Dr. Julie Apker, Associate Professor of Communication at
Western Michigan University and Dr. Jack Kay, Provost and Executive Vice President of
Eastern Michigan University. Both of them helped to launch this investigation and provided
guidance when needed.

iv
TABLE OF CONTENTS
Dedication ....................................................................................................................................... ii
Acknowledgments.......................................................................................................................... iii
List of Tables ................................................................................................................................. vi
List of Figures ............................................................................................................................... vii
Chapter 1 “Review and Discussion of Relevant Literature” ...........................................................1
Service and the Quality Movement ..............................................................................................3
Overview of Customer Service ....................................................................................................4
Overview of Climate ..................................................................................................................13
Overview of Culture ...................................................................................................................21
Key Differences and Research Overlap .....................................................................................33
Guiding Questions of Interest ....................................................................................................37
Chapter 2 “Research Methodology” ..............................................................................................39
Study Rationale and Research Questions ...................................................................................39
Method .......................................................................................................................................48
Research question one: Survey ...............................................................................................51
Research question two: Ethnography .....................................................................................55
Chapter 3 “Results”........................................................................................................................62
Results of Research Question One Comparing Climate Between the Hospital Units ...............62
Results of Research Question Two Comparing Culture Between the Hospital Units ...............68
Chapter 4 “Discussion” ................................................................................................................109
Research Question One ............................................................................................................109
Research Question Two ...........................................................................................................113

v
Research Question Three .........................................................................................................122
Implications ..............................................................................................................................126
Limitations ...............................................................................................................................130
Conclusion ................................................................................................................................133
Appendix A “Schneider, White and Paul’s (1998) Assessment of Service Climate Instrument .134
Appendix B “Litwin and Stringer’s Climate Questionnaire (Form B) Listed by Scale ..............136
Appendix C “Final Survey Instrument” .......................................................................................138
Appendix D “List of Interview Questions” .................................................................................142
Appendix E “Demographics by Job Classification for Survey” ..................................................143
Appendix F “Demographics by Job Classification Collapsed by Unit” ......................................144
Appendix G “Demographics by Tenure for Survey” ...................................................................145
Appendix H “Observation Time Matrix ......................................................................................146
Appendix I “Unit A1 Layout”......................................................................................................147
Appendix J “Unit B1 Layout”......................................................................................................148
Appendix K “Human Investigation Committee Continuation Approval Form” .........................149
References ....................................................................................................................................150
Abstract ........................................................................................................................................171
Autobiographical Statement.........................................................................................................172

vi
LIST OF TABLES
Table 1: Summary of Reliability for Survey Instruments .............................................................64
Table 2: Intercorrelations for ten scale measures ..........................................................................65
Table 3: Summary of Mean Differences between Hospital Units .................................................67
Table 4: Observation Categories derived from Observational Notes on Unit A1 .........................74
Table 5: Observation Categories derived from Observational Notes on Unit B1 .........................86
Table 6: Question #4:What is your impression about the level of service quality performed on this unit? .........................................................................................................................92
Table 7: Question #12: Do you believe that the unit values service quality? ................................94 Table 8: Question #5. Can you provide an example of something that has happened on the unit
that would be considered giving high quality service to patients? .................................95 Table 9: Question #2. What is one thing that you like about your position? .................................98 Table 10: Question #3. What is one thing that you don’t like about your position? ...................100 Table 11: Results of the hospital employee opinion survey by unit ............................................106

vii
LIST OF FIGURES
Figure 1: Data Collection Timeline ..............................................................................................49
Figure 2: Data Collection Timeline Revised .................................................................................50

1
Chapter 1
Review and Discussion of Relevant literature
Emphasizing customer service is one method employed by organizations to differentiate
themselves from competitors and improve profits. Drucker (1954) argues that a company
prospers if its most important asset, customers, is satisfied. Alternatively, organizations must pay
to obtain new customers. Engel, Blackwell, and Miniard (1995) advise that “it is generally less
expensive to hold onto present customers than to attract new ones” (p. 277). In fact,
organizations will spend five times as much to find a new customer than to maintain an existing
one (Rust & Zahorik, 1993). Part of the impact of dissatisfaction of current customers is directly
linked to negative evaluations spread through word-of-mouth. For example, Hospital Peer
Review (2001) indicated that one patient’s negative emergency room experience can impact
admissions for up to five years. Keeping current customers satisfied improves profits and helps
ensure organizational success.
Because service quality is a determinant of store loyalty, intent to recommend the store to
others, intent to increase purchases, and intent to continue purchasing (Gagliano & Hathcote,
1994; Sirohi, McLaughlin & Wittink, 1998), organizations need to monitor customer perceptions
and survey internal environments to determine elements promoting positive customer ratings.
The service provider, the customer, and the environment are the three antecedent variables
generally recognized as determining the outcome of customer satisfaction (Ford & Etienne,
1994). Organizations have the opportunity to influence two of the three components: the service
provider and the environment. Most research on customer service hails from the business
literature and concentrates on the behavioral or attitudinal characteristics of the customer and the
service provider. Communication scholars have devoted little attention to studying

2
organizational aspects that affect either service provider behavior or the service environment
(Ford, 1999).
This goal of this dissertation is to expand the knowledge of customer service research by
illuminating the link between organizational climate and culture to customer perceptions of
service quality. The investigation compares two subgroups within a service organization. One
sub-group received significantly higher customer service ratings compared to the other. Both
subgroups will be analyzed using an ethnographic assessment of culture and a survey instrument
of climate. The general thesis of this dissertation is that organizational culture and climate may
account for disparate service evaluation ratings.
Climate and culture investigation will be instrumental in broadening our understanding of
the impact of organizational practices on customer perceptions of service quality. Reichers and
Schneider (1990) define climate as the “shared perceptions of organizational policies, practices,
and procedures, both formal and informal” (p. 22). Organizational culture also has the potential
to explain differences in customer perceptions of service quality. Culture is the common
understanding of the values, expectations, and beliefs within an organization (Van Maanen &
Schein, 1979). Simpson and Cacioppe (2001) indicate “there is increasing recognition that
organization culture directly affects performance and the quality of customer service.”
Organizations having a culture and climate of service will value customer needs and have
providers who bring service issues to management attention.
The current chapter reviews the relevant service, climate and culture literature. Chapter
two describes the research questions and methods selected in this study. Chapter three
summarizes the research findings. Finally, chapter four considers the research implications and
limitations. This study will help managers understand how organizational factors can ultimately
affect customer evaluations of service quality. The following literature review begins with a brief

3
survey of the quality movement before addressing customer service research. Next, the two
organizational concepts, climate and culture, that can potentially influence service encounter
outcomes are explored. Finally, the three questions of interest guiding the research project are
presented.
Service and the Quality Movement
The quality movement began in the United States in the early 1980s (Cole, 1995).
Cameron and Thompson (2000) explain prior to that time, the scholarly literature referred to
quality as an attribute an organization was trying to achieve such as reducing error rates or
enhancing reputations. However, following improvements by the Japanese quality revolution,
researchers started “using quality as the dependent variable of choice” (Cameron & Thompson,
p. 217). Quality research generally falls into one of three agendas: keeping a customer focus,
instituting continuous improvement and incorporating teamwork (Dean and Bowen, 2000).
Dean and Bowen (2000) contend the customer focus is the most important principle of
the quality movement. “The goal of satisfying customers is fundamental to TQ (total quality)
and is expressed by the organization’s attempt to design and deliver products and services that
fulfill customer needs” (Dean & Bowen, p. 5). The term customer refers to both external and
internal customers. The guiding assumption is that customer satisfaction is the key to long-term
organizational success. To achieve this goal, the entire company must focus on customer needs.
Practices such as collecting customer expectations, providing this information to employees, and
promoting customer interaction will foster a customer focus.
Price and Chen (1995) describe three customer perceptions of quality: expected,
satisfying, and delightful. Expected quality refers to attributes of either products or services that
customers expect to receive without asking. Customers will be very dissatisfied if the expected
features are absent. Satisfying quality refers to customer requested features. When the attributes

4
are present, customers are satisfied but their expectations are not necessarily exceeded. Finally,
delightful quality is when customers receive attributes that they did not know existed. When
received customers are pleased; when absent customers are not dissatisfied. This type of quality
exceeds customer expectations. Price and Chen suggest that expected quality must be met to
prevent dissatisfaction, satisfying quality should be given to meet customer expectations, and
delightful quality, if delivered, will enhance service and product differentiation.
The quality movement was successful in helping organizations to achieve better
performance, however, some researchers lament over the number of organizations that have been
unsuccessful in initiating total quality management or TQM (McNabb & Sepic, 1995; Detert,
Schroeder, & Mauriel, 2000). Failure of implementation is normally attributed to ineffective
management. McNabb and Sepic (1995) believe that the failure of TQM or any change initiative
can be directly linked to “the fundamental, pervasive culture of the organization and the
operating climate that culture instills in its employees” (p. 369). Detert, Schroeder, and Mauriel
(2000) agree. One example offered by the researchers is a company whose culture is biased
against conflict. TQM’s nature is to challenge existing corporate policies. By not recognizing
the culture of this organization, implementation failure is the likely result. Both the
aforementioned research studies indicate the need to consider the impact of organizational
culture and climate on quality change implementation. The next section provides an overview of
the customer service research.
Overview of Customer Service
The variable of service quality is linked and often used interchangeably with the term
customer satisfaction (Oliver, 1997; Parasuraman, Zeithaml, & Berry, 1994). However, Oliver
(1997) explains that service quality is a cognitive judgment whereas satisfaction is an affective

5
reaction. Fundamentally, service quality and customer satisfaction judgments are based on gaps
between observed and expected performance during service encounters.
The service encounter is the interaction between the service provider and the customer
(Blackman, 1985; Suprenant & Solomon, 1987; Kelley, Donnelly, & Skinner, 1990; Crosby,
Evans, & Cowles, 1990). Davis and Luthans (1988) claim “it is the front-line employee that
directly interacts with the customer face-to-face everyday in forming the perception of quality
service” (p. 79). Ford (1998) explains that “during this moment, an organizational representative
presents products or professional assistance in exchange for a customer’s money or cooperation.
This exchange is inherently a communication process” (p. 3).
Parasuraman, Zeithaml, and Berry (1985) identified three basic service quality
assumptions. First, evaluating service quality is more difficult than assessing goods quality.
Second, a perception of service quality is a comparison of expectations to actual performance.
Finally, customer evaluations are not just based on the service outcome. Instead, perceptions are
created throughout the encounter. They identify three characteristics of services: intangibility,
heterogeneity, and inseparability. Intangibility means that services cannot be inventoried.
Heterogeneity explains that services vary depending upon the producer and the customer.
Finally, inseparability is when production and consumption occur simultaneously. These three
assumptions and characteristics make it difficult to evaluate how consumers perceive service
quality.
Researchers are also conducting studies to isolate various aspects of the service
encounter. Ford and Etienne (1994), for example, created a framework identifying three focal
points of the customer service literature: predictor variables, provider service behavior variables
and responses to service encounters. Studies investigating the antecedent conditions of the
service encounter are classified as predictor variables. Research addressing the tactics used by
6
front-line personnel during customer interactions is considered provider service behavior
variables. Finally, the response component includes research that highlights the encounter
outcomes. For the purpose of this review, predictor variables are considered because this
research centers upon understanding the conditions prior to a service encounter.
Predictor variables.
Predictor variables may be classified into three areas: customer variables, provider
variables, and context variables. Ford and Etienne (1994) provide the following definitions:
Customer variables are demographic or behavioral traits of customer participating in the encounters. Likewise, provider variables are demographic or behavioral traits of service providers participating in the encounters. Finally, context variables are features of the environment in which the encounters take place. All three categories of predictors have been linked to provider behaviors in customer service encounters. (p. 421)
Customer, provider, and context variables establish the antecedent conditions of the service
encounter. In essence, these variables are expected to predict customer perceptions of the overall
service encounter. Of the three, provider and context variables can be influenced by
organizational efforts. In order to understand how the current study fits with previous research, a
review of these two variables is warranted.
Provider variables.
Service providers’ personal characteristics, such as gender, identification with the
organization, emotional expression, communicative style, and effort can affect the service
encounter. Gender results have been mixed. Juni, Brannon, and Roth (1988), for example,
found that companies tend to hire women to fill customer service positions. Moshavi’s (2004)
research questions this practice. His study revealed that customers were equally satisfied with
either gender in phone-based service encounters. However, Moshavi did find that customers
favored providers of the opposite gender. Rafaeli (1989a) discovered that male cashiers display
less positive emotion than do female cashiers. Ford (1993) found that male cashiers were less

7
attentive than were female cashiers. Thus, customers may not view male cashiers as providing
high service. However, Fischer, Gainer, and Bristor, (1997) found that customer preferences of
service provider gender varied based on the context.
Identification with the organization is another area of inquiry relevant to service and
tends to focus on uniforms and emotional labor. For example, Rafaeli (1989b) explained service
providers are identified as part of the organization when wearing a uniform or a nametag. Once
identified, providers are expected to conform to organizational norms. Rafaeli suggested that this
phenomenon could be explained by Self-awareness theory, suggesting that when an employee is
at work, the uniform represents a way to see themselves. This “organizational self” makes the
employee evaluate their behavior in terms of organizationally expected behavior. Employees,
under this theory, would seek to bring their behaviors in line with company policy.
Ashforth and Humphrey (1993) define the concept of emotional labor as the display of
expected organizational emotions during service encounters. Emotional labor pressures the
provider to identify with the service role. Rafaeli (1989b) and Rafaeli and Sutton (1990) for
example found that those providers who wore uniforms and badges displayed more emotion
towards customers. Other aspects of provider emotional behavior include friendliness and
personality. Brown and Sulzer-Azaroff (1994) analyzed provider friendliness in terms of
smiling, greeting, and looking at the customer to determine the impact on customer satisfaction.
They found that greetings within the first three seconds of the service encounter correlated
significantly with overall satisfaction ratings. Further, Hurley (1998) found that provider
personality influenced customer service ratings. Providers that were more extroverted and
agreeable to customers were rated as more effective.
The concept of emotional labor was elaborated further by Grandey (2000). He developed
a theoretical model of the emotional regulation process. The model identifies situational cues,

8
individual factors and organizational factors as influencers of emotional labor. The model is
useful because it explains the varying long-term consequences of individual and organizational
well-being. Totterdell and Holman (2003) tested Grandey’s model. They concluded that the
model offers a method to understand emotional labor, but caution that the model lacks a method
to address the variety of motives for emotional regulation.
Communication style research has been mixed. Williams and Spiro (1985) correlated
communication style and sales levels. Customers and providers were evaluated as having an
interaction, task or self-oriented communication style. Sales increased when both the provider
and customer are interaction oriented or if the customer is task or self-oriented and the sales
person is self-oriented. Salespeople who were task oriented did not achieve higher sales.
Therefore, salespeople may benefit by altering their communication between the interaction or
self-oriented style depending on the style used by their customer. On the other hand, Ketrow
(1991), and later supported by Comstock and Higgens (1997), found that buyers prefer service
providers who are task oriented. If service providers are focusing on the task (completing the
sale) then emotional displays will have less priority. The opposite is true for longer encounters.
This is probably due to the fact that when stores are slow, providers can spend more time and
focus on the emotional aspects of the encounter.
The communication style of a service provider may be based on personality variables.
Liao and Chuang (2004) considered the effects of conscientiousness, extraversion, neuroticism
and agreeableness on employee service performance. They found that conscientiousness and
extraversion demonstrated significant positive association with performance levels.
Finally, customers appear to recognize provider effort. Mohr and Bitner (1995)
discovered that customers will rank the quality of service higher when perceived effort is high.
Thus, providers through their own behaviors can influence customer perceptions. Further efforts

9
to personalize the service can also influence customer perceptions. “‘Personalized service’ refers
to any behaviors occurring in the interaction intended to contribute to the individuation of the
customer” (Surprenant & Solomon, 1987, p. 87). By customizing the presentations of products,
providers enable customers to feel special by having their specific needs met.
Gender, identification, emotional expression, communicative styles and service provider
effort will affect customer perceptions. Organizations can use this information to establish a
stronger connection with their customers by influencing the behaviors and expressions of service
providers. The last antecedent condition, context variables, offers another method for companies
to impact the service encounter outcome.
Context variables.
The context variables that become service level predictors include store busyness,
internal service quality, employee satisfaction, staff empowerment, customer empowerment,
organization sponsored interventions, and perceptions. Researchers (Sutton & Rafaeli, 1988;
Rafaeli, 1989b; Rafaeli & Sutton, 1990) have found a negative relationship between the aspects
of store busyness and the use of positive emotional displays. Store busyness includes line length,
store sales, time of day, and overall store busyness. When stores are slower, cashiers welcome
customers and provide more positive emotional displays. When stores become busy, cashiers
become tense, focus on job tasks, and display less positive emotions. Finally, Kumar, Kalwani,
and Dada (1997) found that waiting experiences tend to be negatively related to customer
satisfaction evaluations of service and product attributes. Based upon this relationship, many
companies have instituted waiting guarantees. For example, if a customer waits longer than four
minutes in line, he/she will receive something free from the store.
Hallowell, Schlesinger, and Zornitsky (1996) found that internal service quality is also
important and linked to customer satisfaction. Internal service quality is “employee satisfaction

10
with the service received from internal service providers” (Hallowell et al., 1996, p. 21). Factors
that account for internal service quality include measures of tools, policies, teamwork,
management, goal alignment and training. Tools enable workers to serve customers.
Organizational policies should facilitate serving customers. Teamwork refers to the degree of
working together within and between departments. Management should support the employee’s
ability to serve customers. Goal alignment refers to the consistency between front line workers
and management’s view of customers. Finally, training should be conducted in a timely and
efficient manner. These six factors of internal service quality relate to a concept called service
capability. Having high service quality and capability lead to increased customer satisfaction
and employee job satisfaction. They conclude that organizations should focus on internal
organization characteristics in order to obtain better satisfaction ratings.
Other researchers have supported this concept of internal service quality. Schneider and
Bowen (1994) found a strong correlation between customer experiences of quality and employee
beliefs about customer quality attributes. In addition, customer experiences are statistically
significant when related to employee reports of work facilitation. Therefore, a strong sense of
internal customer service focus will result in increased levels of customer perception of service
quality. Further, Saxe and Weitz’s (1982) study found that salespeople who believed the context
enabled them to better assist customers tended to demonstrate more customer-oriented selling
behaviors. Context variables included the matching of products to needs of customers, support
from co-workers, customer’s willingness to spend the time needed, and the non-price factors of
the purchase decision.
Employee satisfaction also appears to be an important component. Several health care
studies have found that employee satisfaction was directly related to patient perceptions of
hospital quality and hospital loyalty (Atkins, Marshall, & Javalgi, 1996; Clark, Wolosin &
11
Gavran, 2007). Moshavi (2004) reiterated the importance of employee satisfaction on customer
service ratings. He explained that because service is intangible, employee attitudes take on
primary importance in social exchanges. Others have focused on detriments to employee
satisfaction. For example, Zeithaml, Parasuraman and Berry’s (1990) study identified barriers to
effective service. These include interpersonal relationships with peers, role conflict and
ambiguity, performance and reward systems, and autonomy. Each aspect can negatively impact
employee satisfaction resulting in lower customer service ratings.
Staff empowerment has been used to increase customer service evaluations. Sparks,
Bradley, and Callan (1997) found that front line employees who are empowered and exhibit
accommodating communication styles receive greater satisfaction ratings from customers.
Empowered workers would be beneficial when the product can be customized. If the industry is
one in which there is little customer contact, then empowered workers may not be beneficial.
The empowered customer has also been studied in service encounters. In order to combat
customer service problems, some companies are taking a customer-participation approach.
Brond (1997) explains that companies allowing customer input during the service encounter are
more likely to adjust service quality during a transaction to meet customer expectations. They
recommend three strategies: (1) target the customers that would most appreciate participation in
the service encounter, (2) make customers aware of realistic expectations in the service
transaction, and (3) contact the customer within two weeks to provide a quality check. This
follow-up will also serve to remind the customer of the organization’s customer service priority.
Organization-sponsored interventions such as feedback systems, management strategies,
and training programs have also been assessed. Elizur (1987) found that feedback improved
teller use of attentive behavior. Employees were praised when they exhibited smiles, positive
verbal responses, or eye contact with customers. Hartline and Ferrell (1996) indicate that service

12
quality perceptions increased when management increased job satisfaction and self-efficacy and
reduced ambiguity and role conflict of workers. Finally, training interventions can impact service
effectiveness (Milne & Mullin, 1987). For example, hairdressers who received social support
and counseling training received higher service ratings.
The last area of context variable research is labeled perceptions. Yoon, Seo, and Yoon
(2004) examined a variety of support sources for contact employees. They found that perceived
customer support and perceived organizational support significantly influence provider service
efforts. Perceived customer support includes how providers assess the communication behaviors
of customers. Customers that behave more positively receive greater service effort. This is
similar to the results of perceived organizational support. When providers feel that they are
valued and that their contributions are recognized by the organization, providers will increase
service efforts. Increased service effort was found to influence customer perceptions of service
quality.
In summary, context variables such as store busyness, internal service quality, employee
satisfaction, staff empowerment, customer empowerment, organization sponsored interventions,
and perceptions help to predict customer ratings of service quality. The three antecedent
conditions of customer, provider and context variables need to be considered by organizations
when assessing customer service quality levels. Organizations may influence customer
perceptions of service quality by impacting provider and context variables.
For the current research, provider and context variables are important because they are
largely within an organization’s control. Policies instituted by upper management shape
employee behavior which impacts customer perceptions of service quality. Researchers have
found that problems with service quality follow the 85/15 rule (Ford, Bach & Fottler, 1997).
Eighty five percent of the time, the problem is a result of practices, processes, or structures

13
within the organization. Organizations need to identify what elements can be modified in order
to achieve higher service quality levels. By examining the internal climate and culture,
organizations will be better equipped to eliminate problematic characteristics and promote
positive elements that lead to higher service ratings. The following two sections provide an
overview of the climate and culture research.
Overview of Climate
Climate has become a major research theme in organizational communication. Putnam
and Cheney (1985) consider communication climate to be one of the “traditional domains” of
research. Similarly, Wert-Gray, Center, Brashers, and Meyer’s (1991) review of organizational
communication research identified climate as one of three prominent areas of inquiry. Finally,
Jablin (1980) describes climate as one of the two most important organizational research areas.
Given the numerous studies, it is not surprising that Redding (1972) claimed “the ‘climate’ of the
organization is more crucial than are communication skills or techniques (taken by themselves)
in creating an effective organization” (p. 111). Climate research offers significant potential to
describe and understand employee behavior (Hellriegel & Slocum, 1974). This section presents
the topics of climate definitions, climate assumptions and climate research in order to understand
this organizational concept.
Climate definitions.
Although a plethora of studies dating from the 1960s have investigated climate, a general
definition is elusive. Rather, researcher’s perspective orients definitions. For instance, some
define climate by its characteristics. Tagiuri and Litwin (1968) define organizational climate as
“the relatively enduring quality of the internal environment of an organization that (a) is
experienced by its members, (b) influences their behavior, and (c) can be described in terms of
the values of a particular set of characteristics (or attributes) of the organization” (p. 27). Poole

14
(1987) describes climate as “a relatively enduring quality of the environment that is experienced
and perceived by individuals; influences individual interpretations and actions; and can be
described in terms of a particular set of characteristics which describe a system’s practices,
procedures, and tendencies” (p. 2). Schneider (1975) conceptualizes climate this way:
Climate perceptions are psychologically meaningful molar descriptions that people may agree characterize a system’s practices and procedures. By its practices and procedures a system may create many climates. People perceive climate because the molar perceptions function as frames of reference for the attainment of some congruity between behavior and the system’s practices and procedures. (p. 474)
Schneider’s idea of “congruity” demonstrates an individual’s need for understanding. Rentsch
(1990) reflects this by concluding that the study of organizational climate research has shifted
from perceptions of organizational characteristics to a focus on sense making. Finally,
definitions have also emphasized a communicative element. Johnson (1977) referred to climate
as the ‘pattern of how people talk to one another as well as what people talk about’ (p. 124), and
Jablin (1980) defines communication climate as “the measurement of employee’s perceptions
and attitudes of selected communication-related events, activities, and behaviors” (p. 328).
These definitions and others allude to two types of climate: organizational and psychological.
Researchers have identified different perspectives for labeling climate. James and Jones
(1974) propose that organizational climate refers to organizational attributes and psychological
climate relates to individual attributes. This supported Litwin and Stringer’s (1968) concept of
organizational climate that included structures, individual job responsibility, and rewards. Later,
psychological climate was associated with communication climate. Ireland, Van Auken, and
Lewis (1978) explain that communication climate refers to trust and openness shared by
individuals.

15
Kurt Lewin and his associates conducted the first psychological climate studies in the
1930s, and later McGregor (1960) introduced psychological climate to the field of organizational
behavior (Jablin, 1980). McGregor observed:
The day-to-day behavior of the immediate superior and of other significant people in the managerial organization communicates something about their assumptions concerning management which is of fundamental significance. Many subtle behavioral manifestations of managerial attitude create what is often referred to as the ‘psychological climate’ of the relationship. (pp. 133-134)
McGregor’s definition centers on the subtle communication patterns developed in organizations.
Although McGregor introduced “psychological climate,” Redding (1972) became known
for conceptualizing the “ideal communication climate” construct that includes supportiveness;
participative decision-making; trust, confidence, and credibility; openness and candor; and high
performance goals. In 1975, Dennis added two more components: information adequacy/
satisfaction and semantic-information distance. Roberts and O’Reilly (1974) created a
communication climate measurement with the following dimensions: trust, influence, mobility,
desire for interaction, accuracy, summarization, gatekeeping, overload, percentage and direction
of communication time, percentage of time in different communication modes, and an overall
communication satisfaction rating. The contributions of Dennis and Roberts and O’Reilly
indicate that the qualities of superior-subordinate relationships including their communication
patterns are important aspects when analyzing climate (Falcione & Kaplan, 1984).
Climate’s varied perspectives and conceptualizations made it difficult for researchers to
agree on a common definition. In order to overcome this difficulty, general assumptions of
climate were posited. These assumptions are detailed in the next section.
Climate assumptions.
Based on previous climate research, Jablin (1980) and Poole (1985) provide
characteristics or assumptions of climate. Jablin describes the following climate assumptions:

16
• Organizational climate is usually considered to be a molar concept in the same sense that personality is a molar concept.
• The climate of a particular organization, while certainly not unchanging, nevertheless has an air of permanence or at least some continuity over time.
• Phenomenologically, climate is external to the individual, yet cognitively, the climate is internal to the extent that it is affected by individual perceptions.
• Climate is reality-based and thus is capable of being shared in the sense that observers or participants may agree upon the climate of an organization or group, although this consensus may be constrained by individual differences in perceptions.
• The climate of an organization potentially impacts the behavior of people in the system. (pp. 817-818)
Poole (1985) identifies the following set of statements about climate
• There is consensus that organizational climate is a molar construct characterizing properties of an entire system, either the whole organization or an organizational unit.
• There is agreement that climate is descriptive rather than affective or evaluative. • It is also generally accepted that climate arises from and is sustained by
organizational practices, which may be defined as systematized and customary activities deemed important by the organization of its members.
• It is widely assumed that organizational climates influence member behavior. • Climate also has affinities to the concept of organizational culture. (p. 81-84)
Both scholars agree that climate is a molar concept, is enduring, and can influence behavior. The
fact that climate is based on individual perceptions is only noted by Jablin. However, Poole
makes a link between climate and culture. This relationship will be explored more thoroughly
after a review of culture is completed. The next section will present climate studies that have
been conducted.
Climate research.
Just as the definitions of climate have varied so too has the research areas making it
difficult to explain or draw general conclusions. However, Carver (1994) provides a framework
that categorizes research on organizational and communication climate into three areas:
determinants, organizational outcomes, and dimensions. The following sections provide
definitions of each category and the research conducted. The current study’s emphasis is directed
to organizational outcomes and dimensions of climate.

17
Climate determinants.
Climate determinants research includes studies that offer a basis to shape an
organization’s climate by providing information on climate formation. Factors that create,
sustain or change climate have three areas of inquiry. First, organizational structures such as
size, hierarchy, employee participation, rewards, and participation have been reviewed for
impact on climate (Litwin & Stringer, 1968; Hall & Lawler, 1969; Schneider & Bartlett, 1970;
George & Bishop, 1971; Payne & Pheysey, 1971; Stinson & LaBelle, 1971; Schneider & Hall,
1972). The goal is to obtain generalizabilty. The assumption is that similarly structured
organizations would, theoretically, exhibit similar climates.
The second approach is selection-attraction-attrition (SAA). Schneider and Reichers
(1983) state organizations will attract a largely homogeneous workforce because individuals will
seek out organizations that compliment their personalities. Therefore, because members share
similar characteristics through SSA, similar perceptions about the organization’s climate will
develop.
The last approach advances communication as a key determinant variable. This
interactionist perspective claims that perceptions of climate are shaped through employee
interactions (Ashforth, 1985; Poole & McPhee, 1983; Schneider & Reichers, 1983). Ashforth
(1985) argues that climate perceptions are created as employees try to make sense of their
environment. Organizational climate is considered enduring and created not just by
organizational aspects, but also through individual sense-making.
Climate determinants research assists in the understanding of the concept. The next
section details the various links that climate has with other organizational outcomes.

18
Organizational outcomes.
Organizational outcomes research investigates whether altering climate levels will affect
other organizational aspects. Most climate research centers on the consequences of
communication outcomes (Jablin, 1980). Allen, Gotcher, and Seibert (1993) indicate that
climate has been linked to the following outcomes: “communication satisfaction (Pincus, 1986),
job performance (Day & Bedeian, 1991), whistle-blowing (Miceli & Near, 1985), motivation
(Ganesan, 1983), productivity (Infante & Gorden, 1987), job satisfaction, anxiety, propensity to
leave (Batlis, 1980), and organizational alienation (Kakabadse, 1986)” (p. 288-9).
Although research conclusions have been mixed, climate can be considered an
independent variable that may affect employee behaviors. As Ashforth (1985) explains “the
character of an organization’s internal work environment has long been recognized as a potent
influence on employees’ cognitions, affect and behaviors” (p. 837). The current research
suggests customer service as another potential organizational outcome of climate.
Climate dimensions.
The final category, dimensions, provides a basis to define and understand climate.
Cambell, Bownas, and Peterson (1974) reviewed climate instruments and found consistent
dimensions such as achievement emphasis, autonomy, cooperation versus conflict, consideration
and support, intelligence and ability, openness versus decision centralization, reward orientation,
risk taking structure and training emphasis. Later, Goodell (1992) suggests three key dimensions
of climate including organizational structure, organizational attributes, and employee related
issues. Although there may be a common set of dimensions, Hellriegel and Slocum (1974) warn
that there is still a great deal of diversity between organizations when evaluating climate.
In addition to general dimensions of climate, some investigators have suggested studying
particular foci of interest such as a climate for safety (Zohar, 1980), ethical climate (Victor &

19
Cullen, 1988), mission-centered climate (Butcher, 1994), participative climate (Tesluk, Vance,
&Mathieu, 1999), or a climate for service (Schneider, Parkington, & Buxton, 1980). The climate
for service dimension is a primary component of the current research. Schneider, White, and
Paul (1998) provide a definition for service climate:
Climate for service refers to employee perceptions of the practices, procedures, and behaviors that get rewarded, supported, and expected with regard to customer service and customer service quality. For example, to the extent that employees perceive that they are rewarded for delivering quality service, their organization’s service climate will be stronger. Additionally, perceptions that customer service is important to management will also contribute to a strong service climate. (p. 151)
Basically, organizational members attach meaning to behaviors. When certain behaviors are
rewarded, like those promoting service quality, employees will know what the organization
values and expects. Therefore, organizations that want to influence employee’s service
behaviors should consider implementing a climate of service by rewarding those practices that
foster quality service internally and externally.
Schneider and his associates have also investigated human resource practices and
customer experiences in relation to a climate of service. Schneider and Bowen (1985) argued
that certain conditions were needed in order for a climate of service to exist. These conditions
are made possible by activities conducted on individual employees. For example, when
organizational interventions such as work facilitation or career planning are provided to
employees, customers of those employees had increased service ratings. Other activities such as
newcomer socialization tactics and supervision may be able to provide a foundation to develop a
climate of service. Schneider’s research has helped to explain a climate of service by
demonstrating what elements may be needed to create this climate. Johnson’s (1996) study also
generated potential climate of service criteria. Johnson found that delivering quality service
training, rewarding and recognizing excellent service, and seeking and sharing information about
20
customer’s needs and expectations were the three aspects of a service climate that were most
highly related to customer satisfaction ratings.
Some researchers have used other terminology besides “climate of service.” These
concepts include a service or customer orientation and standards. Hogan, Hogan, and Busch
(1984) broadly defined service orientation as a set of attitudes and behaviors that affect
employees and customers. Later, Schneider, White, and Paul (1998) defined customer
orientation as “the degree to which an organization emphasizes in multiple ways, meeting
customer needs and expectations for service quality” (p. 153). These definitions eventually led
to Brady and Cronin’s (2001) model that links customers’ perception of service performance to
the customer orientation concept. The model emphasizes the impact of organizational elements
such as employee performance, service-scape quality and goods quality on customer ratings.
The service orientation or customer orientation concept is built on the notion of
organizational standards. Litwin and Stringer (1968) defined standards as the employee’s
perception of (a) the organization’s goals and objectives, (b) their managers expectations and (c)
the importance placed by the organization on the first two factors. Because perceptions of
standards influence behavior, Schmit and Allscheid (1995) suggested that service standards
would need to be a key element of a service climate. Further, the researchers advocated the need
for a supportive climate of service.
A supportive environment could include help from managers, co-workers or other
departments or processes in the delivery of service excellence. Susskind, Kacmar, and
Borchgrevink’s (2003) research identified that co-worker support was significantly related to a
customer orientation whereas manager support was not. The researchers argued their finding
made sense because front-line employees interact more often with customers than their
managers. Thus, the best form of support would be their peer group. The researchers did find

21
that managerial support offered a significant relationship to front-line provider’s perceptions of
organizational standards. This finding supported Grisaffe (2000) explanation that managerial
values and philosophies ultimately influence employee behavior and customer interactions.
These three key research agendas have provided a general overview of the climate
construct. First, determinants research lays the groundwork for changing an organization’s
climate. Next, outcomes research demonstrates how climate is related to other organizational
concepts and could potentially be related to customer service. Finally, dimension or typologies
provide further insight into the construct’s operationalization and link to climate of service.
The current study investigates the link between climate and the organizational outcome of
customer service and also assesses the climate of service dimension. In addition to the study of
climate, the relationship of culture and customer service is also studied. The next section
presents culture research.
Overview of Culture
Culture was derived from anthropology and has been used to study organizations since
the early 1980s. Pettigrew (1979) has been credited with culture’s introduction into
organizational theory by demonstrating how anthropological topics such as myth, ritual and
symbolism could be used to study organizations (Reichers & Schneider, 1990). Organizational
culture became extremely popular in the business community, and generated ample research
opportunity for scholars (Eisenberg & Riley, 2001). This section will provide culture definitions,
theoretical perspectives, cultural assumptions, cultures application to organizations, and cultures
strengths and weaknesses before a comparison between climate and culture is offered.
Culture definitions.
Since culture’s introduction, researchers have attempted to define its boundaries. With
more than 150 definitions of the term (Kroeber & Kluckhohn, 1952), the complexity of the

22
concept makes it difficult to describe. Brown (1963) refers to culture as “the accepted and
patterned ways of behavior of a given people. It is a body of common understandings…the sum
total and the organization and arrangement of all the group’s ways of thinking, feeling and
acting” (p. 3). Hofstede (1998) believes that this common understanding will help to distinguish
one organization from another. He further explains that “culture is a characteristic of the
organization, not of individuals, but it is manifested in and measured from the verbal and/or
nonverbal behaviour of individuals—aggregated to the level of their organizational unit” (p.
480). Schein (1985) defines the concept as:
A pattern of basic assumptions—invented, discovered, or developed by a given group as it learns to cope with its problems of external adaptation and internal integration—that has worked well enough to be considered valid and, therefore, to be taught to new members as the correct way to perceive, think, and feel in relation to those problems. (p. 9)
Schein’s definition advances the idea of how culture perpetuates through member socialization.
Finally, Morgan (1986) identifies culture as an information gathering tool.
Shared meaning, shared understanding, and shared sense making are all different ways of describing culture. In talking about culture we are really talking about a process for reality construction that allows people to see and understand particular events, actions, objects, utterances, or situations in distinctive ways. These patterns of understanding also provide a basis for making one’s own behavior sensible and meaningful. (Morgan, p. 128)
Although the emphasis of definitions will vary, generally researchers agree that culture is created
through interaction. By studying organizational culture, researchers gain a better understanding
of how communication creates and shapes reality.
Culture is comprised of many elements. Trethewey (1997) lists metaphors, rituals,
stories, heroes, cultural artifacts, performances, and values as a few elements of culture.
Researchers have studied the affect of metaphorical language, such as family, teams or the
jungle, on organizational reality (Morgan, 1986; Smith & Eisenberg, 1987). Rituals are practices
performed regularly or occasionally exemplifying organizational values. Storytelling is routinely

23
used to emphasize organizational values, practices, and sanctions for not following established
procedures (Kramer & Berman, 2001; Wilkins, 1983). Heroes are role models who embody
managerial values (Schein, 1991). Artifacts are the physical features that create a unique
environment (Barley, 1983; Rosen, 1985). Performances are the communicative events that
members engage in when constructing organizational cultures (Pacanowsky & O’Donnell-
Trujillo, 1983). Finally, values are a set of shared beliefs about appropriate behavior. These
could include a commitment to innovation, quality or even customer service (Deal & Kennedy,
1982; Schein, 1991; Shockley-Zalabak & Morley, 1994). These elements work together to
generate an organization’s culture.
Another aspect that can help create an organization’s culture is routinely implemented
solutions. Kotter and Heskett (1992) explain the idea or solution is usually advocated by a
founder or early leader. “The longer the solutions seem to work, the more deeply they tend to
become embedded in the culture” (p. 6). The authors provide an example of a firm that always
increases advertising whenever revenue declines. If this strategy is continually successful, this
concept will be included as part of the culture.
Culture serves several purposes (Smircich, 1983). First, culture creates identification
because employees share in a common group identity. This group identity provides a source of
support to organizational members. Next, culture facilitates commitment. If an employee
embraces an organization’s values, then enhanced commitment is the result. Stability is the third
function of culture and helps to reduce organizational variance. Organizations can expect certain
practices to be followed and values to be held. Finally, through culture, organizational
participants make sense of their environment. These four functions of culture enable members to
understand their roles and organizations to control participant behavior.

24
In summary, past researchers sought to define culture and to suggest components that
create, shape and maintain this organizational concept. In addition to this descriptive focus,
other researchers have advanced theoretical perspectives that are described in the next section.
Theoretical perspectives.
Cultural research has commonly been divided into three theoretical perspectives:
functional, interpretive, and critical (Daniels, Spiker, & Papa, 1997; Trethewey, 1997). A basic
assumption of the functional perspective is that by controlling communication practices
managers can influence organizational outcomes like performance (Trethewey, 1997).
Communication practices include the manifestations of culture such as goals, rituals, stories,
rites, rituals, heroes and orientation programs (Daniels, Spiker, & Papa, 1997). Managers, in the
functional perspective, are encouraged to “see themselves as symbolic actors whose primary
function is to foster and develop desirable patterns of meaning” (Morgan, 1986, p. 135).
Deal and Kennedy’s (1982) and Peters and Waterman’s (1982) research are examples of
this approach. Deal and Kennedy suggest managers can improve organizational and employee
performance by obtaining agreement on values, identifying heroes, developing rites and rituals,
and building networks to create and maintain values in order to create strong cultures. Similarly,
Peters and Waterman provide organizations with themes for success. These themes were based
on surveys conducted at 62 organizations evaluated as “excellent” by both employees and
organizational experts. Themes include a bias for action; hands-on, value driven; productivity
through people; autonomy and entrepreneurship; stick to the knitting; simple form, lean staff;
simultaneous loose-tight properties; and close customer relations. These studies are examples of
the functional approach because they provide managers with a cultural checklist for
organizational success.

25
The interpretive approach seeks to understand an organization’s culture through
employee sense-making. Putnam (1983) explains that interpretists study “the subjective,
intersubjective and socially constructed meanings of organizational actors” (p. 44). “Elements of
culture are understood as ongoing, dynamic, communicative processes that constitute
organizational life” (Trethewey, 1997, p. 211). Trethewey adds that interpretists study the
communicative practices of all members of the organization, because all employees shape
culture not just managers. Interpretive studies are characterized by a focus on themes and
symbols that are evident in communicative discourse.
Smith and Eisenberg’s (1987) study of Disneyland’s culture reflects the interpretive
approach. They compared two driving metaphors: management’s use of drama and employees’
use of family. The complexities between the metaphors provided insight into Disney’s culture.
Finally, the critical approach describes and evaluates an organization’s culture based on
power struggles (Daniels, Spiker, & Papa, 1997). Researchers will become critical of the status
quo by questioning the organizational ideologies and power structures (Trethewey, 1997).
Mumby (1987, 1988) proclaims that narratives can exemplify the critical approach because
Narratives punctuate and sequence events in such a way as to privilege a certain reading of the world. They impose order on ‘reality’ that belies the fact that such a reading is a largely ideological construction that privileges certain [managerial] interests over others. (1988, p. 126).
Miller (1999) provides two similar categorizations, prescriptive and descriptive, that
parallel the functional and the interpretivist approaches respectively. In other words, the
prescriptive approach sees culture as “something an organization has,” and the descriptive
approach sees culture as “something an organization is” (Miller, p. 92). The descriptive approach
is distinguished from the prescriptive approach because culture is complex, emergent, and non-
unitary. Evidence for complexity is demonstrated through research variety. Miller lists studies
on rites (Beyer & Trice, 1987), ceremonies (Dandridge, 1986), metaphors (Smith & Eisenberg,

26
1987), stories (Boje, 1991), values and belief systems (Quinn and McGrath, 1985) and
communication rules (Schall, 1983; Morely & Shockley-Zalabak, 1991; Shockley-Zalabak &
Morley, 1994) as examples. Culture is also dynamic and emergent because it is created and
maintained through member interactions and transforms with each new employee. Finally,
culture is non-unitary. Louis’ (1985) research identifies that subcultures can be created at
various organizational points. These include the “vertical slice” such as a division within the
organization or a “horizontal” slice such as a specific hierarchy within the organization. Louis
also uses cultural penetration to distinguish between subcultures.
Psychological penetration refers to the extent to which individuals hold similar meanings about a particular subculture. Sociological penetration refers to the pervasiveness of a subculture. Finally, historical penetration refers to the stability of cultural meanings over time. (Miller, 1999, p. 97)
These types of cultural penetration and the sites of culture provide a method to analyze multiple
subcultures. Subculture comparison illuminates the main themes of the overall culture, but can
also illustrate unique aspects of a smaller department within the larger corporation. Simpson and
Cacioppe (2001) explain in each sub-culture the core or dominant culture has been modified by
the values held by the individual departments. Rosenfeld, Richman, and May (2004) contend a
cultural divide can result when there is inadequate communication between the main and field
offices. The researchers recommend the importance of creating trust and emphasizing the
relational aspects of the corporate culture (e.g. supervisor support).
There are several theoretical perspectives of culture that allow researchers to orient their
investigations. Each offers unique insight into an organization. However, it is important to
know a researcher’s focus to understand what may be highlighted or left out of their analysis.
Next, the general assumptions of cultural research will be reviewed.

27
Cultural assumptions.
This section explores general cultural assumptions and characteristics of culture. This
literature provides a sense of the fundamental nature of culture.
Ott (1989) details five cultural assumptions. These include the following:
Organizational cultures exist. Each organizational culture is relatively unique. Organizational culture is a socially constructed concept. Organizational culture provides organization members with a way of understanding and making sense of events and symbols. Organizational culture is a powerful lever for guiding organizational behavior. (Ott, p. 52)
All, except for the last assumption, resonate with the interpretive perspective. However, the last
assumption is more consistent with perspectives that advocate the ability to manage culture.
Trice and Beyer (1993) propose six characteristics of culture. These include that culture
is collective, emotionally charged, historically based, dynamic, symbolic, and inherently fuzzy.
First, individuals cannot create cultures. Rather, culture is created through member interaction
and by the endorsement of accepted norms, values, and beliefs. When practices are questioned,
followers become emotional because culture is embodied with sentiment. This makes sense due
to its historical and dynamic nature. Culture evolves over time due to new membership but
continues to have residual impact from its founding members. Within cultures, symbolism plays
a pivotal role. In fact, “symbols so infuse cultural communication that they are considered the
most basic unit of cultural expression” (p. 7). Finally, cultures are inherently fuzzy because of
ambiguities, contradictions and confusion. Trice and Beyer’s list suggests that researchers need
to unravel multiple aspects to understand culture.
Simpson and Cacioppe (2001) have tried to aid organizations in understanding culture
complexity by developing the concept known as unwritten ground rules or UGRs. UGRs
constitute a group or individual’s perception of acceptable or unacceptable organizational
behavior. Their research has asked employees to complete phrases such as “around here

28
customers are…” and “around here, when it comes to spending money…”. Phrases are then
grouped into positively or negatively oriented comments to provide the organization with a
summary of employee perceptions. Simpson and Cacioppe have found that UGRs affect
employees’ performance and more importantly, that an organization consists of two worlds: the
formal organization and the employee’s UGRs. The researchers offer an analogy where the
organization is similar to an iceberg. The formal organization (sales, profits, market share, and
costs) resides on top of the water whereas the UGRs (job satisfaction, team morale, customer
satisfaction, norms, values, and beliefs) operate below the surface. Most organizations,
according to Simpson and Cacioppe, do not have alignment between the UGRs and the formal
organization resulting in an iceberg that is very unstable.
The assumptions and characteristics research provides a more conceptual understanding
of this organizational concept. Next, organizational applications can be reviewed.
Cultures application to organizations.
A review of culture would be incomplete without referencing the contributions of
scholars who offer techniques to apply culture to organizations. Researchers have applied
cultural performances, the competing values framework and a model of culture to organizations
in order to achieve a better understanding of culture’s significance.
First, Pacanowsky and O’Donnell-Trujillo (1982, 1983) analyzed how employee
performances shape organizational culture and suggest that highlighting indicators of
organizational sense-making will illuminate organizational culture. In order to “uncover an
organization’s culture—a researcher can begin by focusing on the following (not exhaustive) set
of indicators and displayers of organizational sense-making” (p 166). These include relevant
constructs, facts, practices, vocabulary, metaphors, stories, rites, and rituals. Organizations use
each of these to create a reality for the employees.

29
Pacanowski and O’Donnell-Trujillo (1982) analyzed the “performances” of employees.
Employees will display or perform these constructs which in turn creates their shared reality.
Performances are interactional, contextual, episodic, and improvisational. Employees do not act
individually. Performances are given by all organizational members in which the surroundings
of the action have implications. Each performance has an identifiable beginning and ending.
However, there is great flexibility on the part of the actors. Thus, the performances of even
patterned behaviors will never be identical. Pacanowski and O’Donnell-Trujillo emphasize the
importance of identifying and understanding the performances of employees in order to
conceptualize the organization’s culture.
The next research area, Competing Values framework, is used to assess the
organization as a whole. The Competing Values framework proposed by Quinn and Rohrbaugh
(1983) and later revised by Quinn and Kimberly (1984) suggest four quadrants reflecting ideal
cultural types. The quadrants of group, developmental, hierarchical, and rational are created
through two axes that evaluate organizations based on whether the organization is flexible or
controlling and whether the organization is more internally or externally focused. Research
using the Competing Values framework has sought to link these cultural types to organizational
outcomes or employee characteristics such as CEO personality traits (Giberson, Resick, Dickson,
Mitchelson, Randall, & Clark, 2009), job satisfaction (Zazzali, Alexander, Shortell, & Burns,
2007; Goodman, Zammutof & Gifford, 2001; Lund, 2003), safety climate (Meterko, Rosen,
Zhao, Shokeen & Gaba, 2009) and patient satisfaction (Meterko, Mohr & Young, 2004).
The last study on patient satisfaction reflects on the current study’s association with
culture and customer service. Meterko, Mohr and Young (2004) used the competing values
framework to determine if patient satisfaction levels were different based on cultural unit type.
The researchers found that cultures emphasizing teamwork had significant positive correlation

30
with patient satisfaction and bureaucratic cultures had a significant and negative correlation for
patient satisfaction. The researchers conclude that hospitals should consider emphasizing
cultures promoting teamwork and de-emphasize aspects of a bureaucratic culture that is not
essential to assuring patient quality care.
Finally, a model of culture was proposed. Schein’s Model of Culture (1985) allows for
an in depth understanding of how culture is created and maintained within an organization.
Schein views culture as a reflection of the shared beliefs and assumptions held by individuals.
He contends that these beliefs and assumptions are learned behaviors experienced by group
members to deal with both internal and external problems. Schein recognizes the debate
between an organization having a single culture versus the potential for subcultures to exist. He
concludes that organizations may have an overall culture but only if there is a significant history
shared by its members. He argues that researchers should not assume that an overall culture
exists. Rather, Schein suggests that researchers select a particular social unit within a larger host
culture to study. This social unit will have historical data and key actors to aid in understanding
the culture’s evolution.
Schein’s model of culture includes three levels: (1) artifacts and creations, (2) values, and
(3) basic assumptions. For Schein, the third level is the core of the organizations’ culture while
the first two levels serve as manifestations of the culture. The first level, artifacts and creations,
exists at the most observable level and includes aspects of the physical and social environment.
Furniture placements, employee dress, forms of address, communication at meetings, and types
of documentation are just a few examples. Observation is less difficult than interpreting
meaning, understanding interrelationships or identifying behavior patterns. Therefore, levels two
and three are essential in understanding these overt symbols.

31
The second level of Schein’s model includes individual and group values. Values
represent what should be done within the organization. There should be a link between the
values of an organization at level two and the behaviors observed from level one. If there is a
discrepancy, then employees may be making “either rationalizations or aspirations for the future”
(Schein, 1985, p. 17). Another type of discrepancy can also occur. Some values are explicitly
stated by the organization and serve to guide member behavior when dealing with uncertainty or
new events. However, sometimes these values are not followed. Argyris and Schon (1978)
labeled these “espoused values” where what people say is different from what they do. For
example, a company states employees are valued yet actions taken by management contradict
this value.
A listing of the organization’s values may not be enough for the researcher to understand
the organization. Behaviors observed at level one may be inconsistent with values at level two.
In addition, values may contradict each other or the researcher may be unable to determine
patterns. Thus, a deeper analysis into the basic assumptions of the workers is needed.
Basic assumptions are the third level of the model. Assumptions are taken for granted
beliefs about the way the world works. What was once just a value has proven to be reality.
Schein (1985) explains that “if a basic assumption is strongly held in a group, members would
find behavior based on any other premise inconceivable" (p. 18). Schein proposes six basic
assumptions around which cultural paradigms form: the nature of time, the nature of space, the
nature of reality and truth, the nature of human nature, the nature of human activity, and the
nature of human relationships. He based his dimensions on Kluckhohn and Strodtbeck’s (1961)
research. Further description of how Schein’s model will be used in the study is detailed in the
method section.

32
Schein’s multi-layered approach to culture allows researchers to understand observable
behavior based upon organizational values and assumptions. When the layers match, researchers
are able to explain employee behaviors and organization artifacts. When the levels do not relate,
the organization may have fragmented subcultures or may be moving from one set of values and
assumptions to another (Miller, 1999).
The basic assumptions or characteristics of culture provide a foundation for what is
generally accepted as a cultural study. Thus, although there seems to be a wide array of potential
definitions, these central tenants enable the construct to be operationalized. The contributions of
Pacanowsky and O’Donnell-Trujillo (1982, 1983), the Competing Value studies, and Schein
(1985) demonstrate how researchers apply culture to organizations. Their efforts allow readers
to see the complexity of culture’s dimensions.
Strengths and weaknesses of the cultural approach.
Researchers have highlighted important advantages of the cultural framework.
Pacanowsky and O’Donnell-Trujillo (1982) identify a series of benefits. First, a cultural
investigation can serve an exploratory or explanatory function. For example, researchers may
need to uncover organizational information prior to survey development. Gaining a thorough
understanding of a culture will hopefully lead to improved research questions. Culture can also
serve an explanatory function. If survey results are inconclusive or ambiguous, a cultural
analysis may provide insight. Another benefit of culture is that it “reaffirms the centrality of
communicative behaviors in organizational inquiry” (p. 169). Studying employee perceptions,
behaviors, language, stories, values, attitudes, and artifacts will provide an enhanced
understanding of how meaning is created. Finally, culture increased scholarly discourse. Prior
to the cultural “revolution,” organizational research in the 1960s and 1970s emphasized the
systems approach (Pacanowsky & O’Donnell-Trujillo, 1983; Smircich & Calas, 1987). When
33
researchers embraced culture, new methods and topics allowed organizations to be described and
understood in alternative methods.
Although this list of benefits can be advantageous, weaknesses of culture perpetuate.
First, Daniels, Spiker, and Papa (1997) contend that many companies expand state lines or are
multi-national. Due to multiple subcultures, cultural descriptions may simply not be accurate.
Another weakness rests with current research. Pacanowsky and O’Donnell-Trujillo (1983) and
Allen, Gotcher, and Seibert (1993) note most researchers have narrowly focused cultural studies
to one or two cultural elements. The weakness of this approach according to Pacanowsky and
O’Donnell-Trujillo is that researchers neglect to demonstrate how the component of interest
interacts with other cultural aspects and how it is manifested in interactions. Finally, researchers
need to indicate their cultural perspective. By doing so, readers will know what aspects of the
culture will be highlighted or hidden from view.
Overall, based on the variety of definitions and perspectives, culture continues to be a
complex concept. Geertz’s (1973) figurative analogy comparing spider webs to culture is still
very appropriate. Webs serve to confine and mobilize a spider. Webs can be changed and are
very strong. Likewise, organizational members spin their own cultural webs that may restrict
behavior or empower employees. These web like characteristics allow researchers to better
define and explain organizations through culture.
Now that a general review of climate and culture has been accomplished, key differences
and research overlap analysis is needed. The following section provides this analysis.
Key Differences and Research Overlap between Climate and Culture
Researchers have argued that climate and culture are similar yet distinct variables. This
section reviews the similarities and differences between climate and culture before the guiding
questions of this study are presented.

34
Climate and culture similarities.
There are several similarities between climate and culture. For example, some
researchers claim that culture could be a synonym for climate (Schneider, 1985; Ouichi &
Wilkins, 1985). This reasoning may be based on definitional similarities. Pettigrew (1990)
explains that both concepts have struggled for an agreed upon interpretation. The terms are used
to cover broad explanations and include the possibility of sub-components (i.e. subcultures and
climates for a particular referent) (Denison, 1996; Pettigrew, 1990; Reichers & Schneider, 1990).
Due to climate and culture's complexity, agreed upon definitions have been almost impossible to
generate.
Denison (1996), who compares two definitions offered by researchers of either camp,
highlights the definitional similarities of the two concepts. Denison critiques Schein’s (1985)
definition of culture and Tagiuri and Litwin’s (1968) definition of climate. (Both definitions can
be found earlier in this review). Dension claims that although Schein describes how actors create
their social environment whereas Tagiuri and Litwin focus on how actors experience their
environment, both have key overlaps. For example, the definitions offer patterns of social
learning, explain a holistic type of social context, suggest durability over time, and have roots in
beliefs, values and assumptions. Reichers and Schneider (1990) agree that the overall concepts
“deal with the ways by which organization members make sense of their environment…Both
climate and culture are learned, largely though the socialization process and through symbolic
interaction among group members” (p. 29).
Some researchers have attempted to resolve the subtle difference. Schneider (2000) and
Svyantek and Bott (2004) agree that climate is behaviorally driven and center on an employee’s
perception of interaction patterns. Culture explains why these patterns develop based on the
values, norms, beliefs and assumptions held by the organization.

35
Researchers have also explained the climate/culture relationship as a causal or linear
process. Moran and Volkwein (1992) describe the relationship by the influence that culture has
on climate formation. Reichers and Schneider (1990) agree. They explain “culture exists at a
higher level of abstraction than climate, and climate is a manifestation of culture” (p. 29). This
line of thinking poses the question of which came first? Reichers and Schneider answer this by
saying the reciprocal nature of the concepts creates an almost endless cycle. Manifestations of
culture (i.e. climate) such as organizational practices and procedures both represent culture and
will also influence how culture will change and be interpreted.
Further similarities between climate and culture are evident in the literature. Both
concepts “have been treated as independent and intervening variables linked to dependent
variables such as financial performance and productivity” (Pettigrew, 1990, p. 415). However,
as far as content is concerned, there have been overlapping research endeavors. Denison (1996)
provides several examples of content similarities. For example, Dension indicates research by
Schwartz and Davis (1981) that lists a set of tasks that can reveal an organization’s culture
including communication, organizing and decision-making is comparable to Taylor and Bowers
(1972) research that labels communication flow, work organization and decision making
practices as key climate dimensions. Denison also claims that climate researchers Litwin and
Stringer’s (1968) dimension of risk taking is closely related to Joyce and Slocum’s (1982)
culture research.
Methodology has also been compared and contrasted. Climate researchers have primarily
used quantitative techniques with an etic perspective whereas culture researchers engage in
qualitative research with an emic perspective (Denison, 1996; Reichers & Schneider, 1990; Trice
& Beyer, 1993). “The etic perspective imposes meaning on a set of data rather than letting the
meaning emerge from the members of the group under study. This latter approach is termed

36
emic” (Reichers & Schneider, 1990, p. 24). In the past, methodological distinctions used to be
one way to determine whether culture or climate was under investigation. However, since the
1990s, some cultural researchers have started using quantitative techniques in their analysis of
organizations (Denison, 1996).
The organizational concepts of climate and culture have several similarities including
definitions, causal processes, research endeavors and methodologies. The next section reviews
how each concept is unique.
Climate and culture differences.
Culture and climate are also distinct. First, the origins come from separate domains.
Moran and Volkwein (1992) provide an overview:
Organizational climate has been the domain of social psychologists and focuses on the perceptions, perceptual processes, cues, and cognitions by which the individual apprehends and discriminates attributes of the organization’s internal environment…Culture, originally the domain of anthropologists, analyzes the underlying structure of symbols, myths, social drama, and rituals which may manifest the shared values, norms, and meanings of the group members…The anthropologist examines the manifestation of culture through its forms—artifacts, myths, legends, symbols, and rituals—which reveal shared values and ideologies. (p. 21)
Overall, while climate investigates the individual’s perceptions of practices and procedures,
culture searches to obtain an understanding of a collective’s underlying assumptions (Denison,
1996; Pettigrew, 1990). Trice and Beyer (1993) explain that even though climate researchers will
sometimes aggregate data to reflect a more collective level, climate measurements still use
individual data. Schneider, Brief, and Guzzo (1996) offer an example to explain the difference.
In an organization, practices such as recalling parts if there is a problem, basing bonuses on
quality, and rewards such as commending someone to repair an error on the assembly line are
examples of climate whereas the belief that management values quality is part of culture.
Finally, Moran and Volkwein (1992) acknowledge a fundamental difference in the
concept of time. Climate research emphasizes individual perceptions and therefore it forms and

37
changes quickly. Changes in staff or policies will have immediate impact on climate
descriptions. This is contrasted to culture. Culture is a highly enduring characteristic that
evolves slowly and is difficult to change because it is based on deeply held assumptions. Culture
is slow to change because it “is in a sense a record of a social unit’s interpretation of its history
and is therefore dependent on the existence of a known past of considerable duration.” (p. 20).
Although similarities such as definitional and research overlap, causal or a linear focus,
and methodological issues exists between climate and culture, distinct differences are apparent.
Their unique origins, the emphasis on an individual or collective nature, and the importance of
time serve to differentiate these constructs. Now that the service, climate and culture literature
has been reviewed, the current study’s research questions need to be addressed.
Guiding Questions of Interest
The review of literature leads to some interesting questions about organizational culture
and climate in relation to service quality. If culture is indeed a representation of the values,
beliefs, and expectations (Van Mannen & Schein, 1979) of a group and various sub-cultures can
exist within one organization, than the differences in service provider ratings may be attributed
to inherent disparities between sub-cultures. A hospital environment was chosen for this study
because sub-cultures can be easily identified and assessed. Service providers on a hospital unit
with high customer service ratings should have different values, beliefs, and expectations as
compared to the providers on the low rated unit. Climate’s emphasis on the perceptions of
policies, practices, and procedures (Schneider 1990) should also help to explain differences
between sub-groups in an organization. Provider behavior is based on perceptions. If behavior
is rated differently between two units, than the climate between the units must be unique. The
climate for service (Schneider, Parkington, & Buxton, 1980) construct should be evidenced on
the unit with higher service. Therefore, the following guiding question was investigated:

38
RQ#1: What is the climate of each unit and how does it vary between units with high and low service ratings?
Another goal of this study is to understand what aspects of culture would affect customer service
ratings. Thus, the following guiding question was investigated:
RQ#2: What is the culture of each unit and how does it vary between units with high and low service ratings?
Finally, the literature review concluded with a comparison between culture and climate.
Instances were revealed that questioned the blurring of boundaries between the two
organizational constructs. Most of the research studies cited investigated only one of the
constructs. This investigation hopes to seek out similarities and differences between culture and
climate. That endeavor is evidenced by the following guiding question:
RQ#3: What is the relationship between culture and climate with each unit and between the different units?
Summary of Chapter
This chapter offered a review of the service, climate and culture literature. While most
customer service literature focuses on provider attributes, research assessing how organizations
can influence customer perceptions of service quality is warranted. The purpose of this study is
to provide a greater understanding of the links between climate, culture and levels of service
quality. The guiding questions presented will help enable organizations to identify aspects of
climate and culture that can foster an increase in customer service evaluations. The next chapter
outlines the research methodology.

39
Chapter 2
Research Methodology
This chapter describes the two primary research methodologies used for data collection.
First, the study rationale and research questions are reviewed before the description, explanation
and justification of the mixed-method design (quantitative and qualitative) employed in this
study is offered.
Study Rationale and Research Questions
The study rationale and research questions begins with a review of current literature
linking culture and climate to health care organizations before addressing the variable
relationships and research questions. A review of literature uncovered limited investigations of
organizational climate and culture in health care settings. Previous studies rarely consider both
organizational concepts, instead focusing mainly on customer service issues as part of safety
evaluations. The following sections present the relevant climate and culture health care studies
conducted in hospital environments and then contrast those research inquiries to what this
current study offers.
Climate studies in health care.
Several studies investigate climate’s relationship to hospital outcomes, patient safety, and
perceptions. For example, Ying, Kunaviktikul, and Tonmukayakal (2007) found a significant
positive correlational relationship between nursing competency and organizational climate.
Hwang and Chang (2009) found positive climate perceptions were significantly and negatively
related to turnover intentions for all work groups. Specifically, for nurses climates that
emphasized workgroup friendliness and warmth and adherence to job standards had lower
turnover intentions. Finally, Liou and Cheng (2010) determined organizational climate was
positively correlated with organizational commitment and negatively correlated with intention to

40
leave, which is similar to Hwang and Chang’s results. Thus, climate appears to be related to
specific employee outcomes of nursing competency, turnover and organizational commitment.
Climate’s relationship to patient safety was another area of interest in the literature. First,
Gershon, Karkashian, Grosch, Murphy, Escamilla-Dejudo, Flanagan, Bernacki, Kasting, and
Martin (2000) found senior management supportiveness was the most significant climate
dimension enhancing staff safety compliance behaviors. Another study by Walston, Al-Omar,
and Al-Mutari (2010) discovered the three climate measures of management support
(communication, information flow and feedback), reporting systems, and resource adequacy
(information technology and workload) to positively influence patient safety. Both studies reveal
the importance of management supportiveness in patient safety outcomes.
The last climate study area, perceptions, was investigated by two research groups.
Lavoie-Tremblay, Paquet, Duchesne, Santo, Gavrancic, Courcy, and Gagnon (2010) investigated
work climate and intention to quit among three generations of hospital workers. Three climate
dimensions that varied significantly between generational groups were challenges, absence of
conflict, and warmth. The significant differences occurred between Baby Boomers and
Generation Y groups, and the researchers provided rationale for these differences. Next, Paquet
and Gagnon’s (2010) study offers evidence for the use of “collective climates” as a means to
better understand how to implement performance and quality strategies. The researchers explain
“collective climates” are based on clusters of individuals who view the collective climate
similarly. Paquet and Gagnon found the same six “collective climates” present at three research
hospitals and were differentiated by levels of satisfaction, commitment, and work load. These
two investigations of climate in terms of perceptions offer alternative perspectives for climate.
Overall the recent climate studies offer insight into climate’s relationship with other
hospital outcomes, patient safety, and perceptions. The current research, however, also
41
contributes to climate knowledge by illuminating the differences between perceptions of climate
on units with high and low service ratings. By using a combination of climate instruments,
specific climate dimensions between hospital units with high and low service levels can offer
hospital administrators and researchers an understanding of the key differences contributing to
patient service ratings. The current study offers contributions to existing literature in terms of
other hospital outcomes and perceptions. Further, the current study is unique because of the
direct comparison between two hospital units. Next, culture studies conducted in hospital
environments will be reviewed and the current study’s emphasis on culture will be highlighted.
Culture studies in health care.
Cultural studies investigated culture’s relationship to patient safety or utilized the
Competing Values Framework to link culture to other hospital outcomes. The first research focus
of culture and patient safety either studied variables of culture impacting patient safety or
perceptions of a patient safety culture. First, the variables of culture impacting patient safety
have been studied by several researchers. Gearhart (2008) found that teamwork within and
between units, perceptions of safety, support for safety, staffing and organizational learning are
significant predictors of patient safety outcomes. Sorra, Nieva, Famolaro, Dyer (2007) also noted
teamwork as an area of strength for most hospitals when instilling a patient safety culture. While
Edwards, Scott, Richardson, Espinoza, Sainfort, Rask, and Jose (2008) reported teamwork as a
safety culture strength and nonpunitive response to errors as an area of improvement for
initiatives in a pediatric health care system. These three research studies concurred that
teamwork was a cultural variable impacting a patient safety culture.
The other area of culture and patient safety research was hospital staff perceptions. First,
Sorra, Nieva, Fastman, Kaplan, Schreiber, and King (2008) analyzed the perceptions of
transfusion service staff from 53 hospitals in order to understand the staffs’ view of patient safety

42
event reporting. Although the researchers found an overall positive attitude toward event
reporting, they noted that the transfusion staff’s work relationship with the nursing staff needs to
be improved in order to increase patient safety. Another study by Kaafarani, Itani, Rosen, Zhao,
Hartmann and Gaba (2009) assessed the perceptions of a patient safety culture amongst
operating room and post-anesthesia care units. Results indicated that the operating room and
post-anesthesia care units witnessed more unsafe patient care, perceived senior leadership as less
understanding and perceived there to be less hospital interest in quality care compared to other
work groups. Finally, Wolosin (2008) investigated hospital staff perceptions of safety and
patients’ evaluations of satisfaction. Safety culture elements of staffing levels, proper
communication between shifts, and nonpunitive response to errors were strongly correlated with
patient satisfaction. Patient satisfaction items of visitor treatment, admission and discharge
processes and noise levels were strongly related to safety culture. Wolosin contends that
although causality cannot be determined, patient satisfaction and safety culture are likely linked
and improvements in safety practice would most likely result in increased patient satisfaction.
Besides the link to patient safety, researchers have also used the Competing Values
Framework or modifications of the framework to determine links between cultural types and
other hospital outcomes. Researchers found personal and dynamic cultures to score higher on
team functioning compared to formal cultures (Strasser, Smits, Falconer, Herrin & Bowen,
2002); a teamwork culture is significantly related to patient satisfaction and bureaucratic cultures
were significant and negatively correlated with patient satisfaction (Meterko, Mohr & Young,
2004); group cultures promote medical error reduction techniques (Stock, McFadden & Gowen,
2006); and the group model was positively associated with job satisfaction, involvement, and
organizational commitment (Gifford, Zammuto, Goodman & Hill, 2002). All of these studies
were conducted with a variety of hospital staff. One study by Rondeau and Wagar’s (1998)

43
surveyed hospital CEOs about their cultures and hospital outcomes. Several results were
obtained. First, group cultures were correlated strongly with employee morale and
organizational commitment. Second, entrepreneurial cultures reported high employee morale and
staff who were less resistant to change initiatives. Third, hierarchical cultures had lower patient
and employee satisfaction levels. Finally, rational cultures obtained higher efficiency and
financial performance scores. The above studies found specific organizational culture types to be
linked to specific hospital outcome measures.
Rondeau and Wagar’s (1999) used the Competing Values Framework to determine a link
between cost-cutting fiscal strategies and perceived culture type. The involvement culture with
an emphasis on human resources used self-managed work teams to cope with fiscal change.
Adaptability cultures that emphasize innovation utilized the widest array of fiscal change
strategies. The consistency culture that focuses on rules reported the least number of change
activities. Finally the mission culture with an emphasis on goal obtainment had CEOs who
increased benchmarking, innovation programs, and management information systems to deal
with cost-cutting. Rondeau and Wagar found that culture type perceptions were linked to hospital
cost saving tactics.
The recent literature survey reveals cultural investigations of hospitals to include patient
safety and the identification of cultural types related to specific hospital outcomes. The current
research seeks to understand the relationship between culture and the hospital outcome of patient
satisfaction ratings. As compared to recent literature, this study is unique because the
investigation of culture is accomplished through an ethnographic approach as opposed to
quantitative methods that were used by the reviewed research. A qualitative approach offers an
advantage because the investigation of culture is not based on perceptions but is studied through
behaviors and interviews revealing the values and assumptions of a given group. The current

44
investigation seeks to understand inherent differences between cultural groups that could
promote differences in hospital service ratings.
Example of a climate and culture study.
Two studies were found to include both climate and culture in a health care setting. First,
Glisson, Schoenwald, Keelecher, Landsverk, Hoagwood, Mayberg and Green (2008) examined
climate and culture in relation to turnover and the successful implementation of mental health
services. Interviews with mental health clinic site directors garnered information on employee
turnover and new program sustainability efforts; surveys of employees determined climate and
culture ratings. Organizations with the best climates had less than half the turnover rates of poor
climates and the best organizational cultures sustained new program implementations for twice
as long. Glisson, et. al. suggest that future research should emphasize how the concepts work
together to gain efficiency in an organization. The current study addresses this call by analyzing
both concepts of culture and climate and their interrelationship based on differences in customer
service levels.
The second study incorporating both climate and culture was conducted by Hartmann,
Meterko, Rosen, Zhao, Shokeen, Singer and Gaba (2009). The researchers studied the
relationship between the Competing Values Framework and safety climate. Researchers
sampled employees from 30 Veterans Administrations hospitals over a six month period.
Hartmann et. al. found group and entrepreneurial cultures to be significantly associated with
higher levels of a safety climate. Lower levels of safety climate were found for hierarchical
cultures. Hartmann et. al. focused on identifying how culture and climate were linked. The
current study seeks to expand our knowledge by providing a deeper understanding of how the
differences in culture are linked to a climate of service. The current study is also unique because
the goal is to understand the relationship between the concepts of culture and climate on each

45
hospital unit and between the hospital units and how these concepts are interrelated and not just
linked to each other. To understand the study further, the next section provides the variable
relationships.
Variable relationships.
This study seeks to identify how organizational climate and culture impact levels of
service quality ratings in a health care setting. With the plethora of definitions detailed in the
literature review presented earlier, an important step is to decide which definitions will guide this
study. The variables for this study include: climate, climate of service, and culture. First, Poole
(1987) describes organizational climate as “a relatively enduring quality of the environment that
is experienced and perceived by individuals; influences individual interpretations and actions;
and can be described in terms of a particular set of characteristics which describe a system’s
practices, procedures, and tendencies” (p. 2). Organizational climate focuses on perceptions of
organizational policies as a whole whereas climate of service isolates the perceptions of the
communicative acts related to customer service. Schneider, White, and Paul (1998) define
climate of service in the following way.
Climate for service refers to employee perceptions of the practices, procedures, and behaviors that get rewarded, supported, and expected with regard to customer service and customer service quality. For example, to the extent that employees perceive that they are rewarded for delivering quality service, their organization’s service climate will be stronger. Additionally, perceptions that customer service is important to management will also contribute to a strong service climate. (Schneider et al., 1998, p. 151)
The climate for service narrows the focus to specific elements within the organization that
facilitate higher service ratings.
Finally, the definition for culture is taken from Schein (1985) as
A pattern of basic assumptions—invented, discovered, or developed by a given group as it learns to cope with its problems of external adaptation and internal integration—that has worked well enough to be considered valid and, therefore, to be taught to new members as the correct way to perceive, think, and feel in relation to those problems. (p. 9)

46
Organizational culture is fundamental to the organization, drives the organization, and makes it
unique. Schein’s deeply held assumptions about the way things are done is passed on to new
recruits and continues over time.
The distinction between climate and culture is nebulous. The literature review
demonstrated research overlaps and hundreds of definitions for each concept. Therefore, the
guiding principle for this research is to define climate as individual feelings for the policies and
communicative practices in the organization, whereas culture will be evidenced by the overriding
deeply held assumptions of the organization.
Research questions.
The setting for this research is an organization where levels of customer service quality
are continually monitored. Hospitals usually meet this standard and also have data that allows
comparison of similar-sized units: one with high service ratings to one with low ratings. For the
purpose of comparisons, other aspects on the unit such as employee benefits should be held
constant. A hospital that has its own doctors (i.e. where doctors only practice at that location)
would be best suited for this investigation because changes in staff physicians would not affect
the climate and culture of the unit. The assumption is that the unit with a higher level of service
quality would exhibit a significantly different climate and culture than the unit with lower
customer service levels because service quality would be emphasized. A customer service
emphasis would include examples of managers who reward service effort, employees who
articulate the value of a customer focus, and an overall commitment by employees to follow the
structures and policies promoting a climate of service. Evidence of a strong commitment to
exceeding customer expectations should be readily apparent to observers on the unit.
The following three research questions, then, provide a general framework for this study.

47
RQ#1: What is the climate of each hospital unit and how does it vary between different hospital
units with high and low service ratings?
RQ#2: What is the culture of each hospital unit and how does it vary between different hospital
units with high and low service ratings?
RQ#3: What is the relationship between culture and climate within each hospital unit and
between the different hospital units?
Research question one on organizational climate was measured through a survey
questionnaire that combined Schneider, White, and Paul’s (1998) Assessment of Service Climate
Instrument (see Appendix A) and Litwin and Stringer’s (1968) Organizational Climate
Questionnaire (see Appendix B). Schneider, White and Paul’s instrument was created for use in
the banking industry to assess elements of service quality. Therefore, some language needed to
be adapted to the hospital environment. Litwin and Stringer’s instrument was selected due to its
more global and non-organization specific nature.
An ethnographic design addressed the second research question on organizational culture.
This type of design requires flexibility when working with an organization’s schedule, work
rules, and traditions so a variety of data collection methods were used. Archival data,
“shadowing” workers, observations, and interviews provided insight into each unit’s daily
routines and offered clues to each unit’s culture.
The last research question addresses the relationship between culture and climate. This
study is unique because it includes both organizational concepts in one research inquiry. A
comparison of the unit’s observations, interviews, and surveys will help to further clarify the
climate/culture debate.
This section provided a rationale for the study based on a review of organizational
climate and culture investigations in health care. In addition the variable relationships and

48
research questions were reviewed. The next section reviews the methods employed in the
current study.
Method
This section begins with the rationale for organizational selection. Next, a description of
the participant samples is provided. Finally, a detailed review of the methods is provided along
with data collection procedures.
Rationale for organizational selection
Access was obtained at a large metropolitan 903 bed tertiary teaching hospital in the
Midwest. This hospital was advantageous because it employed its own staff physicians who
treated patients at the hospital. However, a disadvantage to this hospital was its teaching focus.
First through fourth year residents rotated monthly through units which could impact the results
of the study. However, because this rotation is a hospital norm it could also add a unique
perspective to how unit members cope with resident staffing changes. After meeting with the
Vice President of Human Resource Service Excellence and the Project Administrator, a research
protocol was formulated.
Initially two in-patient units were selected for analysis based on Press Ganey (an outside
consulting firm specializing in customer feedback surveys and data analysis) quarterly reports.
The first unit A1 (unit name changed) had been rated as having poor customer service levels for
four quarters. A1 averaged more than two standard deviations below the hospital mean for the
previous year. The second unit C1 (unit name changed) was the second highest rated unit at the
hospital scoring significantly higher than the hospital mean for the same time frame. The second
highest unit was preferred over the first rated unit due to structural and unit size similarities to
A1. The highest rated unit B1 (unit name changed) was located in the newer wing of the hospital
and had a unique layout. Access was granted to units A1 and C1, however, access to the

49
patients’ bedside was not part of the protocol. Observations included the general floor, reception
area, lunchroom, conference rooms, clerk desks, management offices, and general work areas.
Figure one details the data collection time line.
Figure 1: Data Collection Timeline Unit A1: Observation 3 weeks
Unit A1: Interviews 2 weeks
Unit A1: Distribute and Collect Surveys 2 weeks
Unit C1: Observation 2 weeks
Unit C1: Interviews 2 weeks
Unit C1: Distribute and Collect Surveys 2 weeks
A1=Poor Customer Service Record C1=High Customer Service Record
Data collection started on A1. One week into the project a revised hospital protocol form needed
to be filed. The manager on C1 was leaving prior to the time that research was to start on that
unit. A unit with an abrupt change in management would not yield accurate data for the
purposes of this study. Documentation was approved for data collection on unit B1. This is a
disadvantage to the study because the unit layouts and size were no longer comparable.
However, the third ranked service unit was not significantly higher than the mean of the hospital.
Thus, B1 was the only viable unit to select. Figure 2 represents the time line changes.

50
Figure 2: Data Collection Timeline Revised Unit A1: Observation 3 weeks
Unit A1: Interviews 2 weeks
Unit A1: Distribute and Collect Surveys 2 weeks
Unit B1: Observation 2 weeks
Unit B1: Interviews 2 weeks
Unit B1: Distribute and Collect Surveys 2 weeks
A1= Poor Customer Service Record B1= High Customer Service Record The amount of time spent on each unit was comparable except for the observation times. An
additional week was spent on A1 to become familiar with the hospital surroundings and to
observe a new dress code requirement. Most of the research time was dedicated on the specified
units, however, archival research was completed intermittently throughout the entire schedule.
Participant samples.
The participant sample varied slightly between the units due to personnel and specialty
area. There are a variety of personnel on A1 including the Unit Medical Director (UMD), Staff
Physicians, rotating resident doctors, the Nurse Administrative Manager (NAM), the Unit
Educator, Registered Nurses (RNs), Nurse Assistants (NAs), Nurse Intern/Extern, Clerks, Case
Managers, Pharmacy, Dietary, Unit Associate, and Unit Support Staff. In total, there are
approximately 60 people dedicated to A1.
On B1 personnel was larger and included Clinical Nurse Specialists and Nurse
Practitioners. In addition, there was an additional rotating team of residents. A team includes
two or three first and second year residents, a third year resident, and a fourth year resident. In
total there were approximately 90 staff dedicated to B1.
Units A1 and B1 should also be compared by their specialty area. A1 is a 34 bed
hematology unit specializing in dialysis treatment performed on and off the unit with pre and

51
post transplant care. The average stay for patients is two to four days and most rooms have two
patients. Patients do tend to have repeat stays. The nurse to patient ratio can range from one
nurse to four to six patients.
B1 is a 40 bed oncology unit specializing in cancer treatment. Bone marrow transplant
patients are assigned a special section of the unit. The unit has a unique physical layout and all
patients have private rooms. The average stay for patients is five to six days, however, some
patients spend their last days on the unit. Some patients will have repeat stays for certain
procedures. The nurse to patient ratio is one nurse for every 4 or 6 patients depending on the
time of day.
Research question one: Survey.
A quantitative approach was used to assess the climate of the units. Climate studies, as
indicated in the literature review, have typically used a survey methodology allowing many
people to be analyzed. Smith (1998) identified four procedures for conducting survey research:
selecting a representative survey sample, designing a survey questionnaire, administering the
survey and analyzing the results. The participant samples have already been identified. This
section begins then with a description of the instrument’s design. Next, the steps used to
distribute the survey will be explained. Finally, the survey analysis will be discussed.
Instrument design.
The first research question compared the two unit’s climate through a combined
questionnaire of Schneider, White and Paul’s (1998) Assessment of Service Climate and Litwin
and Stringer’s (1968) Organizational Climate Questionnaire (OCQ-Form B). Each instrument
offers a unique perspective for measuring climate. Appendices A and B respectively.
First, Schneider, White, and Paul’s (1998) instrument assesses whether an organization
has a service climate. This instrument extends Schneider and Bowen’s (1985) research on the

52
relationship between service climate and customer service quality perceptions. Their study used
longitudinal data of over 4,600 employees and 7,200 customers. The researchers assert that
organizations create foundation conditions for enhanced service quality. These conditions serve
to focus employee service efforts resulting in higher service quality perceptions. Permission was
granted by Schneider via email for the inclusion of the survey in this study.
The instrument includes three distinct areas: foundation issues scales, climate for service
scales, and customer perceptions of service quality scales. Work facilitation and inter-
department service are the foundation issue components. Work facilitation included questions
on leadership, participation, computer support, and training. The inter-department service scales
were dropped from the study for several reasons. For example, the survey has ten items
regarding support resources for employees. The current study would have to expand this section
to 90 items because of the presence of more support resources, which would have negatively
impacted response rate. Therefore, this along with other factors forced the decision to eliminate
this scale from analysis.
The climate for service included the following scales: global service climate, customer
orientation, managerial practices, and customer feedback. The first one, global service climate,
is an all encompassing look at the climate for service in an organization. The remaining three
identify specific aspects of a climate for service. All scales were used.
The final area, customer perceptions of service quality, was not used because patients
were not part of the protocol.
The second instrument used in the current research is the Litwin and Stringer’s (1968)
Organizational Climate Questionnaire (OCQ) which is representative of a non-organization
specific climate measurement. The instrument has been used in a variety of industries, and,
according to Schnake (1983), the instrument has been the most frequently used instrument in
53
climate research. Respondents use a four point Likert scale to indicate their agreement level.
The scale dimensions include structure, responsibility, reward, risk, warmth, support, standards,
conflict, and identity. Each is described below.
Structure-the feeling that employees have about the constraints in the group, how many rules, regulations, procedures there are; is there an emphasis on “red tape” and going though channels, or is there a loose and informal atmosphere. Responsibility-the feeling of being your own boss; not having to double-check all your decisions; when you have a job to do, knowing that it is your job. Reward-the feeling of being rewarded for a job well done; emphasizing positive rewards rather than punishments; the perceived fairness of the pay and promotion policies. Risk-the sense of riskiness and challenge in the job and in the organization; is there an emphasis on taking calculated risks, or is playing it safe the best way to operate. Warmth-the feeling of general good fellowship that prevails in the work group atmosphere; the emphasis on being well-liked; the prevalence of friendly and informal social groups. Support-the perceived helpfulness of the managers and other employees in the group; emphasis on mutual support from above and below. Standards-the perceived importance of implicit and explicit goals and performance standards; the emphasis on doing a good job; the challenge represented in personal and group goals. Conflict-the feeling that managers and other workers want to hear different opinions; the emphasis placed on getting problems out in the open, rather than smoothing them over or ignoring them. Identity-the feeling that you belong to a company and you are a valuable member of a working team; the importance placed on this kind of spirit. (Litwin & Stringer, 1968, p. 81-82).
Litwin and Stringer (1968) identified concerns with the standards and conflict scales’
consistency. Later research by LaFollett and Sims (1975) and Muchnisky (1976) indicated
reliability issues with standards, conflict, responsibility and risk. Due to these concerns, the
current research utilized the structure, reward, warmth, support, and identity scales that generated
consistent satisfactory reliabilities.
By combining Schneider, White and Paul’s (1998) and Litwin and Stringer’s (1968)
instruments a specific understanding of whether there is a climate of service on the units can be
obtained. Further, a comparison of the individual factors of each instrument may provide
additional insight as to unit service level differences. Appendix C presents the final instrument.
The survey was pilot tested for usability purposes. Permission was granted by the NAM
and the Nurse Educator on another unit. Respondents were asked to complete the survey and

54
note any difficulties. Pilot testing “should assess the clarity of the instructions, the overall time
required to participate, the clarity and order of the questions, the need for ‘other’ response
categories, and overall, the ability and willingness of respondents to answer honestly and
completely” (Plumb & Spyridakis, 1992, p. 634). During the one week data collection period, 14
surveys were collected. A response rate could not be calculated due to the informal nature of
distribution. One respondent noted that the term “red tape” might be problematic for some
employees to understand. Because this was the only notation of this problem, the statement was
not revised. Two respondents mentioned the survey required less than 15 minutes to complete.
Survey distribution.
The NAM on each unit described the survey process at the unit staff meeting. The
explanation included an introduction to the researcher, a general description of the survey
content, instructions on how to fill out the survey, and the time frame to complete the instrument.
Approved posters were placed around the unit reminding employees to return their
questionnaires. Questionnaires were placed in mailboxes along with a letter explaining the
survey and asking for staff participation. Surveys were returned within two weeks of distribution
to a collection box located by employee mailboxes.
A second procedure for survey collection was used for staff physicians. The doctors do
not attend unit staff meetings run by the NAM and do not have mailboxes on the unit. Their
offices were located in a separate hospital building, so the data collection was coordinated
through the designated office assistant. Doctors received a letter explaining the survey and
seeking their participation. The one difference to this second collection design was the UMD.
On A1, the UMD completed the survey as part of his interview. On B1, the UMD did have an
office located on the unit. The UMD was given his survey during the interview. He completed
the survey at a later time and returned it to the unit’s collection box.

55
Survey analysis.
The questionnaires were counted and then reviewed to identify any non-useable
questionnaires. Each questionnaire received a number to identify the respondent. Likert
responses were entered into SPSS using a one to five or a one to four scale. Frequencies were
calculated to determine overall mean responses on each question by each unit. Frequency data
will also serve to review the data entry process for possible coding mistakes. SPSS will identify
missing data and calculate average individual responses. The data were subjected to t-tests on
each of the factors to determine whether there is a significant difference between the two units.
Due to the small sample size on each unit, additional inferential statistics were unable to be
calculated.
Research Question Two: Ethnography.
This section begins with an overview of ethnographic research. Next, details of data
collection will be explored. Finally, procedures for analysis are detailed.
Overview of Ethnographic Research.
An ethnographic design was employed to identify the differences between unit cultures.
Fetterman (1998) defines ethnography as “the art and science of describing a group or culture”
(p. 1). Gregory (1983) describes the ethnographic approach as studying the “participant’s views
about all aspects of the corporate experience. These would include the work itself, the
technology, the formal organization structure, the everyday language, as well as myths, stories or
special jargon” (p. 359). The goal of ethnography is to describe a culture by using observation,
interviews, and archival analysis.
The ethnographic method has several fundamental characteristics. First, conducting field
research enables the researcher to “know the world of the other through direct involvement
within it” (Grills, 1998, p. 4). Second, once in the field, the ethnographer will collect
56
information on routine behaviors and shared values (Fetterman, 1998; Schwartzman, 1993).
Finally, Patton (1990) explains that “culture is central to ethnography. The critical assumption
guiding ethnographic inquiry is that every human group that is together for a period of time will
evolve a culture” (p. 67-68). Thus, the ethnographer’s goal is to be able to provide a realistic
account of a given population by using observation, collecting a variety of information, and
keeping culture as the central focus.
The researcher needs to decide on an observer type. Denzin (1990) lists the four types as
complete participant, participant as observer, observer as participant, and complete observer. A
complete participant is fully concealed. The researcher becomes a member of the group and thus
studies covertly. A participant as observer will establish relationships with those being observed.
The investigator’s presence is known, but the investigator will interact with participants. In the
observer as participant, there is limited contact with participants. The researcher may just
interact through interviews, and relationships are not created. Finally, the complete observer role
is when the investigator is known but no attempt to interact with the subjects is made.
The majority of the current study was conducted somewhere between the observer as
participant and as participant as observer. Due to the nature of the research environment, I was
not be able to “be a part” of the organization. However, by job shadowing several workers, a
real sense of what life is like in the units can be achieved. Interviews served to clarify initial
observations. This research design did not, however, allow significant relationships between the
researcher and the employees to be established. Thus, a full understanding of the unit’s culture
may not have been obtained.
After data collection, the researcher will analyze the material collected and generate an
overall picture of how a system works. Glaser and Strauss (1967) suggest that the researcher

57
will create a mini-theory about the organization. The mini-theory will be grounded in the
observations and inferences of the organization’s culture.
Data collection.
This goal of ethnography is to describe a culture by using observation, interviews, and
archival analysis. Each of those methods will be discussed.
Observation.
Observation of a group usually occurs first and provides insight for the other techniques
(Fetterman, 1998). Two weeks of observation helped generate an understanding of the unit’s
culture. Observations occurred throughout the day so a bias towards any one shift could be
avoided. Most observations were limited to four-hour shifts to ensure a more accurate picture
was captured. When observation time exceeded this limit, small breaks recommended by
Emerson, Fretz and Shaw (1995) ensured accurate note taking and allowed time to regroup.
Observation notes were taken by hand while on the unit and were then transferred to a computer
document. Later, observations were transferred to note cards for categorization.
While on the units employees knew I was a visitor conducting research. Thus, as
expected, during the initial observations employee behavior seemed hesitant. By limiting notes
while on the unit, I hoped to keep any possible distraction to a minimum. Later, the observation
notes were supplemented with the observation date, the names of the employees, the time of the
observation, and the general locations covered on the unit (e.g. break room, information desk,
etc.). After several days on the unit, employee behavior seemed to be more relaxed around me.
Schein’s Model of Culture was used as a general guideline for observation note taking.
Schein’s Model explains that level one, artifacts and creations, is the most observable and details
were noted accordingly. For example, items such as how employees refer to each other,
communication patterns during meeting, the types of information posted in the break room, how

58
workers related to peers, and how supervisors relate to their subordinates were noted. Gregory
(1983) suggested to record “the work itself, the technology, the formal organization structure, the
everyday language, as well as myths, stories or special jargon” (p. 359).
Interviews.
Schein’s values and assumptions were generated through employee interviews. The
interviews were used to clarify observations and provide potential insight as to the values and
assumptions of each unit. The Human Investigation Committees at both the hospital and at
Wayne State University approved the interview questions prior to the onset of the investigation.
Therefore, some questions based on observational data could not be asked of the respondents.
Appendix E provides a list of the interview questions.
Approved advertisements requested volunteers for the interview and assured staff of
confidentiality. On each unit one or two employees requested interviews, however, the majority
of interviews were obtained after I asked employees if they would be willing to be interviewed.
The interviews were not consistent in terms of location nor in terms of time to complete.
Interview locations included lunchrooms, conference rooms, the information desk, hallways,
offices on and off the unit, and in work station areas. Interviews were conducted before shifts,
after shifts, during shifts or at lunch breaks. At times, some interviews were conducted in stages.
In these cases one or two questions would be asked and then the interviewee attended to patient
needs. All interviewees signed consent forms.
Archival data.
Archival data, such as meeting minutes and hospital newspapers, were obtained. The
hospital further provided results from both units of the employee opinion survey that was
conducted during the time frame of this study. This formal survey had not been completed for

59
more than three years. Archival data were reviewed after observations, interviews, and the
climate survey of this study was completed to reduce researcher bias.
Procedures for analysis.
Constant Comparative Analysis was used to assess observational and interview data.
Constant Comparative Analysis is a technique used to analyze qualitative data once it has been
transferred to another medium such as note cards in order to generate categories pertinent to the
research (Glaser & Strauss, 1967; Strauss & Corbin, 1990). Interview and observation data were
typed and pasted onto note cards for analysis. Each type of data was reviewed separately to
allow for comparison between the units. Observation and interview data were read twice before
categorization. Glaser and Strauss (1967) suggest coding each incident or observation into as
many categories as possible. As I coded each incident, I compared the observation to others
already in the category to make sure consistency in coding was maintained. Two coding
procedures, open and axial as defined by Strauss and Corbin were used during analysis. Open
coding includes making comparisons and asking questions. As observations were compared and
then coded into categories, questions about the incidents were recorded as memos. Strauss and
Corbin suggest to continually ask questions so that assumptions or biases are not overshadowing
the analysis. Axial coding continues this process by considering how the data once in a category
is restructured. Strauss and Corbin explain “axial coding puts those data back together in new
ways by making connections between a category and its sub-categories” (p.97). In other words it
continues the development of the category into its foundational elements. It further refines the
category beyond a singular property or dimension into a multi-dimensional construct. For
example one observation category on A1 was “Rules.” Axial coding revealed its sub-categories
to be policy adherence, policy enforcement, abuse of resources and safety/security. Thus, axial
coding allows for a better understanding of meaning within a category.

60
Miles and Huberman (1984) suggest that problems with validity in qualitative research
can happen because the observations, field notes, analysis and conclusions may all be conducted
by one person. Three biases in the data can result: holistic fallacy, elite bias, and going native.
The holistic fallacy is when patterns in data are labeled as more harmonious than is actually the
case. Elite bias is when more weight is given to select “high status” informants resulting in a
skewed perception. Finally going native is when the researcher “loses perspective” and takes on
the perspective of the informants.
Several strategies were employed to avoid these biases. First, categories were not only
identified, but the number of observation occurrences was tallied. Maxwell (1996) refers to this
as quasi-statistics and indicates “any claim that is a particular phenomenon is typical, rare, or
prevalent in the setting or population studied is an inherently quantitative claim and requires
some quantitative support” (p. 95). Charts were created that rank ordered categories by the
number of occurrences. This kept me from placing more weight on a single incident. Next,
several types of research methods were employed including observation, interview and archival
data analysis which provides a variety of sources to verify findings. Another strategy was
interviewing a large sample. On both units close to 70% of each unit was interviewed and most
job classifications were represented which helps to avoid an elite bias. Finally, for both units,
there was a period of time where I was visible to unit employees before field notes on behavior
were written. For example, for both units, I came to the unit to meet with nursing management
and I took a tour of the unit. During this time the NAM introduced me to members of the unit.
Initial observations included drawing a map and becoming familiar with the unit. This enabled
me to be on the site longer to “fit in” and help alleviate some researcher effects.
The interpretive and the functional perspectives of culture guide this investigation. The
descriptive and explanatory nature of the interpretive perspective provides a basis for unit

61
comparison whereas the functional perspective that assumes culture can be modified provides a
foundation for suggested organizational changes to promote higher service evaluations.
This methodology was reviewed by Wayne State University’s Human Investigation
Committee (HIC # 045003B3E). This research qualified for expedited review. The results of the
study are presented in chapter three. This includes a summary of ethnographic data including
observations, interviews, archival data, as well as survey results and statistical analysis.

62
Chapter 3
Results
This chapter presents the results if the survey questionnaires and the ethnographic data in
two sections: research question one and two. Research question one used a quantitative
approach to assess climate differences between the two hospital units. Research question two
employed a qualitative approach to assess cultural differences between the two units. Within
each section a description of the sample is provided. Research question three comparing climate
and culture is discussed in the final chapter.
Results of Research Question One Comparing Climate Between the Hospital Units
Survey data were collected to answer research question one. Schneider, White and Paul’s
(1998) Assessment of Service Climate and Litwin and Stringer’s (1968) Organizational Climate
Questionnaire were combined to assess climate on the units. This section provides a description
of the sample, descriptive statistics on variables, and the inferential test comparing the means
between the two units.
Description of sample.
A1 had 59 surveys distributed with 36 returned generating a 61 percent response rate; B1
had 87 surveys distributed with 49 returned generating a 56 percent response rate. Demographic
classifications were obtained for job category and tenure. Job classifications were collapsed to
aid unit comparison into four job categories: doctors (UMD, staff physician, senior resident, and
resident in training), RNs (nurse manager, registered nurse, nurse intern/extern, clinical nurse
specialist, and nurse practitioner), NAs, and others (clerk, case manager, pharmacy, unit
associate, unit support person, and other). (See Appendices E and F for job classifications.)
A comparison of collapsed job classifications indicates some unit differences. There was a
larger sample of doctors on A1 (28.6%) compared to B1 (18.8%) and a larger other category on

63
A1 (22.9%) compared to B1 (18.8%). The sample of nurses were larger on B1 (47.9%)
compared to A1 (34.3%). NAs were relatively constant on A1 (14.3%) and B1 (14.6%).
Variances in the demographics of each unit, therefore, may influence results.
Unit tenure is the other demographic variable. Approximately 20 percent of the
respondents on both units had been there for less than one year. Staff who had been on the unit
from one year to less than three years was slightly higher on A1 (33.3%) compared to B1
(28.6%). Finally the senior staff, those on the unit for three or more years, was greater on B1
(49%) than A1 (41.7%). Differences in tenure were less pronounced than job classification
differences. Appendix G provides the tenure chart.
Due to the small sample size on both units, inferential statistics discussed later were only
applied to the units as a whole. Differences between the units based on job classification and
tenure is a potential limitation of the study and will be addressed in the results section.
Descriptive statistics
Exploratory Data Analysis was used to assess for errors or problems with the survey data.
Descriptive statistics including minimum, maximum, mean, standard deviation, and skewness
were reviewed. All responses were within range. Skewness was approximately normal on each
variable for overall data and for each unit (skewness results were less than plus or minus one).
Missing data were less than ten percent for all questions except for four. The highest missing
value was 11.8%. There were a total of 65 climate questions on the survey.
Factor analysis assessed the underlying structure of the Litwin and Stringer’s (1968)
Organizational Climate Questionnaire and the Schneider, White and Paul’s (1998) Assessment of
Service Climate Instrument. Historically, both instruments have produced five factors. The
Litwin and Stringer instrument includes structure, reward, warmth, support, and identity scales.
The Schneider, White and Paul instrument includes work facilitation, global service, customer

64
orientation, managerial practices, and customer feedback scales. Principal axis factoring found
Eigenvalues greater than one for eight factors on the Litwin and Stringer instrument and for eight
factors on the Schneider, White, and Paul instrument indicating inconsistencies with both
instruments’ dimensionality for the current study. Factor analysis was then conducted on each of
the 10 historical factors yielding inconclusive results. Based on previous research treating all
factors as uni-dimensional (Jones, Guberski, Soeken, 1990; Keuter, Byme, Voell & Larson,
2000; Liou & Cheng, 2010), the current research treated the factors in that manner.
Cronbach’s alpha was computed for each scale to determine internal consistency
reliability. Table 1 indicates the reliability scores for each scale.
Table 1
Summary of Reliability for Survey Instruments
Litwin And Stringer Scales
Cronbach’s Alpha
Schneider, White, and Paul Scales
Cronbach’s Alpha
Structure .639 Work Facilitation .900 Reward .746 Global Service .911 Warmth .738 Customer Orientation .882 Support .694 Managerial Practices .917 Identity .778 Customer Feedback .835 Alpha scores for eight of the ten scale items are greater than .70 indicating reasonable to good
internal consistency. However, two scales from the Litwin and Stringer instrument, structure and
support, obtained marginal internal consistency (.639 and .694 respectively). This contradicts
previous research where alphas were much higher. None of the scales obtained an unacceptable
reliability which would be a coefficient below .60 (Reinard, 2006).
A Pearson’s correlation was computed on the scales to aid in validity assessment. Table
2 displays the results.

65
Table 2
Intercorrelations for ten scale measures (n=78a)
Note. r = Estimate of the Pearson product-moment correlation coefficient; p = probability, two-tailed. a Listwise *p<.05. ** p < .01. Table 2 displays the Pearson coefficients obtained when all ten scales were correlated. Forty
three of the 45 coefficients were significant at p < .01. The two remaining relationships
(structure and customer feedback, r = -.271; reward and customer feedback, r = -.248) were
significant at p < .05. Each survey instrument obtained positive correlations when comparing
their sub-scales. When the two survey instruments were compared, negative correlations were
obtained. This is due to differences in the coding of the Likert responses. For example, a person
Variable 1 2 3 4 5 6 7 8 9 10
1. structure r -- .416** .388** .524** .413** -.464** -.489** -.552** -.614** -.271*
p .000 .000 .000 .000 .000 .000 .000 .000 .016
2. reward r -- -- .472** .694** .591** -.309** -.570** -.472** -.490** -.248*
p .000 .000 .000 .006 .000 .000 .000 .029
3. warmth r -- -- -- .697** .604** -.254* -.572** -.534** -.530** -.380**
p .000 .000 .025 .000 .000 .000 .001
4. support r -- -- -- -- .702** -.431** -.640** -.612** -.583** -.444**
p .000 .000 .000 .000 .000 .000 5. identity r -- -- -- -- -- -.408** -.682** -.639** -.624** -.380**
p .000 .000 .000 .000 .001
6. Work Facilitation
r -- -- -- -- -- -- .402** .443** .548** .423**
p .000 .000 .000 .000
7. Global Service
r -- -- -- -- -- -- -- .779** .783** .570**
p .000 .000 .000
8. Customer Orientation
r -- -- -- -- -- -- -- -- .784** .633**
p .000 .000
9. Managerial Practices
r -- -- -- -- -- -- -- -- -- .648**
p .000
10. Customer Feedback
r -- -- -- -- -- -- -- -- -- --
p

66
strongly agreeing with a question on the Litwin and Stringer instrument was coded as a “1”
whereas a person who fully agreed with questions on the Schneider, White, and Paul instrument
was coded with a “5.” The two types of significant correlations, correlations within each
instrument and correlations between instruments, give support for face validity. The correlations
within each instrument and between the two climate instruments indicate that the instruments are
measuring a common phenomenon.
Inferential test results comparing means
Research question one asks: “What is the climate of each unit and how does it vary
between units with high and low service ratings?” The goal of the two instruments was to assess
organizational climate. Comparing the mean results of the two units on each of the ten subscales
indicates not only the type of climate each unit has but also where the units differ. Table 3
provides the results of an independent samples t-test between the two groups.

67
Table 3 Summary of Mean Differences between Hospital Units Scale Unit N Mean SD t df Sig CI
(2-tailed) LL UL Structure A1 36 2.4411 .47010 .345 83 .731 -.16389 .23255 B1 49 2.4068 .44190 Reward A1 36 2.8537 .58626 .883 83 .380 -.14363 .37281 B1 49 2.7391 .59518 Warmth A1 36 2.5417 .68645 2.857** 83 .005 .11376 .63488 B1 49 2.1673 .52177 Support A1 36 2.5819 .57448 1.547 83 .126 -.05776 .46247 B1 49 2.3796 .61083 Identity A1 36 2.7060 .68530 3.063** 82 .003 .15259 .71778 B1 48 2.2708 .61201 Work Facilitation A1 36 3.2866 .88286 .335 83 .738 -.27047 .38022 B1 49 3.2317 .62595 Global Service A1 35 2.8320 .87455 -2.586* 81 .011 -.85550 -.11151 B1 48 3.3155 .81612 Customer Orientation A1 36 2.9529 .78784 -2.341* 81 .022 -.70307 -.05708 B1 47 3.3330 .68826 Managerial Practices A1 36 3.4444 1.06923 -1.078 80 .284 -.68913 .20483 B1 46 3.6866 .96019 Customer Feedback A1 34 3.6422 .91207 -1.253 79 .214 -.66915 .15205 B1 47 3.9007 .91924 Note. CI = confidence interval; LL = lower limit; UL = upper limit *p < .05. ** p < .01.
Table 3 shows that two scales were significant at p < .05 (global service and customer
orientation) and two scales were significant at p < .01 (warmth and identity). For Global Service
there was a statistically significant difference between A1 and B1 t(81) = -2.586, p = .011, d =
.57. B1 (M= 3.3155, SD= .81612) rated their unit as having a better service than A1 (M=
2.8320, SD= .87455), and the effect size would be considered typical. For Customer Orientation
there was a statistically significant difference between A1 and B1 t(81) = -2.341, p = .022, d =
.71. B1 (M = 3.3330, SD = .96019) rated their unit as having a higher customer orientation than
A1 (M = 2.9529, SD = .78784), and the effect size would also be considered typical. There was
a statistically significant difference between A1 and B1 t(83) = 2.857, p = .005, d = .63 on the

68
Warmth scale. B1 (M =2.1673, SD = .52177) ranked themselves as having a better atmosphere
than A1 (M = 2.5417, SD = .68645), and the effect size would be considered typical. Finally,
there was a statistically significant difference between A1 and B1 on Identity t(82) = 3.063, p =
.003, d = .68. B1 (M= 2.2708, SD = .61201) identified more with the organization than A1 (M=
2.7060, SD = .68530), and the effect size was also typical.
Because the t-tests may not provide the most accurate set of results due to the dependent
variables being strongly correlated, a MANOVA was calculated. A mulitivariate analysis of
variance was conducted to assess if there were differences between the units on a linear
combination of the ten climate factors. A significant difference was found, Wilk’s Λ = .779, F
(10, 69) = 1.954, p=.05, multivariate η2 = .22. Follow up univariate ANOVAs verified that
Warmth, Identify, Global Service Climate, and Customer Orientation were significantly different
between units A1 and B1, F (1, 78) = 7.66, p = .007; F (1, 78) = 7.76, p = .007; F (1, 78) =
6.105, p = .016; and F (1, 78) = 4.981, p = .028 respectively.
Although more differences were expected between the two units in terms of climate, the
four factors indicate areas where the units differ. Global Service Climate and Customer
Orientation would be expected to be higher on B1 which is the unit with better customer service
ratings. The other two factors, Warmth and Identity, may provide reasons as to what aspects of
the climate make B1 unique. Warmth is a factor that asked respondents to rate how “friendly”
the people were in their organization, and identity asked respondents to rate how supportive
members of the organization are and whether the respondent feels “close” to the organization.
Both of these factors are indicative of the team nature noticed in the next section on culture.
Results of Research Question Two Comparing Culture Between the Hospital Units
An ethnographic approach assessed the culture on each hospital unit through observation,
interview, and archival data collection and analysis. This section summarizes the results for each

69
data type for each unit. A comparison of the units for purposes of answering research question
three is addressed in chapter four.
Unit A1: Summary of observation notes.
Observations on A1 began in May 2003 and ended in late June 2003. The 56 hours of
observation included “shadowing” workers, attending meetings, and lingering in the lunch room,
hallways, and work stations. Shifts varied between eight and 12 hours. More observation hours
were devoted to day shifts. Doctor rounding typically occurred in the mornings, but more patient
activity (transport to various floors) occurred in the late afternoons. The times observed will
impact the interpretation of the unit’s culture. If more observations had been completed in the
morning, a greater proportion of the doctor’s behavior or communication would have been
captured. Limited observations also occurred during early morning hours when activity and
staffing were significantly reduced. Thus, observation time was directed to hours when staff and
patient activity were highest. Appendix H provides A1’s observation time matrix.
During the first week of observation, limited notes were taken due to my lack of
familiarity with the hospital environment. Instead, I orientated myself to the unit by introducing
myself to employees, asking questions about job responsibilities, meeting with the management,
and drawing a unit floor plan.
The observation notes for A1 are divided into three sections: environment, personnel,
and observation categories.
Environment of A1.
When arriving on the unit, visitors will encounter the clerk’s desk where two clerks can
be found during the day and one clerk during the evening. The clerk’s desk is a high traffic area
for several reasons. First, the team plan, a schedule created by the charge nurse that indicates
nursing assignments, is kept on the clerk’s desk. Second, the NAM will occasionally come to

70
the clerk’s desk to review the team plan. Third, many of the NAs will “hang out” at the clerk’s
desk instead of their work stations. Three of the four clerks on A1 were previously NAs and
they maintain a bond to that group. Finally, the desk is active because many of the transport staff
will stop and talk to the clerks who are working.
A1 is divided into two sides known as the large and small end. Each side has a work
station, medicine alcove, one private suite for patients undergoing radiation treatment, and
patient rooms (all patient rooms have two beds). Most RNs and NAs will be assigned to one end
during their shift, however, many times RNs were assigned a “split” which indicates their
patients were on both ends of the unit. During the day, there was an average of three RNs per
side and one NA per side.
The center hallway contained the clerk’s desk, lunchroom, large conference room, case
manager office, NAM’s office, small conference room, and patient visitor room. In this hallway
there was a shadow box on the wall with staff photos and names. Besides the shadow box there
were only three pictures in the main hallway. Occasionally, there were notices to the staff taped
on the lunchroom door. Appendix I provides a detailed map of A1’s environment.
Personnel.
This section details the job classifications and duties of A1’s personnel. Observations
and informal conversations provided the background descriptions.
The job classifications can be divided between non-bedside and bedside positions. The
non-bedside positions include the NAM, Nurse Educator, Unit Associate, Case Managers, and
Clerks. The NAM has been on the unit for two years. The NAM wore the RN ceil blue scrubs
with a white lab coat. The NAM hires staff, counsels staff, disciplines staff, runs unit meetings,
conducts patient rounds, handles patient and/or family complaints, approves scheduling, attends
hospital committee meetings, and was occasionally seen assisting the floor nurses. The NAM is

71
in charge of all staff except for the doctors. However, the NAM does orient and provide job
performance feedback to the residents.
The NAM leads unit meetings that are held monthly. The meetings are attended by a
majority of staff leaving only a skeleton crew to cover patients. If staff did not attend, meeting
minutes could be reviewed in a binder kept in the lunchroom. During the 20 minute meetings,
the NAM would stop to clarify questions but few questions were asked. Employees listened but
no one took notes.
The Unit Educator was a RN who had been the ANAM (assistant nurse administrative
manager). The ANAM position was eliminated when the NAM was hired. The Unit Educator
had been an applicant for the NAM position, but hospital administration decided to hire from
outside the hospital. The Unit Educator spends half of her time as an RN and the other half of
her time making sure RNs are up to date on competencies, documenting RN and NA skill sets,
and offering educational classes for staff. The Unit Educator wore ceil blue scrubs.
The Unit Associate shares an office with the NAM and the Unit Educator and assists the
NAM with scheduling and documentation. During my observations, she mainly kept to the
office area and would occasionally be found at the clerk’s desk looking over the team plan. Her
part-time position is divided between A1 and another hospital unit.
There is one full time and one part-time case manager. Case managers rarely round with
the doctors due to their workload. Informal questioning revealed that the increased workload
prevented them from interacting with doctors and RNs on a needed level. Case managers work
with patients, families, and the courts to provide financial, home and nursing home assistance.
The full time case manager’s office was located on the unit, but the part time case manager’s
office was located on a nearby unit. CMs wore business attire with a lab coat.

72
Finally, there are four clerks assigned to the unit. Clerks complete admittance and
discharge paperwork and keep patient charts updated. Clerks also handle patient visitors and
phone calls to the unit. Clerks were mainly found at the clerk’s desk or outside of patient rooms
assessing patient charts. Clerks wore either black and white or navy and white.
There are also bed-side positions on the unit including RNs, NAs, physicians, and the
pharmacist intern. RNs are responsible for patient care on the unit by administering medication,
consulting with doctors, teaching patients, charting patient care, fulfilling doctor’s orders,
overseeing NAs, reporting any patient incidents, facilitating family communication, attending
unit and hospital meetings, completing education/certification requirements, and acting as the
patient advocate. RNs may also be assigned as CN (Charge Nurse) for a shift. RNs with
seniority or a “take charge” attitude were assigned to this position. During the shift, the CN was
the manager of the floor. The CN creates the team plan and oversees the “team reports.” The
“team report” provides the next shift with the floor census (the number of patients on the floor),
the number of new admits, the number of potential new admits, any problem patients, and any
patient incidents. After the CN completes the “team shift report,” the individual nursing
“reports” take place.
Reports are an essential element of patient care where the RN from the last shift will meet
with the RN from the next shift to review patient details. This “report” time on the unit usually
takes a half hour. Report occurs in the hallway outside of patient rooms at the “pull downs” (a
shelf like cabinet that houses patient records)
Report is a sacred event on A1. I observed ten full reports and I learned that although
report could be interrupted momentarily the nurses did not stop giving report. For example, in
one instance a doctor interrupted and asked that a patient receive a warm compress. The nurse
coming on shift made a note of the request, but the request was not carried out until after report

73
was completed. This same issue happened with transport who came to take a patient during
report. The nurse coming on needed to administer medication to the patient before the patient
left the floor. Transport had to wait 15 minutes until the nurse finished report before she could
administer the medication.
When starting a shift RNs also face the uncertainty of not knowing which unit they will
be on for their shift. Depending on the census, a nurse may be “pulled” to work on an
understaffed unit. Almost all shifts that I observed either had a RN pulled to another unit or had
an RN or an NA from another unit “pulled” to A1. All nurses on duty are supposed to carry a
wireless phone to ensure rapid communication. Nurses wore ceil blue scrubs.
NAs provide assistance to RNs by completing temperatures, patient weights, turning
patients, and similar duties. RNs often delegate other responsibilities to the NAs depending on
patient load. NAs wore burgundy scrubs.
There were three levels of physicians on the unit: the UMD, staff physicians, and
residents. The UMD is the senior physician in charge. I never observed the UMD interacting
with other unit employees. All physician’s offices are located in another hospital wing. The
staff physicians take turns rounding with the residents and are directly involved with resident
education. During rounding, staff physicians listened to residents and would often ask questions
about the patient’s current condition, medical treatment, and care plans. All staff physicians
willingly answered resident questions. When rounding, RNs were able to ask residents
questions. When this occurred, the resident would take a few steps away from the rounding team
to dialogue with the RN. Resident teams were found in the hallways, the large conference room
or in the work stations in the mornings, but at other times were located elsewhere in the hospital.
All physicians wore business attire with white lab coats and carried pagers.

74
Finally, there is a pharmacist intern dedicated to the unit. She rounds with the doctors,
consults with RNs, and has a small office on the unit. She spent most of her time either in her
office, off the unit at central pharmacy, or was seen rounding with doctors. The pharmacist
intern reviews patient charts for medication problems and consults with physicians. The
pharmacist intern wore business attire with a white lab coat.
The previous descriptions provide a general overview of the types of employees on A1,
their general behaviors and duties, and some background information on their positions. The
next section summarizes the observations made on A1.
Categories of observations on A1.
Observational notes were used to provide the personnel and environment notes
previously described. The remaining notes generated nine observational categories through
Constant Comparative Analysis. Table 4 indicates the categories and the number of observations
that were represented by each.
Table 4
Observation Categories derived from Observational Notes on Unit A1 Observation Category Number Percent Rules 27 29% Management Issues 17 18% Group Support 16 17% Patient Stories 9 10% Doctor and Nurse Interaction 9 10% Issues between Unit A1 and other areas 6 6% Workload 4 4% “Leaving” 3 3% Patient Interaction 2 2% Total Observations 93 100%
For the observational data the top five categories will be discussed because they collectively
have the most potential to influence A1’s culture.

75
The most predominant category is “Rules.” The majority of notes in this category relate
to rules that were being broken. Four sub-categories emerged: policy adherence, policy
enforcement, abuse of resources and safety/security.
Policy adherence includes any employee disregard for hospital rules. Most of the
transgressions fall in this sub-category. One example is the use of RN phones. RNs are required
to have their phone so that communication from other departments or from patient families could
easily be sent to the appropriate nurse. RNs would often leave their phones in the work stations
as they went about their duties. This issue was noted by a clerk who was criticized by other units
because RNs could not be reached. Another example of policy adherence is the eating and
drinking in the mini-stations. Food is discouraged in the work area due to the passing of bacteria
and viruses. One nurse mentioned that their unit had a problem with the doctors eating and
drinking in the work areas. As she spoke to me about this, she was carrying a drink into the
mini-station. A final example of policy adherence was the lack of care plans being completed in
a timely manner. Care plans, which indicate patient treatment, must be completed every 24
hours. One nurse called herself the “Care Plan Queen” because she “gets on” the other nurses to
do the care plans. She recalled that during the morning shift she had printed several care plans
and had asked the day shift nurses to put them in the patient charts. The pile was still sitting next
to the printer when she came back for an 11pm shift. She then remarked to another nurse “See
you can’t trust them to get it done.”
The next sub-category is “Policy Enforcement” which includes management’s inability to
secure rule adherence. One example of policy enforcement stems from the nurse phone issue
addressed previously. The clerk had mentioned the phone issue had been a problem for some
time and a lack of discipline allowed the problem to continue. Management did not enforce this
hospital rule nor punish transgressions. Second, a rule mentioned by the NAM during the unit

76
meeting was that “team shift reports” (where the CN presented unit issues to the next shift) were
not being done and that they needed to be occurring. During my observation time, I only
witnessed two such reports. Although management reminded staff of the “team shift report”
obligation, management consistently failed to enforce this hospital rule.
The third sub-category, “Abuse of Resources,” is the inappropriate use of materials or
time. Two examples of materials abuse occurred on the weekend when managers were not
present. One RN was using the computer to print off coloring material for her daughter while
another nurse dyad was busy doing origami. One of the clerks came in and jokingly said not to
use the paper and that the RNs would need to buy the paper. The origami lasted 45 minutes
before one of the RNs left. Another example of time abuse was employees taking unauthorized
smoking breaks. During the unit meeting the NAM mentioned that smoking breaks were no
longer being allowed and that regular assigned lunch breaks should be used for that purpose. A
clerk reported that the day after the meeting, employees were still taking smoking breaks.
The final sub-category, safety and security, includes four examples. First, on an initial
tour the Unit Educator mentioned that all medicine alcoves were supposed to be locked to keep
medication secure. On my first weekend observation, the CN took me on a tour of the unit and
repeated the same rule. Upon reaching the alcove, we found the doors were not only open, but
bandages had been used as tape to keep the doors from being locked. The majority of time that I
was on the unit, the medicine doors were always left slightly open. Another example of safety
and security was a staff physician who permitted me to access the dialysis area. I had been
observing a teaching session between the staff physician and the residents when the staff
physician asked if I had permission to access patients. Before I could answer he indicated that it
didn’t matter, that he broke the rules all the time and that it wouldn’t come back on him anyway.
A final example of safety and security were patient call lights that were not answered in a timely

77
manner. In fact I noted several instances when staff walked by a room with a call light on
without stopping to see what the patient needed.
The four sub-categories of policy adherence, policy enforcement, abuse of resources and
safety and security indicate a significant problem with “Rules” on A1. Underneath the surface of
this most prominent category lies a greater concern. A negative attitudinal component continues
to surface across employee work groups and indicates a cultural norm for the unit. A strong
negative attitude toward hospital rules by staff and management will surely continue to result in
negative employee behavior.
The second highest category is “Management Issues” with observations divided between
payroll and upper management issues. The payroll concerns were scheduling and
reimbursement. Negative employee remarks included comments about how others received a
better schedule or how the schedule the employee received was not the one they had requested.
For example one RN said, “They say the schedule is up to you but they just make a decision.”
One reimbursement example was a NA complaining that she felt she deserved time and a half for
coming in during an off shift for CPR training. Another reimbursement topic came up when the
Unit Associate received a request from an employee who sought funeral leave for a step
grandparent. The Unit Associate directed the question to the Unit Educator who rolled her eyes,
shook her head and said, “Don’t get me started. No, they don’t get paid for that.”
The remaining observations for “Management Issues” were negative comments directed
at upper management. For example, I attended a Nursing Forum where nursing issues were
presented by upper management. Previously, the nursing office had sent representatives to the
units to meet with staff, but, unfortunately, these meetings were not well attended. Thus, the
new format of a large lecture presentation was designed. Some of the RNs made comments such
as “Why should I go to the meeting to meet (V.P. of Nursing, name omitted) when she doesn’t

78
even say ‘hi’ to me in the hallway.” Other nurses nodded their heads in agreement. Other
comments were about the new nursing model. About a year ago the hospital moved from a
“Patient Focused Care Model” to the “Professional Nursing Model.” Most RNs could not
explain the new model and they assumed the old model, which they liked, was banished due to
budgetary reasons. One RN referred to the Professional Nursing Model as (the V.P. of Nursing)
Model. She went on to say “I don’t know what it is and I’ve never heard about it.”
“Management Issues” mainly comprised payroll and upper management critiques except
for one outlying example. A NA was crying because an RN had told her to “shut up” about
something. The NA was complaining that it would not do her any good to write up something to
the NAM because it would not be listened to and what the other RN would say would make her
look bad. Another NA that was present said it didn’t matter because the RN side would be taken
“no matter what.” This demonstrates a potential problem for management on the unit. This
perception if true could create a negative atmosphere.
The “Management Issue” category points mainly to concerns with upper management
relating to front line employees. Direct patient care personnel may not feel supported by those in
a position to provide changes in the hospital.
The third category of “Group Support” was mainly negative observations noting a lack of
“groupness” on the unit occurring across and within workgroups. Observations were sub-
classified into employee apathy, NA understaffing, and interpersonal communication.
The first sub-category, employee apathy, includes laziness or the appearance of a lack of
concern. Several employees mentioned how others were not doing their work. For example, one
clerk complained about another clerk being lazy by not completing her assignments. One RN
complained “it’s amazing how some people can find the time to sit.” Another RN was
wondering if I was noting those people who were not working. She was upset because she was

79
staying past her shift to complete her assignments because she did not trust the next RN to do the
assignment quickly. Although responding to call lights was grouped under “Rules,” it can also
be applied here in employee apathy. Watching both RNs and NAs walk past rooms with call
lights signals a lack of concern for patient’s needs. Finally, one RN complained about finding
NAs playing on the computer instead of helping. All of these examples demonstrate employees
that are not living up to their potential and indicates an area of concern for management.
NA understaffing is the second sub-category and indicates the numerous instances when
shifts worked with one less NA or no NAs staffed. On one occasion I overheard the clerks
talking about how there were no NAs on the previous evening when the unit had two codes
within 45 minutes. The lack of NAs on the unit causes issues for RNs because RNs lose a
critical level of needed support.
The final sub-category is interpersonal communication. I noticed issues between work
groups and between employees of different ethnic cultures. Throughout the observation, there
were problems between RNs and NAs. There were several instances when RNs complained that
if NAs were asked for help either no help or limited help was given. Another example
mentioned earlier in “Management Issues,” the case of the NA crying because an RN had told
her to shut up about something, also demonstrates interpersonal problems. The NA was upset
and felt that there was little she could do to resolve the issue including going to management. I
also heard through the NAM about an incident that happened where one of the African American
NAs had either pushed or shoved one of the Asian RNs. The NAM commented that there were
race issues on the floor. I did not observe any other issues of this nature.
One observation falling outside of the sub-categories but still a part of “Group Support”
was a pot-luck meal. I watched the sign-up sheet the week before the event and only three
people had signed up to bring food. On the day of the event, only a few people brought in food,

80
creating a crisis for the clerks who started collecting money so food could be purchased. This
small example of lack of employee involvement and coordination seems indicative of a larger
problem on the unit. This instance along with employee apathy, NA understaffing, and
interpersonal communication indicates a problem with unit teamwork that will be explored in
chapter four.
“Patient Stories” is the fourth observational category where the majority of stories reflect
unruly patients or death. For example, a clerk mentioned the story of a 31 year old patient who
created “drama”. The patient couldn’t see and the doctor had ordered a consult from
ophthalmology. The patient then said to a RN to hand her her glasses and then she said she
could see. The same patient had smeared fecal material all over her bed, walls, and bathroom
because she couldn’t find the bathroom. A story of death was related by a RN who
recalled a patient who was going to be discharged but the doctors wanted to do surgery. The
patient did not want to do the surgery, and the nurse suggested a conference with the doctor and
if the patient still did not want to do the surgery to say no. When the nurse came back to the
floor a few days later she found out the patient had died after having the surgery. The nurse said
that when she found out she just walked around all day very sad as if it had been her own father.
Although a few “Patient Stories” were positive, it is important to note that almost all of
the patient stories were negative. One RN mentioned that patients on A1 rarely say thank you.
But, as RNs they must always be the patient’s advocate. Some patient stories also alluded to the
problems between doctors and nurses that the final category illustrates.
The final category is “Doctor/Nurse interaction” which focuses on strained interpersonal
relationships between doctors and nurses. For example, one RN said that there are times when
doctors won’t listen. She said in one month there were three episodes when doctors wouldn’t
listen to her and each time resulted in a patient having a problem, two of those times the patient

81
coded. Another RN revealed she had refused to do a treatment because she thought her patient
may have a stroke from the procedure but the doctor insisted telling her that he was the doctor
and she was the nurse and she needed to obey him. The last example of a negative doctor nurse
interaction is between the UMD and the NAM. I was in the NAM’s office when one of the
clerks walked in and told the NAM that the UM D wanted the NAM to get the dry erase marker
for him. When the NAM asked why the clerk didn’t do it, the clerk appeared embarrassed and
explained that the UMD said he didn’t want the clerk to do it, he wanted the NAM to do it. This
episode clearly indicates that there is tension amongst the head management on the unit.
Another observation in this category related to the residents that rotated through the unit.
Before the current residents were to rotate, I asked whether going away parties were held. One
clerk told me that they have too many doctors coming and going and it was difficult to keep track
of them. I watched for anyone saying good bye to the doctors, but I did not see any such closure.
I did notice on the last day that B1 had a going away party for their residents and the remaining
food from their party was brought down to A1. I watched all the clerks on duty hurry into the
lunchroom and then the RNs and NAs went in at alternate intervals. I never noticed any of the
A1 doctors getting food.
The “Doctor/Nurse interaction” category suggests that the relationship between the
doctors and the RNs on the unit appears strained. The doctors do not call the RNs by name.
Instead, doctors seem to catch the RN’s eyes or tap them on the shoulder and then start to talk.
Most of the RNs referred to the doctor by saying “doctor” or “doc” when they spoke to them.
The stories of interaction between the two groups are all negative stories and the head doctor and
nurse do not appear to get along.
Overall the five observational categories of “Rules,” “Management Issues,” “Groupness,”
“Patient Stories,” and “Doctor/Nurse interaction” seem to indicate problems both structurally and

82
interpersonally for the staff of A1. There is a general lack of support between and within
positions. This absence of teamwork is also illustrated in the interview section presented later in
this chapter. Next, the observation notes for B1 will be presented.
Unit B1: Summary of observation notes
Observations on B1 began in mid July 2003 and were completed in early August 2003.
A total of 38 hours were spent observing. The observation hours do not include the initial time
spent on the unit to meet the NAM, meeting other management staff, or the time needed to draw
the unit, because these duties were completed concurrently with interview sessions on A1.
Unfortunately, the hours for these were not documented but are estimated to be about six hours.
More observation hours were devoted to day shifts as was the case with A1. Day shift hours are
the busiest times for B1 providing more observation opportunities of staff. Appendix H provides
B1’s observation time matrix.
The observation notes for B1 are divided into three sections: environment, personnel,
and observation categories.
Environment of B1.
When first arriving on B1, visitors will walk past a large lounge area where couches,
chairs, tables and a television are located before they are greeted by the Unit Associate. The
Unit Associate’s desk is in the open and is located next to the NAM’s office. Although the
NAM is further away from the patient rooms as compared to A1’s NAM, she is able to see those
coming onto the floor and has her own office.
Once past the Unit Associate’s desk, the unit becomes a maze. The shape of the unit
could best be described as a capital letter “H.” As a visitor, I found the layout complex and I
required several visits before I became familiar with my surroundings. The layout was divided
into “pods” each with its own equipment, medicine alcove, computers, phones, desk, and patient

83
rooms assigned. Some of the pods were combined. For example, Pods 1 and 2 shared one desk,
housed the team plan, and was dedicated to servicing bone marrow transplant recipients. The
team plan location created some issues because members from other pods needed to walk the
maze to find the team plan, however, the CNs did their best to keep patients close together so
that RNs did not have to “split” between locations that were too distant.
Clerks had a separate desk similar to A1. The clerk’s desk had a larger counter area to
enable clerks to work on the necessary paperwork to keep patient charts current. However, the
clerk desk was not a gathering place as it was on A1.
The center hallways of the unit contained restrooms, break rooms, lockers, conference
rooms, the Unit Educator office, the ANAM office, the UMD’s office, one of the Staff
Physician’s office, and the Case Manager offices. Bulletin boards had postings from the hospital
and letters by patients and patient’s families to staff. Visitors to the unit would probably not see
these postings en route to a patient room. Postings would only be seen by visitor using the
lavatories. Another distinction about unit B1 involved wall decorations. Paintings and
decorations were frequently placed around the unit in sharp contrast to the limited wall décor of
A1. Appendix J provides a detailed map of B1’s environment.
Personnel.
Most job classifications on B1 were similar to A1 and can still be divided between non-
bedside and bedside positions. Duties for B1 personnel and attire are the same as A1 except
where noted.
The non-bedside positions include the NAM, Nurse Educator, Clinical Nurse Specialist,
Unit Associate, Case Manager, Clerks, and dieticians. The NAM wore the RN ceil blue scrubs
but did not wear a white lab coat which was a contrast to her A1 peer. The NAM looked like the
other RNs on the floor. The NAM transferred to the unit four years ago from a surgical unit.

84
Due to her hospital tenure and due to the B1’s size, the NAM reports directly to the Vice
President of Nursing and she was the only one to do so. Other hospital NAMs report to a middle
level nursing administrator. The Unit Educator also mentioned that when the NAM cleans, this is
a signal that something is bothering her. The Unit Educator once saw the NAM place a garbage
can next to her desk and just wipe off the table and everything went into the garbage.
The Nurse Educator was originally the NAM’s ANAM prior to them coming to B1. The
Nurse Educator revealed that she followed the NAM to B1 because she believed in the NAM and
wanted to continue to be a part of the NAM’s management team. She does prefer the surgical
floor, but her loyalty to the NAM brought her to this unit.
The Clinical Nurse Specialist (CNS) was another member of the management team. This
job classification was not on A1. The CNS had control over the RN scheduling. The CNS and
the Nurse Educator share an office.
The Unit Associate assists the NAM in the functioning of the floor. The Unit Associate
completes scheduling for the clerks and the NAs. The Unit Associate is a full-time position.
The one full time and one part-time case manager (CM) share an office. Occasionally, I
would see a CM rounding with the doctors. I also observed the CMs coming into the pod areas
and speaking with RNs more often than I noticed this happening on A1.
Clerks are also on the unit and duties are similar to those already explained except for the
visitor issue. Clerks were usually at their desk updating charts.
Finally, B1 has assigned dieticians. Dieticians brought patients food, removed food, and
spoke with patients about their dietary needs. Most RNs referred to the dieticians by their first
name, however, I did not notice whether the first name basis was reciprocated.

85
The bedside positions include RNs, NAs, Nurse Practitioners, and physicians. RNs have
the same duties as previously reported for A1 including the position of Charge Nurse (CN).
Reports are done in the same manner as on unit A1.
NAs were staffed similarly to A1, however, with the increased patient load, NAs had a
disadvantage when working on B1 due to the unit layout. On A1, NAs could easily see all
patient call lights due to one long hallway. NAs on B1 could not easily discern call lights. The
call lights did make a noise, but it was difficult to see a call light due to the unit lay out.
Nurse Practitioners are another job classification on B1 which was not on A1. Nurse
Practitioners have more education than the traditional RN and are legally able to write
prescriptions. The Nurse Practitioner rounded with the doctors in the morning. She wore ceil
blue scrubs with a white lab coat.
Finally, the physician group is different on B1 for a few reasons. First, there are three
rounding resident teams on B1. Second, the UMD and one staff physician have their offices on
the unit. Third, the staff physicians refer to RNs by name and joke around with them during
rounds. RNs were also observed as referring to staff physicians by name. This was a stark
contrast to the interpersonal relationships between RNs and physicians on A1.
The descriptions above explain how employees on B1 differed from A1 based on unit
layout, staff size, staff position, and staff background. The next section summarizes the
observations that were made on B1.
Categories of observations on B1
Observational notes were used to provide the personnel and environment notes
previously described. The remaining observations generated nine observational categories
through Constant Comparative Analysis. Table 5 indicates the categories and the number of
observations that were represented by each.

86
Table 5
Observation Categories derived from Observational Notes on Unit B1
Observation Category Number Percentage Management Issues 14 20% Service Quality 14 20% Team Plan 11 16% Position Socialization 8 11% Team Work 7 10% Report 5 7% Patient Respect 3 4% Patient Stories 3 4% RN and Physician Interaction 3 4% Other 2 3% Total 70 100%
For the observational data the top five categories will be discussed because they collectively
have the most potential to influence B1’s culture.
“Management Issues” is the most predominant category and includes management issues
on the unit and with upper management. “Management Issues” on A1 referred to staff complaints
of the unit management. On B1 this category reflects management practices. For example, when
the NAM took over the unit several staffing changes occurred. For example, previously only
certain RNs were assigned the bone marrow transplant patients. This practice had created a
divide amongst the RNs and scheduling nightmares. Further, the RNs who worked with bone
marrow transplant patients felt superior and called the other pods the “ghetto” and pods one and
two the “suburbs.” The NAM increased unit moral by allowing all RNs to work with bone
marrow transplant patients.
Other practices such as termination are also examples within this category. Recently two
terminations and one suspension created a series of rumors and misunderstandings. For example
one rumor suggested an RN was fired because of a statement made about the NAM. Actually the
RN resigned after she was found sending pornographic emails on midnight shift. The NAM

87
decided to take on the rumors and asked the staff in a meeting if that behavior was appropriate.
Termination and suspension practices demonstrate that inappropriate behavior will be sanctioned.
A further display of management’s authority was a note to all RNs written by the Unit Educator
and attached to the team plan.
“Attention RN’s: It has come to our attention that there is poor compliance when it comes to the team plan. Please as CN it is your responsibility to make sure the entire team plan is filled out correctly and that the care plans have been assessed and the end of shift report is run. The failure by some is by no means a reflection of all. For those who are making the effort and doing it right or trying to do it right thank you. Those who are not making the effort, avoiding the job of CN, or failing to ask for help in performing the job of CN please be advised that team plans will be copied and placed in your file. This lack of effort will then be reflected during your yearly evaluation. This memo is not meant to be a threat but a firm reminder of your duty as CN.”
This note provides additional evidence that so called problem behaviors will have ramifications
unlike the lack of follow through on A1.
Upper level management problems are also a part of “Management Issues” and include
comp time off (CTO) and chart auditing. CTO was a benefit offered to units that achieved 100%
staffing. CTO was to be given when the census fell below established levels allowing a RN or a
NA to leave for the day and still be paid. B1 was the only unit achieving 100% staffing. The
Nursing Office withdrew the offer of CTO due to hospital shortages and insists that overages on
B1 will be pulled to units understaffed. The NAM feels caught between her staff who expects the
CTO promise and the hospital that believes the staff should help other units. The NAM is in the
process of negotiating a deal between B1 and the Nursing Office to receive partial comp time.
The second upper level management problem was patient chart auditing. The hospital
requires quarterly audits where members from pharmacy, dietary, medical, nursing, and other
departments meet as a team to assess unit charting. Each department reviews their sections in the
chart. At the scheduled audit meeting for B1, the NAM and CNS met at the designated time to
find only a human resource representative. Other department were absent. Human resources

88
asked the NAM and CNS to review all sections of the charts. The NAM refused to do other
department’s work. She felt that nursing is always asked to fill in for others. She said she was
making a point and if the Vice President of Nursing told her she had to then she would comply.
Both of the sub-categories of “Management Issues,” on the unit and with upper
management, provide examples of how the NAM manages the staff, fosters change, and
represents the interest of the unit to upper management. The NAMs role on B1 is instrumental
and helps to shape the unit’s culture. Her leadership expertise is also remarked on by unit
members later in the interview data.
The second largest observation category, “Service Quality,” contains three areas: reasons
for high quality, receiving praise, and making a difference. Reasons for high quality are
observations that explain why the unit has such high service. One RN explained that the staff
determines quality not by quantity such as getting their work done, but by whether they make a
difference for the patient. Another RN mentioned that they had high service because they work as
a team. She further explained that because the unit is fully staffed lower patient ratios are a result
making service better. Whatever the reason for high service, the staff does receive recognition.
The second area of “Service Quality” is receiving praise. There were several forms of
praise noted. First, the hospital rewards units who receive high customer service ratings. While I
was on the unit, B1 was awarded an ice cream social for their second quarter service performance.
The conference room was decorated with balloons, cake, and ice cream and all employees
including the UMD and a few staff physicians. RNs were even observed calling the unit
dieticians to make sure they would come to the social. During the event the NAM was soliciting
suggestions for future rewards if the unit won again. The reward was obviously a thank you but
also served as a future motivator. Another form of recognition was the posting of thank you cards

89
and letters in the hallway. Many of the cards referenced specific examples of how employees on
the unit made a difference during a patient’s stay.
Finally, the last area of “Service Quality” is making a difference. I noted various staff
members bringing in items for patients such as perogies for a Polish patient, a deck of cards, nail
polish, and one RN brought in rollers and a blow dryer to help out a patient who was depressed. I
even saw one RN whip out a can of lubricant from her backpack to spray the wheels of a patient’s
IV stand. The patient smiled, winked, and said “Now you won’t know when I’m coming.” She
just smiled back at him. You could tell it made his day. These kinds of activities were clearly
beyond the employee’s assigned job duties but would certainly make a difference to patients.
The “Service Quality” category suggests that B1 knows that service is part of who they
are. Staff seems to find ways to do more than just what is expected. Staff members seek to treat
the person and not just their illness. This attitude was recognized, appreciated, and a unit norm.
The third rated category is the “Team Plan”. The majority of notes refer to the group
effort used to make the team plan more effective. This was very different from the observations
on A1 where the CN was the sole decision maker. On B1 at least two or three RNs worked out
issues such as patient assignments, who would be pulled, who would get the first admit, and when
breaks were scheduled. In one observation, when two RNs and a NA were upset with their
assignments they approached the CN and changes were made to make the schedule more
equitable. Other notes in this category include whether acuity sheets (assessments of how much
care a patient required) were done and one comment made by the CNS and a clerk mentioning
that the pages of the team plan were “tacky” or not as professional as they could be.
The underlying theme for the “Team Plan” category is the sharing of decision making, a
concept that is built upon later in the fifth category of “Team Work.”
90
Position socialization is the fourth largest category and entails comments about the
procedures, difficulties, and successes of staff positions. Empathizing with each other about the
daily tasks of patient care serves to initiate new members about position expectations. One
example was an RN preceptor (a person who trains others on new procedures) lamenting to
another preceptor that teaching her trainee like “talking to a brick wall sometimes.” The RN
listening immediately offered several suggestions. Another example was a gathering of solemn
RNs who were discussing two patients who had just died. Stories were being shared about those
patients when one RN mentioned how hard it was to close the bag. She said she never looked up
whose job it was supposed to be, but she felt if it was her patient then she should be the one to do
it rather than transport. The others agreed with this perspective. This informal situation mirrored
the voluntary quarterly ceremony for those patients who have passed away. A reading of the
patient names was done by one of the management staff. As each name is said, unit members are
able to share personal stories about the patient. The NAM revealed that this ceremony helps her
staff to deal with the losses on the unit. These examples of “Patient Socialization” help to
reaffirm unit behavior expectations and provide employees with a method to understand their
patient care role.
The final category, “Team Work,” presents examples of staff helping each other with the
patient load or by joking with each other. One typical example of helping with patient load was
when two RNs were checking the team plan when they first came on for their shift. The one RN
found she had six patients and a new admit coming. The other RN immediately said she would
help her out on the assignments. Another time an RN said he would cover the other two RNs for
lunch. The two RNs joked with him saying he could get them their food. He bantered back by
saying “covering doesn’t mean getting.” The final example was told to me by several staff
members. One night when I was not observing there was a massive power outage. When I
91
arrived the next morning, I heard from the workers how the NAM and Unit Educator came into
work to help flush toilets and administer medications. These efforts by all staff clearly
demonstrate teamwork and a dedication to the unit.
B1’s main observational categories of “Management Issues,” “Service Quality,” “Team
Plan,” “Patient Socialization,” and “Team Work” provide a general sense of unit life.
“Management Issues” consist of the daily practices and the improvement changes the NAM made
to the unit. “Service Quality” indicates the strong service focus instilled in employees as
evidenced through their behaviors. Finally, the remaining three categories of “Team Plan,”
“Patient Socialization,” and “Team Work” provide evidence that working together is fundamental
to the unit’s culture.
The next section provides the summary of interview data. Questions and their categorical
responses by unit will be presented.
Interview results: A comparison of categorical responses for units A1 and B1.
After initial observations were conducted on each unit, interview data were collected as
described in the research methodology section. Of the 59 potential interviewees on A1, 40
members of staff participated garnering a 68% response rate. Of the 87 potential interviewees on
B1, 58 members of staff participated garnering a 67% response rate. For each unit, all interview
responses were typed and then placed on note cards to begin categorization by question. Constant
Comparative Analysis was used to generate categories for each of the 13 questions by unit. Five
of the 13 interview questions were selected for discussion because the responses demonstrated
differences between the units that potentially provide the clearest understanding for each unit’s
culture. The categories of responses and the number of comments received in that category are
presented for each question.

92
The first question chosen asked respondents to assess the perceived level of service
quality performed on their unit. Table 6 presents the responses. Many respondents rated the unit
and then offered reasons for their responses.
Table 6
Question # 4. What is your impression about the level of service quality performed on this unit?
A1 Raw % B1 Raw % Good 18 45% Excellent 16 28% Fair 12 30% Very Good 30 52% Poor 4 10% Good 7 12% No Rating 6 15% Fair 4 7% Poor 1 2% Total 40 100% Total 58 100%
On A1 45% of the respondents believed the unit was providing “Good” service.
Interestingly, no one rated the unit as providing “Very Good” or “Excellent” service. No one
over-inflated the rating of service performance where it would be inconsistent with the scores
obtained by the outside consulting firm hired by the hospital. (i.e. responding that service quality
is excellent when hospital data places A1’s scores two standard deviations below the hospital
mean). However, a ranking of “Good” may still be a concern. If the unit is consistently achieving
sub-par service ratings, then “Good” is not a word that should describe that performance. Others
on the unit assessed the service quality as either “fair” or “poor” which would be more
descriptive of the actual performance achieved by the unit according to patient ratings. The
remaining 15% of respondents did not answer the question directly and instead replied the unit is
doing the best it can or that the unit is dealing with a difficult patient population.
Of those that answered, many on A1 (15 of 40 respondents or 38%) would qualify their
answers by suggesting that their unit could be doing better if staffing was not an issue. Staffing
problems related to either a lack of staff or staff that do not do enough. For example, one
respondent replied. “(We) could be a lot better, but not enough people. When I assess, I’m in a

93
rush. I should be able to sit down and talk like the way we were taught in school. But, it’s not
like that.” Another person stated, “(There is) not enough staff to do quality care. Too much is
expected for one person to do.” These responses are typical and seem to indicate that staff has
tried to justify the mediocre service ratings that their unit has received.
As expected, B1 had very positive ratings overall. A rating of “Excellent” was used 28%
of the time by respondents. Those saying the unit rated “Very Good” to “Excellent” included
80% of the respondents. Of those answering 26% indicated that staff qualities such as caring,
team work, and members willing to “go the extra mile” were the reason customer service was
ranked high. One respondent commented, “I feel that everyone tends to work together. Everyone
is customer service oriented.” Another unit member reasoned, “I think it’s good because of the
staff. I’ve been pulled to other floors where the staff does not work well together. It’s not good
for the patients. I’m glad I’m on this floor rather than another. It rubs off on patients.” The
ratings and rationale on B1 are consistent with the observational categories of team work and
having a general focus on service quality. The unit has attributed working together and a
customer focus as the key variables that establish excellent service ratings for their unit.
Conversely, the fact that A1 did not use the “Excellent” or “Very Good” label may be indicative
of the cultural mindset, which in turn could impact overall performance.
The next question asked whether the units value service quality. Values are important in
order to understand the fundamental beliefs that a unit has. Table 7 presents the results.
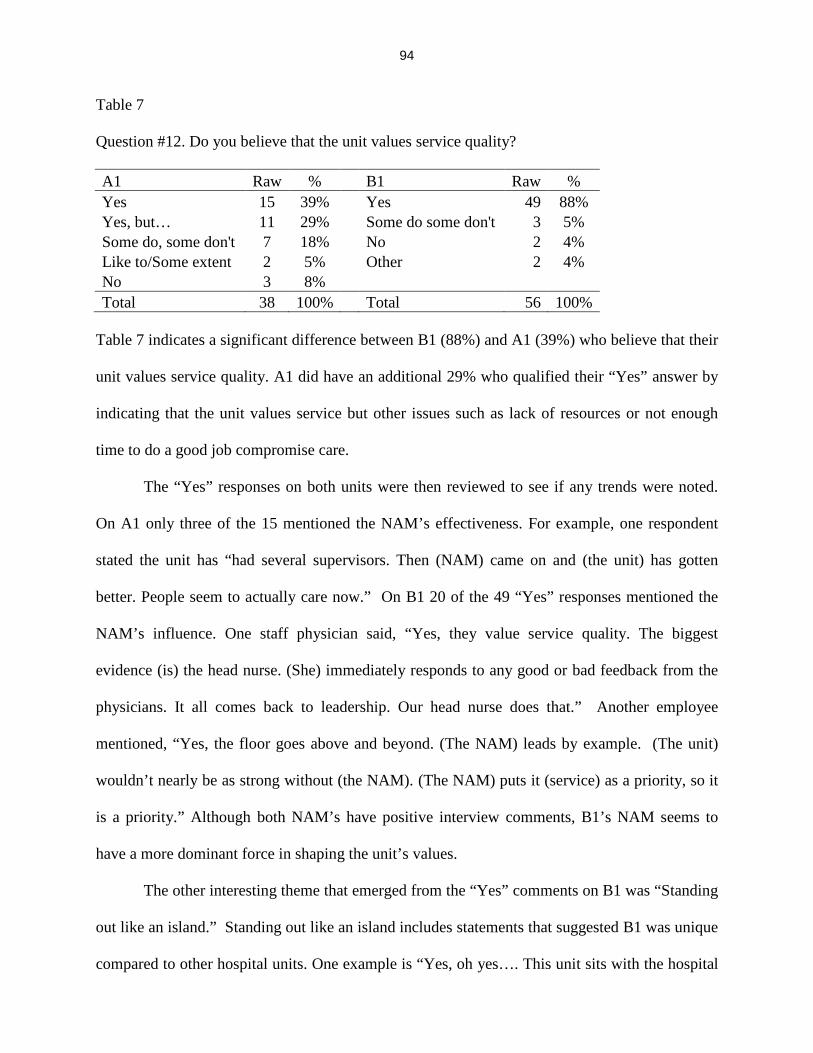
94
Table 7
Question #12. Do you believe that the unit values service quality?
A1 Raw % B1 Raw % Yes 15 39% Yes 49 88% Yes, but… 11 29% Some do some don't 3 5% Some do, some don't 7 18% No 2 4% Like to/Some extent 2 5% Other 2 4% No 3 8% Total 38 100% Total 56 100%
Table 7 indicates a significant difference between B1 (88%) and A1 (39%) who believe that their
unit values service quality. A1 did have an additional 29% who qualified their “Yes” answer by
indicating that the unit values service but other issues such as lack of resources or not enough
time to do a good job compromise care.
The “Yes” responses on both units were then reviewed to see if any trends were noted.
On A1 only three of the 15 mentioned the NAM’s effectiveness. For example, one respondent
stated the unit has “had several supervisors. Then (NAM) came on and (the unit) has gotten
better. People seem to actually care now.” On B1 20 of the 49 “Yes” responses mentioned the
NAM’s influence. One staff physician said, “Yes, they value service quality. The biggest
evidence (is) the head nurse. (She) immediately responds to any good or bad feedback from the
physicians. It all comes back to leadership. Our head nurse does that.” Another employee
mentioned, “Yes, the floor goes above and beyond. (The NAM) leads by example. (The unit)
wouldn’t nearly be as strong without (the NAM). (The NAM) puts it (service) as a priority, so it
is a priority.” Although both NAM’s have positive interview comments, B1’s NAM seems to
have a more dominant force in shaping the unit’s values.
The other interesting theme that emerged from the “Yes” comments on B1 was “Standing
out like an island.” Standing out like an island includes statements that suggested B1 was unique
compared to other hospital units. One example is “Yes, oh yes…. This unit sits with the hospital

95
like an island. We work hard to keep patients happy and to retain nurses.” Another person stated,
“We see many customer service awards. We are dedicated to our patients. It’s a big unit, but a
nice one to work on. B1 stands out amongst the whole hospital on customer service.”
The results of this question signify that both units believe that service is valued on the
units. However, B1’s response is unqualified, whereas A1 provides excuses for their inability to
achieve high service levels. When high service levels are reached, employees should be able to
articulate those behaviors that exemplify superior service.
The next question asked respondents to provide an example of something that has
happened on the unit that would be considered giving high quality service to patients. Table 8
provides summary information of the stories provided by the interviewees.
Table 8
Question #5. “Can you provide an example of something that has happened on the unit that would be considered giving high quality service to patients?” A1 Raw % B1 Raw % Specific Example 15 38% Specific Example 37 66% Personal Example 12 31% Day to Day 10 18% Day to Day 7 18% Service is Us 3 5% Other 5 13% Personal Example 3 5% Other 3 5% Total Comments 39 100% Total Comments 56 100%
Most of the categories were similar. The “Specific Example” category includes
respondents who recalled another person giving superior service. On A1 38% of the respondents
identified another person whereas 66% on B1 named a colleague. B1’s teamwork emphasis is
likely to contribute to this difference. On A1 a variety of service examples were identified. For
example, a NA’s superior teaching ability was appreciated. “When I started I didn’t know how to
draw blood. But one of the NAs helped me to learn. She wasn’t judgmental about it. It was
outside of her job.” Doctors were listed as examples of superior service. “Dr. Smith (name
96
changed) talks to you with respect; he listens if you are concerned about a patient. He allows
RNs to go on rounds.” The NAM was also mentioned. “We had a code and the NAM helped
out, she made beds, etc…and helped us when we were short on staff.” Finally one RN was
mentioned as being exemplary in service. “If you follow her, she will always introduce herself,
she stays on top of the patient and informs them of what is going on. She keeps the patient
informed on what to expect.” Members of A1 provided “Specific Examples” of service for many
job positions.
On B1 there were also a variety of “Specific Examples.” Five of the 37 respondents
repeated the story about a dying patient who wanted to see her dog. “One of the RNs went above
and beyond to get a patient a visit with her dog, really fought with the doctors to do that. But she
is not one of the RNs that I like.” Even though this respondent had obvious interpersonal
conflicts with the RN in question, the respondent was still able to identify this as an example of
superior service. Several of the respondents listed “touch” or direct communication with the
patient as the keys to high service. “The staff physician is very empathetic and takes time with
her patients. She holds their hand and lets them feel she cares. She is an exceptional
communicator.” There were also some unique examples. “There was an RN who always got
tickets for the Super bowl. The RN was talking to a bone marrow patient about football. The RN
told the patient to watch the game. During the game, the RN was seen waving to the patient.”
The other example involved the RN who brought in WD40 to put on the squeaky IV pole wheels.
The person said “It didn’t shock me at all to see her doing that. She always finds a way to help
out.” Finally, one RN was identified for improving a patient’s self esteem. “There was a younger
woman patient who was self conscious, she didn’t want to look like this..so the RN brought in a
curling iron and got her ready for her walk. The RN did her make-up and got her dressed.”

97
The “Specific Example” category is similar for both units in that a variety of job
positions are identified as having high quality service examples. The main difference rests with
how often examples of others are presented compared to personal examples. The “Personal
examples” category was utilized only if the high quality service example was performed by the
individual being interviewed. On A1, 31% of the respondents spoke about superior service that
they had given to a patient whereas only 5% of respondents on B1 talked about their own service
quality. Again, the importance of teamwork between the two units may be a factor determining
the difference in percentages for this category.
The importance of “Day to Day” care was rated similarly by both units. For example
being a friend to the patient, talking to the patient, keeping the patient informed, giving comfort,
answering call lights promptly, providing excellent care and asking if help is needed are
representative examples for this category.
The remaining category on B1 was “Service is Us.” Three of the respondents provided
statements that high service is the norm on B1. “That’s the norm round here. When a patient has
an issue it’s because they can’t accept their disease process. Nothing like this on other floors,
people stop to help others here.” Again the focus on team work helps to create higher service
ratings.
The third question chosen from the interview data asked participants to identify one
aspect of their position that they liked. Table 9 presents the interview results.
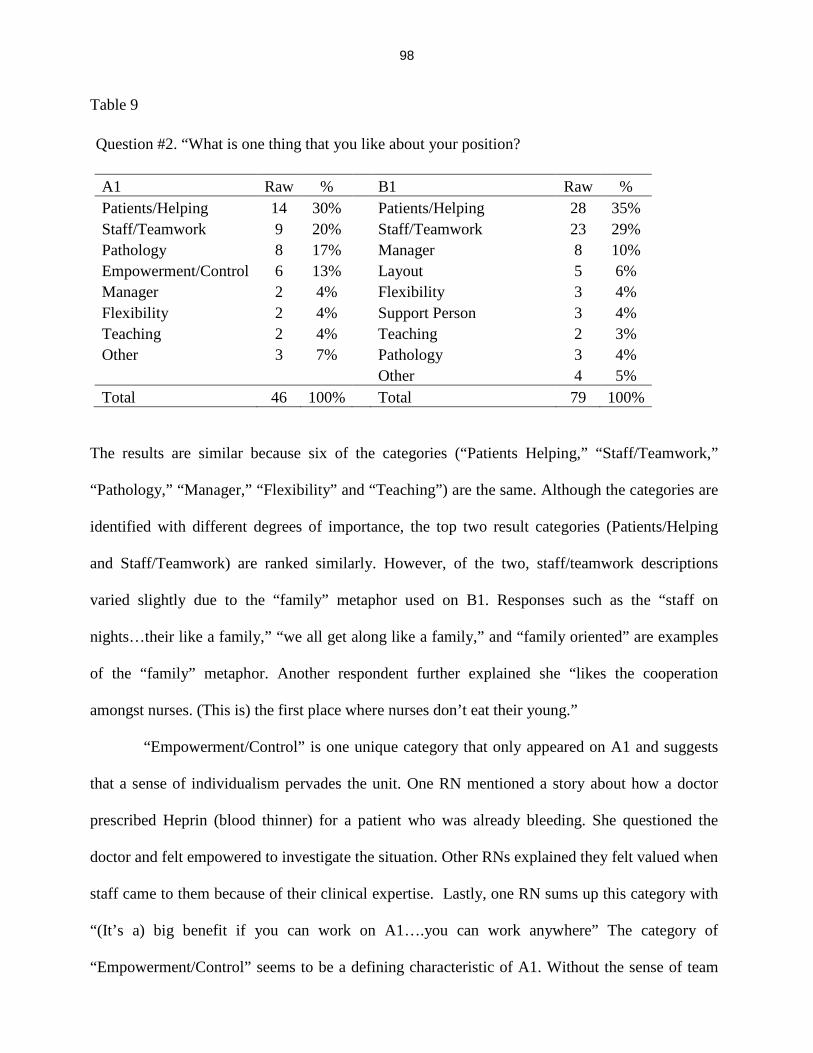
98
Table 9
Question #2. “What is one thing that you like about your position? A1 Raw % B1 Raw % Patients/Helping 14 30% Patients/Helping 28 35% Staff/Teamwork 9 20% Staff/Teamwork 23 29% Pathology 8 17% Manager 8 10% Empowerment/Control 6 13% Layout 5 6% Manager 2 4% Flexibility 3 4% Flexibility 2 4% Support Person 3 4% Teaching 2 4% Teaching 2 3% Other 3 7% Pathology 3 4% Other 4 5% Total 46 100% Total 79 100%
The results are similar because six of the categories (“Patients Helping,” “Staff/Teamwork,”
“Pathology,” “Manager,” “Flexibility” and “Teaching”) are the same. Although the categories are
identified with different degrees of importance, the top two result categories (Patients/Helping
and Staff/Teamwork) are ranked similarly. However, of the two, staff/teamwork descriptions
varied slightly due to the “family” metaphor used on B1. Responses such as the “staff on
nights…their like a family,” “we all get along like a family,” and “family oriented” are examples
of the “family” metaphor. Another respondent further explained she “likes the cooperation
amongst nurses. (This is) the first place where nurses don’t eat their young.”
“Empowerment/Control” is one unique category that only appeared on A1 and suggests
that a sense of individualism pervades the unit. One RN mentioned a story about how a doctor
prescribed Heprin (blood thinner) for a patient who was already bleeding. She questioned the
doctor and felt empowered to investigate the situation. Other RNs explained they felt valued when
staff came to them because of their clinical expertise. Lastly, one RN sums up this category with
“(It’s a) big benefit if you can work on A1….you can work anywhere” The category of
“Empowerment/Control” seems to be a defining characteristic of A1. Without the sense of team

99
work holding the unit together, staff on A1 must be self-reliant in order to have a sense of
empowerment and control.
“Being a Support Person” was unique to B1 and links well with their strong teamwork
philosophy. Three people mentioned that taking a supportive role for others was what they liked
about their position. One person said she “likes knowing I’m a support system for a lot of things.”
The UMD even said “interacting with staff…being regarded as a resource person.” I found the
difference between the “control” on A1 and the “support” on B1 to be interesting and consistent
with the individualistic culture like the “Empowerment/Control” category just mentioned and the
teamwork mentality.
The other category appearing only on B1 that may negatively impact this study is
“Layout.” The differences in layout between the two units must be considered. B1 is newer,
cleaner, and only has single room accommodations. This type of layout must impact not only staff
and the way they feel about the unit, but must also impact how patients feel about their
experience. Chapter four will address this and other limitations of the study.
The final interview question selected asked respondents to identify the main problems
facing individuals on the unit. Table 10 compares the raw scores and percentiles for each unit.

100
Table 10
Question #3. What is one thing that you don’t like about your position? A1 Raw % B1 Raw % Staffing/Workload 19 36% Staffing/Workload 14 24% Relationships 13 25% Patients 10 17% Patients 5 9% Relationships 10 17% Timeliness 5 9% Layout 5 8% Traffic 2 4% Issues with Other Departments 5 8% No Problems 1 2% Equipment 3 5% Other 8 15% Changes 2 3% Politics/Red Tape 2 3% No Problem 2 3% Other 6 10% Total 53 100% Total 59 100%
The top three issues on both sides are comparable. “Staffing/Workload” comments are
similar across positions on both units. Complaints of not enough staff or too much to do on a shift
are the common themes established.
“Patients” and patient’s families (some comments were directed toward families) are also
ranked high as an area of dislike for both units. On A1 the dissatisfaction stems from problem
patients who create a stressful environment. Staff complaints range from extreme cases such as
patients who steal food or property from other patients to patients that are non-compliant. One
person mentioned she doesn’t like patients who are non-compliant with medicine and treatments
“because it’s time consuming trying to convince them to do something. It takes twice as long.
It’s stressful.” On B1 the dislike stems from issues of “mortality” and how emotionally draining
this can be for staff. One person mentioned, “the feeling of people dying. It’s heartbreaking to
see them. You cry…it’s overwhelming.” Another states, “It’s hard when patients are dying,
there’s nothing you can do for them. I will go home and complain because I can’t do anything.”

101
For both units, “Patients” are both a source of motivation as was seen from the previous question
and a source of stress.
“Relationships” is the third category that has similar unit rankings but for different
reasons. For A1 two themes developed: attitude and teamwork. Attitude is the lack of caring
demonstrated, and teamwork is the lack of support given. One person stated, the “night shift
comes in and thinks we (day shift) don’t do anything and sit and twiddle our thumbs. You’ll see
them cop an attitude, and in the midst of all of this we are supposed to be doing our charting.”
Other comments referred to co-workers who were not helpful. Finally one doctor complained
that there is a slowness in RN response time. He has asked RNs if the patient was like this
yesterday and many time the RNs don’t know. He stated that a “nurse is more than a person
giving pills. They should be capable of observing and bringing problems to attention.” Many of
the comments with attitude and teamwork mirrors the observational category of “Group Support”
The main theme for “Relationships” on B1 was the division between the RNs and NAs.
One respondent stated the “politics between the RNs and NA. I think it has always been divided.
NAs think RNs don’t respect them, they don’t think they are important.” Again, both units
placed this as a problem, but both indicated that staff /teamwork were things they liked as well.
“Timeliness” is an issue listed that is unique to A1 as a dislike. Only doctors mentioned
this as an issue. A senior doctor stated there are “chronic complaints about RNs on floor from
patients and junior house staff. Things ordered are not carried out in a timely fashion.” This was
echoed by one of the residents who stated he had to speak with the NAM early in the month
about the slowness of orders being done. He did mention that the problem had been resolved.
The categories of “Traffic” for A1 and “Layout” for B1 indicate both of the unit’s
physical environment can also be a similar source of dislike. On A1, the smallness of the
hallways makes movement difficult. This is exasperated when transport is continually on the

102
floor to move patients throughout the day. On B1 the environment is a problem because visitors
can’t find their way around the floor, staff has a hard time seeing other staff and patient rooms,
and there is a lot of walking for staff members to locate equipment or to check the team plan.
Both unit environments contribute to staff effectiveness.
B1’s categories of “Issues with Other Departments,” “Equipment,” and “Politics/Red
Tape” indicate a dislike for outside factors beyond the unit. Other departments such as pharmacy,
admissions, and the emergency room cause problems because orders are not filled correctly and
patients show up unannounced. The NAM also complained about the levels of commitment
between departments which was also noted in the observational data. Although these problems
are beyond the control of the unit, staff must still negotiate with the other departments to fulfill
patient care needs.
Finally the last category for B1 is “Changes.” Two interviewees mentioned that B1
tends to be the pilot unit for potential hospital changes. Both staff members indicate that this is a
source of stress for the unit because they feel that they are in constant change. As a unit they just
get a new concept working when they are told to abandon that for another new and improved
idea. The constant state of flux would certainly impact consistency across the unit.
The five interview questions presented help to build a unique profile of each unit. On A1
staff members are realistic about their service levels and feel that most members value service,
but their efforts to perform high service are hampered. A1 appears to be more representative of
an individualistic culture whose members rely on their own ability to achieve quality care.
However, these efforts are negated by weak interpersonal relationships and apathy. Conversely,
B1’s staff rate the unit very highly for service provided and know that high service is a norm for
the unit. B1 staff emphasizes teamwork to the point that they think of members like a family.

103
Many of these characteristics were supported by the observational categories previously
described.
Manager comments on service.
In an effort to understand each unit better, managerial comments were sought from the
last open ended question asking for any additional information about unit service quality. The
NAM and ANAM on each unit provided a leadership perspective.
Unit A1’s management team feels there are a few reasons for low service ratings. First,
management believes the staff has problems prioritizing. The NAM has been on similar units
with worse staffing but better service. She feels that current staffing levels are not to blame for
the unit’s poor service record but instead poor prioritization is the problem. Next, the
management staff is skeptical of the unit’s poor hospital service ratings because informal patient
interviews indicate no service issues. Management believes that the low service ratings may
actually be attributed to other hospital departments such as dietary, transport, and the emergency
room. Thirdly, management commented that employee behavior, such as call light response time
and negative NA attitudes, negatively impact service ratings. Management stressed the critical
role of the NAs, however, only one or two NAs do a good job. Although the NAM would like to
remove problem employees, human resources will not back her decision. Finally, management
argues that doctors are a source of conflict due to order changes and interpersonal relationships.
Because of the hospital’s teaching focus, order changes happen routinely, thus impacting the
RNs’ ability to deliver quality care. The other issue is the poor interpersonal relationship
between senior doctors and RNs. For example, two staff physicians are disrespectful to the RNs
which affects the team atmosphere. The attitude is “you’re just a nurse.” The NAM recalled one
resident who called her a “#itch” when she reprimanded him for not following unit regulations.
The Staff Physicians did not back up the NAM, and instead “brushed off” the incident. Finally,

104
the NAM indicated her relationship with the UMD was strained. She said in her two years as
NAM she had met with him only four times. A1’s management team feels that all of these
factors contribute to the low service performance obtained on A1.
Interviews with B1’s management team revealed several reasons for high service levels.
First, the management team explained that the staff has been rebuilt since they took over the unit.
Problem employees have left and word of mouth has built the current staff into a compassionate
group. Second, the management team added new shifts, changed how patient load was
determined, and allowed shift trades in order to promote unit effectiveness. Thirdly, the
management staff indicates that the patient population promotes caring because many patients
are repeat visitors with poor outcomes. Finally, the relationship with the doctors is strong. The
ANAM mentioned that nurses, doctors and management spend time talking with each other
about the patients. The NAM also revealed that she has gone into the UMD’s staff meetings and
every other month meets with the UMD and a senior staff physician. The NAM said, “The docs
have a level of respect for me.” These four reasons, according to management, help to promote
high service ratings.
A comparison of the management’s perspective highlights the extreme difference with
the RN and doctor relationships on both units. A1’s tenuous relationship between all levels of
RNs and physicians places undue stress on all involved. Further, there is obvious tension
between the NAM and the UMD which will only serves to further destabilize any potential
teamwork between these two positions. On B1, the RN and doctor relationships are strong and
demonstrate respect for each other’s clinical expertise. The relationship between the NAM and
the UMD serves to validate the strong teamwork philosophy put forth by unit members.
The final section of chapter three results reviews the archival data analysis. The data were
collected both on the unit and throughout the hospital.

105
Archival hospital data analysis.
In addition to unit observations, interviews, and surveys, I reviewed two hospital
publications, the results of an employee opinion survey, and the patient satisfaction data that
initially determined the two hospital units for analysis.
Analysis of two publications for customer service and culture comments was conducted
during the data collection period. Campus News and Views is the internal hospital newsletter;
Monitor: Each Patient First is the health system newsletter. Both publications were available on
the unit as well as in the hospital cafeteria.
Campus News and Views is a four page bi-weekly internal publication. In the six issues
reviewed (June 2, 2003 through Aug 4, 2003) customer service was mentioned 10 times. Two
examples were letters from patient families commenting on the superior care their loved one
received. The former hospital CEO (and new CEO of the health system) stated how proud she
was of the hospital staff to improve care while balancing the demands of staffing and costs. Next,
the interim hospital CEO challenged hospital employees to provide excellent care. In a later
article, the interim CEO mentioned emergency room improvements led to an increase in service.
He then stated that everyone makes a difference in the patient’s hospital experience. Another
article announced resident awards. One of the criteria for receiving a resident award was
exceptional patient care. Another article called for nominations for a customer service award
noting that Forms were available for employees to nominate other staff who have performed
excellent service. Finally, a report from U.S. News and World Report Magazine was cited.
Several of the hospital’s specialty units (including A1 and B1) were ranked in the top 50 of
America’s “Best Hospitals.” The article indicated that B1 ranked 48 out of 50; A1 ranked 27 out
of 50. The survey assessed hospitals on reputation, mortality, nursing care, technology, and
quality of care.

106
Monitor: Each Patient First is a four page bi-weekly publication for the health system.
Eight mentions of customer service occurred in the four publications reviewed. Three instances
were letters from patients or their families commenting on the excellent service they received.
One was an article with a photo about a transport specialist who provides excellent service. Two
comments were documented in an interview with the health system CEO. She indicated “we
need to make sure we have the processes in place to take care of patients in the most efficient,
expedient way with the highest customer service” (Monitor: each Patient First, 2003, p. 2). She
continued that growth will only be achieved through service quality and patient safety. Later in
the same article, she stated she wanted to foster a culture that supports employees to provide
excellent care. Finally, the health system’s Chief Medical Officer advocated teamwork as a way
to deliver the best health care. He indicates that the staff should create a culture of teamwork.
The second type of archival data was the employee opinion survey conducted by an
outside firm during the data collection period. The survey had a 65% hospital response rate and
included 35 scaled items categorized into 10 themes. I had access only to the final results of A1
and B1. Table 11 displays the results.
Table 11
Results of the hospital employee opinion survey by unit
Category A1 B1 Job Satisfaction 69 92 Immediate Manager 80 70 Training and Development 69 77 Customer Service/Quality 61 72 Feedback/Recognition 71 70 Company Overall 40 75 Work Support 35 60 Employee Involvement 44 61 Senior Management 28 40 Pay/Benefits 41 57 Average Score for all themes 54 67

107
The individual unit scores represent the percent favorable to the category. Unit B1, as expected,
was more favorable on most of the categories. Unexpectedly, A1 had a higher rating on
Immediate Manager and Feedback/Recognition categories. The immediate manager questions
included rating four areas: the overall job done by the immediate manager, the ability of the
immediate manager to treat employees fairly, assessing if the immediate manager is good at
“people management,” and if the immediate manager is good at “managing work.” The
performance feedback and recognition assess whether job performance is evaluated fairly, if the
immediate manager gives useful feedback and rating the respondent’s satisfaction with their
recognition. Unfortunately, inferential statistics cannot be calculated to determine if there is
statistical significance between the two units on these two categories. Of the two categories,
Immediate Manager appears to have the greatest difference. However, in observations and
interviews the managers on both units appear to have staff respect.
Finally, internal documentation on customer service scores were reviewed. The
documents included the results of the outside consultant company that surveyed patients after
their hospital stay. Scores for A1 for the fiscal year 2002 revealed that overall mean scores on
patient surveys were two standard deviations below the hospital mean. Scores for A1 for the first
quarter of fiscal year 2003 indicated A1 had improved to being within one standard deviation
below the hospital mean. Scores for B1 for both fiscal year 2002 and for the first quarter of fiscal
year 2003 revealed that overall mean scores on patient surveys were greater than two standard
deviations above the hospital mean.
Archival data analysis through the hospital newsletters reveals a hospital concern for
customer service demonstrated through the number of times customer service is mentioned. The
employee opinion survey seems to verify that B1 is more favorable to the assessment categories

108
than A1. However, significance cannot be proven. Finally, hospital service ratings by unit
reveals that A1 and B1 are still significantly different from the average hospital scores.
The next chapter will discuss the three research questions in light of the survey,
observation, interview and archival data analysis. Further, the next chapter will also identify the
current study’s limitation and present other potential avenues of research inquiry.

109
Chapter 4
Discussion
The purpose of this study was to explore the link between culture and climate with
respect to customer service ratings. Two hospital units were identified for analysis. A hospital
was selected for this study because customer service ratings are continually monitored and other
variables such as employee benefits, unit size, and hospital procedures are held constant. A
mixed-method design was implemented to assess climate and culture on each unit. Climate was
assessed with a survey that combined elements of Schneider, White, and Paul’s (1998)
Assessment of Service Climate Instrument and Litwin and Stringer’s (1968) Organizational
Climate Questionnaire. An ethnographic approach featuring observation, interviews and archival
data analysis was completed to understand each unit’s culture. This chapter will first present
conclusions for each of the three research questions before implications are reviewed. The
discussion section concludes with an examination of the study’s limitations.
Research Question One
The first research question asked, “What is the climate of each hospital unit and how does
it vary between different hospital units with high and low service ratings?” Of the ten scales, six
(Structure, Reward, Support, Work Facilitation, Managerial Practices, and Customer Feedback)
indicated similarity between the unit’s climates. Similarity between the units should be expected
and would support Schneider and Reichers (1983) observation that an organization will attract a
largely homogeneous workforce due to the Selection-Attraction-Attrition approach, and in turn
will create similar perceptions about the organization’s climate. Thus A1 and B1 would largely
view the majority of the practices and procedures of the climate subscales the same.
Significant differences between the two units were obtained on four factors. Two of the
factors, Global Service and Customer Orientation, came from the Schneider, White and Paul’s

110
(1998) Assessment of Service Climate Instrument and were found significant through
MANOVA analysis. For both factors B1 mean scores were significantly higher than A1 mean
scores indicating that B1 has a more favorable climate on those two dimensions. The Global
Service Climate Subscale includes a broad array of service questions including the ability to
deliver quality service, efforts to track service, effectiveness of communication, and the
recognition of quality service delivery. The Customer Orientation Scale contains questions that
specifically address patients and service quality. Example questions ask employees to rate how
well patients are informed of changes, whether top management has plans to improve quality of
care, if written communication is professional, and whether the policies and procedures make it
easy to deliver excellent service. The Schneider, White, and Paul instrument is designed to
assess a climate of service, and unexpectedly, only two of the five factors were significantly
different between A1 and B1. Because B1 had significantly higher evaluations on patient
satisfaction scores, it was expected that more differences in the factors assessed for the two units
would be obtained.
Johnson’s (1996) study offers a potential explanation for this finding. He had discovered
that quality service training, organizational rewards recognizing customer service quality and
actively sharing the needs and expectations of customers were the three aspects of a service
climate that were most highly related to customer satisfaction. Based on observations and
interviews, only the recognition of customer service on B1 was evident. Perhaps if all three
components noted by Johnson were present, then greater differences in the climate of service
instrument would have been obtained.
Significant differences were also identified for two factors on the Litwin and Stringer
(1968) Organizational Climate Questionnaire as verified by MANOVA analysis. B1 scored
significantly lower than A1 on Warmth and Identity indicating that B1 has a more favorable

111
climate on those two dimensions. Questions on the Warmth subscale asked respondents to
assess whether a friendly or relaxed atmosphere is present, if it is difficult to meet people, and if
there is warmth in the relationship between management and workers. Identity questions asked
respondents if they were proud to belong to the organization, if they see themselves as a member
of a well functioning team, if employees were loyal and if employees looked out only for their
own self-interests. The Litwin and Stringer instrument is a measure of general climate and is not
specific to a climate of service.
In the health care literature, three studies (Jones, Guberski, Soeken, 1990; Keuter, Byrne,
Voell & Larson, 2000; Liou & Cheng, 2010) have used the Litwin and Stringer (1968)
instrument to assess climate and other organizational outcomes besides customer service. A
health care study assessing climate and customer service could not be found. Results of the three
studies demonstrate inconsistencies in which sub-scales are linked to other organizational
outcomes or to perceptions between organizational members. Jones, Guberski, and Soeken
(1990) determined there was a link between climate and self-reported leadership behaviors of
Nurse Practioners on the four subscales of Responsibility, Risk, Structure, and Rewards. Keuter,
Byrne, Voell and Larson’s (2000) study focused on the link between climate and job satisfaction.
They found that the three climate subscales of Structure, Support and Standards correlated
significantly with job satisfaction scores. Keuter, et. al.’s study compared nurses from the Bone
Marrow Transplant unit and nurses working in ICU. The researchers only compared an overall
score for both units and found that a more positive attitude toward climate was found on the
Bone Marrow Transplant Unit. Liou and Cheng’s (2010) study of Taiwanese nurses found
perception differences based on hospital and position type. Their results found that Structure,
Responsibility, Reward, Risk and Identity were perceived differently by district hospital versus

112
regional or teaching hospitals. The authors also found that NAM and staff RNs’ perception of
climate was different on the Structure, Support and Identity subscales.
In the current study, Warmth and Identity were the subscales that demonstrated a
significant difference between units with high and low customer service. Of the studies listed
above, Warmth was not a significant factor and Identity was only found to be a significant factor
in the Liou and Cheng study. In previous studies, only Keuter, Byrne, Voell and Larson’s (2000)
compared different units within a hospital similar to the current study. However, that
comparison was an aggregate score of climate and not compared on the subscale factors. This
along with the limited number of climate studies using the Litwin and Stringer instrument, make
it difficult to compare findings to the current study.
The Scheider, White, and Paul (1998) Assessment of Service Climate Instrument could
not be found in a health care study. One study that did use the instrument was Little and Dean
(2006) who chose to find the predictors of the Global Service Climate factor using the remaining
three dimensions of Customer Orientation, Customer Feedback and Managerial Practices.
Through multiple regression the researchers found that Managerial Practices was the best
predictor of Global Service Climate. The current study found Customer Orientation and Global
Service Climate to be significant climate factors between A1 and B1. Managerial Practices was
not significant and therefore the current study does not uphold Little and Dean’s findings
Additional studies comparing units or departments with good and poor service is needed
to test the climate of service instruments. B1 was the highest ranked unit at the hospital in
quality service delivery and should have demonstrated significant differences on the climate of
service factors compared to one of the poorest ranked units. Although both units are said to
value service, behavioral differences exists and do not seem to fully support the climate of
service concept.
113
This answer provided a discussion of the differences found between climates on A1 and
B1 units. Some significant findings were found for four of the ten climate factors. The next
section moves to draw conclusions and implications for culture as addressed by research
question two.
Research Question Two
The second research question asked, “What is the culture of each hospital unit and how
does it vary between different hospital units with high and low service ratings?” This question
was answered by examining the specific interviews, observations and archival data researched on
the two units and presented in chapter three. Then new conclusions will be forged by
illuminating that research with Schein’s (1985) Model of Culture as presented in chapter one.
Schein’s Model of Culture is first used to generate an overview of each unit’s culture before unit
comparison begins. Therefore, the individual unit cultures will be established first. Following
that discussion, this section will then provide detailed analysis answering question two.
Culture of A1.
Schein (1985) begins by explaining that the most observable cultural level is artifacts and
creations which include aspects of the physical and social environment. One obvious physical
aspect of A1 is the lack of décor. The unit feels like a sterile environment and does not allow A1
to “stand out” from other hospital units. When linked to Schein’s model one can conclude that an
absence of artifacts denotes an absence of culture. Visitors and patients to the floor would be
unable to gain a sense of the unit’s unique identity. When considering the social environment,
members rarely referred to each other by name, tensions existed between staffing and ethnic
groups, and stories about “death” and “unruly” patients related the challenges of working on A1.
As far as rituals or ceremonies, the only attempted ceremony, the pot luck dinner, demonstrated
ineffectual planning and a lack of support suggesting that planned ceremonies are not a norm on

114
the unit. Finally, the abuse of resources and rule breaking were quite obvious. Rules on the unit
appear to be mere suggestions due to the lack of policy enforcement. These examples present the
most observable cultural level, artifacts and creations. When observed through Schein, the
sterile environment, interpersonal challenges, absence of ceremonies, and rule breaking behavior
keep members isolated promoting a sense of individualism on the unit.
Schein’s (1985) next level, “Values,” is a deeper, less obvious aspect of culture that
represents what should be done and reflects deeply held beliefs. Values are manifested through
artifacts and creations thereby creating a link between the two levels. For A1 the values of
“individual choice,” “service” and “rules” can be directly connected to the artifact and creations
level. The value of “individual choice” appears to divide employees on two dimensions:
individual control or apathy. The value of individual control was exemplified at Schein’s level
one when RNs questioned doctors or when the vast number of respondents provided personal
examples of superior service on the unit. The claim of “[It’s a] big benefit if you can work on
A1…you can work anywhere” underscores the importance of individual control. However, the
opposite choice of apathy such as ignoring call lights or not helping when asked plagued
comments and observations. The value of “individual choice” creates a divide between unit
members and perpetuates the lack of support evidenced on the unit.
The other two values, “service” and “rules,” seem to provide evidence for Schein’s
(1985) espoused value phenomenon. Espoused values are present when what people say is
different from what they do (Argyris & Schon, 1978). Although members of A1 responded that
their unit values customer service, many respondents claimed staffing, work load, or patient
acuity prevents high quality care. The employees’ excuses affirm Schein’s (1985) position that
when there are discrepancies between values and observed behavior, cultural members will make
rationalizations for the difference. The other value of “rules” also seems contradictory because

115
A1 employees know the rules, but they disregard them. Further, the NAM on A1 provides no
consequences for rule-breaking allowing the espoused value to continue. The values of “service”
and “rules” present evidence for Schein’s espoused values and could be contributing to an
environment that displays excuses and rationalizations at the artifacts and creations level. Next,
the last level of Schein will be addressed for A1.
At the center of Schein’s (1985) Model of Culture is “Assumptions.” Assumptions are
ingrained ways of thinking about how humans relate to their surroundings. Two assumptions
apply to A1 and later to B1. The first is the “Nature of Time.” According to Schein, people
differ in their experiences, definitions and the importance placed on time. Schein states,
At the level of the organization, one can distinguish companies that are primarily oriented to (1) the past, thinking mostly about how things used to be; (2) the present, worrying only how to get the immediate task done; (3) the near future, worrying mostly about quarterly results; and (4) the distant future, investing heavily in research and development of in building market share at the expense of immediate profits. (p. 152)
A1 is oriented towards the past and present. For example, many RNs orient towards the past
when they lament on how the old model of nursing was better thus rejecting new ideas. A1 is
also oriented to the present. Staff energy is focused on meeting current patient needs and little
emphasis is placed on potential unit improvements. Time also seems to be available for those
individuals choosing apathy, whereas those who chose control, time appears limited. For
example, one respondent stated, “It’s amazing how some people can find the time to sit” and
another wanted to make sure that I noted who wasn’t working. These concerns relate to a
difference between members and their orientation towards time.
The second area, Assumptions about Human Relationships, resides at the core of every
culture and refers to how individuals relate to each other (Schein, 1985). Schein explains that
cultures can be represented by either “individualism” or “groupism” and “high power” versus
“low power” distance. For A1, employees seem to have “individualism” and “high power

116
distance.” Individualism is a dominating theme on A1 and is demonstrated through the unit’s
values and artifacts and creations. Further, A1 would be considered a “high power distance”
culture where employees perceive greater inequality between workgroups resulting in control
disputes. As noted in the first level, there are tensions between and within professional groups on
the floor. This tension is evidenced at the highest level of unit management between the NAM
and the UMD. The resulting tensions form the core of A1’s culture suggesting that conflict and
control dominate the unit. Now that a general sense of A1’s culture has been illuminated, B1’s
culture can be described.
Culture of B1.
The first level of culture, artifacts and creations, includes environmental and social
interactions. On B1 the unit has an inviting feel due to the pictures on the wall, an open lobby,
and letters of thanks on the hallway walls. Thus, Schein’s first level enables visitors and patients
to gain a sense of the unit’s culture when first entering the unit. The informal social interactions
are achieved through first name greetings, joking, and professional group interactions. For
example, members on the unit offer to help each other with shift assignments and unit
ceremonies such as the reading of the patient names and the going-away resident luncheons help
to establish a warm atmosphere. Lastly, evidence of quality service are noticed as members of
the unit bring in additional items such as food, cards, or hair products for the needs of the
patients on the floor. The environment and social interactions as observed through Schein’s
Model promotes a sense of unity and caring.
The second level of Schein’s (1985) Model of Culture identifies the three unit values of
“action,” “teamwork” and “service.” “Action” indicates that members will initiate change or
problem solving behaviors. This value is exemplified by the NAM who dismisses problem
employees, enforces policies when rules are broken, and acts as a negotiator between her floor

117
and the hospital administration. The value of “action” is linked to many of Schein’s artifacts and
creations listed previously, such as the expressions of gratitude written in the thank you cards in
the hallway.
Examples of the second value on the unit, “teamwork,” were abundant. RNs who worked
together to create an efficient team plan and staff who gave others credit for high service are just
a few examples. Further, members of the unit consistently communicated this value of support.
For example, the “family” metaphor was used to describe how supportive the staff was of each
other and during the ice cream social, members of the unit made sure that everyone, including
the dieticians, could take part in the reward. All these examples represent a strong dedication to
the value of teamwork.
The final value identified on this unit was “service.” Unit members make patients their
priority. In fact, as one employee put it, the unit determines quality not by quantity but by
making a difference for the patient. Employees claimed that B1 stands out from the hospital in
providing high customer service and that service is what they do. These statements demonstrate
how deeply valued quality service is on the unit. Interestingly, several of the observations and
interviews suggest that high service on B1 is achieved, in part, through rule breaking. On A1,
rule breaking made work life easier on the employees. For example, bandages on the doors
created easier medicine access and not carrying phones allowed nurses to work free of
distraction. In contrast, on B1, rule breaking provided a method for employees to provide
emotional or physical support to their patients. One example of this behavior is when nurses
brought in a specialty food items to lift the spirits of their patients. So, the intent of rule breaking
was not self-serving, rather rule breaking was motivated by patient care. Thus, when 88% of the
unit indicates they value service, this result is indicative of a strongly held and widely distributed
value.

118
These three values of “action,” “teamwork,” and “service” are directly linked to B1’s
artifact and creations level. In addition, all members appear to support these values. No
espoused values were present for B1. The last cultural level to be assessed for B1 is
Assumptions.
The “Nature of Time” and the “Assumptions about Human Relationships” are examples
of the two assumptions held on B1. The “Nature of Time” defines how time is defined and
measures its importance to members of the unit. B1 employees focus on the near and distant
future. The near future is more predominant and includes the daily actions of problem solving
for patients and the NAMs administrative changes. Employees are also focused on the distant
future. Due to B1’s service record many new hospital procedures are tried on the unit. Although
this was a source of stress for a small number of employees, due to the future time orientation of
the unit combined with the value of action, unit members’ work toward discovering which new
hospital procedures will have the most significant impact on efficiency and service.
Finally, the “Assumptions about Human Relationships” labeled B1 as having “groupism”
with a “low power distance.” “Groupism” is at the core of B1’s culture. B1 employees act in a
manner consistent with a team orientation. From group decisions made on the care plan to the
UMD feeling proud to be a support person, cooperative behavior has become a core foundation
for the unit. “Groupism” flourishes within the low power distance exhibited on the unit and is
demonstrated through respect and professionalism. Perhaps the most significant example is the
relationship between the NAM and the UMD. The synergy that has been created between RNs
and doctors can only enhance patient care and creates a rewarding experience for all members of
the unit.

119
Schein’s (1985) Model of Culture provides a lens through which a culture can be
described. A1 and B1 have unique cultures that are created and maintained through employee
interaction. In the following section the culture of the units are compared.
Comparison of unit cultures.
Schein (1985) explains that shared assumptions of a group will drive the behaviors of that
group. In this sense then, a comparison of A1 and B1 must begin at the third level. The
assumptions of the “Nature of Time” and the “Assumptions about Human Relationships” appear
to be polar opposites when comparing the two units. A1 is time oriented to the past and present
and includes “individualism” with “high power distance.” B1 is time oriented to the near and
distant future and features “groupism” with “low power distance.” These assumptions then
permeate the other two levels, thus impacting the values and artifacts and creations found on the
units.
The values of the two units continue the diversification that is easily observed through the
artifacts and creation level. A1’s assumptions of individualism and power struggles create the
foundation for individual choice as a value. Employees will either try to gain control or will give
up in the power struggles that permeate the culture. Similarly, the contradictions in the rules and
service values for A1 also stem from the assumptions. Hospital rules are not followed even
though they are known and may be linked to the sense that time is limited and self reliance must
be used to fully accomplish tasks and provide quality service. Self reliance may then cause
contradictions in rule application. Finally, service values must be a struggle when high power
distance and individualism are assumed. The struggle to give high service would have to be
compromised when faced with tensions between the very groups that must be relied on for
patient care. Alternatively, the values on B1 of “action,” “teamwork” and “service” directly
follow from the assumptions of near and distant future, “groupism,” and “low power distance.”

120
B1’s employees think in terms of how to solve problems together and use this energy towards its
main purpose, the patients. The power barriers that are profound on A1 are removed from B1
making teamwork possible and expected. The differences noted in teamwork between the two
units will be further discussed in the implications section. The comparison of the units in terms
of culture also brings application for current theory which is discussed next.
Discussion of results.
Although the presentation of culture between A1, the unit with poor customer service,
and B1, the unit with good customer service, is speculative, the strong differences inherent
within the units’ core assumptions of culture suggest that service quality may be fostered in
cultures that have an orientation of near and distant future, “groupism,” and “low power
distance” assumptions. Other applications to current research can now be reviewed and include
sub-culture differences, metaphors, and exceeding service quality expectations.
First, this study demonstrates how unique subcultures can exist within one organization.
Louis (1985) indicated that subcultures can exist at division or hierarchical levels. In this case,
cultural assumptions that lead to strong values have created an inherent divide between units A1
and B1 bringing about surface level observable behavior differences. The relationships between
fundamental core assumptions about human nature potentially shape employees’ behavior on
organizational outcomes such as customer service.
Simpson and Cacioppe (2001) explained that subcultures modify the dominant culture by
the values that are held within the individual departments. In Rosenfeld, Richman, and May’s
(2004) study a cultural divide occurred because there was inadequate communication between
the main and field offices. However, that is not the case in this study because the units are
housed directly within the larger organization. In the current study, both units agreed in
interviews that service is a value both at the unit and the hospital level. Further archival data

121
analysis revealed that customer service is important and is highlighted in the two hospital
publications. Thus, differences in service level behavior could be attributed to the core
assumptions and to the interaction of other dominant values held by group members. These
interactions between values will be discussed further in the implications section.
The next application to current research concerns metaphor. On B1, the metaphor of
“family” was revealed through answers to interview questions. The examples of “we all get
along like a family,” “family oriented,” and the one comment “[This is] the first place where
nurses don’t eat their young” contribute to the use of metaphorical language in explaining and
shaping organizational reality. This study is important because by viewing co-workers as
“family” the teamwork value becomes more important. Letting down “people” that you work
with might be easier than not supporting a “family” member. Thus, the contributions of a
“family” metaphor on B1 may contribute to enhanced team member support leading to increases
in customer service levels.
Smith and Eisenberg’s (1987) research noted how powerful the “family” metaphor could
be in their study of Disneyland’s employees and management teams. The driving metaphor of
“family” became prominent after Walt Disney passed away. Employees began to expect
“family” treatments from management even during times of economic uncertainty. When
management took steps to be fiscally solvent and did not maintain the “family” metaphor,
employees staged a strike. In the current study, B1 may have a similar issue with management
regarding comp-time-off. Nursing management had promised to give comp-time-off to units
who achieved 100% staffing. The value of action prompted B1 to meet the goal, and B1
members expected nursing management to keep its promise. When this did not happen, B1
employees were disappointed and felt “let down” leaving the NAM to negotiate with
administration. The “family” metaphor on B1 provides a sense of “us,” increases teamwork and

122
may certainly impact the level of customer service on the unit. The use of metaphors on B1 is
important for their culture and will be further highlighted in the implications section.
The last application to current research is exceeding customer service expectations and
reveals the relationship between values and high service behaviors for B1’s unit. B1’s service
record as revealed by hospital satisfaction reports identified B1 as the top ranked unit at the
hospital. Through observations, B1 member behavior satisfied Price and Chen’s (1995)
definition of “delightful” service quality whereby customers receive attributes that they did not
know existed and thus customer expectations are exceeded. B1’s value of “service” quality and
“action” interact to enable staff to be sensitive to patient needs beyond basic medical care. B1’s
staff revealed that service is established through quality and not quantity. Patients would
certainly not expect RNs and NAs to perform beautification treatments, bring in games, or make
ethnic food. These above and beyond service actions are not anomalies on the unit but are
instead typical service behaviors. The values that B1 has encourage members to make all aspects
of patient needs their priority.
The three applications of sub-cultures, metaphors, and exceeding service expectations
explain how this study relates to current research. Research question two has revealed both
units’ cultures and the differences between them. Key differences rest deep within the culture
and those differences are obvious to observers of the floor. The final research question provides
a discussion of how these two units are so different leading to evidence of service quality
discrepancies.
Research Question Three
The final research question asked, “What is the relationship between culture and climate
within each hospital unit and between the different hospital units?” Chapter two presented the
definitions of the variables for the purpose of this study. Climate was defined by Poole (1987) as

123
“a relatively enduring quality of the environment that is experienced and perceived by
individuals; influences individual interpretations and actions; and can be described in terms of a
particular set of characteristics which describe a system’s practices, procedures, and tendencies”
(p. 2). Culture was defined by Schein (1985) as
A pattern of basic assumptions—invented, discovered, or developed by a given group as it learns to cope with its problems of external adaptation and internal integration—that has worked well enough to be considered valid and, therefore, to be taught to new members as the correct way to perceive, think, and feel in relation to those problems (p. 9)
The purpose for this investigation was to interpret climate as the individual feelings for the
policies and communicative practices in the organization, whereas culture will be evidenced by
the overriding deeply held assumptions of the organization. The discussion of research question
one and two were presented previously in this chapter, next a discussion of research question
three is explored.
The first part of research question three asks, “What is the relationship between the
culture and climate on each unit?” In order to answer this question, a reminder of the duality of
climate and culture needs to be revisited. Reichers and Schneider (1990) explained that “culture
exists at a higher level of abstraction than climate, and climate is a manifestation of culture” (p.
29). Reichers and Schneider further contend that there is a reciprocal nature between the two
concepts that leads to an endless cycle. Manifestations of culture (i.e. climate) both represent
culture and will also influence how culture will change and be interpreted.
In the present study, the climate dimensions were similar on six of the ten factors. Only
Warmth, Identity, Global Service, and Customer Orientation were different between the two
units with A1 having a less favorable evaluation of those climate concepts. Starting with this
premise of a less favorable climate, the culture of A1 can be seen as supporting the negative
climate evaluation. A1’s culture that features the assumptions of “individualism” and “high
124
power distance” coupled with the values of “individual choice” (where some workers chose
control and others apathy), “service” (where workers say they value the concept but many do not
perform high service behaviors), and “rules” (an espoused value), presents problems for the staff
as they negotiate their unit roles. As Ashforth (1985) claimed “the character of an organization’s
internal work environment has long been recognized as a potent influence on employee’s
cognitions, affect and behaviors” (p. 837). A1 struggles because there is a divide. Some
members want to deliver high quality service, choose to have control and are bewildered by
those members who have chosen apathy and who do not strive to provide excellent service.
On A1 the individuals recognize they operate in a toxic and ineffective culture.
Consequently, they act entirely as individuals, ignoring the rules, disrespecting each other’s
boundaries, and expect there will be no effective enforcement leading to negative personal
ramifications. Since they operate in a consequence free environment, their individualistic
climate fosters their continued toxic culture. Further, the members being individualistically
oriented fail to perceive the link between their own poor performance and the overall toxicity of
their culture. In essence their climate drives their culture.
In stark contrast, the leadership of B1 actively takes responsibility for the unit’s culture,
enforces reasonable rules, leads by example, and inculcates positive team oriented rituals
promoting a positive and healthy culture. Because both leadership and members recognize a link
between poor personal performance and overall team performance, B1 has a culture that drives
climate. The assumptions of “groupism” and “low power distance” combined with the values of
“action,” “teamwork,” and “service” potentially contribute to more favorable ratings of climate.
In short, B1 members recognize their interdependence and act to help each other meet the needs
of their patients.

125
The second part of research question three asks, “What is the climate and culture between
the units?” This difference between the two units is demonstrated through the causal link
between climate and culture. For both units, there is a distinct identifiable link between climate
and culture. For both units, there is a cycle where one supports the other. The definitive
characteristic between the units appears to be the forcing agent. For A1, climate is the forcing
agent perpetuating a toxic culture. For B1, culture is the forcing agent perpetuating a healthy
climate.
Referring again to Moran and Volkwein (1992) climate is easily changed because it is
based on individual perceptions whereas culture is more enduring and based on deeply held
assumptions. The NAM on B1 was able to make immediate changes in climate by making
immediate changes in policies, procedures, and personnel. These changes over time became
inculcated into the dominant culture on B1. The results were highly positive for both the
members and the patients to whom they served. On A1, the absence of a driving culture
permitted the climates of the individuals to dominate the culture of the group. The individual
irresponsibility observed on A1 fosters an apathetic and lethargic culture overall that will take
time to change and in the meantime will be detrimental to the patients’ quality of care.
This research question prompts the need for additional inquiries to study the direction of
the driving force between climate and culture. Reichers and Schneider (1990) advocated the
reciprocal nature between the two concepts and further investigation into this idea would
potentially benefit organizations seeking to change toxic cultures or inculcate healthy ones.
This study has answered the three proposed questions regarding climate, culture and
service through its study of the A1 and B1 units. Important contrasts between climate and
culture were discovered as a result of this investigation. Substantial conclusions were presented
in light of the data and analysis this work revealed. Now that all three of the research questions

126
have been addressed, a discussion of research implications is warranted before the review of the
studies limitations is presented.
Implications
This study sought to understand the relationship between climate and culture and their
link to service quality. In the process of answering the research questions, additional
implications of this research were discovered. Implications for practice and implications for
theory are identified.
Implications for practice.
The implication for practice is teamwork. The difference between A1 and B1 was
substantial at all levels of Schein’s (1985) Model of Culture. B1’s emphasis on “groupism”
promoted teamwork as a value leading to observable behavior both within and between
professional groups on the unit. A1’s lack of support including the conflict between the NAM
and UMD contributed to poor teamwork and increased individualism on the unit. Teamwork in
health care settings is essential. Multiple health care workers must coordinate efforts in order to
provide exceptional care to patients.
Studies in health care have revealed significant advantages to both patients and team
members when supportive behaviors are enacted. For example, Schmalenberg, Kramer, King,
Krugman, Lund, Paduska and Rapp’s (2005) study revealed that high functioning nurse-doctor
teams result in increased job satisfaction for both professional groups. Further, Knaus, Draper,
Wagner and Zimmerman (1986) found that collaborative nurse-doctor partnerships in intensive
care units have lower patient mortality rates as compared to non-collaborative nurse-doctor
partnerships. Wheelen, Burchill, and Tilin (2003) verified that effective health care teams also
resulted in decreased morality rates. Wheelen, Burchill, and Tilin further found that high
127
functioning team members perceived other team members as more trusting and less dependent as
compared to member perceptions in lower performing teams.
B1’s emphasis on teamwork appears to contribute to higher service evaluation ratings,
has direct links between the levels of Schein’s (1985) Model of Culture and is also evidenced
through the Warmth and Identity climate factors that were significantly different between B1 and
A1. The current research supports Meterko, Mohr, and Young (2004) who used the competing
values framework to determine if patient satisfaction levels were different based on cultural unit
type. Meterko, Mohr and Young found that cultures emphasizing teamwork had significant
positive correlation with patient satisfaction. Teamwork as evidenced through the current study
and through other health care studies is important for both patients and providers. Hospital
administrators should consider how to incorporate teamwork values into health care units with
low service ratings.
Implications for theory .
The current study reveals two implications for theory: values and metaphors. The first
theory implication suggests understanding the interaction of values in Schein’s (1985) Model of
Culture. The values of “action,” “teamwork,” and “service” are apparent on the unit
demonstrating high customer service levels. The values appear to work in unison allowing a
high functioning team to result. This synergy in values is not achieved on the unit demonstrating
poor customer service levels. In this case, the value of service was contradictory. Members of
A1 claimed to value service, but somehow this became an espoused value. Future research is
needed to understand how the other values can lessen the impact of service as it did in the current
study. Future research questions could answer what leads to one value being dominant over
another? The answer would help researchers to understand if values have “strength” and if value
“strength” can impact an overall culture.

128
The final implication for this study and specifically for theory is the use of metaphor.
Metaphors were utilized in two situations on B1. First, before the NAM arrived on the unit,
several RNS used the metaphor of the “ghetto” and the “suburbs” to describe working on the
regular pods versus the pod that also treated bone marrow transplant victims. When the B1
NAM took over the unit, she realized the metaphor contributed to low morale and therefore she
intentionally destroyed the metaphor through job realignment. The second metaphor of “family”
was used positively on the unit to achieve what Eisenberg (1984) refers to as group cohesion.
The elimination of the negative metaphor and the promotion of the positive metaphor offer
interesting elements for this study.
By isolating the dominant metaphors of an organization, researchers are able to
understand the current reality for members (Koch & Deetz, 1981). Froggatt’s (1998) study of
emotions and nursing metaphors explains that “since metaphors are grounded in reality, they
give implicit insight into nurses’ understanding of their practical experiences.” (p. 337). The
divide that once happened on B1 with the “ghetto” and the “suburbs” metaphor has changed to a
healthier metaphor of “family.” This change of metaphors on the unit suggests that future
investigations should consider the persuasive effect that metaphors have on changing unit
culture.
An additional area of metaphor inquiry came from the comparison of this study to
Gokenbach’s (2006) research on the use of metaphor as a transformational tool in changing the
behavior of emergency room employees. In Gokenbach’s study, nursing managers and charge
nurses were put through an intensive training curriculum centered on the metaphor “Team of
Eagles.” This metaphor was selected for the “image of strength, empowerment, leadership and
the ability to rise above and embrace challenge” (p. 54). The “Team of Eagles” program is
credited with significantly reduced turnover and increased patient and staff satisfaction scores.
129
Gokenbach concedes that one initiative cannot correct all problems in a health care setting;
however, the metaphor became a powerful tool to align team membership, create shared
meaning, and achieve change.
Gokenbach’s (2006) study supports Sopory and Dillard’s (2006) findings that metaphors
possess a suasory advantage over literal language. Sopory and Dillard found “that the persuasive
impact of metaphor is maximized when the audience is familiar with the metaphor target, the
metaphor is novel, is used at the start of a message, is single, and nonextended.” (p. 413). The
persuasive aspect of the family metaphor on B1 supports Sopory and Dillards finding that the
metaphor is persuasive at the start of a message. On B1 the metaphor is immediately persuasive
when new employees become cultural members. “Team of Eagles” metaphors along with the
two metaphors in the current study met this set of criteria and were thus persuasive for the
employees on the units.
Gokenbach’s (2006) study offers a different approach because it is top-down where a
metaphor was agreed on and implemented into a hospital department. In the current study, the
metaphor of “family” was originated within B1 and was already operating naturally within the
culture to create a stronger sense of teamwork. The naturally occurring metaphor of “family” in
the current study and the leadership “imposed” metaphor of “Team of Eagles” both have been
successful and appear to be linked to customer service ratings. Future studies for customer
service and culture should consider how metaphors are created for groups with high service and
whether “naturally” occurring metaphors or “imposed” metaphors would be more successful
with long term customer service gains.
The implications for practice and theory suggested by teamwork, value interaction, and
metaphors offer suggestions for practice and future research endeavors. The current

130
investigation’s conclusions and implications should also be considered in light of the limitations
of the study.
Limitations
As with all efforts to observe and acquire understanding through investigations, certain
limitations exist. The following limitations of the study include the unit environment, size of
population, reporting hierarchy, factor analysis assessment, ethnographic design and
generalizability pertain to this study in important, if not adjustable ways. The first such
limitation is the unit environment. Due to changes in management staffing a less than desirable
comparison between A1 and B1 was required for the study to continue. The original comparison
between A1 and C1 would have garnered similar unit environments. B1’s inclusion into the
study created some concerns in comparison application, but at least allowed the study to
continue.
There were several limitations of the unit environment between A1 and B1. A1 has an
older facility where most of the patient rooms are configured for two people. Conversely, B1 has
a newer facility where most of the rooms are private. This difference may affect patient
satisfaction ratings and staff attitudes toward work. Another important difference in these two
facilities that affects the unit environment is the design of floors. On A1 the floor is configured
on a single hallway making it easier for care providers to see all call lights and all personnel. On
B1 the unit floor has a layout that places individual work pods into an H pattern creating
difficulty for staff to function in the maze like environment. The floor plan is also different
between these two units. Unit A1 has a 34-bed facility, and their practice encompasses
Nephrology. This discipline and care model usually harbors patients for an average length of
stay between two to four days. B1 is a 40-bed facility that practices Oncology. Their average
length of stay is measurably longer and is currently at five to six days on average. The
131
differences between the units in newness of the facility, type of patient rooms, layout of the
floor, and care specialty may impact climate, culture, and service ratings.
The next factor that limits the scope of this inquiry is the size of the studied populations.
Both subject groups provided a population with wide ranges of job specialties and years of
service. The limited number of the personnel studied did not allow for cross comparison against
specialty or tenure of service. The population also had a fairly high rotation of residents due to it
being a teaching hospital where frequent rotation is common. Both a greater sized population
and a population that had greater longevity would assist in conducting research with substantial
heuristic value.
Another study limitation is the notable difference in the reporting structure and chain of
command between the two units that could impact decision making on the units. On A1 the
NAM reported to a mid-level administrator of the hospital. Conversely, the NAM on B1 reports
directly to the Vice President of Nursing. This more direct access to this key position may result
in greater assignment flexibilities for nursing staff in the B1 unit and could result in greater
power for the NAM on B1. Leadership differences between the two units could be affected by
differences in the reporting structure of the two units. This could impact the interpretation of the
findings.
Next, the factor analysis assessment of the service climate instruments did not produce
the number of factors found historically for the instruments. In the current study, the analysis
continued to use the five historical factors found for each instrument. The differences found in
the number of factors may be due to the unique population of a health care work force. Further,
the instruments have been used in previous research but not in health care settings. Because the
health care setting is such a unique environment, this could explain why only four factors were
found to be significant. Future research within health care settings would benefit by additional

132
use of these survey instruments to help identify alternative factors that could have a significant
impact on the overall service climate. The results of research question one on climate need to be
considered in light of this information.
Another methodological limitation was in the ethnographic study design. The hospital
review board required clearly delineated interview questions to be submitted in the protocol.
This structured design prevented additional or impromptu inquiries of respondents, which could
possibly have illuminated other pertinent values or assumptions for each unit. By having the
flexibility to improvise interview questions based on the observational data could have enriched
the findings and provided a clearer understanding of each unit’s culture. Thus, the results of
research question two about the culture of each unit may not be fully illustrative of the inherent
values and assumptions for each of the units.
Finally, the conclusions obtained in this study are difficult to generalize to the greater
health care provider population. The nature of the study places two specific units under
investigation with severely limited populations, particular specialty areas, and unique
environments. The conclusions are also based on the extreme ends of high and low customer
service unit ratings. Most health care units will generally fall between the two extremes, and
therefore will contain elements of both high and low service behaviors. Although the conclusions
are limited in scope, the purpose of the current study was to understand whether climate and
culture are different on units with high and low service ratings. The results clearly suggest
significant differences between climate and culture on health care units with high and low
service ratings, thus adding to our understanding of the quality of service provided in a health
care setting.

133
Conclusion
Customer service is a critical variable in the success of organizations and in their ability
to serve customers. Nowhere is this more important than in hospitals where nothing less than the
well being of the sick is at stake. The current investigation explored the factors of customer
service in health care settings and found significant differences between the climate and culture
of units with high and low service ratings. High customer service environments rated the factors
of warmth, identity, customer orientation and global service climate more favorably. In addition,
ethnographic elements within high service environments include the Nature of Time,
Assumptions of Human Relationship, and values as discussed by Schein (1985). All these
factors help to create and perpetuate a climate and culture of high service. While further inquiry
is needed, the current adds important insight into this complex set of relationship
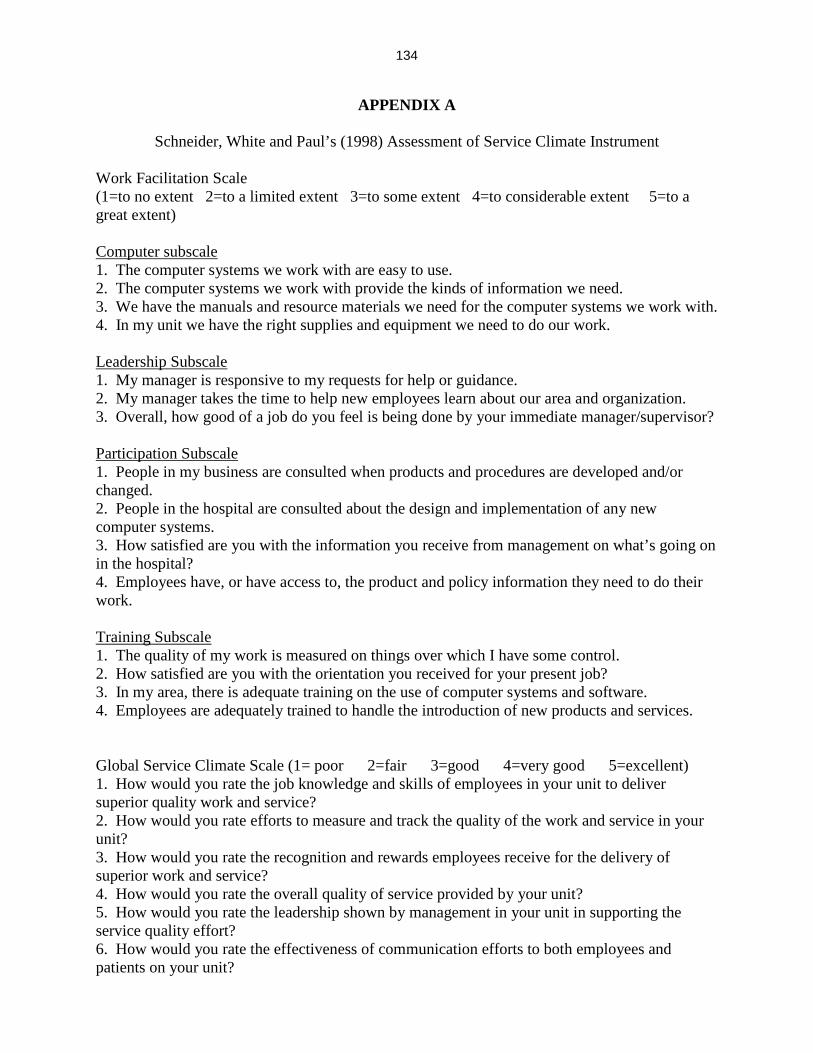
134
APPENDIX A
Schneider, White and Paul’s (1998) Assessment of Service Climate Instrument Work Facilitation Scale (1=to no extent 2=to a limited extent 3=to some extent 4=to considerable extent 5=to a great extent) Computer subscale 1. The computer systems we work with are easy to use. 2. The computer systems we work with provide the kinds of information we need. 3. We have the manuals and resource materials we need for the computer systems we work with. 4. In my unit we have the right supplies and equipment we need to do our work. Leadership Subscale 1. My manager is responsive to my requests for help or guidance. 2. My manager takes the time to help new employees learn about our area and organization. 3. Overall, how good of a job do you feel is being done by your immediate manager/supervisor? Participation Subscale 1. People in my business are consulted when products and procedures are developed and/or changed. 2. People in the hospital are consulted about the design and implementation of any new computer systems. 3. How satisfied are you with the information you receive from management on what’s going on in the hospital? 4. Employees have, or have access to, the product and policy information they need to do their work. Training Subscale 1. The quality of my work is measured on things over which I have some control. 2. How satisfied are you with the orientation you received for your present job? 3. In my area, there is adequate training on the use of computer systems and software. 4. Employees are adequately trained to handle the introduction of new products and services. Global Service Climate Scale (1= poor 2=fair 3=good 4=very good 5=excellent) 1. How would you rate the job knowledge and skills of employees in your unit to deliver superior quality work and service? 2. How would you rate efforts to measure and track the quality of the work and service in your unit? 3. How would you rate the recognition and rewards employees receive for the delivery of superior work and service? 4. How would you rate the overall quality of service provided by your unit? 5. How would you rate the leadership shown by management in your unit in supporting the service quality effort? 6. How would you rate the effectiveness of communication efforts to both employees and patients on your unit?

135
7. How would you rate the tools, technology, and other resources provided to employees on your unit to support the delivery of superior quality work and service? Customer Orientation Scale 1=to no extent 2=to a limited extent 3=to some extent 4=to considerable extent 5=to a great extent 1. My unit does a good job keeping patients informed of changes which affect them 2. My unit does a good job keeping patients informed of changes which affect them 3. Top management commits resources to maintaining and improving the quality of our work and service. 4. Top management has a plan to improve the quality of our work and service. 5. The policies and procedures make it easy to deliver excellent service to the customer. 6. Quality and patient needs are considered when products and policies are developed and/or changed. 7. In my business, written communications to external customers have a professional appearance and tone. 8. My business does a good job educating its customers about our products and services. Managerial Practices 1=to no extent 2=to a limited extent 3=to some extent 4=to considerable extent 5=to a great extent 1. My manager is very committed to improving the quality of our area’s work and service. 2. My manager recognizes and appreciates high quality work and service. 3. My manager removes obstacles which prevent us from producing high quality work and service. 4. We have established clear standards for the quality of work and service in my unit. Customer Feedback 1=to no extent 2=to a limited extent 3=to some extent 4=to considerable extent 5=to a great extent 1. The hospital asks our patients to evaluate the quality of our work and service. 2. We are informed about patient evaluations of the quality of service delivered by my unit 3. The hospital collects information on patient suggestions and complaints.
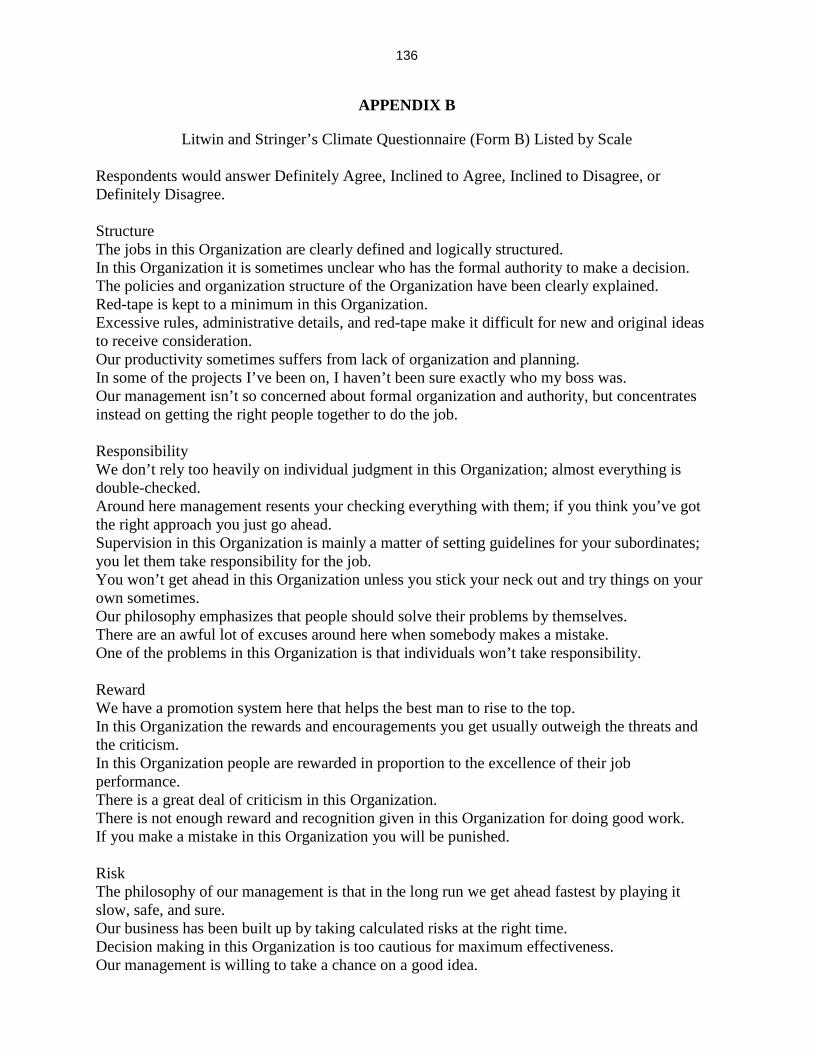
136
APPENDIX B
Litwin and Stringer’s Climate Questionnaire (Form B) Listed by Scale Respondents would answer Definitely Agree, Inclined to Agree, Inclined to Disagree, or Definitely Disagree. Structure The jobs in this Organization are clearly defined and logically structured. In this Organization it is sometimes unclear who has the formal authority to make a decision. The policies and organization structure of the Organization have been clearly explained. Red-tape is kept to a minimum in this Organization. Excessive rules, administrative details, and red-tape make it difficult for new and original ideas to receive consideration. Our productivity sometimes suffers from lack of organization and planning. In some of the projects I’ve been on, I haven’t been sure exactly who my boss was. Our management isn’t so concerned about formal organization and authority, but concentrates instead on getting the right people together to do the job. Responsibility We don’t rely too heavily on individual judgment in this Organization; almost everything is double-checked. Around here management resents your checking everything with them; if you think you’ve got the right approach you just go ahead. Supervision in this Organization is mainly a matter of setting guidelines for your subordinates; you let them take responsibility for the job. You won’t get ahead in this Organization unless you stick your neck out and try things on your own sometimes. Our philosophy emphasizes that people should solve their problems by themselves. There are an awful lot of excuses around here when somebody makes a mistake. One of the problems in this Organization is that individuals won’t take responsibility. Reward We have a promotion system here that helps the best man to rise to the top. In this Organization the rewards and encouragements you get usually outweigh the threats and the criticism. In this Organization people are rewarded in proportion to the excellence of their job performance. There is a great deal of criticism in this Organization. There is not enough reward and recognition given in this Organization for doing good work. If you make a mistake in this Organization you will be punished. Risk The philosophy of our management is that in the long run we get ahead fastest by playing it slow, safe, and sure. Our business has been built up by taking calculated risks at the right time. Decision making in this Organization is too cautious for maximum effectiveness. Our management is willing to take a chance on a good idea.

137
We have to take some pretty big risks occasionally to keep ahead of the competition in the business we’re in. Warmth A friendly atmosphere prevails among the people in this Organization. This Organization is characterized by a relaxed, easy-going working climate. It’s very hard to get to know people in this Organization. People in this Organization tend to be cool and aloof toward each other. This is a lot of warmth in the relationships between management and workers in this Organization. Support You don’t get much sympathy from higher-ups in this Organization if you make a mistake. Management makes an effort to talk with you about your career aspirations within the Organization. People in this Organization don’t really trust each other enough. The philosophy of our management emphasizes the human factor, how people feel, etc. When I am on a difficult assignment I can usually count on getting assistance from my boss and co-workers. Standards In this Organization we set very high standards for performance. Our management believes that no job is so well done that it couldn’t be done better. Around here there is a feeling of pressure to continually improve our personal and group performance. Management believes that if people are happy, productivity will take care of itself. To get ahead in this Organization it’s more important to get along than it is to be a high producer. In this Organization people don’t seem to take much pride in their performance. Conflict The best way to make a good impression around here is to steer clear of open arguments and disagreements. The attitude of our management is that conflict between competing units and individuals can be very healthy. We are encouraged to speak our minds, even if it means disagreeing with our superiors. In management meetings the goal is to arrive at a decision as smoothly and quickly as possible. Identity People are proud of belonging to this Organization. I feel that I am a member of a well functioning team. As far as I can see, there isn’t very much personal loyalty to the company. In this Organization people pretty much look out for their own interests.
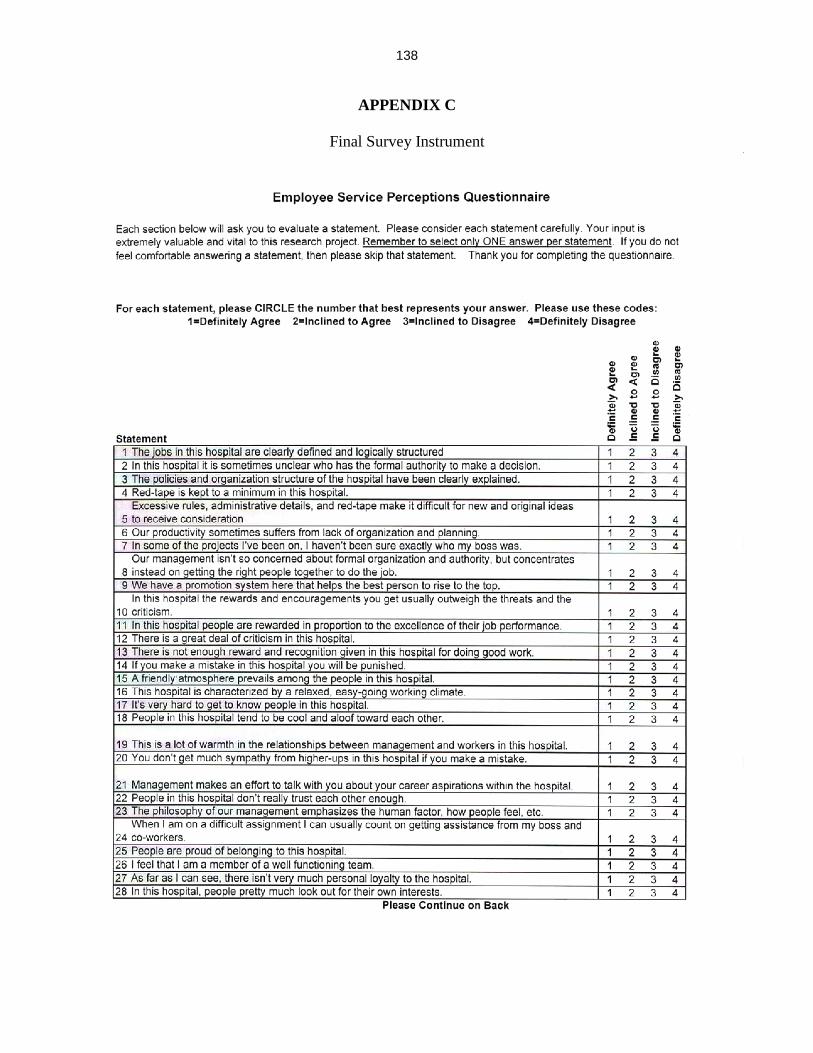
138
APPENDIX C
Final Survey Instrument

139

140

141

142
APPENDIX D
List of Interview Questions Question List
1. Please tell me some background information about yourself. What is your position title? How long have you been in this position?
2. What is one thing that you like about your position? 3. What is one thing you don’t like about your position? 4. The next set of questions focuses on service quality issues. What is your impression
about the level of service quality performed on this unit? 5. Can you give me an example of something that has happened on the unit that would be
considered providing high quality service to patients? 6. Can you give me an example of something that has happened on the unit that would be
considered providing poor quality service to patients? 7. Can you tell me about the methods used at the hospital to determine service quality levels
on the unit? 8. What does the hospital do with this data? 9. Can you tell me about the methods used on the unit that determine service levels? 10. What does the unit do with this data? 11. Do you believe that the hospital values service quality? Why/why not. 12. Do you believe that the unit values service quality? Why/why not. 13. If a patients has a complaint while they are on the unit, how is that handled? 14. If a patient has a complaint after they have left the hospital, how is that handled? 15. Is there anything else about service quality on your unit or at this hospital that I haven’t
asked about? Questions 7 and 8 along with questions 9 and 10 were asked together to make it easier for the respondents to understand and answer the questions. Questions 13 and 14 were later dropped after approximately half the interviews were completed on A1 due to answer repetitiveness. (Answers to question 13 suggested that complaints were taken to the NAM; answers to question 14 suggested that patients either called the hospital or referenced problems on the Press Ganey questionnaire.) It is important to note that subjects did not always answer all of the interview questions. Subjects were allowed to skip any question that made them uncomfortable or that they did not have an answer for.

143
APPENDIX E
Demographics by Job Classification for Survey Job Classification by Unit
Job Category A1 B1 Total
Raw Percent Raw Percent Raw Percent Unit Medical Director 1 2.8 1 2 2 2.4 Senior Staff Physician 5 13.9 4 8.2 9 10.6 Senior Resident 1 2.8 1 2 2 2.4 Resident in Training 3 8.3 3 6.1 6 7.1 Nurse Manager 1 2.8 1 2 2 2.4 Registered Nurse 10 27.8 17 34.7 27 31.8 Nurse Intern/Extern 1 2.8 1 2 2 2.4 Clinical Nurse Specialist 0 0 2 4.1 2 2.4 Nurse Practitioner 0 0 2 4.1 2 2.4 Nurse Assistant 5 13.9 7 14.3 12 14.1 Clerk 3 8.3 1 2 4 4.7 Case Manager 2 5.6 3 6.1 5 5.9 Pharmacy 1 2.8 0 0 1 1.2 Unit Associate 1 2.8 1 2 2 2.4 Unit Support Person 1 2.8 3 6.1 4 4.7 Other 0 0 1 2 1 1.2 Missing 1 2.8 1 2 2 2.4 Total 36 100 49 100 85 100

144
APPENDIX F
Demographics by Job Classification Collapsed by Unit Job Classifications Collapsed by Unit
Job Category A1 B1 Total
Raw Percent Raw Percent Raw Percent
Doctors 10 28.6 9 18.8 19 22.9 Nurses 12 34.3 23 47.9 35 42.2 Nurse Assistants 5 14.3 7 14.6 12 14.5 Other 8 22.9 9 18.8 17 20.5 Total 35 100 48 100 83 100

145
APPENDIX G
Demographics by Tenure for Survey Tenure of survey respondents by Unit
Tenure A1 B1 Total
Raw Percent Raw Percent Raw Percent
Less than six months 6 16.7 7 14.3 13 15.3 Six months to less than one year 2 5.6 3 6.1 5 5.9 One year to less than three years 12 33.3 14 28.6 26 30.6 Three or more years 15 41.7 24 49 39 45.9 Missing 1 2.8 1 2 2 2.4 Total 36 100 49 100 85 100

146
APPENDIX H
Observation Time Matrix Unit A1 Observation Time Matrix
Shifts Using a 12 hour schedule Shifts Using an 8 hour schedule Shift Time Observed Shift Time Observed 7am-7pm 43.5 hours 7am-3pm 21 hours 7pm-7am 12.5 hours 3pm-11pm 33 hours 11pm-7am 2 hours Total Hours 56 hours Total Hours 56 hours
Unit B1 Observation Time Matrix
Shifts Using a 12 hour schedule Shifts Using an 8 hour schedule Shift Time Shift Time 7am-7pm 25 hours 7am-3pm 16.5 hours 7pm-7am 13 hours 3pm-11pm 17 hours 11pm-7am 4.5 hours Total Hours 38 hours Total Hours 38 hours

147
APPENDIX I
Unit A1 Layout

148
APPENDIX J
Unit B1 Layout

149
APPENDIX K
Human Investigation Committee Continuation Approval Form
150
REFERENCES
Allen, M., Gotcher, J., & Seibert, J. (1993). A decade of organizational communication research:
Journal articles 1980-1991. In S. Deetz (Ed.), Communication yearbook (pp. 252-330).
Thousand Oaks, CA: Sage.
Argyris, C., & Schon, D. (1978). Organizational Learning: A theory of action perspective.
Reading, Mass.: Addison-Wesley.
Ashforth, B. (1985). Climate formation: Issues and extensions. Academy of Management
Review, 10, 837-847.
Ashforth, B., & Humphrey, R. (1993). Emotional labor in service roles: The influence of
identity. Academy of Management Review, 18 (1), 88-115.
Atkins, P., Marshall, B., & Javalgi, R. (1996). Happy employees lead to loyal patients.
Marketing Health Services, 16 (4), 14-23.
Batlis, N. (1980). Effect of organizational climate on job satisfaction, anxiety, and propensity to
leave. Journal of Psychology, 104, 233-240.
Beyer, J., & Trice, H. (1987). How an organization’s rites reveal its culture. Organizational
Dynamics, 15, 4-35.
Blackman, B. (1985). Making a service more tangible can make it more manageable. In J.
Czepiel, M. Solomon, & C. Suprenant (Eds.), The service encounter: Managing
employee/customer interaction in service businesses (pp. 291-302). Lexington, MA:
Lexington Books.
Boje, D. (1991). The storytelling organization: A study of story performance in an office-supply
firm. Administrative Science Quarterly, 36, 106-126.
Brond, D. (1997). Customer participation is the latest trend in service delivery. Marketing News,
31 (22), 11.

151
Brady, M., & Cronin, J. (2001). Customer orientation: Effects on customer service perceptions
and outcome behaviors. Journal of Service Research, 3, 241-251.
Brown, C., & Sulzer-Azaroff, B. (1994). An assessment of the relationship between customer
satisfaction and service friendliness. Journal of Organizational Behavior Management, 14
(2), 55-75.
Brown, I. (1963). Understanding other cultures. Englewood Cliffs, N.J.: Prentice-Hall.
Butcher, A. (1994). Supervisors matter more than you think: Components of a mission-centered
organizational climate. Hospital and Health Services Administration, 39 (4), 505-515.
Cameron, K. & Thompson, M. (2000). The problems and promises of total quality management:
Implications for organizational performance. In R. E. Quinn, R.M. O’Neill, & L. St. Clair
(Eds.), Pressing problems in modern organizations: Transforming agendas for research
and practice (pp. 215-242). New York: AMACOM.
Campbell, J., Bownas, D., & Peterson, N. (1974, July). The measurement of organizational
effectiveness: A review of relevant research and opinion. San Diego, CA: Navy Research
and Development Center.
Carver, C. (1994). The effects of connectedness and stability of communication networks on
employee perceptions of organizational climate. Unpublished doctoral dissertation,
University of Minnesota, Minnesota.
Chuang, C., & Liao, H. (2010). Strategic human resource management in service context: Taking
care of business by taking care of employees and customers. Personnel Psychology, 63
(1), 153-196.
Clark, P. A., Wolosin, R., & Gavran, G. (2007). Customer convergence. Health Marketing
Quarterly, 23 (3), 79-99.

152
Cole, R. (1995). Introduction. In R. Cole (Ed.), The death and life of the American quality
movement (pp. 3-10). New York: Oxford University Press.
Comstock, J., & Higgens, G. (1997). Appropriate relational messages in direct selling
interaction: Should salespeople adapt to buyer’s communication style. Journal of
Business Communication, 34 (4), 401-18.
Crosby, L., Evans, K. & Cowles, D. (1990). Relationship quality in services selling: An
interpersonal influence perspective. Journal of Marketing, 54, 68-81.
Dandridge, T. (1986). Ceremony as an integration of work and play. Organizational Studies, 7,
159-170.
Daniels, T., Spiker, B., & Papa, M. (1997). Perspectives on organizational communication.
Boston: McGraw Hill.
Davies, H., Mannion, R., Jacobs, R., Powell, A., & Marshall, M. (2007). Exploring the
relationship between senior management team culture and hospital performance. Medical
Care Research and Review, 64 (1), 46-65.
Davis, T., & Luthans, F. (1988). Service od: Techniques for improving the delivery of quality
service. Organization Development Journal, 6, 76-80.
Day, D., & Bedeian, A. (1991). Predicting job performance across organizations: The
interaction of work orientation and psychological climate. Journal of Management, 17,
589-600.
Deal, T., & Kennedy, A. (1982). Corporate cultures: The rites and rituals of corporate life.
Reading, MA: Addison-Wesley.
Dean, J. Jr, & Bowen, D. (2000). Management theory and total quality: Improving research and
practice through theory development. In R. E. Cole, & W. R. Scott (Eds.). The quality
movement and organization theory (pp. 3-22). Thousand Oaks, CA: Sage.

153
Dennis, H. (1975). The construction of a managerial communication climate inventory for use in
complex organizations. Paper presented at the annual convention of the International
Communication Association, Chicago.
Denison, D. (1996). What is the difference between organizational culture and organizational
climate? A native’s point of view on a decade of paradigm wars. Academy of
Management Review, 21 (3), 619-642.
Detert, J., Schroeder, R., & Mauriel, J. (2000). A framework for linking culture and
improvement initiatives in organizations. Academy of Management Review, 25 (4), 850-
863.
Drucker, P. F. (1954). The practice of management. New York: Harper & Row.
Edwards, P., Scott, T., Richardson, P., Espinoza, S., Sainfort, F., Rask, K., & Jose, J. (2008).
Using staff perceptions on patient safety as a tool for improving safety culture in a
pediatric hospital system. Journal of Patient Safety, 4 (2) 113-118.
Eisenberg, E.M. (1984). Ambiguity as strategy in organizational communication.
Communication Monographs, 51, 227-242.
Eisenberg, E., & Riley, P. (2001). Organizational culture. In F. Jablin & L. Putnam (Eds.), The
new bandbook of organizational communication: Advances in theory, research, and
methods (pp. 291-322). Thousand Oaks, CA: Sage.
Elizure, D. (1987). Effect of feedback on verbal and non-verbal courtesy in a bank setting.
Applied Psychology: An International Review, 36, 147-156.
Emerson, R., Fretz, R., & Shaw, L. (1995). Writing ethnographic fieldnotes. The University of
Chicago Press: Chicago.
Engel, J., Blackwell, R., and Miniard, P. (1995). Consumer Behavior (8th ed.). New York:
Dryden.

154
Falcione, R., & Kaplan, E. (1984). Organizational climate, communication, and culture. In R.
Bostrom (Ed.). Communication Yearbook (pp.285-309). Newbury Park, CA: Sage.
Fetterman, D. (1998). Ethnography: Step by step (2nd ed.). Thousand Oaks, CA: Sage.
Fischer, E., Gainer, B, & Bristor, J. (1997). The sex of the service provider: Does it influence
perceptions of service quality? Journal of Retailing, 73 (3), 361-382.
Ford, R., Bach, S., & Fottler, M. (1997). Methods of measuring patient satisfaction in health care
organizations. Health Care Management Review, 22 (2), 74-89.
Ford, W. S. Z. (1993, May). Employee behaviors, predictors, and outcomes in customer service
encounters: Argument for a structural equation modeling approach to full model analysis.
Paper presented at the annual conference of the International Communication
Association, Washington, DC.
Ford, W. S. Z. (1998). Communicating with customers: Service approaches, ethics, and impact.
Cresskill, NJ: Hampton Press.
Ford, W. (1999). Communication approaches and expectations for service providers in
professional and nonprofessional organizational contexts. Paper presented at the annual
conference of the National Communication Association, Chicago, IL.
Ford, W. S. Z., & Etienne, C. (1994). Can I help you? A framework for the interdisciplinary
research on customer service encounters. Management Communication Quarterly, 7 (4),
413-441.
Froggatt, K. (1998). The place of metaphor and language in exploring nurses’ emotional work.
Journal of Advanced Nursing, 28 (2), 332-338.
Gagliano, K., & Hathcote, J. (1994). Customer expectations and perceptions of service quality in
retail apparel specialty stores. Journal of Services Marketing, 8 (1), 60-69.
155
Ganesan, V. (1983). Knowledge workers: Organizational climate and motivation. Psychological
Reports, 52, 884-886.
Gearhart, S. (2008). The relationship between care provider perceptions of safety culture and
patient perceptions of care on three hospital units. Dissertation Abstracts Interrnational:
Section B. Sciences and Engineering, 69 (12), 3339189.
Geertz, C. (1973). The interpretation of cultures. New York: Basic Books. Gershon, R., Karkashian, C., Grosch, J., Murphy, L., Escamilla-Cejudo, A., Flanagan, P.,
Bernacki, E., Kasting, C., & Martin, L. (2000). American Journal of Infection Control, 28
(3), 211-221.
George, J., & Bishop, L. (1971). Relationship of organizational structure and teacher personality
characteristics to organizational climate. Administrative Science Quarterly, 16, 467-476.
Gifford, B., Zammuto,R., Goodman, E., & Hill, K. (2002). The relationship between hospital
unit culture and nurses’ quality of work life. Journal of Healthcare Management, 47 (1),
13-25.
Glisson, C., Schoenwalk, S., Kelleher, K., Landsverk, J., Hoagwood, K., Mayberg, S., & Green,
P. (2008). Therapist turnover and new program sustainability in mental health clinics as a
function of organizational culture, climate, and service structure. Administration and
Policy in Mental Health Services Research, 35, 124-133.
Gokenbach, V. (2006). Team of eagles: The power of metaphor in transformation. Nurse Leader.
4 (6), 52-55.
Goodell, A. (1992). Organizational climate: Current thinking on an important issue. In K.
Hutchinson (Ed.), Readings on organizational communication (pp. 322-333). Dubuque
IA: Wm. C. Brown.
156
Grandey, A. (2000). Emotion regulation in the workplace: A new way to conceptualize
emotional labor. Journal of Occupational Health Psychology, 5, 95-110.
Gregory, K. (1983). Native-view paradigms: Multiple cultures and culture conflicts in
organizations. Administrative Science Quarterly, 28, 359-376.
Grisaffe, D. (2000). Putting customer satisfaction in its place: Broader organizational research
perspectives versus measurement myopia. Journal of Consumer Satisfaction,
Dissatisfaction, and Complaining Behavior, 13, 1-16.
Gutek, B. (1995). The dynamics of service: Reflections on the changing nature of
customer/provider interactions. San Francisco, CA: Jossey-Bass.
Hall, R., & Lawler, E. (1969). Unused potential in research development organizations. Research
Management, 12, 339-354.
Hallowell, R, Schlesinger, L., & Zornitsky, J. (1996). Internal service quality, customer and job
satisfaction: Linkages and implication for management. Human Resource Planning, 19
(2), 20-31.
Hartline, M., & Ferrell, O. (1996). The management of customer-contact service employees: An
empirical investigation. Journal of Marketing, 60 (4), 52-70.
Hartmann, C., Meterko, M., Rosen, A., Zhao, S., Shokeen, P., Singer, S., & Gaba, D. (2009).
Relationship of hospital organizational culture to patient safety climate in the veterans
health administration. Medical Care Research and Review, 66 (3), 320-338.
Hellriegel, D., & Slocum, J. (1974). Organizational climate: Measures, research, and
contingencies, Academy of Management Journal, 17, 255-279.
Hofstede, G. (1998). Attitudes, values and organizational culture: Disentangling the concepts.
Organizational Studies, 19 (3), 477-492.

157
Hogan, J., Hogan, R., & Busch, C. M. (1984). How to measure service orientation. Journal of
Applied Psychology, 69, 167-173.
Hurley, R. (1998). Customer service behavior in retail settings: A study of the effect of service
provider personality. Journal of the Academy of Marketing Science, 26 (2), 115-127.
Hwang, J., & Chang, H. (2009). Work climate perception and turnover intention among Korean
hospital staff. International Nursing Review, 56 (1), 73-80.
Infante, D., & Gorden, W. (1987). Superior-subordinate communicator profiles: Implications for
independent-mindedness and upward influence. Central States Speech Journal, 38, 73-80.
Ireland, R., Van Auken, P., & Lewis, P. (1978). An investigation of the relationship between
organization climate and communication climate. Journal of Business Communication,
16, 3-10.
Jablin, F. (1980). Organizational communication theory and research: An overview of
communication climate and network research. Communication Yearbook, 4, 327-347.
James, L., & Jones, A. (1974). Organizational climate: A review of theory and research,
Psychological Bulletin, 81, 1086-1112.
Johnson, B. (1977). Communication: The process of organizing. Boston: Allyn & Bacon.
Johnson, J. (1996). Linking employee perceptions of service climate to customer satisfaction.
Personnel Psychology, 49 (4), 831-851.
Jones, L. C., Guberski, T. D., & Soeken, K. L. (1990). Nurse practitioners: Leadership behaviors
and organizational climate. Journal of Professional Nursing, 6 (November-December),
327-333.
Joyce, W. F. & Slocum, J. W. (1982). Climate discrepancy: Refining the concept of
psychological and organizational climate. Human Relations, 35, 951-972.

158
Juni, S., Brannon, R., & Roth, M. (1988). Sexual and racial discrimination in service-seeking
interactions: A field study in fast food and commercial establishments. Psychological
Reports, 63, 71-76.
Kaafarani, H, Itani, K., Rosen, A., Zhao, S., Hartmann, C., & Gaba, D. (2009). How does patient
safety culture in the operating room and post-anesthesia care unit compare to the rest of
the hospital? The American Journal of Surgery, 198 (1), 70-75.
Kakabadse, A. (1986). Organizational alienation and job climate: A comparative study of
structural conditions and psychological adjustment. Small Group Behavior, 17, 458-471.
Kelley, S., Donnelly, J., Jr., & Skinner, S. (1990). Customer participation in service production
and delivery. Journal of Retailing, 66, 315-335.
Ketrow, S. M. (1991). Nonverbal communication and client satisfaction in computer-assisted
transactions. Management Communication Quarterly, 5, 192-219.
Keuter, K., Byrne, E., Voell, J., & Larson, E. (2000). Nurses’ job satisfaction and organizational
climate in a dynamic work environment. Applied Nursing Research, 13 (1), 46-49.
Kluckhohn, F., & Strodtbeck, F. (1961). Variations in value orientations. New York: Harper &
Row.
Knaus, W. A., Draper, E.A., Wagner, D.P., & Zimmerman, J.E., (1986). An evaluation of
outcome from intensive care in major medical centers. Annals of Internal Medicine, 104
(3), 410-418.
Koch, S., & Deetz, S. (1981). Metaphor analysis of social reality in organizations. Journal of
Applied Communication Research, 9 (1), 1-15.
Kotter, J. & Heskett, J. (1992). Corporate culture and performance. New York: The Free Press.
Kramer, M., & Berman, J. (2001). Making sense of a university’s culture: An examination of
undergraduate students’ stories. Southern Communication Journal, 66 (4), 297-311.

159
Kroeber, A., & Kluckhohn, C. (1952). Culture: A critical review of concepts and definitions.
Harvard University Peabody Museum of Archaeology and Ethnology Papers, 47.
Kumar, P., Kalwani, M., & Dada, M. (1997). The impact of waiting time guarantees on
customers waiting experiences. Marketing Science, 16 (4), 295-314.
LaFollette, W., & Sims, H. (1975). Is satisfaction redundant with organizational climate?
Organizational Behavior and Human Performance, 13, 257-278.
Lam, C., & Huang, X., & Janssen, O. (2010). Contextualizing emotional exhaustion and positive
emotional display: The signaling effects of supervisors emotional exhaustion and service
climate. Journal of Applied Psychology, 95 (2), 368-376.
Lavoie-Tremblay, M., Paquet, M., Duchesne, M., Santo, A., Gavrancic, A., Courcy, F., &
Gagnon, S. (2010). Retaining nurses and other hospital workers: An intergenerational
perspective of the work climate. Journal of Nursing Scholarship, 42 (4), 414-422.
Liao, H., & Chuang, A. (2004). A multilevel investigation of factors influencing employee
service performance and customer outcomes. Academy of Management Journal, 47 (1),
41-58.
Liou, S., & Cheng, C. (2010). Organisational climate, organisational commitment and intention
to leave amongst hospital nurses in Taiwan. Journal of Clinical Nursing, 19, 1635-1644.
Little, M. M., Dean, A. M. (2006). Links between service climate, employee commitment and
employees’ service quality capability. Managing Service Quality, 16 (5). 460-476.
Litwin, G., & Stringer, R. (1968). Motivation and organizational climate. Cambridge, Mass.:
Harvard University Press.
Louis, M. (1985). An investigator’s guide to workplace culture. In P. Frost, L. Moore, M. Louis,
C. Lundberg, & J. Martin (Eds.), Organizational culture (pp. 73-93). Beverly Hills, CA:
Sage.
160
McGregor, D. (1960). The human side of enterprise. New York: McGraw-Hill.
McNabb, D. & Sepic, F. (1995). Culture, climate, and total quality management: Measuring
readiness for change. Public Productivity and Management Review, 18 (4), 369-381.
Meterko, M., Mohr, D., & Young, G. (2004). Teamwork culture and patient satisfaction in
hospitals. Medical Care, 42 (5), 492-498.
Micelie, M., & Near, J. (1985). Characteristics of organizational climate and perceived
wrongdoing associated with whistle-blowing decisions. Personnel Psychology, 38, 525-
544.
Miller, K. (1999). Organizational communication: Approaches and processes. (2nd ed.).
Belmont, CA: Wadsworth.
Milne, D., & Mullin, M. (1987). Is a problem shared a problem shaved? An evaluation of
hairdressers and social support. British Journal of Clinical Psychology, 26, 69-70.
Mohr, L., & Bitner, M. (1995). The role of employee effort in satisfaction with service
transactions. Journal of Business Research, 32, 239-252.
Moran, E., & Volkwein, J. (1992). The cultural approach to the formation of organizational
climate. Human Relations, 45, (1), 19-38.
Morgan, G. (1986). Images of Organization. Beverly Hills, CA: Sage.
Morley, D., & Schockley-Zalabak, P. (1991). Setting the rules: An examination of organizational
founders’ values. Management Communication Quarterly, 4, 422-449.
Moshavi, D. (2004). He said, she said: Gender bias and customer satisfaction with phone-based
service encounters. Journal of Applied Social Psychology, 34 (1), 162-176.
Mumby, D. (1987). The political function of narrative in organizations. Communication
Monographs, 54, 113-127.

161
Mumby, D. (1988). Communication and power in organizations: Discourse, ideology, and
domination. Norwood, NJ: Ablex.
Muchinsky, P.M. (1976). An assessment of the Litwin and Stringer organizational climate
questionnaire: An empirical theoretical extension of the Simms and LaFollette study.
Personnel Psychology, 29, 371-392.
Oliver, R. L. (1997). Satisfaction: A behavioral perspective on the consumer. New York:
McGraw-Hill.
Ott, J. S. (1989). The organizational culture perspective. Chicago: Dorsey Press.
Ouichi, W., & Wilkins, A. (1985). Organizational culture. Annual Review of Sociology, 11, 457. Pacanowsky, M., & O’Donnell-Trujillo, N. (1982). Communication and organizational cultures.
Western Journal of Speech Communication, 46, 121.
Pacanowsky, M., & O’Donnell-Trujillo, N. (1983). Organizational communication as cultural
performance. Communication Monographs, 50, 126-147.
Paquet, M., & Gagnon, S. (2010). “Collective climate” in hospital settings: A tool to better target
work climate improvement strategies. Heathcare Management Forum, 25-31.
Parasuraman, A., Zeithaml, V., & Berry, L. (1985). A conceptual model of service quality and its
implications for future research. Journal of Marketing, 49, 41-50.
Parasuraman, A., Zeithaml, V., & Berry, L. (1994). SERVQUAL: A multiple item scale for
measuring consumer perceptions of service quality. Journal of Retailing, 64, 12-40.
Payne, R., & Pheysey, D. (1971). G. Stern’s organizational climate index: A reconceptualization
and application to business organizations. Organizational Behavior and Human
Performace, 5, 77-98.
Peters, T., & Waterman, R. (1982). In search of excellence: Lessons from America’s best-run
companies. New York: Harper & Row.

162
Pettigrew, R. (1979). On studying organizational cultures. Administrative Science Quarterly, 24,
570-581.
Pettigrew (1990). Organizational climate and culture: two constructs in search of a role. In B.
Schneider (Ed.), Organizational climate and culture (pp. 5-39). San Francisco: Jossey-
Bass.
Pincus, J. (1986). Communication satisfaction, job satisfaction, and job performance. Human
Communication Research, 12, 395-419.
Plumb, C., & Spyridakis, J. (1992). Survey research in technical communication: Designing and
administering questionnaires. Technical Communication, 625-638.
Poole, M. (1985). Communication and organizational climates: Review, critique and a new
perspective. R. D. McPhee and P.K. Tompkins (Eds.), Organizational communication:
Traditional themes and new directions (pp. 79-108). Beverly Hills: Sage.
Poole, M. (1987). The structuring of organizational climates. Unpublished manuscript,
University of Minnesota, Minneapolis, MN.
Poole, M., & McPhee, R. (1983). A structurational analysis of organizational climate. In L.
Putnam and M. Pacanowsky (Eds.), Communication in organizations: An interpretive
approach (pp. 195-210). Beverly Hills: Sage.
Poor customer service has significant impact on bottom line. Hospital Peer Review. (2001) 26
(12), 167-168.
Price, M., & Chen, E. (1995). Total quality management in a small, high-technology company.
In R. Cole (Ed.), The death and life of the American quality movement. (pp. 115-138).
New York: Oxford University Press.

163
Putnam,L. (1983). The interpretive paradigm: An alternative to functionalism. In L. Putnam &
M. Pacanowsky (Eds.), Communication and organizations: An interpretive approach (pp.
31-45). Newbury Park, CA: Sage.
Putnam, L., & Cheney, G. (1985). Organizational communication: Historical development and
future directions. In M. S.. Mander (Ed.), Communications in transition (pp. 31-54).
Beverly Hills: Sage.
Quinn, R., & McGrath, M. (1985). The transformation of organizational cultures: A competing
values perspective. In P. Frost, L. Moore, M. Louis, C. Lundberg, & J. Martin (Eds.),
Organizational culture (pp. 315-334). Beverly Hills, CA: Sage.
Rafaeli, A. (1989a). When cashiers meet customers: An analysis of the role of supermarket
cashiers. Academy of Management Journal, 33, 623-637.
Rafaeli, A. (1989b). When clerks meet customers: A test of variables related to emotional
expressions on the job. Journal of Applied Psychology, 74, 385-393.
Rafaeli, A., & Sutton, R. I. (1990). Busy stores and demanding customers: How do they affect
the display of positive emotion? Academy of Management Journal, 32, 245-273.
Redding, W. C. (1972). Communication within the organization: An interpretive review of
theory and research. New York: Industrial Communication Council, Inc.
Reichers, A., & Schneider, B. (1990). Climate and culture: An evolution of constructs. In
Schneider, B. (Ed.), Organizational climate and culture, (pp. 5-39). San Francisco, CA:
Jossey-Bass.
Reinard, J. (2006). Communication research statistics. Thousand Oaks, CA: Sage.
Rentsch, J. (1990). Climate and culture interaction and qualitative differences in organizational
meanings. Journal of Applied Psychology, 75, 668-681.

164
Roberts, K., & O’Reilly, C. (1974). Measuring organizational communication. Journal of
Applied Psychology, 59, 321-326.
Rondeau, K., & Wagar, T. (1998). Hospital chief executive officer perceptions of organizational
culture and performance. Hospital Topics, 76 (2), 14-21.
Rondeau, K., & Wagar, T. (1999). Hospital choices in times of cutback: the role of
organizational culture. Leadership in Health Services, 12 (3), 14-22.
Rosenfeld, L., Richman, J., & May, S. (2004). Information adequacy, job satisfaction and
organizational culture in a dispersed-network organization. Journal of Applied
Communication Research, 32 (1), 28-54.
Rust, R., & Zahorik, A. (1993). Customer satisfaction, customer retention, and market share.
Journal of Retailing, 69, 193-215.
Saxe, R., & Weitz, B. (1982). The SOCO scale: A measure of the customer orientation of
salespeople. Journal of Marketing Research, 19, 343-351.
Schall, M. (1983). A communication-rules approach to organizational culture. Administrative
Science Quarterly, 28, 557-581.
Schmalenberg, C., Kramer, M., King, C., Krugman, M., Lund, C., Poduska, D., & Rapp, D.
(2005). Excellence through evidence: Securing collegial/collaborative nurse-physician
relationships. International Journal of Nursing Administration, 35 (10), 450-458.
Schein, E. (1985). Organizational culture and leadership: A dynamic view. San Francisco:
Jossey-Bass.
Schein, E. (1991). The role of the founder in the creation of organizational culture. In P. Frost, L.
Moore, M. Louis, C. Lundberg, & J. Martin (Eds.), Reframing organizational culture (pp.
14-25). Newbury Park, CA: Sage.

165
Schmit, M., & Allscheid, S. (1995). Employee attitudes and customer satisfaction: Making
theoretical and empirical connections. Personnel Psychology, 48, 521-536.
Schnake, M. (1983). An empirical assessment of the effects of affective response in the
measurement of organizational climate. Personnel Psychology, 36, 791-807.
Schneider, B. (1975). Organizational climates: An essay. Personnel Psychology, 28, 447-479.
Schneider, B. (1990). The climate for service: An application of the climate construct. In B.
Schneider (Ed.), Organizational climate and culture (pp. 383-412). San Francisco: Jossey-
Bass.
Schneider, B. (2000). The psychological life of organizations. In N. M. Ashkanasy, C. P. M.
Wilderon, & M. F. Peterson (Eds.), Handbook of organizational culture and climate (pp.
xvii-xxi). Thousand Oaks, CA: Sage.
Schneider, B., & Bartlett, C. (1970). Individual differences and organizational climate II:
Measurement of organizational climate by multitrait-multirater matrix. Personnel
Psychology, 23, 493-512.
Schneider, B., & Bowen, D. (1985). Employee and customer perceptions of service in banks:
Replication and extension. Journal of Applied Psychology, 70, 423-433.
Schneider, B., & Bowen, D. (1994). The service organization: Human resources management is
crucial. Organizational Dynamics, 21, 39-52.
Schneider, B, Brief, A., & Guzzo, R. (1996). Creating a climate and culture for sustainable
organizational change. Organizational Dynamics, 24, 6-19.
Schneider, B., Gunnarson, S., & Niles-Jolly, K. (1994). Creating the climate and culture of
success. Organizational Dynamics, 21, 39-52.
Schneider, B., & Hall, D. (1972). Toward specifying the concept of work climate: A study of
Roman Catholic diocessen priests. Journal of Applied Psychology, 56, 447-456.
166
Schneider, B., Parkington, J., & Buxton, U. (1980). Employee and customer perceptions of
service in banks. Administrative Science Quarterly, 25, 252-267.
Schneider, B., & Reichers, A. (1983). On the etiology of climates. Personnel Psychology, 36, 19-
39.
Schneider, B., White, & Paul (1998). Linking service climate and customer perceptions of
service quality: Test of a causal model. Journal of Applied Psychology, 83 (2), 150-164.
Schwartz, H., & Davis, S. (1981). Matching corporate culture and business strategy.
Organizational Dynamics, 10 (1), 30-38.
Schwartzman, H. (1993). Ethnography in organizations. Newbury Park, CA: Sage. Shockley-Zalabak, P., & Morley, D. (1994). Creating a culture: A longitudinal examination of
the influence of management and employee values on communication rule stability and
emergence. Human Communication Research, 20, 334-355.
Simpson, S., & Cacioppe, R. (2001). Unwritten ground rules: transforming organizational culture
to achieve key business objectives and outstanding customer service. Leadership and
Organization Development Journal, 22 (8), 394-401.
Sirohi, N., McLaughlin, E., & Wittink, D. (1998). A model of consumer perceptions and store
loyalty intentions for a supermarket retailer. Journal of Retailing, 74 (2), 223-245.
Smircich, L. (1983). Concepts of culture and organizational analysis. Administrative Science
Quarterly, 28, 339-358.
Smircich, L., & Calas, M. (1987). Organizational culture: A critical assessment. In F. Jablin, L.
Putnam, K. Roberts, & L. Porter (Eds.), Handbook of organizational communication
(pp.228-263). Newbury Park, CA: Sage.
Smith, R., & Eisenberg, E. (1987). Conflict at Disneyland: A root metaphor analysis.
Communication Monographs, 54, 367-380.

167
Sopory, P., & Dillard, J. (2006). The persuasive effects of metaphor: A meta-analysis. Human
Communication Research, 28 (3), 382-419.
Sorra, J., Nieva, V., Famolaro, T., & Dyer, N. (2007). Hospital survey on patient safety culture.
In (Prepared by Westat, under contract no. 290-96-0004). Rockville, MD: Agency for
Healthcare Research and Quality; 2004.
Sorra, J., Nieva, V., Fastman, B., Kaplan, H., Schreiber, G., & King, M. (2008). Staff attitudes
about event reporting and patient safety culture in hospital transfusion services.
Transfusion, 48 (9), 1934-1942.
Sparks, B., Bradley, G., & Callan, V. (1997). The impact of staff empowerment and
communication style on customer evaluations: The special case of service failure.
Psychology & Marketing, 14 (5), 475-493.
Stock, G., McFadden, K., & Gowen, C. (2007). Organizational culture, critical success factors,
and the reduction of hospital errors. International Journal of Production Economics, 106
(2), 368-392.
Stinson, J., & LaBelle, T. (1971). The organizational climate of Paraguayan elementary schools:
Rural-urban differentiation. Education and Urban Society, 3, 333-349.
Strasser, D., Smits, S., Falconer, J., Herrin, J., & Bowen, S. (2002). The influence of hospital
culture on rehabilitation team functioning in VA hospitals. Journal of Rehabilitation
Research and Development, 39 (1), 115-126.
Surprenant, C., & Solomon, M. (1987). Predictability and personalization in the service
encounter. Journal of Marketing, 51, 86-96.
Susskind, A., Kacmar, K., & Borchgrevink, C. (2003). Customer service providers’ attitudes
relating to customer service and customer satisfaction in the customer-server exchange.
Journal of Applied Psychology, 88 (1), 179-187.

168
Sutton, R. I., & Rafaeli, A. (1988). Untangling the relationship between displayed emotions and
organizational sales: The case of convenience stores. Academy of Management Journal,
31, 461-487.
Svyantek, D., & Bott, J. (2004). Organizational culture and organizational climate measures: an
integrative review. In J. C. Thomas (Ed.), Comprehensive handbook of psychological
assessment: Industrial and organizational assessment (Vol. 4, pp. 507-524). Hoboken,
NJ: Wiley.
Tagiuri, R., & Litwin, G. (1968). Organizational climate: Exploration of a concept. Boston:
Harvard University Press.
Taylor, J. C., & Bowers, D. G. (1972). Survey of organizations. Ann Arbor: The University of
Michigan.
Tesluk, P, Vance, R., & Mathieu, J. (1999). Examining employee involvement in the context of
participative work environments. Group & Organization Management, 24 (3), 271-299.
Totterdell, P., & Holman, D. (2003). Emotion Regulation in customer service roles: Testing a
model of emotional labor. Journal of Occupational Health Psychology, 8 (1), 55-73.
Trethewey, A. (1997). Organizational culture. In P. Byers, Organizational Communication:
Theory and Behavior, (pp. 203-234). Boston: Allyn & Bacon.
Trice, H., & Beyer, J. (1993). The cultures of work organizations. Englewood Cliffs, NJ:
Prentice Hall.
Van Maanen, J., & Schein, E. (1979). Toward a theory of organization socialization. In B. Staw
(Ed.), Research in organizational behavior: Vol. 1 (pp. 209-264). Greenwich, CT: JAI
Press.
Victor, B., & Cullen J. (1988). The organizational bases of ethical work climates. Administrative
Science Quarterly, 33, 101-125.

169
Walston, S., Al-Omar, Bl, Al-Mutari, F. (2010). Factors affecting the climate of hospital patient
safety: A study of hospitals in Saudi Arabia. International Journal of Health Care Quality
Assurance, 23 (1), 35-50.
Walumbwa, F., Peterson, S., Avolio, B., & Hartnell, C. (2010). An investigation of the
relationships among leader and follower psychological capital, service climate, and job
performance. Personnel Psychology, 63 (4), 937-964.
Way, S., Sturman, M., & Raab, C. (2010). What matters more? Contrasting the effects of job
satisfaction and service climate on hotel food and beverage managers’ job performance.
Cornell Hospitality Quarterly, 51 (3), 379-397.
Wert-Gray, S., Center, C., Brashers, D., & Meyers, R. (1991). Research topics and
methodological orientations in organizational communication: A decade in review,
Communication Studies, 42 (2), 141-154.
Wheelan, S., Burchill, C., & Titlin, F. (2003). The link between teamwork and patinets’
outcomes in intensive care units. American Journal of Critical Care, 12, 527-534.
Wilkins, A. (1983). Organizational stories as symbols which control the organization. In L.
Pondy, G. Morgan, P. Frost, & T. Dandridge (Eds.), Organizational symbolism (pp. 81-
92). Greenwich, Conn.: JAI Press.
Williams, K., & Spiro, R. (1985). Communication style in the salesperson-customer dyad.
Journal of Marketing Research, 12, 434-442.
Wolosin, R. (2008, May/June). Safety and satisfaction: Where are the connections? Patient
Safety and Quality Healthcare. Retrieved from
http://www.psqh.com/mayjun08/satisfaction.html

170
Ying, L., Kunaviktikul, W., & Tonmukayakal, O. (2007). Nursing competency and
organizational climate as perceived by staff nurses in a Chinese university hospital.
Nursing and Health Sciences, 9 (3), 221-227.
Yoon, M., Seo, F., & Yoon, T. (2004). Effects of contact employee supports on critical employee
responses and customer service evaluation. Journal of Services Marketing, 18 (5), 395-
412.
Zeithaml, V., Parasuraman, A., & Berry, L. (1990). Delivering quality service: Balancing
customer perceptions and expectations. New York: The Free Press.
Zohar, D. (1980). Safety climate in industrial organizations: Theoretical and applied
implications. Journal of Applied Psychology, 65, 96-102.

171
ABSTRACT
THE ROLE OF ORGANIZATIONAL CLIMATE AND CULTURE IN SERVICE ENCOUNTERS
by
BETH A. HEYART
May 2011
Advisor: Dr. Matthew Seeger Major : Communication Degree: Doctor of Philosophy This study explored the link between culture and climate with respect to customer service
ratings. Two hospital units, one with high customer service ratings and one with low customer
service ratings, were identified for analysis. A mixed-method design was implemented to assess
climate and culture on each unit. Climate was assessed with a survey that combined elements of
Schneider, White, and Paul’s (1998) Assessment of Service Climate Instrument and Litwin and
Stringer’s (1968) Organizational Climate Questionnaire. An ethnographic approach using
observation, interviews and archival data analysis was completed to understand each unit’s
culture. Findings indicate high customer service environments rated the factors of warmth,
identity, customer orientation and global service climate more favorably. In addition,
ethnographic elements within high service environments include the Nature of Time,
Assumptions of Human Relationship, and values as discussed by Schein (1985). All these
factors help to create and perpetuate a climate and culture of high service

172
AUTOBIOGRAPHICAL STATEMENT
Beth A. Heyart is currently an Associate Professor of Communication at Delta College
where she teaches basic public speaking, interpersonal communication, and business
communication for managers. She enhances her classes through service learning and by being
involved in learning communities with other faculty at Delta College.
Beth has always been interested in customer service research. When she started in retail
sales at the age of 16, she was surprised by how differently her co-workers treated customers.
This current study reflects her concerns from long ago.
In her free time, Beth helps with the Delta College Drama Department stage productions,
and tries, sometimes successfully, to keep up with the many activities of her three young
children.