Embed Size (px)
Citation preview
The Role of Productive and Technological Capabilities on Export Dynamics in Developing Countries*
Author: Sebastian Vergara**
ABSTRACT
Keywords:
Sustainable Development Goals: 9.5, 8.2, 9B, 17.11
* The author thanks suggestions made by Roberto Alvarez, Dan Gay, Thomas Grebel, Dawn Holland, Lucas Navarro, Poh Lynn Ng and Ingo Pitterle, two anonymous referees from DESA Working Papers, and participants at the DESA Expert Group Meeting on the World Economy held at ECLAC in Santiago, Chile, 5-7 September 2018. The views expressed in this paper are those of the author and do not necessarily reflect those of the United Nations. The author is responsible for errors and omissions.
** Economic Affairs Officer, Department of Economic and Social Affairs, United Nations. Email: [email protected]
DESA Working Paper No. 161ST/ESA/2019/DWP/161
September 2019

UN/DESA Working Papers are preliminary documents circulated in a limited number of copies and posted on the DESA website at https://www.un.org/development/desa/publications/working-paper to stimulate discussion and critical comment. The views and opinions expressed herein are those of the author and do not necessarily reflect those of the United Nations Secretariat. The designations and terminology employed may not conform to United Nations practice and do not imply the expression of any opinion whatsoever on the part of the Organization.
Typesetter: Nancy Settecasi
UNITED NATIONS
Department of Economic and Social Affairs
UN Secretariat, 405 East 42nd Street
New York, N.Y. 10017, USA
e-mail: [email protected]
https://www.un.org/development/desa/
CONTENTS
I Introduction . . . . . . . . . . . . . . . . . . . . . . . . . . . . . . . . . . . . . . . . . . . . . . . . . . . . . . . . . . . . . 3
II Data and basic statistics. . . . . . . . . . . . . . . . . . . . . . . . . . . . . . . . . . . . . . . . . . . . . . . . . . . . 6
III Empirical approach. . . . . . . . . . . . . . . . . . . . . . . . . . . . . . . . . . . . . . . . . . . . . . . . . . . . . . . . 9
IV Regression results . . . . . . . . . . . . . . . . . . . . . . . . . . . . . . . . . . . . . . . . . . . . . . . . . . . . . . . 10
V Concluding Remarks . . . . . . . . . . . . . . . . . . . . . . . . . . . . . . . . . . . . . . . . . . . . . . . . . . . . . 14
References . . . . . . . . . . . . . . . . . . . . . . . . . . . . . . . . . . . . . . . . . . . . . . . . . . . . . . . . . . . . . . . . 15
Annexes . . . . . . . . . . . . . . . . . . . . . . . . . . . . . . . . . . . . . . . . . . . . . . . . . . . . . . . . . . . . . . . . . . 18

THE ROLE OF PRODUCTIVE TECHNOLOGICAL CAPABILITIES ON EXPORT DYNAMICS IN DEVELOPING COUNTRIES
3
I IntroductionProductive capacities and technological capabilities have been emphasized in several strains of economic lit-erature as major engines of export, growth and development. The early contributions on development theory highlighted the transformation of the productive structure –from agriculture and extractive industries to more sophisticated and knowledge-based industries- as a critical factor in shaping the international speciali-zation patterns (Hirschman, 1958; Singer, 1950; Prebisch, 1950). This would entail a process of accumulation of knowledge within the economy (Cimoli et al., 2009). Schumpeterian ideas also emphasized the importance of research and development (R&D) investments and innovation activities in shaping market dynamics, particularly through the process of creative destruction (Schumpeter, 1942).
Later, modern growth theories underscored the role of human capital, R&D investments and, more broadly, knowledge, as a major driver of economic growth (Romer, 1990; Aghion and Howitt, 1998). Finally, contri-butions on technology and trade theory underscored that technological asymmetries were major determinants of trade flows and specialization patterns in foreign markets, influencing on economic performance in the short and medium-term. The key idea was that trade patterns between countries would persist as along as differences in technological capabilities to absorb, generate and use knowledge remain in place (Posner, 1961; Dosi et al., 1990).
From an aggregate perspective, previous studies have shed light on the existing asymmetries regarding tech-nological, export and growth indicators between countries. For example, Cimoli et al. (2005) discuss the position and evolution of Latin American countries on different indicators regarding structural change, inter-national trade and productivity growth vis a vis the United States, Scandinavian countries and the Republic of Korea. The main results are that the performance of Latin American economies was relatively weak, with the region lagging with respect to several indexes of technological efforts, capabilities accumulation and productivity growth.
From an individual country perspective, many studies have shown the connection between capabilities and exports. For example, Ernst et al. (1998) examines technological capabilities and export success in the elec-tronics and textile industries in several East Asian countries (Republic of Korea, Taiwan Province of China, Thailand, Indonesia, and Viet Nam). It clearly shows that learning, innovation and capabilities accumulation, including product design, production processes, management routines, marketing and the organization of production, are critical to export growth and for expanding developing countries’ market share. Also, there is ample evidence showing that exporters are more productive than non-exporters, and that exporter pro-ductivity premia tend to increase with the share of exports in total sales (World Bank, 2007). Also, there is compelling evidence in favour of self-selection of more productive firms into export markets, but scarce evidence for the learning-by-exporting hypothesis. Furthermore, recent research has also emphasized that firms take the choice of entering or expanding their operations in foreign markets together with decisions on investment, technology adoption, product-mix, R&D and innovation.1 For example, Aw et al. (2011) show that productivity growth for electronic producers in Taiwan evolves endogenously to firm’s decisions to export and invest in R&D. Also, the results show that a firm’s export and R&D decisions affect each other and that both decisions affect productivity growth.
1 Recent advances in the literature on international trade also offer interesting insights to understand the relationship between the weaknesses in global trade and the deceleration in productivity growth in recent years. It shows how trade, investment and technology decisions at firm level interact with each other and affects aggregate productivity growth (Vergara, 2017).
DESA WORKING PAPER NO. 161
4
Despite these long-standing theoretical and empirical contributions, there are many open questions on how productive and technological capabilities influence export performance and dynamics, even more so across developing countries. This paper attempts to shed light on the role of productive and technological capabilities on export dynamics at the microeconomic level using a large sample of developing countries. For example, the average steel exporter in Turkey is 1.5 times larger than the average steel exporter in Mexico, and the initial level of exports of a new steel exporter in Turkey is about 1.6 times larger than in Mexico. Meanwhile, Bang-ladesh exporters of apparel and clothing accessories export to more than 4 destinations on average, while in Pakistan to only 2 destinations. The average Mexican exporter of electrical machinery and equipment exports on average more than 6 different products (at 6-digit of the HS 2002 classification), while Thailand exporters only 4 products. Obviously, these differences are related to the size of the country, level of development, market structure, trade policy and comparative advantages. But what about productive and technological capacities? And across which export margin?
Against this backdrop, this paper tackles the following questions: Do countries with stronger productive capacities have more and larger exporters, and do these exporters charge higher unit prices for their products? Do new exporters in foreign markets display a higher initial level of exports in countries with more productive capacities? Are exporters from countries with higher technological capabilities more diversified in terms of products and destinations? Thus, the goal is to uncover what are the links between capabilities and exporter dynamics in foreign markets. In particular, the paper attempts to connect the issue of capabilities with the extensive and intensive margin of exports (number and size of exporters), diversification across products and destinations, and product quality, all of which have been emphasized as crucial aspects of international competitiveness. In doing this, the empirical strategy controls for other country dimensions that can also be relevant, such as the size of the economy, level of development, trade openness, size of manufacturing sector and commodity dependency.
This paper uses data from the World Bank’s Exporter Dynamics Database, which compiles statistical informa-tion from national sources exporter-level customs data, covering the universe of annual export transactions (Fernandes et al., 2016).2 The database contains exporter-level information for 40 developing countries be-tween 2002 and 2012 aggregated at sectoral level. A key issue is that there is no obvious approach to measure productive and technological capabilities. The concept of capabilities is closely connected to the accumulation of explicit and tacit knowledge, and to how different chunks of knowledge are mixed, combined and used to generate new productive and technological capacities. Thus, the issue of capabilities is multidimensional, encompassing economic, technological and institutional aspects.
The paper uses two proxies of capabilities, one for productive capacities, one for technological capabilities. To measure productive capacities, the empirical approach uses the Economic Complexity Index (ECI) (Hausmann et al., 2011). The ECI measures the multiplicity of productive knowledge in an economy by combining infor-mation on the diversity of a country’s exports (based on the number of its export products) and the ubiquity of its products (based on the number of countries that export a particular product). Thus, the ECI builds upon productive diversification3 and capabilities. As discussed by Mealy et al. (2018) and Kemp-Benedict (2014), the ECI is orthogonal to diversity, and it captures information on what type of products and capabilities
2 Fernandes et al. (2016) initially presented the Exporter Dynamics Database. They analyze how export behaviour is linked to country size and level of development. Interestingly, the paper shows that larger and more developed countries have more and larger exporters, and a greater share of exports controlled by the top 5% of exporters. This database opens a variety of research possibilities to improve the understanding of export dynamics at disaggregated levels.
3 There is ample evidence on the relationship between diversification and economic growth, especially for less developed coun-tries (Cherif, et al., 2018; Al-Marhubi, 2000; Herzer and Nowak-Lehnmann, 2006).

THE ROLE OF PRODUCTIVE TECHNOLOGICAL CAPABILITIES ON EXPORT DYNAMICS IN DEVELOPING COUNTRIES
5
countries are competitive in. Furthermore, the ECI provides a rank ordering of countries in terms of how similar their exports and capabilities are to each other and this ordering helps to explain variations in GDP per capita and future growth (Hidalgo and Hausmann, 2009). This suggest that some type of exports, and thus some type of capabilities, are more relevant to development, a crucial argument of the early development theories4.
Meanwhile, to measure technological capabilities, the empirical approach uses R&D investments as a proxy5. The R&D investments reflect the technological efforts that countries put in place to foster knowledge creation and technological progress. In fact, firm’s R&D activities encourage product and process innovations and en-hance the absorptive capacity to assimilate external knowledge (Griliches, 1979; Cohen and Levinthal, 1990; Griffith et al., 2003). In addition, R&D activities can also convey intangible benefits to overcome barriers to exporting (Harris and Li, 2009; Tecce and Pisano, 1998), and they are also a crucial feature of National Innovation Systems6. In comparison to developed countries, national innovation systems in developing econ-omies are generally characterized by low level of R&D, high participation of public R&D in total R&D ex-penditures, innovation activities concentrated in natural-resources and low-tech activities, low level of human capital and workforce capabilities and lack of interactions among economic agents (Arocena and Sutz, 2005).
The empirical hypotheses are that the ECI and R&D investments are positively correlated with different export dimensions. Intuitively, a higher level of sophistication and a wider variety of productive knowledge embedded in the productive structure should be reflected in the international competitiveness. Thus, a higher ECI could imply a larger number of exporters and higher levels of exports per exporter. Also, the productive knowledge could be reflected in the quality of products, thus a positive correlation with unit prices is also tested7. Similarly, the level of R&D is expected to be positively connected with diversification across products and destinations markets, particularly given the vital role it plays on product and process innovations (Mair-esse and Mohen, 2010).
The contribution of this paper is threefold. First, it presents a comprehensive analysis within developing countries on the role of productive and technological capabilities on export dynamics. While the relevance of technological and innovation capabilities on firms’ export indicators has been documented, comprehensive cross-country comparisons are scarce. Second, the paper uncovers explicit links on how productive and tech-nological capabilities relates to export dynamics. Third, the links between capabilities and exports dynamics
4 For example, Hirschman (1958) and Singer (1950) emphasized that development implied factor reallocations from low-produc-tivity sectors to high productivity sectors. See Hausmann et al. (2007) for a formal empirical validation of the argument. In developing countries, Lall (2000) shows that technologically sophisticated products are more strongly associated with export and income growth.
5 Measuring technological capabilities is a difficult task. On one hand, technological capabilities encompass multifaceted aspects, including the composition of the productive structure, R&D investments, patents, labour skills, among others. On the other, R&D investments is not the only way to acquire new technologies in developing countries, which can materialize through cap-ital goods, technology licenses and foreign direct investment.
6 The concept of National Innovation Systems (NIS) emerged to explain the differences in innovative performances of developed countries. The underlying idea was that innovation differences depended on “institutional differences in the mode of importing, improving, developing and diffusing new technologies, products and processes” and on the level of interactions of different agents and institutions within the society (Freeman, 1995). The NIS approach then became a useful framework to address the complexity of innovation activities as a “systemic process” in developing countries.
7 Using unit prices as a proxy of product quality at sectoral level is a strong simplification. Price dispersions exist due to quality differences and several other reasons, including demand shocks, market power, production costs, among others. However, using unit prices across sectors for a comprehensive set of countries and for a relatively extended period seems to be a plausible approach to reduce its problems as a proxy for product quality. For example, Schott (2004) shows that countries more abundant in physical and human capital export to the United States at higher unit prices, even within narrow categories.
DESA WORKING PAPER NO. 161
6
underline their role not only on developing countries’ resilience to trade shocks, but also on their medi-um-term development prospects. Obviously, the paper also displays several limitations. Most importantly, the empirical analysis and the nature of the data prevents any inference on causality between capabilities and export dynamics. The paper is organised as follows. Section 2 describes the data and some basic statistics, providing an aggregate picture for the empirical analysis. Then, section 3 presents the empirical approach, while Section 4 discusses the main results. Finally, section 5 concludes.
II Data and basic statistics The statistical information regarding export dynamics comes from the Exporter Dynamics Database8. This database compiles export information from national sources exporter-level customs data, covering the uni-verse of annual exporter transactions. The database contains information for 40 developing countries between 2002 and 2012. Thus, it is a country-sector-year database, unevenly distributed across developing countries (see Annex A1). In particular, it comprises aggregated information at sectoral level (2-digit of the Harmonized System 2002 Classification)9 for the number of exporters (total and per product), average value of exports per exporter and per entrant (new exporter in year t), average unit prices per exporter, average number of products per exporter; and the average number of destinations per exporter, among other variables.
As discussed, productive capacities are proxied by the Economic Complexity Index (ECI), from the MIT’s Ob-servatory of Economic Complexity10. The ECI measures the sophistication of a country’s productive structure by combining information on the diversity of country exporting activity and the ubiquity of its products. These dimensions are based on the number of products that a country exports and the number of countries that export a specific product, respectively. The intuition is that more sophisticated economies tend to be more diversified, and they are able to export products that, on average, have low ubiquity. Thus, it encompasses information on the diversification and on what type of capabilities countries are competitive. Meanwhile, technological capabilities are proxied by R&D investments over GDP, data that comes from the World Devel-opment Indicators of the World Bank11. The R&D investments reflect technological efforts. R&D investments is a variable commonly used to measure country’s technological effort to generate, absorb and use knowledge, and it constitutes a crucial input for introducing products and process innovations.
Figure 1 displays a simple correlation plot of the ECI and R&D across developing countries12, with a signif-icant country variation across both dimensions. The ECI ranges from -2.2 to 0.98, with an average of -0.39 and a standard deviation of 0.7013. Meanwhile, R&D investments range from 0 to above 2.0 per cent over GDP, with an average of 0.45 and a standard deviation of 0.3614. As expected, there is a relatively strong and positive correlation between ECI and R&D activities, and countries with more productive knowledge tend to
8 For details about the database, see http://www.worldbank.org/en/research/brief/exporter-dynamics-database.
9 https://unstats.un.org/unsd/tradekb/Knowledgebase/50043/HS-2002-Classification-by-Section
10 See Annex A2 for details about the calculation of the Economic Complexity Index (https://atlas.media.mit.edu/en/.)
11 https://data.worldbank.org/products/wdi.
12 This description covers all developing countries with available information for ECI and R&D investments, not only the 40 developing countries included in the sample estimation. China, for example, is not included in the Exporters Dynamics Data-base. Thus, China is included only in the descriptive statistics (Figure 1 and 2), but not in the econometric estimations (see Annex A.1).
13 For developed countries, the ECI ranges between -0.27 and 2.42, with an average of 1.11 and a standard deviation of 0.60.
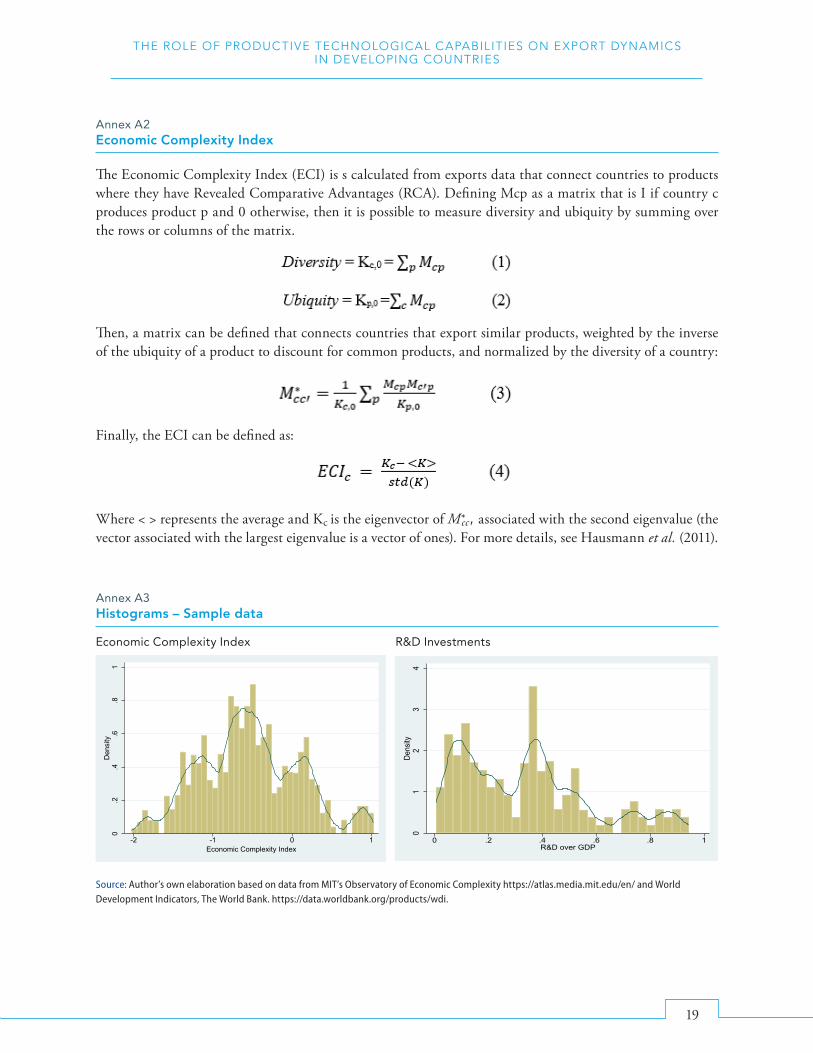
14 Annex A3 displays the histograms of ECI and R&D investments based on the sample estimation data.

THE ROLE OF PRODUCTIVE TECHNOLOGICAL CAPABILITIES ON EXPORT DYNAMICS IN DEVELOPING COUNTRIES
7
exhibit higher technological efforts. China and Malaysia are among those with the highest combinations on productive and technological capabilities, while countries such as Nicaragua and Tajikistan exhibit a relatively deficient performance.
The different combinations along these indicators for specific countries also underscore that the ECI and R&D investments reflect distinct aspects of capabilities. For example, Mexico displays a relatively high ECI as its export structure is diversified, with a relatively large share of medium-high and high-technology products.15 However, technological efforts in the Mexican economy is limited, with relatively low levels of R&D invest-ments, only 0.55% of GDP. This illustrates several weaknesses in its national innovation system, including a low participation of the private sector on R&D activities, lack of interactions and cooperation between private sector and universities, and relatively low level of human capital (Casanova, 2015). By contrast, Kenya exhibit a relatively low level of ECI, with an export structure highly concentrated in a few agricultural products and textiles. However, Kenya has visibly strengthened its efforts to increase R&D investments, to about 0.8% of GDP, particularly by designing comprehensive innovation policy frameworks (Ndemo, 2015).
Figures 2 and 3 display simple correlation plots of ECI and R&D investments with the level of development across developing countries, using GDP per capita as a proxy. As expected, both variables are positively correlated with GDP per capita. The correlation is higher for the ECI (0.49), yet, some countries such as Kuwait and Qatar and some Latin American economies exhibit a low level of productive capacities, despite a relatively high level of GDP per capita. The correlation between R&D and level of development across developing countries is lower, only 0.26. This shows that, while relatively poor countries tend to invest little
15 In Mexico, export products such as automobiles, vehicle parts, trucks, computers and other machinery and equipment products account for more than 60% of total merchandise exports.
Madagascar
TajikistanPhilippines
Nicaragua
MexicoMorocco
Kenya
Malaysia
China
y = 0.26x + 0.55
-0.5
0.5
1.5
2.5
-2.5 -1.5 -0.5 0.5 1.5
R&D
ove
r GD
P
Economic Complexity Index
Figure 1Economic complexity and R&D investments, 2015
Source: Author’s own elaboration based on data from the WDI and MIT Observatory on Economic Complexity.

DESA WORKING PAPER NO. 161
8
Figure 2Economic complexity index and GDP per capita, 2015
Figure 3R&D investments and GDP per capita, 2015
Source: Author’s own elaboration based on data from World Development Indicators, World Bank, and the MIT’s Observatory of Economic Complexity https://atlas.media.mit.edu/en/
Source: Author’s own elaboration based on data from World Development Indicators, World Bank. R&D data is for 2015 or latest available information.
Mali
Ethiopia
Guinea
Chile Kuwait Qatar
Thailand
MalaysiaMexico
-2.0
-1.5
-1.0
-0.5
0.0
0.5
1.0
1.5
5.0 6.0 7.0 8.0 9.0 10.0 11.0 12.0
Econ
omic
Com
plex
ity
GDP per capita (in logs)
MadagascarKyrgyzstan
Colombia KuwaitMozambique Chile
Brazil
Malaysia
China
0.0
0.5
1.0
1.5
2.0
2.5
5.0 6.0 7.0 8.0 9.0 10.0 11.0 12.0
R&D
ove
r GD
P
GDP per capita (in logs)
THE ROLE OF PRODUCTIVE TECHNOLOGICAL CAPABILITIES ON EXPORT DYNAMICS IN DEVELOPING COUNTRIES
9
in R&D as a norm, there are also a variety of country specific circumstances16. For example, countries such as Chile, Colombia and some Arab States of the Persian Gulf display a relatively high GDP per capita, but underperform regarding R&D investments.
III Empirical approachThis section describes the empirical strategy to analyse the role of productive and technological capabilities on the different export dynamics dimensions. The approach closely follows the one taken by Fernandes et al. (2016). To analyse the role of productive capacities on different export dimensions, I specify the following equation:
Export dimensionsijt= αi+ δt+ θECIjt+βXjt+εijt (1)
where i, j, and t represent sectors, countries and years, respectively. There are several dependent variables: i) Number of exporters (log of the total number of exporters), ii) Number of exporters per product (log of the average number of exporters per product - products defined at 6-digit of the HS 2002 classification); iii) Exports per exporter (log of the average exports per exporter); iv) Exports per entrant (log of the average exports per entrant, which is a new exporter in year t), and v) Unit prices (log of the average export value over quan-tity). The variable ECI corresponds to the Economic Complexity Index and the vector X encompasses several control variables: GDP is the log of GDP in constant US dollars; GDP per capita is the log of GDP per capita in constant US dollars; Trade over GDP is total merchandise exports and imports over GDP; Manufacturing sector correspond to the share of the manufacturing sector in the economy; and Commodity-Dependent is a dummy variable that takes the value 1 if the country is a commodity dependent economy17. Finally, αi and δt correspond to sectoral and year effects. The equation (1) is estimated by Ordinary Least Squares (OLS), using robust standard errors adjusted by “clustering” at country level.
Similarly, the equation to investigate the role of technological capabilities –using as proxy R&D investments- on diversification across products and destinations is the following:
Diversification dimensionijt= αi + δt+ θR&Djt+γR&Djt * HighTechijt+ βXjt+εijt (2)
where i, j, and t represent sectors, countries and years, respectively. The dependent variables are i) Products per exporter (log of the average number of products per exporter – products defined at 6-digit of the HS 2002 clas-sification); and ii) Destination per exporter (log of the average number of destination countries per exporter). R&D corresponds to aggregate R&D investments over GDP. Similarly, GDP, GDP per capita, Manufacturing sector and Commodity-Dependent are control variables. This approach includes a multiplicative variable of R&D and HighTech, which is a dummy variable that takes the value 1 if the sector is R&D intensive18.
16 There is large literature that attempt to explain why poor countries invest too little on R&D. Cirera and Maloney (2017) argue that the main reason is the scarcity of complementary factors to innovation, including physical and human capital, credit mar-kets and managerial quality, among others.
17 There are 22 commodity-dependent economies in the estimation sample: Cameroon, Chile, Colombia, Ecuador, Ethiopia, Gabon, Guatemala, Guinea, Kenya, Kuwait, Kyrgyzstan, Lao People’s Dem. Rep., Madagascar, Malawi, Mali, Paraguay, Peru, Senegal, Uganda, Uruguay, Yemen and Zambia (UNCTAD, 2017).
18 High-technology sectors are defined following the definition of Medium and High technology manufacturing products (Lall, 2000). See Annex A4 for the list of high technology sectors (“sections” at the 2-digit HS classification).
DESA WORKING PAPER NO. 161
10
Including this multiplicative variable allows us to test for a heterogeneous relation between R&D and export dynamics across different sectors. In fact, it has been widely discussed that technical progress does not occur evenly across sectors, and some sectors are more innovative and stimulate technological diffusion more than others (Pavitt, 1984). An illustration of this is that R&D investments do not distribute homogenously across sectors, and sectors such as electronics, machinery and pharmaceuticals concentrate the bulk of technological efforts. Again, equation (2) is estimated by Ordinary Least Squares (OLS), using robust standard errors adjusted by “clustering” at country level.
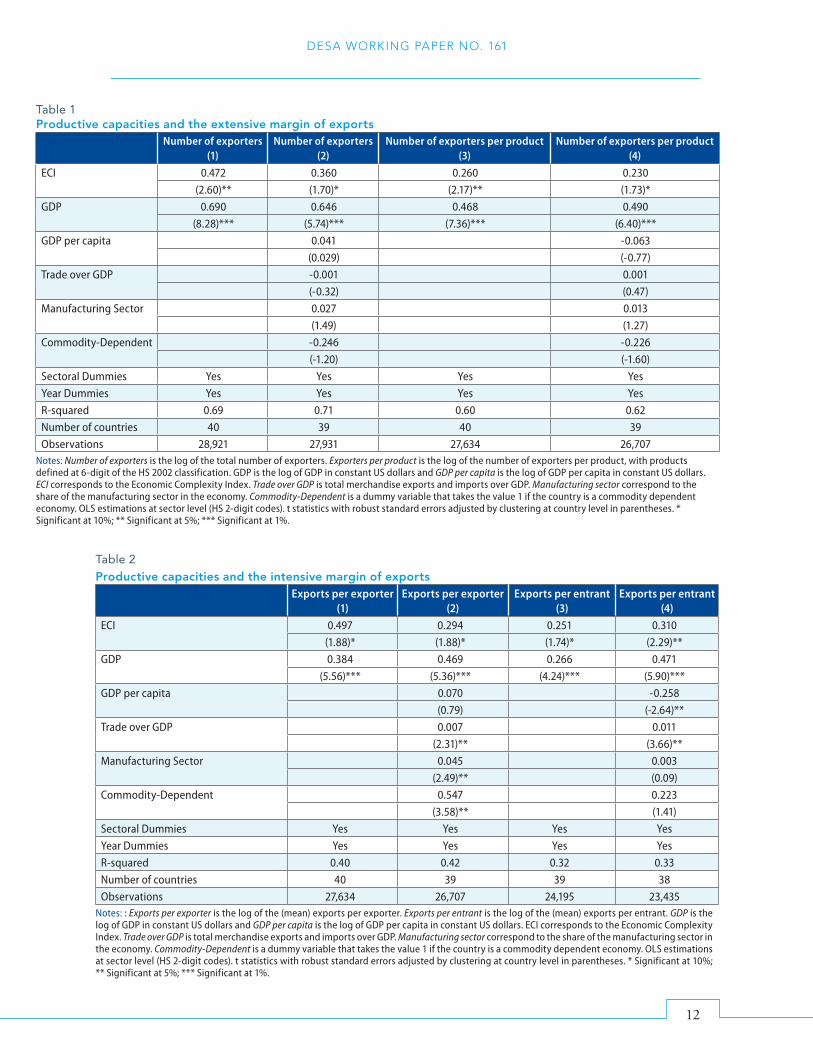
IV Regression resultsTable 1 presents the estimation results regarding the number of exporters, total and per product. Columns (1) and (3) provide the baseline estimations, including only ECI and the level of GDP as explanatory variables, while column (2) and (4) include the whole set of control variables. All regressions include sectoral and year fixed effects. The coefficients associated to ECI are significant at 5% in the baseline regressions for the total number of exporters and for the number of exporters per product. Likewise, when including all the control variables in column (2) and (4), ECI remains significant, at 10%, in both cases. This suggest that within sec-tors, countries with stronger productive capacities have more exporters, total and per product. The regressions also show that the size of the economy is positively associated with the number of exporters, which confirms previous results obtained by Fernandes et al. (2016). Thus, productive capacities tend to be positively correlat-ed with the extensive margin of exports across a relatively large sample of developing countries.
Table 2 displays the estimation results regarding the level of exports per exporter and the level of export per new entrant in foreign markets. Again, column (1) and 3) provides the baseline regressions, while columns (2) and (4) presents the regression with the full set of control variables. In the case of exports per exporter, the coefficient associated to ECI is positive and significant, at 10% in the baseline and at 10% with all the control variables. Among the other variables, the results show that the size of the economy, the relevance of the manufacturing sector and trade openness are positively correlated with the level of exports per exporter. In addition, commodity-dependent economies tend to have a higher level of exports per exporter, due to the importance of sectors based on natural resources. In facts, these sectors tend to be capital intensive and dom-inated by only a few but very large exporters. For the case of exports per entrant, the coefficients associated to ECI are positive and significant in the two regressions. Thus, within sectors, new exporters from countries with more productive capacities tend to have higher levels of exports, even when controlling for other relevant variables. Altogether, this suggests that there is clear-cut correlation between productive capacities and the intensive margin of exports across developing countries.
Interestingly, column (4) of Table 2 also shows that the level of development, proxied by GDP per capita, is negatively associated with the average level of export per entrant. Thus, it suggests that the initial levels of exports for new exporters is larger in countries with lower levels of development. While it might seem coun-terintuitive, this is consistent with the literature of trade costs and barriers to trade, which clearly underscore that trade costs decrease as per capita income increases (Arvis et al., 2012). Thus, new exporters in poorer countries confronts much higher trade costs than a new exporter in a more developed and globally integrated economy. As a result, new exporters then need to start their exporting activity with a relatively larger volume of exports to confront higher trade costs.
THE ROLE OF PRODUCTIVE TECHNOLOGICAL CAPABILITIES ON EXPORT DYNAMICS IN DEVELOPING COUNTRIES
11
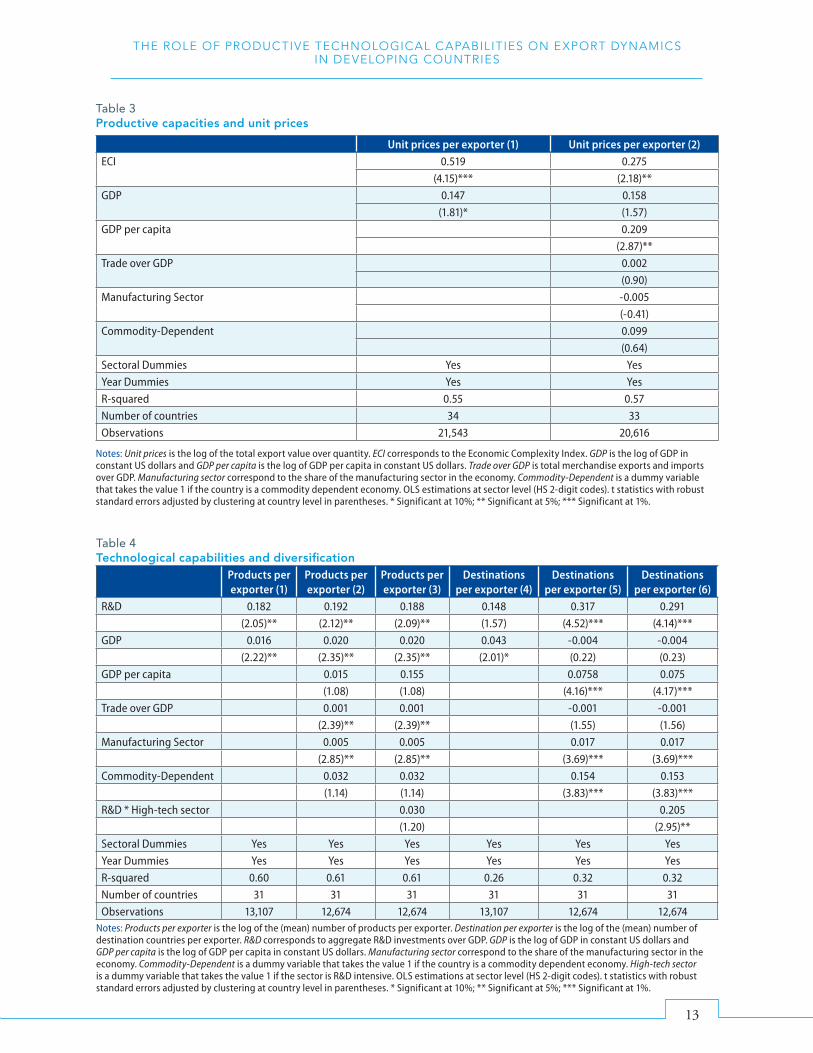
Meanwhile, the regression results regarding unit prices per exporter are presented in Table 3. GDP per capita and the ECI are the only variables that display a significant correlation with unit prices. Thus, exporters from countries with higher levels of development and productive capacities tend to have higher average unit prices for their products, in the comparison across sectors. I interpret this result as a strong indication that, within sectors, productive capacities are positively correlated with product quality across developing countries. In fact, while unit price dispersions exist due to a multiplicity of factors –such as demand shocks, market power or others-, the significant role play by productive capacities for such a comprehensive sample of countries and for an extended period of time is a solid indication that the main driver for these unit prices differences (in levels) is product quality.
Finally, Table 4 displays the regression results for the role of R&D investments on exporter’s diversification across products and destinations. Note that in these estimations the number of countries considered are lower, only 31, due to the lesser availability of R&D data for some countries. Column (1) presents the baseline regression when using products per exporter as a dependent variable. Then, columns (2) and (3) sequentially add the control variables and the multiplicative variable R&D*High-Tech. The estimated coefficients associated to R&D investments are stable and suggest a positive and significant correlation with the number of products per exporter. Thus, exporters in countries with higher level of R&D investments export a larger number of products, at 6-digit of the HS classification, to foreign markets. Meanwhile, the size of the economy, the trade openness and the size of the manufacturing sector are also positively correlated with product diversification, which are, a priori, intuitive results. Interestingly, the multiplicative variable R&D*High-tech is not signifi-cant, showing there are no heterogeneous effects for high-technology sectors.
Columns (4), (5) and (6) of Table 4 displays the regression for the number of destinations per exporter. When including all the control variables, the result shows that R&D investment is positively correlated with diversification across destinations, together with level of development, the size of manufacturing sector and the dummy for commodity-dependent economies. Thus, within sectors, exporters from countries with higher R&D tend to export their products to a larger number of destinations. Interestingly, the variable R&D*HighTech is positive and significant at 5%. This suggests that there is an additional correlation between R&D investments and the number of destinations per exporter in high-technology sectors. Thus, the higher the level of R&D, the larger the number of (average) destinations per exporter in high technology sectors. This result is consistent with a growing literature emphasizing the relationship between R&D activities and export diversification, with a causality that could run in both directions19.
In order to analyse the sensitivity of the results, several robustness checks are implemented. A key aspect to consider is to what extent the empirical results regarding productive and technological capabilities could be driven by the estimation sample. In fact, the estimation sample is not balanced across countries, and some countries are observed in the database for longer periods of time. To address this issue, I follow a twofold strategy. First, the equations are estimated using a restricted sample with the same number of observations per country. Thus, the “additional” observations for some countries, in comparison to countries with fewer
19 For example, Baum (2015) examines the endogenous relationship between diversification and R&D activities in UK firms. The results suggest that geographical sales diversification induces UK firms to increase R&D expenditures. Also, the results imply that R&D expenditures cause higher export sales but do not cause export sales diversification. Meanwhile, Wagner (2017) in-vestigates the links between innovation and R&D activities and diversification in manufacturing firms in Germany. The results confirm that more innovative firms outperform less innovative firms in the number of products and destinations.
DESA WORKING PAPER NO. 161
12
Table 1Productive capacities and the extensive margin of exports
Number of exporters(1)
Number of exporters(2)
Number of exporters per product(3)
Number of exporters per product(4)
ECI 0.472 0.360 0.260 0.230
(2.60)** (1.70)* (2.17)** (1.73)*
GDP 0.690 0.646 0.468 0.490
(8.28)*** (5.74)*** (7.36)*** (6.40)***
GDP per capita 0.041 -0.063
(0.029) (-0.77)
Trade over GDP -0.001 0.001
(-0.32) (0.47)
Manufacturing Sector 0.027 0.013
(1.49) (1.27)
Commodity-Dependent -0.246 -0.226
(-1.20) (-1.60)
Sectoral Dummies Yes Yes Yes Yes
Year Dummies Yes Yes Yes Yes
R-squared 0.69 0.71 0.60 0.62
Number of countries 40 39 40 39
Observations 28,921 27,931 27,634 26,707Notes: Number of exporters is the log of the total number of exporters. Exporters per product is the log of the number of exporters per product, with products defined at 6-digit of the HS 2002 classification. GDP is the log of GDP in constant US dollars and GDP per capita is the log of GDP per capita in constant US dollars. ECI corresponds to the Economic Complexity Index. Trade over GDP is total merchandise exports and imports over GDP. Manufacturing sector correspond to the share of the manufacturing sector in the economy. Commodity-Dependent is a dummy variable that takes the value 1 if the country is a commodity dependent economy. OLS estimations at sector level (HS 2-digit codes). t statistics with robust standard errors adjusted by clustering at country level in parentheses. * Significant at 10%; ** Significant at 5%; *** Significant at 1%.
Table 2Productive capacities and the intensive margin of exports
Exports per exporter(1)
Exports per exporter(2)
Exports per entrant (3)
Exports per entrant (4)
ECI 0.497 0.294 0.251 0.310
(1.88)* (1.88)* (1.74)* (2.29)**
GDP 0.384 0.469 0.266 0.471
(5.56)*** (5.36)*** (4.24)*** (5.90)***
GDP per capita 0.070 -0.258
(0.79) (-2.64)**
Trade over GDP 0.007 0.011
(2.31)** (3.66)**
Manufacturing Sector 0.045 0.003
(2.49)** (0.09)
Commodity-Dependent 0.547 0.223
(3.58)** (1.41)
Sectoral Dummies Yes Yes Yes Yes
Year Dummies Yes Yes Yes Yes
R-squared 0.40 0.42 0.32 0.33
Number of countries 40 39 39 38
Observations 27,634 26,707 24,195 23,435Notes: : Exports per exporter is the log of the (mean) exports per exporter. Exports per entrant is the log of the (mean) exports per entrant. GDP is the log of GDP in constant US dollars and GDP per capita is the log of GDP per capita in constant US dollars. ECI corresponds to the Economic Complexity Index. Trade over GDP is total merchandise exports and imports over GDP. Manufacturing sector correspond to the share of the manufacturing sector in the economy. Commodity-Dependent is a dummy variable that takes the value 1 if the country is a commodity dependent economy. OLS estimations at sector level (HS 2-digit codes). t statistics with robust standard errors adjusted by clustering at country level in parentheses. * Significant at 10%; ** Significant at 5%; *** Significant at 1%.
THE ROLE OF PRODUCTIVE TECHNOLOGICAL CAPABILITIES ON EXPORT DYNAMICS IN DEVELOPING COUNTRIES
13
Table 3Productive capacities and unit prices
Unit prices per exporter (1) Unit prices per exporter (2)ECI 0.519 0.275
(4.15)*** (2.18)**
GDP 0.147 0.158
(1.81)* (1.57)
GDP per capita 0.209
(2.87)**
Trade over GDP 0.002
(0.90)
Manufacturing Sector -0.005
(-0.41)
Commodity-Dependent 0.099
(0.64)
Sectoral Dummies Yes Yes
Year Dummies Yes Yes
R-squared 0.55 0.57
Number of countries 34 33
Observations 21,543 20,616
Notes: Unit prices is the log of the total export value over quantity. ECI corresponds to the Economic Complexity Index. GDP is the log of GDP in constant US dollars and GDP per capita is the log of GDP per capita in constant US dollars. Trade over GDP is total merchandise exports and imports over GDP. Manufacturing sector correspond to the share of the manufacturing sector in the economy. Commodity-Dependent is a dummy variable that takes the value 1 if the country is a commodity dependent economy. OLS estimations at sector level (HS 2-digit codes). t statistics with robust standard errors adjusted by clustering at country level in parentheses. * Significant at 10%; ** Significant at 5%; *** Significant at 1%.
Table 4Technological capabilities and diversification
Products per exporter (1)
Products per exporter (2)
Products per exporter (3)
Destinations per exporter (4)
Destinations per exporter (5)
Destinations per exporter (6)
R&D 0.182 0.192 0.188 0.148 0.317 0.291
(2.05)** (2.12)** (2.09)** (1.57) (4.52)*** (4.14)***
GDP 0.016 0.020 0.020 0.043 -0.004 -0.004
(2.22)** (2.35)** (2.35)** (2.01)* (0.22) (0.23)
GDP per capita 0.015 0.155 0.0758 0.075
(1.08) (1.08) (4.16)*** (4.17)***
Trade over GDP 0.001 0.001 -0.001 -0.001
(2.39)** (2.39)** (1.55) (1.56)
Manufacturing Sector 0.005 0.005 0.017 0.017
(2.85)** (2.85)** (3.69)*** (3.69)***
Commodity-Dependent 0.032 0.032 0.154 0.153
(1.14) (1.14) (3.83)*** (3.83)***
R&D * High-tech sector 0.030 0.205
(1.20) (2.95)**
Sectoral Dummies Yes Yes Yes Yes Yes Yes
Year Dummies Yes Yes Yes Yes Yes Yes
R-squared 0.60 0.61 0.61 0.26 0.32 0.32
Number of countries 31 31 31 31 31 31
Observations 13,107 12,674 12,674 13,107 12,674 12,674Notes: Products per exporter is the log of the (mean) number of products per exporter. Destination per exporter is the log of the (mean) number of destination countries per exporter. R&D corresponds to aggregate R&D investments over GDP. GDP is the log of GDP in constant US dollars and GDP per capita is the log of GDP per capita in constant US dollars. Manufacturing sector correspond to the share of the manufacturing sector in the economy. Commodity-Dependent is a dummy variable that takes the value 1 if the country is a commodity dependent economy. High-tech sector is a dummy variable that takes the value 1 if the sector is R&D intensive. OLS estimations at sector level (HS 2-digit codes). t statistics with robust standard errors adjusted by clustering at country level in parentheses. * Significant at 10%; ** Significant at 5%; *** Significant at 1%.
DESA WORKING PAPER NO. 161
14
observations, are left out from the estimation sample. Second, the estimations are implemented on a second restricted sample, where countries have, at least, 500 observations. With this approach, countries with fewer observations are left out from the estimation sample, approximately 20% of the full sample. Finally, the equations are estimated by correcting for the issue that some sectors have zero exports –in fact, not all coun-tries export in every sector. Correcting this issue expands the database by approximately 5%. Despite some variations, the robustness checks, particularly the results regarding productive and technological capabilities, confirm the main conclusions20.
V Concluding Remarks The accumulation of productive and technological capabilities is a major driver of economic growth, struc-tural change and development. This paper examines their role on export dynamics at microeconomic level in a large sample of developing countries. The results indicate that productive capabilities, proxied by the Economic Complexity Index, are positively correlated with the intensive and the extensive margins of exports and product quality. The results also confirm that technological capabilities, proxied by R&D investments, are strongly linked to firms’ diversification across products and destinations, especially in high-technology sectors. In short, within similar sectors, developing countries with higher productive and technological capa-bilities have more exporters; and the exporters are larger, more diversified and charge higher unit prices for their products.
These findings are important for several reasons. First, they explicitly and empirically underscore the relevance of asymmetries of productive and technological capabilities across developing countries, a crucial issue em-phasized by the structuralist tradition. So far, most of the aggregate literature have compared technological capabilities between developing and developed countries. As expected, these studies demonstrate that capa-bilities are a major determinant of productivity, export and growth. This paper shows that capabilities matter even when comparing export dynamics only among developing countries. Second, the results illustrate how the accumulation of productive and technological capabilities play a role on developing countries’ insertion in international markets through different channels. These results are consistent with the ‘Kaldorian’ view that the creation and the development of productive capacities for exporting activity are prior to the effect that “incentives”, such as trade liberalization reforms, might have on exports.
Therefore, the paper underlines the role of capabilities not only on developing countries’ macroeconomic resil-ience to trade shocks -a major risk in the current international environment-, but also on their medium-term development prospects. In fact, the accumulation of capabilities is reflected in product and market diversifica-tion, a key factor to navigate international trade shocks. In addition, productive and technological capabilities are mirrored in the extensive and intensive margin of trade and on product quality, which are relevant aspects of international competitiveness and on how countries adjust to changing demand patterns. Thus, these links emphasize different aspects of how the micro-macro interactions drive development trajectories under a different setup of capabilities. Finally, the paper implicitly suggest that productive and technological capabi-lities should also be a major dimension to understand and evaluate the consequences and dynamics from the changing global trade environment.
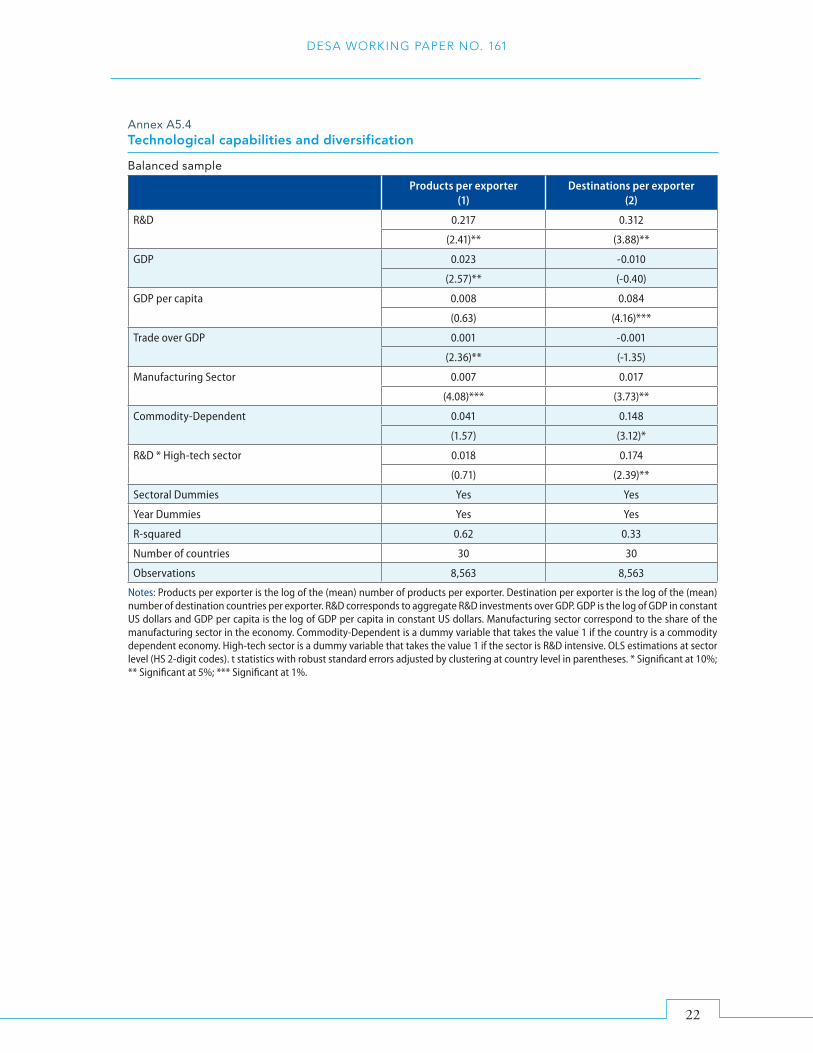
20 The Annex tables A5.1-A5.4. display the regressions for the robustness checks using a balanced number of observations across countries (“balance sample”). The other robustness checks are available upon request.

THE ROLE OF PRODUCTIVE TECHNOLOGICAL CAPABILITIES ON EXPORT DYNAMICS IN DEVELOPING COUNTRIES
15
REFERENCES
Aghion, Phillipe and Peter Howitt (1998). Endogenous Growth Theory, MIT Press, Cambridge, M.A.
Al-Marhubi, Fahim (2010). “Export diversification and growth: an empirical investigation”, Applied economics letters, 7(9):559–562.
Arocena, Rodrigo and Judith Sutz (2005). “Innovation Systems and Developing Countries”, Working Paper No. 02-05, Danish Research Unit for Industrial Dynamics, DRUID.
Arvis, Jean-François, Duval, Yann, Shepherd, Ben and Chorthip Utoktham (2012). “Trade Costs in the Developing World: 1995 – 2010”, ARTNeT Working Paper Series, No. 121/December 2012
Aw, Bee Yan, Mark J. Roberts and Daniel Yi Xu (2011). “R&D Investment, Exporting, and Productivity Dynamics”, American Economic Review, Vol. 101, No. 4, pp. 1312–44.
Baum, Christopher F., Caglayan, Mustafa and Oleksandr Talavera (2015). “R&D Expenditures and Geographical Sales Diversification”, The Manchester School, Vol. 84, Issue 2, pp. 197-221.
Casanova, Lourdes and Samantha Rullan (2015). “A review of the Mexican national innovation system”, International Journal of Business and Economic Sciences Applied Research, 8(3), pp.59-68.
Cherif, Reda, Hasanov, Fuad and Lichen Wang (2018). “Sharp Instrument: A Stab at Identifying the Causes of Economic Growth”, IMF Working Paper WP/18/117, May.
Cirera, Xavier and William F. Maloney (2017). The Innovation Paradox: Developing-Country Capabilities and the Unrealized Promise of Technological Catch-Up. Washington, DC: World Bank.
Cimoli, Mario, Dosi, Giovanni and Joseph Stiglitz (2009). “The Political Economy Capabilities Accumulation: The Past and Future of Policies for Industrial Policies”, in Industrial Policy and Development: The Political Economy of Capabilities Accumulation, Mario Cimoli, Giovanni Dosi and Joseph E. Stiglitz (Eds.), Oxford University Press, 2009.
Cimoli, Mario, Porcile, Gabriel, Primi, Annalisa, and Sebastian Vergara (2005). “Cambio Estructural heterogeneidad Productiva y Tecnología en América Latina”, in Heterogeneidad estructural, asimetrías tecnológicas y crecimiento en América Latina, M. Cimoli (Ed.), CEPAL and BID, Santiago de Chile.
Cohen, Wesley M. and Daniel A. Levinthal (1990). “Absorptive capacity: A new perspective on learning and innova-tion”, Administrative Science Quarterly 35, 128–152.
Dosi, Giovanni, Pavitt, Keith and Luc Soete (1990). The Economic of Technical Change and International Trade, London and New York, Harvester/Wheatsheaf Press.
Earnst, Dieter, Ganiatsos, Tom and Lynn Mytelka (1998). Technological Capabilities and Export Success in Asia, Routledge Studies in the Growth Economies of Asia, Routledge, 1998
Fernandes, Ana M., Freund, Caroline and Martha Denisse Pierola (2016). “Export Behavior, Country Size and Stage of Development: Evidence from the Exporter Dynamics Database”. Journal of Development Economics 119, pp.121-137.
Freeman, Chris (1995). “The ‘national system of innovation’ in historical perspective”, Cambridge Journal of Economics 19 5-24.
Griffith, Rachel, Redding, Stephen and John Van Reenen (2003). “R&D and Absorptive Capacity: Theory and Empirical Evidence”, Scandinavian Journal of Economics 105(1), 99-118.

DESA WORKING PAPER NO. 161
16
Griliches, Zvi (1979). “Issues in Assessing the Contribution of Research and Development to Productivity Growth”, Bell Journal of Economics, 10(1):92-116.
Harris, Richard and Quian Cher Li (2009). “Exporting, R&D, and absorptive capacity in UK establishments”, Oxford Economic Papers 61(1), 74–103.
Hausmann, Ricardo, Hidalgo, César A., Bustos, Sebastián, Coscia, Michele, Chung, Sarah, Jimenez, Juan, Simoes, Alexander and Muhammed A. Yıldırım (2011). The Atlas of Economic Complexity. Mapping the path to Prosperity. Center for International Development at Harvard University and MIT Media Lab, Massachusetts Institute of Technology.
Hausmann, Ricardo, Hwang, Jason and Dani Rodrik (2007). “What you export matters”. Journal of Economic Growth, 12(1):1–25.
Herzer, Dierk and Felicitas Nowak-Lehnmann (2006). “What does export diversification do for growth? an econo-metric analysis”, Applied economics, 38(15):1825–1838, 2006.
Hidalgo, Cesar and Ricardo Hausmann (2009). “The building blocks of economic complexity”. Proceedings of the National Academy of Sciences, 106(26), 10570–10575.
Hirschman, Albert O. (1958). The Strategy of Economic Development (Vol. 10) New Haven: Yale Univ. Press.
Kemp-Benedict, Eric (2014). “An interpretation and critique of the Method of Reflections”, MPRA Working Paper No. 60705, 18 December.
Lall, Sanjaya (2000). “The technological structure and performance of developing country manufactured exports, 1985-98”. Oxford development studies, 28(3):337–369, 2000.
Mairesse, Jacques and Pierre Mohnen (2010). “Using innovation surveys for econometric analysis”. In B. H. Hall and N. Rosenberg (editors), Handbook of the Economics of Innovation, Elsevier, Amsterdam, 2010, 1130-1155.
Mealy, Penny, Farmer, J. Doyne and Alexander Teytelboym (2018). “A new Interpretation of the Economic Complexi-ty Index”, INET Oxford Working Paper No.2018-04.
Ndemo, Bitange (2015). “Effective Innovation Policies for Development: The Case of Kenya”, The Global Innovation Index, Chapter 9, Cornell University, INSEAD and the World Intellectual Property Organization (WIPO).
Pavitt, Keith (1984). “Sectoral patterns of technical change: towards a taxonomy and a theory”, Research Policy, vol. 13, pp.343-373.
Posner, Michael V. (1961). “International trade and technological change”, Oxford Economic Paper, vol.13.
Prebisch, R. (1950). The Economic Development of Latin America and its Principal Problems, Nueva York, United Nations.
Romer, Paul M. (1990). “Endogenous Technological Change”, Journal of Political Economy 98, S71-S102.
Schumpeter, Joseph. (1942). Capitalism, Socialism & Democracy. Routledge, London and New York.
Singer, Hans W. (1950). “The distribution of gains between investing and borrowing countries”, American Economic Review, 40(2), 473–485.
Schott, Peter. (2004). “Across-Product versus Within-Product Specialization in International Trade”. Quarterly Journal of Economics, 119(2): 647-678.
Teece, David and Gary Pisano (1998). “The dynamic capabilities of firms: An introduction”, in G. Dosi, T. D.J. & C. J., Eds, Technology, Organisation, and Competitiveness: Perspectives on Industrial and Corporate Change, Oxford University Press, pp. 17–66.
THE ROLE OF PRODUCTIVE TECHNOLOGICAL CAPABILITIES ON EXPORT DYNAMICS IN DEVELOPING COUNTRIES
17
United Nations Conference on Trade and Development (UNCTAD) (2017). The State of Commodity Dependence 2016. Special Unit on Commodities. UNCTAD/SUC/2017/2.
Vergara, Sebastian (2017). “The Slowdown in Productivity Growth: A View from International Trade”. Development Issues No. 11, Development Policy and Analysis Division, Department of Economic and Social Affairs, United Nations.
Wagner, Joachim (2017). “R&D Activities and Extensive Margins of Exports in Manufacturing Enterprises: First Evidence for Germany”, The International Trade Journal, Volume 31, 2017 - Issue 3.
World Bank (2007). “Exports and Productivity – Comparable Evidence for 14 Countries Policy”, Research Working Paper 4418, The International Study Group on Exports and Productivity.

DESA WORKING PAPER NO. 161
18
Annex A1Database – Distribution of observations across countries
Country Frequency Per cent Cum.
Albania 834 3.00 3.00
Bangladesh 756 2.72 5.72
Botswana 939 3.38 9.10
Cambodia 569 2.05 11.15
Cameroon 893 3.21 14.36
Chile 950 3.42 17.78
Colombia 570 2.05 19.83
Costa Rica 934 3.36 23.19
Dominican Republic 925 3.33 26.52
Ecuador 931 3.35 29.87
El Salvador 665 2.39 32.26
Ethiopia 422 1.52 33.78
Gabon 80 0.29 34.07
Georgia 926 3.33 37.04
Guatemala 760 2.73 40.14
Guinea 280 1.01 41.14
Jordan 896 3.22 44.37
Kenya 665 2.39 46.76
Kuwait 188 0.68 47.44
Kyrgyzstan 654 2.35 49.79
Lao People's Dem. Rep. 377 1.36 51.15
Lebanon 475 1.71 52.86
Madagascar 559 2.01 54.87
Malawi 613 2.21 57.07
Mali 336 1.21 58.28
Mauritius 944 3.4 61.68
Mexico 950 3.42 65.10
Morocco 950 3.42 68.51
Nicaragua 912 3.28 71.80
Pakistan 760 2.73 74.53
Paraguay 473 1.70 76.23
Peru 950 3.42 79.65
Senegal 904 3.25 82.90
South Africa 948 3.41 86.32
Thailand 95 0.34 86.66
Turkey 950 3.42 90.08
Uganda 587 2.11 92.19
Uruguay 930 3.35 95.53
Yemen 397 1.43 96.96
Zambia 844 3.04 100.00
Source: Author’s own elaboration based on Exporter Dynamics Database. http://www.worldbank.org/en/research/brief/exporter-dynamics-database.
THE ROLE OF PRODUCTIVE TECHNOLOGICAL CAPABILITIES ON EXPORT DYNAMICS IN DEVELOPING COUNTRIES
19
Annex A2Economic Complexity Index
The Economic Complexity Index (ECI) is s calculated from exports data that connect countries to products where they have Revealed Comparative Advantages (RCA). Defining Mcp as a matrix that is I if country c produces product p and 0 otherwise, then it is possible to measure diversity and ubiquity by summing over the rows or columns of the matrix.
Then, a matrix can be defined that connects countries that export similar products, weighted by the inverse of the ubiquity of a product to discount for common products, and normalized by the diversity of a country:
Finally, the ECI can be defined as:
Where < > represents the average and Kc is the eigenvector of M*cc' associated with the second eigenvalue (the vector associated with the largest eigenvalue is a vector of ones). For more details, see Hausmann et al. (2011).
Annex A3Histograms – Sample data
Economic Complexity Index R&D Investments
Source: Author’s own elaboration based on data from MIT’s Observatory of Economic Complexity https://atlas.media.mit.edu/en/ and World Development Indicators, The World Bank. https://data.worldbank.org/products/wdi.
01
23
4De
nsity
0 .2 .4 .6 .8 1R&D over GDP
0.2
.4.6
.81
Den
sity
-2 -1 0 1Economic Complexity Index

DESA WORKING PAPER NO. 161
20
Annex A5.1Productive capacities and the extensive margin of exports
Balanced sample
Number of exporters(1)
Number of exporters per product(2)
ECI 0.478 0.285
(2.12)** (2.06)**
GDP 0.632 0.480
(5.11)*** (5.61)***
GDP per capita 0.017 -0.078
(0.12) (-0.93)
Trade over GDP -0.002 0.000
(-0.42) (0.28)
Manufacturing Sector 0.018 0.005
(0.78) (0.43)
Commodity-Dependent -0.160 -0.184
(-0.73) (-1.26)
Sectoral Dummies Yes Yes
Year Dummies Yes Yes
R-squared 0.70 0.61
Number of countries 38 38
Observations 12,122 11,525
Notes: Number of exporters is the log of the number of exporters. Number of exporters per product is the log of the number of exporters per product. GDP is the log of GDP in constant US dollars and GDP per capita is the log of GDP per capita in constant US dollars. ECI corresponds to the Economic Complexity Index. Trade over GDP is total merchandise exports and imports over GDP. Manufacturing sector correspond to the share of the manufacturing sector in the economy. Commodity-Dependent is a dummy variable that takes the value 1 if the country is a commodity de-pendent economy. OLS estimations at sector level (HS 2-digit codes), using a balanced estimation sample. t statistics with robust standard errors adjusted by clustering at country level in parentheses. * Significant at 10%; ** Significant at 5%; *** Significant at 1%.
Annex A4High technology sectors at 2-digit HS 2002 Classification
Section Description
30 Pharmaceutical products
37 Photographic or cinematographic goods.
84 Nuclear reactors, boilers, machinery and mechanical appliances; parts thereof
85 Electrical machinery & equipment; sound recorders/reproducers, televisions, parts & accessories
86 Railway or tramway locomotives, mechanical and electro-mechanical traffic signalling equipment.
87 Vehicles other than railway or tramway rolling-stock, and parts and accessories thereof.
88 Aircraft, spacecraft, and parts thereof.
89 Ships, boats and floating structures.
90 Optical, precision, medical or surgical instruments and apparatus; parts & accessories
91 Clocks and watches and parts thereof.
92 Musical instruments; parts and accessories of such articles.
93 Arms and ammunition; parts and accessories thereof.
Source: Author’s own elaboration using the 2-digit HS 2002 classification, based on Lall (2000). https://unstats.un.org/unsd/tradekb/Knowledgebase/50043/HS-2002-Classification-by-Section

THE ROLE OF PRODUCTIVE TECHNOLOGICAL CAPABILITIES ON EXPORT DYNAMICS IN DEVELOPING COUNTRIES
21
Annex A5.2Productive capacities and the intensive margin of exports
Balanced sample
Exports per exporter(1)
Exports per entrant (2)
ECI 0.228 0.271
(1.56) (1.78)*
GDP 0.482 0.481
(5.44)*** (6.43)***
GDP per capita 0.060 -0.251
(0.70) (-2.64)**
Trade over GDP 0.008 0.012
(2.81)** (4.25)***
Manufacturing Sector 0.055 -0.004
(3.09)** (-0.21)
Commodity-Dependent 0.503 0.149
(3.38)** (1.02)
Sectoral Dummies Yes Yes
Year Dummies Yes Yes
R-squared 0.42 0.32
Number of countries 38 38
Observations 11,525 10,293
Notes: Exports per exporter is the log of the (mean) exports per exporter. Exports per entrant is the log of the (mean) exports per entrant. GDP is the log of GDP in constant US dollars and GDP per capita is the log of GDP per capita in constant US dollars. ECI corresponds to the Economic Complexity Index. Trade over GDP is total merchandise exports and imports over GDP. Manufacturing sector correspond to the share of the manufacturing sector in the economy. Commodity-Dependent is a dummy variable that takes the value 1 if the country is a commodity dependent economy. OLS estimations at sector level (HS 2-digit codes). t statistics with robust standard errors adjusted by clustering at country level in parentheses. * Significant at 10%; ** Significant at 5%; *** Significant at 1%.
Annex A5.3Productive capacities and unit prices
Balanced sample
Unit prices per exporter(1)
ECI 0.243
(1.75)*
GDP 0.150
(1.28)
GDP per capita 0.154
(1.99)*
Trade over GDP 0.001
(0.38)
Manufacturing Sector 0.006
(0.38)
Commodity-Dependent 0.031
(0.20)
Sectoral Dummies Yes
Year Dummies Yes
R-squared 0.56
Number of countries 30
Observations 8,679
Notes: Unit prices is the log of the total export value over quantity. ECI corresponds to the Economic Complexity Index. GDP is the log of GDP in constant US dollars and GDP per capita is the log of GDP per capita in constant US dollars. Trade over GDP is total merchandise exports and imports over GDP. Manufacturing sector correspond to the share of the manu-facturing sector in the economy. Commodity-Dependent is a dummy variable that takes the value 1 if the country is a commodity depen-dent economy. OLS estimations at sector level (HS 2-digit codes). t statistics with robust stan-dard errors adjusted by clustering at country level in parentheses. * Significant at 10%; ** Significant at 5%; *** Significant at 1%.
DESA WORKING PAPER NO. 161
22
Annex A5.4Technological capabilities and diversification
Balanced sample
Products per exporter (1)
Destinations per exporter(2)
R&D 0.217 0.312
(2.41)** (3.88)**
GDP 0.023 -0.010
(2.57)** (-0.40)
GDP per capita 0.008 0.084
(0.63) (4.16)***
Trade over GDP 0.001 -0.001
(2.36)** (-1.35)
Manufacturing Sector 0.007 0.017
(4.08)*** (3.73)**
Commodity-Dependent 0.041 0.148
(1.57) (3.12)*
R&D * High-tech sector 0.018 0.174
(0.71) (2.39)**
Sectoral Dummies Yes Yes
Year Dummies Yes Yes
R-squared 0.62 0.33
Number of countries 30 30
Observations 8,563 8,563
Notes: Products per exporter is the log of the (mean) number of products per exporter. Destination per exporter is the log of the (mean) number of destination countries per exporter. R&D corresponds to aggregate R&D investments over GDP. GDP is the log of GDP in constant US dollars and GDP per capita is the log of GDP per capita in constant US dollars. Manufacturing sector correspond to the share of the manufacturing sector in the economy. Commodity-Dependent is a dummy variable that takes the value 1 if the country is a commodity dependent economy. High-tech sector is a dummy variable that takes the value 1 if the sector is R&D intensive. OLS estimations at sector level (HS 2-digit codes). t statistics with robust standard errors adjusted by clustering at country level in parentheses. * Significant at 10%; ** Significant at 5%; *** Significant at 1%.