Embed Size (px)
Citation preview
3
The role of radar in predicting and preventingasteroid and comet collisions with Earth
Steven J. OstroJet Propulsion Laboratory, California Institute of Technology
Jon D. GiorginiJet Propulsion Laboratory, California Institute of Technology
1 Introduction
The current Spaceguard Survey classifies each known near-Earth asteroid (NEA)as either non-threatening or deserving of additional astrometric attention. For anypossibly threatening object, the dominant issues are the uncertainty in its trajectoryand physical nature as well as what can be done to reduce that uncertainty. Morrisonet al. (2002) note that
From the standpoint of an allocator of society’s resources, an uncertain threat calls foradaptive policies, delaying potentially costly action but informing later decision by investingin uncertainty-reduction measures. In the context of the NEO impact hazard, this meansavoiding the costs of standing organizational structures and capital expenditures until athreat materializes. . . .
Thus reduction in uncertainty is tantamount to ensuring that unnecessary costs areavoided and that necessary actions are undertaken with adequate warning.
Ground-based radar is a knowledge-gathering tool that is uniquely able to shrinkuncertainty in NEO trajectories and physical properties. The power of radar stemslargely from the precision of its measurements (Table 3.1). The resolution of echoesin time delay (range) and Doppler frequency (radial velocity) is often of order1/100 the extent of a kilometer-sized target, so several thousand radar image pixelscan be placed on the target. Delay-Doppler positional measurements often havea fractional precision finer than 1/10 000 000, comparable to sub-milliarcsecondoptical astrometry.
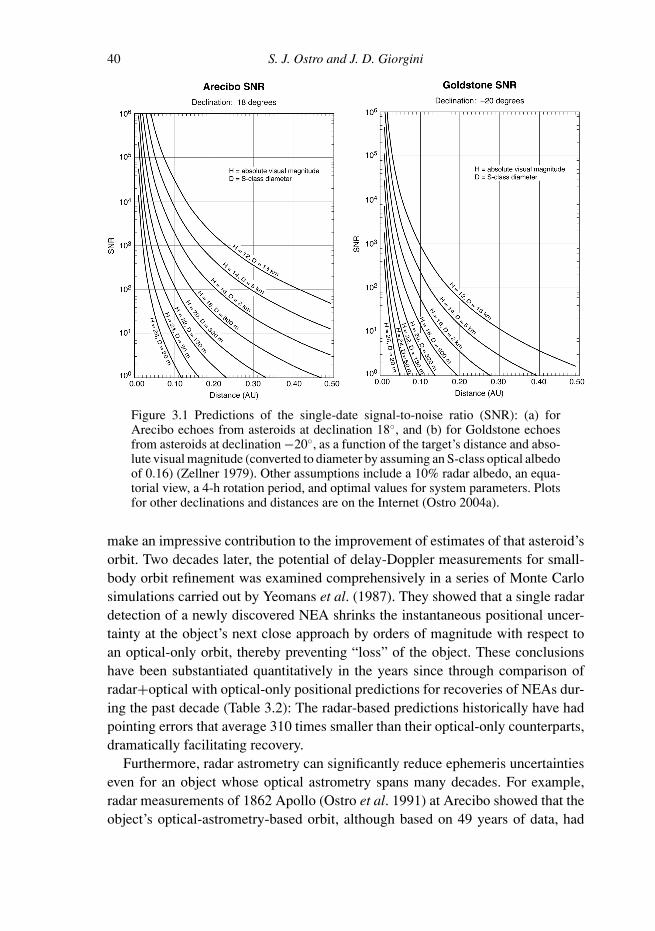
The single-date signal-to-noise ratio (SNR) of echoes, a measure of the numberof useful imaging pixels placed on a target by a given radar data set, dependsprimarily on the object’s distance and size. Figure 3.1 shows nominal values of
Mitigation of Hazardous Comets and Asteroids, ed. M. J. S. Belton, T. H. Morgan, N. H. Samarasinha, andD. K. Yeomans. Published by Cambridge University Press. C© Cambridge University Press 2004.
38
Radar’s role in prediction and prevention of collisions 39
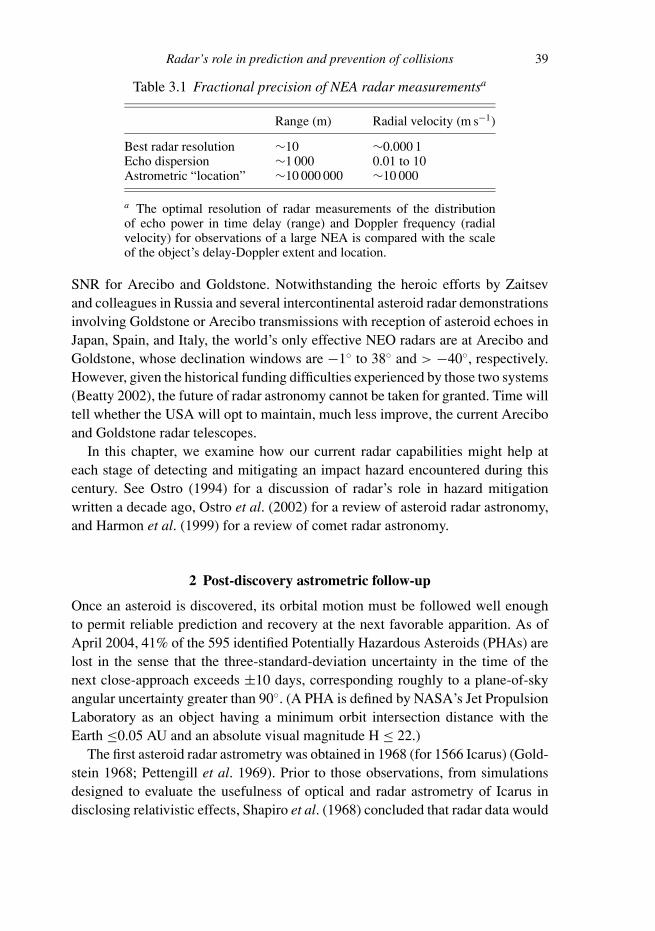
Table 3.1 Fractional precision of NEA radar measurementsa
Range (m) Radial velocity (m s−1)
Best radar resolution ∼10 ∼0.000 1Echo dispersion ∼1 000 0.01 to 10Astrometric “location” ∼10 000 000 ∼10 000
a The optimal resolution of radar measurements of the distributionof echo power in time delay (range) and Doppler frequency (radialvelocity) for observations of a large NEA is compared with the scaleof the object’s delay-Doppler extent and location.
SNR for Arecibo and Goldstone. Notwithstanding the heroic efforts by Zaitsevand colleagues in Russia and several intercontinental asteroid radar demonstrationsinvolving Goldstone or Arecibo transmissions with reception of asteroid echoes inJapan, Spain, and Italy, the world’s only effective NEO radars are at Arecibo andGoldstone, whose declination windows are −1◦ to 38◦ and > −40◦, respectively.However, given the historical funding difficulties experienced by those two systems(Beatty 2002), the future of radar astronomy cannot be taken for granted. Time willtell whether the USA will opt to maintain, much less improve, the current Areciboand Goldstone radar telescopes.
In this chapter, we examine how our current radar capabilities might help ateach stage of detecting and mitigating an impact hazard encountered during thiscentury. See Ostro (1994) for a discussion of radar’s role in hazard mitigationwritten a decade ago, Ostro et al. (2002) for a review of asteroid radar astronomy,and Harmon et al. (1999) for a review of comet radar astronomy.
2 Post-discovery astrometric follow-up
Once an asteroid is discovered, its orbital motion must be followed well enoughto permit reliable prediction and recovery at the next favorable apparition. As ofApril 2004, 41% of the 595 identified Potentially Hazardous Asteroids (PHAs) arelost in the sense that the three-standard-deviation uncertainty in the time of thenext close-approach exceeds ±10 days, corresponding roughly to a plane-of-skyangular uncertainty greater than 90◦. (A PHA is defined by NASA’s Jet PropulsionLaboratory as an object having a minimum orbit intersection distance with theEarth ≤0.05 AU and an absolute visual magnitude H ≤ 22.)
The first asteroid radar astrometry was obtained in 1968 (for 1566 Icarus) (Gold-stein 1968; Pettengill et al. 1969). Prior to those observations, from simulationsdesigned to evaluate the usefulness of optical and radar astrometry of Icarus indisclosing relativistic effects, Shapiro et al. (1968) concluded that radar data would
40 S. J. Ostro and J. D. Giorgini
Figure 3.1 Predictions of the single-date signal-to-noise ratio (SNR): (a) forArecibo echoes from asteroids at declination 18◦, and (b) for Goldstone echoesfrom asteroids at declination −20◦, as a function of the target’s distance and abso-lute visual magnitude (converted to diameter by assuming an S-class optical albedoof 0.16) (Zellner 1979). Other assumptions include a 10% radar albedo, an equa-torial view, a 4-h rotation period, and optimal values for system parameters. Plotsfor other declinations and distances are on the Internet (Ostro 2004a).
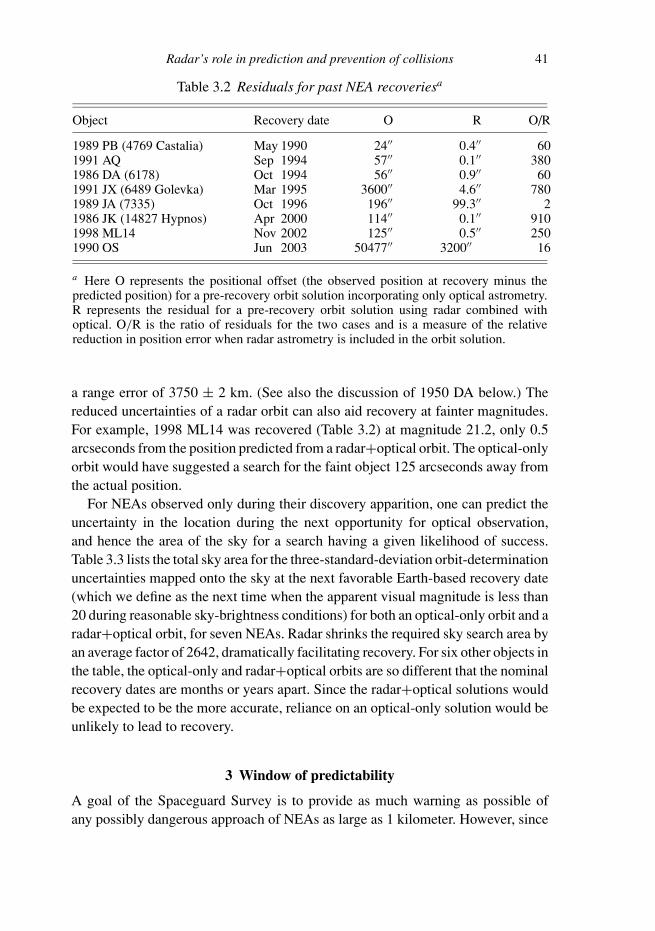
make an impressive contribution to the improvement of estimates of that asteroid’sorbit. Two decades later, the potential of delay-Doppler measurements for small-body orbit refinement was examined comprehensively in a series of Monte Carlosimulations carried out by Yeomans et al. (1987). They showed that a single radardetection of a newly discovered NEA shrinks the instantaneous positional uncer-tainty at the object’s next close approach by orders of magnitude with respect toan optical-only orbit, thereby preventing “loss” of the object. These conclusionshave been substantiated quantitatively in the years since through comparison ofradar+optical with optical-only positional predictions for recoveries of NEAs dur-ing the past decade (Table 3.2): The radar-based predictions historically have hadpointing errors that average 310 times smaller than their optical-only counterparts,dramatically facilitating recovery.
Furthermore, radar astrometry can significantly reduce ephemeris uncertaintieseven for an object whose optical astrometry spans many decades. For example,radar measurements of 1862 Apollo (Ostro et al. 1991) at Arecibo showed that theobject’s optical-astrometry-based orbit, although based on 49 years of data, had
Radar’s role in prediction and prevention of collisions 41
Table 3.2 Residuals for past NEA recoveriesa
Object Recovery date O R O/R
1989 PB (4769 Castalia) May 1990 24′′ 0.4′′ 601991 AQ Sep 1994 57′′ 0.1′′ 3801986 DA (6178) Oct 1994 56′′ 0.9′′ 601991 JX (6489 Golevka) Mar 1995 3600′′ 4.6′′ 7801989 JA (7335) Oct 1996 196′′ 99.3′′ 21986 JK (14827 Hypnos) Apr 2000 114′′ 0.1′′ 9101998 ML14 Nov 2002 125′′ 0.5′′ 2501990 OS Jun 2003 50477′′ 3200′′ 16
a Here O represents the positional offset (the observed position at recovery minus thepredicted position) for a pre-recovery orbit solution incorporating only optical astrometry.R represents the residual for a pre-recovery orbit solution using radar combined withoptical. O/R is the ratio of residuals for the two cases and is a measure of the relativereduction in position error when radar astrometry is included in the orbit solution.
a range error of 3750 ± 2 km. (See also the discussion of 1950 DA below.) Thereduced uncertainties of a radar orbit can also aid recovery at fainter magnitudes.For example, 1998 ML14 was recovered (Table 3.2) at magnitude 21.2, only 0.5arcseconds from the position predicted from a radar+optical orbit. The optical-onlyorbit would have suggested a search for the faint object 125 arcseconds away fromthe actual position.
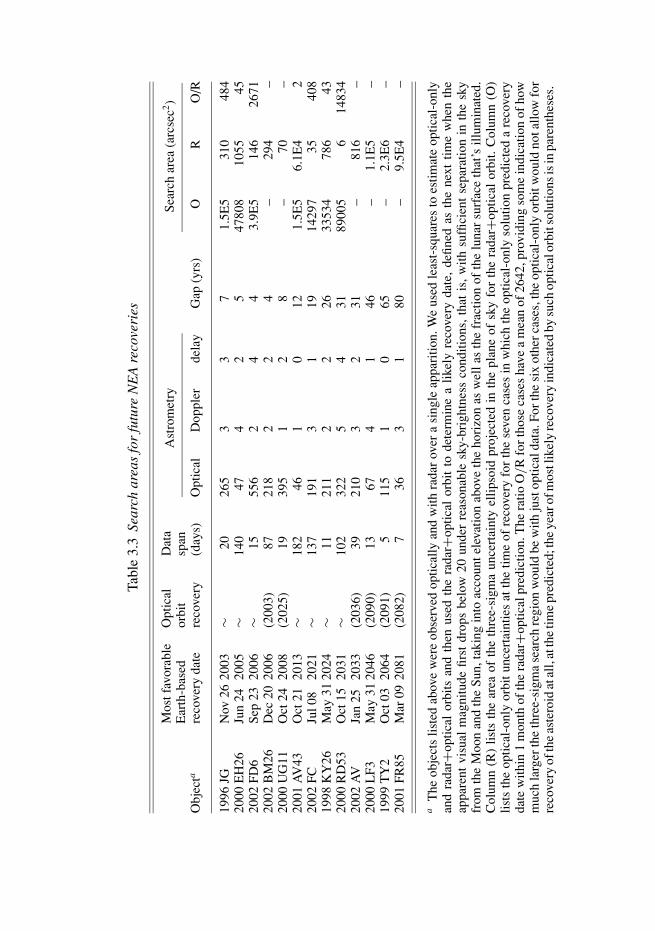
For NEAs observed only during their discovery apparition, one can predict theuncertainty in the location during the next opportunity for optical observation,and hence the area of the sky for a search having a given likelihood of success.Table 3.3 lists the total sky area for the three-standard-deviation orbit-determinationuncertainties mapped onto the sky at the next favorable Earth-based recovery date(which we define as the next time when the apparent visual magnitude is less than20 during reasonable sky-brightness conditions) for both an optical-only orbit and aradar+optical orbit, for seven NEAs. Radar shrinks the required sky search area byan average factor of 2642, dramatically facilitating recovery. For six other objects inthe table, the optical-only and radar+optical orbits are so different that the nominalrecovery dates are months or years apart. Since the radar+optical solutions wouldbe expected to be the more accurate, reliance on an optical-only solution would beunlikely to lead to recovery.
3 Window of predictability
A goal of the Spaceguard Survey is to provide as much warning as possible ofany possibly dangerous approach of NEAs as large as 1 kilometer. However, since
Tabl
e3.
3Se
arch
area
sfo
rfu
ture
NE
Are
cove
ries
Mos
tfav
orab
leO
ptic
alD
ata
Ear
th-b
ased
orbi
tsp
anO
bjec
tare
cove
ryda
tere
cove
ry(d
ays)
Ast
rom
etry
Sear
char
ea(a
rcse
c2)
Opt
ical
Dop
pler
dela
yG
ap(y
rs)
OR
O/R
1996
JGN
ov26
2003
∼20
265
33
71.
5E5
310
484
2000
EH
26Ju
n24
2005
∼14
047
42
547
808
1055
4520
02FD
6Se
p23
2006
∼15
556
24
43.
9E5
146
2671
2002
BM
26D
ec20
2006
(200
3)87
218
22
4–
294
–20
00U
G11
Oct
2420
08(2
025)
1939
51
28
–70
–20
01A
V43
Oct
2120
13∼
182
461
012
1.5E
56.
1E4
220
02FC
Jul0
820
21∼
137
191
31
1914
297
3540
819
98K
Y26
May
3120
24∼
1121
12
226
3353
478
643
2000
RD
53O
ct15
2031
∼10
232
25
431
8900
56
1483
420
02A
VJa
n25
2033
(203
6)39
210
32
31–
816
–20
00L
F3M
ay31
2046
(209
0)13
674
146
–1.
1E5
–19
99T
Y2
Oct
0320
64(2
091)
511
51
065
–2.
3E6
–20
01FR
85M
ar09
2081
(208
2)7
363
180
–9.
5E4
–
aT
heob
ject
slis
ted
abov
ew
ere
obse
rved
optic
ally
and
with
rada
rov
era
sing
leap
pari
tion.
We
used
leas
t-sq
uare
sto
estim
ate
optic
al-o
nly
and
rada
r+op
tical
orbi
tsan
dth
enus
edth
era
dar+
optic
alor
bit
tode
term
ine
alik
ely
reco
very
date
,de
fined
asth
ene
xttim
ew
hen
the
appa
rent
visu
alm
agni
tude
first
drop
sbe
low
20un
der
reas
onab
lesk
y-br
ight
ness
cond
ition
s,th
atis
,w
ithsu
ffici
ent
sepa
ratio
nin
the
sky
from
the
Moo
nan
dth
eSu
n,ta
king
into
acco
unte
leva
tion
abov
eth
eho
rizo
nas
wel
las
the
frac
tion
ofth
elu
nar
surf
ace
that
’sill
umin
ated
.C
olum
n(R
)lis
tsth
ear
eaof
the
thre
e-si
gma
unce
rtai
nty
ellip
soid
proj
ecte
din
the
plan
eof
sky
for
the
rada
r+op
tical
orbi
t.C
olum
n(O
)lis
tsth
eop
tical
-onl
yor
bitu
ncer
tain
ties
atth
etim
eof
reco
very
for
the
seve
nca
ses
inw
hich
the
optic
al-o
nly
solu
tion
pred
icte
da
reco
very
date
with
in1
mon
thof
the
rada
r+op
tical
pred
ictio
n.T
hera
tioO
/R
for
thos
eca
ses
have
am
ean
of26
42,p
rovi
ding
som
ein
dica
tion
ofho
wm
uch
larg
erth
eth
ree-
sigm
ase
arch
regi
onw
ould
bew
ithju
stop
tical
data
.For
the
six
othe
rcas
es,t
heop
tical
-onl
yor
bitw
ould
nota
llow
for
reco
very
ofth
eas
tero
idat
all,
atth
etim
epr
edic
ted;
the
year
ofm
ostl
ikel
yre
cove
ryin
dica
ted
bysu
chop
tical
orbi
tsol
utio
nsis
inpa
rent
hese
s.
Radar’s role in prediction and prevention of collisions 43
an orbit estimate is based on a least-squares fit to measurements of an asteroid’sposition over a small portion of its orbit, knowledge of the future trajectory generallyis limited by statistical uncertainties that increase with the length of time from theinterval spanned by astrometric measurements. Trajectory uncertainties are greatestand grow most rapidly during close planetary encounters, as the steeper gravity fieldgradient differentially affects the volume of space centered on the nominal orbitsolution within which the asteroid is statistically located. Eventually the uncertaintyregion grows so large, typically within the orbit plane and along the direction ofmotion, that the prediction becomes meaningless.
Current ground-based optical astrometric measurements typically have angularuncertainties of between 0.2 and 1.0 arcsec (a standard deviation of 0.5 to 0.8 arcsecis common), corresponding to tens or hundreds or thousands of kilometers of uncer-tainty for any given measurement, depending on the asteroid’s distance. Radar canprovide astrometry referenced to the asteroid’s center of mass, with uncertainties assmall as ∼10 m in range and ∼1 mm s−1 in range rate. Since those measurementsare orthogonal to plane-of-sky angular measurements and have relatively fine frac-tional precision, they offer substantial leverage on an orbit solution and normallyextend NEO trajectory predictability intervals far beyond what is possible withoptical data alone.
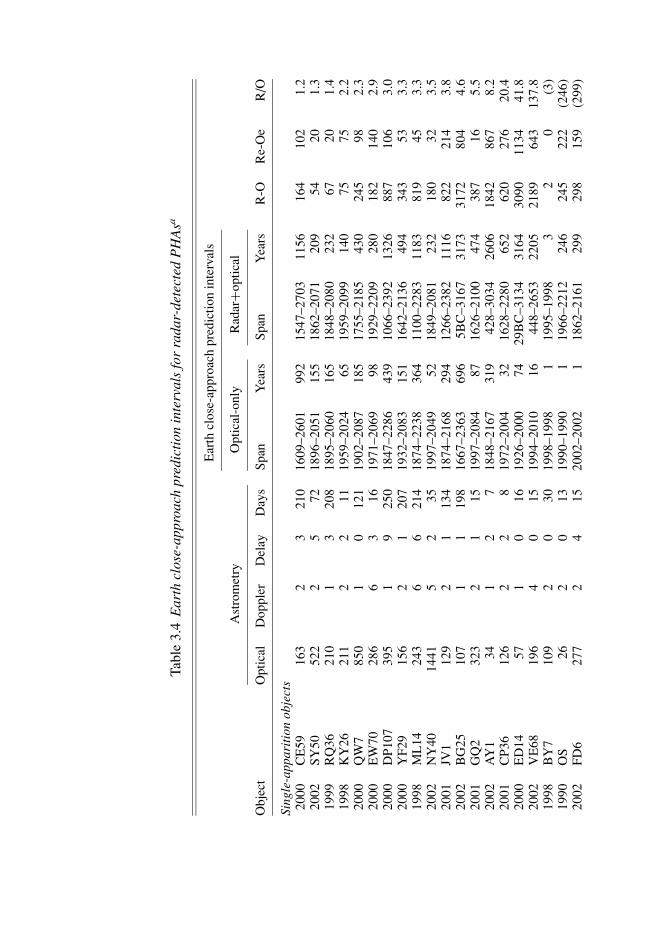
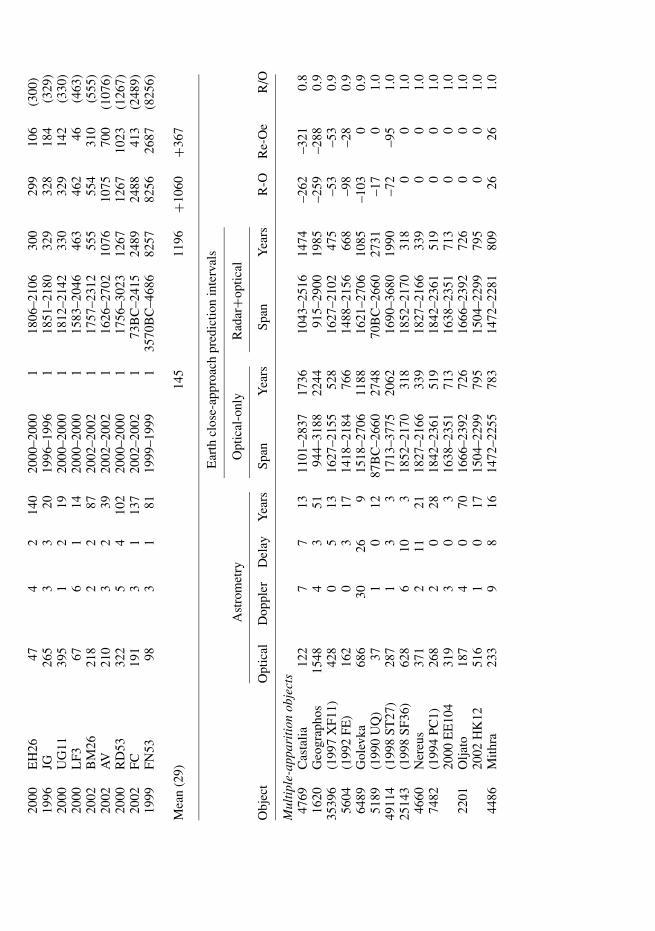
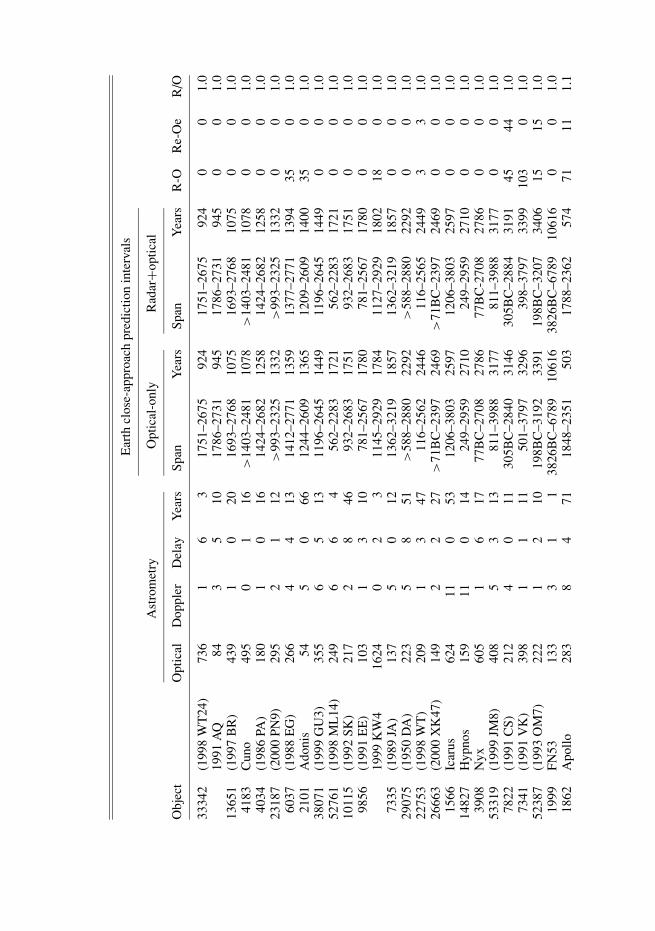
Let us define the window of predictability as the interval over which an object’sEarth close approaches can be reliably known at the three-sigma level of confidence.Table 3.4 lists optical-only and radar+optical predictability windows for all radar-detected PHAs. For objects observed only during their discovery apparition, radarhas enlarged the total window of predictability (past and future) by an averagefactor of eight, from 145 years for solutions based only on optical data to 1196years when radar was included in the orbit solution. On average, radar has added367 more years to the window of accurate future predictions.
When radar astrometry is excluded from the 29 single-apparition PHAradar+optical orbit solutions, 41% cannot have their next close approach predictedwithin the adopted confidence level using only the single apparition of optical data.This is the same percentage seen in the total population of PHAs. Radar astrometryobtained in these cases adds an average of 500 years of statistical confidence totheir Earth encounter predictions, preventing them from being lost. For 2000 RD53and 1999 FN53, the extension is through the end of this millennium.
We see that a discovery–apparition orbit solution containing radar astrometry canbe compared favorably to a multiple-apparition, optical-only solution. As an exam-ple, 1998 ML14 is listed in both single and multiple apparition categories to showthe effect of including the first six optical observations from the November 2002recovery, which lengthened the data arc from 7 months to 5 years and lengthenedthe optical-only total knowledge window from 364 to 1721 years. By comparison,
Tabl
e3.
4E
arth
clos
e-ap
proa
chpr
edic
tion
inte
rval
sfo
rra
dar-
dete
cted
PH
Asa
Ear
thcl
ose-
appr
oach
pred
ictio
nin
terv
als
Ast
rom
etry
Opt
ical
-onl
yR
adar
+opt
ical
Obj
ect
Opt
ical
Dop
pler
Del
ayD
ays
Span
Yea
rsSp
anY
ears
R-O
Re-
Oe
R/O
Sing
le-a
ppar
itio
nob
ject
s20
00C
E59
163
23
210
1609
–260
199
215
47–2
703
1156
164
102
1.2
2002
SY50
522
25
7218
96–2
051
155
1862
–207
120
954
201.
319
99R
Q36
210
13
208
1895
–206
016
518
48–2
080
232
6720
1.4
1998
KY
2621
12
211
1959
–202
465
1959
–209
914
075
752.
220
00Q
W7
850
10
121
1902
–208
718
517
55–2
185
430
245
982.
320
00E
W70
286
63
1619
71–2
069
9819
29–2
209
280
182
140
2.9
2000
DP1
0739
51
925
018
47–2
286
439
1066
–239
213
2688
710
63.
020
00Y
F29
156
21
207
1932
–208
315
116
42–2
136
494
343
533.
319
98M
L14
243
66
214
1874
–223
836
411
00–2
283
1183
819
453.
320
02N
Y40
1441
52
3519
97–2
049
5218
49–2
081
232
180
323.
520
01JV
112
92
113
418
74–2
168
294
1266
–238
211
1682
221
43.
820
02B
G25
107
11
198
1667
–236
369
65B
C–3
167
3173
3172
804
4.6
2001
GQ
232
32
115
1997
–208
487
1626
–210
047
438
716
5.5
2002
AY
134
12
718
48–2
167
319
428–
3034
2606
1842
867
8.2
2001
CP3
612
62
28
1972
–200
432
1628
–228
065
262
027
620
.420
00E
D14
571
016
1926
–200
074
29B
C–3
134
3164
3090
1134
41.8
2002
VE
6819
64
015
1994
–201
016
448–
2653
2205
2189
643
137.
819
98B
Y7
109
20
3019
98–1
998
119
95–1
998
32
0(3
)19
90O
S26
20
1319
90–1
990
119
66–2
212
246
245
222
(246
)20
02FD
627
72
415
2002
–200
21
1862
–216
129
929
815
9(2
99)
2000
EH
2647
42
140
2000
–200
01
1806
–210
630
029
910
6(3
00)
1996
JG26
53
320
1996
–199
61
1851
–218
032
932
818
4(3
29)
2000
UG
1139
51
219
2000
–200
01
1812
–214
233
032
914
2(3
30)
2000
LF3
676
114
2000
–200
01
1583
–204
646
346
246
(463
)20
02B
M26
218
22
8720
02–2
002
117
57–2
312
555
554
310
(555
)20
02A
V21
03
239
2002
–200
21
1626
–270
210
7610
7570
0(1
076)
2000
RD
5332
25
410
220
00–2
000
117
56–3
023
1267
1267
1023
(126
7)20
02FC
191
31
137
2002
–200
21
73B
C–2
415
2489
2488
413
(248
9)19
99FN
5398
31
8119
99–1
999
135
70B
C–4
686
8257
8256
2687
(825
6)
Mea
n(2
9)14
511
96+1
060
+367
Ear
thcl
ose-
appr
oach
pred
ictio
nin
terv
als
Ast
rom
etry
Opt
ical
-onl
yR
adar
+opt
ical
Obj
ect
Opt
ical
Dop
pler
Del
ayY
ears
Span
Yea
rsSp
anY
ears
R-O
Re-
Oe
R/O
Mul
tipl
e-ap
pari
tion
obje
cts
4769
Cas
talia
122
77
1311
01–2
837
1736
1043
–251
614
74–2
62–3
210.
816
20G
eogr
apho
s15
484
351
944–
3188
2244
915–
2900
1985
–259
–288
0.9
3539
6(1
997
XF1
1)42
80
513
1627
–215
552
816
27–2
102
475
–53
–53
0.9
5604
(199
2FE
)16
20
317
1418
–218
476
614
88–2
156
668
–98
–28
0.9
6489
Gol
evka
686
3026
915
18–2
706
1188
1621
–270
610
85–1
030
0.9
5189
(199
0U
Q)
371
012
87B
C–2
660
2748
70B
C–2
660
2731
–17
01.
049
114
(199
8ST
27)
287
13
317
13–3
775
2062
1690
–368
019
90–7
2–9
51.
025
143
(199
8SF
36)
628
610
318
52–2
170
318
1852
–217
031
80
01.
046
60N
ereu
s37
12
1121
1827
–216
633
918
27–2
166
339
00
1.0
7482
(199
4PC
1)26
82
028
1842
–236
151
918
42–2
361
519
00
1.0
2000
EE
104
319
30
316
38–2
351
713
1638
–235
171
30
01.
022
01O
ljato
187
40
7016
66–2
392
726
1666
–239
272
60
01.
020
02H
K12
516
10
1715
04–2
299
795
1504
–229
979
50
01.
044
86M
ithra
233
98
1614
72–2
255
783
1472
–228
180
926
261.
0
Ear
thcl
ose-
appr
oach
pred
ictio
nin
terv
als
Ast
rom
etry
Opt
ical
-onl
yR
adar
+opt
ical
Obj
ect
Opt
ical
Dop
pler
Del
ayY
ears
Span
Yea
rsSp
anY
ears
R-O
Re-
Oe
R/O
3334
2(1
998
WT
24)
736
16
317
51–2
675
924
1751
–267
592
40
01.
019
91A
Q84
35
1017
86–2
731
945
1786
–273
194
50
01.
013
651
(199
7B
R)
439
10
2016
93–2
768
1075
1693
–276
810
750
01.
041
83C
uno
495
01
16>
1403
–248
110
78>
1403
–248
110
780
01.
040
34(1
986
PA)
180
10
1614
24–2
682
1258
1424
–268
212
580
01.
023
187
(200
0PN
9)29
52
112
>99
3–23
2513
32>
993–
2325
1332
00
1.0
6037
(198
8E
G)
266
44
1314
12–2
771
1359
1377
–277
113
9435
01.
021
01A
doni
s54
50
6612
44–2
609
1365
1209
–260
914
0035
01.
038
071
(199
9G
U3)
355
65
1311
96–2
645
1449
1196
–264
514
490
01.
052
761
(199
8M
L14
)24
96
64
562–
2283
1721
562–
2283
1721
00
1.0
1011
5(1
992
SK)
217
28
4693
2–26
8317
5193
2–26
8317
510
01.
098
56(1
991
EE
)10
31
310
781–
2567
1780
781–
2567
1780
00
1.0
1999
KW
416
240
23
1145
–292
917
8411
27–2
929
1802
180
1.0
7335
(198
9JA
)13
75
012
1362
–321
918
5713
62–3
219
1857
00
1.0
2907
5(1
950
DA
)22
35
851
>58
8–28
8022
92>
588–
2880
2292
00
1.0
2275
3(1
998
WT
)20
91
347
116–
2562
2446
116–
2565
2449
33
1.0
2666
3(2
000
XK
47)
149
22
27>
71B
C–2
397
2469
>71
BC
–239
724
690
01.
015
66Ic
arus
624
110
5312
06–3
803
2597
1206
–380
325
970
01.
014
827
Hyp
nos
159
110
1424
9–29
5927
1024
9–29
5927
100
01.
039
08N
yx60
51
617
77B
C–2
708
2786
77B
C-2
708
2786
00
1.0
5331
9(1
999
JM8)
408
53
1381
1–39
8831
7781
1–39
8831
770
01.
078
22(1
991
CS)
212
40
1130
5BC
–284
031
4630
5BC
–288
431
9145
441.
073
41(1
991
VK
)39
81
111
501–
3797
3296
398–
3797
3399
103
01.
052
387
(199
3O
M7)
222
12
1019
8BC
–319
233
9119
8BC
–320
734
0615
151.
019
99FN
5313
33
11
3826
BC
–678
910
616
3826
BC
–678
910
616
00
1.0
1862
Apo
llo28
38
471
1848
–235
150
317
88–2
362
574
7111
1.1
Mul
tipl
e-ap
pari
tion
obje
cts
8014
(199
0M
F)60
106
815
68–2
313
745
1568
–237
180
358
581.
141
79To
utat
is11
0527
1968
1221
–206
984
811
17–2
069
952
104
01.
149
53(1
990
MU
)95
20
27>
1519
–312
316
04>
1519
–327
117
5214
814
81.
137
57(1
982
XB
)85
20
2011
84–2
673
1489
1005
–267
316
6817
90
1.1
1981
Mid
as96
10
2612
37–3
122
1885
1011
–312
221
1122
60
1.1
Mea
n(4
5)18
0318
08+4
–11
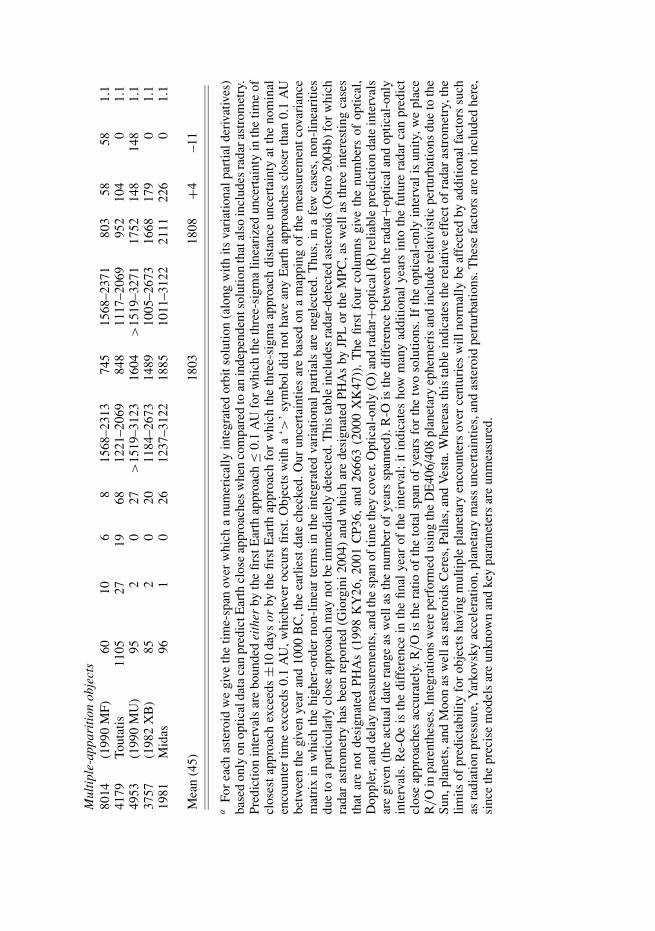
aFo
rea
chas
tero
idw
egi
veth
etim
e-sp
anov
erw
hich
anu
mer
ical
lyin
tegr
ated
orbi
tsol
utio
n(a
long
with
itsva
riat
iona
lpar
tiald
eriv
ativ
es)
base
don
lyon
optic
alda
taca
npr
edic
tEar
thcl
ose
appr
oach
esw
hen
com
pare
dto
anin
depe
nden
tsol
utio
nth
atal
soin
clud
esra
dara
stro
met
ry.
Pred
ictio
nin
terv
als
are
boun
ded
eith
erby
the
first
Ear
thap
proa
ch≤
0.1
AU
for
whi
chth
eth
ree-
sigm
alin
eari
zed
unce
rtai
nty
inth
etim
eof
clos
esta
ppro
ach
exce
eds±1
0da
ysor
byth
efir
stE
arth
appr
oach
for
whi
chth
eth
ree-
sigm
aap
proa
chdi
stan
ceun
cert
aint
yat
the
nom
inal
enco
unte
rtim
eex
ceed
s0.
1A
U,w
hich
ever
occu
rsfir
st.O
bjec
tsw
itha
‘>’
sym
bol
did
not
have
any
Ear
thap
proa
ches
clos
erth
an0.
1A
Ube
twee
nth
egi
ven
year
and
1000
BC
,the
earl
iest
date
chec
ked.
Our
unce
rtai
ntie
sar
eba
sed
ona
map
ping
ofth
em
easu
rem
entc
ovar
ianc
em
atri
xin
whi
chth
ehi
gher
-ord
erno
n-lin
ear
term
sin
the
inte
grat
edva
riat
iona
lpa
rtia
lsar
ene
glec
ted.
Thu
s,in
afe
wca
ses,
non-
linea
ritie
sdu
eto
apa
rtic
ular
lycl
ose
appr
oach
may
notb
eim
med
iate
lyde
tect
ed.T
his
tabl
ein
clud
esra
dar-
dete
cted
aste
roid
s(O
stro
2004
b)fo
rw
hich
rada
ras
trom
etry
has
been
repo
rted
(Gio
rgin
i200
4)an
dw
hich
are
desi
gnat
edPH
As
byJP
Lor
the
MPC
,as
wel
las
thre
ein
tere
stin
gca
ses
that
are
not
desi
gnat
edPH
As
(199
8K
Y26
,20
01C
P36,
and
2666
3(2
000
XK
47))
.T
hefir
stfo
urco
lum
nsgi
veth
enu
mbe
rsof
optic
al,
Dop
pler
,and
dela
ym
easu
rem
ents
,and
the
span
oftim
eth
eyco
ver.
Opt
ical
-onl
y(O
)and
rada
r+op
tical
(R)r
elia
ble
pred
ictio
nda
tein
terv
als
are
give
n(t
heac
tual
date
rang
eas
wel
las
the
num
ber
ofye
ars
span
ned)
.R-O
isth
edi
ffer
ence
betw
een
the
rada
r+op
tical
and
optic
al-o
nly
inte
rval
s.R
e-O
eis
the
diff
eren
cein
the
final
year
ofth
ein
terv
al;
itin
dica
tes
how
man
yad
ditio
nal
year
sin
toth
efu
ture
rada
rca
npr
edic
tcl
ose
appr
oach
esac
cura
tely
.R/O
isth
era
tioof
the
tota
lspa
nof
year
sfo
rth
etw
oso
lutio
ns.I
fth
eop
tical
-onl
yin
terv
alis
unity
,we
plac
eR
/O
inpa
rent
hese
s.In
tegr
atio
nsw
ere
perf
orm
edus
ing
the
DE
406/
408
plan
etar
yep
hem
eris
and
incl
ude
rela
tivis
ticpe
rtur
batio
nsdu
eto
the
Sun,
plan
ets,
and
Moo
nas
wel
las
aste
roid
sC
eres
,Pal
las,
and
Ves
ta.W
here
asth
ista
ble
indi
cate
sth
ere
lativ
eef
fect
ofra
dar
astr
omet
ry,t
helim
itsof
pred
icta
bilit
yfo
rob
ject
sha
ving
mul
tiple
plan
etar
yen
coun
ters
over
cent
urie
sw
illno
rmal
lybe
affe
cted
byad
ditio
nalf
acto
rssu
chas
radi
atio
npr
essu
re,Y
arko
vsky
acce
lera
tion,
plan
etar
ym
ass
unce
rtai
ntie
s,an
das
tero
idpe
rtur
batio
ns.T
hese
fact
ors
are
noti
nclu
ded
here
,si
nce
the
prec
ise
mod
els
are
unkn
own
and
key
para
met
ers
are
unm
easu
red.
48 S. J. Ostro and J. D. Giorgini
during the discovery apparition, radar astrometry combined with optical data pro-vided an interval of 1183 years. It required the recovery of 1998 ML14 beforean optical-only solution yielded a prediction interval comparable to the discoveryapparition combined with radar. Similarly, for 1999 FN53, discovery apparitionradar indicated an 8257-year window not possible with optical data alone until theobject was recovered about half an orbit period later.
For multiple-apparition objects, radar does not significantly extend the interval,which often is terminated centuries from the present era by one or more closeplanetary approaches whose detailed geometry simply cannot be discerned byany present-day data type. Nevertheless, radar improves the accuracy of multi-apparition orbits. A prime example is 1950 DA: the same upper-limit of AD 2880exists whether or not radar is included in the multiple-apparition solution. However,including radar revealed a non-negligible impact potential in 2880 not apparent inoptical solutions. This was because radar astrometry eliminated a bias in the opti-cal data and reduced the 2880 uncertainty region by about 20% as compared to theoptical only solution, resulting in the potential hazard detection (see Section 4.2).
In seven of the 45 multi-apparition cases, radar astrometry actually reducedthe interval of prediction, while 17 cases were slightly extended. These disparateeffects arise because the different nominal orbits for the optical and optical+radarsolutions have slightly different planetary encounter circumstances, so their uncer-tainty regions increase in different ways. Thus the net effect of radar for thesemulti-apparition cases is to correct the length of the optically predicted interval,suggesting that if any optical-only orbit were to reveal a potentially hazardousclose approach, it would be highly desirable to get radar astrometry to check theprediction.
4 Radar and collision probability prediction
For newly discovered NEOs, a collision probability is now routinely estimated(Milani et al. 2002) for close Earth approaches. This probability is combined withthe asteroid’s estimated diameter and the time until the approach to rate the relativedegree of hazard using the Palermo Technical Scale (Chesley et al. 2002). The JetPropulsion Laboratory’s Sentry program maintains a “risk page” (Chesley 2004)which lists objects found to have a potential for impact within the next 100 years.However, for newly discovered objects, the limited number of initial astrometricobservations typically does not permit accurate trajectory prediction. When anobject’s optical astrometric arc is only days or weeks long, the orbit is so uncertainthat a potentially hazardous close approach cannot be distinguished from a harmlessone or even a non-existent one. The object is placed on the Sentry page, then
Radar’s role in prediction and prevention of collisions 49
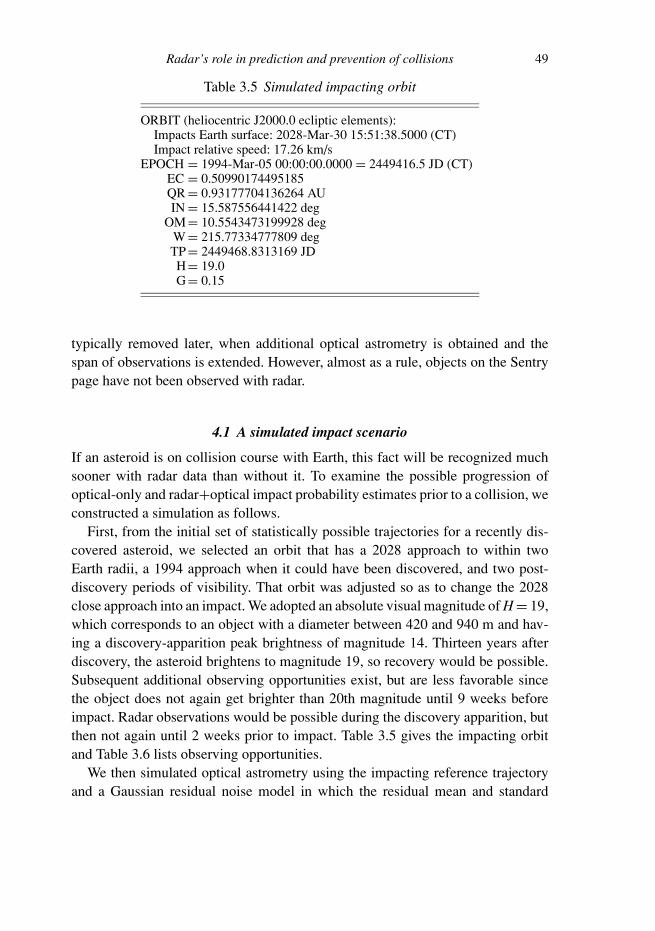
Table 3.5 Simulated impacting orbit
ORBIT (heliocentric J2000.0 ecliptic elements):Impacts Earth surface: 2028-Mar-30 15:51:38.5000 (CT)Impact relative speed: 17.26 km/s
EPOCH = 1994-Mar-05 00:00:00.0000 = 2449416.5 JD (CT)EC = 0.50990174495185QR = 0.93177704136264 AUIN = 15.587556441422 deg
OM= 10.5543473199928 degW = 215.77334777809 degTP= 2449468.8313169 JDH= 19.0G= 0.15
typically removed later, when additional optical astrometry is obtained and thespan of observations is extended. However, almost as a rule, objects on the Sentrypage have not been observed with radar.
4.1 A simulated impact scenario
If an asteroid is on collision course with Earth, this fact will be recognized muchsooner with radar data than without it. To examine the possible progression ofoptical-only and radar+optical impact probability estimates prior to a collision, weconstructed a simulation as follows.
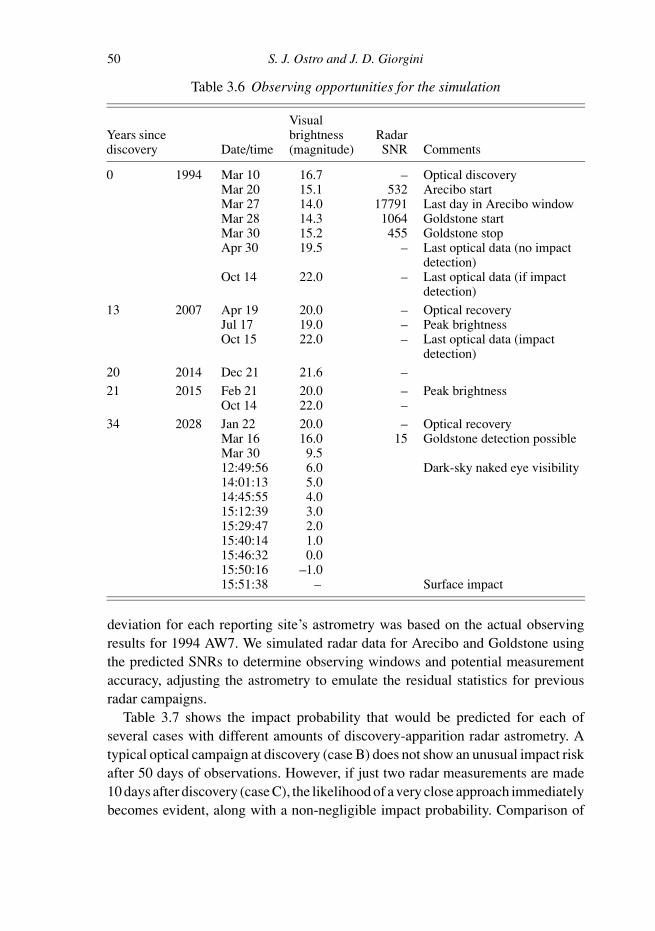
First, from the initial set of statistically possible trajectories for a recently dis-covered asteroid, we selected an orbit that has a 2028 approach to within twoEarth radii, a 1994 approach when it could have been discovered, and two post-discovery periods of visibility. That orbit was adjusted so as to change the 2028close approach into an impact. We adopted an absolute visual magnitude of H = 19,which corresponds to an object with a diameter between 420 and 940 m and hav-ing a discovery-apparition peak brightness of magnitude 14. Thirteen years afterdiscovery, the asteroid brightens to magnitude 19, so recovery would be possible.Subsequent additional observing opportunities exist, but are less favorable sincethe object does not again get brighter than 20th magnitude until 9 weeks beforeimpact. Radar observations would be possible during the discovery apparition, butthen not again until 2 weeks prior to impact. Table 3.5 gives the impacting orbitand Table 3.6 lists observing opportunities.
We then simulated optical astrometry using the impacting reference trajectoryand a Gaussian residual noise model in which the residual mean and standard
50 S. J. Ostro and J. D. Giorgini
Table 3.6 Observing opportunities for the simulation
VisualYears since brightness Radardiscovery Date/time (magnitude) SNR Comments
0 1994 Mar 10 16.7 – Optical discoveryMar 20 15.1 532 Arecibo startMar 27 14.0 17791 Last day in Arecibo windowMar 28 14.3 1064 Goldstone startMar 30 15.2 455 Goldstone stopApr 30 19.5 – Last optical data (no impact
detection)Oct 14 22.0 – Last optical data (if impact
detection)
13 2007 Apr 19 20.0 – Optical recoveryJul 17 19.0 – Peak brightnessOct 15 22.0 – Last optical data (impact
detection)
20 2014 Dec 21 21.6 –
21 2015 Feb 21 20.0 – Peak brightnessOct 14 22.0 –
34 2028 Jan 22 20.0 – Optical recoveryMar 16 16.0 15 Goldstone detection possibleMar 30 9.512:49:56 6.0 Dark-sky naked eye visibility14:01:13 5.014:45:55 4.015:12:39 3.015:29:47 2.015:40:14 1.015:46:32 0.015:50:16 –1.015:51:38 – Surface impact
deviation for each reporting site’s astrometry was based on the actual observingresults for 1994 AW7. We simulated radar data for Arecibo and Goldstone usingthe predicted SNRs to determine observing windows and potential measurementaccuracy, adjusting the astrometry to emulate the residual statistics for previousradar campaigns.
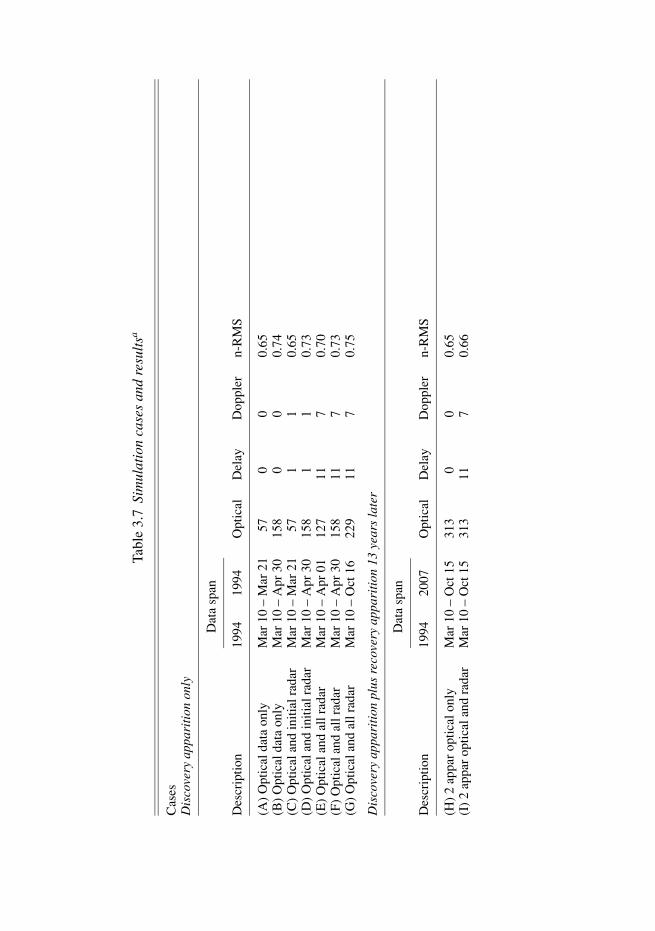
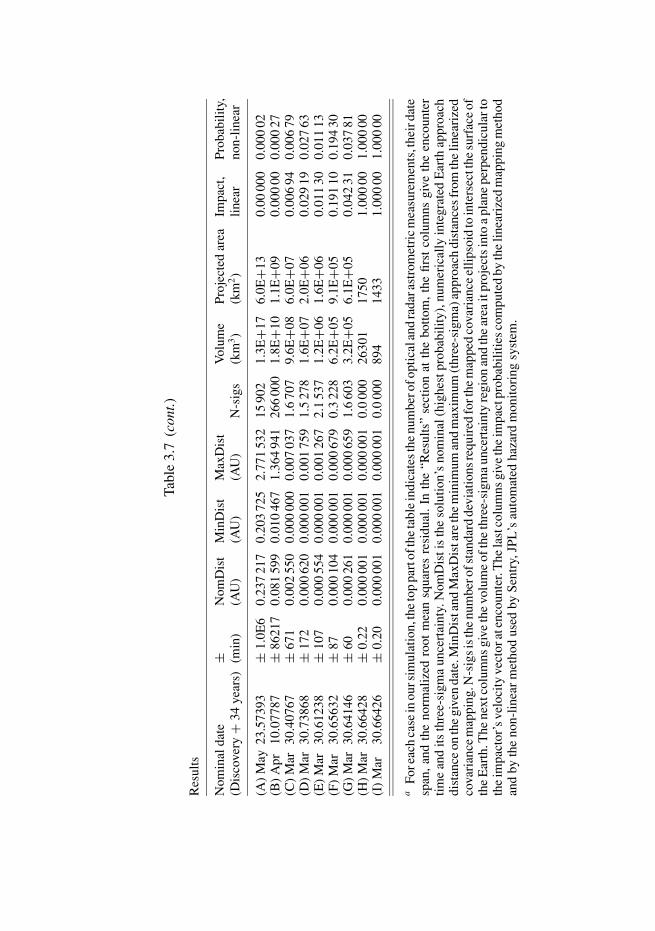
Table 3.7 shows the impact probability that would be predicted for each ofseveral cases with different amounts of discovery-apparition radar astrometry. Atypical optical campaign at discovery (case B) does not show an unusual impact riskafter 50 days of observations. However, if just two radar measurements are made10 days after discovery (case C), the likelihood of a very close approach immediatelybecomes evident, along with a non-negligible impact probability. Comparison of
Tabl
e3.
7Si
mul
atio
nca
ses
and
resu
ltsa
Cas
esD
isco
very
appa
riti
onon
ly
Dat
asp
an
Des
crip
tion
1994
1994
Opt
ical
Del
ayD
oppl
ern-
RM
S
(A)
Opt
ical
data
only
Mar
10–
Mar
2157
00
0.65
(B)
Opt
ical
data
only
Mar
10–
Apr
3015
80
00.
74(C
)O
ptic
alan
din
itial
rada
rM
ar10
–M
ar21
571
10.
65(D
)O
ptic
alan
din
itial
rada
rM
ar10
–A
pr30
158
11
0.73
(E)
Opt
ical
and
allr
adar
Mar
10–
Apr
0112
711
70.
70(F
)O
ptic
alan
dal
lrad
arM
ar10
–A
pr30
158
117
0.73
(G)
Opt
ical
and
allr
adar
Mar
10–
Oct
1622
911
70.
75
Dis
cove
ryap
pari
tion
plus
reco
very
appa
riti
on13
year
sla
ter
Dat
asp
an
Des
crip
tion
1994
2007
Opt
ical
Del
ayD
oppl
ern-
RM
S
(H)
2ap
par
optic
alon
lyM
ar10
–O
ct15
313
00
0.65
(I)
2ap
par
optic
alan
dra
dar
Mar
10–
Oct
1531
311
70.
66
Tabl
e3.
7(c
ont.)
Res
ults
Nom
inal
date
±N
omD
ist
Min
Dis
tM
axD
ist
Vol
ume
Proj
ecte
dar
eaIm
pact
,Pr
obab
ility
,(D
isco
very
+34
year
s)(m
in)
(AU
)(A
U)
(AU
)N
-sig
s(k
m3)
(km
2)
linea
rno
n-lin
ear
(A)
May
23.5
7393
±1.
0E6
0.23
721
70.
203
725
2.77
153
215
902
1.3E
+17
6.0E
+13
0.00
000
0.00
002
(B)
Apr
10.0
7787
±86
217
0.08
159
90.
010
467
1.36
494
126
600
01.
8E+1
01.
1E+0
90.
000
000.
000
27(C
)M
ar30
.407
67±
671
0.00
255
00.
000
000
0.00
703
71.
670
79.
6E+0
86.
0E+0
70.
006
940.
006
79(D
)M
ar30
.738
68±
172
0.00
062
00.
000
001
0.00
175
91.
527
81.
6E+0
72.
0E+0
60.
029
190.
027
63(E
)M
ar30
.612
38±
107
0.00
055
40.
000
001
0.00
126
72.
153
71.
2E+0
61.
6E+0
60.
011
300.
011
13(F
)M
ar30
.656
32±
870.
000
104
0.00
000
10.
000
679
0.3
228
6.2E
+05
9.1E
+05
0.19
110
0.19
430
(G)
Mar
30.6
4146
±60
0.00
026
10.
000
001
0.00
065
91.
660
33.
2E+0
56.
1E+0
50.
042
310.
037
81(H
)M
ar30
.664
28±
0.22
0.00
000
10.
000
001
0.00
000
10.
000
026
301
1750
1.00
000
1.00
000
(I)
Mar
30.6
6426
±0.
200.
000
001
0.00
000
10.
000
001
0.0
000
894
1433
1.00
000
1.00
000
aFo
reac
hca
sein
ours
imul
atio
n,th
eto
ppa
rtof
the
tabl
ein
dica
test
henu
mbe
rofo
ptic
alan
dra
dara
stro
met
ric
mea
sure
men
ts,t
heir
date
span
,an
dth
eno
rmal
ized
root
mea
nsq
uare
sre
sidu
al.
Inth
e“R
esul
ts”
sect
ion
atth
ebo
ttom
,th
efir
stco
lum
nsgi
veth
een
coun
ter
time
and
itsth
ree-
sigm
aun
cert
aint
y.N
omD
isti
sth
eso
lutio
n’s
nom
inal
(hig
hest
prob
abili
ty),
num
eric
ally
inte
grat
edE
arth
appr
oach
dist
ance
onth
egi
ven
date
.Min
Dis
tand
Max
Dis
tare
the
min
imum
and
max
imum
(thr
ee-s
igm
a)ap
proa
chdi
stan
ces
from
the
linea
rize
dco
vari
ance
map
ping
.N-s
igsi
sthe
num
bero
fsta
ndar
dde
viat
ions
requ
ired
fort
hem
appe
dco
vari
ance
ellip
soid
toin
ters
ectt
hesu
rfac
eof
the
Ear
th.T
hene
xtco
lum
nsgi
veth
evo
lum
eof
the
thre
e-si
gma
unce
rtai
nty
regi
onan
dth
ear
eait
proj
ects
into
apl
ane
perp
endi
cula
rto
the
impa
ctor
’sve
loci
tyve
ctor
aten
coun
ter.
The
last
colu
mns
give
the
impa
ctpr
obab
ilitie
scom
pute
dby
the
linea
rize
dm
appi
ngm
etho
dan
dby
the
non-
linea
rm
etho
dus
edby
Sent
ry,J
PL’s
auto
mat
edha
zard
mon
itori
ngsy
stem
.
Radar’s role in prediction and prevention of collisions 53
cases A and C reveals that after the first two radar measurements, the volume ofthe uncertainty region is nine orders of magnitude smaller with the radar+opticalorbit than with the optical-only orbit.
At the conclusion of case B’s 50-day observing window, a 0.027% impact prob-ability is indicated by the optical-only solution. This is noteworthy, but not unusualfor single-apparition objects – there currently are four objects on the Sentry RiskPage with a comparable impact probability. However, with the radar astrometry(case F), a 19% impact probability is indicated at the same point in time. Radarreduces the volume of the uncertainty region at the encounter by five orders ofmagnitude compared to the optical-only case B. A 19% impact probability wouldattract additional resources and would extend the window of optical observabilityseveral months, down to at least magnitude 22 (case G). Due to marginally greaterbias and noise in the simulated data as the target fades from view, the additionaloptical astrometry moves the solution’s nominal close approach slightly furtheraway from the Earth, decreasing the impact probability estimate.
If instead there is no radar data at the discovery apparition, recovery would prob-ably still occur during the optically favorable apparition 13 years after discovery.If so, two such apparitions of optical data conclusively identify the impact eventwhether or not radar data is available (cases H and I), although the radar data reducesthe volume of the uncertainty region by a factor of 29 compared to a solution basedonly on two apparitions of optical data. However, if the recovery does not occur, thenext good opportunity to recover the object and clarify the impact risk, or perhapsto first become aware of it, would be 2 months prior to impact. Radar data duringthe discovery apparition guarantees the recovery by clearly indicating a high impactrisk immediately, providing 34 years of warning instead of 21 years (or possiblyonly a few weeks).
4.2 Negative predictions, positive predictions, and warning time
To a great extent, the dominance of PHA trajectory uncertainties is a temporary one,an artifact of the current discovery phase. Predictions are made for single-apparitionobjects having a few days or weeks of measurements. The uncertainty region in suchcases can encompass a large portion of the inner solar system, thereby generatingsmall but finite impact probabilities that change rapidly as the data arc lengthens,or if high-precision radar delay and Doppler measurements can be made. Impactprobabilities in such cases are effectively a statement that the motion of the asteroidis so poorly known that the Earth cannot avoid passing through the asteroid’s largeuncertainty region – hence the apparent impact “risk.” As optical measurementsare made, the region shrinks. The resulting change in impact probability, up ordown, is effectively a statement about where the asteroid won’t be – a “negative
54 S. J. Ostro and J. D. Giorgini
prediction” – rather than a “positive prediction” of where it will be. This is due tothe modest positional precision of optical measurements.
In contrast, radar measurements naturally provide strong constraints on themotion and hence “positive predictions” about where an asteroid will be decadesand often centuries into the future. Thus radar measurements substantially openthe time-window of positive predictability. However, within a couple of decades,asteroids being found now (but unobserved by radar) will themselves have multipleoptical apparitions and similarly be predictable in a positive way over centuries,as radar cases are now. In this way, orbit uncertainties for present-day radar casesillustrate what the situation will be by mid-century for most of the asteroids knowntoday, and presumably for almost all PHAs as large as 1 kilometer.
Unless a significant impact is predicted to occur in the next few decades, mit-igation will primarily be an issue for multi-apparition asteroids with decades ofobservations behind them (since most objects will typically have that much opti-cal astrometry) or for radar-detected objects, with the impact predictions at leastcenturies in the future. Examination of the next 1000 years will be 30 times aslikely to find an actual impactor than examination of the next few decades. Thissuggests that high-energy mitigation methods may be rendered obsolete beforethey could be implemented, not by technology, but by the changing nature of orbitpredictability as the primary discovery phase ends and observations accumulate.Low-energy methods such as radiation pressure or Yarkovsky modification canpotentially be implemented at lower cost, on timescales compatible with the actualhazard.
4.3 1950 DA
At this writing, there is only one known NEO with a potentially significant possi-bility of collision. For 29075 (1950 DA), integrations of the radar-refined orbit byGiorgini et al. (2002) revealed that in 2880 there could be a hazardous approachnot indicated in the half-century arc of pre-radar optical data. The current nominalorbit represents a risk as large as 50% greater than that of the average backgroundhazard due to all other asteroids from now through 2880, as defined by the PalermoTechnical Scale (PTS value +0.17). 1950 DA is the only known asteroid whosedanger could be above the background level. During the observations, a radar time-delay measurement corrected the optical ephemeris’s prediction by 7.9 km, chang-ing an optical-only prediction of a 2880 close approach to a nominal distance of20 lunar distances into a radar-refined prediction of a nominal distance of 0.9 lunardistances.
The uncertainty in the closeness of 1950 DA’s 2880 approach and hence in theprobability of a collision (which could be as low as zero or as high as 1/300) is due
Radar’s role in prediction and prevention of collisions 55
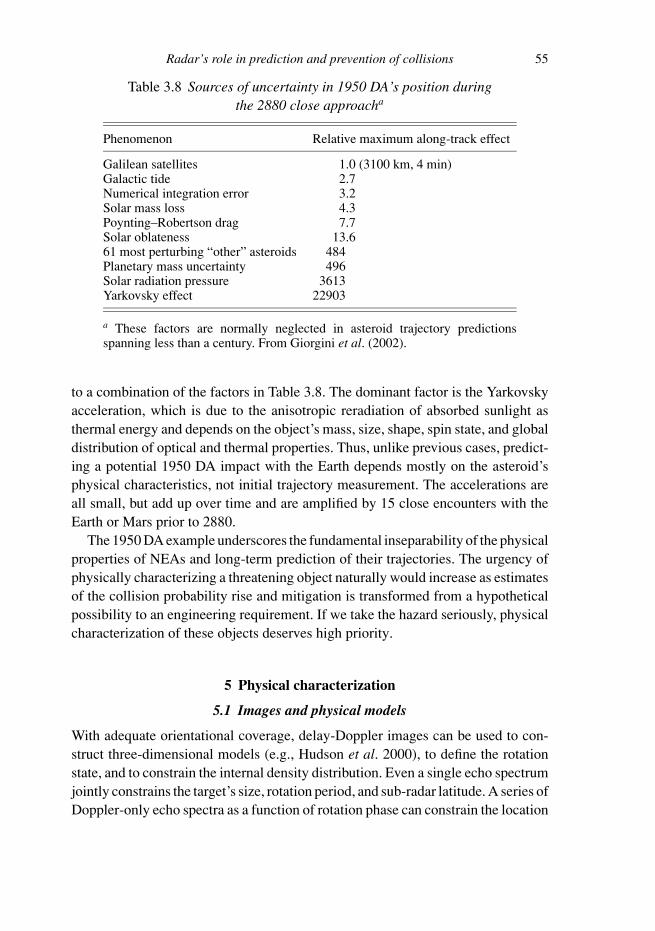
Table 3.8 Sources of uncertainty in 1950 DA’s position duringthe 2880 close approacha
Phenomenon Relative maximum along-track effect
Galilean satellites 1.0 (3100 km, 4 min)Galactic tide 2.7Numerical integration error 3.2Solar mass loss 4.3Poynting–Robertson drag 7.7Solar oblateness 13.661 most perturbing “other” asteroids 484Planetary mass uncertainty 496Solar radiation pressure 3613Yarkovsky effect 22903
a These factors are normally neglected in asteroid trajectory predictionsspanning less than a century. From Giorgini et al. (2002).
to a combination of the factors in Table 3.8. The dominant factor is the Yarkovskyacceleration, which is due to the anisotropic reradiation of absorbed sunlight asthermal energy and depends on the object’s mass, size, shape, spin state, and globaldistribution of optical and thermal properties. Thus, unlike previous cases, predict-ing a potential 1950 DA impact with the Earth depends mostly on the asteroid’sphysical characteristics, not initial trajectory measurement. The accelerations areall small, but add up over time and are amplified by 15 close encounters with theEarth or Mars prior to 2880.
The 1950 DA example underscores the fundamental inseparability of the physicalproperties of NEAs and long-term prediction of their trajectories. The urgency ofphysically characterizing a threatening object naturally would increase as estimatesof the collision probability rise and mitigation is transformed from a hypotheticalpossibility to an engineering requirement. If we take the hazard seriously, physicalcharacterization of these objects deserves high priority.
5 Physical characterization
5.1 Images and physical models
With adequate orientational coverage, delay-Doppler images can be used to con-struct three-dimensional models (e.g., Hudson et al. 2000), to define the rotationstate, and to constrain the internal density distribution. Even a single echo spectrumjointly constrains the target’s size, rotation period, and sub-radar latitude. A series ofDoppler-only echo spectra as a function of rotation phase can constrain the location
56 S. J. Ostro and J. D. Giorgini
of the center of mass with respect to a pole-on projection of the asteroid’s convexenvelope (e.g., Benner et al. 1999a). For objects in a non-principal-axis spin state,the hypothesis of uniform internal density can be tested directly (Hudson and Ostro1995). Given a radar-derived model and the associated constraints on an object’sinternal density distribution, one can use a shape model to estimate the object’sgravity field and hence its dynamical environment, as well as the distribution ofgravitational slopes on the surface, which can constrain regolith depth and interiorconfiguration.
For most NEAs, radar is the only Earth-based technique that can make imageswith useful spatial resolution. Therefore, although a sufficiently long, multi-apparition optical astrometric time base might provide about as much advancewarning of a possibly dangerous close approach as a radar+optical data set, theonly way to compensate for a lack of radar images is with a space mission.
5.2 Extreme diversity
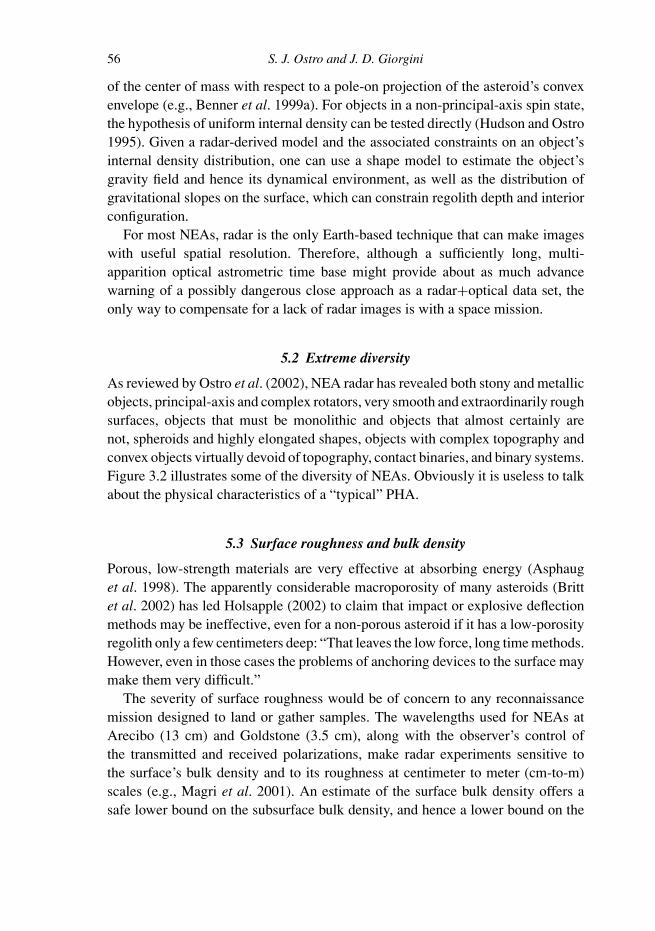
As reviewed by Ostro et al. (2002), NEA radar has revealed both stony and metallicobjects, principal-axis and complex rotators, very smooth and extraordinarily roughsurfaces, objects that must be monolithic and objects that almost certainly arenot, spheroids and highly elongated shapes, objects with complex topography andconvex objects virtually devoid of topography, contact binaries, and binary systems.Figure 3.2 illustrates some of the diversity of NEAs. Obviously it is useless to talkabout the physical characteristics of a “typical” PHA.
5.3 Surface roughness and bulk density
Porous, low-strength materials are very effective at absorbing energy (Asphauget al. 1998). The apparently considerable macroporosity of many asteroids (Brittet al. 2002) has led Holsapple (2002) to claim that impact or explosive deflectionmethods may be ineffective, even for a non-porous asteroid if it has a low-porosityregolith only a few centimeters deep: “That leaves the low force, long time methods.However, even in those cases the problems of anchoring devices to the surface maymake them very difficult.”
The severity of surface roughness would be of concern to any reconnaissancemission designed to land or gather samples. The wavelengths used for NEAs atArecibo (13 cm) and Goldstone (3.5 cm), along with the observer’s control ofthe transmitted and received polarizations, make radar experiments sensitive tothe surface’s bulk density and to its roughness at centimeter to meter (cm-to-m)scales (e.g., Magri et al. 2001). An estimate of the surface bulk density offers asafe lower bound on the subsurface bulk density, and hence a lower bound on the
Radar’s role in prediction and prevention of collisions 57
Figure 3.2 Radar delay-Doppler images and shape models. The top collage showsradar images of (left to right) 1999 JM8 (Benner et al. 2002a), Geographos (Ostroet al. 1996), the binary 1999 KW4 (Ostro et al. 2002), 1950 DA (Giorgini et al.2002), and Golevka (Hudson et al. 2000). The bottom collage shows renderingsof shape models of (left to right) Toutatis (Hudson et al. 2003), Castalia (Hudsonand Ostro 1994), Nyx (Benner et al. 2002b), Bacchus (Benner et al. 1999b), andGolevka (Hudson et al. 2000). The relative scale of the images and models isapproximately correct; Nyx is about 1 km in diameter.
asteroid’s mass. Bulk density is a function of regolith porosity and grain density, soif an asteroid can confidently be associated with a meteorite type, then the averageporosity of the surface can be estimated. Values of porosity estimated by Magriet al. (2001) for nine NEAs range from 0.28 to 0.78, with a mean and standarddeviation of 0.53 ± 0.15. The current results suggest that most NEAs are coveredby at least several centimeters of porous regolith, and therefore the above warningby Holsapple may be valid for virtually any object likely to threaten collision withEarth.
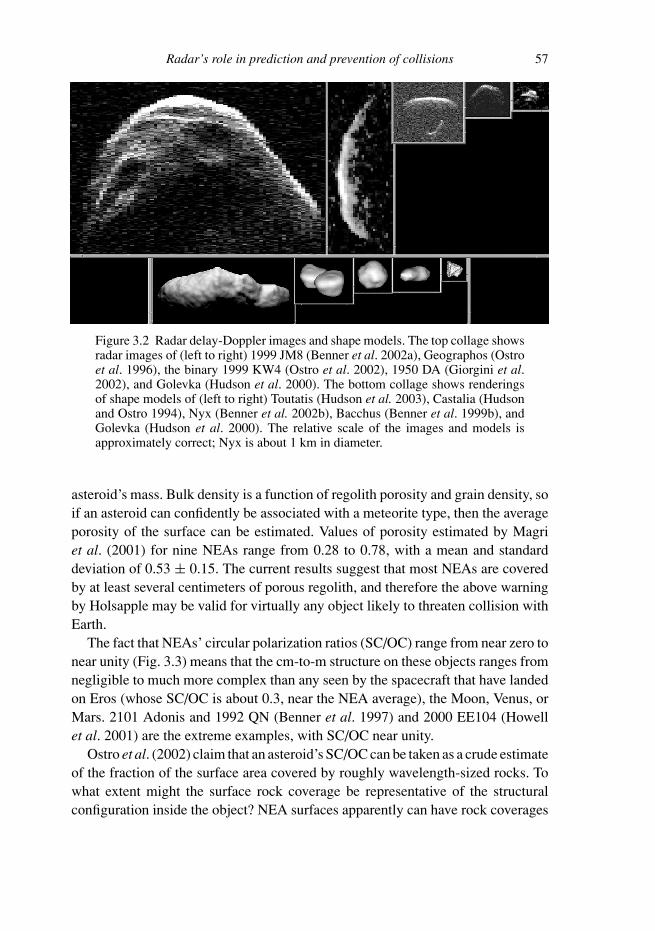
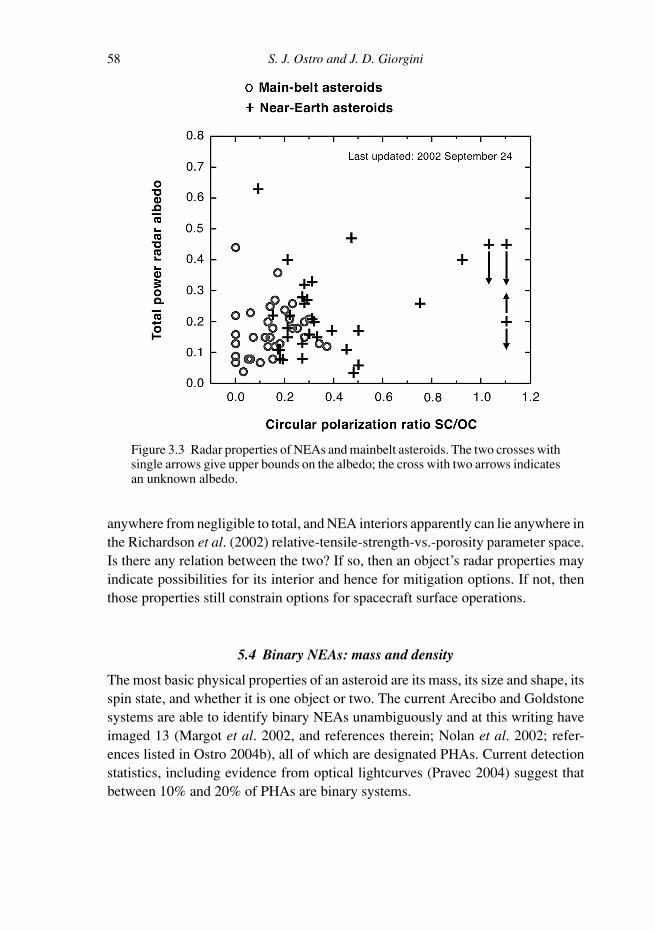
The fact that NEAs’ circular polarization ratios (SC/OC) range from near zero tonear unity (Fig. 3.3) means that the cm-to-m structure on these objects ranges fromnegligible to much more complex than any seen by the spacecraft that have landedon Eros (whose SC/OC is about 0.3, near the NEA average), the Moon, Venus, orMars. 2101 Adonis and 1992 QN (Benner et al. 1997) and 2000 EE104 (Howellet al. 2001) are the extreme examples, with SC/OC near unity.
Ostro et al. (2002) claim that an asteroid’s SC/OC can be taken as a crude estimateof the fraction of the surface area covered by roughly wavelength-sized rocks. Towhat extent might the surface rock coverage be representative of the structuralconfiguration inside the object? NEA surfaces apparently can have rock coverages
58 S. J. Ostro and J. D. Giorgini
Figure 3.3 Radar properties of NEAs and mainbelt asteroids. The two crosses withsingle arrows give upper bounds on the albedo; the cross with two arrows indicatesan unknown albedo.
anywhere from negligible to total, and NEA interiors apparently can lie anywhere inthe Richardson et al. (2002) relative-tensile-strength-vs.-porosity parameter space.Is there any relation between the two? If so, then an object’s radar properties mayindicate possibilities for its interior and hence for mitigation options. If not, thenthose properties still constrain options for spacecraft surface operations.
5.4 Binary NEAs: mass and density
The most basic physical properties of an asteroid are its mass, its size and shape, itsspin state, and whether it is one object or two. The current Arecibo and Goldstonesystems are able to identify binary NEAs unambiguously and at this writing haveimaged 13 (Margot et al. 2002, and references therein; Nolan et al. 2002; refer-ences listed in Ostro 2004b), all of which are designated PHAs. Current detectionstatistics, including evidence from optical lightcurves (Pravec 2004) suggest thatbetween 10% and 20% of PHAs are binary systems.

Radar’s role in prediction and prevention of collisions 59
Analysis of echoes from these binaries is yielding our first measurements ofPHA densities. Delay-Doppler images of 2000 DP107 (Margot et al. 2002) reveala 800-m primary and a 300-m secondary. The orbital period of 1.767 d and semi-major axis of 2620 ± 160 m yield a bulk density of 1.7 ± 1.1 g cm−3 for theprimary. DP107 and the five other radar binaries have spheroidal primaries spin-ning near the breakup-point for strengthless bodies. Whether binaries’ componentswere mutually captured following a highly dispersive impact into a much largerbody (Richardson et al. 2002, and references therein) or formed by tidal disruptionof an object passing too close to an inner planet (Margot et al. 2002), it seemslikely that the primaries are unconsolidated, gravitationally bound aggregates, soHolsapple’s warning applies to them.
5.5 Radar investigations, mission design, and spacecraft navigation
Whether a PHA is single or binary, mitigation will involve spacecraft operationsclose to the object. Maneuvering near a small object is a non-trivial challenge,because of the weakness and complexity of the gravitational environment (Scheereset al. 2000). Maneuvering close to either component of a binary system would beespecially harrowing.
The instability of close orbits looms as such a serious unknown that unlesswe have detailed information about the object’s shape and spin state, it wouldbe virtually impossible to design a mission capable of autonomous navigationclose to the object. Control of a spacecraft orbiting close to an asteroid requiresknowledge of the asteroid’s location, spin state, gravity field, size, shape and mass,as well as knowledge of any satellite bodies that could pose a risk to the spacecraft.Radar can provide information on all these parameters. Knowledge of the target’sspin state as well as its shape (and hence nominal gravity harmonics under theassumption of uniform density) (Miller et al. 1999) would permit design of stableorbits immune to escape or unintended surface impact. (Upon its arrival at Eros,the NEAR Shoemaker spacecraft required almost 2 months to refine its estimate ofthe gravity field enough to ensure reliable close-approach operations.)
If it turns out to be necessary to have a sequence of missions beginning withphysical reconnaissance and ending with a deflection, then a radar-derived physicalmodel would speed up this process, reduce its cost, decrease complexity in thedesign and construction of the spacecraft, and improve the odds of successfulmitigation. A reduced need for contingency fuel could be significant enough toallow a smaller launch vehicle for the mission. For example, the result might save$100 million via a switch from a Titan III launch vehicle to a Titan IIS, or $200million for a switch from a Titan IV to a Titan III. The ability of prior radar

60 S. J. Ostro and J. D. Giorgini
reconnaissance to reduce mission cost, complexity and risk was embraced by theDepartment of Defense in their proposed Clementine II multiple-flyby mission(Hope et al. 1997), all of whose candidate targets either had already been observedwith radar (Toutatis, Golevka) or were radar observable prior to encounter (1987OA, 1989 UR).
Ironically, although PHAs include the lowest-�V rendezvous targets in thesolar system, Japan’s Hayabusa (MUSES-C) sample-return mission to 25143Itokawa (1998 SF36) is the world’s first rendezvous mission to a PHA. Resultsof radar imaging of that asteroid (Ostro et al. 2001) are being used by theJapanese Institute of Space and Astronautical Science in planning for the late2005 rendezvous, and radar observations during the asteroid’s mid-2004 closeapproach will be used for navigational assistance and to refine the modelderived from the 2001 images. Radar-derived shape models of small NEAs havemade it possible to explore the evolution and stability of close orbits (e.g.,Scheeres et al. 1996, 1998), and this experience is currently being applied toHayabusa.
Radar refinement of physical properties and radar refinement of orbits are verytightly coupled: shape modeling necessarily involves refinement of the delay-Doppler trajectory of the center of mass through the observing ephemerides. Withvery precise radar astrometry, a spacecraft lacking onboard optical navigation couldbe guided into orbit around, or collision course with, an asteroid. For exam-ple, consider how Goldstone observations shrunk the positional error ellipsoidof Geographos, an object already heavily observed by optical telescopes, justprior to a planned Clementine flyby of that target on August 31, 1994 (Ostro1996). Before Goldstone ranging observations carried out during August 28–29, the overall dimension of the positional error ellipsoid was ∼11 km. Theradar astrometry collapsed the ellipsoid’s size along the line of sight to severalhundred meters, so its projection toward Clementine on its inbound leg wouldhave been 11 × 2 km. Goldstone–VLA radar aperture synthesis angular astrom-etry (see discussions by de Pater et al. 1994, and Hudson et al. 2000), couldhave shrunk the error ellipsoid’s longest dimension to about 1 km, about halfof Geographos’ shortest overall dimension. For less well-observed objects, thegains could be substantially more, as with 1862 Apollo’s 3750 km radar rangecorrection.
5.6 Modeling the efficiency of explosive deflection
Mitigation scenarios include the use of explosives to deflect the projectile (Ahrensand Harris 1992). However, as demonstrated by Asphaug et al. (1998), the outcome
Radar’s role in prediction and prevention of collisions 61
of explosive energy transfer to an asteroid or comet (via a bomb or a hypervelocityimpact) is extremely sensitive to the pre-existing configuration of fractures andvoids, and also to impact velocity. Just as porosity damps shock propagation, shel-tering distant regions from impact effects while enhancing energy deposition atthe impact point, parts of multi-component asteroids are preserved, because shockwaves cannot bridge inter-lobe discontinuities. A radar-derived shape model wouldallow more realistic investigation (Asphaug et al. 1998) of the potential effective-ness of nuclear explosions in deflecting or destroying a hazardous asteroid.
5.7 Comets
The risk of a civilization-ending impact during this century is about the same asthe risk of a civilization-ending impact by a long-period comet (LPC) during thismillennium. At present, the maximum possible warning time for an LPC impactprobably is between a few months and a few years. Comet trajectory prediction ishampered by optical obscuration of the nucleus and by uncertainties due to time-varying, non-gravitational forces. Comets are likely to be very porous aggregates,so concern about the ineffectiveness of explosive deflection is underscored in thecase of comets.
Radar reconnaissance of an incoming comet would be the most reliable way toestimate the size of the nucleus (Harmon et al. 1999), could reveal the prevalence ofcentimeter-and-larger particles in the coma (Harmon et al. 1989, 1997), and wouldbe valuable for determining the likelihood of a collision.
6 Recommendations
How much effort should be made to make radar observations of NEAs? For newlydiscovered objects, it is desirable to guarantee recovery and to ensure accurateprediction of close approaches well into the future, and at least throughout this cen-tury. Moreover, a target’s discovery apparition often provides the most favorableradar opportunity for decades and hence a unique chance for physical character-ization that otherwise would require a space mission. Similarly, even for NEAsthat have already been detected, any opportunity offering a significant incrementin echo strength and hence imaging resolution should be exploited. Binaries andnon-principal-axis rotators, for which determination of dynamical and geophys-ical properties requires a long, preferably multi-apparition time base, should beobserved extensively during any radar opportunity.
Construction of the proposed Large Synoptic Survey Telescope (LSST) has beenendorsed (Belton et al. 2002), in part as a means to extend the Spaceguard Survey’s
62 S. J. Ostro and J. D. Giorgini
90% completeness goal for kilometer-sized objects down to 300-m objects. How-ever, both Arecibo and Goldstone are already heavily oversubscribed, with onlyseveral percent of their time available for asteroid radar. Over the coming decades,it may become increasingly clear that most of the NEO radar reconnaissance thatis technically achievable with Arecibo and Goldstone is precluded by the limitedaccessibility of those instruments, and that a dedicated NEO radar instrument isdesirable.
An ideal NEO radar system (Ostro 1997) might consist of two antennas like the100-m NRAO Greenbank Telescope (GBT, in West Virginia), one with a megawatttransmitter and one just for receiving, separated by a few tens of kilometers, operat-ing at a wavelength of 0.9 cm (Ka band). Each antenna’s gain could be 88 dB, com-pared to 73.5 dB for Arecibo. A two-antenna (bistatic) configuration would elimi-nate the frequent transmit/receive alternation and klystron power cycling requiredin single-antenna observations of NEOs and would double the available integra-tion time. The antennas would be fully steerable, so any object could be trackedat least several times longer than at Arecibo. The combination of all these factorswould make this dedicated NEO radar an order of magnitude more sensitive thanthe upgraded Arecibo telescope. The capital cost of building this system now, ascalibrated by the GBT experience, would be within 10% of $180 million, compa-rable to the cost of a small Discovery mission and very close to the estimated costof the LSST.
Acknowledgment
This research was conducted at the Jet Propulsion Laboratory, California Instituteof Technology, under contract with the National Aeronautics and Space Adminis-tration (NASA). S. Ostro was partially supported by the Steven and Michele KirschFoundation.
References
Ahrens, T. J. and Harris, A. W. 1992. Deflection and fragmentation of near-Earthasteroids. Nature 360, 429–433.
Asphaug, E., Ostro, S. J., Hudson, R. S., et al. 1998. Disruption of kilometre-sizedasteroids by energetic collisions. Nature 393, 437–440.
Beatty, J. K. 2002. Arecibo radar gets 11th-hour reprieve. Sky Publishing Corp. [citedApril 23, 2004]. Available online athttp://skyandtelescope.com/news/archive/article 285 1.asp.
Belton, M. J., Porco, C., A’Hearn, M., et al. (2002). New Frontiers in the Solar System:An Integrated Exploration Strategy Solar System Exploration Survey. Washington,DC: National Research Council.
Radar’s role in prediction and prevention of collisions 63
Benner, L. A. M., Ostro, S. J., Giorgini, J. D., et al. 1997. Radar detection of near-Earthasteroids 2062 Aten, 2101 Adonis, 3103 Eger, 4544 Xanthus, and 1992 QN. Icarus130, 296–312.
Benner, L. A. M., Ostro, S. J., Rosema, K. D., et al. 1999a. Radar observations of asteroid7822 (1991 CS). Icarus 137, 247–259.
Benner, L. A. M., Hudson, R. S., Ostro, S. J., et al. 1999b. Radar observations of asteroid2063 Bacchus. Icarus 139, 309–327.
Benner, L. A. M., Ostro, S. J., Nolan, M. C., et al. 2002a. Radar observations of asteroid1999 JM8. Meteor. and Planet. Sci. 37, 779–792.
Benner, L. A. M., Ostro, S. J., Hudson, R. S., et al. 2002b. Radar observations of asteroid3908 Nyx. Icarus 158, 379–388.
Britt, D. T., Yeomans, D., Housen, K., et al. 2002. Asteroid density, porosity, andstructure. In Asteroids III, eds. W. F. Bottke, A. Cellino, P. Paolicchi, and R. P.Binzel, pp. 485–500. Tucson, AZ: University of Arizona Press.
Chesley, S. R. 2004. Current impact risks. California Institute of Technology, Pasadena[cited April 23, 2004]. Available online at http://neo.jpl.nasa.gov/risks.
Chesley, S. R., Chodas, P. W., Milani, A., 2002. Quantifying the risk posed by potentialEarth impacts. Icarus 159, 423–432.
de Pater, I., Palmer, P., Mitchell, D. L., et al. 1994. Radar aperture synthesis observationsof asteroids. Icarus 111, 489–502.
Giorgini, J. D. 2004. Small-body astrometric radar observations. California Institute ofTechnology, Pasadena [cited April 23, 2004]. Available online athttp://ssd.jpl.nasa.gov/radar data.html.
Giorgini, J. D., Ostro, S. J., Benner, L. A. M., et. al. 2002. Asteroid 1950 DA’s encounterwith Earth in 2880: physical limits of collision probability prediction. Science 296,132–136.
Goldstein, R. M. 1968. Radar observations of Icarus. Science 162, 903–904.Harmon, J. K., Campbell, D. B., Hine, A. A., et al. 1989. Radar observations of comet
IRAS-Araki-Alcock 1983d. Astroph. J. 338, 1071–1093.Harmon, J. K., Ostro, S. J., Benner, L. A. M., et al. 1997. Comet Hyakutake (C/1996 B2):
radar detection of nucleus and coma. Science 278, 1921–1924.Harmon, J. K., Campbell, D. B., Ostro, S. J., et al. 1999. Radar observations of comets.
Planet. Space Sci. 47, 1409–1422.Holsapple, K. A. (2002). The deflection of menacing rubble pile asteroids. In Extended
Abstracts from the NASA Workshop on Scientific Requirements for Mitigation ofHazardous Comets and Asteroids, Arlington, VA, September 3–6, 2002, eds. E.Asphaug and N. Samarasinha. pp. 49–52.
Hope, A. S., Kaufman, B., Dasenbrock, R., et al. 1997. A Clementine II mission to theasteroids. In Dynamics and Astrometry of Natural and Artificial Celestial Bodies,Proceedings of IAU Colloquium 165, eds. I. M. Wytrzyszczak, J. H. Lieske, andR. A. Feldman, pp. 183–190. Dordrecht, The Netherlands: Kluwer.
Howell, E. S., Nolan, M. C., DeRemer, L., et al. 2001. Arecibo radar observations ofnear-Earth asteroid 2000 EE104. Bull. Am. Astron. Soc., 33, 1153.
Hudson, R. S. and Ostro, S. J. 1994. Shape of asteroid 4769 Castalia (1989 PB) frominversion of radar images. Science 263, 940–943.
1995. Shape and non-principal-axis spin state of asteroid 4179 Toutatis. Science 270,84–86.
Hudson, R. S., Ostro, S. J., Jurgens, R. F., et al. 2000. Radar observations and physicalmodeling of asteroid 6489 Golevka. Icarus 148, 37–51.
64 S. J. Ostro and J. D. Giorgini
Hudson, R. S., Ostro, S. J., and Scheeres, D. J. 2003. High-resolution model of asteroid4179 Toutatis. Icarus 161, 348–357.
Magri, C., Consolmagno, G. J., Ostro, S. J., et al. 2001. Radar constraints on asteroidregolith compositions using 433 Eros as ground truth. Meteor. and Planet. Sci. 36,1697–1709.
Margot, J. L., Nolan, M. C., Benner, L. A. M., et al. 2002. Binary asteroids in thenear-Earth object population. Science 296, 1445–1448.
Milani, A., Chesley, S. R., Chodas, P. W., et al. 2002. Asteroid close approaches:analysis and potential impact detection. In Asteroids III, eds. W. F. Bottke,A. Cellino, P. Paolicchi, and R. P. Binzel, pp. 55–69. Tucson, AZ: University ofArizona Press.
Miller, J. K., Antreasian., P. J., Gaskell, R. W., et al. 1999. Determination of Eros physicalparameters for near-Earth asteroid rendezvous orbit phase navigation. Am. Astron.Soc. Paper no. 99-463.
Morrison, D., Harris, A. W., Sommer, G., et al. 2002. Dealing with the impact hazard.In Asteroids III, eds. W. F. Bottke, A. Cellino, P. Paolicchi, and R. P. Binzel,pp. 739–754. Tucson, AZ: University of Arizona Press.
Nolan, M. C., Howell, E. S., Ostro, S. J., et al. 2002. 2002 KK 8. IAU Circ. No. 7921.Ostro, S. J. 1994. The role of groundbased radar in near-Earth object hazard identification
and mitigation. In Hazards due to Comets and Asteroids, eds. T. Gehrels,pp. 259–282. Tucson, AZ: University of Arizona Press.
1996. Radar astrometry of asteroids, comets and planetary satellites. In Dynamics andEphemerides of the Solar System, Proceedings of IAU Symposium 172, eds. S.Ferraz-Mello, B. Morando, and J.-E. Arlot, pp. 365–372. Dordrecht, TheNetherlands: Kluwer.
1997. Radar reconnaissance of near-Earth objects at the dawn of the next millennium.Ann. New York Acad. Sci. 822, 118–139.
2004a. Echo strength predictions. California Institute of Technology, Pasadena [citedApril 23, 2004]. Available online at http://echo.jpl.nasa.gov/∼ostro/snr/.
2004b. Radar-detected asteroids. California Institute of Technology, Pasadena [citedApril 23, 2004]. Available online at http://echo.jpl.nasa.gov/ asteroids/index.html.
Ostro, S. J., Campbell, D. B., Chandler, J. F., et al. 1991. Asteroid radar astrometry.Astron. J. 102, 1490–1502.
Ostro, S. J., Jurgens, R. F., Rosema, K. D., et al. 1996. Radar observations of asteroid1620 Geographos. Icarus 121, 44–66.
Ostro, S. J., Benner, L. A. M., Nolan, M. C., et al. 2001. Radar observations of asteroid25143 (1998 SF36). Bull. Am. Astron. Soc. 33, 1117.
Ostro, S. J., Hudson, R. S., Benner, L. A. M., et al. 2002. Asteroid radar astronomy. InAsteroids III, eds. W. F. Bottke, A. Cellino, P. Paolicchi, and R. P. Binzel,pp. 151–168. Tucson, AZ: University of Arizona Press.
Pettengill, G. H., Shapiro, I. I., Ash, M. E., et al. 1969. Radar observations of IcarusIcarus, 10, 432–435.
Pravec, P. 2004. Binary near-Earth asteroids. Ondrejov Observatory [cited April 23,2004]. Available online at http://www.asu.cas.cz/∼asteroid/binneas.htm.
Richardson, D. C., Leinhardt, Z. M., Melosh, H. J., et al. 2002. Gravitational aggregates:evidence and evolution. In Asteroids III, eds. W. F. Bottke, A. Cellino, P. Paolicchi,and R. P. Binzel, pp. 501–515. Tucson, AZ: University of Arizona Press.
Scheeres, D. J., Ostro, S. J., Hudson, R. S., et al. 1996. Orbits close to asteroid 4769Castalia. Icarus 121, 67–87.
1998. Dynamics of orbits close to asteroid 4179 Toutatis. Icarus 132, 53–79.

Radar’s role in prediction and prevention of collisions 65
Scheeres, D. J., Williams, B. G., and Miller, J. K. 2000. Evaluation of the dynamicenvironment of an asteroid: applications to 433 Eros. J. Guidance, Control andDynamics 23, 466–475.
Shapiro, I. I., Ash, M. E., and Smith, W. B. 1968. Icarus: further confirmation of therelativistic perihelion precession. Phys. Rev. Lett. 20, 1517–1518.
Yeomans, D. K., Ostro, S. J., and Chodas, P. W. 1987. Radar astrometry of near-Earthasteroids. Astron. J. 94, 189–200.
Zellner, B. 1979. Asteroid taxonomy and the distribution of the compositional types. InAsteroids, ed. T. Gehrels, pp. 783–806. Tucson, AZ: University of Arizona Press.