Embed Size (px)
Citation preview
1
The role of safety perceptions for
airline passenger loyalty
and the influence of aviation expertise
Robin Valkenburcht
838315240
Open University Netherlands
Faculteit : Managementwetenschappen
Opleiding : Master of Science in Management
Begeleider/examinator : Prof. dr. Janjaap Semeijn
Medebeoordelaar : Dr. Paul Ghijsen
July, 2013
brought to you by COREView metadata, citation and similar papers at core.ac.uk
provided by DSpace at Open Universiteit Nederland
2
The role of safety perceptions for
airline passenger loyalty
and the influence of aviation expertise
Abstract
Rationally, there is no need to have a fear of flying. Aviation is one of the safest modes of
transportation. However, many people feel uncomfortable prior to and during their flight,
ranging from uneasiness to total panic. Taking this into account, it is interesting to
understand to which extent passengers consider safety when they book their ticket. Or from
an airline marketing perspective it could be beneficial to know whether safety plays a role in
marketing and communication strategies in order to convince the potential customer to
choose for the respective airline.
This thesis tries to answer the question what the influence is of safety in the decision to
select a certain airline and if it differs for regular passengers, compared to aviation experts.
Data is collected by means of a questionnaire with a sample of 134 persons. In order to
establish the effect of aviation expertise in the airline selection decision making process, the
group consisted of both aviation experts and non-experts. The experts were (former) pilots
and air traffic controllers. It may be assumed that because of their knowledge of the aviation
system and their experience with safety related issues, they may make other choices than
the regular public.
It may be expected that if passengers perceive risk of flying significantly, that the safest
airline is the most successful one. With the upcoming market of low cost carriers (LCC) this is
proven to be not the case. Ticket prices have gone down to as far as zero, which may lead to
a different balance towards safety than the full service carriers (FSC). In that case one may
wonder why price is the most contributing factor when it comes to satisfaction and loyalty.
Earlier research has been performed on the elements that affect service quality and how this
affects satisfaction and passenger loyalty. From literature it is known that assurance,
responsiveness, empathy, reliability, tangibles, market presence and fare level all play their
3
role when it comes to satisfaction and loyalty. This research adds safety and the role of
aviation expertise as elements to this process.
It was found that for the regular passengers only tangibles appeared to play a significant
positive role in their perception of safety and satisfaction. Market presence has a significant
positive relation to safety perception, whereas fare level relates significantly positive to
satisfaction. Finally, satisfaction appears to relate convincingly significant positive to loyalty.
In other words, the most obvious conclusion may be that a cheap-ticket passenger is
satisfied and that the satisfied passenger is willing to be loyal to the airline. So far, this
conclusion may not be very surprising. Secondly, passengers appear to support the
WYSIWYG principle. Whether that be a nicely painted aircraft or a correctly dressed flight
attendant or even the number of commercials in the different media, it plays a positive role
in the perceived safety. Surprisingly no relationship could be established between fare level
and safety, whereas exactly the trade-off between the two is an actual discussion.
For the aviation experts it was also found that there is no significant moderation between
the constructs of service quality and safety. Also the relationship between the constructs of
service quality and satisfaction is non-significant. The relationship between fare level and
both independent variables is also not convincing; this is different for market presence,
which relates positively to both. Thirdly however, there is a strong positive relation between
satisfaction and loyalty. In other words, satisfied passengers return to the respective airline.
That experts consider safety as an argument to select a specific airline, could not be
established.
For airline marketing strategies the outcome may be of relevance. The physical and frequent
appearance of the airline brand increases passengers’ service perception and leads to
satisfaction and loyalty. This may not be surprising as safety statistics are not very
transparent for passengers and conclusions from them may be difficult to draw. However, it
is surprising that for those who have access to safety data and are able to interpret them,
the weight of safety does not significantly differ. Further research can be done as to why
safety and loyalty are not significantly related and how passengers perceive the relation
between fare level and safety.
4
Table of Contents
1. Introduction 6
1.1 Background and purpose
1.2 Problem statement and research questions
1.3 Contribution
1.4 Research outline
2. Literature 12
2.1 Airline selection
2.2 Experts
2.3 Aviation safety
2.4 Satisfaction
2.5 Loyalty
3. Methodology 18
3.1 Sample and demographics
3.2 Survey design and questionnaire development
4. Results 20
4.1 The measurement model
4.2 Content validity
4.3 Unidimensionality and construct validity
4.4 Structural model
4.5 Improved model
5
4.6 Hypothesis testing
4.6.1 The influence of service quality on safety perception
4.6.2 The moderating effect of expert knowledge of service quality on safety perception
4.6.3 The influence of safety perception on satisfaction
4.6.4 The influence of service quality on satisfaction and satisfaction on loyalty
4.6.5 Mediation of safety perception on the relation between service quality and satisfaction
5. Conclusions 33
5.1 Discussion
5.2 Conclusion
5.3 Implications for theory
5.4 Implications for practice
5.5 Limitations and suggestions for further research
References
Appendix A: Descriptive Statistics on Item Level
Appendix B: Constructs an Items
Appendix C: Questionnaire
6
1. Introduction
1.1 Background and purpose
Aircraft crashes do not occur very often. But when it happens, it is spread out in the
newspapers. Terrible pictures of fire and smoke between debris and suitcases cover the
news. In a single accident many people may lose their lives. This must be the reason that an
irrational process starts in many people: fear of flying! Around 30% of the people has a
certain fear of flying. It would be expected that airlines emphasized their safety figures in
any marketing campaign in order for the public to understand that they are the safest airline.
Surprisingly, they do not.
Humans fly already for over one hundred years. In the beginning many accidents occurred,
and pioneers have taken tremendous risks in order to improve technological developments.
Perhaps from that moment on the uncomfortable fear of flying developed in our genes. It is
very well known that over the last decades flying has become one of the safest modes of
transportation. In Europe only 1,6 per 1 million flights end in a crash (EASA, 2011). From a
rational point of view everybody is aware of these figures. Nevertheless do many passengers
feel slightly uncomfortable before and during their flight.
If safety were to be that important for passengers , it would be easy for airlines to adapt this
subject in their marketing strategies. The safest airline would be the most successful airline.
We know this is not the case. It may even be the other way around. In the last decade a
massive increase in the number of low cost carriers (LCC) took place. Low cost potentially
means that less money is made available for safety related tasks. Despite this fact, the LCC
market is very successful and does not seem to have an image problem, even though
because of their short history not many incident statistics are available.
Not much research has been performed on the relation between safety and loyalty.
Rationally this relationship must be clearly visible. Why would otherwise the Netherlands
national carrier use the term “reliable airline” in its marketing strategies? But how can the
popularity of the LCC’s be uncovered if safety is considered crucial by passengers in their
7
airline selection? Identical research has been done on the relationship between safety and
loyalty, but it had been concluded that the data collection had been less representative
(students only). Therefore this thesis has collected data from both aviation experts and
regular passengers, working in the aviation sector. It may be assumed that these
respondents are more mature, have a good vision on safety and have less financial
constraints that may affect their airline selection.
1.2 Problem statement and research questions
In aviation, safety and low cost seem to contradict (IATA, 2012). Properly trained pilots and
adequately maintained aircraft are paramount for a safe operation (EASA, 2011). The
financial margins in aviation are small and over the last few years only little profit has been
booked for most of the air carriers, if any (Eurocontrol, 2012). At the same time, passengers
are less prepared to pay a realistic price for their ticket (Dresner, 2006). Since the start of the
low cost carriers, about fifteen years ago, tickets had been “sold” for as little as one euro.
Any relationship between the actual cost price and the ticket price appears to be entirely
lost. Low cost carriers use a different type of business model than the more traditional
carriers (Franke, 2004). These companies have low overhead and the ticket covers only the
journey, without any extra’s. Short stretches are flown with high frequency and there is no
real robust network. Personnel salaries are much lower than with traditional carriers. Taking
a closer look at the types of LCC it seems that in general two types of them exist
(Dobruszkes, 2006). Firstly the airlines that operate leased aircraft that have been registered
in countries with a poor aviation authority that fly as many tourists into countries for very
low fares. These carriers exist only for a limited period and have a questionable reputation.
Secondly legacy type airlines that have been registered in Western-European countries, own
their aircraft and have a solid network to and from mainly secondary airports. Easyjet and
Ryanair are examples of the latter.
Especially the first category of questionable airlines caused the LCC market a bad reputation
(ILenT, 2006). An increasing number of incidents seemed to confirm the idea of a tension
between low cost and aviation safety. Passengers that have the (financial) possibility to
8
spend money on a ticket of a traditional carrier, do so. Meanwhile Easyjet and Ryanair have
proven to be very reliable airlines, thanks to e.g. their excellent safety figures by having little
incidents, although recent incidents may have opened a debate on this topic (IAA, 2013).
Notwithstanding recent discussions, for the sake of this research, this type of LCC is
considered to be a legacy carrier.
Passengers travelling with an LCC may state that they trust the airline because of the
aviation authority that is responsible for the safety oversight, which causes that airlines are
more or less comparable to each other. Hence that an identical risk exists between every
two airlines in the system. This may be true from a formal perspective, however it is
frequently forgotten that there is a significant range between safe and safer. The level of
compliance with international standards and the quality of safety oversight affect the risk
considerably (Button, 2004). On top of that the legacy carriers very often already exist for a
very long time and even have the role of national carrier. A good reputation is paramount in
order to safeguard continuity. Although difficult to prove statistically because of the low
number of aviation incidents, it must be the case that there are relatively safe and relatively
unsafe airlines. So why do people still select LCC to fly to their destination? In other words,
when are passengers loyal to an airline, or when are they prepared to switch to another
one?
This thesis introduces a new element to existing research. Literature so far has not made a
distinction between the regular passenger and the aviation expert. Perhaps, the aviation
professional is otherwise loyal to an airline as they may score differently to constructs than
non-professionals do. Therefore, an important part of the thesis is dedicated to expertise,
which leads to the question if aviation professionals e.g. pilots and air traffic controllers
make a different selection if they fly an airline as a passenger, because of their knowledge of
the aviation system and the role of safety in it? In other words, how does expertise
moderate from service quality to safety perception? These are the central questions in this
research.
9
The upcoming markets of the LCC’s push loyalty to its limits. It is therefore relevant for
airlines to know what exactly drives safety perception and what are the implications for their
marketing strategies.
The central question that this thesis tries to cover is:
‘What is the role of safety perceptions for airline passenger loyalty and what is the
influence of aviation expertise?’
The problem statement is detailed in the following research questions:
1. What is the influence of service quality on safety perception?
2. Does expert knowledge moderate the effect of service quality on safety perception?
3. What is the influence of safety perception on satisfaction?
4. What is the influence of service quality on satisfaction and consequently, indirectly
on loyalty?
5. Does safety perception mediate the relation between service quality and
satisfaction?
1.3 Contribution
For airline operators it is important to understand why the potential customer makes a
particular selection for the airline. Therefore it is frequently being researched as to which
elements a customer finds important to re-select a specific airline for an upcoming journey.
Thanks to Parasuraman (1988) and later Cunningham (2002) we know to which aspects a
passenger judges an airline. What is also clear (Janic, 2000) is that the perceived risk to fly
plays a certain role for the potential passenger. What counts then is the perception the
passenger has towards the airline and towards the aviation system as a whole. Also
important is if there were any known accidents or incidents in the recent past and if there
10
was large media coverage of it. For the airline there is not much possible to change this
variable. Flying is by far the safest mode of transportation.
Not much research has been performed on how passenger loyalty for a specific airline may
be influenced and in how far it is affected by flight safety. A difference may be made by
passengers of low cost carriers (LCC) and full service carriers (FSC). The main definition of an
LCC is that it strongly reduces costs compared to FSC, by aiming for simplicity, efficiency,
productivity and high utilization of assests (O’Connel, 2005).
This research tries to reveal the role of safety on passenger loyalty. Therefore it has been
investigated if there is a positive relation between the constructs from service quality,
market presence and fare level on safety perception and satisfaction.
1.4 Research outline
The first chapter reveals the scientific relevant problem statement and provides a clearly
motivated argumentation for this. It also makes clear the relevance of the research. Finally it
shows how the problem statement is being dealt with in the thesis.
The second chapter addresses a synthesis of scientific research. A subdivision is made from
the central question in chapter one into research questions, and links them to the existing
literature. The relevant sources are quoted and put into the perspective of the research
questions. More specific, this chapter identifies the factors that affect passenger’s
perception of service quality. It also explains the role of experts and describes aviation
safety. This way, the scientific contribution of the thesis is further explained.
Whereas the second chapter describes all relevant literature, the third chapter will focus on
survey techniques and the statistical method that answers the questions to the research
questions.
The fourth chapter deals with the results of the various analyses that are done in the
statistical software programs. It starts with the empirical test of the conceptual model for
which Partial Least Squares (PLS) is used. An answer is given to the respective hypotheses
11
from the second chapter and a mediating and moderating exercise is performed where
found necessary in order to establish the role of the constructs.
The last chapter summarises the findings of the research. A flashback is made to the
literature in chapter two in order to establish the relationship between the results and the
literature. It ends with the relevant practical implications of the research and makes
suggestions for further research.
12
2. Literature
This chapter addresses a synthesis of scientific research. A subdivision is made from the
central question in chapter one into research questions, and links them to the existing
literature. The relevant sources are quoted and put into the perspective of the research
questions. More specific, this chapter identifies the factors that affect passenger’s
perception of service quality. It also explains the role of experts and describes aviation
safety. This way, the scientific contribution of the thesis is further explained.
2.1 Airline selection
The main goal of this research is to decide what makes passenger loyalty select a certain
airline again. Initially the impact of five constructs (assurance, responsiveness, empathy,
reliability, tangibles) will be analyzed with reference to their impact on safety and
satisfaction. Secondly the research tries to find an answer to the question which effect both
aspects have on loyalty. Finally, research should discover whether safety perception differs
for aviation experts as air traffic controllers and pilots from regular passengers. One would
expect that safety is perceived differently by experts based on their extensive knowledge of
the aviation system and that this would have an effect on their satisfaction
Substantial research is being done on the possibility to rate the quality of an airline, but
because of the incomparability of the items it is found difficult to compare the quality of
airlines in relation to each other.
Risk is the probability of an occurrence multiplied by the severity of the impact. Experienced
risk may be based on emotion and therefore intuition plays a role in the perception of
individuals (Janic, 2000). The selection of an airline, according to Proussaloglou and
Koppelman (1995) is based on a combination of factors. Gilbert and Wong (2003) have found
that safety is an important aspect for the passenger to base its airline choice on. He also
found that aspects like punctuality, responsiveness and frequent flyer programs and inflight
entertainment were important.
13
Quality of an airline is difficult to measure and almost incomparable, as all airlines have
unique characteristics (Ling Feng-I, 2005). Nevertheless, Parasuraman, Zeithaml and Berry
(1995) attempted to measure service quality (Parasuraman, 1985). The research focused on
tangibles, reliability, responsiveness, assurance and empathy (Cunningham, 2002). A survey
had been designed that had to show the differences in expectation and experience.
However, when it proved to be confusing for the respondents it was assumed that only
expectations could be tested as passengers base their expectations on those service
elements.
Apart from the above mentioned aspects, ticket price is seen as an important determent for
airline choice; especially in a high risk situation (V.A. Zeithaml, Bitner, M.J., Gremler, D.D.,
2006). In those situations a high ticket price reflects a good quality. It is however evident
that a low price is attractive for passengers (Prousaloglou, 1995). Research by O’connell and
Williams confirmed that the choice for a low cost carrier is mainly based on the low price
(2005).
Familiarity with the name of an organization is of great importance for a long standing
relationship with a customer. This may contribute to trust from passengers which leads to
loyalty (Blois, 2000). On top of that it appears that price elasticity for leisure flights is far
higher than that of business trips (Dresner, 2006). Finally Proussaloglou and Koppelman
show that the availability of a frequent flyer program has a strong influence on airline choice
(1995).
In contrast to the results of O’Connel and Williams (2005), Gilbert and Wong (2003)
discovered that safety is the most decisive criteria in airline selection. To make the matter
even more complex, It was found that “the higher the price, the higher the perceived safety”
(Ching Biu Tse, 1999) seemed to be the case.
Hypothesis 1: Service quality positively influences safety perception
14
2.2 Experts
The value of experts is often being discussed. “No lesson seems to be so deeply inculcated
by the experience of life as that you never should trust experts” (Lord Salisbury, 1877).
Shanteau (1992) researched expertise from a different angle and used that perspective in
order to develop new insight in the competence of experts. For simplification purposes the
definition of expert in this research is limited to (former) licensed airline pilot or air traffic
controller (ATCO). It is perceived that both will have a profound and in depth knowledge of
aviation safety. The question is if that leads to a different type of loyalty to an airline,
compared to a regular passenger.
In the light of this study it is assumed that experts are professionals that are part of the
aviation system. In aviation by far the most recognised experts are pilots and ATCO’s. This
type of professional knows the ins and outs of its own airline or air traffic control
organisation and the details of other players in the system. They have a fair knowledge how,
both on organisational level and on individual basis, safety management systems are dealt
with and are able to judge the role and quality of the oversight authorities. It is for that
reason that in the search for experts, emphasis is being put on organisations where many of
this type of experts are employed. The Civil Aviation Authority (CAA-NL) employs both
(former and active) pilots and ATCO’s. Most of the pilots are both inspector and pilot,
responsible for oversight on airline operations. In order to keep their knowledge and
experience up to date, they fly as guest pilots with regular airlines. Also a number of former
ATCO’s work for the CAA. Most of them have been trained in the military and have
performed operational duties in the Royal Netherlands Air Force. Upon request, the CAA was
willing to assist in this research by sending questionnaires to its personnel. In order to
increase the number of experts under the respondents, the air traffic control organisation
Eurocontrol Maastricht Upper Area Control Centre (MUAC) in Beek (NL) had been asked to
cooperate as well in the distribution of questionnaires under its personnel, amongst which
are over two hundred ATCO’s. Because of their experience in the system it may be assumed
that these experts have sound knowledge of the level of safety of actors in the aviation
system. It may also be expected that they behave differently than regular passenger towards
15
aviation safety, whenever they book a flight with an airline as a private passenger. This may
be different from people that do not have the inside information. Therefore the second
hypothesis is the following:
Hypothesis 2: Expert knowledge moderates the effect of service quality on safety
perception
2.3 Aviation Safety
An airplane crash does not happen frequently, but if so , it triggers a lot of media attention.
After an accident people often ask themselves if flying is a safe thing to do. However,
commercial aviation is one of the safest forms of transport and statistics show that it has
become even more safe over the last decades. The 2011 global accident rate was 0.37, the
equivalent of one accident every 2.7 million flights. This represented a 39% improvement
compared to 2010, when the accident rate was 0.61, or one accident for every 1.6 million
flights (IATA, 2012). Statistics also show a downward trend over the last few years. The trend
easily becomes disturbed when an accident does happen, as the trend is only based on a
very little number of accidents. Just as the little chance on an aircraft accident the
survivability increased significantly. In the United States for example there is a one in two
million chance that one will be caught in an aircraft crash, when you board an aircraft. But if
this happens, the chances of survival are calculated to be 60%. The reason for the little
number of accidents is a consequence of the learning organizations in the system, where
improvements take place after every accident in order to prevent an identical accident from
happening again. What also contributes to the low number of incidents are the improved
training methods of airline crews and air traffic controllers.
Despite the fact that flying becomes safer and safer, the gap between facts and passenger
perception grows continuously. This seems to be caused by the fact that the accidents are of
that complex nature that journalists do not have enough knowledge and experience to cover
the news factually. In addition the media seem to be more interested in trying to find the
one who is guilty of the accident, rather than the question how a similar accident can be
16
prevented from happening. Based on the media coverage the passenger safety perception
on aviation safety is likely to decrease.
In The Netherlands no evidence is found that a similar trend is ongoing. De Gier (2005) on
request of the Ministry of Infrastructure and the Environment (then Ministry of Transport
and Water Management) researched the aviation safety perception of the Dutch population.
It was found that aviation safety was perceived acceptable for 95% of the population. A
division was made between internal and external safety. Internal safety (during flight) is
mainly achieved by the presence of professional crew, a statistical small accident-chance,
good equipment and a reliable airline. There is no reason to believe that this perception has
changed over the recent years.
The safety of the Air Traffic Management (ATM) system in Europe slowly increases. In order
to reach the targets of the Single European Sky (SES) program in 2020 more efforts will
however be necessary (Eurocontrol, 2011). The SES program has set a target to reach a ten-
fold safety-gain in 2020. Despite the fact that budget cuts cause problems in the oversight
area, ATM safety has been up to standard in 2009. No ATM related accidents had been
logged in Europe.
The Single European sky initiative has been launched in 1999 by the European Commission
with the aim of making aviation more efficient and safer. It is assumed that not only
technical developments will be sufficient. The reason for the programme mainly was the
increase in delays. With further growth of the aviation sector it is expected that the delays
would increase even more. Therefore the European Commission considered itself forced to
take action on behalf of its member states.
The third hypothesis states that perceived safety does influence satisfaction.
Hypothesis 3: Safety perception positively influences satisfaction
17
2.4 Satisfaction
Satisfaction can be defined (see also Engel et al., 1990, p. 481) as the outcome of the
subjective evaluation that the chosen alternative meets or exceeds expectations (Bloemer, J
en de Ruyter, K, 1998). Airline quality may lead to satisfaction. Satisfaction is of great
importance for an airline as this is the start for a customer to return to the airline on a next
occasion. It is a way for the airline to establish a relationship with the customer. Mooradian
and Oliver (1997) researched the relation between personality, emotion and the attitude
towards a service organisation. Lin, Chiu and Hsieh (2001) focussed on the relationship
between personality and service quality expectations. So far no research has been done as
to the relationship between quality, safety and satisfaction and in what way it relates to
loyalty. Also the question whether aviation experts perceive the items differently has not yet
been investigated.
Hypothesis 4: Service quality positively influences satisfaction and satisfaction
consequently indirectly positively on loyalty
Hypothesis 5: Safety perception mediates the relation between service quality and
satisfaction
2.5 Loyalty
Loyalty can be defined as the biased behavioral response, expressed over time, by some
decision-making unit with respect to one airline out of a set of airlines, which is a function of
psychological processes resulting in brand commitment (Bloemer, de Ruyter, 1998). Loyalty
is what it is all about when we talk about airline choice. Hence, a loyal passenger returns to
the airline and therefore is a stable and continuous source of income.
18
3. Methodology
In the previous chapter all relevant literature has been described. Also the hypothesis of this
research have been defined. This chapter will focus on survey techniques and the statistical
method that answers the questions to the research questions.
3.1 Sample and Demographics
The questionnaire has been electronically distributed to organizations and companies that
are active in the field of aviation. It has been assumed that in the organizations both experts
and non-experts are employed. Experts are considered pilots and air traffic controllers. Non-
experts are for example employed in the supporting departments. Contributing companies
were the Eurocontrol Upper Area Control Center in Maastricht and the Civil Aviation
Authority The Netherlands in Hoofddorp (ILT, then IVW). In both organizations in total
approximately one thousand and two hundred people are employed respectively.
The survey has been available on surveymonkey.com for a period of four weeks. In this
period the questionnaire has been completed by 143 persons in total. Finally, the
questionnaires of 124 respondents have shown to be useful for this research.
3.2 Survey Design and Questionnaire Development
For data collection purposes a questionnaire has been developed. Glatthorn and Joyner
(2005) do recommend this type of method for the use of correlational research, to be able
to compare opinions, presumptions and attitudes. The advantage of this method over for
example an interview is that this type of questionnaires prevents feelings of embarrassment
etcetera. With the design of the questionnaire the recommendations of Dillman (1994) have
been taken into account in order to increase the number of respondents. The questionnaire
had been designed with the use of Surveymonkey.com. Two managers of the participating
organisations had been requested to send an internal email that included a hyperlink to the
questionnaire site, an explanation on the importance of the questionnaire and the emphasis
19
on confidentiality (Brace 2008). The email also offered the option of receiving feedback
when the results would be available by the end of the research period. Finally respondents
were offered the possibility to win a €50 dinner cheque by means of incentive if they
included their email address.
The companies that agreed on their participation were the Human Environment and
Transport Inspectorate (ILT) and Eurocontrol Maastricht Upper Area Control Center (MUAC).
ILT is the Civil Aviation Authority (CAA) in the Netherlands and responsible for safety
oversight of Dutch aviation and employs many experts that have an operational background
in aviation, both as air traffic controllers and pilots. MUAC is the international air traffic
control centre for the upper airspace over the Netherlands, Belgium, Luxembourg and the
northern part of Germany. Out of a thousand employees about two hundred of them are
actually air traffic controllers. It had been deemed important that both experts and non-
experts would fill in the questionnaire. This was assured by the fact that in both
organisations also staff is employed in supportive processes, which is mostly done by non-
experts.
The questionnaire consisted of eight parts. The first part was the main section and used in
order to establish whether the respondent had actually flown recently and with which (type
of) airline mainly. The second part measured the satisfaction of the respondent. The third
part of the questionnaire tested the quality of the service and the fourth part covered safety.
Apart from one question in parts 2, 3 and 4 the constructs were measured by a seven point
Likert scale, varying from van 1 = “strongly disagree” to 7 = “strongly agree”. Part five
focussed on the difference between FSC and LCC and the number of business trips. Part six
was about market presence and seven dealt with personal details such as age, gender and if
the respondent considered himself an expert in aviation or not. In part 8 the option had
been created to enter an email address to be able to contact, despite confidentiality, the
respondent that would win the dinner cheque. In order to reduce the number of non-
sampling mistakes, the scales and the items in the questionnaire had been re-used from
available sources. All the questions had been formulated positively (Brace 2008, Malhotra
and Birks 2003).
20
4. Results
This chapter deals with the results of the various analyses that are done in the statistical
software programs. It starts with the empirical test of the conceptual model for which Partial
Least Squares (PLS) is used. An answer is given to the respective hypotheses from chapter 2
and a mediating and moderating exercise is performed where deemed necessary in order to
establish the role of the constructs.
4.1 The measurement model
Scale reliability is the internal consistency of the items that are used to measure a latent
construct. Internal consistency items form a homogeneous set, but vary statistically
together. Reliability therefore deals with the consistency of the scale. Cronbach’s alpha is
mostly used for reliability purposes (Wanke, Arkadar, and Hijjar 2007). An alpha exceeding
0.7 means a consistency between the items in a scale (Nunnaly 1978). Brosius (2008)
describes that alpha’s between 0.5 and 0.8 are sufficient. When we look at individual item
loadings, it shows that all the items have a number higher than 0.5 on the respective
construct. This supports the idea that a high level of individual item reliability exists
(Hulland, 1999; White et al., 2003).
4.2 Content Validity and scale reliability
Content validity exists when the scope of a construct is adequately displayed by the items as
a group (Dunn, Seaker, and Waller 1994, p.157). The constructs therefore have to be
carefully supported by literature, in which it is clearly explained how other researchers have
measured the construct. A construct must be measured by more than one item. As the
latent constructs in this thesis have been derived from existing literature, content validity
may be assumed.
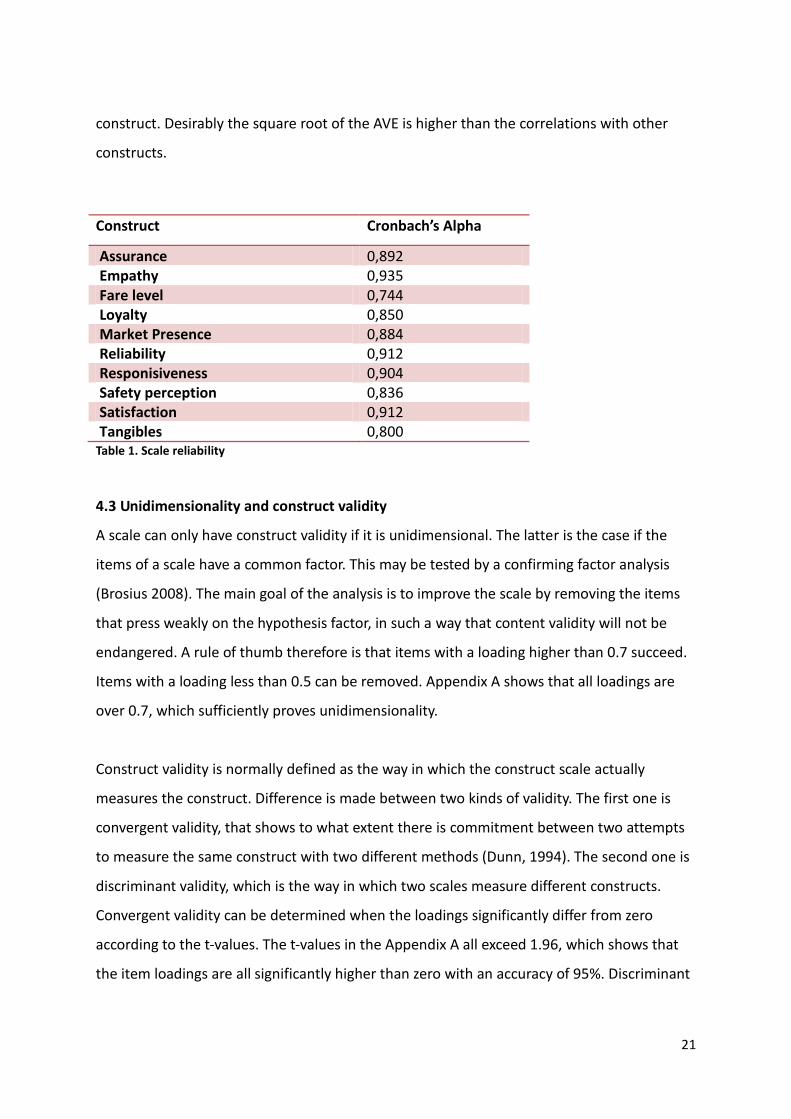
At first Cronbach’s alpha is considered in order to confirm internal consistency of the
constructs. These are all higher than 0.7 which shows sufficient internal consistency. In order
to know discriminant validity the square root of the AVE is compared to the correlations per
21
construct. Desirably the square root of the AVE is higher than the correlations with other
constructs.
Construct Cronbach’s Alpha
Assurance 0,892 Empathy 0,935 Fare level 0,744 Loyalty 0,850 Market Presence 0,884 Reliability 0,912 Responisiveness 0,904 Safety perception 0,836 Satisfaction 0,912 Tangibles 0,800 Table 1. Scale reliability
4.3 Unidimensionality and construct validity
A scale can only have construct validity if it is unidimensional. The latter is the case if the
items of a scale have a common factor. This may be tested by a confirming factor analysis
(Brosius 2008). The main goal of the analysis is to improve the scale by removing the items
that press weakly on the hypothesis factor, in such a way that content validity will not be
endangered. A rule of thumb therefore is that items with a loading higher than 0.7 succeed.
Items with a loading less than 0.5 can be removed. Appendix A shows that all loadings are
over 0.7, which sufficiently proves unidimensionality.
Construct validity is normally defined as the way in which the construct scale actually
measures the construct. Difference is made between two kinds of validity. The first one is
convergent validity, that shows to what extent there is commitment between two attempts
to measure the same construct with two different methods (Dunn, 1994). The second one is
discriminant validity, which is the way in which two scales measure different constructs.
Convergent validity can be determined when the loadings significantly differ from zero
according to the t-values. The t-values in the Appendix A all exceed 1.96, which shows that
the item loadings are all significantly higher than zero with an accuracy of 95%. Discriminant
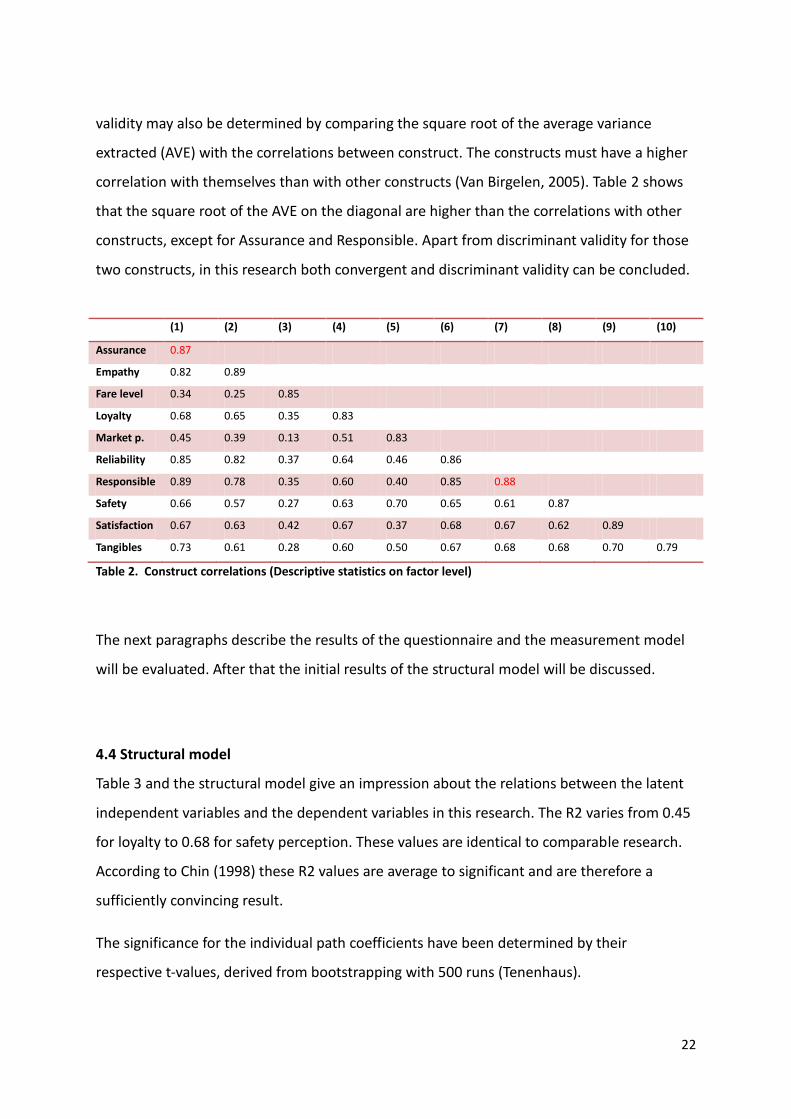
22
validity may also be determined by comparing the square root of the average variance
extracted (AVE) with the correlations between construct. The constructs must have a higher
correlation with themselves than with other constructs (Van Birgelen, 2005). Table 2 shows
that the square root of the AVE on the diagonal are higher than the correlations with other
constructs, except for Assurance and Responsible. Apart from discriminant validity for those
two constructs, in this research both convergent and discriminant validity can be concluded.
(1) (2) (3) (4) (5) (6) (7) (8) (9) (10)
Assurance 0.87
Empathy 0.82 0.89
Fare level 0.34 0.25 0.85
Loyalty 0.68 0.65 0.35 0.83
Market p. 0.45 0.39 0.13 0.51 0.83
Reliability 0.85 0.82 0.37 0.64 0.46 0.86
Responsible 0.89 0.78 0.35 0.60 0.40 0.85 0.88
Safety 0.66 0.57 0.27 0.63 0.70 0.65 0.61 0.87
Satisfaction 0.67 0.63 0.42 0.67 0.37 0.68 0.67 0.62 0.89
Tangibles 0.73 0.61 0.28 0.60 0.50 0.67 0.68 0.68 0.70 0.79
Table 2. Construct correlations (Descriptive statistics on factor level)
The next paragraphs describe the results of the questionnaire and the measurement model
will be evaluated. After that the initial results of the structural model will be discussed.
4.4 Structural model
Table 3 and the structural model give an impression about the relations between the latent
independent variables and the dependent variables in this research. The R2 varies from 0.45
for loyalty to 0.68 for safety perception. These values are identical to comparable research.
According to Chin (1998) these R2 values are average to significant and are therefore a
sufficiently convincing result.
The significance for the individual path coefficients have been determined by their
respective t-values, derived from bootstrapping with 500 runs (Tenenhaus).
23
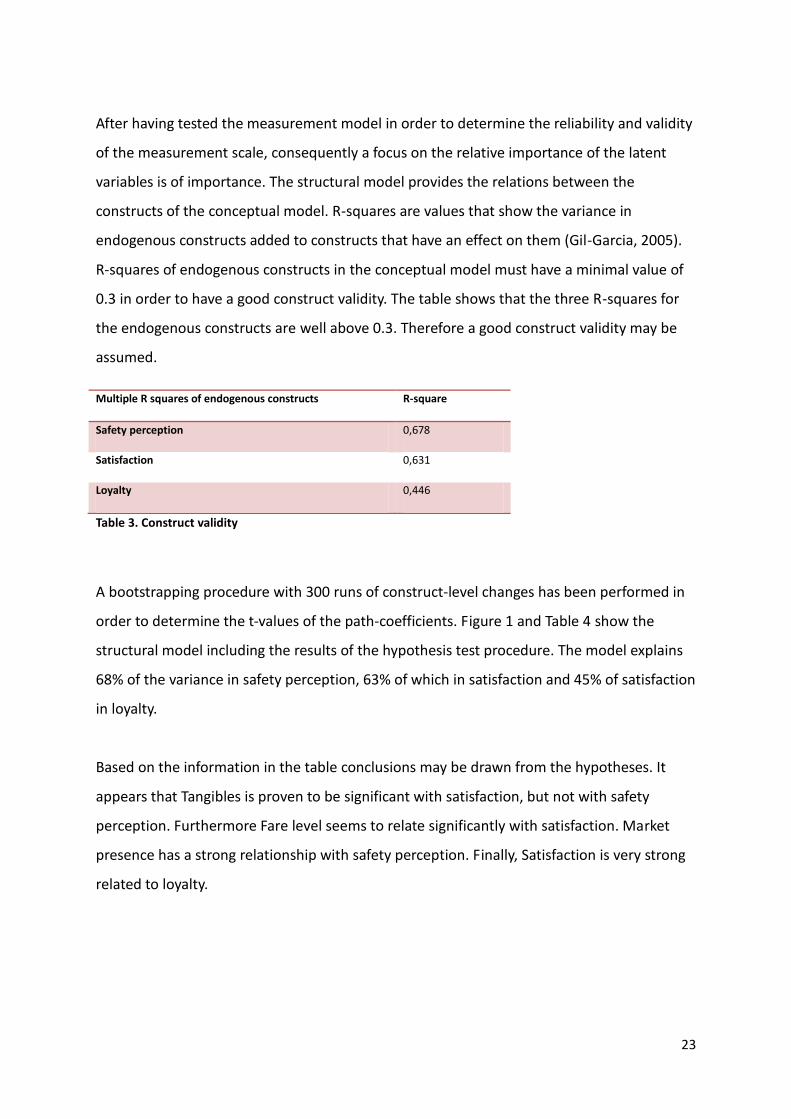
After having tested the measurement model in order to determine the reliability and validity
of the measurement scale, consequently a focus on the relative importance of the latent
variables is of importance. The structural model provides the relations between the
constructs of the conceptual model. R-squares are values that show the variance in
endogenous constructs added to constructs that have an effect on them (Gil-Garcia, 2005).
R-squares of endogenous constructs in the conceptual model must have a minimal value of
0.3 in order to have a good construct validity. The table shows that the three R-squares for
the endogenous constructs are well above 0.3. Therefore a good construct validity may be
assumed.
Multiple R squares of endogenous constructs R-square
Safety perception 0,678
Satisfaction 0,631
Loyalty 0,446
Table 3. Construct validity
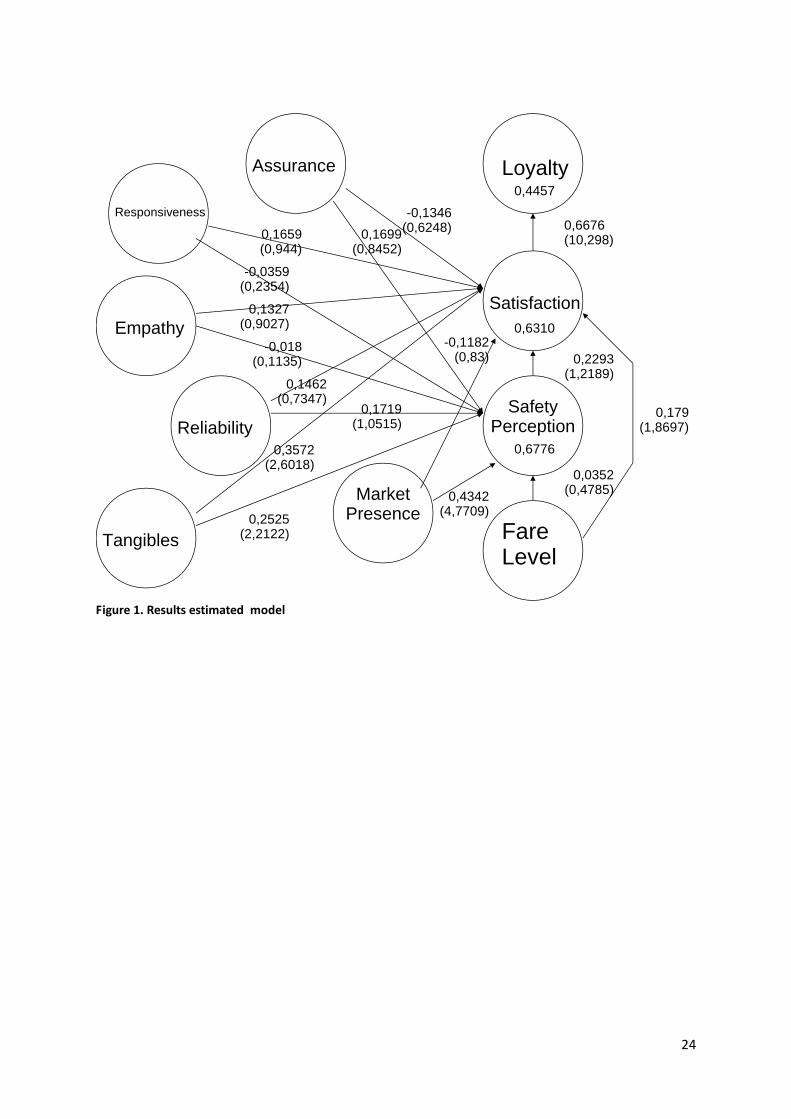
A bootstrapping procedure with 300 runs of construct-level changes has been performed in
order to determine the t-values of the path-coefficients. Figure 1 and Table 4 show the
structural model including the results of the hypothesis test procedure. The model explains
68% of the variance in safety perception, 63% of which in satisfaction and 45% of satisfaction
in loyalty.
Based on the information in the table conclusions may be drawn from the hypotheses. It
appears that Tangibles is proven to be significant with satisfaction, but not with safety
perception. Furthermore Fare level seems to relate significantly with satisfaction. Market
presence has a strong relationship with safety perception. Finally, Satisfaction is very strong
related to loyalty.
24
Fare Level
Safety Perception
Loyalty
Satisfaction
Market Presence
Tangibles
Reliability
Empathy
Responsiveness
Assurance
0,6676(10,298)
0,2293(1,2189)
0,0352(0,4785)
0,179(1,8697)
-0,1346(0,6248)
0,1699(0,8452)
0,1659(0,944)
-0,0359(0,2354)
0,1327(0,9027)
-0,018(0,1135)
0,1462(0,7347)
0,1719(1,0515)
0,3572(2,6018)
0,2525(2,2122)
0,4342(4,7709)
-0,1182(0,83)
0,6776
0,6310
0,4457
Figure 1. Results estimated model
25
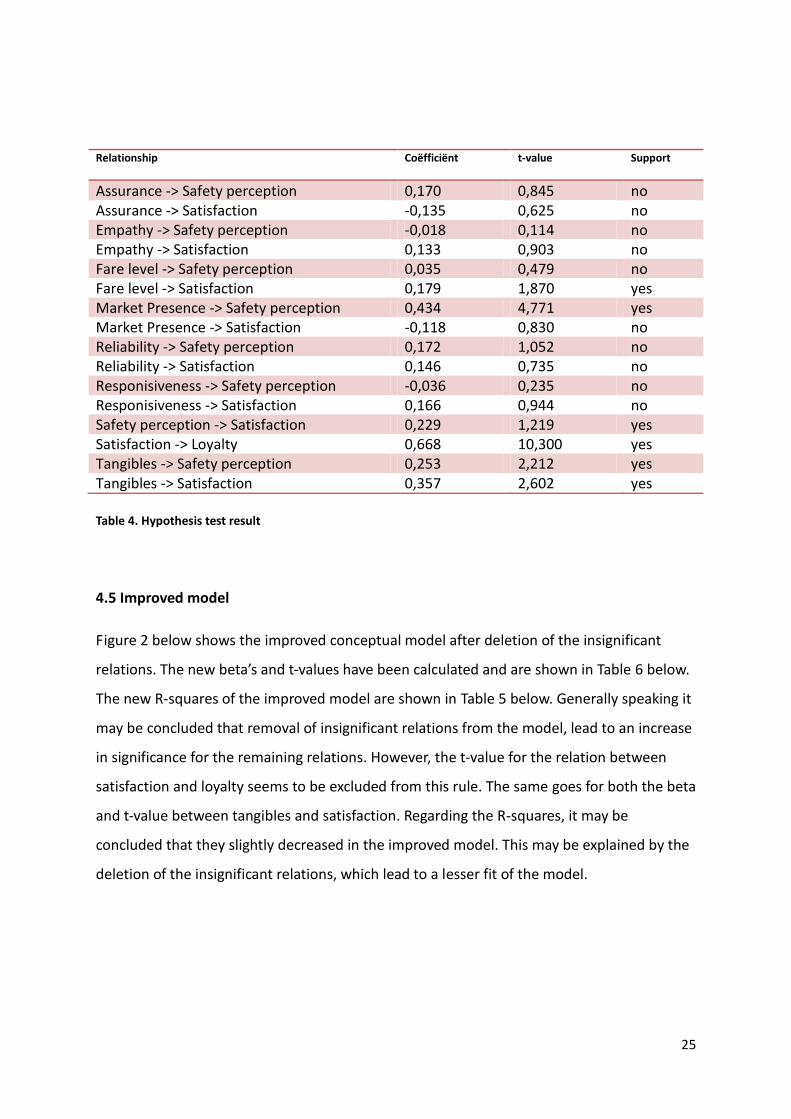
Relationship
Coëfficiënt t-value Support
Assurance -> Safety perception 0,170 0,845 no Assurance -> Satisfaction -0,135 0,625 no Empathy -> Safety perception -0,018 0,114 no Empathy -> Satisfaction 0,133 0,903 no Fare level -> Safety perception 0,035 0,479 no Fare level -> Satisfaction 0,179 1,870 yes Market Presence -> Safety perception 0,434 4,771 yes Market Presence -> Satisfaction -0,118 0,830 no Reliability -> Safety perception 0,172 1,052 no Reliability -> Satisfaction 0,146 0,735 no Responisiveness -> Safety perception -0,036 0,235 no Responisiveness -> Satisfaction 0,166 0,944 no Safety perception -> Satisfaction 0,229 1,219 yes Satisfaction -> Loyalty 0,668 10,300 yes Tangibles -> Safety perception 0,253 2,212 yes Tangibles -> Satisfaction 0,357 2,602 yes
Table 4. Hypothesis test result
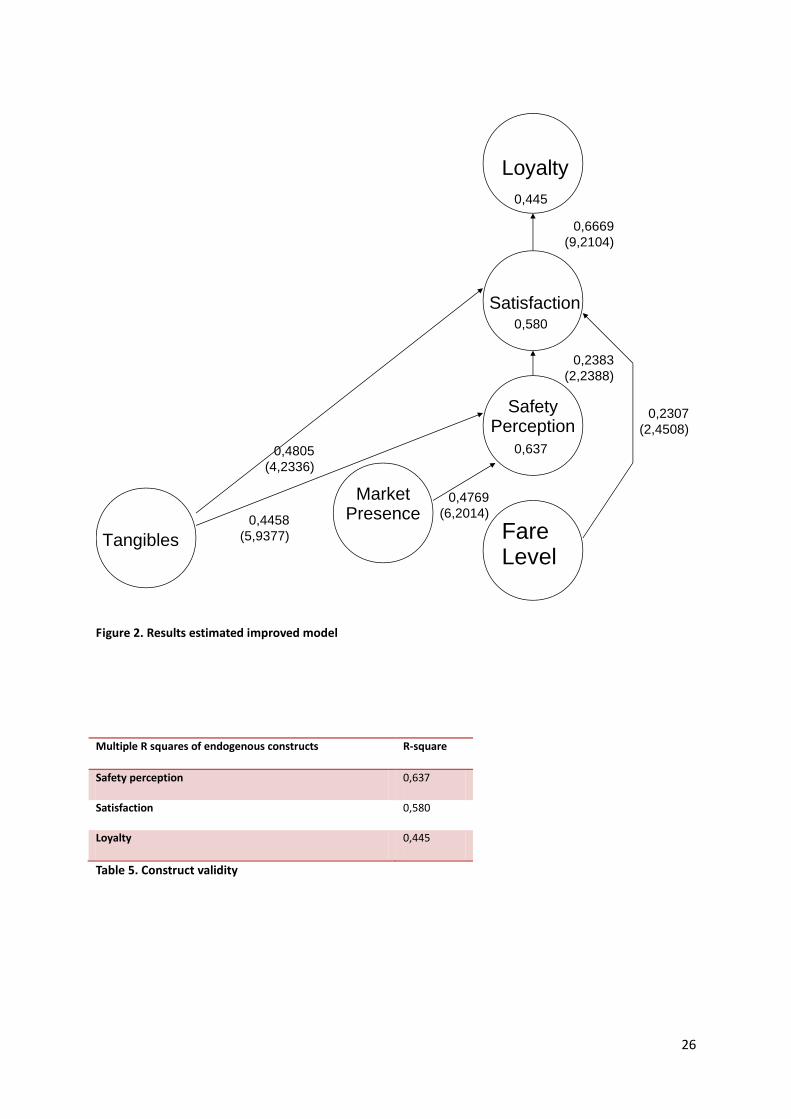
4.5 Improved model
Figure 2 below shows the improved conceptual model after deletion of the insignificant
relations. The new beta’s and t-values have been calculated and are shown in Table 6 below.
The new R-squares of the improved model are shown in Table 5 below. Generally speaking it
may be concluded that removal of insignificant relations from the model, lead to an increase
in significance for the remaining relations. However, the t-value for the relation between
satisfaction and loyalty seems to be excluded from this rule. The same goes for both the beta
and t-value between tangibles and satisfaction. Regarding the R-squares, it may be
concluded that they slightly decreased in the improved model. This may be explained by the
deletion of the insignificant relations, which lead to a lesser fit of the model.
26
Fare Level
Safety Perception
Loyalty
Satisfaction
Market Presence
Tangibles
0,6669
(9,2104)
0,2383
(2,2388)
0,2307
(2,4508)
0,4805
(4,2336)
0,4458
(5,9377)
0,4769
(6,2014)
0,637
0,580
0,445
Figure 2. Results estimated improved model
Multiple R squares of endogenous constructs R-square
Safety perception 0,637
Satisfaction 0,580
Loyalty 0,445
Table 5. Construct validity
27
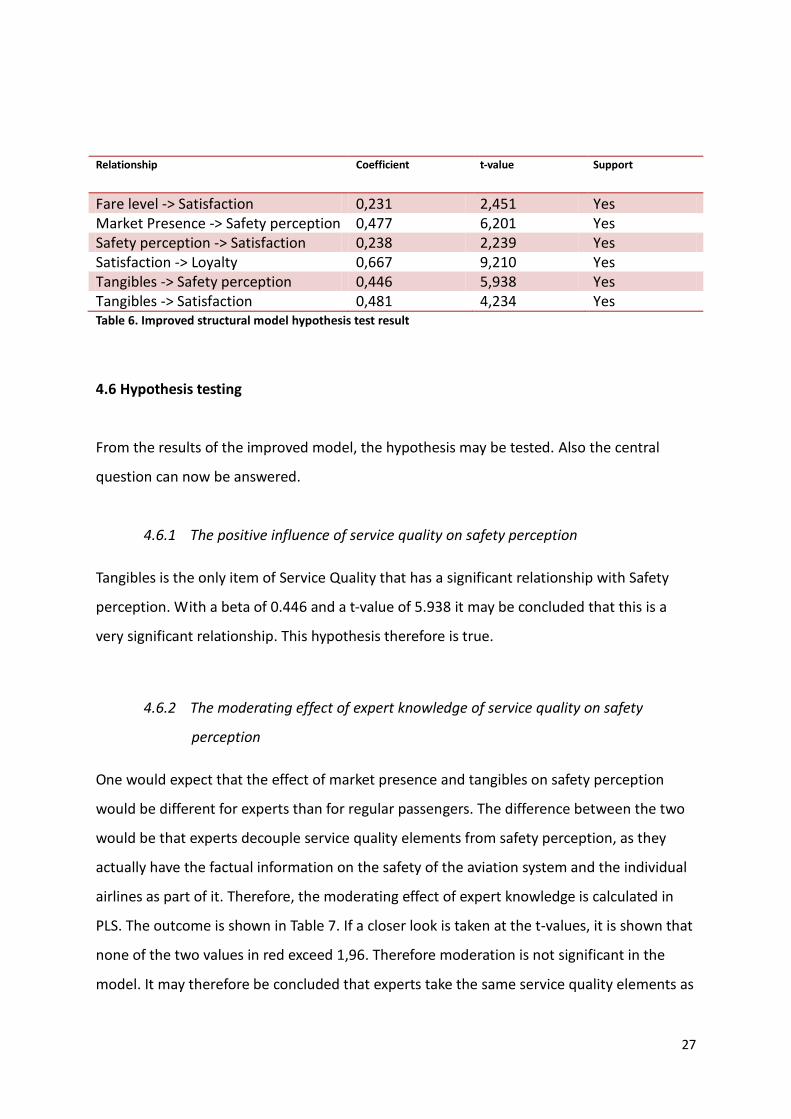
Relationship Coefficient t-value Support
Fare level -> Satisfaction 0,231 2,451 Yes Market Presence -> Safety perception 0,477 6,201 Yes Safety perception -> Satisfaction 0,238 2,239 Yes Satisfaction -> Loyalty 0,667 9,210 Yes Tangibles -> Safety perception 0,446 5,938 Yes Tangibles -> Satisfaction 0,481 4,234 Yes Table 6. Improved structural model hypothesis test result
4.6 Hypothesis testing
From the results of the improved model, the hypothesis may be tested. Also the central
question can now be answered.
4.6.1 The positive influence of service quality on safety perception
Tangibles is the only item of Service Quality that has a significant relationship with Safety
perception. With a beta of 0.446 and a t-value of 5.938 it may be concluded that this is a
very significant relationship. This hypothesis therefore is true.
4.6.2 The moderating effect of expert knowledge of service quality on safety
perception
One would expect that the effect of market presence and tangibles on safety perception
would be different for experts than for regular passengers. The difference between the two
would be that experts decouple service quality elements from safety perception, as they
actually have the factual information on the safety of the aviation system and the individual
airlines as part of it. Therefore, the moderating effect of expert knowledge is calculated in
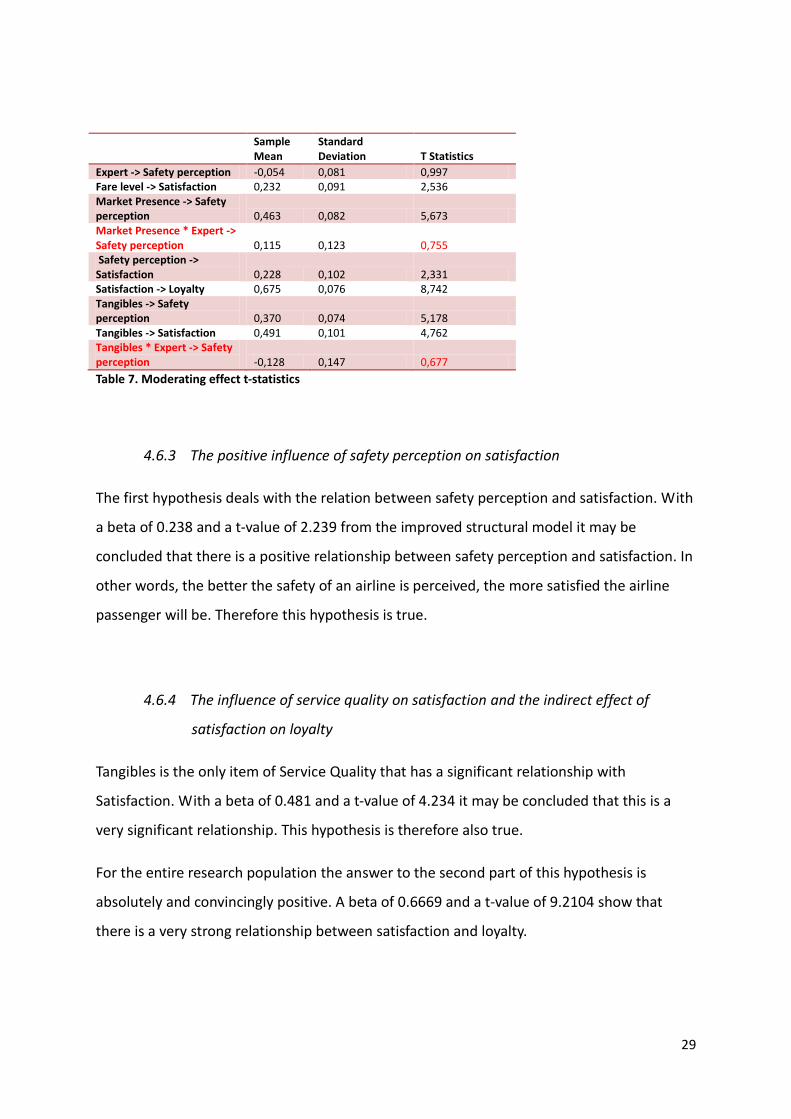
PLS. The outcome is shown in Table 7. If a closer look is taken at the t-values, it is shown that
none of the two values in red exceed 1,96. Therefore moderation is not significant in the
model. It may therefore be concluded that experts take the same service quality elements as
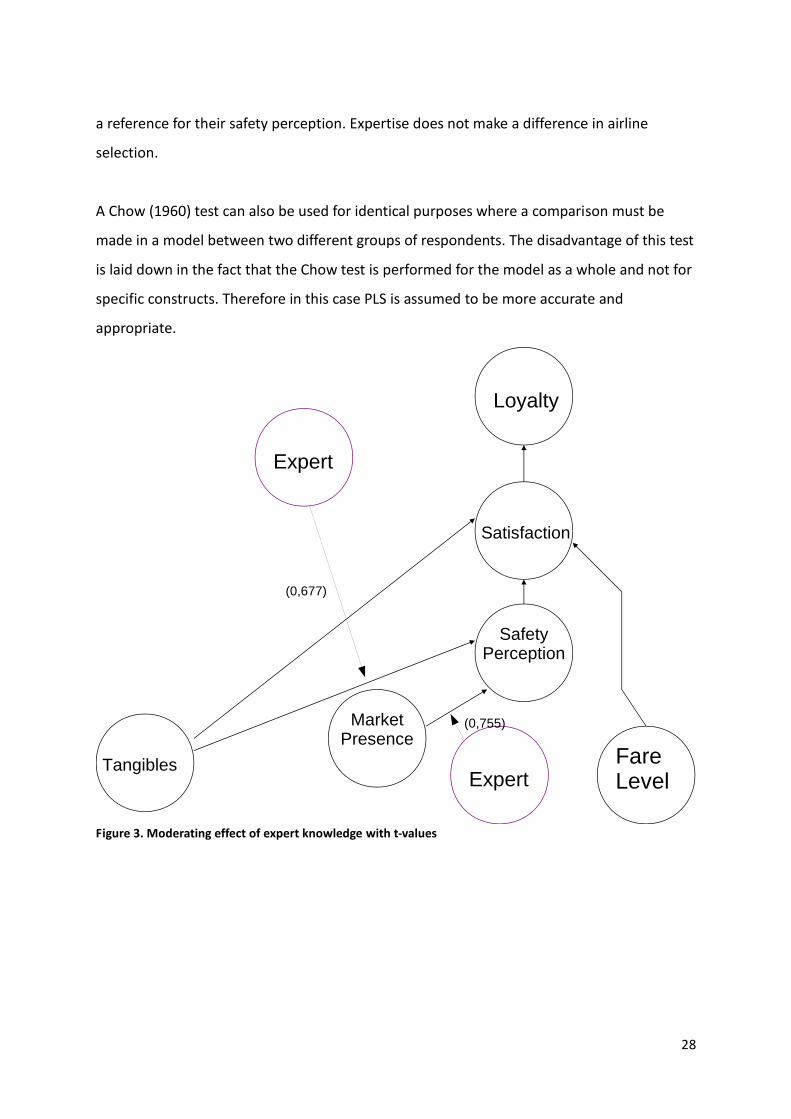
28
a reference for their safety perception. Expertise does not make a difference in airline
selection.
A Chow (1960) test can also be used for identical purposes where a comparison must be
made in a model between two different groups of respondents. The disadvantage of this test
is laid down in the fact that the Chow test is performed for the model as a whole and not for
specific constructs. Therefore in this case PLS is assumed to be more accurate and
appropriate.
Fare Level
Safety Perception
Loyalty
Satisfaction
Market Presence
TangiblesExpert
(0,677)
(0,755)
Expert
Figure 3. Moderating effect of expert knowledge with t-values
29
Sample
Mean Standard Deviation T Statistics
Expert -> Safety perception -0,054 0,081 0,997 Fare level -> Satisfaction 0,232 0,091 2,536 Market Presence -> Safety perception 0,463 0,082 5,673 Market Presence * Expert -> Safety perception 0,115 0,123 0,755 Safety perception -> Satisfaction 0,228 0,102 2,331 Satisfaction -> Loyalty 0,675 0,076 8,742 Tangibles -> Safety perception 0,370 0,074 5,178 Tangibles -> Satisfaction 0,491 0,101 4,762 Tangibles * Expert -> Safety perception -0,128 0,147 0,677
Table 7. Moderating effect t-statistics
4.6.3 The positive influence of safety perception on satisfaction
The first hypothesis deals with the relation between safety perception and satisfaction. With
a beta of 0.238 and a t-value of 2.239 from the improved structural model it may be
concluded that there is a positive relationship between safety perception and satisfaction. In
other words, the better the safety of an airline is perceived, the more satisfied the airline
passenger will be. Therefore this hypothesis is true.
4.6.4 The influence of service quality on satisfaction and the indirect effect of
satisfaction on loyalty
Tangibles is the only item of Service Quality that has a significant relationship with
Satisfaction. With a beta of 0.481 and a t-value of 4.234 it may be concluded that this is a
very significant relationship. This hypothesis is therefore also true.
For the entire research population the answer to the second part of this hypothesis is
absolutely and convincingly positive. A beta of 0.6669 and a t-value of 9.2104 show that
there is a very strong relationship between satisfaction and loyalty.
30
4.6.5 Mediation of safety perception on the relation between service quality and
satisfaction
It is assumed that for the general public safety perception does not directly impact loyalty.
This is laid down in the fact that practice shows that airlines with a relatively unsafe
reputation also have more than enough passengers on board their aircraft to be able to
economically survive. Therefore, the direct relation between safety perception and loyalty is
not part of the conceptual model. As the construct of safety is perhaps perceived in a
different way by experts, the indirect relation is performed by means of a mediation analysis.
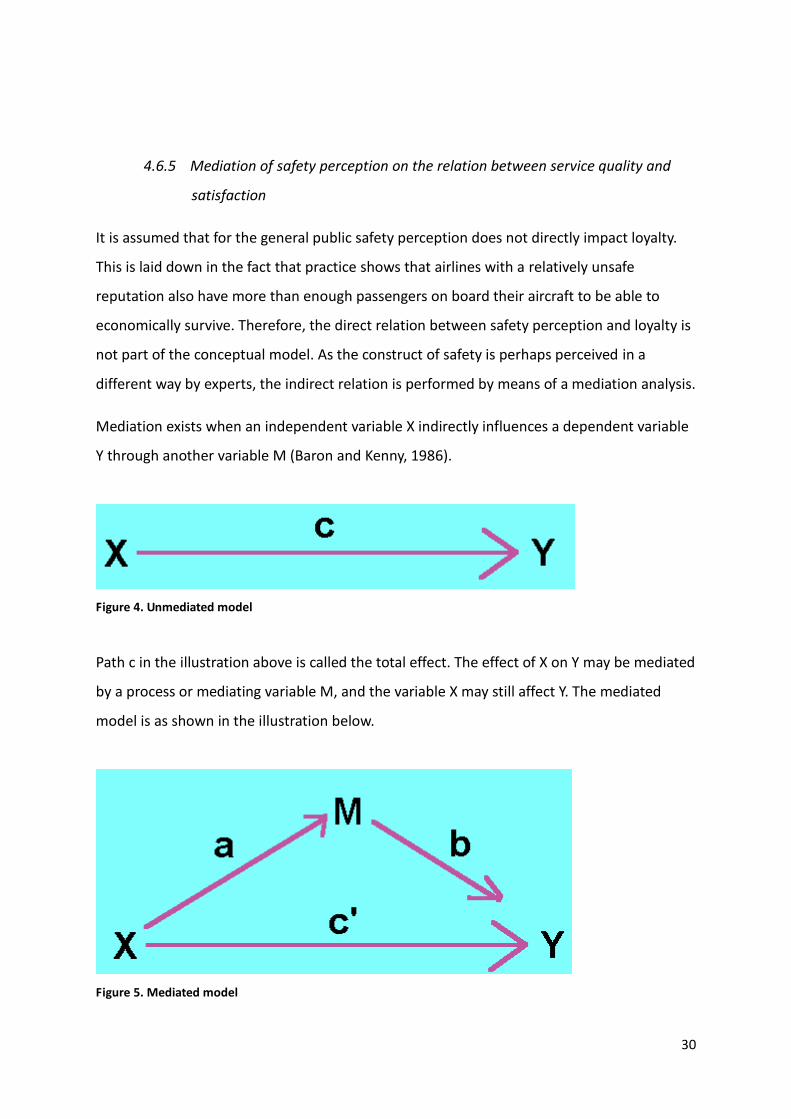
Mediation exists when an independent variable X indirectly influences a dependent variable
Y through another variable M (Baron and Kenny, 1986).
Figure 4. Unmediated model
Path c in the illustration above is called the total effect. The effect of X on Y may be mediated
by a process or mediating variable M, and the variable X may still affect Y. The mediated
model is as shown in the illustration below.
Figure 5. Mediated model
31
In order to establish mediation, we will have to establish whether there is a difference
between c and c’.
In the model that is used in this research the construct safety perception can be a mediator
for the direct relations between the seven independent constructs and the dependent
construct satisfaction. In order to perform this mediation analysis the first model is
expanded in order to take the direct relations into account.
In this thesis we are looking separately for a possible mediating effect of Safety in the
relation between all of the SERVPERF factors and Satisfaction. In order to establish this effect
a Sobeltest has been performed. The amount of mediation (the indirect effect) is equal to
the difference between the total effect and the direct effect.
In order to calculate the mediation effect, we consider each of the service quality constructs
to affect satisfaction. The service quality construct is called the initial variable and
satisfaction is called the outcome.
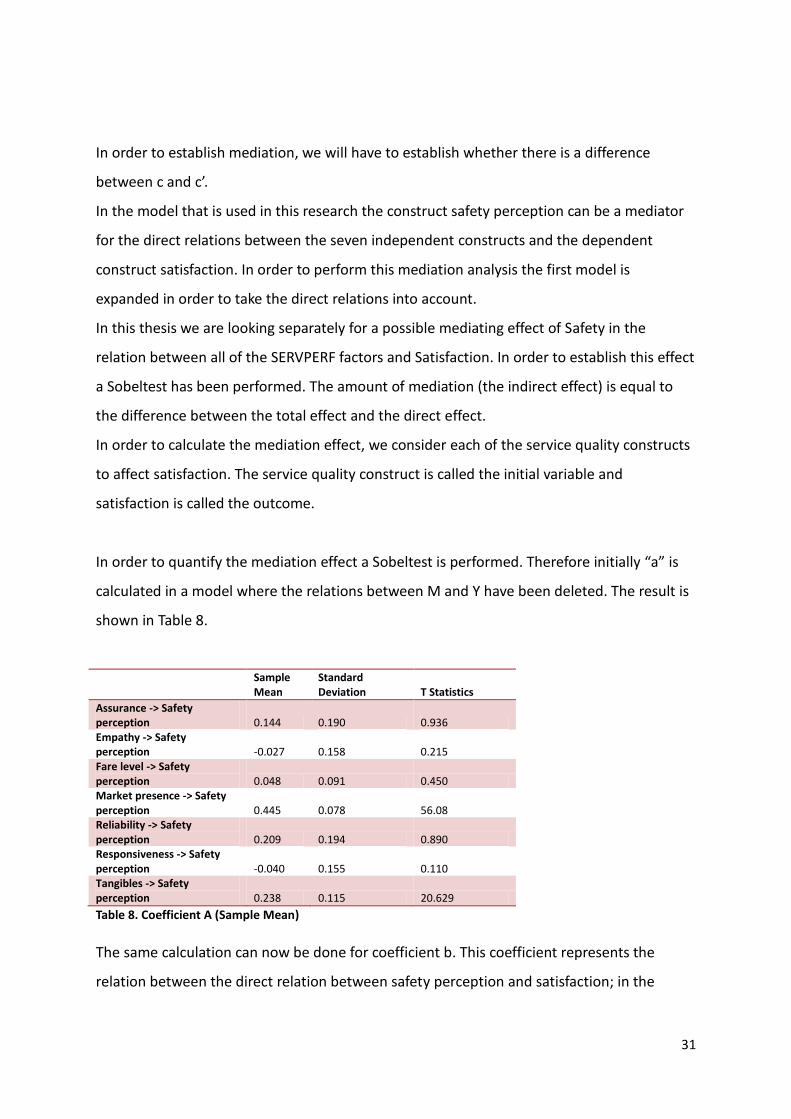
In order to quantify the mediation effect a Sobeltest is performed. Therefore initially “a” is
calculated in a model where the relations between M and Y have been deleted. The result is
shown in Table 8.
Sample Mean
Standard Deviation T Statistics
Assurance -> Safety perception 0.144 0.190 0.936 Empathy -> Safety perception -0.027 0.158 0.215 Fare level -> Safety perception 0.048 0.091 0.450 Market presence -> Safety perception 0.445 0.078 56.08 Reliability -> Safety perception 0.209 0.194 0.890 Responsiveness -> Safety perception -0.040 0.155 0.110 Tangibles -> Safety perception 0.238 0.115 20.629
Table 8. Coefficient A (Sample Mean)
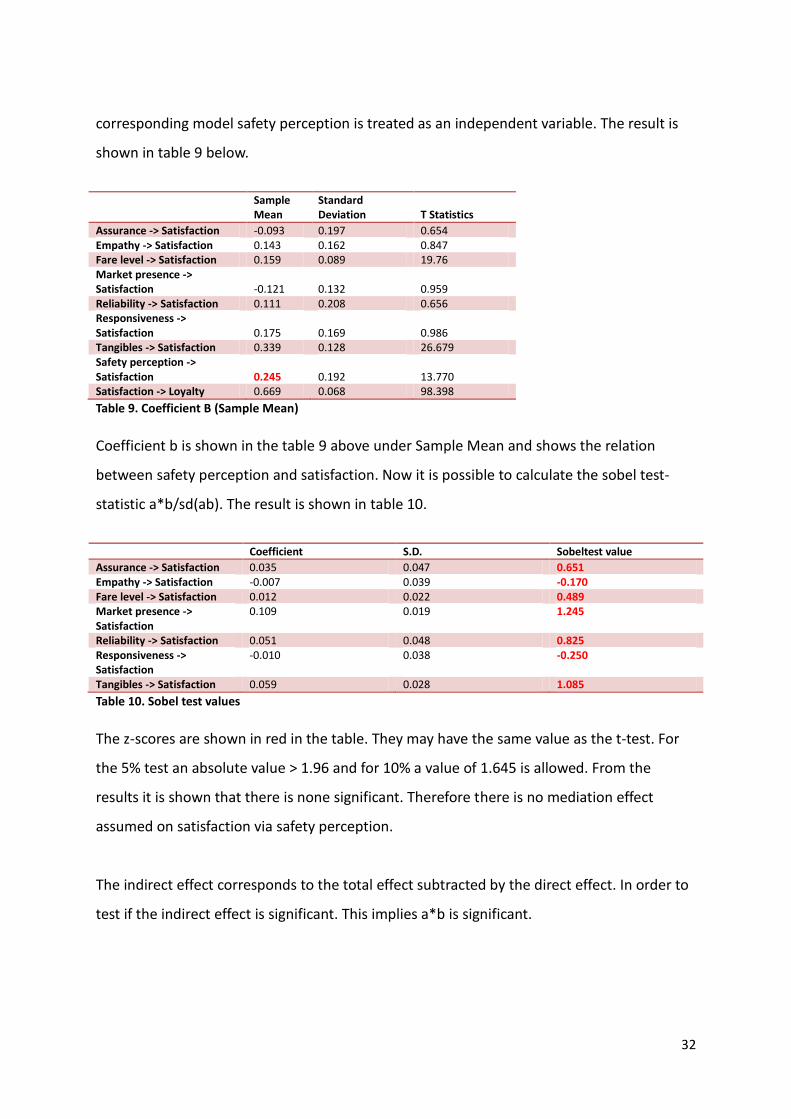
The same calculation can now be done for coefficient b. This coefficient represents the
relation between the direct relation between safety perception and satisfaction; in the
32
corresponding model safety perception is treated as an independent variable. The result is
shown in table 9 below.
Sample
Mean Standard Deviation T Statistics
Assurance -> Satisfaction -0.093 0.197 0.654 Empathy -> Satisfaction 0.143 0.162 0.847 Fare level -> Satisfaction 0.159 0.089 19.76 Market presence -> Satisfaction -0.121 0.132 0.959 Reliability -> Satisfaction 0.111 0.208 0.656 Responsiveness -> Satisfaction 0.175 0.169 0.986 Tangibles -> Satisfaction 0.339 0.128 26.679 Safety perception -> Satisfaction 0.245 0.192 13.770 Satisfaction -> Loyalty 0.669 0.068 98.398
Table 9. Coefficient B (Sample Mean)
Coefficient b is shown in the table 9 above under Sample Mean and shows the relation
between safety perception and satisfaction. Now it is possible to calculate the sobel test-
statistic a*b/sd(ab). The result is shown in table 10.
Coefficient S.D. Sobeltest value
Assurance -> Satisfaction 0.035 0.047 0.651 Empathy -> Satisfaction -0.007 0.039 -0.170 Fare level -> Satisfaction 0.012 0.022 0.489 Market presence -> Satisfaction
0.109 0.019 1.245
Reliability -> Satisfaction 0.051 0.048 0.825 Responsiveness -> Satisfaction
-0.010 0.038 -0.250
Tangibles -> Satisfaction 0.059 0.028 1.085
Table 10. Sobel test values
The z-scores are shown in red in the table. They may have the same value as the t-test. For
the 5% test an absolute value > 1.96 and for 10% a value of 1.645 is allowed. From the
results it is shown that there is none significant. Therefore there is no mediation effect
assumed on satisfaction via safety perception.
The indirect effect corresponds to the total effect subtracted by the direct effect. In order to
test if the indirect effect is significant. This implies a*b is significant.
33
5.Conclusions
This chapter summarises the findings of the research. A flashback is made to the literature in
chapter two in order to establish the relationship between the results and the literature. It
ends with the relevant practical implications of the research and makes suggestions for
further research.
5.1 Discussion
Although the current financial crisis has had a serious impact on air travel, transportation
through the air has nowadays become a normal way of moving from A to B. Competition
however is greater than ever and airlines are fighting for survival and market share. Airline
passenger behaviour therefore is a phenomenon that is currently receiving a great deal of
interest from commercial parties. The major emphasis in this model is the role of safety on
airline passenger loyalty. In addition to existing research a subdivision is made between
experts and non-experts and is looked at differences for FSC and LCC business models. As
Parasuraman (1988) and later Cunningham (2002) have defined ways to rate airlines with
respect to quality this appeared to be a good starting point. Therefore first it has been
investigated if there is a relation between the constructs from service quality, market
presence and fare level on safety perception and satisfaction. We found initially that there is
no significant relationship between service quality and safety, except for the construct
tangibles. Also the relationship between service quality and satisfaction is non-significant,
again with the exception for the construct tangibles. The relationship between fare level and
market presence and both independent variables is also not convincing. Therefore it may be
concluded that for the respondents of this thesis, results turn out to nuance the intuitively
appealing direct relationship between service quality and airlines selection as described in
existing literature. A focus on fare level may be more relevant for airlines passengers than
qualitative elements, as already considered by Prousaloglou and Koppelman (1995).
O’Connell (2005) has given us a good description of the LCC market and strategies. Over the
last years the strategic gap between the FSC and LCC has become smaller. As competition
grows, the FSC have started to copy the successful ideas from LCC. A good illustration for this
34
is the bare fare price, that may be upgraded with different options for an additional price.
This thesis started with a description of safety in aviation and showed that safety is the
number one priority in aviation. However, low financial margins with the traditional carriers
have resulted in the rise of the low cost carriers. It may be the case that in order to save
money, some carriers may have decreased their safety margins. The traditional carriers could
have responded by emphasizing their long history and profound safety statistics, but they
did not.
Consequently the determinants for satisfaction have been found to be described by Service
quality constructs tangibles, reliability, responsiveness, assurance and empathy. The study
showed that only tangibles and market presence have shown to have a significant relation
on safety perception. Consequently safety perception has a clear relation with satisfaction.
This research questioned the study by Gilbert and Wong (2003), stating that safety is an
important element for passengers to base their airline selection on. Not very surprisingly,
low prices make the passenger satisfied as fare level has a positive relationship with
satisfaction. This does also not support the findings from Zeithaml (2006), that a high price is
an important determinant for customers in a selection process, especially in high risk
situations. This does not seem to qualify for the aviation industry. First of all, flying is not a
high risk situation, and secondly, price elasticity in aviation appears to work exactly the other
way around: the lower the price, the more attractive for passengers.
The general question of this thesis was how safety was perceived and if this was perceived
differently by aviation experts. The research took into consideration that aviation expertise
may cause the experts to score differently on safety perception than non-experts. This would
consequently lead to different satisfaction levels and different loyalty significance.
Surprisingly the difference between experts and non-experts appeared to be negligible.
Therefore, Lord Salisbury (1877) appears to be right that we should never trust experts.
Experts seem to say one thing, but do the other. A substantial part of the respondents has
extensive and up to date content knowledge of the weaker players in the airline industry.
And although they are aware of the poor performing operators, they do not hesitate to fly
these airlines as long as the aircraft are not too old and the price is right. This confirms the
35
identified abilities of experts as found by Shanteau (1992). Experts have an ability to simplify
complex problems and are better at identifying and adapting to exceptions. This may mean
that the experts are aware of the impaired safety of certain airlines, they are still able to
judge that we are only talking about relative safety and that the risk of flying nevertheless
approaches zero in quantitative terms. This may lead to the conclusion that also experts may
rely on the aviation authorities safety oversight and do not take their own safety expertise
into consideration when it comes to airline selection and loyalty. Fare level is for both groups
a very important aspect when it comes to flying behavior.
5.2 Conclusion
Airline passengers wear different hats. As residents of urban areas they worry about the
theoretical risks that aviation brings to society. However when it comes to their identity as
airlines passenger, they tend to book their tickets based on physical appearance of the airline
and ticket price. Existing literature assumed a high number of qualitative elements that
would affect the selection process, whereas in practice the selection process may be a lot
more simplified. The respondents of this thesis showed three things. First, an airline is
considered either safe or unsafe and it is up to the government to execute safety oversight
on the airline industry. Once the airline is considered safe, the passenger does not make the
distinction between safe and safer. Secondly, even though experts are aware of this
distinction, they do not make a different selection as they do not consider the situation as
high risk. Therefore, behavior in the airline selection process by experts and regular
passengers does not differ considerably. Thirdly, the selection process of business passengers
is entirely different from leisure passengers. As they do not worry so much about the ticket
price, other factors may play a role which may be closer to the ones identified in existing
literature. But as the majority of the airline passengers are leisure passengers, marketing
strategies may continue to be adapted to the current playing field.
36
5.3 Implications for theory
This thesis focused on safety and introduced a new element to existing research. Literature
so far has not made a distinction between the regular passenger and the aviation expert. We
now know that the aviation professional is equally loyal to an airline as the non-professional.
Aviation professionals do not make a different selection if they fly an airline as a passenger,
because of their knowledge of the aviation system and the role of safety in it? In other
words, expertise does not moderate from service quality to safety perception.
Other theoretical implications follow from this thesis. First of all, it appears that the airline
industry follows a different selection process than any other customer oriented market.
Service quality elements as found in literature may not be as suitable for marketing purposes
as assumed so far.
Secondly, although the general public considers aviation as a high risk industry –which it is
not-, safety is not a factor in the airline selection process for regular passengers. Loyalty is
reached when the tangibles of the airline suit the perception of the passenger and the price
is as low as reasonably possible.
Thirdly, this study has not distinguished between leisure and business passengers. It is
perfectly possible that business travelers make a different selection as normally they do not
have to worry so much about the ticket price. Another aspect of business travelers is that
they do not select the destination of the journey themselves, but this is directed by the
company. This may mean that the willingness to take a perceived risk may be less than when
the journey has a leisure nature. Finally the tourist has selected the final destination himself
and there is a strong will to reach that destination, no matter what, against the lowest price
possible.
Finally, earlier research only focused on service quality elements when it comes to loyalty.
This study added safety perception and satisfaction to the airline selection process. As part
of this contribution to literature, items from different origin have been combined in the
survey.
37
5.4 Implications for practice
A satisfied customer is willing to return. This is the most obvious outcome of the thesis and
will not surprise anyone. There are however some more interesting managerial implications
resulting from this research.
Firstly, it appears that a pure FSC is not able to survive the current crisis if it does not move
its strategy in the direction of the LCC. In the airline selection process, the bare ticket fare is
the most decisive element for passengers to base its decision on. Major FSC have already
announced that it will publish the naked ticket price and charge additional fees for extra
space or luggage.
Secondly, although investment is difficult in the current economic situation, it is known from
our research that from all qualitative elements, tangibles is the most important one for
passengers to base its choice on. That means that the visible elements of the airline are
more important to passengers than e.g. safety performance. Investments in website, fleet,
uniforms and other tangibles may increase the interest of passengers.
Thirdly, airlines should have different marketing strategies for business and leisure
passengers as their selection process differs. In order to fill the business classes and increase
turnover, other communication channels may be used for both groups. Other than in this
research, safety and service quality elements may be of larger interest for business travelers
than for leisure passengers.
Finally, the government may learn something out of this research. Safety inspections by
aviation authorities show that in the group of safe airlines, there is a range from just safe
until extremely safe. This information is not known to the public, until incidents occur that
are covered in the media. Experts are able to judge the information and make a conscious
selection for a specific airline. This is different for general public, that does not have the
information and if it had , would not be able to base its selection on. Therefore, the
government may become more transparent in communicating safety ratings. Nowadays this
38
is also done for other markets, e.g. health institutions and others. A black list is an
acceptable first step, but more transparency is required.
5.5 Limitations and suggestions for further research
Research has been done earlier on how service is perceived in aviation and how it relates to
safety and satisfaction. However, those studies have been based on small samples and with a
limited diversity in the research group demographics. This research has taken a larger group
with more variety. On top of that, a group of aviation experts has been included in the group
in order to establish whether this would lead to different satisfaction levels than for the non-
experts. This may be important to know for airline marketing purposes. Improving the
potential passengers knowledge on aviation safety parameters may lead to better safety
perception and therefore to more satisfaction and loyalty. This research adds this
information to the existing literature.
All known research mainly focus on service quality implications in respect of customer
satisfaction and loyalty. In contradiction to other sectors, aviation is a service sector where
safety perception is important for the potential passenger in the selection of an airline. Very
little research has been done on the relationship between aviation expertise, safety
perception, satisfaction and finally loyalty. This study added these aspects to the literature.
The strength of this paper may also be its limitation. In the search for a target group with
aviation expertise we have come to a select group of aviation experts from two specific
organizations: (former) pilots and (former military) air traffic controllers. More variety and
an even larger research group are recommended for future research.
39
References
Baron, R.M., Kenny, D.A., 1986. The moderator-mediator variable distinction in social
psychological research: conceptual, strategic and statistical considerations. J. Pers. Soc.
Psychol. 51, 1173-1182.
Brace, I. (2008). Questionnaire design: How to Plan, Structure and Write Survey Material for
Effective Market Research. London: Kogan Page.
Brosius, F. (2008). SPSS 16 (1. ed.). Heidelberg: Redline GmbH.
Bloemer, J., De Ruyter, K., 1998. On the relationship between store image, store satisfaction
and store loyalty. European Journal of Marketing, Vol. 32 Iss: 5/6, pp.499 – 513.
Button, F., Clarke, A., Palubinskas, G., Stough, R., Thibault, M. (2004). Conforming with ICAO
safety oversight standards. Journal of Air Transport Management, Volume 10, Issue 4, 249–
255
Chin, W. (1998). “The Partial Least Squares Approach to Structural Equation Modeling”, in
Modern Methods for Business Research, G. Marcoulides. Mahwah, NJ: Lawrence Erlbaum
Associates, 295-358.
Chin, W and P. Newsted (1999). “Structural Equation Modelling Analysis with Small Samples
using Partial Least Squares”, in Statistical Strategies for small Sample Research, R. Hoyle.
Thousand Oaks: Sage, 307-342.
Ching Biu Tse, A. (1999). Factors affecting consumer perceptions on product safety. European
Journal of Marketing, 33(9/10), 911-925.
Chow, G. (1960). “Tests of Equality Between Sets of Coefficients in Two Linear Regressions”,
Econometrica, 1960, 28(3), 591-605.
Cunningham, L.F., Young, C.E., Lee, M (2002). Cross-cultural Perspectives of Service Quality
and Risk in Air Transportation. Journal of Air Transportation, 7(1).
40
Salant, P., & Dillman, D. A. (1994). How to conduct your own survey. New York: John Wiley
and Sons.
Dobruszkes, F. (2006). An analysis of European low-cost airlines and their networks. Journal
of Transport Geography 14, 249–264
Dresner, M (2006). Leisure versus business passengers: Similarities, differences, and
implications. Journal of Air Transport Management, 12, 28-32.
Dunn, S.C., Seaker, R.F., Waller, M.A., 1994. Latent variables in business logistics research:
scale development and validation. J. Bus. Logist. 15, 145-172.
Engel, James F., Roger D. Blackwell and Paul W. Miniard (1990), Consumer Behavior and
Marketing Strategy, 6th ed., Chicago, IL: Dryden Press.
Eurocontrol. (2012). Safety Regulation Commission Annual Report 2011. Retrieved from
https://www.eurocontrol.int/sites/default/files/content/documents/single-sky/src/src-
docs/src-doc-50-lr-e1.0.pdf
European Aviation Safety Agency (EASA). (2011). Annual Report 2011. Retrieved from
http://www.easa.europa.eu/communications/docs/annual-report/EASA-
Annual_Report_2011.pdf
Franke, M. (2004). Competition between network carriers and low-cost carriers –retreat
battle or breakthrough to a new level of efficiency. Air Transport Management, 10, 15-21.
Gier, M, de. (2005). Luchtvaartveiligheid, de beleving van de Nederlandse bevolking, TNS-
NIPO consult, report E1537, TNS-NIPO Amsterdam.
Gil-Garcia, J. R. (2005). Exploring the Success Factors of State Website Functionality: An
Empirical Investigation. paper presented at The national conference on digital government
research, Atlanta, GA.
Gilbert, D., Wong, Robin K.C. (2003). Passenger expectations and airline services: A Hong
Kong based study. Tourism Management, 24, 519-532.
41
Glatthorn, A. and R. Joyner (2005). Writing the Winning Thesis or Dissertation. Thousand
Oaks, CA: Corwin Press.
Hulland, J. (1999). Use of partial least squares (PLS) in strategic management research: A
review of four recent studies. Strategic Management Journal, 20(2), 195-204.
Human Environment and Transport Inspectorate (ILenT). (2006). Year report. Retrieved from
http://www.ilent.nl/Images/Jaarbericht%202005_tcm334-312092.pdf
Irish Aviation Authority (IAA). (2013). Press release. Retrieved from
http://www.rijksoverheid.nl/documenten-en-publicaties/brieven/2013/01/18/ryanair-
weather-diversions-madrid.html
International Air Transport Association (IATA). (2012). Press release. Retrieved from
http://www.iata.org/pressroom/pr/pages/2012-03-06-01.aspx
Janic, M. (2000). An Assessment of risk and safety in civil aviation. Journal of Air Transport
Management, 6, 43-50.
Lin, N.-P., H.-C. Chiu and Y.-C. Hsieh, 2001, ‘Investigating the Relationship Between Service
Providers’ Personality and Customers’ Perceptions of Service Quality Across Gender’, Total
Quality Management, Vol.12, No.1, pp.57–67.
Ling Feng-I, (2005). Difference in service quality of cross-strait airlines and its effect on
passengers’ preferences. Journal of the Eastern Asia Society for Transportation Studies, Vol.
6, pp. 798 - 813, 2005
Malhotra, N.K. and Birks, D.F.,2003. Marketing Research: An Applied Approach, Prentice
Hall, Harlow.
Mooradian, T. & Oliver, J. (1997). “I can’t get no satisfaction”: the impact of personality and
emotion on post purchase processes. Psychology and Marketing, 14: 379-393.
Mowen, J.C. (1990). Consumer Behavior (2 ed.). New York: Macmillan Publishing Company.
42
O’Connell, J.F., Williams, G. (2005). Passengers’ perceptions of low cost airlines and full
service carriers: A case study involving Ryanair, Aer Lingus, Air Asia and Malaysia Airlines.
Journal of Air Transport Management, 11, 259-272.
Nunnally, J. C. (1978). Psychometric theory (2nd ed.). New York: McGraw-Hill.
Parasuraman, Z., Berry. (1985). A conceptual model of service quality and its implications for
further research. Journal of Marketing, 49, 41-50.
Parasuraman, Z., Berry. (1988). A multiple-item scale for measuring consumer perceptions of
service quality. Journal of Retailing, 64, 28-31.
Proussaloglou, K., Koppelman, F. (1995). Air carrier demand. An analysis of marketshare
determinants. Transportation, 22, 371-388.
Ringle, C.M., Wende, S., Will, S., 2005. SmartPLS 2.0 (M3). Beta, Hamburg.
http://www.smartpls.de.
Shanteau, J. (1992). Competence in experts: The role of task characteristics. Organizational
Behavior and Human Decision Processes, 53, 252-266.
Tenenhaus, M. (1999): “L’approche PLS”, Revue de Statistique Appliquée, vol. 47, n°2, pp. 5-
40.
Van Birgelen, M., Ghijsen, Paul, Semeijn, Janjaap. (2005). The added value of web innovation
for customer satisfaction; Experiences with a barbeque catering service. Managing Service
Quality, 15(6), 539-554.
Wanke, P., R. Arkader and M.F. Hijjar (2007), “Logistics Alliances: The European Experience,”
McKinsey Quarterly, 1 (1), 39-49.
J. Chris White, P. Varadarajan and P. Dacin (2003), “Market Situation Interpretation and
Response: The Role of Cognitive Style, Organizational Culture and Information use,” Journal
of Marketing, Volume 67, July, 63-99.
43
Zeithaml, V. A., Berry, L.L., Parasuraman, A. (1996). The behavioral consequences of service
quality. Journal of Marketing, 60, 31-46.
Zeithaml, V.A., Bitner, M.J., Gremler, D.D. (2006). Services Marketing: Integrating Customer
Focus Across The Firm. In Services Marketing: Integrating Customer Focus Acros The Firm (4
ed., pp. 116-120). New York: McGraw-Hill.

44
APPENDIX
Appendix A: Descriptive Statistics on Item Level
Appendix B: Constructs and Items
Appendix C: Questionnaire
45
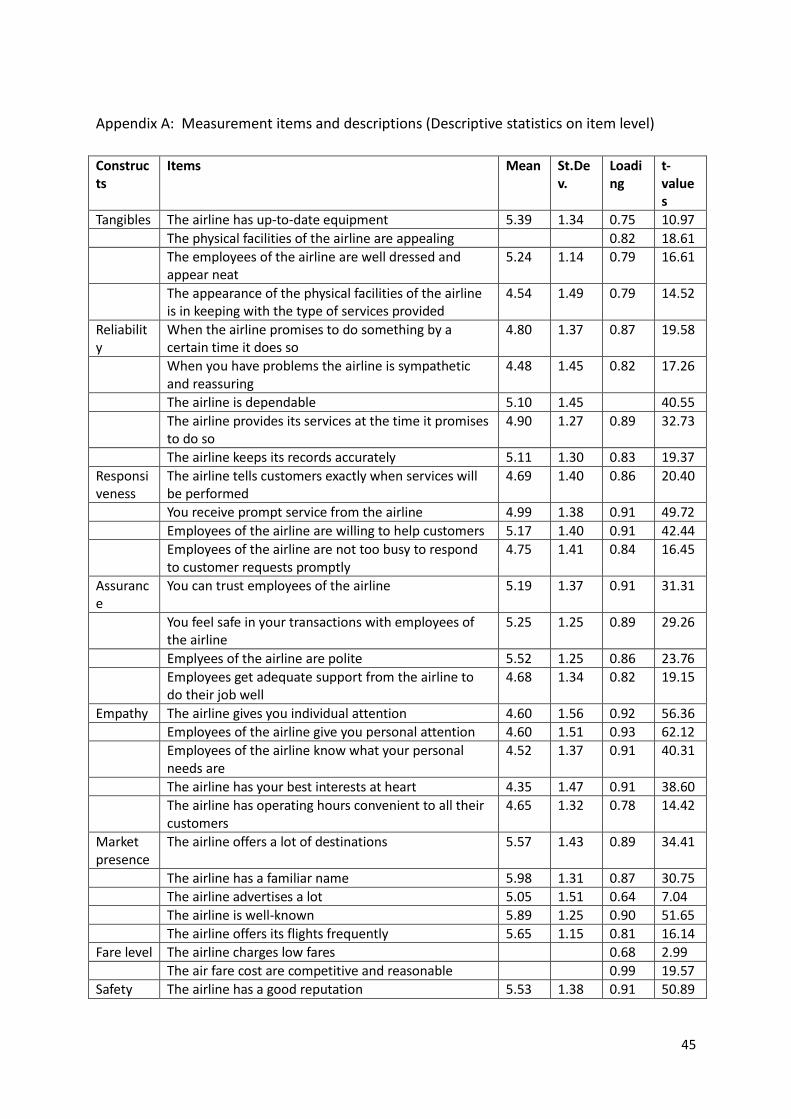
Appendix A: Measurement items and descriptions (Descriptive statistics on item level)
Constructs
Items Mean St.Dev.
Loading
t-values
Tangibles The airline has up-to-date equipment 5.39 1.34 0.75 10.97
The physical facilities of the airline are appealing 0.82 18.61
The employees of the airline are well dressed and appear neat
5.24 1.14 0.79 16.61
The appearance of the physical facilities of the airline is in keeping with the type of services provided
4.54 1.49 0.79 14.52
Reliability
When the airline promises to do something by a certain time it does so
4.80 1.37 0.87 19.58
When you have problems the airline is sympathetic and reassuring
4.48 1.45 0.82 17.26
The airline is dependable 5.10 1.45 40.55
The airline provides its services at the time it promises to do so
4.90 1.27 0.89 32.73
The airline keeps its records accurately 5.11 1.30 0.83 19.37
Responsiveness
The airline tells customers exactly when services will be performed
4.69 1.40 0.86 20.40
You receive prompt service from the airline 4.99 1.38 0.91 49.72
Employees of the airline are willing to help customers 5.17 1.40 0.91 42.44
Employees of the airline are not too busy to respond to customer requests promptly
4.75 1.41 0.84 16.45
Assurance
You can trust employees of the airline 5.19 1.37 0.91 31.31
You feel safe in your transactions with employees of the airline
5.25 1.25 0.89 29.26
Emplyees of the airline are polite 5.52 1.25 0.86 23.76
Employees get adequate support from the airline to do their job well
4.68 1.34 0.82 19.15
Empathy The airline gives you individual attention 4.60 1.56 0.92 56.36
Employees of the airline give you personal attention 4.60 1.51 0.93 62.12
Employees of the airline know what your personal needs are
4.52 1.37 0.91 40.31
The airline has your best interests at heart 4.35 1.47 0.91 38.60
The airline has operating hours convenient to all their customers
4.65 1.32 0.78 14.42
Market presence
The airline offers a lot of destinations 5.57 1.43 0.89 34.41
The airline has a familiar name 5.98 1.31 0.87 30.75
The airline advertises a lot 5.05 1.51 0.64 7.04
The airline is well-known 5.89 1.25 0.90 51.65
The airline offers its flights frequently 5.65 1.15 0.81 16.14
Fare level The airline charges low fares 0.68 2.99
The air fare cost are competitive and reasonable 0.99 19.57
Safety The airline has a good reputation 5.53 1.38 0.91 50.89
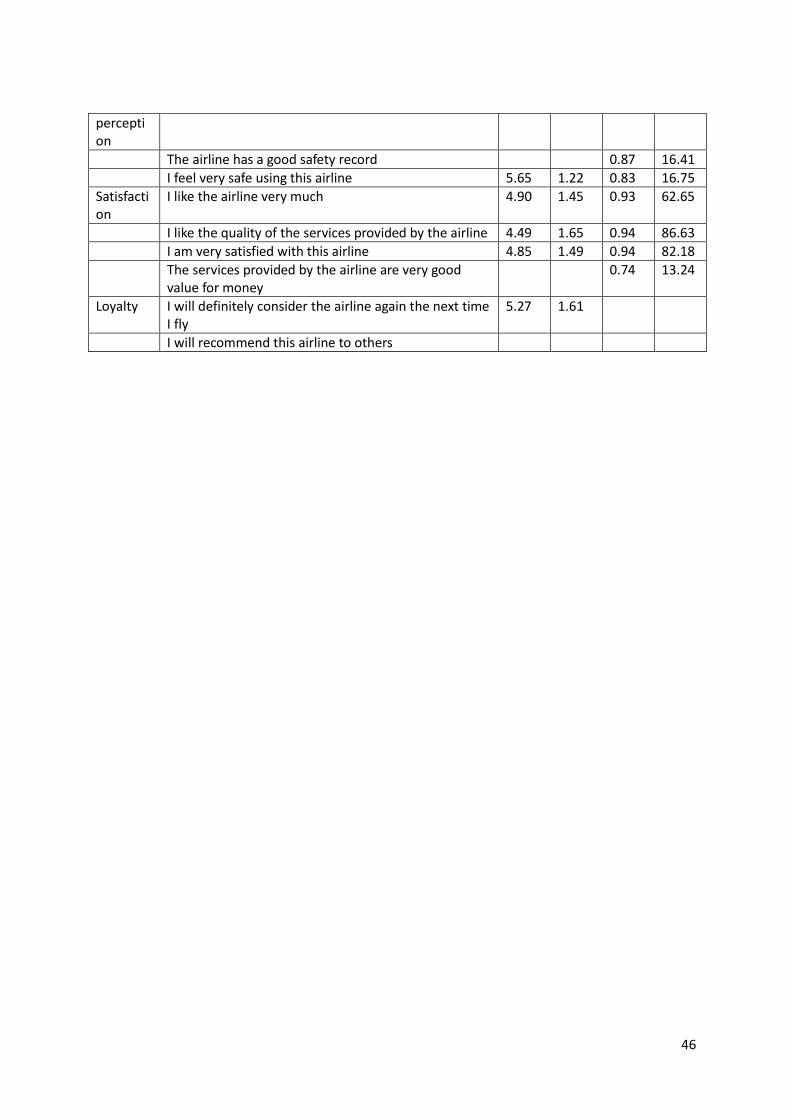
46
perception
The airline has a good safety record 0.87 16.41
I feel very safe using this airline 5.65 1.22 0.83 16.75
Satisfaction
I like the airline very much 4.90 1.45 0.93 62.65
I like the quality of the services provided by the airline 4.49 1.65 0.94 86.63
I am very satisfied with this airline 4.85 1.49 0.94 82.18
The services provided by the airline are very good value for money
0.74 13.24
Loyalty I will definitely consider the airline again the next time I fly
5.27 1.61
I will recommend this airline to others
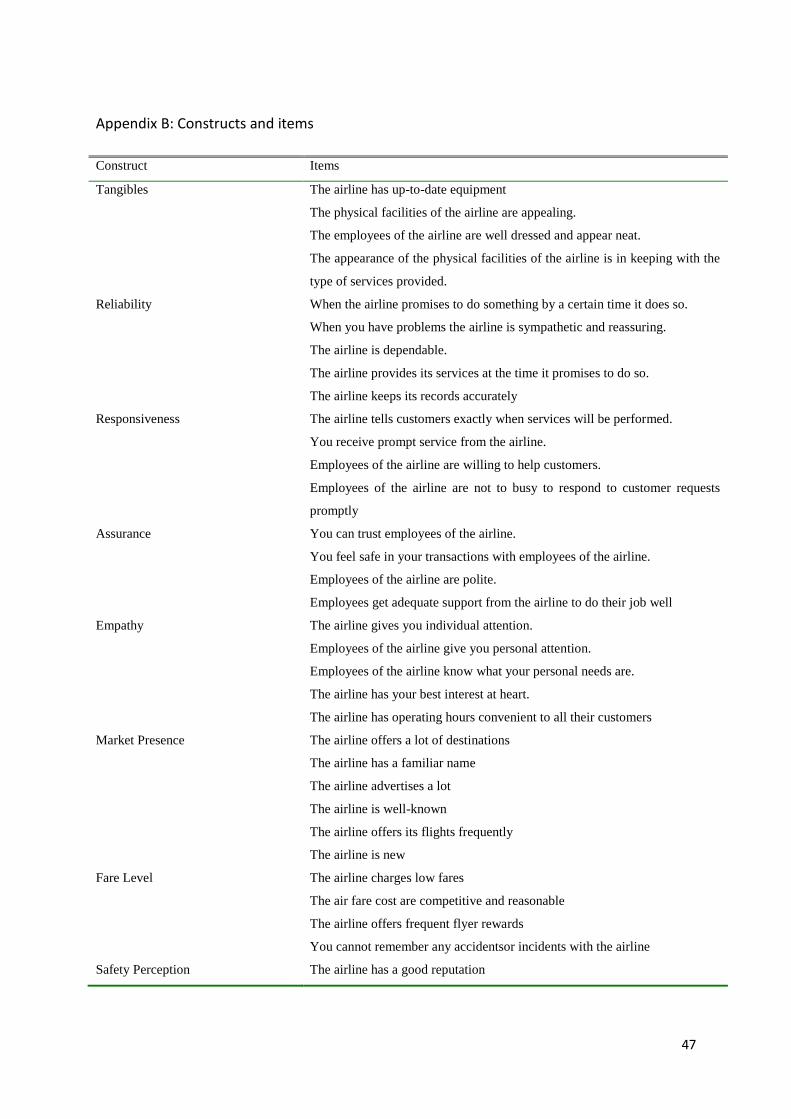
47
Appendix B: Constructs and items
Construct Items
Tangibles The airline has up-to-date equipment
The physical facilities of the airline are appealing.
The employees of the airline are well dressed and appear neat.
The appearance of the physical facilities of the airline is in keeping with the
type of services provided.
Reliability When the airline promises to do something by a certain time it does so.
When you have problems the airline is sympathetic and reassuring.
The airline is dependable.
The airline provides its services at the time it promises to do so.
The airline keeps its records accurately
Responsiveness The airline tells customers exactly when services will be performed.
You receive prompt service from the airline.
Employees of the airline are willing to help customers.
Employees of the airline are not to busy to respond to customer requests
promptly
Assurance You can trust employees of the airline.
You feel safe in your transactions with employees of the airline.
Employees of the airline are polite.
Employees get adequate support from the airline to do their job well
Empathy The airline gives you individual attention.
Employees of the airline give you personal attention.
Employees of the airline know what your personal needs are.
The airline has your best interest at heart.
The airline has operating hours convenient to all their customers
Market Presence The airline offers a lot of destinations
The airline has a familiar name
The airline advertises a lot
The airline is well-known
The airline offers its flights frequently
The airline is new
Fare Level The airline charges low fares
The air fare cost are competitive and reasonable
The airline offers frequent flyer rewards
You cannot remember any accidentsor incidents with the airline
Safety Perception The airline has a good reputation
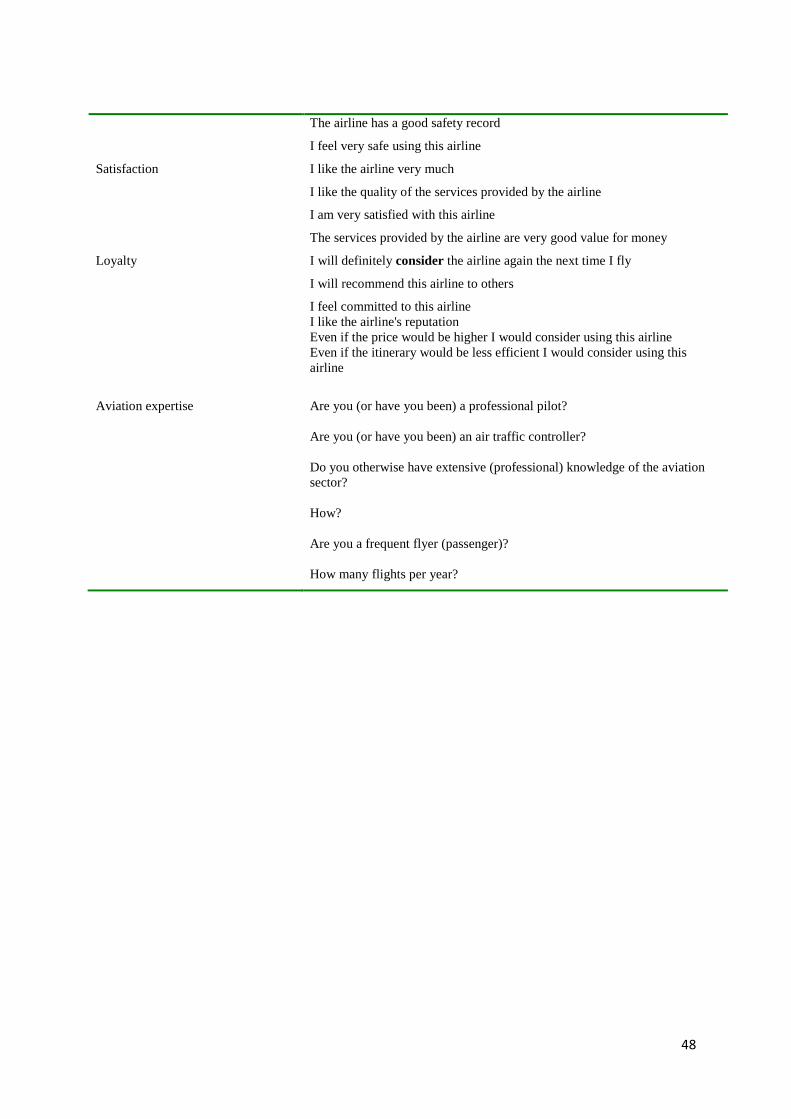
48
The airline has a good safety record
I feel very safe using this airline
Satisfaction I like the airline very much
I like the quality of the services provided by the airline
I am very satisfied with this airline
The services provided by the airline are very good value for money
Loyalty I will definitely consider the airline again the next time I fly
I will recommend this airline to others
I feel committed to this airline
I like the airline's reputation
Even if the price would be higher I would consider using this airline
Even if the itinerary would be less efficient I would consider using this
airline
Aviation expertise Are you (or have you been) a professional pilot?
Are you (or have you been) an air traffic controller?
Do you otherwise have extensive (professional) knowledge of the aviation
sector?
How?
Are you a frequent flyer (passenger)?
How many flights per year?
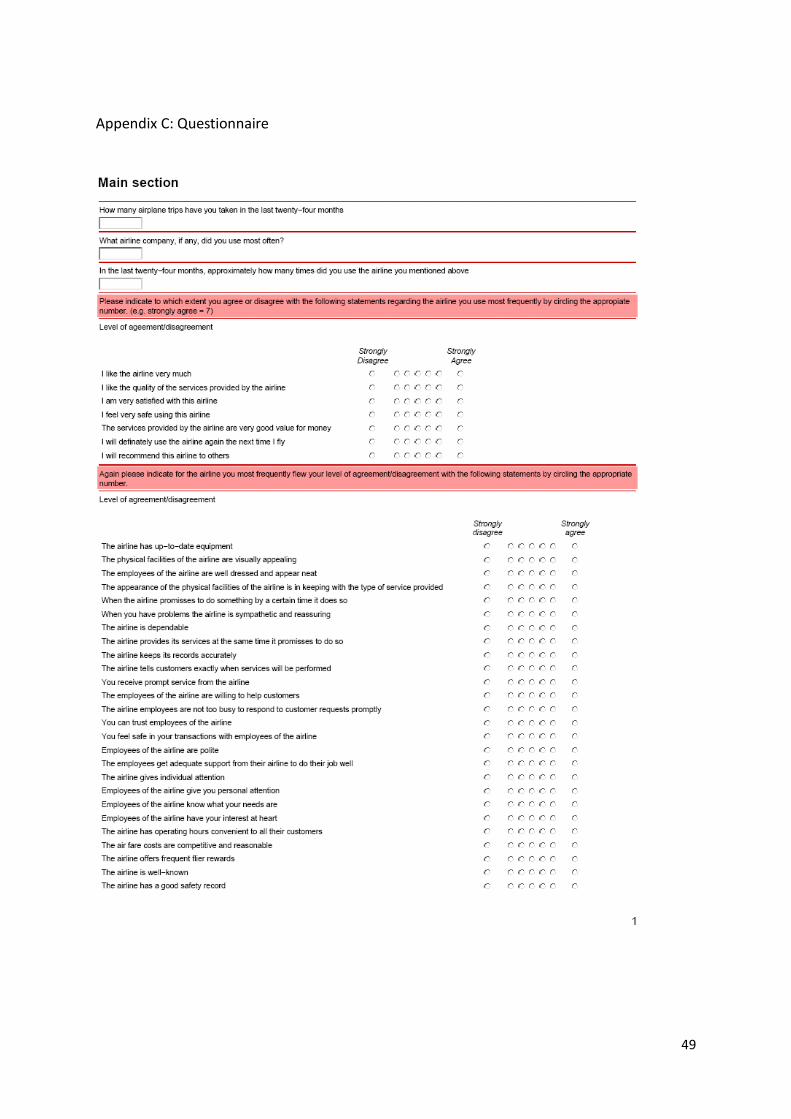
49
Appendix C: Questionnaire
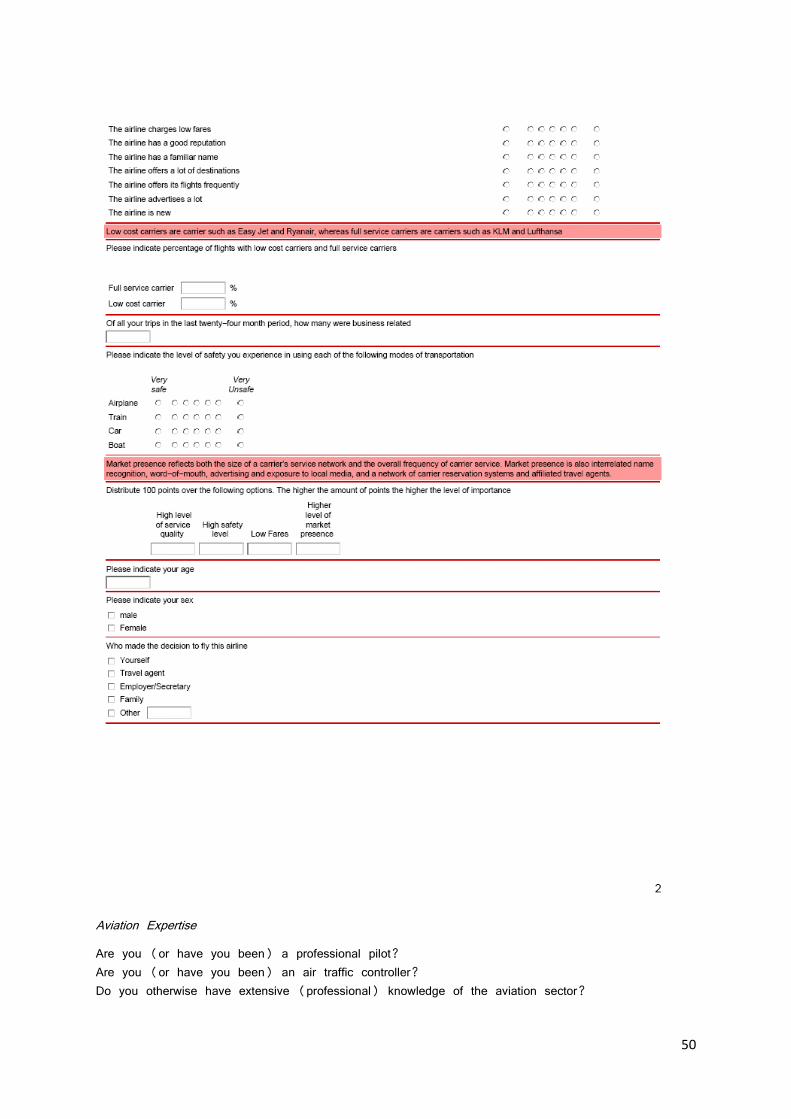
50
Aviation Expertise
Are you (or have you been) a professional pilot? Are you (or have you been) an air traffic controller? Do you otherwise have extensive (professional) knowledge of the aviation sector?
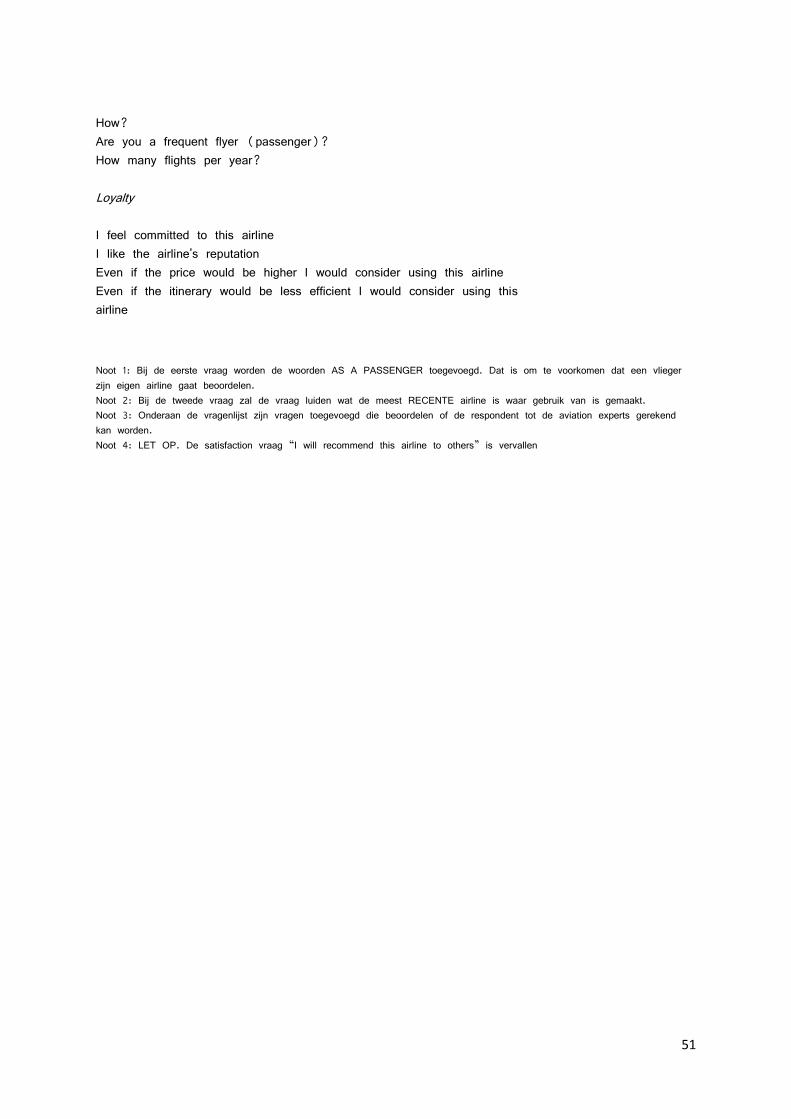
51
How? Are you a frequent flyer (passenger)? How many flights per year? Loyalty I feel committed to this airline I like the airline's reputation Even if the price would be higher I would consider using this airline Even if the itinerary would be less efficient I would consider using this airline
Noot 1: Bij de eerste vraag worden de woorden AS A PASSENGER toegevoegd. Dat is om te voorkomen dat een vlieger zijn eigen airline gaat beoordelen. Noot 2: Bij de tweede vraag zal de vraag luiden wat de meest RECENTE airline is waar gebruik van is gemaakt. Noot 3: Onderaan de vragenlijst zijn vragen toegevoegd die beoordelen of de respondent tot de aviation experts gerekend kan worden. Noot 4: LET OP. De satisfaction vraag “I will recommend this airline to others” is vervallen