Embed Size (px)
Citation preview

The role of Snail and Slug in invasion and cancer stem cell
maintenance in glioblastoma multiforme
Inauguraldissertation
eingereicht im Fachbereich Medizin
in Erfüllung der Anforderungen zur Erlangung des akademischen Grades Ph.D.
der Fachbereiche Veterinärmedizin und Medizin
der Justus-Liebig-Universität Gießen
Vorgelegt von Sarah Goos
aus Herborn
Gießen 2015

Aus dem Institut für Neuropathologie
(Direktor: Prof. Dr.med. Till Acker)
des Fachbereichs Medizin
Erster Gutachter und Mitglied der Prüfungskommission: Prof. Dr. Till Acker
Zweiter Gutachter und Mitglied der Prüfungskommission : Prof. Dr. Amparo Acker-
Palmer
Weitere Gutachter in der Prüfungskommission:
Tag der Disputation:

Declaration
I declare that I have completed this dissertation single-handedly without the
unauthorized help of second party and only with the assistance acknowledged
therein. I have appropriately acknowledged and referenced all text passages that are
derived literally from or based on the content of published or unpublished work of
others, and all information that relates to verbal communications. I have abided by
the principles of good scientific conduct laid down in the charter of the Justus Liebig
University of Giessen in carrying out the investigations described in the dissertation.

Table of content
1. Summary ........................................................................................................................... 1
2. Zusammenfassung ............................................................................................................ 2
3. Introduction ....................................................................................................................... 4
3.1 Classification of malignant glioma ................................................................................ 4
3.1.1 Molecular subclasses of glioma ............................................................................. 6
3.2 Invasion and migration of tumour cells ......................................................................... 8
3.2.1 Mechanisms of invasion and migration .................................................................. 9
3.3 Epithelial-to-mesenchymal transition ...........................................................................11
3.3.1 Induction of EMT by Hypoxia ................................................................................13
3.3.2 Induction of EMT by TGFβ ....................................................................................14
3.3.3 The Snail super-family of transcription factors and their role in E(G)MT ...................15
3.4 Cancer stem cells .......................................................................................................19
3.4.1 Cancer stem cells in glioma ..................................................................................21
3.6 Aim of the study ..........................................................................................................25
4. Results .............................................................................................................................26
4.1. Expression of Snail and Slug in the different molecular subclasses of glioblastoma ...26
4.2 Regulation of Snail and Slug expression and induction of GMT by environmental
signals ..............................................................................................................................27
4.3. The loss of Snail and Slug impairs GMT and the establishment of a cancer stem cell
phenotype .........................................................................................................................29
4.4 Snail and Slug influence the cancer stem cell phenotype of GBM cells .......................33
4.5 Apoptosis and proliferation of GBM cells in vitro is not impaired by the loss of Snail and
Slug ..................................................................................................................................36
4.6. The loss of Snail and Slug impairs the invasiveness of GBM cells in vitro ..................37
4.7. Snail and Slug deficient cells show reduced tumour growth .......................................40
4.8. The loss of Snail and Slug does not impair apoptosis, proliferation or vascularisation in
vivo ...................................................................................................................................41
4.9. The loss of Snail and Slug impairs the invasiveness of GBM cells in vivo ..................45
5. Discussion ........................................................................................................................47
5.1 The molecular subclassification of GBM .....................................................................47
5.2 The distinctive features of EMT and GMT ...................................................................51
5.3 The importance of Snail and Slug in GMT in glioblastoma multiforme .........................53
5.4 EMT and the cancer stem cell phenotype ...................................................................54
5.4.1 The role of Snail and Slug in the maintenance of cancer stem cells in GBM .........56
5.5 Invasion in GBM ..........................................................................................................57

5.5.1 GMT and invasion ................................................................................................58
5.6 Snail and Slug in tumour growth .................................................................................59
5.7 Perspectives ...............................................................................................................60
5.7.1 Transcriptomic analysis ........................................................................................60
5.7.2 Snail and Slug as therapeutic targets ...................................................................61
6. Materials and Methods .....................................................................................................63
6.1 Materials .....................................................................................................................63
6.1.1 Antibiotics .............................................................................................................63
6.1.2 Antibodies.............................................................................................................63
6.1.2.1. Primary antibodies ........................................................................................63
6.1.2.2. Secondary antibodies ....................................................................................65
6.1.3 Human cell lines ...................................................................................................65
6.1.4. Knock-down cell pools generated in this work .....................................................66
6.1.5. Plasmids ..............................................................................................................67
6.1.6 Sequences (Primers) ............................................................................................68
6.1.7 Growth factors ......................................................................................................69
6.1.8 Protein/DNA ladders .............................................................................................69
6.1.8.1 Protein ladders ...............................................................................................69
6.1.9 Media, Buffers and other reagents ........................................................................70
6.1.9.1 Animal experiments ...........................................................................................70
6.1.10 Bacterial cultures ............................................................................................70
6.1.11 Cell culture ......................................................................................................70
6.1.12 Western Blot .......................................................................................................72
6.2 Solvents/Chemicals ....................................................................................................73
6.3 Methods ......................................................................................................................73
6.3.1 Working with RNA ................................................................................................73
6.3.1.1 RNA extraction ...............................................................................................73
6.3.1.2 Reverse transcription .....................................................................................74
6.3.2 Working with DNA ................................................................................................74
6.3.2.1 Plasmid isolation ............................................................................................74
6.3.2.2 Measuring DNA/RNA concentrations .............................................................74
6.3.2.3 Sequencing ....................................................................................................74
6.3.2.4 Quantitative real time polymerase chain reaction (qRT-PCR) ........................75
6.3.3 Working with proteins ...........................................................................................76
6.3.3.1 Protein extraction ...........................................................................................76
6.3.3.2 Determination of protein concentration ...........................................................76

6.3.3.3 SDS-PAGE (Sodium-Dodecyl-Sulfate-Poly Acrylamide Gel
Electrophoresis)/Western Blot ....................................................................................77
6.3.3.4 Western blot membrane stripping ...................................................................77
6.4.4 Cell culture ...........................................................................................................78
6.4.4.1. Isolation of primary glioblastoma cells from human tumor specimen .............78
6.4.4.2 Cell culture conditions for established cell lines ..............................................78
6.4.4.3 Subculturing cells ...........................................................................................79
6.4.4.4 Cryopreservation of cells ................................................................................79
6.4.4.5 Determining cell number ................................................................................80
6.4.4.6 Producing lentiviruses in HEK 293T cells using calcium phosphate transfection
..................................................................................................................................80
6.4.4.7 Titration of lentiviral particles ..........................................................................82
6.4.4.8 Lentiviral transduction of cells ........................................................................82
6.4.4.8.1 Stable transduction of primary glioblastoma cell lines ..............................82
6.4.4.8.2 Stable transduction of glioblastoma cell lines ...........................................83
6.4.4.9 Hypoxic incubation of cells .............................................................................83
6.4.4.10 Sphere formation assay ...............................................................................83
6.4.4.11 Fluorescence activated cell sorting (FACS) ..................................................84
6.4.4.12 Modified Boyden Chamber assay .................................................................85
6.4.4.13 Collagen Invasion assay ..............................................................................86
6.4.5 In vivo tumour models ..........................................................................................86
6.4.5.1 Intracranial tumour xenograft models .............................................................86
6.4.5.2 Perfusion and tissue preparation ....................................................................87
6.4.5.3 Quantification of tumour volume and hematoxylin an eosin (HE) staining ......87
6.4.5.4 Analysis of invasiveness of xenograft tumours ...............................................88
6.4.6 Immunofluorescence stainings .............................................................................89
6.4.6.1 BrdU labelling and staining of cells .................................................................89
6.4.6.2 Free-floating endomucin staining of 40µm brain sections ...............................90
6.4.6.3 Phospho-histone 3 staining of 40µm brain sections .......................................90
6.4.6.4 Staining of apoptotic cells ..............................................................................91
6.4.7 Statistical analysis ................................................................................................91
7. Literature ..........................................................................................................................92
Abbreviations ..................................................................................................................... 111
Acknowledgements ............................................................................................................ 116
Curriculum vitae ................................................................................................................. 117

Summary
1
1. Summary
Glioblastoma multiforme (GBM) is the most common tumour of the central nervous
system. Despite some progress in the therapy of the disease, patients still have a
poor prognosis and a median survival of approximately 15 months. The biggest
obstacle for successful surgical removal of glioblastoma is the high infiltration of
invasive cancer cells throughout the brain. This makes it impossible to remove the
complete tumour tissue, eventually resulting in relapse. Recent evidence suggests
that glial-to-mesenchymal transition (GMT), a cellular program comparable to
epithelial-to-mesenchymal transition (EMT), could play a major role in controlling the
invasiveness of glioma cells. The transcription factors Snail and Slug are known to be
major regulators of EMT in epithelial cancers. We therefore hypothesized that they
may act as key components of GMT in glioma. Analysis of the expression of Snail
and Slug in GBMs of different molecular subclasses revealed that these two EMT
regulators are mainly expressed in the mesenchymal GBM subclass. By profiling a
panel of signature markers we demonstrate that the combined loss of Snail and Slug
impaired the TGFβ1-induced transition from a glial/proneural phenotype to a
mesenchymal phenotype in GBM cells. Furthermore, we show that Snail and Slug
play a crucial role in controlling glioblastoma stem cell properties, such as self-
renewal and the expression of cancer stem cell markers. In line with their role in
GMT, Snail and Slug silencing led to a severely impaired invasive behaviour of GBM
cells in vitro. Importantly, we found that Snail and Slug silenced GBM cells showed
significantly reduced tumour growth in an orthotopic mouse xenograft model. Detailed
analysis revealed that the reduced growth did not result from changes in proliferation
and apoptosis due to the silencing of Snail and Slug. Instead, the invasiveness of
Snail and Slug silenced cells was drastically reduced. In summary, this work
demonstrates that Snail and Slug are major regulators of GMT in glioma, controlling
the transition from a glial/proneural to a mesenchymal phenotype. Importantly, the
mesenchymal phenotype is closely connected to the adoption of invasive and stem
cell properties indicating that these are the major mechanisms through which Snail
and Slug regulate GBM growth. This improved understanding of GMT in glioma could
help to optimize existing GBM treatments and provide a basis for the development of
novel therapeutic strategies.

Zusammenfassung
2
2. Zusammenfassung
Glioblastoma multiforme (GBM) ist der häufigste Tumor des zentralen
Nervensystems. Trotz großer Fortschritte in der Therapie der Erkrankung haben
Patienten immer noch eine schlechte Prognose und eine mittlere Lebenserwartung
von 15 Monaten. Das größte Hindernis bei der chirurgischen Entfernung des Tumors
ist die hohe Infiltration des Gehirns durch invasive Krebszellen. Dadurch ist es
nahezu unmöglich das vollständige Tumorgewebe zu entfernen und viele Patienten
leiden unter einem Rezidiv. Neueste Erkenntnisse legen nahe, dass gliale zu
mesenchymale Transition (GMT), ein zelluläres Programm vergleichbar mit
epithelialer zu mesenchymaler Transition (EMT), eine wichtige Rolle bei der Kontrolle
der Invasivität von Gliomzellen spielt. Es ist bekannt, dass die Transkriptionsfaktoren
Snail und Slug EMT-Hauptregulatoren in epithelialen Tumoren sind. Daher nehmen
wir an, dass diese Transkriptionsfaktoren ebenfalls Schlüsselkomponenten von GMT
in GBM sind. Eine Analyse der Expression von Snail und Slug in GBMs in
verschiedenen molekularen Unterklassen zeigte, dass diese beiden Regulatoren vor
allem in der mesenchymalen GBM-Unterklasse exprimiert werden. Wir zeigen
anhand der Expression einiger Signaturmarker, dass der gleichzeitige Verlust von
Snail und Slug den TGFβ1-induzierten Übergang von einem glialen/proneuralen
Phänotypen hin zu einem mesenchymalen Phänotypen verhindert. Darüber hinaus
demonstrieren wir, dass Snail und Slug eine entscheidende Rolle bei der Kontrolle
der Glioblastom-Stammzelleigenschaften wie Selbsterneuerung und der Expression
von Krebsstammzellmarker spielen. Der Verlust von Snail und Slug führte des
Weiteren zu einer starken Beeinträchtigung des invasiven Verhaltens der Krebszellen
in vitro. Wichtig ist, dass reduzierte Snail und Slug Expression in GBM Zellen zu
einem signifikant reduzierten Tumorwachstum in einem orthotopischen Maus-
Xenograft-Modell führte. Detaillierte Analyse der Tumore zeigte, dass das reduzierte
Wachstum nicht von Veränderungen der Proliferation und Apoptose der Zellen
herrührte. Stattdessen konnten wir durch eine in vivo Invasionanalyse belegen, dass
der Verlust von Snail und Slug die Invasionsfähigkeit der Zellen signifikant verringert.
Zusammenfassend zeigt diese Arbeit, dass Snail und Slug wichtige GMT-
Regulatoren sind die den Übergang von einem glialen/proneuralen zu einem
mesenchymalen Phänotypen kontrollieren. Wichtig ist, dass der mesenchymale

Zusammenfassung
3
Phänotyp sehr eng mit der Invasivität und dem Erwerb von Stammzell-Eigenschaften
der Gliomzellen verknüpft ist. Das legt nahe, dass dies wichtige Mechanismen sind
durch die Snail und Slug das Tumorwachstum von GBM kontrollieren. Dieses
verbesserte Verständnis von GMT könnte dazu beitragen bestehende
Behandlungsformen von GBM zu verbessern und neue therapeutische Ansätze zu
finden.

Introduction
4
3. Introduction
Primary tumours of the central nervous system consist of a quite heterogeneous
group of benign and malignant neoplasias (Soeda et al.). The majority of CNS
tumours are of glial origin and termed glioma (Ohgaki and Kleihues, 2005). Initially
glioma were classified according to the original glial cell type that the tumour arose
from: astrocytic, oligodendrocytic, ependymal or mixed forms (Louis et al., 2007).
However, recent evidences obtained from human and animal studies also suggest
neural stem cells as alternative cells of origin of gliomas (Canoll and Goldman, 2008;
Caussinus and Gonzalez, 2005; Dirks, 2006; Galli et al., 2004; Singh et al., 2003).
Glioblastoma multiforme belongs to the most common glial neoplasia and shows the
highest malignancy and aggressiveness in the group of gliomas. Patients diagnosed
with GBM have a median survival of fifteen months (Norden and Wen, 2006). In the
last years research improved the therapeutic approaches to treat the patients, but the
prognosis is still poor. The most common therapy is the surgical removal of the
primary tumour combined with radio-and or chemotherapy. Unfortunately it is nearly
impossible to remove and eliminate all cancer cells, primarily due to the high invasive
capacity of the tumour cells into the surrounding brain parenchyma already prior to
the surgery. Secondary tumours arise from these remaining and invading cells and
reduce the survival of the patients.
3.1 Classification of malignant glioma
The World Health Organization (WHO) classified gliomas in terms of malignancy into
grade I, II, III and IV (published in the 3rd edition by Kleihues and Cavenee in 2000,
complemented by Louis and Kleihues in 2007, Table 3.1). These grades are based
on histological facts like cell differentiation, cell and cell core polymorphism, cell
density, proliferation rate, proliferation of endothelium and tumour necrosis.
Tumours classified as grade I glioma, such as pilocytic astrocytoma and
subependymal giant cell astrocytoma, show a high extent of differentiation and a slow
proliferation with a good survival prognosis for the patient.

Introduction
5
Grade II gliomas, such as diffuse astrocytoma, pleomorphic xanthoastrocytoma or
pilomyxoid astrocytoma, are characterized by diffuse infiltration of the brain
parenchyma, weak proliferation and patients often suffer from relapse of the tumour.
The median survival of patients with grade II tumours is between three to eight years.
Anaplastic astrocytoma and anaplastic oligodendroglioma are examples for grade III
tumours. Characteristics for this tumour type are atypical cell core morphology, high
rate of proliferation and single cell necrosis. Patients have a median survival of two to
three years (Norden and Wen, 2006).
Grade IV tumours show high proliferation, necrotic areas, hyper proliferating
endothelium and high polymorphism. Glioblastoma multiforme (GBM) is the most
abundant tumour type in this class. Patients diagnosed with GBM have a median
survival of fifteen months. The median age of patients diagnosed with glioblastoma is
64 years.
WHO-Grade Tumour Type
I Pilocytic astrocytoma, subependymal
giant cell astrocytoma
II diffuse astrocytoma, pleomorphic
xanthoastrocytoma, pilomyxoid
astrocytoma
III Anaplastic astrocytoma, anaplastic
oligodendroglioma,
IV Glioblastoma
Table 3.1 Examples of grade I-IV gliomas, based on the WHO classification of tumours
of the central nervous system (Louis et al., 2007)
Nearly 70% of all diagnosed primary malignant brain tumours in the USA are
gliomas. Every year more than 14.000 new cases are reported. That means that 5
people out of 100.000 are diagnosed with glioma. Approximately 60 to 70% of
malignant gliomas are glioblastoma, 10 to 15% are anaplastic astrocytoma,
anaplastic oligodendroglioma and anaplastic oligoastrocytoma account for 10%. The

Introduction
6
rest are the less common anaplastic ependymoma and anaplastic ganglioglioma
(Wen and Kesari, 2008)
3.1.1 Molecular subclasses of glioma
With the development of new molecular techniques the classification of gliomas was
refined to include information related to the expression of specific genetic signatures.
With the help of microarray gene expression profiling it was possible to identify
molecular subtypes of gliomas as well as genes associated with tumour grade,
progression, and patient survival (Godard et al., 2003; Rickman et al., 2001; van den
Boom et al., 2003). While GBM and anaplastic astrocytomas are still defined by
histological criteria, several reports showed that expression profiles predict patient
outcome better than a histological examination (Freije et al., 2004; Nutt et al., 2003).
This led to the hypothesis that neoplasms defined morphologically as anaplastic
astrocytoma and GBM could represent a mix of molecular genetic subtypes.
In 2006 Phillips et al. (Phillips et al., 2006) showed prognostically relevant molecular
subclasses of high grade glioma, especially high grade astrocytoma. These
subclasses resemble known stages in neurogenesis. They divided their expression
profiling in three subgroups: proneural, proliferative and mesenchymal.
The proneural subclass showed a better prognosis in patient outcome and expressed
genes that are associated with normal brain and the process of neurogenesis (for
example Olig2 (oligodendroglial marker 2) and MAP2 (microtubule associated protein
2)). For the proliferative subclass the authors reported increased expression of genes
involved in cell proliferation (for example PCNA (proliferating cell nuclear antigen)
and TOP2A (topoisomerase II alpha). The mesenchymal subclass was defined by the
enrichment of cells of mesenchymal origin with the upregulation of respective genes
like CD44 (transmembrane glycoprotein) or YKL40 (human chitinase 3 like protein 1)
as well as the stem cell marker CD133 (transmembrane glycoprotein). Both classes
showed a poor overall survival of the patients. Interestingly recurrent tumours were
observed to shift in their expression profile to the mesenchymal subclass.

Introduction
7
Based on the study described above and on data from The Cancer Genome Atlas
(TCGA) glioblastoma cohort in 2010 Verhaak et al. (Verhaak et al., 2010) defined
four subclasses of tumours (proneural, neural, classical, mesenchymal) all
morphologically diagnosed as GBM.
The proneural subtype showed an amplification of PDGFRA (platelet derived growth
factor receptor A) and very frequently a point mutation in IDH1 (isocitrate
dehydrogenase 1) as well as a mutation and the loss of heterozygosity in p53.
Furthermore a high expression of oligodendrocytic development genes such as
PDGFRA and Olig2 was characteristic for this subclass.
In accordance to the study of Phillips et al. the expression of YKL40 and CD44 was
elevated in the mesenchymal subclass. Furthermore they found a frequent
hemizygous deletion of NF1 and a co-occurring mutation of NF1 (neurofibromin 1)
and PTEN (phosphatase and tensin homologue). Components of the TNFα and the
NF-κB pathways were highly upregulated as a consequence of higher necrosis and
associated inflammatory infiltrates in the mesenchymal class.
The neural subclass was difficult to distinguish from normal brain because of the high
expression of neuron markers like NEFL (neurofilament), GABRA1 (gamma-
aminobutyric acid (GABA) A receptor alpha 1), SYT1 (synaptotagmin I) and SLC12A5
(potassium/chloride transporter), but all samples were histologically identified as
GBM.
The classical subtype showed an amplification of chromosome 7 and a loss of
chromosome 10, no mutations in p53 and amplification and a high mutation rate of
EGFR (epidermal growth factor receptor). Co-occurring with the amplification of
EGFR was a homozygous deletion of CDKN2A (cyclin-dependent kinase inhibitor
2A). In this subclass a high expression of neural precursor and stem cell marker
nestin was found, as well as a high activation of the Notch and sonic hedgehog
pathways.
Shortly after the analysis by Verhaak et al. another possibility to get a deeper insight
in the molecular differences of GBM was published. The method of choice was to
identify promoter DNA methylation alterations of 272 GBM tumours in the TCGA
cohort (Noushmehr et al., 2010). It was found that a distinct subset of samples
displays a concerted hypermethylation at a large number of loci. This could indicate

Introduction
8
the existence of a glioma CpG-island methylator phenotype (G-CIMP), as previously
described for colorectal cancer (Toyota et al., 1999). G-CIMP tumours belong to the
proneural subgroup and are more prevalent in lower-grade glioma. Interestingly, the
G-CIMP phenotype seems to be tightly associated with IDH1 mutations. Patients with
G-CIMP tumours are younger at the time of diagnosis and have an improved
outcome.
3.2 Invasion and migration of tumour cells
One of the main characteristics of GBM is the high invasive and migratory capacity of
tumour cells. Single cells or groups of cells are able to leave the primary tumour
mass and invade along the white matter, myelinated fibres or along blood vessels in
the surrounding brain parenchyma even until the contralateral hemisphere where
they are the basis for recurrent tumours. Recurrence is usually still observed even
after surgical removal of the primary tumour and chemo- or radiotherapy. The
infiltrating tumour micro-satellites or small groups of cells are hard to visualize and to
discriminate from healthy brain tissue during surgery or in MRI (Black, 1997; Claes et
al., 2007; Giese and Westphal, 1996; Louis et al., 2007).
The very common necrotic areas in glioblastoma are often surrounded by
pseudopalisades with a higher cell density. These pseudopalisades consist of cells
which show low proliferation and a higher apoptosis rate than cells that are not in
close proximity to necrotic areas. The reason for this higher cell density in
perinecrotic areas seems to be an enhanced migration of tumour cells out of the
necrotic tissue. These migratory cells are believed to be selected for a more
aggressive, more malignant and more resistant phenotype (Brat et al., 2004; Claes et
al., 2007).
Despite the high invasiveness of glioma cells distant metastasis outside neural
tissues is observed very rarely (Subramanian et al., 2002). The reasons for that are
still not fully understood. Possible contributing factors could be the blood-brain barrier
which prevents the cells to leave the brain, the lack of lymphatic drainage or the
special microenvironment of the brain which is not found in other organs and makes it

Introduction
9
more difficult for cancer cells from the brain to adapt in distant organs and establish
metastasis.
3.2.1 Mechanisms of invasion and migration
Fig. 3.2 Schematic illustration of the principal mechanisms of glioma invasion. Principally, glioma invasion can be divided into 4 steps: 1. Detachment from the tumour mass. 2. Attachment to the ECM. 3. Degradation of the ECM and 4. Migration to a distant side. The involved signalling pathways and cellular components are described in the text. (Image taken from Nakada, 2007)
The molecular principles of tumour cell invasion are based on changes in the
mechanisms of cell adhesion to the extracellular matrix (ECM) components and loss
of direct cell-cell contact. For the detachment of tumour cells from the main tumour
mass cell adhesion proteins have to be cleaved or their expression has to change
(Nakada et al., 2007). A good example for cleavage of adhesion molecules in GBM is
the transmembrane glycoprotein CD44. It interacts with hyaluronic acid in the ECM
and gets cleaved by proteinases ADAM10 and 17 (Nagano et al., 2004; Okamoto et
al., 1999) (Fig. 3.2). During the loss of cell adhesion especially in GBM the

Introduction
10
expression of the neural cell adhesion molecule NCAM is also reduced (Sasaki et al.,
1998). Furthermore calcium depending adhesion molecules like cadherins (N-
cadherin and E-cadherin) are changed in their expression during the process of
invasion. A reduced E-cadherin expression and an induced expression of N-cadherin
are important for the cell motility and migration (Cavallaro and Christofori, 2004;
Thiery, 2003). The particular role of these two proteins in invasiveness of tumour
cells will be elaborated later in detail in context of epithelial-to-mesenchymal
transition (see section 3.3).
In the brain the ECM works as a scaffold to guide invasive cells. To make way for the
migrating tumour cells the ECM gets degraded by proteolytic proteins. In glioma it is
known that especially the proteinases MMP-2 and -9 (matrix metalloproteinases),
ADAM10, 12m and 17, the serine proteinase uPA (urokinase-type plasminogen
activator) and its receptor uPAR as well as cysteine proteinases (cathepsin B, L, S)
play an important role during the degradation of the ECM (Nakada et al., 2007) (Fig.
3.2).
The motility of the cells depends furthermore on many more paracrine and autocrine
signalling pathways. Through several signalling molecules the cell morphology
changes, the cell gets polarized and starts to form protrusions like pseudopodia,
lamellipodia and filopodia to be able to invade and migrate. Invasive glioma cells
show an upregulation of Tenascin-C which stimulates via the RhoA signalling
pathway the development of actin-rich filopodia (Mahesparan et al., 2003; Wenk et
al., 2000). Also the interaction of ECM components like fibronectin, collagen, laminin
and vitronectin with the intracellular actin-cytoskeleton via integrins is an important
requirement for cell motility. In invasive glioma cells it was observed that especially
integrin-β1 is upregulated (Hynes, 2002; Perego et al., 2002) (Fig. 3.2).
The final step in the mechanism of migration is the formation of membrane anchors
which enables the cell to move forward through contractions of the cytoskeleton
(Nakada et al., 2007) (Demuth and Berens, 2004) (Fig. 3.2).

Introduction
11
3.3 Epithelial-to-mesenchymal transition
During tumour development from a benign to a malignant or metastatic tumour the
tumour cells have to undergo morphological and phenotypical changes. In case of
epithelial cancer types the cells develop from highly differentiated epithelial cells to
less differentiated, migratory and invasive cells with a mesenchymal phenotype. This
specific change is called epithelial-to-mesenchymal-transition or shortly EMT.
Originally this transition program is known from embryonic development. It is very
important for the positioning and differentiation of particular cell types and for the
development of complex structures of many tissues and inner organs during
gastrulation and the formation of the neural crest (Thiery, 2003).
An epithelial cell layer is characterised by close cell-cell contacts between
neighbouring cells through adherens junctions, tight junctions and desmosomes.
During EMT these close connections are abrogated to enable the detachment of the
cells from the basal membrane and to leave the cell layer due to a higher motility
(Fig. 3.3). For that a morphological change of the cells is necessary and the
cytoskeleton gets rearranged. Epithelial cells have a rounder shape than
mesenchymal cells which show a more spindle-shaped structure and more
protrusions like filopodia which are typical for migratory and invasive cells.
During tumorigenesis, epithelial cancer cells are also capable of undergoing changes
analogous to EMT, including the hallmarks of EMT: repression of epithelial specific
proteins like E-cadherin and upregulation of mesenchymal proteins like N-cadherin,
vimentin and fibronectin (Peinado et al., 2007; Thiery, 2002; Yilmaz and Christofori,
2009). The loss of E-cadherin is one of the key events during EMT and can be
correlated with increased tumour progression and metastatic incidence in carcinoma
(Birchmeier and Behrens, 1994; Perl et al., 1998). In tumour cells E-cadherin is
transcriptionally repressed by a group of EMT repressor genes. These repressor
genes are mainly Zinc-finger transcription factors of the Snail-family (SNAI1 (Snail),
SNAI2 (Slug)) (Batlle et al., 2000; Bolos et al., 2003; Cano et al., 2000), and the ZEB-
family (ZEB1, ZEB2) (Comijn et al., 2001; Eger A et al., 2005; Peinado et al., 2007)
(Fig. 3.3). All these transcription factors bind the E-box consensus sequence
CANNT(G) in the promoter region of E-cadherin and repress the transcription of the
gene (Batlle et al., 2000; Cano et al., 2000). SNAI1/2 and ZEB1/2 are also involved in

Introduction
12
the epigenetic regulation of E-cadherin by recruiting chromatin-remodelling
complexes (HDAC2 complex) to the E-cadherin gene (Peinado et al., 2004; Peinado
et al., 2007)
Fig. 3.3 Schematic illustration of EMT. Due to microenvironmental triggers like hypoxia or TGFβ signalling transcriptional inducers like Snail and Slug get activated and the expression of E-cadherin is repressed. The cells lose tight cell-cell contact and start to leave the epithelial cell layer. Subsequently, the expression of mesenchymal markers like vimentin and N-cadherin is elevated. Cells which gain a mesenchymal phenotype start to migrate and invade. Furthermore, EMT can promote the acquisition of a cancer stem cell phenotype. Adapted from (Pouyssegur et al., 2006).

Introduction
13
Several signalling pathways involved in tumour cell migration or cell
growth/proliferation are in turn influenced by the loss of E-cadherin, for example the
canonical Wnt pathway and the remodelling of the actin-cytoskeleton by Rho-family
GTPase dependent pathways (Cavallaro and Christofori, 2004; Perego et al., 2002).
Many EMT repressors are mainly expressed at the invasive front of tumours but also
in necrotic/hypoxic areas and are known to be regulated by many pro-tumorigenic
pathways like HIF, TGFβ, STAT3, NF-κB as well as by other autocrine growth
factors like HGF, EGF or FGF (Janda et al., 2002; Kang and Massague, 2004; Lu et
al., 2003; Peinado et al., 2003; Spaderna et al., 2006; Thiery et al., 2009; Yook et al.,
2005). These growth factors are either produced by the tumour cells themselves or
by the neighbouring stromal cells. TGFβ is also known as the most potent inducer of
SNAI transcription, discussed below (see section 3.3.3).
There is growing evidence that a program comparable to EMT can also be observed
in non-epithelial cancers like gliomas. In this context it can rather be termed GMT
(glial to mesenchymal transition) due to distinctive features of glial cells, as compared
to epithelial ones. Interestingly the same repressive transcription factors and
pathways could play an important role in glioma as well, but so far there is only little
known. Previous studies gave some of the first evidence that the EMT factors Snail
and Slug are very important regulators of this transitions (see section 3.3.2 and
3.3.3). But also other EMT regulators like TWIST1 and ZEB1 can play a functional
role in GBM growth, invasion and therapy resistance related to a transition to a
mesenchymal phenotype (Siebzehnrubl et al., 2013) (Mikheeva et al., 2010)
3.3.1 Induction of EMT by Hypoxia
Cellular responses to low oxygen tension (hypoxia) are mediated by the hypoxia
inducible factors (HIF). Under hypoxic conditions the HIFα subunit (HIF1α or HIF2α)
gets stabilised and interacts with the HIFβ subunit to form a heterodimer.
Subsequently the HIF dimer binds to hypoxic responsive elements (HREs) in the
promoter regions of hypoxia regulated genes to induce their expression. Normoxic
conditions lead to the proteasomal degradation of HIFα through ubiquitination by VHL
(von Hippel-Lindau) and no expression of hypoxia responsive genes.

Introduction
14
Hypoxia is reported as a potent inducer of EMT by elevating the expression of the
respective transcriptional regulators. The importance of HIF to induce EMT in
epithelial cancers is reported for pancreatic ductal adenocarcinoma (Liu et al.,
2014a), hepatocellular carcinoma (Liu et al., 2014b), ovarian carcinoma (Du et al.,
2014) and lung cancer (Shaikh et al., 2012). In non-epithelial cancers like GBM it is
reported that tumours with a mesenchymal gene signature show a high level of
necrotic/hypoxic areas (Verhaak, 2010). Furthermore it is known that cells
surrounding such necrotic zones (pseudopalisading cells) and therefore lacking a
sufficient oxygen supply show a high expression of the mesenchymal transcription
factors C/EBP-β and C/EBP-δ together with a poor prognosis for patients with this
class of tumours (Cooper et al., 2012). In this context a recent study reported that in
necrotic/hypoxic areas EMT is mainly promoted by the hypoxic induction of the EMT
regulator ZEB1 which facilitates the expression of mesenchymal markers and
impacts the invasiveness of the cancer cells (Joseph et al., 2015).
3.3.2 Induction of EMT by TGFβ
TGFβ is, like hypoxia, a master inducer of mesenchymal transition and invasion of
cancer cells. Latent TGFβ is immobilized to the ECM through its components
fibronectin and fibrillin by interaction with latent TGFβ-binding proteins (LTBP) like
LTB1-4. To activate TGFβ, it needs to be released by limited proteolysis mediated by
MMPs or furins which are activated and released by activated stromal cells (Mu et al.,
2002). As an alternative way to make ECM bound TGFβ accessible for its receptors
is that integrins bind to latent TGFβ-binding protein complexes and pull to induce a
conformational change (Wipff et al., 2007). Also TNFα can upregulate the
transcription of TGFβ (Sullivan et al., 2009) and subsequently accelerate TGFβ-
induced EMT dramatically (Bates and Mercurio, 2003).
Nevertheless, TGFβ has a dual role in carcinogenesis. In early lesions it is
considered to be a master anti-inflammatory cytokine which prevents uncontrolled
proliferation of the cells (Siegel and Massague, 2003). But many more advanced
tumours show a resistance towards the growth-inhibitory effects of TGFβ, instead it is
able to act as an activator of prometastatic pathways like EMT (Jakowlew, 2006).

Introduction
15
Taken together TGFβ can act on the one hand as a tumour suppressor at early
stages of cancer progression but on the other hand contribute later to the malignant
progression by promoting invasion and metastasis and help to induce oncogenic
EMT (Massague, 2008) (Galliher et al., 2006).
TGFβ induces EMT through two distinct pathways, the Smad-dependent pathways
and the Smad-independent pathway (Kalluri and Weinberg, 2009). The Smad-
dependent pathway includes the binding of TGFβ by the TGFβ receptors type I and II
which form tight complexes. The activation of the receptors lead to phosphorylation of
Smad2 and Smad3 and the receptor-related Smad (R-Smad) proteins (Massague
and Wotton, 2000). Phosphorylated Smads form heteromeric complexes with Smad4
and translocate into the nucleus to regulate transcription of EMT associated target
genes like Snail, Slug and ZEBs (Derynck and Zhang, 2003). The Smad independent
pathway is characterised by the direct activation of several non-Smad signalling
pathways through TGFβ including Ras/ERK, c-Jun and JNK (Myazono, 2009;
Ozdamar et al., 2005).
After single tumour cells or groups of cells leave the primary tumour mass and when
the invading cells reached the surrounding tissue or their specific side of metastasis
the EMT program is reversible. Through interaction with the new microenvironment
the cells can turn back to their initial epithelial phenotype. This backwards conversion
is called MET (mesenchymal to epithelial transition) (Spaderna et al., 2006; Thiery,
2003; Thiery et al., 2009). It seems that EMT in cancer is only transiently activated
and may be locally limited to the invasive front and heavily regulated by complex
orchestrated environmental cues.
3.3.3 The Snail super-family of transcription factors and their role in E(G)MT
Snail transcription factors were first discovered in the fruit fly Drosophila
melanogaster. In this organism they are essential for the development of the
mesoderm (Alberga et al., 1991; Grau et al., 1984). In vertebrates there are three
Snail family members: Snail1 (Snail), Snail2 (Slug) and Snail3 (Smuc). Interestingly,
in contrast to the other two Snail proteins, Snail3 is a non-essential protein in
embryogenesis of mice which shows a tissue specific expression in thymus and

Introduction
16
skeletal muscles (Bradley et al., 2013) and seems to have only poor abilities to
induce EMT (Gras et al., 2014).
Snail is a protein with a very short half-life. Its turn-over in the nucleus is decreased
but in the cytoplasm it gets rapidly degraded by proteasomes (Zhou et al., 2004). All
members of this transcription factor family encode transcriptional repressors. They all
share a highly conserved domain organisation. The C-terminal domain contains four
to six C2H2 type zinc fingers and binds target gene promoters at the E-box consensus
motif 5´-CANNTG-3´ and is responsible for the repressive activity of Snail (Nieto,
2002). The N-terminus of all Snail members harbours the conserved SNAG domain.
This domain is essential for the binding of co-repressor complexes to transcriptionally
and epigenetically influence the expression of target genes. Such co-repressor
complexes include the Sin3A, histone deacetylase 1/2 (HDAC1/2) complex (Peinado
et al., 2004), the Polycomb repressive complex 2 (PRC2) (Herranz et al., 2008), the
protein arginine methyltransferase 5 (PRMT5)/Ajuba complex (Hou et al., 2008) or
the lysine-specific demethylase 1 (LSD1)/coREST complex (Lin et al., 2010) (Fig.
3.4).
In the centre of the Snail proteins one can find a serine-rich domain (SRD) where
most sites for post-translational modifications are located and a nuclear export
sequence (NES), which are important for protein stabilisation, activation, localisation
and degradation of the gene product (Dominguez et al., 2003). In the SRD many
phosphorylation sites are found which get phosphorylated mainly through GSK3β but
also PAK1 phosphorylates serine 246 and enhances the accumulation of Snail in the
nucleus and promotes subsequently its repressive activity in the nucleus (Yang et al.,
2005) (Fig. 3.5). The small C-terminal domain phosphatase (SCP) removes such
phosphorylations through interaction with Snail to stabilize the protein (Wu et al.,
2009b). Nevertheless, phosphorylated Snail interacts with β-TrCP and gets degraded
subsequently (Zhou et al., 2004). Especially, the F-box E3 ubiquitin ligase FBXL14
promotes the ubiquitination and proteasomal degradation of Snail. Furthermore lysyl
oxidase-like 2 (LOXL2) binds to the SNAG domain of Snail and antagonises the
interaction between Snail and β-TrCP or FBXL14, which leads to stabilisation of Snail
(Vinas-Castells et al., 2010). Recently it was described in breast cancer that the E3
ligase SCF-FBXO11 targets Snail for ubiquitination and degradation. The authors
could show that the degradation of Snail by FBXO11 is dependent on Ser-11
phosphorylation by protein kinase D1 (PKD1). This degradation process inhibits

Introduction
17
Snail-induced EMT, tumour initiation and metastasis in various breast cancer models
(Zheng et al., 2014).
Fig. 3.4 Regulation of Snail expression. Summary of direct regulators of Snail and their
interaction locations and respective pathways (Kaufhold and Bonavida, 2014).
Snail expression or induction in cancer depends on many signalling molecules from
the tumour microenvironment. Growth factors like HGF, FGF or EGF activate
signalling through receptor tyrosine kinases (RTKs) via the RAS-MAPK or PI3K-Akt
pathway which leads to an induction of Snail expression (Ciruna and Rossant, 2001;
Lu et al., 2003). TGFβ and the SMAD pathway play an important role in inducing
Snail expression, which in turn helps to overcome the tumour suppressing effects of
TGFβ. Snail mediates resistance to TGFβ initiated apoptosis and shifts the response
to promotion of tumour progression (Franco et al., 2010). TGFβ increases also Notch
signalling via SMAD3 which leads to elevated expression of Jagged1 and HEY1 and
subsequently promotes expression of Slug which leads to an EMT phenotype (Leong
et al., 2007). But Notch also controls Snail expression via two synergistic
mechanisms: direct transcriptional activation of Snail or a more indirect mechanism
through lysyl oxidase (LOX). Under hypoxic conditions Notch recruits HIF1α to the
promoter of LOX, which increases LOX expression, stabilises the Snail protein and
leads to EMT (Grego-Bessa et al., 2004; Sahlgren et al., 2008). A very important

Introduction
18
signalling pathway in tumour progression is the Wnt-pathway. Activation of this
pathway inhibits GSK3β-mediated phosphorylation of β-catenin and Snail (two of its
main targets) and stabilises the two proteins in the nucleus (Barrallo-Gimeno and
Nieto, 2005; Kim et al., 2002; Liebner et al., 2004).
Another important regulator of Snail expression is the NF-κB pathway. Snail gets
regulated by this pathway transcriptional and post-translational. NF-κB binds to the
human Snail promoter (at positions -194 and -78) (Fig.3.5) and elevates the
expression of Snail (Barbera et al., 2004). The post-translational regulation of Snail
works via activation of NF-κB through AKT signalling, which leads to phosphorylation
of IKKα and the upregulation of Snail (Julien et al., 2007; Ozes et al., 1999;
Romashkova and Makarov, 1999; Zhou et al., 2000).
Inflammatory pathways also provide important microenvironmental cues during
tumour progression. TNFα, a major inflammatory cytokine, stabilises functional Snail.
By disrupting the binding of Snail with GSK3β and β-TrCP, TNFα inhibits the
phosphorylation and ubiquitination of Snail (Fig. 3.6) (Wu et al., 2009a).
In addition to the microenvironmental associated pathways Snail and Slug are also
able to autoregulate their own expression. Both bind to the own promoter and
repress their expression through an autoregulatory loop (Fig. 3.5) (Peiro et al., 2006).
Fig. 3.5 Regulatory elements in the SNAI promoter. Overview showing different regulatory elements and the respective transcriptional regulators of the Snail promoter (Kaufhold and
Bonavida, 2014).

Introduction
19
Fig. 3.6 Localisation and stabilisation of Snail. Schematic overview of translational modifications changing the localisation and the stability of Snail (Kaufhold and Bonavida,
2014).
3.4 Cancer stem cells
Since many years it is a main goal in cancer research to explain the origin of cancer
and to use this knowledge for therapeutic approaches. It is known that cancer arises
from a series of mutations in a few cells or even in a single cell which can be called
founder cell. Such cells could gain unlimited and uncontrolled expansion potential
and a long life-span (Hanahan and Weinberg, 2011). To explain these observations
two hypothetical models are currently under discussion. The first is the stochastic
model in which it is assumed that all cells of the tumour have the same tumorigenic
potential and can account for tumour growth (Reya et al., 2001). The second one is
the hierarchical model, according to which only a small subpopulation of tumour cells
have the capacity to self-renew and maintain the tumour growth, while the bulk of the
tumour cells are differentiating or terminally differentiated cells (Fig. 3.7) (Reya et al.,
2001; Visvader and Lindeman, 2008, 2012).
The hierarchical model, also referred to as the cancer-stem-cell or the tumour-
initiating-cell model, was described first in human myeloid leukaemia(Bonnet and
Dick, 1997; Lapidot et al., 1994). Later the concept was extended to human solid

Introduction
20
tumours like breast cancer(Al-Hajj et al., 2003; Cho et al., 2008; Ginestier et al.,
2007), prostate cancer (Collins et al., 2005) and brain tumours as well (Harris et al.,
2008; Singh et al., 2003; Son et al., 2009)
Fig. 3.7 Schematic illustration of the cancer stem cell model. The tumour mass consists of three cell types with a different state of differentiation. A few cells in the tumour mass exhibit a high capacity of self-renewal and a very undifferentiated cell status. These tumour stem cells are able to give rise to more differentiated progenitor cells and to new stem cells (self-renewal). Progenitor cells can give rise to differentiated tumour cells, which form the main tumour cell population (modified from Till Acker).
Cancer stem cells (CSC) are a small minority of tumour cells which show
characteristics comparable to normal stem cells, such as differentiation potential and
self-renewal. In addition, CSCs show a high resistance to chemo-and radiotherapy
(Bao et al., 2006a). Another important fact in the context of normal stem cells and
CSCs is the homeostatic control, the maintenance of the stem cell pool (Reya et al.,
2001; Sell, 2004, 2006; Sell and Pierce, 1994; Wicha et al., 2006). When stem cells
divide they give rise to one daughter cell which remains in the stem cell state,
whereas the other daughter cell can enter the process of differentiation (Fig. 3.7).

Introduction
21
3.4.1 Cancer stem cells in glioma
Within solid tumours gliomas were among the first tumour entities in which the CSC
model was experimentally validated (Venere et al., 2011)
Like in other cancer types several markers are used to identify and characterise brain
tumour stem cells (BTSCs). One of the most prominent markers in brain tumour stem
cells is the surface protein CD133. It was shown that FACS sorted CD133 positive
cells can initiate new brain tumours when transplanted into the striatum of
immunodeficient mice whereas CD133 negative cells were not able to form a tumour
(Singh et al., 2003) (Galli et al., 2004; Singh et al., 2003). The obtained tumours
showed the classic features of GBM like extensive migration and infiltration and also
the histological features were comparable. It was also possible to re-isolate stem like
cells from theses tumours and in a second transplantation experiment with these
cells GBM tumours were obtained, demonstrating the self-renewal and tumour-
initiating ability of these cells in vivo. Other markers that are often used to identify
BTSCs are integrinα6 (Lathia et al., 2010), CD15 (Son et al., 2009), EGFR (Jin et al.,
2011), A2B5 (Ogden et al., 2008), L1CAM (Bao et al., 2008), CD44 (Anido et al.,
2010) and the chemokine CXCR4 (Ping et al., 2011). Through a side-population
approach further stem cell signature genes, ASPHD2 (aspartate beta-hydroxylase
domain-containing protein 2), NFATc2 (nuclear factor of activated T cells 2, part of
the calcineurin pathway) and MAML3 (mastermind-like protein 3, part of the Notch
pathway) were identified. All these side population genes are hypoxia-inducible
through the activation of HIF2α (Seidel et al., 2010).
The regulation of brain tumour stem cells shows the same key mechanisms like
normal neuronal progenitor cells, found in the subventricular zone (SVZ). Self-
renewal in adult neural stem cells relies predominantly on the Notch pathway (Hitoshi
et al., 2002; Shen et al., 2004), overexpression of Notch receptors and their ligands
Delta-like 1 and Jagged1 are correlated with proliferation of human glioma cells
(Purow et al., 2005). Additionally, self-renewal in normal neural stem cells and
tumorigenesis of the central nervous system is positively regulated through the
repression of INK4a and the tumour suppressor ARF (Molofsky et al., 2003).
Furthermore, the regulation and maintenance of neural stem cells, progenitor cells
and cancer stem cells relies not only on specific intrinsic genetic mechanisms but

Introduction
22
also on interaction with several microenvironmental cues. Within malignant brain
tumours like GBM two distinct microenvironmental niches can be found which play an
important role for induction, regulation and maintenance of brain tumour stem cells,
the perivascular niche and the hypoxic niche.
The tumour tissue in close proximity to blood vessels is called the perivascular niche.
Due to the vasculature this niche is well supplied with oxygen and nutrients. It was
shown that the perivascular niche contains cells associated to blood vessels with
stem cell like phenotypes and stem cell marker expression (Calabrese et al., 2007).
GBMs are fast growing highly proliferating tumours and have strong metabolic needs
which cannot sufficiently served by the existing vasculature. It was shown that
BTSCs of GBM can support neo-angiogenesis. Interestingly, blood vessels and brain
tumour stem cells rely on a bidirectional regulation. BTSCs secrete VEGF (vascular
endothelial growth factor) which induces angiogenesis (Bao et al., 2006b) and
endothelial cells secrete themselves mitogens which activate the Notch pathway to
maintain the brain tumour stem cell pool (Charles et al., 2010). The perivascular
niche could be also a therapeutic target to indirectly eliminate BTSCs. Especially anti-
angiogenic treatments could help to starve out the stem cell population due to lack of
nutrients and oxygen. An anti-VEGF treatment which is already in clinical use,
Avastin (Bevacizumab), showed only limited clinical success because tumours of
patients treated with this drug showed a more invasive behaviour than before (Paez-
Ribes et al., 2009) (Chinot et al., 2014; Gilbert et al., 2014; Haines and Gabor Miklos,
2014).
Regions of low oxygen tension due to severe necrosis or inefficient vasculature are
not only histological hallmarks of GBMs but also a second niche for BTSCs (Pries et
al., 2010). The molecular response to low oxygen availability is mainly regulated by
HIFs (Hypoxia-inducible factors, HIF1α and HIF2α) (Bar, 2011; Li et al., 2009; Soeda
et al., 2009). These factors are very important to maintain BTSCs and are closely
linked to induction of angiogenesis. In particular, HIF2α promotes the expression of
stem cell maintenance markers like Oct4 and Nanog, CD133, MAML3, ASPHD2
(Covello et al., 2006; Heddleston et al., 2009; Seidel et al., 2010). Several
experiments could show that the stabilisation of the HIF2α protein under hypoxic
conditions or through expression of a non-degradable HIF mutant increased self-
renewal of BTSCs and enhanced the tumour formation in vivo, even in tumour cells

Introduction
23
which showed no stem cell characteristics before (Heddleston et al., 2009) (Li et al.,
2009; Pietras et al., 2009; Seidel et al., 2010). HIF1α is known to induce the
expression of the stem cell marker CD133 and increase the self-renewal of BTSCs
(Soeda et al., 2009).
In addition to the microenvironmental niches the TGFβ signalling pathway plays an
important role in the regulation of CSCs. Despite the fact that TGFβ signalling is
commonly found in tumours, so far there is only little known how TGFβ can influence
CSCs. Nevertheless, some recent reports showed that in glioma TGFβ signalling is
important for the maintenance of stem-like cells through the induction of the direct
TGFβ target Sox4 which leads to accelerated expression of the stem cell marker
Sox2 (Ikushima et al., 2009). Furthermore, it was reported that the self-renewal
capacity of BTSCs in glioma relies on the induction of the cytokine LIF (leukaemia
inhibiting factor) via TGFβ signalling (Penuelas et al., 2009). Through inhibition of the
TGFβ pathway it was shown that this resulted in a decrease of the
CD44(high)/Id1(high) population which is thought to represent BTSCs in glioma as
well (Anido et al., 2010).
Many of the above described signalling pathways, especially TGFβ and hypoxia, are
also important for the induction of EMT. Interestingly, a number of recent studies
suggest EMT is linked not only to the induction of mesenchymal features, but also to
the acquisition of a CSC phenotype (Fig. 3.8). The strongest evidence was found in
epithelial cancers like breast cancer. The cellular processes observed in cells
undergoing EMT during cancer metastasis are analogous to the processes of tissue
reconstruction by adult stem cells (Kondo et al., 2003). As an experimental approach
naturally occurring stem cells isolated from immortalized human mammary epithelial
cells, normal mouse mammary tissues and human reduction mammoplasty tissues
were shown to express EMT markers. Moreover, induction of EMT through
overexpression of Snail or Twist generated stem cell-like cells from differentiated
transformed mammary epithelial cells stem-like cells can be generated in vitro,
suggesting an important role of EMT in CSCs induction (Mani et al., 2008).

Introduction
24
Fig. 3.8 Schematic model of CSC maintenance by EMT. Cells with an epithelial phenotype undergo EMT and are transformed into cells with mesenchymal expression patterns which share cancer stem cell traits. These CSC are able to initiate tumour formation, enhance tumour growth, invasion and migration of tumour cells to form distant metastasis and also contribute to tumour recurrence. Based on (Ouyang et al., 2010).

Introduction
25
3.6 Aim of the study
The importance of EMT regulators in invasion as a critical step in malignancy is very
well elucidated in epithelial cancers but the mechanisms of glial to mesenchymal
transition in solid tumour of the CNS, like glioma, is so far only partly understood. In
this work we wanted to assess the role of GMT in tumour growth, invasion and the
induction and maintenance of CSCs. Furthermore, we wanted to find out what role
microenvironmental cues, such as hypoxia and TGFβ signalling, play in the induction
of GMT.
We first determined a set of markers suitable for the analysis of GMT. Next we
examined the role of hypoxia and TGFβ signalling in controlling the expression of the
key EMT factors of the Snail family. To address the functional significance of the
EMT factors in the control of GMT we performed Snail/Slug loss of function
experiments. Using stably transduced polyclonal pools of silenced cells we assessed
the GMT phenotype by marker expression and by examining the invasive capacity of
the cells. The involvement of the GMT regulators in tumour growth and invasion was
examined by in vivo xenograft transplantation experiments. In addition, we
investigated the functional role of Snail and Slug in the regulation of the cancer stem
cell phenotype.

Results
26
4. Results
4.1. Expression of Snail and Slug in the different molecular subclasses of
glioblastoma
To examine the specific expression of EMT regulators Snail and Slug (SNAI1,SNAI2)
in the molecular subclasses of glioblastoma we carried out a bioinformatic analysis
of glioblastoma expression datasets from “The Cancer Genome Atlas” (TCGA). The
mRNA expression data of the EMT regulators was downloaded from the publicly
available datasets for GBM with neural, proneural, mesenchymal and classical gene
signature (TCGA, 2008; Verhaak, 2010). The analysis showed that Snail and Slug, in
line with their known function in other cancers, are significantly upregulated in
tumours with a mesenchymal gene signature and downregulated in proneural, neural
and classical subtypes (Fig. 4.1).
Fig.4.1 SNAI1 and SNAI2 are overexpressed in the mesenchymal glioblastoma subtype. mRNA expression of SNAI1 and SNAI2 in GBM with proneural, neural, mesenchymal and classical gene signature. The significances were calculated versus the mesenchymal subclass. **p < 0.01, ***p < 0.001

Results
27
4.2 Regulation of Snail and Slug expression and induction of GMT by
environmental signals
Fig. 4.2 Hypoxic induction of Snail Western blot analysis of different glioma cell lines, showing induced Snail expression when exposed to 1% oxygen for 18 h, compared to normoxic (21% oxygen) controls.
EMT/GMT is regulated by environmental cues, such as hypoxia and TGFβ. These
triggers lead to an upregulation of transcriptional regulators like Snail and Slug as
well as markers like vimentin and N-cadherin, accompanied by a downregulation of
markers like E-cadherin, as a part of the induction of the EMT programme.
To find out if the expression of Snail is induced by low oxygen concentrations several
glioblastoma cell lines were cultured either under normoxic (21% O2) or hypoxic (1%
O2) conditions for 18 hours (Fig. 4.2). We used GBM10, GBM18 and GBM37x
primary cell lines isolated from patient tumour samples, as well as LN229x, an
established human glioma cell line that was re-isolated from a mouse xenograft. The
analysis of protein levels by Western blotting showed a hypoxic induction of Snail, in
comparison to the normoxic control, in several glioblastoma cell lines (Fig. 4.2).
However the common markers for EMT like vimentin and N-cadherin showed no

Results
28
regulation, upon hypoxic treatment in the glioblastoma cells used (data not shown).
Furthermore E-cadherin showed no expression in our GBM lines. These results show
that though hypoxia induces EMT regulator Snail this is not sufficient for the induction
of typical EMT markers in glioblastoma.
Fig. 4.3 Regulation of Snail and Slug expression and induction of GMT by environmental signals. TGFβ treatment (2.5 ng/ml for 3,5 or 7 days) induced Snail and Slug expression and regulated a set of markers corresponding to the transition from a proneural to a mesenchymal phenotype.
We next sought to determine the effect of TGFβ, the classical inducer of EMT on
glioblastoma cells. G55 cells, an established glioma line, were treated with 2.5 ng/ml
TGFβ for either 3, 5 or 7 days. As shown in Fig. 4.3 the expression levels of Slug and
especially of Snail were strongly upregulated upon TGFβ treatment at all time points.
Similarly to our findings following hypoxic exposure, however, the classical EMT
markers vimentin and N-cadherin showed no consistent regulation upon TGFβ
treatment. Therefore we aimed to determine whether alternative markers could be

Results
29
found, which could be linked to the transition from a proneural to a mesenchymal
phenotype. Based on literature research and expression profiling data (Phillips et al.,
2006; Verhaak et al., 2010) we decided to test several possible markers to
distinguish if cells are undergoing GMT and if this is accompanied to the acquisition
of a cancer stem cell phenotype.
We used YKL40 as a mesenchymal marker, Olig2 as a proneural marker and
ASPHD2 as a marker for stemness (Phillips et al 2006, Seidel et al 2010). Indeed,
following TGFβ treatment G55 cells showed an upregulation of the mesenchymal
marker YKL40 and the stemness marker ASPHD2 (Fig. 4.3). Consistently, Olig2 as
proneural marker showed a stable downregulation when cells were treated with
TGFβ (Fig. 4.3).
4.3. The loss of Snail and Slug impairs GMT and the establishment of a cancer
stem cell phenotype
Fig. 4.4 The loss of Snail and Slug does not impair the expression of the classical EMT markers N-cadherin and vimentin. Western blot analysis of Snail and Slug deficient cells demonstrating no changes in the expression of N-cadherin and vimentin. GBM046x and G55 cells were treated with 2.5 ng/ml TGFβ1 for 3 days.

Results
30
Snail and Slug were highly upregulated by TGFβ during the induction of EMT/GMT,
suggesting that they play an important role in this process. To directly test this, we
examined the phenotype of Snail, Slug or Snail/Slug deficient cells. GBM046x and
G55 cells were stably transduced with lentiviruses carrying a vector containing a
shRNA to silence either Snail or Slug or both together (Fig. 4.4). First, we checked
the expression of the classical marker N-cadherin and vimentin in these knock-down
pools. Consistent with our earlier findings, we could not observe any changes in
protein levels of N-cadherin and vimentin following TGFβ treatment or silencing of
either Snail, Slug or both (Fig. 4.4).
Fig. 4.5 Expression of GMT markers in glioma molecular subgroups. Analysis of the TCGA database showed that the panel of markers used in this work are differentially expressed in the different molecular subclasses of GBM. Significances were calculated versus the mesenchymal subclass. *p < 0.05, ** p < 0.01, ***p < 0.001
Results
31
We next went on to establish a panel of markers that could be suitable for the
distinction between proneural and mesenchymal states in glioblastoma. We focused
on markers that have been previously proposed in expression profiling studies
including MAP2, Olig2, and T-cadherin as proneural/glial marker, as well as CD44,
CDH11 and YKL40 as mesenchymal markers (Phillips 2006, Verhaak 2010, Carro
2010). As a first step we analysed the expression of these markers in the TCGA
glioblastoma dataset (Fig. 4.5). We found that MAP2, T-cadherin and Olig2 were
significantly reduced in the mesenchymal subgroup compared to the proneural group.
CD44, CDH11 and YKL40 showed a significant increase of expression in tumours
classified for the mesenchymal subgroup compared to the proneural subgroup (Fig.
4.5)
Immunoblotting (Fig. 4.6) and an analysis of mRNA levels (Fig. 3.7) of the markers in
GBM046x and G55 cells showed that they are prominently regulated through the
addition of TGFβ1. The proneural markers MAP2, Olig2 and T-cadherin exhibit a
reduced expression when control cells were treated with TGFβ1, whereas the
mesenchymal markers CD44, YKL40 and CDH11 as well as the stemness marker
ASPHD2 showed an upregulation when GMT was induced by TGFβ1 in control cells.
Importantly, silencing of Snail and Slug largely reversed the TGFβ1 induced GMT
transition (Fig. 4.6). Quantitative real-time PCR showed that the loss of Snail and
Slug induced strongly the expression of the proneural marker T-cadherin and
reduces the expression of the mesenchymal markers CDH11 and CD44 in GBM046x
and G55 cells (Fig. 4.7).
The markers MAP2, Olig2, CD44, ASPHD2 were not altered or changed in a
direction corresponding to a transition from a mesenchymal to a proneural state upon
single silencing of Snail or Slug, but Snail/slug double knockdown induced a
pronounced shift to a proneural phenotype. On the other hand for the mesenchymal
marker YKL40 single Snail and Slug knockdowns induced a partial mesenchymal to
proneural transition, but the effects of the combined Snail/Slug knockdown were
again typically more potent. Thus, while silencing of either Snail or Slug was sufficient
to alter the expression of some of the proneural and mesenchymal markers,
combined silencing of Snail and Slug had the most profound and robust effects,
inducing a shift from a mesenchymal to a proneural state under TGFβ1 stimulation.

Results
32
Taken together, these results demonstrate that the transcription factors Snail and
Slug play a synergistic, partially redundant role in the regulation of GMT and the
acquisition of cancer stem cell traits.
Fig. 4.6 The loss of Snail and Slug inhibits a complete glial to mesenchymal transition. A+B Immunoblotting of GMT markers in GBM046x and G55 after TGFβ1 stimulation, showing that cells with silenced Snail and Slug expression are not able to complete the transition from a proneural to a mesenchymal phenotype. (For knock-down efficiency see Fig. 4.4)

Results
33
Fig. 4.7 The loss of Snail and Slug impairs the mRNA expression of GMT markers. Analysis of mRNA levels of GMT markers, showing that the loss of Snail and Slug impairs the transition from proneural to mesenchymal phenotype.
4.4 Snail and Slug influence the cancer stem cell phenotype of GBM cells
The regulation of glioma stem cell markers such as ASPHD2 by Snail/Slug silencing
(see Fig. 4.6A, B), suggested that Snail and Slug are involved in the control of cancer
stem cell expansion or maintenance. To further investigate if cell stemness is
connected to the expression of GMT regulators we performed fluorescence activated
cell sorting (FACS) to assess the expression of the surface marker CD15 which is

Results
34
commonly used as a stem cell marker (Read et al., 2009) (Fig. 4.8A). Interestingly,
GBM046x cells lacking Snail and Slug showed a significantly smaller population of
cells with high CD15 expression in FACS compared to the control cells (Fig. 4.8A).
Furthermore Snail/Slug knockdown cells also exhibit a reduced expression of cancer
stem cell markers, such as MAML3, SOX2 and OCT4 (Fig. 4.8B).
Fig. 4.8 Snail and Slug influence the expression of CSC markers. A FACS analysis of CD15 showed reduced expression in Snail and Slug deficient cells. B The expression of the stem cell markers MAML3, OCT4 and SOX2 is reduced in shSnail/Slug cells. **p < 0.01
To functionally confirm that Snail and Slug are involved in stem cell regulation we
performed a sphere formation assay for GBM046x and G55 cells (Fig. 4.9). This
assay examines the ability of single GBM cells to self-renew and form gliomaspheres

Results
35
in suspension culture conditions, which is one of the key read-outs for the self-
renewal potential of normal and cancer stem cells. Seven days after seeding the
single cells, the formed gliomaspheres were counted and the percentage of sphere
forming units (SFU) was assessed. These experiments demonstrated that combined
silencing of Snail and Slug suppressed the glioma cell self-renewal significantly, with
Snail playing an apparently dominant role in GBM046x in this context (Fig. 4.9).
Fig. 4.9 Snail and Slug control the self-renewal ability of glioma cells. Sphere formation assays showing that the self-renewal capacity of Snail/Slug deficient cells is significantly reduced. Scale bars represent 200 µm. **p < 0.01, ***p < 0.001

Results
36
Taken together, these results show that concomitantly with their effects on GMT,
Snail and Slug are important regulators of the glioma stem cell phenotype. As
combined silencing of Snail and Slug had more robust and consistent effects on the
capacity of glioblastoma cells to undergo GMT and on their stem cell phenotype
compared to individual knockdown of Snail or Slug, we focused our further
experiments on cells with simultaneous Snail and Slug loss.
4.5 Apoptosis and proliferation of GBM cells in vitro is not impaired by the loss
of Snail and Slug
Snail and Slug are also thought to be involved in proliferation and/or apoptosis in
vitro as well as in patients (see section 3.3.3). To determine the role of Snail and Slug
in cell death and proliferation we performed immunofluorescence stainings of
apoptotic cells with the TUNEL assay. Proliferative cells were analysed by staining
for BrdU (Bromodeoxyuridine), incorporated in the DNA during S-phase (Fig. 4.10A,
B). Quantification of the stainings showed that the loss of Snail and Slug had no
significant effect on the amount of apoptotic or proliferative cells in GBM046x and
G55 cells (Fig. 4.10A, B).
Fig. 4.10 The loss of Snail and Slug does not affect apoptosis and proliferation in vitro. A Quantification of TUNEL staining of GBM046x and G55 cells showed no significant differences in the amount of apoptotic cells between control and shSnail/Slug cells. B Quantification of BrdU staining of GBM046x and G55 cells showed no significant differences in the amount of proliferating cells between control and shSnail/Slug cells.

Results
37
4.6. The loss of Snail and Slug impairs the invasiveness of GBM cells in vitro
Fig. 4.11 The loss of Snail and Slug impairs the invasiveness of glioblastoma cells through matrigel. Modified Boyden chamber assay showed that GBM046x and G55 cells have a severely reduced ability to invade through a matrigel covered filter when Snail or Snail /Slug are silenced. Scale bars represent 100 µm *p < 0.05, ***p < 0.001
A central characteristic of the mesenchymal phenotype is enhanced cell
invasiveness. In the context of GBM this could be reflected by an accelerated
infiltration of tumour cells away from the tumour mass into the surrounding brain
parenchyma. To assess the role of Snail and Slug in GBM cell invasion we performed
in vitro Invasion assays (Fig. 4.11, 4.12). First we used a modified Boyden chamber
assay to assess the ability of the cells to invade through a polystyrene filter with a
pore size of 8 µm coated with a layer of matrigel, which serves as a model of the

Results
38
basal lamina. The invasion rate of the cells was examined after 18 hours of invasion.
Importantly in both GBM046x and G55 cells silencing of Snail and Slug significantly
reduced invasion. Interestingly, in GBM046x cells the single knock-down of Snail
seemed to be sufficient to reduce the invasive capacity of the cells in this assay. The
observed effect of strongly reduced invasion in the Snail and Slug deficient cells
seemed to be presumably due to the silencing of Snail since the knock-down of Slug
increased the invasion of the cells (Fig. 4.11). By contrast, in G55 cells the modified
Boyden chamber assay showed clearly that only combined Snail and Slug deficiency
significantly impaired in invasion through the matrigel layer (Fig. 4.11). Single
silencing of Snail or Slug alone had no effect on the invasiveness of the cells.
To provide further support for the role of Snail and Slug in glioblastoma cell invasion
we performed an additional assay, namely a collagen invasion assay. This assay
resembles the natural conditions of cancer cell invasion through an extracellular
matrix. The cancer cells are embedded as a small gliomasphere into a layer of
collagen, which is a part of the extracellular matrix, allowing the cells to invade in a
three dimensional manner. By capturing microscope images every 24 hours we were
able to follow the process of invasion. The ability of the cells to invade into the
collagen was quantified using the invasion index formula,
invasiveness= (Perimeter)2 / Area (Siebzehnrubl et al., 2013).
The obtained results supported the data of the modified Boyden chamber assay, by
demonstrating that silencing of Snail and Slug markedly reduced invasion. In
GBM046x cells silencing of Snail was sufficient to impair the invasiveness in collagen
after 24 and 48 hours (Fig. 4.12), in accordance with the results from the Boyden
chamber assay. In G55 cells, on the other hand the silencing of either Snail or Slug
alone had no significant effects on the three dimensional invasion in the collagen
matrix. However, combined loss of Snail and Slug strongly impaired the capacity of
G55 cells to invade collagen (Fig. 4.12).
Taken together, these finding suggest a prominent role for Snail and Slug in the
regulation of invasion in GBM which seems to be closely connected to the regulation
of GMT.

Results
39
Fig. 4.12 Snail and Slug deficiency reduces the ability of glioblastoma cells to invade into collagen Collagen invasion assay of a tumoursphere showed that the invasion capacity of shSnail and shSnail/Slug cells is highly impaired. Scale bars 100 µm. *p < 0.05, ***p < 0.001

Results
40
4.7. Snail and Slug deficient cells show reduced tumour growth
Fig. 4.13 Snail and Slug deficiency reduces intracranial glioma growth. A Representative hematoxylin/eosin staining of GBM046x and G55 control and shSnail/Slug tumours (40 µm thick section). Snail and Slug deficient cells showed a significantly reduced tumour volume. Scale bars represent 1mm. **p < 0.01
Given the effects of silencing Snail and Slug on GMT and stemness, we next wanted
to assess if Snail and Slug are involved in the control of tumour growth in vivo. The
Snail/Slug deficient cells were pretreated with TGFβ1 and then intracranially injected
into immuno-deficient nude mice. After the mice started to show neurological
symptoms typically associated with brain tumour growth and the development of
increased intracranial pressure, they were sacrificed and perfused with 4% PFA to fix
the tumour tissue. The tumour growth in the brain was assessed by measuring the
tumour volume in hematoxylin and eosin (H&E) staining of serial sections (Fig. 4.13).

Results
41
The tumours of GBM46x and G55 cells with silenced Snail and Slug showed a
significantly smaller size compared to the control group (Fig. 4.13), consistent with
our findings of an important functional role of Snail and Slug in GMT and glioma stem
cell maintenance.
4.8. The loss of Snail and Slug does not impair apoptosis, proliferation or
vascularisation in vivo
To further asses the reasons for the reduced growth of Snail and Slug silenced
tumours we also examined the effects on apoptosis and proliferation of tumour cells
in vivo as well as the vascularisation of the tumour itself.
To visualize apoptotic cells, 40 µm thick sections of the GBM046x and G55 tumours
we used a TUNEL assay (Fig. 4.14). Quantification of the stained cells showed that in
both tumours no difference in the number of apoptotic cells per mm2 was observed
between control group and the Snail/Slug double knockdown group (Fig. 4.14). Thus,
we could rule out that a higher apoptosis rate in the double knockdown group is the
reason for the smaller tumour volume.
Differences in tumour growth can be often explained through effects on cell
proliferation. Proliferating cells are detectable when stained for the phosphorylated
form of histone 3 on the highly conserved Ser-10 residue. This phosphorylation event
is a read out for the onset of mitosis. Staining of tumours from GBM046x and G55
cells for phospho-histone 3 showed no significant difference between control and
Snail/Slug silenced tumours (Fig. 4.15), indicating that reduced tumour growth of
Snail/Slug double knockdown cells cannot be explained by impaired proliferation.
Another reason for slower growth could be a reduced vascularisation of the tumour.
Neovascularisation and co-opted brain vessels are needed by the tumour for
suffiencient oxygen and nutritional supply. To asses tumour vascularisation we
performed an immunofluorescence staining for endomucin, a protein present on the
surface of blood vessel endothelial cells (Fig. 4.16). Quantification of the ratio of area
covered by vessels to total analysed tumour area showed that the vascularisation of
the tumour was also not affected through the silencing of Snail and Slug (Fig. 4.16).

Results
42
Fig. 4.14 The loss of Snail and Slug does not impair apoptosis of tumour cells. 40 µm tumour sections were stained for apoptotic cells using a TUNELassay. Positively stained cells/mm2 were quantified. Scale bar represents 100 µm.

Results
43
Fig. 4.15 The loss of Snail and Slug does not impair proliferation of tumour cells. 40µm thick tumour sections were stained for proliferating cells using an antibody against phospho-histone 3. Positively stained cells/mm2 were quantified. Scale bar represents 100 µm.

Results
44
Fig. 4.16 The loss of Snail and Slug does not impair vascularisation of the tumour. 40 µm tumour sections were stained for blood vessels using an antibody against the endothelial protein Endomucin. The stained vessel area was quantified. Scale bar represents 100 µm.

Results
45
4.9. The loss of Snail and Slug impairs the invasiveness of GBM cells in vivo
Fig. 4.17 The invasiveness of cancer cells in vivo is significantly reduced by silencing Snail and Slug. GFP expressing control cells or shSnail/Slug GBM046x or G55 cells were orthotopically transplanted into nude mice to monitor the invasive behaviour of the cells. Cells with silenced Snail/Slug expression showed a drastic reduction of invasion into the surrounding brain parenchyma. Pictures of GBM046x tumours were taken with 10x magnification; Pictures of G55 tumours were taken with 20x magnification. Scale bars represent 100 µm. **p < 0.01, *** p < 0.001
In our in vivo experiments we were able to use the GFP signal of the transduced cells
to assess the invasive area. 40 µm thick sections of the brain were mounted and
pictures were taken with a fluorescence microscope (Fig. 4.17). Both the GBM046x
and G55 tumours showed a striking effect on invasion when Snail and Slug were
silenced, as apparent through the strong reduction of invading cells leaving the

Results
46
tumour mass in the double knock-down cells compared to the control cells . Analysis
of the invasive area of the tumours showed that the invasion of tumour cells was
significantly reduced in the Snail and Slug double knockdown group in comparison to
the control tumours (Fig. 4.17).
These findings support our hypothesis that invasion, the key feature of EMT in
epithelial cancers is also controlled by the transcriptional regulators Snail and Slug in
non-epithelial gliomas.

Discussion
47
5. Discussion
In this work we demonstrate that the EMT/GMT regulators Snail and Slug play a
crucial role for the transition from a glial to mesenchymal phenotype in glioblastoma.
Furthermore, Snail and Slug are involved in the induction or maintenance of cancer
stem cells by regulating the self-renewal capacity of the cells, indicating a coupling
between mesenchymal and stem cell traits in GBM. Consistently, tumour growth and
the invasiveness of glioma cells depend on these EMT/GMT factors. These findings
identify common key mechanisms controlling the transition between epithelial/glial
and mesenchymal states in epithelial and glial tumours, and highlight the importance
of Snail family EMT regulators as potential targets for glioblastoma therapy.
5.1 The molecular subclassification of GBM
The first indications that glioblastoma cells can possess mesenchymal characteristics
were based on genome-wide molecular profiling studies that allowed a classification
of GBM into distinct subtypes.
The first publication that proposed a classification of GBM in three different molecular
subclasses used a microarray based expression analysis of high-grade astrocytoma
sample sets (Phillips et al., 2006). It defined three distinct subgroups of tumours by
identifying a robust set of signature genes, chromosomal aberrations and possible
cells of origin: proneural, mesenchymal and proliferative.
The proneural (PN) subgroup included a mixture of WHO-grade III and IV gliomas
with or without necrosis. The specific signature gene set for PN tumours included
genes such as the Notch ligand delta.like ligand 3 (DLL3) and brevican (BCAN).
Furthermore, markers like Olig2 (oligodendroglial marker 2), MAP2 (microtubule
associated protein 2) and the neuronal marker NeuN, which are related to
neuroblasts or developing neurons showed an overexpression in this group.
The mesenchymal (Mes) and proliferative (Prolif) subgroup consisted nearly
exclusively of WHO grade IV tumours with necrosis. The microarray analysis showed
that the Mes group of tumours is characterised by the overexpression of markers like

Discussion
48
the chitinase-like protein YKL40, the cell surface glycoprotein CD44 or the
transcription factor STAT3 (signal transducer and activator of transcription 3). In this
subgroup genes important for angiogenesis, such as VEGF (vascular endothelial
growthfactor) and its receptors, as well as the endothelial marker PCAM1, are also
upregulated. Interestingly, the mesenchymal subgroup showed also a correlation to
the expression of stemness markers like Nestin or CD133. The Prolif group of
tumours was classified by the expression of proliferation related markers like
proliferating cell nuclear antigen (PCNA) or TOP2A (topoisomerase 2A).
In 2010 a study of gene expression in the glioblastoma cohort of The Cancer
Genome Atlas (TCGA) refined the classification of the GBM subtypes (Verhaak et al.,
2010). According to this classification GBM is subdivided into 4 molecular groups:
classical, mesenchymal, proneural and neural.
In their study the authors classified the classical subtype by genetic aberrations of
chromosome 10 and 7, amplification of the EGFR (epidermal growth factor receptor)
gene, lack of TP53 mutations and aberrations of components of the RB
(retinoblastoma tumour suppressor) pathway (important for DNA replication and
transcription). Expression data showed an overexpression of neural precursor and
stem cell marker nestin and high expression of components of the notch and sonic
hedgehog pathways.
The mesenchymal class was characterised by the deletion of the tumour suppressor
NF1 (neurofibromin 1) gene and the strong expression of YKL40 and CD44. Thus the
definition of the mesenchymal subtype overlaps with that of (Phillips et al., 2006)
which was based on a combination of grade II and grade IV gliomas. Additionally,
they show an upregulation of members of the NFκB pathway probably due to higher
overall necrosis and associated inflammatory infiltrates in this tumour subtype.
In the proneural subtype they were able to show a high frequency of alteration
leading to an overexpression of PDGF (platelet derived growth factor) receptor A
(found in all subtypes but the highest percentage is in the proneural class), as well as
IDH1 (isocitrate dehydrogenase 1) point mutations. Again in accordance with the
previously discussed study (Phillips et al., 2006) they found an elevated expression
of oligodendrocytic development genes like DLL3 and Olig2 and others (Verhaak et
al., 2010).

Discussion
49
The neural subtype is characterised by the high expression of neuronal markers like
NEFL (neurofilament light polypeptide), GABRA (gamma-aminobutyric acid (GABA)
receptor A), the calcium sensor SYT1 and the potassium/chloride transporter
SLC12A5. Interestingly, the different subtypes of GBM show distinct variations in
survival benefit of the patients upon different therapies. A common treatment of GBM
is the combination of the alkylating agent temozolomide with radiation. Heavily
treated patients with tumours of the proneural group showed no beneficial effects on
survival, whereas patients with tumours belonging to the classical or mesenchymal
subgroup showed delayed mortality.
A further study examined the variation of DNA methylation patterns among different
GBM samples of the TCGA collection, revealing additional important features of the
distinct tumour subtypes (Noushmehr et al., 2010). The authors showed that a large
number of loci are hypermethylated only within the proneural subtype. This indicates
the presence of a glioma CpG island methylator phenotype (G-CIMP) as previously
described for colorectal cancer (Toyota et al., 1999). Interestingly, G-CIMP tumours
showed altered expression of a panel of genes associated with patient outcome,
markers of the mesenchyme, tumour invasion and extracellular matrix. In conclusion,
the lack of this silencing methylation phenotype could lead to the development of
more aggressive tumours, especially in the mesenchymal subtype, which lacks CpG
island hypermethylation.
Subsequent work combining methylation, expression and mutational analyses of
GBM samples uncovered further subgroups of GBM tumours, highlighting the
heterogeneity of these tumours (Sturm et al., 2012). Sturm and co-workers performed
a genome-wide methylation pattern analysis but combining adult and pediatric GBM
samples. They were able to define six distinct methylation clusters. Based on
correlation with mutational status, DNA copy number aberrations and gene
expression signatures they classified six biological subgroups as followed: 1. IDH
mutated (mostly correlating with the proneural subgroup), 2. Histone 3.3 (H3F3A)
K27 mutated (mostly pediatric samples and correlated to proneural subtype), 3.
Histone 3.3 (H3F3A) G34 mutated (pediatric GBM), 4. RTK I (typically involving
PDGFRA amplification), 5. Mesenchymal, 6. RTK II (correlated with the classical
subtype). Interestingly, their definition of the mesenchymal subgroup is not fully
comparable to the other studies since they combined in this group all cases that did

Discussion
50
not completely fit in one of the other five. The mesenchymal class here consists of
samples that showed the highest similarity to normal brain methylation pattern, have
a much lower incidence of GBM related copy number aberrations, fewer copy
number changes and no characteristic point mutations. Nevertheless, this study
could give a deeper insight into how epigenetic mechanisms especially mutation of
K27 in Histone 3 could be important to further subclassify GBM tumours.
The first experimental study taking advantage of the classification of GBM subtypes
showed that patient derived glioma spheres that resemble either PN or Mes
phenotypes (tested by expression of markers and existence of G-CIMP cluster) differ
in their biological characteristics (Bhat et al., 2013). After the isolation of the cells
most of the samples derived from Mes tumours lost the typical Mes phenotype and
shifted toward a PN phenotype following in vitro culturing or transplantation as
xenografts. The cells showed a loss of YKL40 and a gain of Olig2 expression, as well
as gain of G-CIMP. All this suggesting a lack of microenvironmental signals which are
necessary for the maintenance of a mesenchymal phenotype in cell culture
conditions and in mouse xenografts. As reported in the previous studies the
mesenchymal subclass shows an upregulated activity of the NF-κB pathway,
therefore the authors treated the isolated cells with cytokines known to activate the
NF-κB pathway. They tested IL6, IL8, IL10, TGFβ and TNFα, showing that only TNFα
had a striking effect on the expression of CD44, CD15 and YKL40. Transcriptomic
analysis showed that the treatment with TNFα induced a shift from a proneural back
to a mesenchymal signature. This analysis also revealed that transcription factors
known to induce a mesenchymal signature such as STAT3, C/EBPβ and TAZ were
significantly upregulated. Interestingly, transcription factors directly related to EMT,
namely Snail1, Slug and TWIST1 showed no differential expression. Furthermore,
overexpression of the Mes signature genes CD44 and CD15, as well as the NF-κB
activation correlated with poor radiation response and shorter survival in patients.
Taken together these studies demonstrate the utility of GBM subclassification, which
can have both prognostic value and therapeutic importance. The studies suggest that
different subtypes of GBM may benefit from different types of therapy; therefore
assays for the diagnosis of GBM subtype could represent a useful addition to current
molecular diagnostic markers for GBM.

Discussion
51
5.2 The distinctive features of EMT and GMT
So far there are few reports showing EMT in CNS cancers such as glioma and the
terminology related to the study of this process in brain tumours remains a point of
debate. Indeed, since the brain is lacking typical epithelium and mesenchyme the
use of an alternative terminology is warranted. Therefore we propose the term glial-
to-mesenchymal transition (GMT), or proneural-to-mesenchymal transition with
regard to the marker expression in the different molecular subclasses of glioma.
Epithelial cell layers outside the CNS are characterized by close cell-cell contacts
including tight junctions, adherens junctions and desmosomes. A major component
mediating epithelial cell-cell attachment in these structures is E-cadherin. The
epithelial cells show an apical and basolateral polarisation and a tight connection to
the basal membrane. During EMT in normal development or carcinogenesis the cells
change from well differentiated polarized epithelial cells to unpolarised migratory
mesenchymal cells with changes in expression of marker genes like vimentin and N-
cadherin. To manage these morphological changes a rearrangement of the
cytoskeleton and the ECM has to occur as well.
Although glial cells in the brain have a neuroepithelial origin, they are not as strictly
organised as epithelial cell layers. They also have cell-cell contacts mediated mainly
by cadherins such as N-cadherin and CDH11 as well as NCAM (Sakisaka and Takai,
2005).
In our work we faced the problem that the classical markers often used to determine
EMT, such as E-cadherin, N-cadherin or vimentin were either not expressed in
glioma cells or did not show any response to EMT induction by major triggers like
hypoxia (data not shown) or TGFβ treatment (see Fig. 4.4). Therefore we examined
the reports of the molecular subclassification of GBM to find a panel of reliable
markers to monitor GMT in our glioma cell lines. After testing many of the proposed
signature genes we were able to validate a working set of GMT markers. To
determine the mesenchymal state of the cells we used CD44 (also used as marker
for stemness), YKL40 and CDH11. The utility of some of these markers was already
reported before. YKL40 was shown to play a role in promotion of glioma growth,
malignancy, radio-resistance and angiogenesis and is overexpressed in glioma
patient with poor prognosis (Francescone et al., 2011). The literature on the calcium
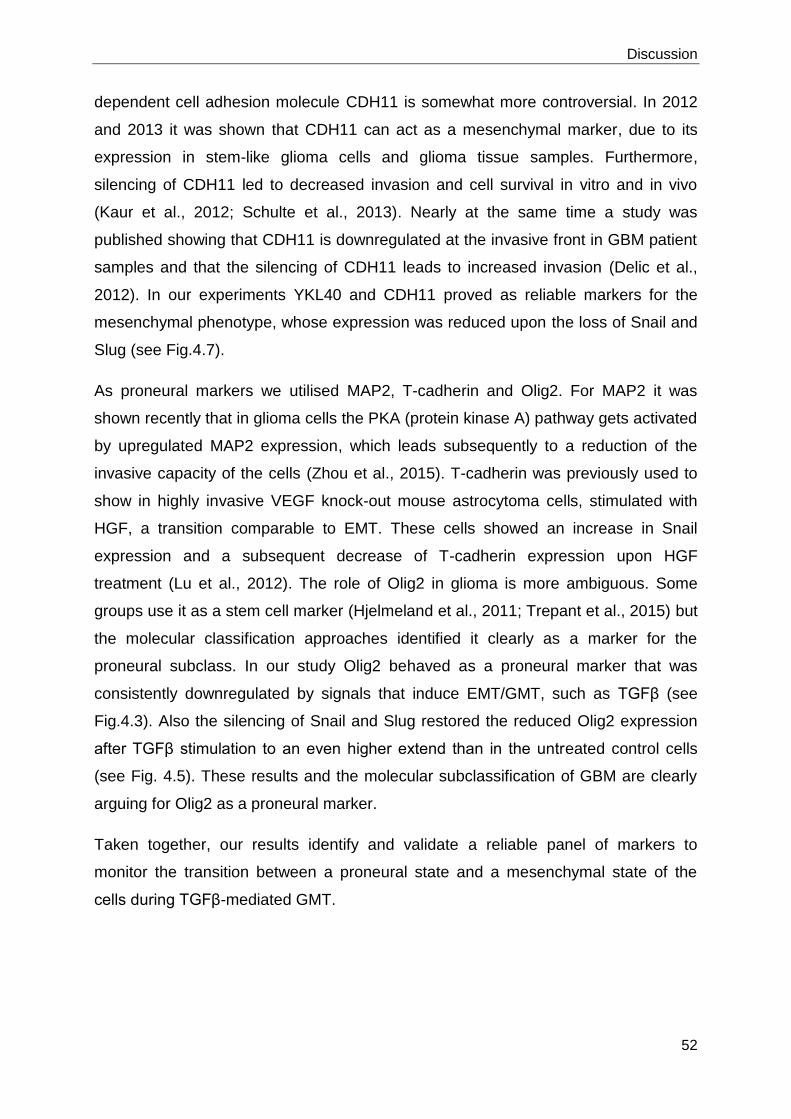
Discussion
52
dependent cell adhesion molecule CDH11 is somewhat more controversial. In 2012
and 2013 it was shown that CDH11 can act as a mesenchymal marker, due to its
expression in stem-like glioma cells and glioma tissue samples. Furthermore,
silencing of CDH11 led to decreased invasion and cell survival in vitro and in vivo
(Kaur et al., 2012; Schulte et al., 2013). Nearly at the same time a study was
published showing that CDH11 is downregulated at the invasive front in GBM patient
samples and that the silencing of CDH11 leads to increased invasion (Delic et al.,
2012). In our experiments YKL40 and CDH11 proved as reliable markers for the
mesenchymal phenotype, whose expression was reduced upon the loss of Snail and
Slug (see Fig.4.7).
As proneural markers we utilised MAP2, T-cadherin and Olig2. For MAP2 it was
shown recently that in glioma cells the PKA (protein kinase A) pathway gets activated
by upregulated MAP2 expression, which leads subsequently to a reduction of the
invasive capacity of the cells (Zhou et al., 2015). T-cadherin was previously used to
show in highly invasive VEGF knock-out mouse astrocytoma cells, stimulated with
HGF, a transition comparable to EMT. These cells showed an increase in Snail
expression and a subsequent decrease of T-cadherin expression upon HGF
treatment (Lu et al., 2012). The role of Olig2 in glioma is more ambiguous. Some
groups use it as a stem cell marker (Hjelmeland et al., 2011; Trepant et al., 2015) but
the molecular classification approaches identified it clearly as a marker for the
proneural subclass. In our study Olig2 behaved as a proneural marker that was
consistently downregulated by signals that induce EMT/GMT, such as TGFβ (see
Fig.4.3). Also the silencing of Snail and Slug restored the reduced Olig2 expression
after TGFβ stimulation to an even higher extend than in the untreated control cells
(see Fig. 4.5). These results and the molecular subclassification of GBM are clearly
arguing for Olig2 as a proneural marker.
Taken together, our results identify and validate a reliable panel of markers to
monitor the transition between a proneural state and a mesenchymal state of the
cells during TGFβ-mediated GMT.

Discussion
53
5.3 The importance of Snail and Slug in GMT in glioblastoma multiforme
As shown in our data Snail and Slug play a crucial role in regulating GMT and
stemness in glioma. They do not influence the classical markers N-cadherin and
vimentin known from epithelial cancers. However, cells with silenced Snail and Slug
show impaired transition from a glial/proneural to a mesenchymal state, as evidenced
by changes in the expression of several markers on protein and mRNA level.
Interestingly, the relative contribution of Snail and Slug to the regulation of individual
markers, such as YKL40 or CDH11, and cellular functions such as self-renewal and
invasion appear to be different and in part cell line dependent (see. Fig 4.6; 4.7; 4.9).
For example in the primary cell line GBM046x the self-renewal capacity and the
invasiveness of the cells is primarily affected by silencing Snail (see Fig. 4.11; 4.12).
On the whole, however, GMT, stemness and invasion are more consistently and
more robustly suppressed by combined silencing of Snail and Slug than by the loss
of either factor individually.
Interestingly, a couple of recent reports show a potential strong involvement of Snail
and Slug in invasiveness and stemness of glioma cells but concentrated only on
silencing or overexpressing one of the SNAI family members.
A genome-wide expression profiling of human glioma samples showed that tumours
with increased in vitro proliferation and invasion had an upregulation of Slug. Slug
overexpressing cells exhibited in vivo promoted angiogenesis and elevated tumour
growth. Enhanced invasiveness could be abrogated by silencing Slug and
subsequent animal studies showed an increased survival of mice bearing Slug
silenced tumours (Yang et al., 2010). Two recent reports showed comparable results
for Snail. By silencing Snail expression it was observed that the cells showed a
reduced expression of vimentin and a subsequent upregulation of E-cadherin
together with decreased proliferation, retarded cell cycle and impaired
invasion/migration of the cells in vitro(Han et al., 2011; Myung et al., 2014).
Furthermore, it was found that Snail supresses the microRNA miR128, a known
tumour suppressor involved in regulating the expression of SP1, by binding to the
miR128 promoter region. SP1, in turn, regulates the cell cycle, tumour formation and
growth, as well as migration of tumour cells (Dong et al., 2014).
Another study reported that irradiation leads to elevated levels of Snail in glioma
cells, which promotes GMT. Murine tumour specimens taken after irradiation cycles

Discussion
54
showed higher migratory and invasive capacity, as well as upregulated Snail
expression. Again these effects were reverted by silencing of Snail. Interestingly the
irradiated cells showed in addition an elevated expression of the stemness marker
SOX2 and a tumour initiating potential (Mahabir et al., 2014).
With our study we are able to confirm for the first time that Snail and Slug together
are important to induce a complete transition from a glial/proneural to a more
mesenchymal phenotype with concomitant increase in cell invasiveness and stem
cell capacity. Furthermore, we also examined in detail the effects of the loss of Snail
and Slug on tumour growth in orthotopic intracranial xenografts. We showed that
combined silencing of Snail/Slug reduced tumour volume and invasion but did not
affect proliferation, apoptosis or vascularisation.
A study in 2013 found that stimulation of glioblastoma cells with BMP7 (bone
morphogenetic protein 7), a member of the TGFβ superfamily, induces Snail in a
SMAD1/5-dependent manner. They could show that glioma cells overexpressing
Snail exhibit elevated invasive behaviour in a xenograft model. Surprisingly, however,
overexpression of Snail led to decreased tumour sphere formation in vitro and
reduced tumorigenicity, an effect that the authors attributed to the known capacity of
BMPs induce differentiation of stem-like cells (Savary et al., 2013). It is conceivable
that BMP7-driven Snail expression activates different signalling mechanisms, which
leads to a dissociation of the invasive capacity of GBM from the stemness and the
tumorigenic potential of the cells. At the same time, it has to be noted that these
findings were based on Snail overexpression experiments, which may cause
secondary effects in the cells, due to impaired homeostasis of protein synthesis and
folding and the activation of pathways that are not induced by normal amounts or
through natural triggers of the respective protein. Therefore, we avoided the use of
overexpression approaches and instead focused our analysis on studying the effects
of loss-of-function of the endogenous protein.
5.4 EMT and the cancer stem cell phenotype
Accumulating evidence over the last years demonstrates a link between the transition
from an epithelial to a mesenchymal state and the acquisition of stem cell traits in
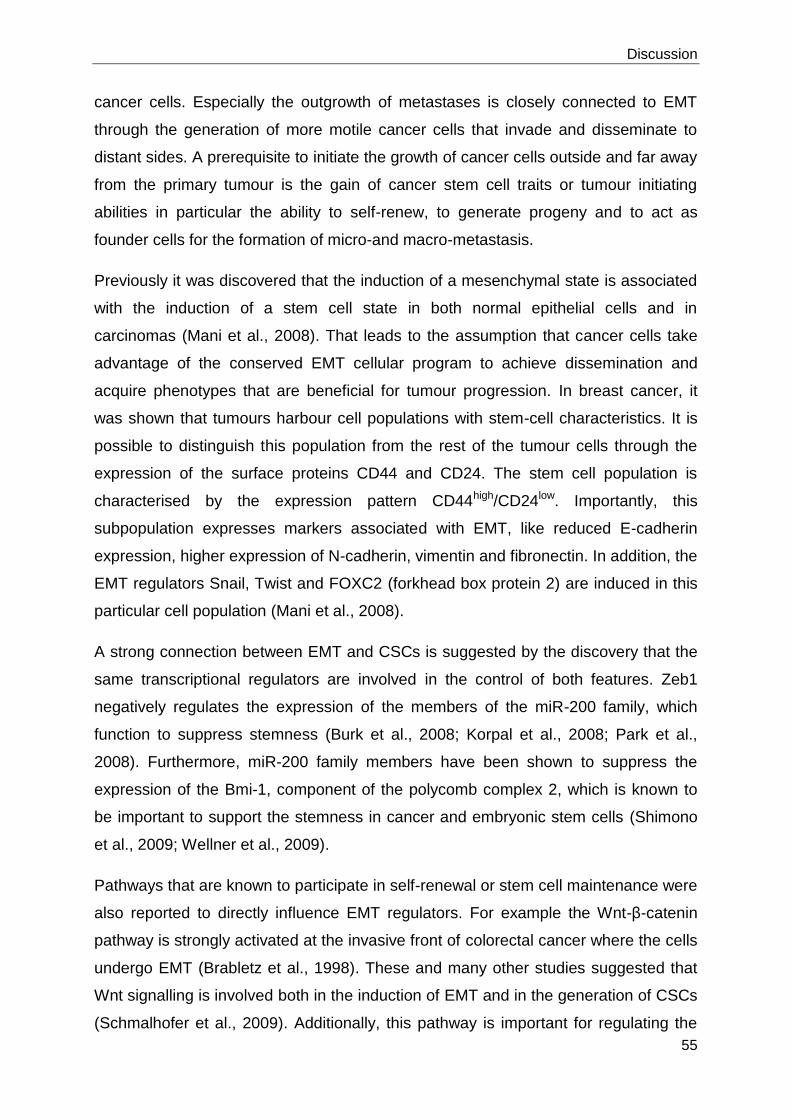
Discussion
55
cancer cells. Especially the outgrowth of metastases is closely connected to EMT
through the generation of more motile cancer cells that invade and disseminate to
distant sides. A prerequisite to initiate the growth of cancer cells outside and far away
from the primary tumour is the gain of cancer stem cell traits or tumour initiating
abilities in particular the ability to self-renew, to generate progeny and to act as
founder cells for the formation of micro-and macro-metastasis.
Previously it was discovered that the induction of a mesenchymal state is associated
with the induction of a stem cell state in both normal epithelial cells and in
carcinomas (Mani et al., 2008). That leads to the assumption that cancer cells take
advantage of the conserved EMT cellular program to achieve dissemination and
acquire phenotypes that are beneficial for tumour progression. In breast cancer, it
was shown that tumours harbour cell populations with stem-cell characteristics. It is
possible to distinguish this population from the rest of the tumour cells through the
expression of the surface proteins CD44 and CD24. The stem cell population is
characterised by the expression pattern CD44high/CD24low. Importantly, this
subpopulation expresses markers associated with EMT, like reduced E-cadherin
expression, higher expression of N-cadherin, vimentin and fibronectin. In addition, the
EMT regulators Snail, Twist and FOXC2 (forkhead box protein 2) are induced in this
particular cell population (Mani et al., 2008).
A strong connection between EMT and CSCs is suggested by the discovery that the
same transcriptional regulators are involved in the control of both features. Zeb1
negatively regulates the expression of the members of the miR-200 family, which
function to suppress stemness (Burk et al., 2008; Korpal et al., 2008; Park et al.,
2008). Furthermore, miR-200 family members have been shown to suppress the
expression of the Bmi-1, component of the polycomb complex 2, which is known to
be important to support the stemness in cancer and embryonic stem cells (Shimono
et al., 2009; Wellner et al., 2009).
Pathways that are known to participate in self-renewal or stem cell maintenance were
also reported to directly influence EMT regulators. For example the Wnt-β-catenin
pathway is strongly activated at the invasive front of colorectal cancer where the cells
undergo EMT (Brabletz et al., 1998). These and many other studies suggested that
Wnt signalling is involved both in the induction of EMT and in the generation of CSCs
(Schmalhofer et al., 2009). Additionally, this pathway is important for regulating the

Discussion
56
turnover and activity of Snail in breast cancer (Yook et al., 2005) and normal
hepatocellular regeneration (Sekiya and Suzuki, 2011). Especially TGFβ, as a major
EMT inducer (Kalluri and Weinberg, 2009; Massague, 2008), activates Snail, Slug
and Twist in many epithelial cancers and induced the stem cell population
CD44high/CD24low in immortalised mammary epithelial cells (Thuault et al., 2006).
5.4.1 The role of Snail and Slug in the maintenance of cancer stem cells in GBM
In non-epithelial cancers like GBM little is known about the role of EMT or GMT in the
induction and maintenance of CSCs. In the last few years some evidence arose that
a comparable connection, involving similar components and pathways also exists in
glioma. Especially TGFβ signalling seems to play a major role in GBM both for the
induction of EMT and the maintenance of stem-cell properties (Anido et al., 2010;
Ikushima et al., 2009; Penuelas et al., 2009). Recently it was shown that the EMT
regulator Zeb1 controls key features of CSCs in glioma and can be used as a marker
for invasive cells that is also linked to chemoresistance (Siebzehnrubl et al., 2013).
Furthermore, the EMT marker TWIST1 is involved in the promotion of invasiveness
and stemness of glioma cells (Mikheeva et al., 2010). There are also a few reports
showing that Snail and Slug can induce cellular changes comparable to EMT and
that the loss of theses transcription factors reduces invasion and vimentin expression
(Han et al., 2011; Myung et al., 2014; Yang et al., 2010). However, a direct
connection of GMT regulators of the Snail family to the CSC phenotype has been
missing so far.
In our study we were able to show and confirm a direct link of the transcription factors
Snail and Slug to GMT and stem-cell features in GBM. The loss of Snail or Snail and
Slug impairs not only the transition from a glial to a mesenchymal cell state induced
by TGFβ signalling but also the ability of cells to self-renew as functionally shown
with a glioma sphere formation assay in two GBM cell lines (see Fig. 4.9). Also, the
expression of the established glioma stem cell markers SOX2, OCT4, MAML3 and
CD15 is impaired by silencing Snail and Slug (see Fig. 4.8). These results are clearly
arguing for a connection of GMT and the induction of a CSC phenotype in glioma.

Discussion
57
Surprisingly, we were not able to detect a reduction of the commonly used glioma
stem cell marker CD133 upon silencing Snail and Slug; indeed silencing of the two
transcription factors led to an induction of CD133 (data not shown). These findings,
however, are supported by a very recent report, which analysed co-expression of
glioma stem cell markers in publicly available GBM databases. This study found that
CD133 is negatively correlated with CD44 and in turn CD44 is positively correlated
with the stem cell marker CD15. Moreover, the expression of CD133 overlapped
surprisingly with the proneural signature of the samples, whereas CD44 and CD15
clearly overlapped with the mesenchymal phenotype (Brown et al., 2015). This could
mean that CD133 is not a suitable marker for stem cell traits induced via GMT and
could explain our observations.
5.5 Invasion in GBM
GBM is the most aggressive tumour type of the CNS and most brain tumours are
glioblastomas. With a median survival of fifteen month, patients have a very poor
prognosis. Despite the development of improved imaging methods, specific surgical
techniques and new chemo-and radiotherapies the survival prognosis for patients did
not significantly change in the last decades. One of the mayor reasons is the high
infiltration of GBM cells throughout the brain, often even to the opposite hemisphere.
Upon surgical removal of the primary tumour it is nearly impossible to remove all
tumour tissue. Many patients suffer from a relapse with secondary tumours formed by
residing invasive cancer cells. Interestingly, therapeutic approaches, such as anti-
angiogenic treatment to withdraw oxygen and nutrients from the tumour result in an
initial shrinkage of the tumour but enhances the invasiveness of the cells.
It is not fully understood which mechanisms are responsible for the high invasive
capacity of GBM. One explanation could be EMT/GMT. The gain of mesenchymal
features is in many cancer types closely connected with a higher invasiveness of the
cells and a further progression of the disease. Snail and Slug as the major regulators
of EMT were shown to have a strong influence on invasion in epithelial cancers.
Therefore, studying GMT and invasion in glioma is very important for understanding
the mechanisms for the enhanced invasiveness of the cells, which may lead to an
improved treatment for patients.

Discussion
58
5.5.1 GMT and invasion
In glioma many recent reports showed a connection between EMT/GMT regulators
and the invasive capacity of the glioma cells in vitro. In this study we also examined
the influence of Snail and Slug on the invasiveness of glioma cells in vitro and in vivo.
Interestingly, we found that the precise extent to which GBM cell invasion depended
on specific members of the Snail family was cell line dependent. In the modified
Boyden chamber assay the primary cell line GBM046x showed that silencing of Snail
is sufficient to abrogate the ability of the cells to invade through the matrigel layer.
Surprisingly, silencing of Slug alone led to a significant increase of invasion,
suggesting a differential role of these two transcription factors in regulating invasive
behaviour in this cell line. When both regulators were lost the invasive capacity of the
cells was again significantly reduced (see Fig. 4.11). The same results were obtained
for GBM046x with a second invasion assay that mimics the three dimensional tumour
architecture and allows gliomaspheres to invade a collagen layer in all directions (see
Fig.4.12).
In the established cell line G55 the single knock-down of Snail or Slug had no
significant effect on the invasion of the cells, either in the matrigel invasion assay or
in the collagen invasion assay. Only the loss of both regulators led to a significant
decrease of invasiveness in both assays (see Fig. 4.11; 4.12). These findings show
that Snail alone can already influence the invasive behaviour in a cell line dependent
manner, but taking into account that only the double knockdown of Snail and Slug
shows a complete transition from proneural to mesenchymal state in terms of
signature gene expression our data support a model in which both regulators can
play a crucial role in GMT induced invasion. Therefore we performed in vivo studies
with glioma cells lacking Snail and Slug and examined the invasiveness of those cells
directly in the brain. We could observe that the loss of Snail and Slug led to severely
decreased parenchymal invasion compared to the control cells. It should also be
pointed out that some of our markers to determine the state of the cells (proneural or
mesenchymal) are also functionally involved in invasion. The cadherin CDH11, as
described in section 5.2, is strongly involved in glioma invasion and its loss results in
decreased invasion. CD44 is not only a mesenchymal marker but also an adhesion
molecule of the cells to the ECM. In this particular case, the amount of CD44 protein
may be more important for determining the mesenchymal state of the cells than for

Discussion
59
showing a direct connection to the invasive behaviour of the cells because to
enhance the invasion of cells CD44 has to be cleaved by ADAM proteases (Nagano
et al., 2004; Okamoto et al., 1999). To further study if also the cleavage of CD44 is
impaired in Snail and Slug silenced cells one could examine the activity of ADAM 10
and 11a.
In general, additional potential avenues for the further elucidation of the connection
between GMT and invasion could involve analysis of the expression levels of genes
and proteins closely connected to invasion mechanisms of glioma. For example one
could characterise the expression of MMPs or integrinβ1, in particular in tumour
samples from our in vivo studies.
5.6 Snail and Slug in tumour growth
A major part in the study presented here is the assessment of the role of Snail and
Slug in glioma tumour growth. So far this topic is underrepresented in the published
reports. Many of the reports mentioned in section 3.3.3 or 5.4.1 showed no in vivo
data to confirm their findings about the role of Snail and Slug (Han et al., 2011)
(Myung et al., 2014) (Dong et al., 2014). The rest of the reports often used only
subcutaneous injection into mice and no orthotopic intracranial injections into the
brain. The biggest limitation here is that important components of the specific
microenvironment of the brain are missing so that the subcutaneous tumour model
cannot fully mirror the natural situation of brain tumour growth. If intracranial
injections were used, the authors only analysed the survival of the mice and did not
analyse tumour volume or other features influencing tumour growth, such as
invasion, proliferation, apoptosis or vascularisation (Yang et al., 2010) (Savary et al.,
2013). Nevertheless, these key features of tumour growth and progression need to
be assessed to fully understand the role of Snail and Slug in glioma growth.
Therefore, we performed intracranial orthotopic injections into the brains of mice to
have a microenvironment comparable with situation in GBM. In these in vivo
experiments we assessed the proliferation, apoptosis and the vascularisation of the
tumours by immunofluorescence staining. By analysing the volume of the tumours we
saw a striking effect of silencing of Snail and Slug. The loss of both transcription
factors led to significantly reduced tumour growth (see Fig. 4.13). Surprisingly, we

Discussion
60
could not observe any differences in proliferation, apoptosis and vascularisation of
the Snail/Slug silenced and control tumours (see Fig. 4.14-16), indicating that Snail
and Slug have no major influence on these key features of tumour growth. These
results were also confirmed by analysing the proliferation and apoptosis of glioma
cells in vitro (see Fig. 4.10). By contrast, analysis of the invasiveness of the tumours
obtained from the in vivo experiments showed that the invasive capacity of the glioma
cells is severely impaired when Snail and Slug are silenced (see Fig.4.17).
Interestingly, the abrogated invasiveness of Snail/Slug silenced tumours seems to be
the main reason of the reduced tumour growth. We were also able to confirm these
data with two independent in vitro invasion assays (see Fig. 4.11; 4.12). Thus, our
work shows for the first time the connection between Snail and Slug and in vivo
invasiveness of glioma cells.
5.7 Perspectives
5.7.1 Transcriptomic analysis
To further confirm the specific role of Snail and Slug in GBM and in particular in the
molecular subtype transition that possibly occurs also during the progression of the
disease in patients, a transcriptome analysis could be a helpful approach. We are
currently generating Snail and Slug loss-of-function glioma cells with the
CRISPR/Cas9 technique. In collaboration with the German Cancer Research Center
(DKFZ) in Heidelberg, we will analyse the changes in the transcriptome following the
loss of Snail and Slug, which could further support the role of Snail/Slug in GMT by
demonstrating a shift of the expression signature to a proneural one. This analysis
may also allow us to gain a deeper insight into the Snail/Slug-dependent
mechanisms of GMT, invasion and stemness in glioma. Furthermore, it could also
complement the panel of markers we are currently using to determine GMT and the
CSC phenotype. Such an approach can also provide important information about
pathways and mechanism that could be used as potential therapeutic targets to act
directly on Snail and Slug expression or on the downstream pathways controlled by
them to prevent GMT and the gain of a more aggressive phenotype in glioma cells.

Discussion
61
5.7.2 Snail and Slug as therapeutic targets
In general, transcription factors are challenging drug targets. Nevertheless, there are
first attempts to target EMT factors with some initial success. Few chemical
compounds act directly on Snail, a more promising approach seems to be the
targeting of pathways regulating Snail expression (e.g. through HDAC (histone-
deacetylase) or LSD (lysine-specific-demethylase) inhibitors) or the interaction of
Snail with E-cadherin or p53 (Fig.5.1) (Kaufhold and Bonavida, 2014).
Fig. 5.1 Chemical inhibitors of Snail-induced EMT (taken from Kaufhold et al., 2014)
Other EMT regulators are also affected by inhibition of HDACs. The class I HDAC
inhibitor mocetinosat acts on the chemotherapy resistance of colorectal tumours
expressing high levels of ZEB1. Mocetinosat acts on the ZEB1 target gene miR203
(a major drug sensitizer repressed by ZEB1) as an epigenetic drug to restore miR203
expression, repress stemness and re-induce sensitivity against standard
chemotherapy (Meidhof et al., 2015). Epigenetic reactivation of miR expression is
technically easier to realize than a targeted delivery of miRNAs directly to a tumour.
Comparable strategies could be helpful also for the treatment of GBM. In glioma it
was recently shown that in multi-drug resistant cells, which had undergone GMT,
ectopic expression of miR203 reversed the resistance phenotype by the
downregulation of Slug. Unfortunately, the effects on Snail following overexpression
of miR203 were not assessed (Liao et al., 2015). Collectively, this work combined
with a transcriptome analysis, as described above, for getting a better understanding

Discussion
62
of the mechanisms and pathways regulated by Snail and Slug, has an important
potential for new approaches for the design of therapeutic strategies against
Snail/Slug-induced GMT, invasion and stemness.
Fig. 5.2 Graphical summary TGFβ1 induced GMT via Snail and Slug leads to an invasive phenotype, CSC maintenance and tumour propagation.

Materials and Methods
63
6. Materials and Methods
6.1 Materials
6.1.1 Antibiotics
Name Stock concentration Final concentration
Ampicillin (#A-9518,
Sigma)
100 mg/ml in aqua dest. 100 µg/ml
Kanamycin (#T832.1,
Roth)
100 mg/ml in aqua dest. 100 µg/ml
Table 6.1 Antibiotics for selection of bacterial cells
Name Stock concentration Concentration for
maintenance of
transgene expression
Blasticidin (#R210-01,
Invitrogen)
6 mg/ml in PBS 6 µg/ml
Puromycin (#P9620,
Sigma-Aldrich)
10 mg/ml ready to use
solution
G55: 4 µg/ml
GBM46x: 0.4 µg/ml
Table 6.2 Antibiotics for selection of mammalian cells
6.1.2 Antibodies
6.1.2.1. Primary antibodies
Antigen Species Dilution Company
Snail Rat (monoclonal) 1:500 for WB #4719, Cell
Signaling
Slug Rabbit
(monoclonal)
1:500 for WB #9585S,
Cell Signaling

Materials and Methods
64
CD133 Mouse
(monoclonal)
1:500 for WB #130-092-395,
Miltenyi
CD44 Mouse
(monoclonal)
1:5000 for WB #3570S,
Cell Signaling
YKL40 Goat (polyclonal) 1:200 for WB #AF2599,
R+D Systems
Olig2 Rabbit (polyclonal) 1:1000 for WB #18953, IBL
T-cadherin Mouse
(monoclonal)
1:1000 for WB #SC166875,
Santa Cruz
MAP2 Mouse
(monoclonal)
1:1000 for WB #M9942, Sigma
ASPHD2 Rabbit (polyclonal) 1:500 for WB #HPA000820
,Sigma
Tubulin Mouse
(monoclonal)
1:8000 for WB #DLN09992,
Dianova
Table 6.3 Primary antibodies for western blots
Antigen Species Dilution Company
Endomucin Rat (monoclonal) 1:500 #14-5851,
eBioscience
Phospho-histone 3 rabbit 1:200 #IHC-00061,
Bethyl lab
BrdU Mouse
(monoclonal)
1:200 #M0744,
Dako Cytomation
Human nuclei Mouse monoclonal 1:500 #MAB4383,
Millipore
Table 6.4 Primary antibodies for stainings

Materials and Methods
65
6.1.2.2. Secondary antibodies
Antigen Dilution Company
Peroxidase-conjugated
AffiniPure goat anti rabbit
IgG
1:2500 for Western Blot #111-035-144, Dianova
Peroxidase-conjugated
AffiniPure donkey anti
goat IgG
1:2500 for Western Blot #705-035-147, Dianova
Peroxidase-conjugated
AffiniPure goat anti mouse
IgG
1:2500 for Western Blot #115-035-146, Dianova
Peroxidase conjugated
f(ab’)2 fragment goat anti
rat IgG
1:2500 for Western Blot #721-1333, Rockland
Alexa Fluor®568 goat anti
rat IgG
1:200 for
Immunofluorescence
staining
#A11077, Life
Technologies
Alexa Fluor®568 goat anti
rabbit IgG
1:200 for
Immunofluorescence
staining
#A11036, Life
Technologies
Alexa Fluor®568 goat anti
mouse IgG
1:200 for
Immunofluorescence
staining
#A11031, Life
Technologies
Table 6.5 Secondary antibodies
6.1.3 Human cell lines
LN-229x: human glioblastoma cell line
G55: established human glioblastoma cell line
GBM10: primary glioblastoma cell line, isolated from human tumour material
GBM18: primary glioblastoma cell line, isolated from human tumour material

Materials and Methods
66
GBM37x: primary glioblastoma cell line, isolated from human tumour material
GBM46x: primary glioblastoma cell line, isolated from human tumour material
HEK293T: human embryonic kidney cell line: This cell line is transformed with
sheared human adenovirus type 5 DNA. The E1A adenovirus gene is expressed in
these cells and participates in the transactivation of some viral promoters allowing the
cells to produce large amounts of viral particles when transfected with suitable
plasmids. This cell line was purchased from Invitrogen.
6.1.4. Knock-down cell pools generated in this work
Name Construct/Lentivirus MOI Selection
G55 nsc non silencing control
(Thermo Scientific)
80 Puromycin
G55 shSlug pGIPZ-shSlug #2
( Thermo Scientific)
80 Puromycin
G55 shSnail pGIPZ-shSnail #19
(Thermo Scientific)
80 Puromycin
G55
shSnail/shSlug
pGIPZ-shSnail #19/
pGIPZ-shSlug #2
(Thermo Scientific)
Each 40 Puromycin
GBM46x nsc non silencing control (
Thermo Scientific)
10 Puromycin
GBM46x shSlug pGIPZ-shSlug #2
( Thermo Scientific)
10 Puromycin
GBM46x shSnail pGIPZ-shSnail #19
(Thermo Scientific)
10 Puromycin
GBM46x
shSnail/shSlug
pGIPZ-shSnail #19/
pGIPZ-shSlug #2
(Thermo Scientific)
Each 5 Puromycin
Table 6.6 Generated knock-down cell pools

Materials and Methods
67
6.1.5. Plasmids
pCL-VSV-G lentiviral packaging plasmid, expresses the envelope protein
glycoprotein-G (#1733 Addgene, Garry Nolan)
pS-PAX2 lentiviral packaging plasmid (#12260 Addgene, Didier Trono)
pGIPZ non silencing control (Delic et al.) lentiviral expression vector (non
targeting)
Hairpin sequence nsc (non silencing control):
TGCTGTTGACAGTGAGCGATCTCGCTTGGGCGAGAGTAAGTAGTGAAGCCACA
GATGTACTTACTCTCGCCCAAGCGAGAGTGCCTACTGCCTCGGA 22mer sense:
ATCTCGCTTGGGCGAGAGTAAG22merantisense: TACTCTCGCCCAAGCGAGAG
pGIPZshSnail mir (human) lentiviral expression vector to silence SNAI1
Hairpin sequence shRNA Snail (V2LS_199873)
TGCTGTTGACAGTGAGCGCAAAGGTACACTGGTATTTATATAGTGAAGCCACAG
ATGTATATAAATACCAGTGTACCTTTATGCCTACTGCCTCGGA
pGIPZ shSlug mir (human) lentiviral expression vector to silence SNAI2
Hairpin sequence ShRNA Slug (V2LHS_153126)
TGCTGTTGACAGTGAGCGACGAAGCCAAATGACAAATAAATAGTGAAGCCACAG
ATGTATTTATTTGTCATTTGGCTTCGGTGCCTACTGCCTCGGA
Hairpin sequence color code: miR-30 derived sequence, mature sense, loop, mature
antisense, miR-30 derived sequence (as given from the manufacturer)

Materials and Methods
68
6.1.6 Sequences (Primers)
CDH11
forward:TGGGCGGACTCTCAGGGACA
reverse: TTCCTCCCCAGGGACGGCTG
T-cadherin
forward: AGCGATGGCGGCTTAGTTG
reverse:CCCCGACAATCACGAGTTCTG
CD44
forward: TGGCACCCGCTATGTCCAG
reverse: GTAGCAGGGATTCTGTCTG
MAML3
forward: CAGCAGGTCAATCAGTTTCAAG
reverse: GGTTCTGGGAGGGTCCTATTC
OCT4
forward: GCTCGAGAAGGATGTGGTCC
reverse: CGTTGTGCATAGTCGCTGCT
SOX2
forward: GCCGGCGGCAACCAGAAAAACAG
reverse: CCGCCGGGGCCGGTATTTAT

Materials and Methods
69
HPRT1 (housekeeping gene)
forward: TATGGCGACCCGCAGCCC
reverse: GCAAGACGTTCAGTCCTGTCCAT
6.1.7 Growth factors
Reagent Stock concentration Final concentration
EGF (epidermal growth
factor)
(#C-10015-SS Peprotech)
200 µg/ml 20 ng/ml
bFGF (fibroblast growth
factor)
(#C-10018-BF Peprotech)
200 µg/ml 20 ng/ml
TGFβ1 (transforming
growth factor β1) (-21C
Peprotech)
10 mg/ml 2.5 ng/ml
Table 6.7 Growth factors
6.1.8 Protein/DNA ladders
6.1.8.1 Protein ladders
For proteins with low molecular weights PageRuler Prestained Protein ladder
(#26616, Thermo Scientific) was used.
For proteins with high molecular weights Spectra Multicolor High Range Protein
ladder (#26625, Thermo Scientific) was used.

Materials and Methods
70
6.1.9 Media, Buffers and other reagents
6.1.9.1 Animal experiments
Anaesthesia: 9 ml 0.9 % NaCl solution, 2 ml ketamine 10% (#FS1670041 bela-
pharm GmbH), 0.5 ml xylazine 2 % (CEVA Tiergesundheit GmbH)
4% Paraformaldehyde: 80 g PFA were solved in aqua dest.
0.5M PB pH7.4: 115 mM NaH2PO4 x H2O, 385 mM Na2PO4 x H2O., pH was adjusted
to 7.4
Cryoprotection solution (CPS): 500 ml 0.1 M PB (pH 7.4), 250 ml Ethylene glycol
(#9516.1, Roth) and 250 ml Glycerol (#3783.1, Roth), solution was stored at RT
30% sucrose in 0.1M PB pH7.4: 0.1 M D (+)-Sucrose (#84099, Fluka), solution was
sterile filtered and stored at 4 °C
6.1.10 Bacterial cultures
LB-Agar: 32 g of ready to use powder were dissolved in 1l aqua dest., the solution
was autoclaved at 121 °C for 15 min, cooled down to 40-50 °C and the appropriate
antibiotics were added. Afterward the LB-Agar was poured into 10 cm dishes. The
plates were stored at 4 °C.
LB-Medium: 20 g of LB powder were dissolved in 1 l aqua dest., and autoclaved at
121 °C for 15 min. The medium was stored at 4 °C.
6.1.11 Cell culture
Accutase: #A11105-01 Gibco
2.5M CaCl2: dissolved in aqua dest., sterile filtered and stored at 4°C
10mM Chloroquine: dissolved in aqua dest., sterile filtered an stored at 4°C
CO2-independent Medium without L-Glutamine: #18045-054, Gibco

Materials and Methods
71
Cryo-Medium SFM: #C-29910, Promocell
Dimethyl sulfoxide (DMSO): #A994.1, Roth
D-MEM/F12 (1:1) (with GlutaMAX): #31331-028, Gibco
D-MEM (Dulbecco´s Modified Eagle Medium High Glucose (with GlutaMAX, 4.5
g/l D-Glucose, Sodium Pyruvate): #31966-021, Gibco
FCS (Foetal Calf Serum): # 10270-106, Gibco
General cell culture medium for adherent cells: 500 ml DMEM, 10 %FCS
2xHBS: 281 mM NaCl2, 100 mM HEPES, 1.5 mM Na2HPO4 in aqua dest., pH 7.12,
sterile filtered and stored at -20°C
HEPES: #1563-056 Gibco
Tumoursphere medium: 500 ml DMEM/F12, 10ml B27 serum-free supplement
(#12587-010, Gibco), 5 ml amphotericin B (#A2942, Sigma), 2.5 ml 1M HEPES, 0.5
ml gentamicin (50 mg/ml) (P11-005, PAA Laboratories GmbH)
1xPBS: #10010-056, Gibco
Polybrene: 6 mg/ml in aqua dest., sterile filtered and stored at -20 °C
Poly (2-hydroxyethyl methacrylate) (pHEMA): 10 mg/ml pHEMA (#P3932-25g,
Sigma-Aldrich) was dissolved in 95 % ethanol, sterile filtered and stored at RT
Trypsin/EDTA: #L11-004, PAA Laboratories GmbH
Collagen solution (10 ml): 5.1 ml bovine collagen (Biomatrix), 3.5 ml TSM, 1.36 ml
HEPES
FACS Staining buffer: 1x PBS, 0.5 % BSA, 2 mM EDTA, pH 7.2
Papain stock solution: 100 mg papain (LS004194; Worthington) in 5 ml EBSS
(14155.048, Invitrogen)
DNase I solution: 100 mg DNase I in 5 ml sterile 0.15 M NaCl, stored in 50 µl
aliquots at -20 °C (#DN25-100mg, Sigma)

Materials and Methods
72
Solution 1 for primary cell isolation: 50 ml HBSS (#14180-046, Invitrogen) , 9 ml
D-Glucose (300 mg/ml), 7.5 ml 1 M HEPES; adjust pH to 7.5, fill up with H2O to 500
ml; activate before use 30 min at 37 °C, add freshly 200 µl papain and 50 µl of
DNase I solution
Solution 2 for primary cell isolation: 100 ml solution 1, 70 mg collagenase I
(LS004194, Worthington), 70 mg hyaluronidase (#H3884-100mg, Sigma), 100 mg
trypsin (#T9935-100mg, Sigma), stored at -20 °C in 5 ml aliquots, add freshly 50 µl
DNase I solution
6.1.12 Western Blot
Ammonium persulfate (APS): 1 g of powdered APS solved in 100 ml aqua dest.
and stored in 1 ml aliquots at -20 °C (9592.1, Roth)
Lower-buffer: 0.5 M Tris base, set pH to 8.8, add 0.4 % SDS, fill up with H2O
Lysis buffer (Laemmli): 10 mM Tris HCl, 2 % SDS, 2 mM EGTA, 20 mM NaF, filled
up with aqua dest.
Blocking buffer: 5 % milk powder in 1x PBS-Tween-20 (0.1 %)
20x PBS: 140 mM NaCl, 2.7 mM KCl, 10 mM Na2HPO4x2 H2O, 1.8 mM KH2PO4,
filled up with aqua dest., set pH to 7.4
10x Running buffer: 250mM Tris base, 2M glycine, 1% SDS, filled up with aqua
dest.
Sample buffer: 40 ml 10 % SDS, 16 ml 1 M Tris pH 6.8, 20 ml glycerol, 19 ml aqua
dest., stored in 800 µl aliquots, for usage mixed with 200 µl 1% bromphenol blue and
50 µl β-mercaptoethanol
8% separating gel: 2.7 ml 30 % poly-Acrylamide, 2.6 ml lower buffer, 4.5 ml aqua
dest., 100 µl APS (10%), 10 µl TEMED
12% separating gel: 4 ml 30 % poly-Acrylamide, 2.6 ml lower buffer, 3.5 ml aqua
dest., 100 µl APS (10 %), 10 µl TEMED

Materials and Methods
73
Stacking gel: 0.65 ml 30 % poly-Acrylamide, 1.3 ml upper buffer, 4.5 ml aqua dest.,
100 µl APS (10 %), 10 µl TEMED
TEMED: Tetramethylenediamine #A1148, Applichem
10x Wet Transfer buffer without SDS: 200 mM Tris base, 1.5 M glycine, filled up
with aqua dest.
Upper buffer: 0.5M Tris base, 0.4 % SDS, filled up with aqua dest.
Stripping buffer: 200 mM glycine, 0.05 % Tween-20, filled up with aqua dest.
Washing buffer (PBS-T): 1x PBS, 0.1 % Tween-20, filled up with aqua dest.
6.2 Solvents/Chemicals
Solvents and chemicals were, if not mentioned differently, purchased from Sigma-
Aldrich, Roth, Merck and Applichem
6.3 Methods
6.3.1 Working with RNA
6.3.1.1 RNA extraction
Cells were plated in 10 cm dishes (800.000-1.000.000 cells, depending on the
duration of the experiment). Cells grown as spheres were centrifuged and washed
with PBS afterwards the cells were lysed with 350 µl RLT buffer (RNeasy Mini Kit,
#74106, Qiagen; 1 ml RLT buffer+10 ml beta-mercaptoethanol). Cells grown
adherent were washed with PBS and lysed with 350 µl RLT buffer and scraped off
the dish with a cell lifter RNA extraction was performed following the manufacturer’s
instructions of the Qiagen RNeasy Mini Kit. The optional on-column DNase digestion
was performed using the RNAse-Free DNase Set (#79254, Qiagen) in order to
remove residual DNA. The concentration of the RNA was determined by NanoDrop
(Peqlab) photometric measurement at a wavelength of 260 nm.

Materials and Methods
74
6.3.1.2 Reverse transcription
1 µg of RNA filled up with DEPC-water to 11 µl together with 1 µl random hexamer
were incubated for 5 min at 70 °C and cooled down immediately on ice. This
procedure unfolds the secondary structures of the RNA. 7 µl of a mix containing 4 µl
5x reverse transcriptase reaction buffer (#EP0451,Thermo), 2 µl dNTP-Mix (10 mM)
(#NO447L, NEB) and 1 µl RNase-Inhibitor (#03335402001, Roche) were added and
the whole mixture was centrifuged briefly followed by an incubation of 5 min at RT. 1
µl of Revert Aid H Minus M-MuLV Reverse transcriptase (#EP0451, Thermo) was
added the whole reaction centrifuged briefly and incubated for 10 min at RT followed
by 60 min incubation at 42 °C. The enzymatic reaction was inactivated for 10 min at
70°C. The mixture was cooled down on ice and 1 µl RNase H (#10786357001,
Roche) was added. Again the reaction was centrifuged and incubated for 20 min at
37 °C. The cDNA was diluted with 180 µl DEPC-water.
6.3.2 Working with DNA
6.3.2.1 Plasmid isolation
The isolation of larger amounts of plasmid was carried out according to the protocol
of the Isolation Kit PureLink HiPure Plasmid Maxiprep Kit (#K2100-07, Invitrogen)
6.3.2.2 Measuring DNA/RNA concentrations
Concentration of DNA or RNA was measured with NanoDrop (Peqlab) at a
wavelength of 260 nm.
6.3.2.3 Sequencing
All sequencing reactions were performed by SeqLab.

Materials and Methods
75
6.3.2.4 Quantitative real time polymerase chain reaction (qRT-PCR)
Quantitative real time PCR allows amplification and simultaneously quantification of
the amount of DNA/cDNA molecules of interest in the sample either as absolute
number of copies or as relative amount to a normalizing gene. Quantification is based
on the detection of fluorescent signals, which are produced during PCR cycles. In this
work the SYBR Green method was used. The fluorescent dye SYBR green
intercalates with double- stranded DNA and emits light when excited. The PCR
reactions were performed with the Absolute QPCR SYBR Green ROX Mix (ABgene #
AB-1162/a) on a StepOne Plus system (ABgene, Thermo-Scientific).
Reactions were performed in triplicates with 20 ng of cDNA, 100 nM forward (fw)
primer, 100 nM reverse (rev) primer, 12,5 µl 2X ABsolute™ QPCR SYBR Green Mix
and DEPC-water. in a total volume of 25 µl. The amount of target mRNA was
determined using the comparative cycle threshold method and normalized relatively
to the amount of the housekeeping HPRT mRNA.
Step Temperature Time Number of cycles
Enzyme activation 95°C 15 min 1
Denaturation 95°C 30 sec 45
Annealing 60°C 30 sec
Extension 72°C 30 sec
Denaturation 95°C 1 min 1
Annealing/Extension 60°C 1 min 1
Melt curve 55°C 15 sec 0.5°C stepwise
increse in
temperature
End 4°C hold
Table 6.8 Routinely used qPCR program.

Materials and Methods
76
6.3.3 Working with proteins
6.3.3.1 Protein extraction
Plates with adherent cells were placed on ice and washed with cold PBS. After
aspiration of all PBS the cells were lysed with 100-250 µl Laemmli-buffer (see section
6.1.12) and scraped off the dish with a cell scraper. The proteins were collected in
Eppendorf-cups.
Cells grown as spheres were span, washed with cold PBS. After aspiration of all PBS
the cell pellet was resuspended in 80-200 µl Laemmli-buffer. The proteins were
collected in Eppendorf-tubes. Proteins were stored at -20 °C.
6.3.3.2 Determination of protein concentration
The concentration of proteins was determined with the colorimetric DC Protein Assay
Reagents Package (#500-01116, BIO-RAD). The main principle behind this method
is a combination of the reactions of copper ions with the peptide bonds under alkaline
conditions (the Biuret test) with the oxidation of aromatic protein residues which leads
to colour development which can be determined by absorbance measurement
between 650 and 750 nm. Protein concentration was determined using the
colorimetric DC Protein Assay Reagents Package (BIO-RAD # 500-0116). The
alkaline copper tartrate solution (Reagent A), the diluted Folin Reagent (Reagent B)
and Reagent S were prepared according to the manual. In an ELISA plate 25 μl of
the mixture of reagent B and S were added to the sample (5 μl of protein lysate) and
combined with 200 µl reagent B. After 15 min incubation at RT absorbance was
measured at 750 nm in a plate reader. Pure Laemmli buffer was measured as a
blank. The protein concentration was determined using a calibration curve measured
with increasing concentrations of BSA (bovine serum albumin). Afterwards sample
buffer (see section 6.1.12) was added to the protein lysate in a ratio 1:3 and the
sample heated at 95 °C for 5 min to denature the proteins.

Materials and Methods
77
6.3.3.3 SDS-PAGE (Sodium-Dodecyl-Sulfate-Poly Acrylamide Gel
Electrophoresis)/Western Blot
The principle behind this method lies in separation of proteins according to their size.
Due to binding of SDS, proteins have identical charge per unit mass, which leads to a
size depending fractionation. Electrophoresis was carried out by standard
discontinuous SDS-polyacrylamide denaturing gel electrophoresis in Mini-Protean
Tetra cells (BIO-RAD). Depending on the size of the protein being analysed 8 % or
12 % separating gels were prepared (see section 6.1.12). Separated proteins were
transferred electrophoretically to PVDF membranes (Hybond ECL, Amersham) at
100 mA per gel for 2 h using the Wet Blot System from BioRad. Membranes were
incubated for 1 h in 5 % milk blocking buffer (PBS, 0.1 % Tween-20, 5 % milk
powder) to prevent unspecific antibody binding followed by primary antibody
incubation in the blocking buffer at 4°C overnight. Blots were rinsed 3 times (15 min
each) in washing buffer (PBS, 0.1 % Tween 20) and incubated for 1 h at RT with the
appropriate secondary HRP-conjugated antibody diluted in blocking buffer. After
three times washing with washing buffer and once with PBS (each 15 min),
chemiluminescent signal was produced using ECL Western Blotting Detection
System (Thermo Scientific), ECL plus System (Perkin Elmer) or ECL Pico/Femto
System (Thermo Scientific) depending on the abundance of the protein and
peroxidase activity of the secondary antibody. The membrane was put into a
developing cassette and the luminescent signals developed on a radiographic film
(Thermo Scientific) with exposure times of 1 sec to 1 h, depending on the signal
strength.
6.3.3.4 Western blot membrane stripping
To re-incubate the membrane with another primary antibody, the membrane was
incubated in stripping buffer (see section 6.1.12) for 1 h at RT and subsequently
blocked with 5 % blocking buffer (see section 6.1.12) again for 1 h. Then the new
primary antibody was added and incubated over night at 4 °C. The rest of the
procedure was carried out as described above.

Materials and Methods
78
6.4.4 Cell culture
6.4.4.1. Isolation of primary glioblastoma cells from human tumor specimen
To isolate and culture primary glioblastoma cells from human tumor specimen the
following detailed protocol was used (based on (Seidel, 2015 #226)). All steps of the
tissue dissociation were carried out under sterile conditions in a laminar flow cell
culture hood to reduce the risk of contamination of the primary culture.
For tissue dissociation and cell isolation the tumour specimen was transferred to a
sterile petri dish using autoclaved forceps and washed with PBS 2 times. Hereafter
the tissue was cut into small fragments using a sterile scalpel. The fragments were
further chopped with a sterile single edged razor blade until the tissue was well
minced. The tumour tissue was transferred to a sterile 15 ml tube by flushing the dish
with 5 ml activated Dissociation medium 1 and pipetting it with a sterile pipette. The
tissue suspension was incubated at 37 °C for 30 min. Every 5 min during the
incubation the suspension was mixed with a 5 ml pipette. After incubation the tube
was centrifuged at 300 g for five min and the supernatant carefully removed. The
pellet was resuspended in 5 ml Dissociation medium 2 and the tube incubated for
another 30 min at 37 °C. Again, the suspension was triturated every 5 min during the
incubation. After 5 min centrifugation at 300 g the supernatant was removed carefully
and the pellet resuspended in 2 ml of Red Blood Cell Lysis Buffer (Roche) and
incubated 10 min at RT. 5 ml of PBS were added and the suspension centrifuged
again for 5 min at 300 g. Subsequently the pellet was resuspended in 10 ml PBS and
the solution filtered over a 70 µm cell strainer (BD Bioscience) into a sterile 50 ml
tube. Following another round of centrifugation, the cell pellet was resuspended in 10
ml tumour sphere medium with growth factors. The cells were cultured until there
were enough spheres to freeze several cryo vials.
6.4.4.2 Cell culture conditions for established cell lines
All glioblastoma cell lines were cultured in DMEM containing 10 % fetal calf serum on
10 cm tissue culture dishes under adherent conditions. For several experiments
glioblastoma cell lines were cultured under tumour sphere conditions: to prevent

Materials and Methods
79
attachment of the cells to the plate surface the cell culture dishes were coated with
10 mg/ml pHEMA in 95 % ethanol, dried, rinsed with PBS and plated in tumour
sphere medium supplemented with 20 ng/ml EGF and bFGF.
HEK 293 cells were cultured in DMEM supplemented with 10 % fetal calf serum on
tissue culture dishes or flasks.
6.4.4.3 Subculturing cells
Tumour sphere cultures of primary glioblastoma cells were split, depending on their
size, every 7 to 10 days. The spheres were centrifuged for 3 min at 900 rpm, the
supernatant discarded and the pellet was incubated with 1 ml of accutase solution at
37 °C for 15 min. The cell suspension was triturated gently with a 1000 µl pipette tip,
9 ml tumour sphere medium added and filtered over a 40 µm cell strainer. After
another round of centrifugation the cells were resuspended in fresh TSM medium
including growth factors.
Adherent cells were washed with PBS and covered with 3 ml Trypsin-EDTA solution
and incubated at 37 °C for 3 min until the cells detached from the plate. Hereafter
10ml of complete growth medium were added and the cells aspirated by gently
pipetting. The cell suspension was centrifuged at 1000 rpm for 3 min, the supernatant
discarded and the cells resuspended in fresh complete growth medium and
subcultured in ratios between 1:5 and 1:20 depending on the cell line.
6.4.4.4 Cryopreservation of cells
The primary glioblastoma cells should be used at low passage number, as there is a
risk of genetic alterations and phenotypic shifts over the course of prolonged culture
with multiple passaging. Therefore, a substantial number of aliquots should be
cryopreserved at the earliest passage when they can be sufficiently expanded.
Subsequently, fresh frozen aliquots should be periodically thawed and cultured for a
limited number of passages and new fresh aliquots at low passages should be
frozen.

Materials and Methods
80
For cryopreservation the primary glioblastoma cells were centrifuged for 3 min at 900
rpm. The pellet of 1 petri dish was resuspended in 2 ml of Cryo-SFM
cryopreservation medium and distributed to 2 cryo vials, which were placed into a
commercial available cryo-container (#5100-0001, Thermo) used to control the
freezing rate of cells. The container was filled with isopropyl alcohol at room
temperature, which leads to a freezing rate of 1 °C/min when placed at -80 °C. The
following day the vials were transferred to liquid nitrogen for long-term storage.
For adherent cells dishes with 70-90% cell confluence were trypsinized, centrifuged
for 3 min at 1000 rpm and resuspended in 2 ml DMEM, 20 % FCS, 10 % DMSO,
transferred to 2 cryo vials and frozen as described above.
Cryopreserved cells were rapidly thawed in a water bath at 37 °C and mixed with 10
ml of the corresponding culture medium and seeded on the respective culture dishes.
The following day the medium was changed and, if necessary, replaced with medium
containing antibiotics for transgene expression or selection.
6.4.4.5 Determining cell number
Cell number was determined using the CASY Cell Counter and Analyzer System
Model TT (# 05651697001, Roche Diagnostics GmbH), which works via electronic
pulse area analysis and measures cell number, size distribution and viability of a
sample. Cell counting was performed by diluting 100µl cell suspension in 10ml CASY
ton solution (# 05651808001, Roche Diagnostics GmbH) and analysed according to
the manufacturer’s instructions.
6.4.4.6 Producing lentiviruses in HEK 293T cells using calcium phosphate
transfection
All steps were carried out in a S2 (biosafety level 2) laboratory.
Expression Arrest pGIPZ lentiviral shRNA vectors, as well as the pGIPZ non
silencing control were purchased from Open Biosystems. Viral particles were

Materials and Methods
81
produced through calcium phosphate co-transfection with lentiviral vector and
packaging vectors.
For the calcium phosphate transfection method HEK 293T cells were seeded at a
density of 4 x 10⁶ cells per T75 tissue culture flask in full medium (DMEM/10 % FCS)
the day before transfection. The following day a medium change was performed 2 h
before transfection using 9 ml of serum containing medium. For each transfection 25
µg specific lentiviral vector, 12.5 μg of ENV plasmid (p-CL2-VSV-G) and 12.5 μg of
core packaging plasmid (pS-PAX2) were added to 450 μl sterile filtered water in a 50
ml tube. Additionally 50 μl of 2.5 M CaCl2 were added. DNA was precipitated by
dropwise addition 500 μl of 2x HBS to the DNA/CaCl2 mixture while vortexing the
mixture vigorously. After additional vortexing for one min, the mixture was incubated
at RT for 30 min. In the meantime 10 µl of 10 mM chloroquine stock (final
concentration 10 μM, #C6628-25g, Sigma) was added to the flask. 1 ml of
precipitated DNA solution was slowly pipetted into the dish and cells were placed at
37 °C for up to 16 h. The transfection mixture was aspirated and replaced by 10 ml of
standard culture medium. The virus containing supernatant was collected 48 and 72
h post-transfection into a sterile tube, which was stored at 4 °C. Addition of 10 ml
fresh standard culture medium was carried out by pipetting slowly at the rim of the
flask as HEK293T cells easily detach. Transfection efficiency could be monitored
microscopically for expression of EmGFP.
Before concentrating the virus, the supernatant was filtered through a sterile, 0.45 μm
low protein binding filter (Millex-HV 0.45 μm PVDF filters, Millipore #SLHVR25LS) to
remove any remaining cellular debris. Viral supernatant was pipetted into a sterile
38.5 ml ultracentrifuge tube (PA thick-walled-UC-tube, Herolab), which was already
placed in the centrifuge bucket on a balance under the tissue culture hood. Tubes
were balanced to 0.1 g exactly and ultracentrifugation was performed at 20000 g for
4 h at 4 °C in a Sorvall Pro 80 Ultracentrifuge and an AH-629 swinging bucket rotor.
The supernatant was discarded by decanting and residual liquid was removed by
placing the tube upside down on a beforehand UV-lighted paper for a few min. The
desired resuspension volume (100 μl-250 μl) of DMEM (no serum) was pipetted at
the bottom of the tube. In order to dislodge the viral particles from the protein pellet
the suspension was incubated for 5-10 min at 4 °C and then gently pipetted about 30
times up and down trying to avoid formation of air bubbles. The resuspended pellet

Materials and Methods
82
was transferred to a sterile 1.5 ml tube and centrifuged in a microfuge at full speed
for 5 min at 4 °C. The supernatant was placed in a new, sterile 1,5 ml tube, aliquoted
into multiple vials at 10-20 μl and stored at -80 °C. Usually the virus production per
lentiviral vector was performed at least in duplicates and the concentrated virus was
combined at the end to obtain higher viral titers.
6.4.4.7 Titration of lentiviral particles
For determining the virus titer 2,5 x 10⁴ G55TL cells were seeded in 24 wells and
titration was performed according to the manufacturer’s directions including the
addition of 8 µg/ml polybrene (#H9268-5g, Sigma) (Manual: Trans-Lentiviral shRNA
Bulk Packaging System). Transduced cells were counted as described in the manual
and transducing units per ml determined using the following formula:
Number of TurboGFP positive colonies counted x dilution factor x 40 = # TU/ml
The final TU/ml was obtained by assessing the average from the number of TU/ml of
the successive dilutions.
6.4.4.8 Lentiviral transduction of cells
All steps were carried out in a S2 (biosafety level 2) laboratory.
6.4.4.8.1 Stable transduction of primary glioblastoma cell lines
Depending on the cell line and desired multiplicity of infection (MOI), primary
glioblastoma cells were seeded at a density between 5x10⁴ (12-well plate, 400 µl
total volume including medium, polybrene and virus stock) and 1x10⁶ (6-well plate,
800 µl total volume including medium, polybrene and virus stock) cells on cell culture
multiwell plates coated with laminin (Sigma-Aldrich # L2020 solution in PBS (10
µg/ml), incubated at 37 °C for 3-5 h) in serum free tumour sphere medium without
antibiotics, containing 8 µg/ml polybrene.

Materials and Methods
83
Lentiviral particles were added according to the desired MOI and the cells were
incubated overnight. The following day the cells were washed with PBS and new
tumor sphere medium was added. Selection was started with the corresponding
antibiotic two days after transduction. Five days after viral transduction, cells were
detached from the monolayer on laminin using accutase and seeded as sphere
cultures in 6-well suspension culture plates in tumour sphere medium.
6.4.4.8.2 Stable transduction of glioblastoma cell lines
Depending on the cell line and desired MOI cells were seeded at a density of 5 x 10³
and 5 x 10⁵ cell per well in a 24-well cell culture plate (600 µl total volume including
medium, polybrene and virus stock) in DMEM/10 % FCS containing 8 µg/ml
polybrene. Lentiviral particles were added according to the desired MOI and the cells
were incubated overnight. The following day cells were washed with PBS and new
medium was added. In the presence of a selection marker, selection was started with
the corresponding antibiotic. When the cells reached a confluence of around 80 %
they were split to larger cell culture dishes.
6.4.4.9 Hypoxic incubation of cells
Before cells were cultured under hypoxic conditions medium was changed in all
corresponding samples of the experiment to be compared. For hypoxic treatment
cells were grown at 1 % O2 and 5 % CO2 for the indicated time points in an O2 control
Hypoxic Workstation (Coy Lab, Grass Lake, USA).
6.4.4.10 Sphere formation assay
For the determination of secondary sphere formation (sphere forming units (SFU))
cells were seeded at a density of 1x10⁶ cells on either petri dishes (primary
glioblastoma cells) or pHEMA coated tissue culture dishes (glioblastoma cell lines) in
tumour sphere medium for 7 days. The cells were then split to suspension 6-well

Materials and Methods
84
plates (primary glioblastoma cells, 1000 cells per well) or pHEMA coated 6-well
tissue culture plates (glioblastoma cell lines, 1000 cells per well) with 6 wells per
condition. Spheres consisting of 4 or more cells were counted and presented as the
percentage of sphere forming cells after 7 days.
6.4.4.11 Fluorescence activated cell sorting (FACS)
Cells were seeded 3 days before performing the FACS experiment into 6 well dishes
(100.000 cells per well). Cells were seeded in six replicates. In addition three
additional wells were seeded for IgG control, unstained control and GFP control.
The cells were dissociated with accutase containing 100 U/ml DNase I for 15 min at
37 °C. Afterwards the cells were cooled down on ice and 9ml staining buffer added
and the cells were triturated and centrifuged at 4 °C for 3 min at a speed of 900 rpm.
The supernatant was discarded by inverting the tube and the cells were resuspended
in 3.5 ml staining buffer. A cell strainer was placed on a FACS tube (# 55.1579,
Sarstedt) and the cells were passed through it. Again the cells were centrifuged at 4
°C at 900 rpm for 3 min. The centrifugation was followed by two washing steps. The
supernatant was discarded by inverting the tube. Approximately 100 µl buffer were
left in the tube. 20 µl (60 µg) of normal mouse IgG (# 10400C, Invitrogen) was added
to block unspecific binding. Cells were incubated on ice in the fridge for 20 min. The
fluorophore-coupled antibody against CD15 (# 642917, BD Horizon) or IgG control (#
561286, BD Horizon) was added (5 µg/ml) and incubated, protected from light, for 30
min on ice in the fridge. After the antibody incubation the cells were washed 2 times
with staining buffer.
For data acquisition with the BD FACS Canto the first step was to perform the
compensation measurements and to find the right settings for SSC (side scatter) and
FSC (forward scatter) and the suitable voltage values to detect the fluorophores.
Following compensation samples were analysed: non-stained cells, dead cells
(incubated shortly before measuring with 1 µl of SYTOX red (# S34859, Molecular
Probes), GFP control (cells were expressing GFP) and compensation beads (# 01-
1111-42, eBioscience) coupled with IgG + used fluorophore. Afterwards the normal

Materials and Methods
85
samples were analysed, also incubated with SYTOX to detect the dead cell
population.
The acquired data was analysed with FlowJo software to gate the dead cell
populations and the CD15 positive cells. The obtained percentages of populations
were exported to EXCEL to generate graphs. Dot Plots were exported directly from
FlowJo V2.2.
6.4.4.12 Modified Boyden Chamber assay
To assess the ability of cells to migrate through filters with defined pore sizes and/or
to invade through a basement membrane matrix such as matrigel a modified Boyden
chamber assay was performed. 24 well transwell plates (with 12 polycarbonate
membrane inserts with a pore size of 8.0 µm; # 3422 Corning/Costar) were used.
100 µl matrigel (Matrigel # 356234; BD) were mixed with 900 µl TSM (containing
EGF and FGF). 700 µl of this mixture was used to resuspend a cell pellet of a
particular cell number (for G55 100.000 cells per well, for 46x 200.000 cells per well).
For each condition 6 wells were prepared. 100 µl of the matrigel/cells suspension
was pipetted carefully onto the filter in the upper compartment of the insert. The plate
was incubated for 1h at 37 °C to allow polymerization of the matrigel. Afterwards 600
µl of TSM containing EGF/FGF and 1 % FCS were added to the lower compartment
of the well and 100 µl of TSM containing only EGF/FGF were added to the upper
compartment on top of the matrigel. After 18 h incubation at 37 °C the cells were
fixed for 10 min by replacing the medium of the lower compartment with 70 %
ethanol. The cells were rehydrated by a washing step with 1x PBS and the nuclei of
the cells were stained with DAPI (1:5000 in 1x PBS; 10 min incubation). After one last
washing step with 1x PBS pictures of the DAPI signal of the upper compartment were
taken with a fluorescence microscope using the 2.5x objective (LEICA BM IL LED,
camera: LEICA DFC420C). 1 picture of the whole compartment was taken.
Afterwards the upper side of the filter was cleaned with a q-tip to remove all cells.
The filter of the insert was removed and mounted with the lower side facing upwards
to microscope slides with fluorescence mounting medium (Dako). After drying the
slides over night at room temperature pictures were taken of the filters as described

Materials and Methods
86
above. The amount of cells was analysed with the program ImageJ
(http://imagej.nih.gov/ij/). The number of cells that had moved through the filter was
divided by the number of cells in the upper compartment and later on normalized to
the control cells.
6.4.4.13 Collagen Invasion assay
To assess the invasion ability of a tumour sphere a collagen invasion assay was
performed.
A 12 well plate was coated with 300 µl per well of the collagen solution and incubated
for 30 min at 37 °C to allow polymerisation of the collagen. 48-72 h old single tumour
spheres were picked with a 10 µl pipet tip and placed in the middle of the well. The
spheres were covered with 360 µl of the collagen solution and again incubated for
30min for polymerisation. Subsequently pictures of the spheres were taken with a
light microscope to record the size of the spheres at time point 0. Afterwards every 24
h pictures were taken to document the invasion of the spheres. The last time point
was reached after 96 h. The invasion of the spheres was analysed with the
programmes Adobe Photoshop and ImageJ. The invasion was calculated with the
formula of the Invasion Index (Perimeter)2/Area
6.4.5 In vivo tumour models
6.4.5.1 Intracranial tumour xenograft models
For intracranial tumour xenograft transplantations mice were anesthetized (through
intraperitoneal injection of 150 µl/20 g bodyweight of 2 ml 10 % ketamine, 0.5 ml 2 %
xylazine in 9 ml 0.9 % saline) and placed into a stereotactic apparatus (Kopf
Instruments). The scalp was disinfected with a swab dipped in 70% ethanol and
opened with a type 15 scalpel. A burr hole was made 2mm left of the sagittal suture
and 0.5 mm anterior to the bregma using a micro drill 0.7 mm in diameter. The cells,
resuspended in cold CO2 independent medium, were slowly implanted at a depth of 3
mm from the dura using a 2.5 µl Hamilton syringe equipped with an unbeveled 33G

Materials and Methods
87
needle. The mice were kept until the development of neurological symptoms and, in
case of comparative experiments, sacrificed at the same time point.
Cell lines used for intracranial tumour implantations: G55 nsc (5000 cells in 1µl),
G55shSnail/shSlug (5000 cells in 1 µl), 46x nsc (200.000 cell in 2 µl), 46x
shSnail/shSlug (200.000 cells in 2 µl)
6.4.5.2 Perfusion and tissue preparation
Intracranial tumor bearing mice were anesthetized (through intraperitoneal injection
of 250 µl/20 g bodyweight of 2ml 10% ketamine, 1 ml 2 % xylazine in 9 ml 0.9 %
saline) the chest was opened and vascular perfusion was performed using 0.9%
saline for 3 min and 4 % PFA as a fixative for 6 min via a 13 gauge needle inserted
through the left ventricle. The brains were dissected and additionally fixed in 4 % PFA
at 4 °C over night. The brains were dehydrated in 30 % sucrose for about 4 days at 4
°C and subsequently rapidly frozen on dry ice for sectioning with a sliding microtome
(Leica # SM2010R). The whole brain was sectioned by collecting 10 x 40 µm
sections followed by 4 x 20 µm sections in 14 sequential microcentrifuge tubes
containing cryoprotection solution. When the last section was stored in the tube,
collection of sections was performed in the first tube again, resulting in brain sections
of a 480 µm interval in every microcentrifuge tube. The sections were stored at -20
°C.
6.4.5.3 Quantification of tumour volume and hematoxylin an eosin (HE) staining
The tumour volume of intracranial tumours was quantified on HE stainings.
The hematoxylin solution (# A4840-500, Applichem) consists of an oxidizing agent,
most commonly sodium iodide that converts hematoxylin to hematein and a mordent
usually aluminium or iron compounds. The hematoxylin-metal complex acts as a
basic dye, staining nucleic acids in the nucleus and cytoplasm blue. On the contrary
eosin (1% eosin in 70 % EtOH, add 1 drop of concentrated acetic acid per 100 ml),

Materials and Methods
88
acting as an alcohol-based acidic dye, stains more basic proteins within the
cytoplasm pink.
A series of brain sections covering the whole brain in 480 µm intervals was mounted
on microscope slides and dried at room temperature overnight. The slides were fit
into a removable glass slide rack and rehydrated in PBS for two min followed by a
rinse in ultrapure aqua dest. Hematoxylin staining was performed for 8-10 min in a
staining jar. The slides were rinsed in ultrapure aqua dest. and blued in tap water for
2 min, followed by an additional rinse in ultrapure aqua dest. Cytoplasmic eosin
staining was performed for 6 min followed by dehydration in an ascending alcohol
series (2 times 70 % and 96 % ethanol for 30 s and 2 times for 5 min in 100 %
ethanol). Finally the slides were transferred to xylol 2 times for 5 min each and
subsequently mounted with Cytoseal™ XYL (Richard-Allen Scientific) and dried
under the chemical fume hood.
The tumour volume was calculated by tracing the tumour area using the semi-
automated stereological system Stereo Investigator 4.34 (MicroBrightField Inc.) or
ImageJ and calculating the volume with the following formula:
V [mm3] = total tumour area [mm2] x12 x 0.04 mm (thickness of sections)
6.4.5.4 Analysis of invasiveness of xenograft tumours
The invasive area of the xenograft tumours was analyses with the help of the GFP
signal of the injected cells. 10 pictures of the tumour rim and the invasive area per
tumour were taken with a fluorescence microscope (LEICA TCS SPE, camera:
LEICA DFC420C; 20x objective). With the program ImageJ the length of the tumour
rim and the area of the invading tumour cells was measured. The ratio of the invasive
front to the initial perimeter of the tumour rim was calculated with the formula area of
the invasive front / length of the tumour rim.

Materials and Methods
89
6.4.6 Immunofluorescence stainings
6.4.6.1 BrdU labelling and staining of cells
5-bromo-2-deoxy-uridine (BrdU) is a synthetic nucleoside and analogue of thymidine
that can be incorporated into DNA during DNA synthesis. By using monoclonal
antibodies directed against BrdU and enzyme- or fluorochrome-conjugated
secondary antibodies, cell proliferation can be assessed.
Cells were cultured as spheres in TSM medium. For each condition triplets were
prepared. The cells were separated with accutase and washed with 1x PBS. BrdU
was added to the cells to a final concentration of 10 µm and incubated for 10 min at
37 °C. In parallel a control without BrdU treatment was prepared. After the incubation
the cells were put directly on ice and 100000 cells transferred on microscope slides
using a cytospin centrifuge (Sakura Finetek) (800 rpm, 3min). The cells on the
microscope slides were fixed with 4 % PFA for 30 min at 4 °C followed by a short
rinse in 1x PBS. Afterwards antigen retrieval was performed by boiling the slides for 5
min in 0.01 M sodium citrate buffer (1.47 g tri sodium citrate in 500 ml H2O, adjust pH
with 1 M HCl), pH 6.0 (before boiling the slides preheat the buffer for 20 min). The
slides were cooled down in the buffer for 15min at room temperature followed by 3
washing steps of 2 min each in 1x PBS. After the washing steps the slides were
incubated for 30 min in 2 N HCl to denature the BrdU-labelled DNA in the nucleus
and make it accessible for antibody binding. Afterwards the slides were immersed 2
times for 5 min in 0.1 M borate buffer (3.8 g di-sodium tetra borate decahydrate in
100ml H2O), pH 8.5 to neutralize the acid from the step before. Again the slides were
washed 3 times 2 min in 1x PBS. For 1h the slides were blocked with 20 % normal
goat serum/1xPBS. The primary anti-BrdU antibody (1:200 in 10% normal goat
serum/1x PBS) was incubated over night at 4 °C. The next day the slides were
washed 3 times 5 min with 1x PBS followed by incubation with the Alexa-568
secondary antibody (1:500 in 10 % normal goat serum/PBS) for 1 h at room
temperature. Afterwards the cells were counterstained with DAPI (1:5000 in 1x PBS)
to visualize the nuclei. Again the slides were washed with 1x PBS 3 times for 2 min.
The cells were mounted with Dako Fluorescence mounting medium. The proliferation
was analysed as a percentage of BrdU positive cells in 5 randomly selected 20x
fields per slide (3 replicates per condition).

Materials and Methods
90
6.4.6.2 Free-floating endomucin staining of 40µm brain sections
Endomucin (endothelial sialomucin) is a protein expressed on endothelial cells. To
analyse the vasculature of xenograft tumours a monoclonal anti-mouse Endomucin
antibody was used.
The 40 µm brain sections were put in a 24-well plate (per well maximum 3 sections)
and permeabilized for 1 h in 1 % Triton X-100/1x PBS at room temperature while
shaking on an orbital shaker. Afterwards the sections were blocked with 0.5 % Triton
X-100/1x PBS/5 % normal goat serum at room temperature. The primary endomucin
antibody (1:500 in blocking buffer (20% normal goat serum/1x PBS/0.01 % Triton X-
100)) was added to the sections and incubated for two night at 4 °C while shaking on
an orbital shaker.
After the incubation with the primary antibody the sections were washed 3 times for
15 min in 1x PBS/0.01 % Triton X-100 and once with 1x PBS for 15 min. The
secondary antibody (goat anti rat Alexa Fluor 568, 1:200 in blocking buffer) was
added and incubated over night at 4 °C. The next day the sections were washed 3
times for 15 min with 1x PBS/0.01 % Triton X-100, followed by one washing step with
1x PBS for 15 min. The sections were counterstained with DAPI (1:5000 in 1x PBS)
to visualize the nuclei. Afterwards, the sections were washed again 2 times for 5 min
with 1x PBS and mounted with fluorescence mounting medium (#S3023 Dako).
The vessel area was analysed as percentage of the total tumour area in 10 pictures
per tumour.
6.4.6.3 Phospho-histone 3 staining of 40µm brain sections
To assess the proliferation of tumour cells in xenografts a staining of phospho-
histone 3 was performed.
The brain sections were mounted on microscope slides and dried over night at room
temperature. The sections were encircled with Cytomation pen (#S2002). Sections
were boiled in TE buffer for 5 min, the slides were cooled down for 20 min at room
temperature. Afterwards the sections were washed 2 times 5 min in 1x PBS/0.01 %

Materials and Methods
91
Triton X-100 followed by one washing step in 1x PBS. To permeabilise the sections
they were incubated for 4 h at room temperature in blocking buffer. The primary
antibody against human-phospho Histone 3 was diluted 1:200 in incubation buffer
(10% normal goat serum/1xPBS/0.01% TritonX-100) and the slices were incubated
for two nights at 4°C in a humidified chamber.
After the incubation with the primary antibody the slices were washed in 1x PBS/0.01
% Triton X-100 several h (changed 2 times). The rest of the day the slices were
washed in 1x PBS. The secondary antibody was diluted in 1:500 in incubation buffer
and the slices were incubated over night at room temperature in a humidified
chamber. The next day the slices were washed several h in 1x PBS/0.01 % Triton X-
100 (two changes) followed by washing once in 1x PBS for the rest of the day. The
slices were counterstained with DAPI (1:5000 in PBS) to visualize the nuclei.
Afterwards the slices were washed again 3 times 5min in PBS and then mounted with
fluorescence mounting medium (#S3023 Dako). The amount of proliferating cells was
analysed by taking 10 pictures per slice with a 10x objective and calculating the
number of phospho-histone 3 positive cells per mm2.
6.4.6.4 Staining of apoptotic cells
To stain apoptotic cells in vitro and in vivo the apoptosis detection kit ApopTag Red in
situ from Millipore was used. This kit is based on the TUNEL assay and detects
double- and single-stranded DNA breaks by labelling the free 3’OH ends of the
damaged DNA with fluorescent nucleotides. The procedure was performed according
to the manual of the manufacturer.
6.4.7 Statistical analysis
Results are presented as mean + standard error of mean. Statistical comparisons of
values were made using the Student’s t-test or Mann-Whitney U-test. Statistical
significance was assumed at p < 0.05 *, p < 0.01 **, p < 0.001 ***.

Literature
92
7. Literature
Al-Hajj, M., Wicha, M.S., Benito-Hernandez, A., Morrison, S.J., and Clarke, M.F.
(2003). Prospective identification of tumorigenic breast cancer cells. Proc Natl Acad
Sci U S A 100, 3983-3988.
Alberga, A., Boulay, J.L., Kempe, E., Dennefeld, C., and Haenlin, M. (1991). The
snail gene required for mesoderm formation in Drosophila is expressed dynamically
in derivatives of all three germ layers. Development 111, 983-992.
Anido, J., Saez-Borderias, A., Gonzalez-Junca, A., Rodon, L., Folch, G., Carmona,
M.A., Prieto-Sanchez, R.M., Barba, I., Martinez-Saez, E., Prudkin, L., et al. (2010).
TGF-beta Receptor Inhibitors Target the CD44(high)/Id1(high) Glioma-Initiating Cell
Population in Human Glioblastoma. Cancer Cell 18, 655-668.
Bao, S., Wu, Q., Li, Z., Sathornsumetee, S., Wang, H., McLendon, R.E., Hjelmeland,
A.B., and Rich, J.N. (2008). Targeting cancer stem cells through L1CAM suppresses
glioma growth. Cancer Res 68, 6043-6048.
Bao, S., Wu, Q., McLendon, R.E., Hao, Y., Shi, Q., Hjelmeland, A.B., Dewhirst, M.W.,
Bigner, D.D., and Rich, J.N. (2006a). Glioma stem cells promote radioresistance by
preferential activation of the DNA damage response. Nature 444, 756-760.
Bao, S., Wu, Q., Sathornsumetee, S., Hao, Y., Li, Z., Hjelmeland, A.B., Shi, Q.,
McLendon, R.E., Bigner, D.D., and Rich, J.N. (2006b). Stem cell-like glioma cells
promote tumor angiogenesis through vascular endothelial growth factor. Cancer Res
66, 7843-7848.
Bar, E.E. (2011). Glioblastoma, cancer stem cells and hypoxia. Brain Pathol 21, 119-
129.
Barbera, M.J., Puig, I., Dominguez, D., Julien-Grille, S., Guaita-Esteruelas, S., Peiro,
S., Baulida, J., Franci, C., Dedhar, S., Larue, L., et al. (2004). Regulation of Snail
transcription during epithelial to mesenchymal transition of tumor cells. Oncogene 23,
7345-7354.
Barrallo-Gimeno, A., and Nieto, M.A. (2005). The Snail genes as inducers of cell
movement and survival: implications in development and cancer. Development 132,
3151-3161.
Bates, R.C., and Mercurio, A.M. (2003). Tumor necrosis factor-alpha stimulates the
epithelial-to-mesenchymal transition of human colonic organoids. Mol Biol Cell 14,
1790-1800.

Literature
93
Batlle, E., Sancho, E., Franci, C., Dominguez, D., Monfar, M., Baulida, J., and Garcia
De Herreros, A. (2000). The transcription factor snail is a repressor of E-cadherin
gene expression in epithelial tumour cells. Nat Cell Biol 2, 84-89.
Bhat, K.P., Balasubramaniyan, V., Vaillant, B., Ezhilarasan, R., Hummelink, K.,
Hollingsworth, F., Wani, K., Heathcock, L., James, J.D., Goodman, L.D., et al. (2013).
Mesenchymal differentiation mediated by NF-kappaB promotes radiation resistance
in glioblastoma. Cancer Cell 24, 331-346.
Birchmeier, W., and Behrens, J. (1994). Cadherin expression in carcinomas: role in
the formation of cell junctions and the prevention of invasiveness. Biochim Biophys
Acta 1198, 11-26.
Black, K.L. (1997). The Cure for Cancer: Not If but When. Oncologist 2, IX-X.
Bolos, V., Peinado, H., Perez-Moreno, M.A., Fraga, M.F., Esteller, M., and Cano, A.
(2003). The transcription factor Slug represses E-cadherin expression and induces
epithelial to mesenchymal transitions: a comparison with Snail and E47 repressors. J
Cell Sci 116, 499-511.
Bonnet, D., and Dick, J.E. (1997). Human acute myeloid leukemia is organized as a
hierarchy that originates from a primitive hematopoietic cell. Nat Med 3, 730-737.
Brabletz, T., Jung, A., Hermann, K., Gunther, K., Hohenberger, W., and Kirchner, T.
(1998). Nuclear overexpression of the oncoprotein beta-catenin in colorectal cancer
is localized predominantly at the invasion front. Pathol Res Pract 194, 701-704.
Bradley, C.K., Norton, C.R., Chen, Y., Han, X., Booth, C.J., Yoon, J.K., Krebs, L.T.,
and Gridley, T. (2013). The snail family gene snai3 is not essential for embryogenesis
in mice. PLoS One 8, e65344.
Brat, D.J., Castellano-Sanchez, A.A., Hunter, S.B., Pecot, M., Cohen, C., Hammond,
E.H., Devi, S.N., Kaur, B., and Van Meir, E.G. (2004). Pseudopalisades in
glioblastoma are hypoxic, express extracellular matrix proteases, and are formed by
an actively migrating cell population. Cancer Res 64, 920-927.
Brecher, G., Pallavicini, M.G., and Cronkite, E.P. (1993). Competitive repopulation in
leukemic and normal bone marrow. Blood Cells 19, 691-697; discussion 698-707.
Brown, D.V., Daniel, P.M., D'Abaco, G.M., Gogos, A., Ng, W., Morokoff, A.P., and
Mantamadiotis, T. (2015). Coexpression analysis of CD133 and CD44 identifies
proneural and mesenchymal subtypes of glioblastoma multiforme. Oncotarget 6,
6267-6280.
Burk, U., Schubert, J., Wellner, U., Schmalhofer, O., Vincan, E., Spaderna, S., and
Brabletz, T. (2008). A reciprocal repression between ZEB1 and members of the miR-
200 family promotes EMT and invasion in cancer cells. EMBO Rep 9, 582-589.

Literature
94
Calabrese, C., Poppleton, H., Kocak, M., Hogg, T.L., Fuller, C., Hamner, B., Oh, E.Y.,
Gaber, M.W., Finklestein, D., Allen, M., et al. (2007). A perivascular niche for brain
tumor stem cells. Cancer Cell 11, 69-82.
Cano, A., Perez-Moreno, M.A., Rodrigo, I., Locascio, A., Blanco, M.J., del Barrio,
M.G., Portillo, F., and Nieto, M.A. (2000). The transcription factor snail controls
epithelial-mesenchymal transitions by repressing E-cadherin expression. Nat Cell
Biol 2, 76-83.
Canoll, P., and Goldman, J.E. (2008). The interface between glial progenitors and
gliomas. Acta Neuropathol 116, 465-477.
Caussinus, E., and Gonzalez, C. (2005). Induction of tumor growth by altered stem-
cell asymmetric division in Drosophila melanogaster. Nat Genet 37, 1125-1129.
Cavallaro, U., and Christofori, G. (2004). Cell adhesion and signalling by cadherins
and Ig-CAMs in cancer. Nat Rev Cancer 4, 118-132.
Charles, N., Ozawa, T., Squatrito, M., Bleau, A.M., Brennan, C.W., Hambardzumyan,
D., and Holland, E.C. (2010). Perivascular nitric oxide activates notch signaling and
promotes stem-like character in PDGF-induced glioma cells. Cell Stem Cell 6, 141-
152.
Chinot, O.L., Wick, W., Mason, W., Henriksson, R., Saran, F., Nishikawa, R.,
Carpentier, A.F., Hoang-Xuan, K., Kavan, P., Cernea, D., et al. (2014). Bevacizumab
plus radiotherapy-temozolomide for newly diagnosed glioblastoma. N Engl J Med
370, 709-722.
Cho, R.W., Wang, X., Diehn, M., Shedden, K., Chen, G.Y., Sherlock, G., Gurney, A.,
Lewicki, J., and Clarke, M.F. (2008). Isolation and molecular characterization of
cancer stem cells in MMTV-Wnt-1 murine breast tumors. Stem Cells 26, 364-371.
Ciruna, B., and Rossant, J. (2001). FGF signaling regulates mesoderm cell fate
specification and morphogenetic movement at the primitive streak. Dev Cell 1, 37-49.
Claes, A., Idema, A.J., and Wesseling, P. (2007). Diffuse glioma growth: a guerilla
war. Acta Neuropathol 114, 443-458.
Collins, A.T., Berry, P.A., Hyde, C., Stower, M.J., and Maitland, N.J. (2005).
Prospective identification of tumorigenic prostate cancer stem cells. Cancer Res 65,
10946-10951.
Comijn, J., Berx, G., Vermassen, P., Verschueren, K., van Grunsven, L., Bruyneel,
E., Mareel, M., Huylebroeck, D., and van Roy, F. (2001). The two-handed E box
binding zinc finger protein SIP1 downregulates E-cadherin and induces invasion. Mol
Cell 7, 1267-1278.
Cooper, L.A., Gutman, D.A., Chisolm, C., Appin, C., Kong, J., Rong, Y., Kurc, T., Van
Meir, E.G., Saltz, J.H., Moreno, C.S., et al. (2012). The tumor microenvironment

Literature
95
strongly impacts master transcriptional regulators and gene expression class of
glioblastoma. Am J Pathol 180, 2108-2119.
Covello, K.L., Kehler, J., Yu, H., Gordan, J.D., Arsham, A.M., Hu, C.J., Labosky, P.A.,
Simon, M.C., and Keith, B. (2006). HIF-2alpha regulates Oct-4: effects of hypoxia on
stem cell function, embryonic development, and tumor growth. Genes Dev 20, 557-
570.
Delic, S., Lottmann, N., Jetschke, K., Reifenberger, G., and Riemenschneider, M.J.
(2012). Identification and functional validation of CDH11, PCSK6 and SH3GL3 as
novel glioma invasion-associated candidate genes. Neuropathol Appl Neurobiol 38,
201-212.
Demuth, T., and Berens, M.E. (2004). Molecular mechanisms of glioma cell migration
and invasion. J Neurooncol 70, 217-228.
Derynck, R., and Zhang, Y.E. (2003). Smad-dependent and Smad-independent
pathways in TGF-beta family signalling. Nature 425, 577-584.
Dirks, P.B. (2006). Cancer: stem cells and brain tumours. Nature 444, 687-688.
Dominguez, D., Montserrat-Sentis, B., Virgos-Soler, A., Guaita, S., Grueso, J., Porta,
M., Puig, I., Baulida, J., Franci, C., and Garcia de Herreros, A. (2003).
Phosphorylation regulates the subcellular location and activity of the snail
transcriptional repressor. Mol Cell Biol 23, 5078-5089.
Dong, Q., Cai, N., Tao, T., Zhang, R., Yan, W., Li, R., Zhang, J., Luo, H., Shi, Y.,
Luan, W., et al. (2014). An axis involving SNAI1, microRNA-128 and SP1 modulates
glioma progression. PLoS One 9, e98651.
Du, J., Sun, B., Zhao, X., Gu, Q., Dong, X., Mo, J., Sun, T., Wang, J., Sun, R., and
Liu, Y. (2014). Hypoxia promotes vasculogenic mimicry formation by inducing
epithelial-mesenchymal transition in ovarian carcinoma. Gynecol Oncol 133, 575-
583.
Eger A, Aigner K, Sonderegger S, Dampier B, Oehler S, Schreiber M, Berx G, Cano
A, Beug H, and R., F. (2005). DeltaEF1 is a transcriptional repressor of E-cadherin
and regulates epithelial plasticity in breast cancer cells. Oncogene 14, 2375-2385.
Francescone, R.A., Scully, S., Faibish, M., Taylor, S.L., Oh, D., Moral, L., Yan, W.,
Bentley, B., and Shao, R. (2011). Role of YKL-40 in the angiogenesis,
radioresistance, and progression of glioblastoma. J Biol Chem 286, 15332-15343.
Franco, D.L., Mainez, J., Vega, S., Sancho, P., Murillo, M.M., de Frutos, C.A., Del
Castillo, G., Lopez-Blau, C., Fabregat, I., and Nieto, M.A. (2010). Snail1 suppresses
TGF-beta-induced apoptosis and is sufficient to trigger EMT in hepatocytes. J Cell
Sci 123, 3467-3477.

Literature
96
Freije, W.A., Castro-Vargas, F.E., Fang, Z., Horvath, S., Cloughesy, T., Liau, L.M.,
Mischel, P.S., and Nelson, S.F. (2004). Gene expression profiling of gliomas strongly
predicts survival. Cancer Res 64, 6503-6510.
Galli, R., Binda, E., Orfanelli, U., Cipelletti, B., Gritti, A., De Vitis, S., Fiocco, R.,
Foroni, C., Dimeco, F., and Vescovi, A. (2004). Isolation and characterization of
tumorigenic, stem-like neural precursors from human glioblastoma. Cancer Res 64,
7011-7021.
Galliher, A.J., Neil, J.R., and Schiemann, W.P. (2006). Role of transforming growth
factor-beta in cancer progression. Future Oncol 2, 743-763.
Giese, A., and Westphal, M. (1996). Glioma invasion in the central nervous system.
Neurosurgery 39, 235-250; discussion 250-232.
Gilbert, M.R., Sulman, E.P., and Mehta, M.P. (2014). Bevacizumab for newly
diagnosed glioblastoma. N Engl J Med 370, 2048-2049.
Ginestier, C., Hur, M.H., Charafe-Jauffret, E., Monville, F., Dutcher, J., Brown, M.,
Jacquemier, J., Viens, P., Kleer, C.G., Liu, S., et al. (2007). ALDH1 is a marker of
normal and malignant human mammary stem cells and a predictor of poor clinical
outcome. Cell Stem Cell 1, 555-567.
Godard, S., Getz, G., Delorenzi, M., Farmer, P., Kobayashi, H., Desbaillets, I.,
Nozaki, M., Diserens, A.C., Hamou, M.F., Dietrich, P.Y., et al. (2003). Classification
of human astrocytic gliomas on the basis of gene expression: a correlated group of
genes with angiogenic activity emerges as a strong predictor of subtypes. Cancer
Res 63, 6613-6625.
Gras, B., Jacqueroud, L., Wierinckx, A., Lamblot, C., Fauvet, F., Lachuer, J.,
Puisieux, A., and Ansieau, S. (2014). Snail family members unequally trigger EMT
and thereby differ in their ability to promote the neoplastic transformation of
mammary epithelial cells. PLoS One 9, e92254.
Grau, Y., Carteret, C., and Simpson, P. (1984). Mutations and Chromosomal
Rearrangements Affecting the Expression of Snail, a Gene Involved in Embryonic
Patterning in DROSOPHILA MELANOGASTER. Genetics 108, 347-360.
Grego-Bessa, J., Diez, J., Timmerman, L., and de la Pompa, J.L. (2004). Notch and
epithelial-mesenchyme transition in development and tumor progression: another
turn of the screw. Cell Cycle 3, 718-721.
Haines, I.E., and Gabor Miklos, G.L. (2014). Bevacizumab for newly diagnosed
glioblastoma. N Engl J Med 370, 2048.
Han, S.P., Kim, J.H., Han, M.E., Sim, H.E., Kim, K.S., Yoon, S., Baek, S.Y., Kim,
B.S., and Oh, S.O. (2011). SNAI1 is involved in the proliferation and migration of
glioblastoma cells. Cell Mol Neurobiol 31, 489-496.

Literature
97
Hanahan, D., and Weinberg, R.A. (2011). Hallmarks of cancer: the next generation.
Cell 144, 646-674.
Harris, M.A., Yang, H., Low, B.E., Mukherjee, J., Guha, A., Bronson, R.T., Shultz,
L.D., Israel, M.A., and Yun, K. (2008). Cancer stem cells are enriched in the side
population cells in a mouse model of glioma. Cancer Res 68, 10051-10059.
Heddleston, J.M., Li, Z., McLendon, R.E., Hjelmeland, A.B., and Rich, J.N. (2009).
The hypoxic microenvironment maintains glioblastoma stem cells and promotes
reprogramming towards a cancer stem cell phenotype. Cell Cycle 8, 3274-3284.
Herranz, N., Pasini, D., Diaz, V.M., Franci, C., Gutierrez, A., Dave, N., Escriva, M.,
Hernandez-Munoz, I., Di Croce, L., Helin, K., et al. (2008). Polycomb complex 2 is
required for E-cadherin repression by the Snail1 transcription factor. Mol Cell Biol 28,
4772-4781.
Hitoshi, S., Alexson, T., Tropepe, V., Donoviel, D., Elia, A.J., Nye, J.S., Conlon, R.A.,
Mak, T.W., Bernstein, A., and van der Kooy, D. (2002). Notch pathway molecules are
essential for the maintenance, but not the generation, of mammalian neural stem
cells. Genes Dev 16, 846-858.
Hjelmeland, A.B., Wu, Q., Heddleston, J.M., Choudhary, G.S., MacSwords, J.,
Lathia, J.D., McLendon, R., Lindner, D., Sloan, A., and Rich, J.N. (2011). Acidic
stress promotes a glioma stem cell phenotype. Cell Death Differ 18, 829-840.
Hou, Z., Peng, H., Ayyanathan, K., Yan, K.P., Langer, E.M., Longmore, G.D., and
Rauscher, F.J., 3rd (2008). The LIM protein AJUBA recruits protein arginine
methyltransferase 5 to mediate SNAIL-dependent transcriptional repression. Mol Cell
Biol 28, 3198-3207.
Hynes, R.O. (2002). Integrins: bidirectional, allosteric signaling machines. Cell 110,
673-687.
Ikushima, H., Todo, T., Ino, Y., Takahashi, M., Miyazawa, K., and Miyazono, K.
(2009). Autocrine TGF-beta signaling maintains tumorigenicity of glioma-initiating
cells through Sry-related HMG-box factors. Cell Stem Cell 5, 504-514.
Jakowlew, S.B. (2006). Transforming growth factor-beta in cancer and metastasis.
Cancer Metastasis Rev 25, 435-457.
Janda, E., Lehmann, K., Killisch, I., Jechlinger, M., Herzig, M., Downward, J., Beug,
H., and Grunert, S. (2002). Ras and TGF[beta] cooperatively regulate epithelial cell
plasticity and metastasis: dissection of Ras signaling pathways. J Cell Biol 156, 299-
313.
Jin, X., Yin, J., Kim, S.H., Sohn, Y.W., Beck, S., Lim, Y.C., Nam, D.H., Choi, Y.J., and
Kim, H. (2011). EGFR-AKT-Smad signaling promotes formation of glioma stem-like

Literature
98
cells and tumor angiogenesis by ID3-driven cytokine induction. Cancer Res 71, 7125-
7134.
Joseph, J.V., Conroy, S., Pavlov, K., Sontakke, P., Tomar, T., Eggens-Meijer, E.,
Balasubramaniyan, V., Wagemakers, M., den Dunnen, W.F., and Kruyt, F.A. (2015).
Hypoxia enhances migration and invasion in glioblastoma by promoting a
mesenchymal shift mediated by the HIF1alpha-ZEB1 axis. Cancer Lett 359, 107-116.
Julien, S., Puig, I., Caretti, E., Bonaventure, J., Nelles, L., van Roy, F., Dargemont,
C., de Herreros, A.G., Bellacosa, A., and Larue, L. (2007). Activation of NF-kappaB
by Akt upregulates Snail expression and induces epithelium mesenchyme transition.
Oncogene 26, 7445-7456.
Kalluri, R., and Weinberg, R.A. (2009). The basics of epithelial-mesenchymal
transition. J Clin Invest 119, 1420-1428.
Kang, Y., and Massague, J. (2004). Epithelial-mesenchymal transitions: twist in
development and metastasis. Cell 118, 277-279.
Kaufhold, S., and Bonavida, B. (2014). Central role of Snail1 in the regulation of EMT
and resistance in cancer: a target for therapeutic intervention. J Exp Clin Cancer Res
33, 62.
Kaur, H., Phillips-Mason, P.J., Burden-Gulley, S.M., Kerstetter-Fogle, A.E., Basilion,
J.P., Sloan, A.E., and Brady-Kalnay, S.M. (2012). Cadherin-11, a marker of the
mesenchymal phenotype, regulates glioblastoma cell migration and survival in vivo.
Mol Cancer Res 10, 293-304.
Kim, K., Lu, Z., and Hay, E.D. (2002). Direct evidence for a role of beta-catenin/LEF-
1 signaling pathway in induction of EMT. Cell Biol Int 26, 463-476.
Kondo, M., Wagers, A.J., Manz, M.G., Prohaska, S.S., Scherer, D.C., Beilhack, G.F.,
Shizuru, J.A., and Weissman, I.L. (2003). Biology of hematopoietic stem cells and
progenitors: implications for clinical application. Annu Rev Immunol 21, 759-806.
Korpal, M., Lee, E.S., Hu, G., and Kang, Y. (2008). The miR-200 family inhibits
epithelial-mesenchymal transition and cancer cell migration by direct targeting of E-
cadherin transcriptional repressors ZEB1 and ZEB2. J Biol Chem 283, 14910-14914.
Lapidot, T., Sirard, C., Vormoor, J., Murdoch, B., Hoang, T., Caceres-Cortes, J.,
Minden, M., Paterson, B., Caligiuri, M.A., and Dick, J.E. (1994). A cell initiating
human acute myeloid leukaemia after transplantation into SCID mice. Nature 367,
645-648.
Lathia, J.D., Gallagher, J., Heddleston, J.M., Wang, J., Eyler, C.E., Macswords, J.,
Wu, Q., Vasanji, A., McLendon, R.E., Hjelmeland, A.B., et al. (2010). Integrin alpha 6
regulates glioblastoma stem cells. Cell Stem Cell 6, 421-432.

Literature
99
Leong, K.G., Niessen, K., Kulic, I., Raouf, A., Eaves, C., Pollet, I., and Karsan, A.
(2007). Jagged1-mediated Notch activation induces epithelial-to-mesenchymal
transition through Slug-induced repression of E-cadherin. J Exp Med 204, 2935-
2948.
Li, Z., Bao, S., Wu, Q., Wang, H., Eyler, C., Sathornsumetee, S., Shi, Q., Cao, Y.,
Lathia, J., McLendon, R.E., et al. (2009). Hypoxia-inducible factors regulate
tumorigenic capacity of glioma stem cells. Cancer Cell 15, 501-513.
Liao, H., Bai, Y., Qiu, S., Zheng, L., Huang, L., Liu, T., Wang, X., Liu, Y., Xu, N., Yan,
X., et al. (2015). MiR-203 downregulation is responsible for chemoresistance in
human glioblastoma by promoting epithelial-mesenchymal transition via SNAI2.
Oncotarget 6, 8914-8928.
Liebner, S., Cattelino, A., Gallini, R., Rudini, N., Iurlaro, M., Piccolo, S., and Dejana,
E. (2004). Beta-catenin is required for endothelial-mesenchymal transformation
during heart cushion development in the mouse. J Cell Biol 166, 359-367.
Lin, Y., Wu, Y., Li, J., Dong, C., Ye, X., Chi, Y.I., Evers, B.M., and Zhou, B.P. (2010).
The SNAG domain of Snail1 functions as a molecular hook for recruiting lysine-
specific demethylase 1. EMBO J 29, 1803-1816.
Liu, L., Salnikov, A.V., Bauer, N., Aleksandrowicz, E., Labsch, S., Nwaeburu, C.,
Mattern, J., Gladkich, J., Schemmer, P., Werner, J., et al. (2014a). Triptolide reverses
hypoxia-induced epithelial-mesenchymal transition and stem-like features in
pancreatic cancer by NF-kappaB downregulation. Int J Cancer 134, 2489-2503.
Liu, Y., Liu, Y., Yan, X., Xu, Y., Luo, F., Ye, J., Yan, H., Yang, X., Huang, X., Zhang,
J., et al. (2014b). HIFs enhance the migratory and neoplastic capacities of
hepatocellular carcinoma cells by promoting EMT. Tumour Biol 35, 8103-8114.
Louis, D.N., Ohgaki, H., Wiestler, O.D., Cavenee, W.K., Burger, P.C., Jouvet, A.,
Scheithauer, B.W., and Kleihues, P. (2007). The 2007 WHO classification of tumours
of the central nervous system. Acta Neuropathol 114, 97-109.
Lu, K.V., Chang, J.P., Parachoniak, C.A., Pandika, M.M., Aghi, M.K., Meyronet, D.,
Isachenko, N., Fouse, S.D., Phillips, J.J., Cheresh, D.A., et al. (2012). VEGF inhibits
tumor cell invasion and mesenchymal transition through a MET/VEGFR2 complex.
Cancer Cell 22, 21-35.
Lu, Z., Ghosh, S., Wang, Z., and Hunter, T. (2003). Downregulation of caveolin-1
function by EGF leads to the loss of E-cadherin, increased transcriptional activity of
beta-catenin, and enhanced tumor cell invasion. Cancer Cell 4, 499-515.
Mahabir, R., Tanino, M., Elmansuri, A., Wang, L., Kimura, T., Itoh, T., Ohba, Y.,
Nishihara, H., Shirato, H., Tsuda, M., et al. (2014). Sustained elevation of Snail
promotes glial-mesenchymal transition after irradiation in malignant glioma. Neuro
Oncol 16, 671-685.

Literature
100
Mahesparan, R., Read, T.A., Lund-Johansen, M., Skaftnesmo, K.O., Bjerkvig, R.,
and Engebraaten, O. (2003). Expression of extracellular matrix components in a
highly infiltrative in vivo glioma model. Acta Neuropathol 105, 49-57.
Mani, S.A., Guo, W., Liao, M.J., Eaton, E.N., Ayyanan, A., Zhou, A.Y., Brooks, M.,
Reinhard, F., Zhang, C.C., Shipitsin, M., et al. (2008). The epithelial-mesenchymal
transition generates cells with properties of stem cells. Cell 133, 704-715.
Massague, J. (2008). TGFbeta in Cancer. Cell 134, 215-230.
Massague, J., and Wotton, D. (2000). Transcriptional control by the TGF-beta/Smad
signaling system. EMBO J 19, 1745-1754.
Meidhof, S., Brabletz, S., Lehmann, W., Preca, B.T., Mock, K., Ruh, M., Schuler, J.,
Berthold, M., Weber, A., Burk, U., et al. (2015). ZEB1-associated drug resistance in
cancer cells is reversed by the class I HDAC inhibitor mocetinostat. EMBO Mol Med
7, 831-847.
Mikheeva, S.A., Mikheev, A.M., Petit, A., Beyer, R., Oxford, R.G., Khorasani, L.,
Maxwell, J.P., Glackin, C.A., Wakimoto, H., Gonzalez-Herrero, I., et al. (2010).
TWIST1 promotes invasion through mesenchymal change in human glioblastoma.
Mol Cancer 9, 194.
Molofsky, A.V., Pardal, R., Iwashita, T., Park, I.K., Clarke, M.F., and Morrison, S.J.
(2003). Bmi-1 dependence distinguishes neural stem cell self-renewal from
progenitor proliferation. Nature 425, 962-967.
Mu, D., Cambier, S., Fjellbirkeland, L., Baron, J.L., Munger, J.S., Kawakatsu, H.,
Sheppard, D., Broaddus, V.C., and Nishimura, S.L. (2002). The integrin
alpha(v)beta8 mediates epithelial homeostasis through MT1-MMP-dependent
activation of TGF-beta1. J Cell Biol 157, 493-507.
Myazono, K. (2009). Transforming growth factor-beta signaling in epithelial-
mesenchymal transition and progression of cancer. Proc Jpn Acad Ser B Phys Biol
Sci 85, 314-323.
Myung, J.K., Choi, S.A., Kim, S.K., Wang, K.C., and Park, S.H. (2014). Snail plays an
oncogenic role in glioblastoma by promoting epithelial mesenchymal transition. Int J
Clin Exp Pathol 7, 1977-1987.
Nagano, O., Murakami, D., Hartmann, D., De Strooper, B., Saftig, P., Iwatsubo, T.,
Nakajima, M., Shinohara, M., and Saya, H. (2004). Cell-matrix interaction via CD44 is
independently regulated by different metalloproteinases activated in response to
extracellular Ca(2+) influx and PKC activation. J Cell Biol 165, 893-902.
Nakada, M., Nakada, S., Demuth, T., Tran, N.L., Hoelzinger, D.B., and Berens, M.E.
(2007). Molecular targets of glioma invasion. Cell Mol Life Sci 64, 458-478.

Literature
101
Nieto, M.A. (2002). The snail superfamily of zinc-finger transcription factors. Nat Rev
Mol Cell Biol 3, 155-166.
Norden, A.D., and Wen, P.Y. (2006). Glioma therapy in adults. Neurologist 12, 279-
292.
Noushmehr, H., Weisenberger, D.J., Diefes, K., Phillips, H.S., Pujara, K., Berman,
B.P., Pan, F., Pelloski, C.E., Sulman, E.P., Bhat, K.P., et al. (2010). Identification of a
CpG island methylator phenotype that defines a distinct subgroup of glioma. Cancer
Cell 17, 510-522.
Nutt, C.L., Mani, D.R., Betensky, R.A., Tamayo, P., Cairncross, J.G., Ladd, C., Pohl,
U., Hartmann, C., McLaughlin, M.E., Batchelor, T.T., et al. (2003). Gene expression-
based classification of malignant gliomas correlates better with survival than
histological classification. Cancer Res 63, 1602-1607.
Ogden, A.T., Waziri, A.E., Lochhead, R.A., Fusco, D., Lopez, K., Ellis, J.A., Kang, J.,
Assanah, M., McKhann, G.M., Sisti, M.B., et al. (2008). Identification of
A2B5+CD133- tumor-initiating cells in adult human gliomas. Neurosurgery 62, 505-
514; discussion 514-505.
Ohgaki, H., and Kleihues, P. (2005). Epidemiology and etiology of gliomas. Acta
Neuropathol 109, 93-108.
Okamoto, I., Kawano, Y., Matsumoto, M., Suga, M., Kaibuchi, K., Ando, M., and
Saya, H. (1999). Regulated CD44 cleavage under the control of protein kinase C,
calcium influx, and the Rho family of small G proteins. J Biol Chem 274, 25525-
25534.
Ouyang, G., Wang, Z., Fang, X., Liu, J., and Yang, C.J. (2010). Molecular signaling
of the epithelial to mesenchymal transition in generating and maintaining cancer stem
cells. Cell Mol Life Sci 67, 2605-2618.
Ozdamar, B., Bose, R., Barrios-Rodiles, M., Wang, H.R., Zhang, Y., and Wrana, J.L.
(2005). Regulation of the polarity protein Par6 by TGFbeta receptors controls
epithelial cell plasticity. Science 307, 1603-1609.
Ozes, O.N., Mayo, L.D., Gustin, J.A., Pfeffer, S.R., Pfeffer, L.M., and Donner, D.B.
(1999). NF-kappaB activation by tumour necrosis factor requires the Akt serine-
threonine kinase. Nature 401, 82-85.
Paez-Ribes, M., Allen, E., Hudock, J., Takeda, T., Okuyama, H., Vinals, F., Inoue,
M., Bergers, G., Hanahan, D., and Casanovas, O. (2009). Antiangiogenic therapy
elicits malignant progression of tumors to increased local invasion and distant
metastasis. Cancer Cell 15, 220-231.

Literature
102
Park, S.M., Gaur, A.B., Lengyel, E., and Peter, M.E. (2008). The miR-200 family
determines the epithelial phenotype of cancer cells by targeting the E-cadherin
repressors ZEB1 and ZEB2. Genes Dev 22, 894-907.
Peinado, H., Ballestar, E., Esteller, M., and Cano, A. (2004). Snail mediates E-
cadherin repression by the recruitment of the Sin3A/histone deacetylase 1
(HDAC1)/HDAC2 complex. Mol Cell Biol 24, 306-319.
Peinado, H., Olmeda, D., and Cano, A. (2007). Snail, Zeb and bHLH factors in
tumour progression: an alliance against the epithelial phenotype? Nat Rev Cancer 7,
415-428.
Peinado, H., Quintanilla, M., and Cano, A. (2003). Transforming growth factor beta-1
induces snail transcription factor in epithelial cell lines: mechanisms for epithelial
mesenchymal transitions. J Biol Chem 278, 21113-21123.
Peiro, S., Escriva, M., Puig, I., Barbera, M.J., Dave, N., Herranz, N., Larriba, M.J.,
Takkunen, M., Franci, C., Munoz, A., et al. (2006). Snail1 transcriptional repressor
binds to its own promoter and controls its expression. Nucleic Acids Res 34, 2077-
2084.
Penuelas, S., Anido, J., Prieto-Sanchez, R.M., Folch, G., Barba, I., Cuartas, I.,
Garcia-Dorado, D., Poca, M.A., Sahuquillo, J., Baselga, J., et al. (2009). TGF-beta
increases glioma-initiating cell self-renewal through the induction of LIF in human
glioblastoma. Cancer Cell 15, 315-327.
Perego, C., Vanoni, C., Massari, S., Raimondi, A., Pola, S., Cattaneo, M.G.,
Francolini, M., Vicentini, L.M., and Pietrini, G. (2002). Invasive behaviour of
glioblastoma cell lines is associated with altered organisation of the cadherin-catenin
adhesion system. J Cell Sci 115, 3331-3340.
Perl, A.K., Wilgenbus, P., Dahl, U., Semb, H., and Christofori, G. (1998). A causal
role for E-cadherin in the transition from adenoma to carcinoma. Nature 392, 190-
193.
Phillips, H.S., Kharbanda, S., Chen, R., Forrest, W.F., Soriano, R.H., Wu, T.D.,
Misra, A., Nigro, J.M., Colman, H., Soroceanu, L., et al. (2006). Molecular subclasses
of high-grade glioma predict prognosis, delineate a pattern of disease progression,
and resemble stages in neurogenesis. Cancer Cell 9, 157-173.
Pietras, A., Hansford, L.M., Johnsson, A.S., Bridges, E., Sjolund, J., Gisselsson, D.,
Rehn, M., Beckman, S., Noguera, R., Navarro, S., et al. (2009). HIF-2alpha maintains
an undifferentiated state in neural crest-like human neuroblastoma tumor-initiating
cells. Proc Natl Acad Sci U S A 106, 16805-16810.
Ping, Y.F., Yao, X.H., Jiang, J.Y., Zhao, L.T., Yu, S.C., Jiang, T., Lin, M.C., Chen,
J.H., Wang, B., Zhang, R., et al. (2011). The chemokine CXCL12 and its receptor

Literature
103
CXCR4 promote glioma stem cell-mediated VEGF production and tumour
angiogenesis via PI3K/AKT signalling. J Pathol 224, 344-354.
Pouyssegur, J., Dayan, F., and Mazure, N.M. (2006). Hypoxia signalling in cancer
and approaches to enforce tumour regression. Nature 441, 437-443.
Pries, A.R., Hopfner, M., le Noble, F., Dewhirst, M.W., and Secomb, T.W. (2010).
The shunt problem: control of functional shunting in normal and tumour vasculature.
Nat Rev Cancer 10, 587-593.
Purow, B.W., Haque, R.M., Noel, M.W., Su, Q., Burdick, M.J., Lee, J., Sundaresan,
T., Pastorino, S., Park, J.K., Mikolaenko, I., et al. (2005). Expression of Notch-1 and
its ligands, Delta-like-1 and Jagged-1, is critical for glioma cell survival and
proliferation. Cancer Res 65, 2353-2363.
Read, T.A., Fogarty, M.P., Markant, S.L., McLendon, R.E., Wei, Z., Ellison, D.W.,
Febbo, P.G., and Wechsler-Reya, R.J. (2009). Identification of CD15 as a marker for
tumor-propagating cells in a mouse model of medulloblastoma. Cancer Cell 15, 135-
147.
Reya, T., Morrison, S.J., Clarke, M.F., and Weissman, I.L. (2001). Stem cells, cancer,
and cancer stem cells. Nature 414, 105-111.
Rickman, D.S., Bobek, M.P., Misek, D.E., Kuick, R., Blaivas, M., Kurnit, D.M., Taylor,
J., and Hanash, S.M. (2001). Distinctive molecular profiles of high-grade and low-
grade gliomas based on oligonucleotide microarray analysis. Cancer Res 61, 6885-
6891.
Romashkova, J.A., and Makarov, S.S. (1999). NF-kappaB is a target of AKT in anti-
apoptotic PDGF signalling. Nature 401, 86-90.
Sahlgren, C., Gustafsson, M.V., Jin, S., Poellinger, L., and Lendahl, U. (2008). Notch
signaling mediates hypoxia-induced tumor cell migration and invasion. Proc Natl
Acad Sci U S A 105, 6392-6397.
Sakisaka, T., and Takai, Y. (2005). Cell adhesion molecules in the CNS. J Cell Sci
118, 5407-5410.
Sasaki, H., Yoshida, K., Ikeda, E., Asou, H., Inaba, M., Otani, M., and Kawase, T.
(1998). Expression of the neural cell adhesion molecule in astrocytic tumors: an
inverse correlation with malignancy. Cancer 82, 1921-1931.
Savary, K., Caglayan, D., Caja, L., Tzavlaki, K., Bin Nayeem, S., Bergstrom, T.,
Jiang, Y., Uhrbom, L., Forsberg-Nilsson, K., Westermark, B., et al. (2013). Snail
depletes the tumorigenic potential of glioblastoma. Oncogene 32, 5409-5420.
Schmalhofer, O., Brabletz, S., and Brabletz, T. (2009). E-cadherin, beta-catenin, and
ZEB1 in malignant progression of cancer. Cancer Metastasis Rev 28, 151-166.

Literature
104
Schulte, J.D., Srikanth, M., Das, S., Zhang, J., Lathia, J.D., Yin, L., Rich, J.N., Olson,
E.C., Kessler, J.A., and Chenn, A. (2013). Cadherin-11 regulates motility in normal
cortical neural precursors and glioblastoma. PLoS One 8, e70962.
Seidel, S., Garvalov, B.K., Wirta, V., von Stechow, L., Schanzer, A., Meletis, K.,
Wolter, M., Sommerlad, D., Henze, A.T., Nister, M., et al. (2010). A hypoxic niche
regulates glioblastoma stem cells through hypoxia inducible factor 2 alpha. Brain 133,
983-995.
Sekiya, S., and Suzuki, A. (2011). Glycogen synthase kinase 3 beta-dependent Snail
degradation directs hepatocyte proliferation in normal liver regeneration. Proc Natl
Acad Sci U S A 108, 11175-11180.
Sell, S. (2004). Stem cell origin of cancer and differentiation therapy. Crit Rev Oncol
Hematol 51, 1-28.
Sell, S. (2006). Potential gene therapy strategies for cancer stem cells. Curr Gene
Ther 6, 579-591.
Sell, S., and Pierce, G.B. (1994). Maturation arrest of stem cell differentiation is a
common pathway for the cellular origin of teratocarcinomas and epithelial cancers.
Lab Invest 70, 6-22.
Shaikh, D., Zhou, Q., Chen, T., Ibe, J.C., Raj, J.U., and Zhou, G. (2012). cAMP-
dependent protein kinase is essential for hypoxia-mediated epithelial-mesenchymal
transition, migration, and invasion in lung cancer cells. Cell Signal 24, 2396-2406.
Shen, Q., Goderie, S.K., Jin, L., Karanth, N., Sun, Y., Abramova, N., Vincent, P.,
Pumiglia, K., and Temple, S. (2004). Endothelial cells stimulate self-renewal and
expand neurogenesis of neural stem cells. Science 304, 1338-1340.
Shimono, Y., Zabala, M., Cho, R.W., Lobo, N., Dalerba, P., Qian, D., Diehn, M., Liu,
H., Panula, S.P., Chiao, E., et al. (2009). Downregulation of miRNA-200c links breast
cancer stem cells with normal stem cells. Cell 138, 592-603.
Siebzehnrubl, F.A., Silver, D.J., Tugertimur, B., Deleyrolle, L.P., Siebzehnrubl, D.,
Sarkisian, M.R., Devers, K.G., Yachnis, A.T., Kupper, M.D., Neal, D., et al. (2013).
The ZEB1 pathway links glioblastoma initiation, invasion and chemoresistance.
EMBO Mol Med 5, 1196-1212.
Siegel, P.M., and Massague, J. (2003). Cytostatic and apoptotic actions of TGF-beta
in homeostasis and cancer. Nat Rev Cancer 3, 807-821.
Singh, S.K., Clarke, I.D., Terasaki, M., Bonn, V.E., Hawkins, C., Squire, J., and Dirks,
P.B. (2003). Identification of a cancer stem cell in human brain tumors. Cancer Res
63, 5821-5828.
Soeda, A., Park, M., Lee, D., Mintz, A., Androutsellis-Theotokis, A., McKay, R.D.,
Engh, J., Iwama, T., Kunisada, T., Kassam, A.B., et al. (2009). Hypoxia promotes

Literature
105
expansion of the CD133-positive glioma stem cells through activation of HIF-1alpha.
Oncogene 28, 3949-3959.
Son, M.J., Woolard, K., Nam, D.H., Lee, J., and Fine, H.A. (2009). SSEA-1 is an
enrichment marker for tumor-initiating cells in human glioblastoma. Cell Stem Cell 4,
440-452.
Spaderna, S., Schmalhofer, O., Hlubek, F., Berx, G., Eger, A., Merkel, S., Jung, A.,
Kirchner, T., and Brabletz, T. (2006). A transient, EMT-linked loss of basement
membranes indicates metastasis and poor survival in colorectal cancer.
Gastroenterology 131, 830-840.
Sturm, D., Witt, H., Hovestadt, V., Khuong-Quang, D.A., Jones, D.T., Konermann, C.,
Pfaff, E., Tonjes, M., Sill, M., Bender, S., et al. (2012). Hotspot mutations in H3F3A
and IDH1 define distinct epigenetic and biological subgroups of glioblastoma. Cancer
Cell 22, 425-437.
Subramanian, A., Harris, A., Piggott, K., Shieff, C., and Bradford, R. (2002).
Metastasis to and from the central nervous system--the 'relatively protected site'.
Lancet Oncol 3, 498-507.
Sullivan, D.E., Ferris, M., Nguyen, H., Abboud, E., and Brody, A.R. (2009). TNF-
alpha induces TGF-beta1 expression in lung fibroblasts at the transcriptional level via
AP-1 activation. J Cell Mol Med 13, 1866-1876.
Thiery, J.P. (2002). Epithelial-mesenchymal transitions in tumour progression. Nat
Rev Cancer 2, 442-454.
Thiery, J.P. (2003). Epithelial-mesenchymal transitions in development and
pathologies. Curr Opin Cell Biol 15, 740-746.
Thiery, J.P., Acloque, H., Huang, R.Y., and Nieto, M.A. (2009). Epithelial-
mesenchymal transitions in development and disease. Cell 139, 871-890.
Thuault, S., Valcourt, U., Petersen, M., Manfioletti, G., Heldin, C.H., and Moustakas,
A. (2006). Transforming growth factor-beta employs HMGA2 to elicit epithelial-
mesenchymal transition. J Cell Biol 174, 175-183.
Toyota, M., Ahuja, N., Suzuki, H., Itoh, F., Ohe-Toyota, M., Imai, K., Baylin, S.B., and
Issa, J.P. (1999). Aberrant methylation in gastric cancer associated with the CpG
island methylator phenotype. Cancer Res 59, 5438-5442.
Trepant, A.L., Bouchart, C., Rorive, S., Sauvage, S., Decaestecker, C., Demetter, P.,
and Salmon, I. (2015). Identification of OLIG2 as the most specific glioblastoma stem
cell marker starting from comparative analysis of data from similar DNA chip
microarray platforms. Tumour Biol 36, 1943-1953.
van den Boom, J., Wolter, M., Kuick, R., Misek, D.E., Youkilis, A.S., Wechsler, D.S.,
Sommer, C., Reifenberger, G., and Hanash, S.M. (2003). Characterization of gene

Literature
106
expression profiles associated with glioma progression using oligonucleotide-based
microarray analysis and real-time reverse transcription-polymerase chain reaction.
Am J Pathol 163, 1033-1043.
Venere, M., Fine, H.A., Dirks, P.B., and Rich, J.N. (2011). Cancer stem cells in
gliomas: identifying and understanding the apex cell in cancer's hierarchy. Glia 59,
1148-1154.
Verhaak, R.G., Hoadley, K.A., Purdom, E., Wang, V., Qi, Y., Wilkerson, M.D., Miller,
C.R., Ding, L., Golub, T., Mesirov, J.P., et al. (2010). Integrated genomic analysis
identifies clinically relevant subtypes of glioblastoma characterized by abnormalities
in PDGFRA, IDH1, EGFR, and NF1. Cancer Cell 17, 98-110.
Vinas-Castells, R., Beltran, M., Valls, G., Gomez, I., Garcia, J.M., Montserrat-Sentis,
B., Baulida, J., Bonilla, F., de Herreros, A.G., and Diaz, V.M. (2010). The hypoxia-
controlled FBXL14 ubiquitin ligase targets SNAIL1 for proteasome degradation. J Biol
Chem 285, 3794-3805.
Visvader, J.E., and Lindeman, G.J. (2008). Cancer stem cells in solid tumours:
accumulating evidence and unresolved questions. Nat Rev Cancer 8, 755-768.
Visvader, J.E., and Lindeman, G.J. (2012). Cancer stem cells: current status and
evolving complexities. Cell Stem Cell 10, 717-728.
Wellner, U., Schubert, J., Burk, U.C., Schmalhofer, O., Zhu, F., Sonntag, A.,
Waldvogel, B., Vannier, C., Darling, D., zur Hausen, A., et al. (2009). The EMT-
activator ZEB1 promotes tumorigenicity by repressing stemness-inhibiting
microRNAs. Nat Cell Biol 11, 1487-1495.
Wen, P.Y., and Kesari, S. (2008). Malignant gliomas in adults. N Engl J Med 359,
492-507.
Wenk, M.B., Midwood, K.S., and Schwarzbauer, J.E. (2000). Tenascin-C suppresses
Rho activation. J Cell Biol 150, 913-920.
Wicha, M.S., Liu, S., and Dontu, G. (2006). Cancer stem cells: an old idea--a
paradigm shift. Cancer Res 66, 1883-1890; discussion 1895-1886.
Wipff, P.J., Rifkin, D.B., Meister, J.J., and Hinz, B. (2007). Myofibroblast contraction
activates latent TGF-beta1 from the extracellular matrix. J Cell Biol 179, 1311-1323.
Wu, Y., Deng, J., Rychahou, P.G., Qiu, S., Evers, B.M., and Zhou, B.P. (2009a).
Stabilization of snail by NF-kappaB is required for inflammation-induced cell
migration and invasion. Cancer Cell 15, 416-428.
Wu, Y., Evers, B.M., and Zhou, B.P. (2009b). Small C-terminal domain phosphatase
enhances snail activity through dephosphorylation. J Biol Chem 284, 640-648.

Literature
107
Yang, H.W., Menon, L.G., Black, P.M., Carroll, R.S., and Johnson, M.D. (2010).
SNAI2/Slug promotes growth and invasion in human gliomas. BMC Cancer 10, 301.
Yang, Z., Rayala, S., Nguyen, D., Vadlamudi, R.K., Chen, S., and Kumar, R. (2005).
Pak1 phosphorylation of snail, a master regulator of epithelial-to-mesenchyme
transition, modulates snail's subcellular localization and functions. Cancer Res 65,
3179-3184.
Yilmaz, M., and Christofori, G. (2009). EMT, the cytoskeleton, and cancer cell
invasion. Cancer Metastasis Rev 28, 15-33.
Yook, J.I., Li, X.Y., Ota, I., Fearon, E.R., and Weiss, S.J. (2005). Wnt-dependent
regulation of the E-cadherin repressor snail. J Biol Chem 280, 11740-11748.
Zheng, H., Shen, M., Zha, Y.L., Li, W., Wei, Y., Blanco, M.A., Ren, G., Zhou, T.,
Storz, P., Wang, H.Y., et al. (2014). PKD1 phosphorylation-dependent degradation of
SNAIL by SCF-FBXO11 regulates epithelial-mesenchymal transition and metastasis.
Cancer Cell 26, 358-373.
Zhou, B.P., Deng, J., Xia, W., Xu, J., Li, Y.M., Gunduz, M., and Hung, M.C. (2004).
Dual regulation of Snail by GSK-3beta-mediated phosphorylation in control of
epithelial-mesenchymal transition. Nat Cell Biol 6, 931-940.
Zhou, B.P., Hu, M.C., Miller, S.A., Yu, Z., Xia, W., Lin, S.Y., and Hung, M.C. (2000).
HER-2/neu blocks tumor necrosis factor-induced apoptosis via the Akt/NF-kappaB
pathway. J Biol Chem 275, 8027-8031.
Zhou, Y., Wu, S., Liang, C., Lin, Y., Zou, Y., Li, K., Lu, B., Shu, M., Huang, Y., Zhu,
W., et al. (2015). Transcriptional upregulation of microtubule-associated protein 2 is
involved in the protein kinase A-induced decrease in the invasiveness of glioma cells.
Neuro Oncol.

Index of Figures and Tables
108
Index of Figures and Tables
3. Introduction
Table 3.1 Examples of grade I-IV gliomas, based on the WHO classification of
tumours of the central nervous system p.5
Fig. 3.2 Schematic illustration of the principle mechanisms of glioma invasion p.9
Fig. 3.3 Schematic illustration of EMT p.12
Fig. 3.4 Regulation of Snail expression p.17
Fig. 3.5 Regulatory elements in the SNAI1 promoter p.18
Fig. 3.6 Localisation and stabilisation of Snail p.19
Fig. 3.7 Schematic illustration of the cancer stem cell model p.20
Fig. 3.8 Schematic model of CSC maintenance by EMT p.24
4. Results
Fig. 4.1 SNAI1 and SNAI2 are overexpressed in the mesenchymal glioblastoma
subtype p.26
Fig. 4.2 Hypoxic induction of Snail p.27
Fig. 4.3 Regulation of Snail and Slug expression and induction of GMT by
environmental signals p.28
Fig. 4.4 The loss of Snail and Slug does not impair the expression of the classical
EMT markers N-cadherin and vimentin p.29
Fig. 4.5 Expression of GMT markers in glioma molecular subgroups p.30
Fig. 4.6 The loss of Snail and Slug inhibits a complete glial to mesenchymal
transition p.32

Index of Figures and Tables
109
Fig. 4.7 The loss of Snail and Slug impairs the mRNA expression of GMT
markers p.33
Fig. 4.8 Snail and Slug influence the expression of CSC markers p.34
Fig. 4.9 Snail and Slug control the self-renewal ability of glioma cells p.35
Fig. 4.10 The loss of Snail and Slug does not affect apoptosis and proliferation in
vitro p.36
Fig. 4.11 The loss of Snail and Slug impairs the invasiveness of glioblastoma cells
through matrigel p.37
Fig. 4.12 Snail and Slug deficiency reduces the ability of glioblastoma cells to invade
into collagen p.39
Fig. 4.13 Snail and Slug deficiency reduces intracranial glioma growth p.40
Fig. 4.14 The loss of Snail and Slug does not impair apoptosis of tumour cells p.42
Fig. 4.15 The loss of Snail and Slug does not impair proliferation of tumour cells p.43
Fig. 4.16 The loss of Snail and Slug does not impair vascularisation of the
tumour p.44
Fig. 4.17 The invasiveness of cancer cells in vivo is significantly reduced by silencing
Snail and Slug p.45
5. Discussion
Fig. 5.1 Chemical inhibitors of Snail-induced EMT p.61
Fig. 5.2 Graphical summary p.62
6. Materials and Methods
Table 6.1 Antibiotics for selection of bacterial cells p.63
Table 6.2 Antibiotics for selection of mammalian cells p.63

Index of Figures and Tables
110
Table 6.3 Primary antibodies for western blot p.63
Table 6.4 Primary antibodies for stainings p.64
Table 6.5 Secondary antibodies p.65
Table 6.6 Generated knock.down pools p.66
Table 6.7 Growth factors p.69
Table 6.8 Routinely used qPCR program p.75

Abbreviations
111
Abbreviations
° C: degree Celsius
µg: microgram
µl: microlitre
µm: micrometre
A2B5: antigen
ADAM: a disintegrin and metalloproteinase
APS: ammoniumpersulfate
ASPHD2: aspartate beta-hydroxylase domain containing 2
BMP7: bone morphogenic protein 7
BrdU: bromodeoxyuridine
BTSC: brain tumour stem cell
C/EBP-β/ δ: CAAT enhancer binding protein
CD133: prominin 1 glycoprotein
CD15: 3-fucosyl-N-acetyl-lactosamine antigen cluster
CD24: cluster of differentiation 24 antigen
CD44: cell surface glycoprotein
CDKN2A: cyclin-dependent kinase inhibitor 2A
CNS: central nervous system
Co: control
coREST: co-repressor of REST (RE1-Silencing Transcription factor)
CPS: cryo-protection solution
CRISPR/Cas9: clustered regularly interspaced short palindromic repeats/caspase 9
CSC: cancer stem cell
CXCR4: CXC-motif chemokine receptor 4
DAPI: 4′,6-Diamidin-2-phenylindol
DEPC: di-ethylpyrocarbonate
DKFZ: Deutsches Krebsforschungszentrum

Abbreviations
112
DLL3: Notch ligand delta like 3
DNA: deoxyribonucleic acid
E-cadherin: epithelial cadherin
ECM: extracellular matrix
EGF: epidermal growth factor
EGFR: epidermal growth factor receptor
EMT: epithelial to mesenchymal transition
FACS: fluorescence activated cell sorting
FBXL14: F-box protein 14
FCS: fetal calf serum
FGF: fibroblast growth factor
g: gram
G34: glycine 34
GABA: gamma-aminobutyric acid
GABRA1: gamma-aminobutyric acid receptor A 1
GBM: glioblastoma multiforme
G-CIMP: CpG-island methylator phenotype
GFP/eGFP: (enhanced) green fluorescence protein
GMT: glial to mesenchymal transition
GSK3β: glycogen synthase kinase 3 beta
h: hour
H&E: haematoxylin and eosin
H3F3A: histone 3 family 3A
HBS: HEPES buffered saline
HDAC: histone deacetylase
HEY1: Hes-related family BHLH transcription factor with YRPW motif 1
HGF: hepatocyte growth factor
HIF: hypoxia inducible factor
Id1: DNA-binding protein inhibitor
IDH1: isocitrate dehydrogenase

Abbreviations
113
IgG: immunoglobulin G
IKKα: IκB (inhibitor of kappa B) kinase α
IL: interleukin
JNK: c-Jun N-terminal kinase
K27: lysine 27
l: litre
LB: Luria-Bertani
LOX: lysyl oxidase
LSD: lysine specific demethylase
LTBP: latent TGFβ-binding proteins
M: molar
MAML3: mastermind-like protein 3
MAP2: microtubule associated protein 2
Mes: mesenchymal
mg: milligram
min: minute
miRNA: micro ribonucleic acid
ml: milliltre
mm: millimetre
mM: millimolar
MMP: matrix metalloproteinase
MOI: multiplicity of infection
MRI: magnetic resonance imaging
mRNA: messenger ribonucleic acid
N-cadherin: neural cadherin
NCAM: neural cell adhesion molecule 1
NEFL: neurofilament, light polypeptide
NES: nuclear export sequence
NF1: neurofibromin 1
NFATc2: nuclear factor of activated T cells 2

Abbreviations
114
NF-κB: nuclear factor kappa B
ng: nanogram
nm: nanometre
Oct4: octamer-binding transcription factor 4
Olig2: oligodendroglial marker 2
p53 or TP53: cellular tumour antigen p53
PAK1: p21 activated kinase 1
PB: phosphate buffer
PBS: phosphate buffered saline
PCAM1: Platelet endothelial cell adhesion molecule
PCNA: proliferating cell nuclear antigen
PCR: polymerase chain reaction
PDGF: platelet derived growth factor
PDGFRA: platelet derived growth factor receptor A
PFA: paraformaldehyde
PI3K-Akt: Phosphatidylinositol 3-kinase-Akt pathway
PKD1 polycystin 1
PN: proneural
PRC2: polycomb repressor complex 2
PRMT5: protein Arginine Methyltransferase 5
Prolif: proliferative
PTEN: phosphatase and tensin homologue
q-RT PCR: quantitative real time polymerase chain reaction
Ras/ERK: rat sarcoma G-protein/Extracellular Signal-regulated Kinase-1 pathway
RAS-MAPK: rat sarcoma G-protein/ Mitogen-activated protein kinases
RB: retinoblastoma protein
RNA: ribonucleic acid
RT: room temperature
RTK: receptor tyrosine kinase
sec: second

Abbreviations
115
Ser-10: serine 10
SFU: sphere forming units
shRNA: short hairpin ribonucleic acid
SLC12A5: potassium/chloride transporter
SNAG: Snail/Gfi domain
Sox2: sex determining region Y-box 2
SRD: serine rich domain
STAT3: signal transducer and activator of transcription 3
SVZ: subventricular zome
SYT1: synaptotagmin I
TCGA: The Cancer Genome Atlas
TGFβ1: transforming growth factor β1
TNFα: tumour necrosis factor alpha
TOP2A: topoisomerase 2A
TU: transducing units
TUNEL: TdT mediated dUTP-biotin nick end labelling
uPA: urokinase-type plasminogene activator
uPAR: urokinase-type plasminogene activator receptor
VEGF: vascular endothelial growth factor
VHL: von Hippel-Lindau
WHO: world health organisation
Wnt: wingless gene from drosophila melanogaster
YKL40: human chitinase 3 like
ZEB: Zinc finger E-box binding homeobox 1
β-TrCP: beta-transducin repeat containing protein

Acknowledgements
116
Acknowledgements
First of all I would like to thank Prof. Till Acker for giving me this interesting Ph.D.-
project and the opportunity to work in his institute. Thank you and the head of the
research lab Dr. Boyan Garvalov for the excellent guidance, helpful discussions and
overall support.
Thanks also to the Ph.D. program of the veterinary medical and human medical
faculty to include me into the program. As well I would like to thank the GGL (Giessen
Graduate School for the Life Sciences) for giving me excellent training, good support
and motivation.
A very important support was also the encouragement and assistance of all current
and former members of the Institute for Neuropathology in Giessen. THANK YOU
Sabine, Annette, Marion, Conny, Anne, Nuray, Sascha, Manuela, Miao, Alina and
Omelyan (especially for the help with the animal experiments). It is indescribable how
much it means to have colleagues who support you, who share happiness and anger
or desperation with you. I will never forget all of you!
Natürlich möchte ich auch meiner Familie und Benny danken, die mich immer in
jeglicher Form unerlässlich unterstützen. Vielen, vielen Dank dafür!

Der Lebenslauf wurde aus der elektronischen Version der Arbeit entfernt.
The curriculum vitae was removed from the electronic version of the paper.