Embed Size (px)
Citation preview

The Role of the Medical Director in
Quality Assurance Performance
Improvement
Verna Sellers, MD, MPH, CMD, AGSFMedical Director
Centra PACELynchburg, Virginia
1

Speaker Disclosures:
Dr. Sellers
has disclosed that she has no relevant financial relationship(s).

Role
Definition:
The set of behaviors an organizational member is expected to perform and that he/she feels obligated to perform.
4

Objectives
1.Know the PACE regulations related to Quality
Assurance Performance Improvement (QAPI)
2.Describe the role of the medical director in
the design, implementation and the
monitoring of QAPI.
3.Discuss the Basic Principles of Quality
5

PACE Medical Director
42 CFR Part 460 states:
“The Organization must employ or contract with in accordance with 460.70 a medical director who is responsible for the delivery of participant care, clinical outcomes and the implementation as well as oversight of the quality assurance and performance improvement program.”
6

PACE QAPI Coordinator
The QAPI coordinator would be responsible for day-to-day quality issues, collecting data, analyzing data, detecting trends, coordinating IDT members, PACE staff, and contract providers in planning QAPI activities, disseminating reports on activities to them, and compiling comments related to participant/caregiver satisfaction and concerns.
7

Programs of All-Inclusive Care for the Elderly (PACE)
Chapter 10 – Quality Assessment and Performance Improvement
(Rev. 2, Issued: 06-09-11)
20 - QAPI Program(Rev. 2, Issued: 06-09-11; Effective: 06-03-11;
Implementation: 06-03-11)
The PACE organization must develop, implement, maintain, and evaluate an effective data-driven QAPI program.
8

Definitions• Quality Assurance addresses primarily
negative outcomes
• Performance Improvement seek opportunities to improve care by improving upon satisfactory outcomes
• Continuous Quality Improvement builds on previous improvements and uses a systematic process including data analysis to enhance performance
9
American Board of Quality Assurance and Utilization Review Physicians, Inc.

Quality Management:
Definition
• Organizational activities designed to:– Continually improve performance and productivity
levels.
– Improve the efficiency and predictability of the care process.
– Reduce unnecessary care and waste.
– Contain costs.
– Improve patient outcomes and quality of life.
--Dimant
10

The Big Picture
• Group of related interdependent processes working together to achieve a common goal
• Made up of a culture, structure and boundarySystem
• Sequence of tasks aimed at accomplishing a goal
• Produce data which can be analyzedProcess
• Have beliefs, values, interests, needs
• Have roles which are made up of functions and tasks
People
11

20.3 - Internal QAPI Activities
PACE organizations must use a set of outcome measures to identify areas of good or problematic performance and take actions targeted at maintaining or improving care based on these outcome measures. CMS expects PACE organizations to use the most current clinical practice guidelines and professional standards in the development of outcome measures applicable to the care of PACE participants.
(Rev. 2, Issued: 06-09-11; Effective: 06-03-11; Implementation: 06-03-11)
12

First Step: Select performance goals
• Census Growth
• End of life care
• Grievances
• Appeals
• Participant satisfaction
• Effectiveness of contract services
• Promptness of service delivery
13

Second Step: define success
• Routine Immunizations • Grievances and Appeals; • Enrollments; • Dis-enrollments; • Prospective Enrollees; • Readmissions; • Emergency (Unscheduled) Care; • Unusual Incidents; and, • Deaths.
14

15
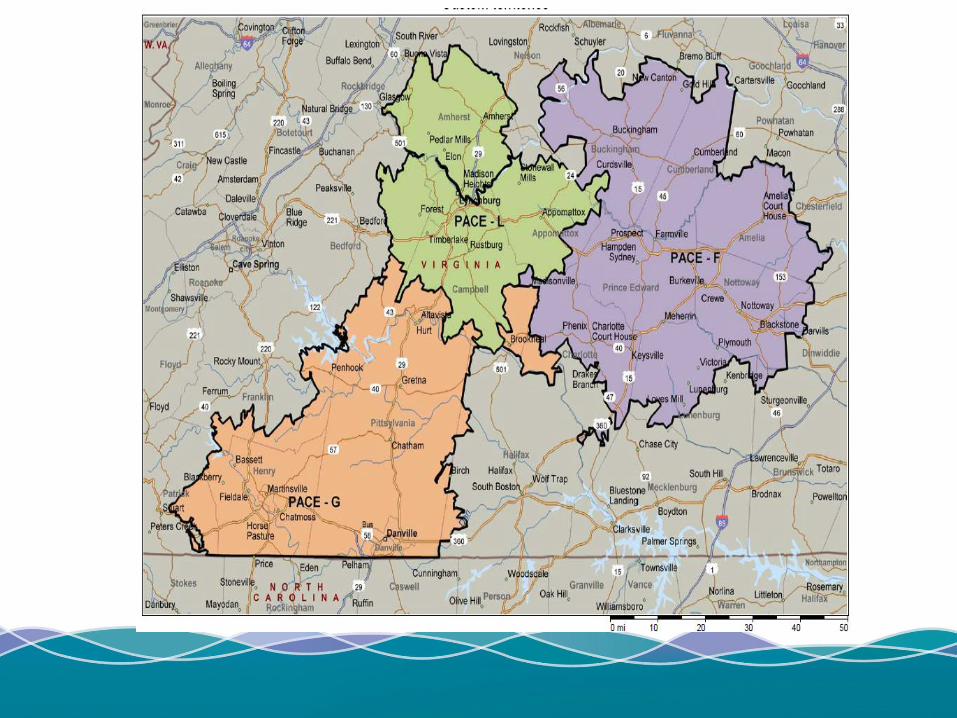
Spark Lines
Infection Control Target Dec'14 YTD Infection Rate Jan'12 to Dec'14
UTI ≤2 3 26
Infections per 1000 participant days 0.34 0.62 0.21
16

Seven Basis Principles of Quality
17
Focus on Mission
Continuous Improvement
Focus on Processes & Systems
Empower Front-Line
Maintain Strong Partnerships
Leadership Commitment
Focus on Data
Schamp, R: NPA Medical Director’s Handbook

Continuous Improvement
18
Step 1 Understand the Process
Step 2 Identify the
Problem
Step 3 Attend to
the Problem
Step 4 Course of
Action
Step 5 Monitoring & Feedback

The Model for Continuous Improvement - PDCA
START
Plan
Do
Check
Act
19

Quality Improvement
• Beyond “projects” to an integrated strategy.
– Quality and continual improvement need to be a formal part of every PACE organization
– Executive commitment to quality.
– Can not overlook the cultural/psychological issues of quality improvement.
• Medical Director can not do this alone.
20

Empowering Front Line Staff

Participant Assessments
Physiological and clinical well-being
Functional status
Cognitive functioning
Emotional/mental health status
Effectiveness and safety of staff-provided and contract-provided services
Centra PACE QAPI Plan 2016
22

23


25
Root Cause Analysis
• Fishbone Diagrams
• Show the causes of a certain event.
A Fishbone or Ishikawa diagram
can be useful to break down (in
successive layers of detail) root
causes that potentially contribute to
a particular effect.
25

Plan CheckCurrent Metrics
December, 2014
Goals:
2014 FMV Rate: 2.6% per month
2014 LYN Rate: 2.1% per month
Team Members
Dawn Stanley, FMV Int Ctr Mgr Kendra Kerr, Int LYN Ctr Mgr
Renee Gilliam, FMV Clinic Coord Jenny Link, LYN Clinic Coord,
Cassandra Hurt, FMV HCC Carol Arthur,LYN HCC
Meagan Waller, FMV Dietician Brenda Meredith, LYN Dietician
Verna Sellers, MD Kimberly Woodley, Facilitator
Chrissette Brooks, Outcomes Specialist
Do● Revise nutrition criteria for Risk Assessment Tool: Brenda/Meagan
● Update Risk Assessment Tool and distribute: Kimbelry
● Trial Tool in January for all semi-annual & annual assessmetns at both sites:
Renee & Jenny
● Analyze results: Kimberly
ACT:● Determine if Risk Assessment tool is Adequate.
○ Needs revision?
○ Second trial to confirm usefulness?
● Determine scoring
● Deveiop interventions for each risk level
Pressure Ulcer Reduction
Mission Statement: Reduce the percertange of participants, who acquire any
pressure ulcer after enrollment into the PACE program or a pressure ulcer that
is present upon enrollment worsens. This rate includes all pressure ulcers
regardless of the location or stage when it is initially identified.
2015 Goal is to reduce the Centra rate to ≤ 1.5% of PACE participants will
acquire a pressure ulcer in any given month or have a pressure ulcer present on
admission worsen. This is a stretch goal.
SENSORY PERCEPTION
ability to respond meaningfully
to pressure- related discomfort
1.Comple te ly Limite d
● Unresponsive (does not moan flinch or
grasp to painful stimuli due to diminished
level of consciousness or sedation
OR
● Limited ability to feel pain over most of
body
2 . Ve ry Limite d
● Responds only to painful stimuli. Cannot
communicate discomfort except by
moaning or restlessness
OR
● Has a sensory impairment which limits
the ability to feel pain or discomfort.
3 . S lightly Limite d
● Responds to verbal commands but
cannot always communicate discomfort
or the need to be turned.
OR
● Has some sensory impairment which
limits the ability to feel pain or discomfort
in 1 or 2 extremities.
4 . No Impa irme nt
● Responds to verbal commands. Has no
sensory defic it which would limit ability to
feel or voice pain or discomfort.
COGNITIVE IMPAIRMENT 1.La te , Se ve re Impa irme nt
● Nearly unintelligible verbal output
● Remote memory gone
● Unable to copy or write
● No longer grooming or dressing
● Motor or verbal agitation
● MMSE 0 to 10
2 . Middle , Mode ra te Cognitive
Impa irme nt
● Disoriented to date, place
● Comprehension difficulties (aphasia)
● Impaired new learning
● Getting lost in familiar places
● Delusions, agitation, aggression
● MMSE 11 to 20
3 . Ea rly, Mild Cognitive Impa irme nt
● Disoriented to date
● Naming difficulties (anomia)
● Recent recall problems
● Mild difficulty copying figures
● Decreased insight
● Problems managing finances
● MMSE 21 to 25
4 . Mild Cognitive Impa irme nt
●Report by patient or caregiver of memory
loss
● Objective signs of memory impairment.
● Mild construction, language, or
executive dysfunction.
● MMSE 26 to 30
MOISTURE
degree to which skin is exposed
to moisture (include feet)
1. Inc ontine nt of Bla dde r a nd/or
Bowe l
● R equires changing every two hours.
2 . Ve ry Moist
●Skin is often moist.
●Incontinent at times
●Requires assistance changing
●BMI ≥ 40 w/ multiple skin folds
3 . Oc c a siona lly moist.
● Skin is occasionally moist.
● Some skin folds
● Moisture between toes
4 . Contine nt of bla dde r a nd bowe l
● Toilet self OR
● Able to change self w/o assistance
ACTIVITY
degree of physical activity
1. Be dfa st
● Confined to bed.
2 . Cha irfa st
●Ability to walk severely limited or non-
existent.
● Cannot bear own weight and/or must be
assisted into chair or wheelchair.
3 . Wa lks Oc c a siona lly
●Walks occasionally during day but for
very short distances with or without
assistance.
●Spends majority of time in bed or in
chair.
4 . Wa lks Fre que ntly
● Walks at least once every two hours
during waking hours.
MOBILITY
ability to change and control
body position
1. Immobile
● Does not make purposeful movement
OR
● Inability to change position without
assistance.
2 . Ve ry Limite d
● Makes occasional changes in body or
extremity position but unable to make
consistent or frequent or significant
changes independently.
3 . S lightly Limite d
● Makes frequent though slight changes
in body or extremity position indecently.
4 . No Limita tion
●Makes major and frequent changes in
position without assistance.
NUTRITIONNutrition risk assessment w ill be
assessed by RD in semiannual/ annual
assessment. Rated on a scale of 1-4
as a skin core under "other" in skin
part of nutritional assessment.
1. Ne e ds proba bly not be ing me t
(two or more of the following
fa c tors)
● Weight loss or BMI ≤ 23
● Poor/ fair intake in Center
● No appetite; poor intake
● Interventions in place to meet nutritional
needs, but status remains compromised
● Totally dependent for feeding
/hydrating
2 . High Risk (two or more of the
following fa c tors)
● Weight loss due to insuffic ient calories
● Dependent and/or refuses
supplements/food
● Intake is primarily "empty calorie food"
● BMI ≤ 23
● Takes > 40 minutes to eat
● Upper GI or mouth issue effecting PO
3 . Mode ra te Risk (one or more of
the following fa c tors)
● Weight stable but questionable protein
intake.
● Dependent on supplements
● Intake is primarily "empty calorie food"
● BMI ≤ 23
● Upper GI or mouth issue effecting PO
● Weight Loss Pattern
4 .Low Risk
● Weight stable indicative of calories to
spare protein.
● Intake is primarily balanced diet from
"My Plate"
● Adequate food resources
● Able to feed self without problems
FRICTION & SHEER 1. Ma ximum Assista nc e
● Requires moderate to maximum
assistance in moving.
● Complete lifting without sliding against
sheets is impossible.
● Frequently slides down in bed requiring
frequent repositioning with maximum
assistance.
2 . Ne e ds Assista nc e
●Maintains relatively good position in
chair or bed most of the time but
occasionally slides down, and needs
some assistance for repositioning.
3 . Some Assista nc e
● Maintains relatively good position in
chair or bed most of the time seldom
slides down, and needs little assistance
for repositioning.
4 . No Assista nc e
●Maintains relatively good position in
chair or bed most of the time .
● Needs no assistance in repositioning.
Scoring: TBD
Centra PACE Pressure Ulcer Risk Assessment
FMV 0.0% 0.0%
LYN 2.0% 6.0%
Centra PACE 1.9% 3.9%
Prevelence of Participants
w/ Acquired Pressure
Ulcers.
Site
Percentage of Participants w/
Acquired Pressure Ulcers
during month.
26

27
Effective QAPI Programs
Assess current
performance.
Establish a baseline for
improvement efforts.
Assess improvement
efforts.
Predict future performance.
Ensure that improvement
gains are held.
27
Focus on Process

PACE Audit Agenda
• Administrative
• Clinical
• Chart Review
• Home visit
• Bus Rides
• Interviews
• DMAS and CMS representatives
28

Quality Management vs Risk Management
• An essential component of an effective quality improvement program is risk assessment and management
• Ideally-proactive
• Reality-reactive
29

30
Overview Risk Management
Define
Analyze
Reduce Risk

Risk Management Includes
• An integrated process of defining and monitoring specific areas of risk and
• Developing and implementing a comprehensive plan to PREVENT, MITIGATE and/or RESPOND TO RISK
31
32
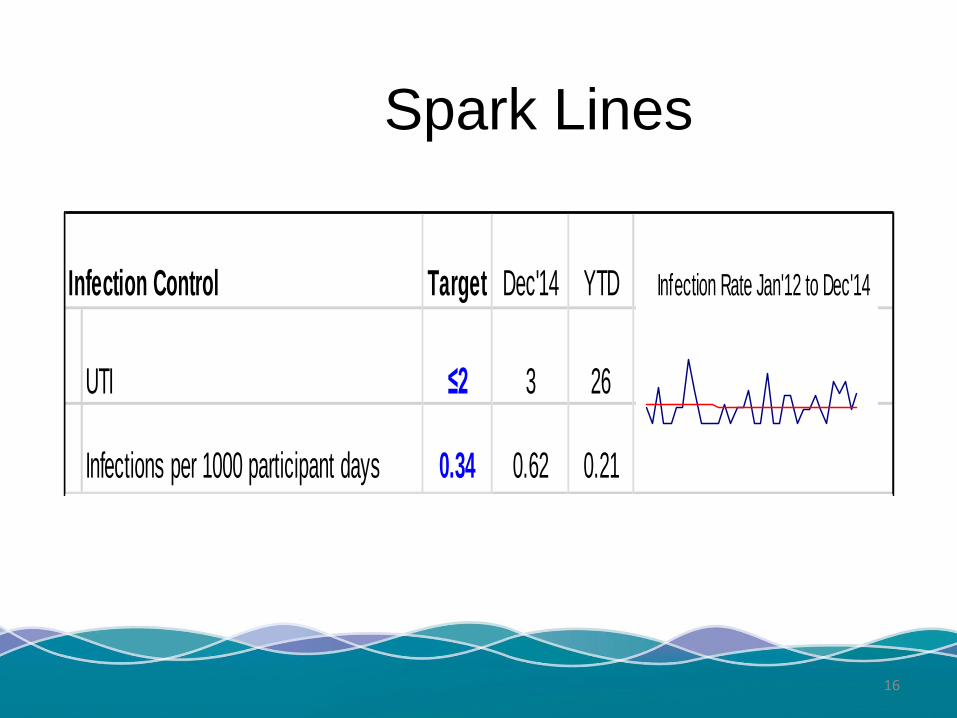
Centra PACE Quality Program
Centra Board of DirectorsPace Reports Quarterly
Centra Council(A Division of Centra Board)
Pace Reports Quarterly
Site Specific Participant Advisory Committee
(Staff, Participants, Family Members, Community Leaders)
Centra PACE Quality Team(Medical Director( Program
Director, Site Managers, Finance Manager & Quality Coordinator)
Rehabilitation and Geriatric Specialists Committee
(Verna Sellers, MD)
Site Specific Performance Improvement Teams
(Falls Team, Hospitalization Team)
Site Specific Participant Council
(Participants, Activities, Quality Coordinator)
Individual PACE Employees
Bioethics Committee (Includes Medical Director
MD)
Compliance Committee(Includes Director of
Corporate Compliance)
Waste, Fraud, and Abuse and Pharmacy Review Committee
(Corporate Compliane, Medical Director, Program Director, Site Directors,Finance
Manager, Transportation Coordinator,
Pharmacy Reprentatives, PACE Pharmacy, HCC, Quality Coordinator)
Site Sepecific Quality Team(Medical Director, Specific Site Manager, Transportation, SW,
Activities, HCC, & Quality Coordinator)
Southside Community Board of Directors
(A Division of Centra Board)Pace Reports Quarterly
Southside Professional & Patient Care Committee
(A Division of Centra Board)Pace Reports Quarterly

References
o http://www.cms.gov/Medicare/Health-Plans/pace/downloads/finalreg.pdf
o http://www.npaonline.org/website/download.asp?id=1783&title=PACE_Final_Rule_-_12/08/06
33

34

The Right Tool
for the Right Job!
36

Flowcharting• To allow a team to identify the flow or
sequence of events in a process; helps picture the process.
– Shows where simplification / standardization possible.
– Compares / contrasts actual vs. ideal flow, thus identifying improvement opportunities.
– Facilitates agreement on the steps of a process & examines impact of activities of process performance.
– Identifies areas for data collection and analysis.
37

38
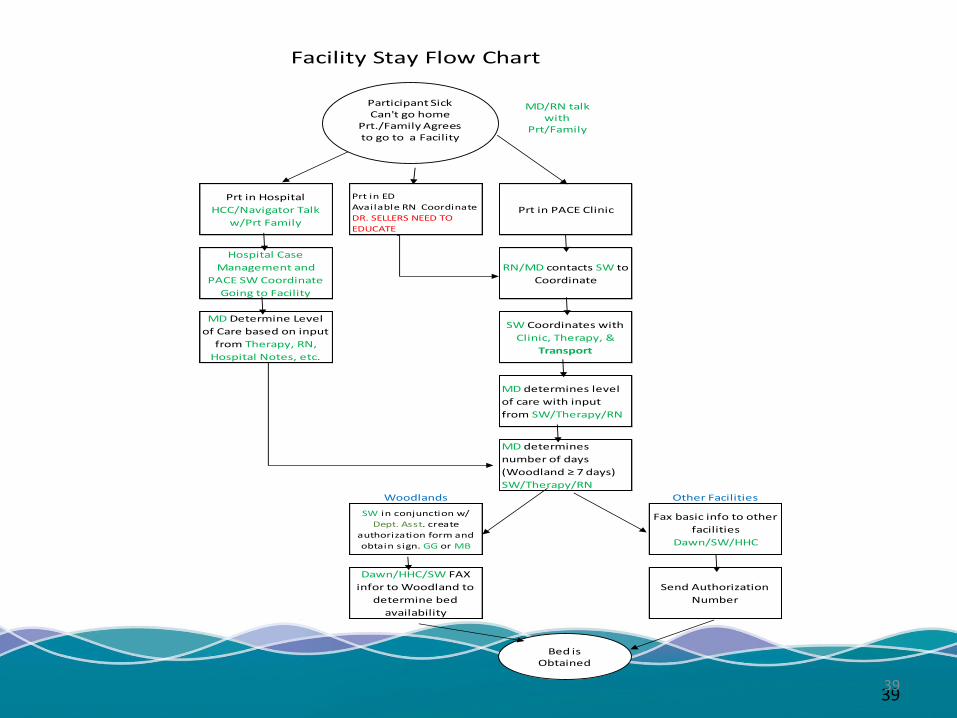
39
Prt in Hospital
HCC/Navigator Talk
w/Prt Family
Prt in ED
Available RN Coordinate
DR. SELLERS NEED TO
EDUCATE
Prt in PACE Clinic
Hospital Case
Management and
PACE SW Coordinate
Going to Facility
RN/MD contacts SW to
Coordinate
MD Determine Level
of Care based on input
from Therapy, RN,
Hospital Notes, etc.
SW Coordinates with
Clinic, Therapy, &
Transport
MD determines level
of care with input
from SW/Therapy/RN
MD determines
number of days
(Woodland ≥ 7 days)
SW/Therapy/RN
Woodlands Other Facilities
SW in conjunction w/
Dept. Asst. create
authorization form and
obtain sign. GG or MB
Fax basic info to other
facilities
Dawn/SW/HHC
Dawn/HHC/SW FAX
infor to Woodland to
determine bed
availability
Send Authorization
Number
Facility Stay Flow Chart
Participant SickCan't go home
Prt./Family Agrees to go to a Facility
MD/RN talk with
Prt/Family
Bed is Obtained
39

40
Describing the Process• Include all members of the team
– They can tell you what is stopping them from doing their job.
– Also gives you an opportunity to see if they:
• Know what should be done.
• Know how to do it.
• Understand why it is important.
• Think their way is better than the required way.
40

SIPOC Diagram
The SIPOC tool is particularly useful when it is not clear:
• Who supplies inputs to the process?
• What specifications are placed on the inputs?
• Who are the true customers of the process?
• What are the requirements of the customers?
41

SIPOC Diagram
• identify all relevant elements of a process improvement project before work begins
• defines a complex project that may not be well scoped
• similar and related to process mapping or flowcharting but provides additional detail.
42

SIPOC Diagram
• Suppliers
• Input
• Process
• Outcome
• Customer
43

S
Suppliers
I
Inputs
P
Process
O
Output
C
Customer
Clinic
(On Call Nurse)
Clinic Schedule
Adjusted (if Initiated)
TherapyDME Coordination (if
Initiated)
TransportationAssign Pick Up/Drop
Off Times
Home Care
Coordinator
Adjust PCA hours with
Agency
MealsMeal: Current Diet/
Take Home/ "box lunch"
Staffing Maintain 6:1 Ratio
Participant NotificationParticipant Notified of
Plan
Family Notification (if
applicable)Family Notified of Plan
Social WorkIf Clinic initated: respite
maybe required.
PharmacyMedication Delivery
Coordination
Hospital ResourcesSchedule Resource &
Transport to CSCH
Outside ProvidersOutside Providers
Appointment
Complete Remainder
of Notifications
Send out Follow Up
Email when Complete
SIPOC
Participant Attending Center on an Unscheduled Day
Participant Needs to
Attend Day Center on
Unscheduled day due
to Clinic Appointment,
DME Need, or
Transport to Outside
Provider
Clinic Nurse/Tech (or
On Call Nurse) OR
Therapist (LPTA or
CODA) Initates
Telephone List
Satisfied Participant
with Immediate Future
Needs being Met.
Establish Pick Up/ Take
Home Times with
Transport Coordinator
44

Pareto Chart
• How do I do it?
– Decide on problem to be analyzed.
– Brainstorm or collect data to select problems or causes to be analyzed.
– Choose unit of measurement and timeframe for the study.
– Collect data (real time or historical).
– Compare relative frequency of each problem or cause.
– Graph the frequencies with a cumulative % line to interpret the results.
45

0%
10%
20%
30%
40%
50%
60%
70%
80%
90%
100%
0
20
40
60
80
100
120
140
160
180
Home NursingFacility
AssistedLiving
Community PACECenter
PACE Bus Dialysis Hospital
Cu
mu
lati
ve P
erce
nta
ge o
f Fa
lls
Nu
mb
er o
f Fa
lls
Location
Participant Falls at Lynchburg SiteJanuary 1, 2014 to December 31,2014
n=230
Number of Falls Percentage46

Data Analysis - Control Charts
• Graphical representation of data over time.
• Time ordered plot of a set of data in it’s naturally occurring order with the median of the data drawn in as a reference line.
• Ignoring the time element implicit in every data set can lead to incorrect statistical conclusions.
47

Quality Improvement: Control Chart
Falls with Average and Control Limits
0
2
4
6
8
10
12
14
Jan-
00
Mar
-00
May
-00
Jul-0
0
Sep-0
0
Nov-00
Jan-
01
Mar
-01
May
-01
Jul-0
1
Sep-0
1
Nov-01
Falls
Average
Upper Control Limit
Lower Control Limit
48

49
Root Cause Analysis
• Fishbone Diagrams
• Show the causes of a certain event.
A Fishbone or Ishikawa diagram
can be useful to break down (in
successive layers of detail) root
causes that potentially contribute to
a particular effect.
49

50
Weight Loss
Fishbone Diagram
50

51
Weight Loss
Type of Patient
Dietary Staffing
CNA assistance with meals
Food Not Appetizing
Fishbone Diagram
51

52
Weight Loss
Type of Patient
Hospice
Obese patient
on dietOrtho
Rehab
Dietary Staffing
Holiday call-offs
Wages not competitive
New
Dietician
CNA assistance with meals
Short staffed
Wages not competitive
Holiday call-offs
Inadequate
training
Lack of
interest
High toileting needs
Don’t understand
importance
Food Not Appetizing
Monotonous Menu
Wrong Temperature
Poor presentation
Fishbone Diagram
52