Embed Size (px)
Citation preview

The role of the public primary care network in accessing primary care services in Chile
By
Maria S. Martinez-Gutierrez
A dissertation submitted in partial satisfaction of the requirements for the degree of
Doctor of Philosophy
in
Health Services and Policy Analysis
in the
Graduate Division
of the
University of California, UC Berkeley
Committee in charge:
Professor William Dow, Chair Professor Sylvia Guendelman Professor Mahasin Mujahid
Spring 2014


1
Abstract
The role of the public primary care network in accessing primary care services in Chile
by
Maria S Martinez Gutierrez
Doctor of Philosophy in Health Services and Policy Analysis
University of California, UC Berkeley
Professor William Dow, Chair
The present study examines the hypothesis that patients receiving care in the public sector in Chile have better access to primary care services, especially preventive services, than patients in the private sector. Although the hypothesis might appear counterintuitive, since worldwide public health facilities are typically underfunded, overcrowded and present deficiencies in quality, Chile’s strong network of public primary healthcare facilities (similar to other Latin American countries such as Costa Rica and Uruguay), may help to explain this hypothesis.
This dissertation addresses the following over-arching research question: is using the public system as a preferred venue for accessing primary care services associated with higher utilization of primary care services?
First, it was determined that type of health insurance could be used as a proxy of choice of private provider i.e. being enrolled in a public health plan directed to the poor which restricted provision of services only to the public sector (Fonasa A) was associated with choosing a public provider most of the time. Next, the association of type of health insurance with utilization of primary care services, controlling for all relevant variables from the Andersen model of healthcare access, was analyzed. Regressions were fitted using nationally representative survey data. In depth interview and focus groups were conducted with patients and healthcare providers to complement quantitative findings.
Regression results for utilization of services showed that, in terms of preventive care utilization, using the public system was associated with higher utilization of preventive services in adult and older women, but there was no association found for other age/sex groups. Since people who use the private sector may have been getting their preventive care in other settings such a specialty care clinics an ambulatory care indicator was added as a dependent variable as a sensitivity analysis. For both infants and older people–groups that use intensively the healthcare system–there are no differences in ambulatory healthcare utilization across insurance types. For other age groups using the public healthcare system was associated with lower utilization of ambulatory care services.
In summary, the evidence found in this dissertation suggests that 1) Isapre members and people enrolled in public health plans other than Fonasa A use the private healthcare sector more frequently and 2) although some population groups that use the private system have higher utilization of ambulatory care services there are no differences in preventive services utilization for any population group. In light of these findings, proposals to further expand private health insurance coverage or use of private providers

2
in the Chilean population should take into consideration that this could lead not only to care focused on curative versus preventive services but also to a less efficient distribution of primary care services, since some of the people that need primary care services may be substituting preventive services for specialist services, which are more expensive and less comprehensive than preventive visits.

i
To Ernesto, Tito and Magdalena, the family that made me the realized woman I am today
ii
Acknowledgements
I want to thank William Dow for his guidance and support throughout the entire doctoral program, for being an advocate for students and a guardian of academic excellence in everything we students did. I can say without a doubt that he is one of the main engineers of my success as a foreign doctoral student. I also want to thank my qualifying exam chair and committee member, Sylvia Guendelman, for all her support as I was developing this research project and for her brilliant revisions to my dissertation. Finally, I want to thank Mahasin Mujahid for all her revisions as I worked in my prospectus and later in my dissertation, her comments and suggestions enhanced the quality of this product but ultimately the quality of the papers that I will publish based on it.
I could not have finished the program and actually have written this dissertation without the constant presence, support and nagging of my precious writing group: Megan Vanneman, Sarah Jane Holcombe and Sahai Burrowes. From writing our methods paper, to taking our qualifying exams, to actually finishing our doctoral dissertations; these amazing women have shared with me their passion, failures and successes, making the whole process much less scary than it might have been. For this I thank them eternally and vow to be their friend forever.
I also want to thank Dion Shimatsu-Ong, who was instrumental in my decision to come to UC Berkeley and one of the many people that provided me with emotional and logistic support during the five and a half years I lived in the US. Knowing that she had my back made the journey much more pleasant. I’m forever in her debt and consider her my friend and protector.
I also want to thank two bright undergraduate students who helped me with sections of my dissertation. Zosha Kandel approached me a couple of years ago and offered her help pro bono in anything I was working with. She was responsible for the literature reviews related to primary care in the world and Latin America. Alexis Captanian worked with me in the context of the SMART program (an undergraduate mentorship program from the Graduate Division at UC Berkeley). She helped me with the qualitative analysis and provided me with excellent insights regarding the data I had collected. I thank them for their generosity in giving me their time above and beyond the call of duty and their rigor while working in my project.
Thanks to all the agencies that funded my doctoral program: the International Berkeley Fellowship for Doctoral Studies from UC Berkeley which funded me the first two years; the Fulbright-MECESUP fellowship from the US and Chilean government which provided me with a stipend for four years; the SMART program from the Graduate Division at UC Berkeley that helped me to pay for some research expenses and provided me with an outstanding research assistant and to the Tinker travel grant from the Center of Latin American Studies at UC Berkeley which paid for my trip to Chile to conduct qualitative fieldwork.
I thank the support of my employer, the Escuela de Salud Pública Salvador Allende at the University of Chile, which allowed me to take a study leave to pursue this degree while also supporting me financially. My mentor, Oscar Arteaga, became the Director of the Escuela while I was in the US and I thank him for his support as a mentor but also as the Director of the Escuela.

iii
The Chilean community in Berkeley was also instrumental in my survival as a mother and wife with a husband who also was a UC Berkeley student. So many of them were my family away from home and I thank everyone (more than a hundred probably!) especially (in chronological order): María Jesús Lara and Alejandro De Giorgis, María José Lacamara and Matías Hube, Bárbara Errázuriz and Mauricio Larraín, Rosario Rivero and Luis Calvo, Lesliam Quirós and Luis Estévez, Claudia Pavón and Ignacio Santelices, Margarita Santa María and Diego Pardow, Paz Arroyo and Ricardo Henoch, Gabriella Hilliger and Patricio Domínguez, Elisa Palma and Guillermo Gonzalez, Keka Salinas and Marcial Mora, Ignacia del Río and Crescente Valle. Our Canadian-Ecuatorian friends Michelle and Matt Arevalo-Carpenter deserve a special mention for continuing to reach out to us after they moved from the US. We value their friendship immensely.
Thanks to Vanesa Llaro, an exceptional woman who took care of my children while I was working for my doctoral program. I take the fact that I had the peace of mind to work without worries about my children, as one of the best gifts that life gave me during these years. Many many thanks to childcare providers who were so important in my children’s lives during this period; Dinha Baldisarella, Cathy O’Soullivan, Tim Peak, Solange, Pam, María, Mila and Carmen.
Finally, I want to thank Ernesto Muñoz Lamartine, my husband and best friend, for encouraging me to pursue this degree in the US, inspiring me and being my partner in this long and beautiful journey. We prevailed, mono!!!

iv
Table of contents Executive Summary ............................................................................................................................vi Introduction ............................................................................................................................................x Chapter 1. Overview of the Chilean Healthcare System ...................................................1
1.1 Health insurance................................................................................................................................................... 1 1.1.1 Public health insurance ....................................................................................................................1 1.1.2 Private health insurance ...................................................................................................................3
1.2 Healthcare provision ............................................................................................................................................. 5 1.2.1 Primary care systems: basic concepts...........................................................................................6 1.2.2 Public primary care in Chile...........................................................................................................9 1.2.3 Private primary care in Chile ......................................................................................................12
1.3 Ambulatory healthcare services ..........................................................................................................................13 1.3.1 Preventive visits ................................................................................................................................14 1.3.2 Acute care visits................................................................................................................................14 1.3.3 Specialty visits ...................................................................................................................................14 1.3.4 Emergency care visits .....................................................................................................................15
1.4 Cross-utilization of health services between the private and the public sector ...............................................15 1.5 The relationship between socioeconomic status, health insurance and utilization of primary care services in Chile 16 1.6 Summary of the overview of the Chilean Healthcare System ..........................................................................20
Chapter 2. Conceptual Framework, research questions and hypotheses............... 21 2.1 Andersen model: Health services utilization.....................................................................................................21 2.2 Conceptual model, research question 1 and hypotheses: Choice of primary care provider in the private sector in Chile ............................................................................................................................................................................23 2.3 Conceptual model, research question 2 and hypotheses: Health services utilization in primary healthcare in Chile 25
Chapter 3. Quantitative methods ............................................................................................ 29 3.1 Data Sources and sample Characteristics.........................................................................................................30 3.2 Variables..............................................................................................................................................................30 3.3 Statistical analyses..............................................................................................................................................34 3.4 Statistical methods ..............................................................................................................................................35
Chapter 4. Qualitative methods ............................................................................................... 37 4.1 Design ..................................................................................................................................................................37 4.2 Study site .............................................................................................................................................................37 4.3 Sample and recruitment......................................................................................................................................37
4.3.1 Providers.............................................................................................................................................37 4.3.2 Patients ................................................................................................................................................38
4.4 Data collection and analysis ..............................................................................................................................38 4.5 Human Subjects Protection and Ethical Considerations ................................................................................40
Chapter 5. Results ......................................................................................................................... 41 5.1 Health insurance.................................................................................................................................................41 5.2 Choice of private provider ...................................................................................................................................44
5.2.1 Regression results ............................................................................................................................47 5.2.2 Summary of quantitative results for choice of private provider.......................................49 5.2.3 Key qualitative results for choice of private provider..........................................................50
5.3 Healthcare Utilization .......................................................................................................................................53
v
5.3.1 Descriptive results............................................................................................................................53 5.3.2 Regression results ............................................................................................................................69 5.3.3 Summary of quantitative results for visits utilization...........................................................78 5.3.4 Key qualitative results for healthcare utilization...................................................................78
Chapter 6. Discussion .................................................................................................................. 83 6.1 Choice of private provider ...................................................................................................................................83 6.2 Utilization of primary care services ..................................................................................................................85 6.3 Health insurance.................................................................................................................................................87 6.4 Limitations ..........................................................................................................................................................88 6.5 Future research ....................................................................................................................................................90
Chapter 7. Conclusion and policy implications ................................................................. 91 Chapter 8. References .................................................................................................................. 93 Appendices..........................................................................................................................................101
Appendix 1. Health Services provided by the Family healthcare plan in the public system ............................ 101 Appendix 2. Recruitment letter Provider ............................................................................................................... 103 Appendix 3. Informed Consent Providers and Patients....................................................................................... 105 Appendix 4. Interview guide providers and patients ............................................................................................ 111 Appendix 5. Summary of regression results for preventive, acute care, specialty and emergency care visits.... 123

vi
Executive Summary The present study examines the hypothesis that patients receiving care in the public
sector in Chile have better access to primary care services, especially preventive services, than patients in the private sector. Although the hypothesis might appear counterintuitive, since worldwide public health facilities are typically underfunded, overcrowded and present deficiencies in quality, Chile’s strong network of public primary healthcare facilities, may help to explain this hypothesis. On a larger context, other Latin American countries such as Costa Rica or Uruguay have a strong primary care network, so this research may apply to them as well.
First, in terms of health insurance, low-income individuals are insured through a public plan that only permits them to get primary care services in public primary healthcare facilities (Fonasa A). Middle-income groups have access to public plans that allow the use of vouchers for care in the private system (Fonasa B, C or D) or to private insurance with richer benefits in terms of use of private services (Isapres). High-income individuals are mostly privately insured. Regarding healthcare provision, in Chile there are two distinct primary health care delivery systems: an extensive public healthcare system with more than 80% of the total supply of hospital beds and a smaller but growing (and heterogeneous) private sector system. Since the public system is based on the Comprehensive Care model, which assigns to each primary care center a population for which the center is responsible for, the public system may have more incentives to provide primary care services than the private system.
This dissertation addresses the following over-arching research question: is using the public system as a preferred venue for accessing primary care services associated with higher utilization of primary care services? Specific research questions and hypotheses are:
• Research question 1: What are the determinants of choice of private versus public primary healthcare provider in Chile?
o Research question 1.1: Is type of health insurance (Fonasa A versus all other public and private plans) associated with choice of private versus public provider after controlling for socio-demographic characteristics?
! H1.1.a. Individuals enrolled in Fonasa A will be less likely to have chosen a private provider for all types of visits (preventive, acute care, specialty and emergency care) than individuals in other health insurance groups.
o Research question 1.2: How do out of pocket expenditures associate to services, geographic location of the provider, perceived service and amenities, perceived quality of care and expected wait time influence the choice of private versus public primary care provider?
! H1.2.a. Higher out of pocket expenditure associated with services in the private sector will deter individuals from choosing private providers.
! H1.2.b. Geographic location of private centers will be deemed more convenient than geographic location of public centers.
! H1.2.c. Respondents will perceive quality of care as better in private primary care centers.
! H1.2.d. Respondents will expect to have a shorter wait time in private primary care centers.

vii
! H1.2.e. Respondents will perceive service and amenities as better in private primary care centers.
• Research question 2: What are the determinants of primary care services utilization in Chile?
o Research question 2.1: Is type of health insurance associated with having had a primary care visit in the last three months after controlling for socio-demographic characteristics?
! H2.1.a. Fonasa A enrollees will be more likely to have had a primary care visit in the last three months than individuals enrolled in Fonasa B, C, D or in Isapres.
! H2.1.b. The magnitude of the association between type of health insurance and primary care services utilization described above will be larger for priority groups in the public system (children and elderly over age 65)
! H2.1.c. Priority groups will report having less access barriers for primary care services than other age groups.
o Research question 2.2: Is type of health insurance associated with having had an ambulatory care visit (any preventive, acute care, specialist care or emergency care visit) in the last three months after controlling for socio-demographic characteristics?
! H2.2.a. Non-priority groups (teenagers and adults) enrolled in Fonasa A will be less likely to have had an ambulatory care visit in the last three months compared with their counterparts enrolled in Fonasa B, C, D or in Isapres.
! H2.2.b. For priority groups, there will be no difference in ambulatory care services utilization between Fonasa A enrollees compared with their counterparts enrolled in Fonasa B, C, D or in Isapres.
o Research question 2.3: How do hypothesized determinants of utilization of primary care services such as out-of-pocket expenditures associated with services patients regularly use, appointment availability, use of reminders and outreach activities and comprehensiveness of care differ between public and private providers?
! H2.3.a. Respondents will report higher out-of-pocket expenditures for primary care services in the private sector.
! H2.3.b. Respondents will report better appointment availability in the private sector.
! H2.3.c. Public sector providers and users of public services will report a more intense use of reminders and outreach activities
! H2.3.d. Patients and providers will report more comprehensive services in the public sector.
Hypotheses 1.1.a, 2.1.a., 2.1.b, 2.2.a and 2.2.b were tested using regression models
with data from the 2011 National Socio-demographic Characterization survey; Hypotheses 1.2.a to 1.2.d, 2.1.c and 2.3.a to 2.3.d were explored using qualitative data collected by the author using patients focus groups and short interviews and in-depth interviewees with public and private healthcare providers.

viii
In terms of choice of private versus public provider, regression results showed that although public plan enrollees have a higher probability of choosing the public healthcare network in the case of preventive services, they sometimes use the private sector to access specialty and emergency services. This is explained by the fact that people enrolled in plans other than Fonasa A can buy vouchers to have access to services in the private sector. Furthermore, Isapre members have access to plans with better benefits and coinsurance rates than people enrolled in public plans. In any case, being enrolled in plans other than Fonasa A was associated with a higher likelihood of choosing a private provider for each type of visit so type of health insurance can be used as a proxy of using the private sector as a preferred venue.
Qualitative data showed that respondents enrolled in public insurance plans felt locked in the public sector due to their lack of financial resources to buy services in the private sector. Patients reported choosing a private provider because they perceive they could get an appointment faster than in the public sector, wait time is shorter, the provider was in their health plan preferred network and they wanted to be able to choose a doctor they can trust in, results that are consistent with the existing literature. Users of private services did perceive quality of those services as better in private primary care centers although there is no clear evidence that, in low and middle-income contexts, the private sector provides better quality care than the public system.
Regression results for utilization of services showed that, in terms of preventive care utilization, there were no significant differences between individuals in the most restrictive public plan and other health insurance groups except for adult and older women where being in the most restrictive plan was associated with a higher probability of having had a preventive visit. The fact that, for age other groups, there are no differences in preventive services utilization between Fonasa A enrollees and other insurance groups may be explained by special efforts by the public system to provide these services to the population they serve counterbalancing better access to services that individuals in the private sector experience given the existence of the voucher system. Strategies such as patient reminders, small media and one-on-one education, all of them used in the public sector much more intensively at least theoretically, have been associated with higher use of preventive services in the existing literature. Another force driving lower use of preventive services in the private sector can be the existence of user fees for preventive services which have been found to be associated with lower preventive services utilization.
For children, teenagers, male adults and male older adults, being enrolled in Fonasa A was associated with lower utilization of acute care services and combined visits. This lower utilization for Fonasa A enrollees may be explained by the fact that they do not have access to private services through the voucher system.
In terms of acute care and overall ambulatory care visits, for both infants and older people–groups that use intensively the healthcare system–there are no differences in ambulatory healthcare utilization across health insurance types. One interpretation of this finding in older women (who have a higher utilization rate of preventive services for Fonasa A enrollees) may be that the public system is equalizing ambulatory care utilization for this group probably by increasing preventive services use since Isapre members and other public health plans should have higher utilization rates after controlling for health need by the mere fact that they have access to vouchers. For other age groups, individuals in the most restrictive public plan are generally less likely to have had any type of visit in the last three months.

ix
Regarding differences between public and private providers in terms of hypothesized determinants of utilization of primary care services findings were consistent with evidence from other low and middle-income countries. Private providers were reported to perform better than public providers in terms of appointment availability⎯which would theoretically increase utilization of services⎯but were also linked with higher copayments which are supposed to disincentivize use of unnecessary (and sometimes necessary) care. The public system was reported to use more intensively patient reminders, outreach activities and offer a more comprehensive portfolio of services, especially in terms of healthcare prevention.
All these determinants of healthcare utilization may be working in opposite directions and eventually cancelling each other in the cases where no differences were found between users of the public and the private sector.
In summary, the evidence found in this dissertation suggests that 1) Isapre members and people enrolled in public health plans other than Fonasa A use the private healthcare sector more frequently and 2) although some population groups that use the private system have higher utilization of ambulatory care services there are no differences in preventive services utilization for any population group.
In light of these findings, proposals to further expand private health insurance coverage or use of private providers in the Chilean population should take into consideration that this could lead not only to care focused on curative versus preventive services but also to a less efficient distribution of primary care services, since some of the people that need primary care services may be substituting preventive services for specialist services, which are more expensive and less comprehensive than preventive visits.
x
Introduction
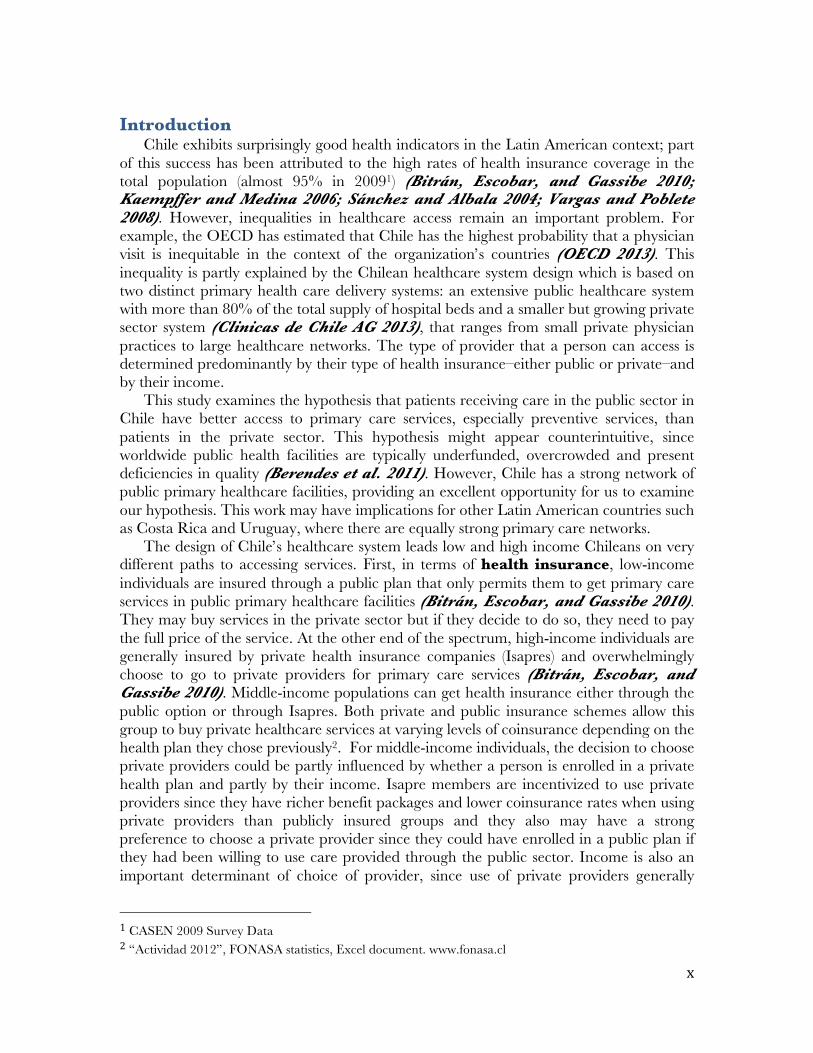
Chile exhibits surprisingly good health indicators in the Latin American context; part of this success has been attributed to the high rates of health insurance coverage in the total population (almost 95% in 20091) (Bitrán, Escobar, and Gassibe 2010; Kaempffer and Medina 2006; Sánchez and Albala 2004; Vargas and Poblete 2008). However, inequalities in healthcare access remain an important problem. For example, the OECD has estimated that Chile has the highest probability that a physician visit is inequitable in the context of the organization’s countries (OECD 2013). This inequality is partly explained by the Chilean healthcare system design which is based on two distinct primary health care delivery systems: an extensive public healthcare system with more than 80% of the total supply of hospital beds and a smaller but growing private sector system (Clinicas de Chile AG 2013), that ranges from small private physician practices to large healthcare networks. The type of provider that a person can access is determined predominantly by their type of health insurance–either public or private–and by their income.
This study examines the hypothesis that patients receiving care in the public sector in Chile have better access to primary care services, especially preventive services, than patients in the private sector. This hypothesis might appear counterintuitive, since worldwide public health facilities are typically underfunded, overcrowded and present deficiencies in quality (Berendes et al. 2011). However, Chile has a strong network of public primary healthcare facilities, providing an excellent opportunity for us to examine our hypothesis. This work may have implications for other Latin American countries such as Costa Rica and Uruguay, where there are equally strong primary care networks.
The design of Chile’s healthcare system leads low and high income Chileans on very different paths to accessing services. First, in terms of health insurance, low-income individuals are insured through a public plan that only permits them to get primary care services in public primary healthcare facilities (Bitrán, Escobar, and Gassibe 2010). They may buy services in the private sector but if they decide to do so, they need to pay the full price of the service. At the other end of the spectrum, high-income individuals are generally insured by private health insurance companies (Isapres) and overwhelmingly choose to go to private providers for primary care services (Bitrán, Escobar, and Gassibe 2010). Middle-income populations can get health insurance either through the public option or through Isapres. Both private and public insurance schemes allow this group to buy private healthcare services at varying levels of coinsurance depending on the health plan they chose previously2. For middle-income individuals, the decision to choose private providers could be partly influenced by whether a person is enrolled in a private health plan and partly by their income. Isapre members are incentivized to use private providers since they have richer benefit packages and lower coinsurance rates when using private providers than publicly insured groups and they also may have a strong preference to choose a private provider since they could have enrolled in a public plan if they had been willing to use care provided through the public sector. Income is also an important determinant of choice of provider, since use of private providers generally
1 CASEN 2009 Survey Data 2 “Actividad 2012”, FONASA statistics, Excel document. www.fonasa.cl

xi
entails larger out-of-pocket expenses than using the public system. Moreover, groups with higher income are able to buy health plans with richer benefit packages, especially for more expensive services such as hospitalizations and surgeries (Holst, Laaser, and Hohmann 2004). Lastly, users of the public system with higher income could be using private services when there are long waits in the public sector as it has been observed in Chile (Superintendencia de Salud de Chile 2012) (Silva 2013) and other middle-income countries (Montagu et al. 2011; Pribble 2010). Although general patterns of utilization of private services are known, there is a gap in the literature with respect to the individual socio-demographic factors associated with the decision of demanding services in the private sector and the actual pattern of use of private and public providers by different population groups. This dissertation will add to the literature by exploring these relationships.
Second, in terms of healthcare provision, the Chilean system presents significant differences in how care is provided by the public and private systems. The Chilean public primary healthcare network is designed around primary care centers that operate according to the principles of the Alma Ata primary healthcare approach such as accessibility, affordability and acceptability of basic but comprehensive care for all people in a country. Moreover, public primary healthcare centers offer a variety of services on-site; delivery of healthcare services is organized around standardized procedures and payment is capitated for every enrollee who generally lives near the center (Verónica Vargas 2006). Thus the public system has built-in incentives to provide preventive services to their enrollees and the community. However, since the primary care level is not financially responsible for care referred to more complex levels, some centers could be withholding necessary care. Public primary healthcare centers, even though decentralized at the local level, are a central part of the national public healthcare network. National vertical programs (Verónica Vargas 2006) operate through primary healthcare centers standardizing and making accountable the provision of primary healthcare services in each municipality or locality.
In contrast, the private sector is heterogeneous with regards to its organizational structure, payment mechanisms and quality of care. Private providers serving high-income populations tend to deliver care in integrated health care facilities housed in hospitals that have high standards of care; for example, the U.S. Joint Commission has accredited a few private hospitals in Chile. Primary care private providers serving middle-income populations, in contrast, constitute a heterogeneous group of providers ranging from stand-alone practitioners, small practices, medical centers and private hospitals. Generally, they are not accredited by any agency and work under fee-for-service arrangements focusing on curative medicine. This situation is not so different from the one in other low and middle-income countries (Berer 2011).
These features of the Chilean health system make it plausible that users enrolled in plans that only allow the use of the public system have higher utilization rates of preventive services and of primary care services–after controlling for need–than do users in public plans that allow the use of private providers or those enrolled in private plans (Isapres). These results may have implications for the design of future policies oriented to strengthening primary care in Chile, especially regarding the use of private services to increase access to primary care. Findings can also inform a larger debate in low and middle-income countries about the implementation of policies granting a greater role to private healthcare providers.

xii
This dissertation addresses the following over-arching research question: is using the public system as a preferred venue for accessing primary care services associated with higher utilization of primary care services?
I will use two complementary analytic approaches. First, I will conduct statistical analyses using survey data from a cross-sectional nationally representative sample of individuals. This will be used determine the relationship between type of health insurance and choice of a private provider for a set of healthcare visits. This approach will enable me to describe the pattern of private care utilization for the various health insurance groups and will in turn inform the subsequent analysis of the relationship between type of health insurance and primary healthcare utilization. In this second analysis, type of health insurance and more specifically, being enrolled in the most restrictive public plan, will be used as a proxy for using the public healthcare system as a preferred venue for getting primary care services. Additionally, I will draw on interview data from patients and primary care providers in Chile to elucidate the pathways through which the public primary care system could be achieving better results than the private sector in terms of utilization of primary care services for low and middle-income populations. For example, the public healthcare system may be making a special effort to remind their patients to schedule an annual wellness visit or they may be offering a more comprehensive portfolio of services that includes a strong preventive component.
Chapter 1 is an overview of the Chilean healthcare system focusing on health insurance and healthcare provision. Public and private primary care systems are described in detail. The conceptual model for the dissertation, which is predominantly based on the Andersen model of healthcare access, is presented in Chapter 2, along with the research questions and hypotheses for both survey data and in-depth interview analyses. Quantitative and qualitative methods are discussed in Chapter 3 and Chapter 4, respectively. All results are presented in Chapter 5.
A discussion about quantitative and qualitative results and how they inform each other is presented in Chapter 6 while Chapter 7 contains the conclusions and policy implications of these dissertation findings.

1
Chapter 1. Overview of the Chilean Healthcare System
In this section, the major features of the Chilean healthcare system will be described in detail with a special emphasis on how these features could be mediating the relationship between type of health insurance and utilization of primary care services. In addition, previous research on health and healthcare inequalities in Chile according to income and type of health insurance⎯focusing on preventive services and primary care⎯ will be presented.
1.1 Health insurance
The Chilean healthcare system can be described as a two-tier system with two major types of health insurance–public and private. Although, health insurance is partially tied to employment (every employed worker is required to contribute 7% of his or her salary towards health insurance), it can be said that Chile has “effectively reached universal health insurance enrollment” (Savedoff 2009). The public health insurer, the Fondo Nacional de Salud or National Health Fund (Fonasa), covered, in 2012, 76.5% of the population3, while 144 private insurance companies (Holst, Laaser, and Hohmann 2004)– the Instituciones de Salud Previsional or Social Security Health Institutions (Isapres) created during the military dictatorship in 1981- insured approximately 17.5% of the population through a vast number of health plans. The remainder of the population was either covered by the Armed Forces Health Insurance, other private arrangements or not covered at all (5.9%). Isapres set premiums that are risk-adjusted according to the number of dependents and observable risk factors, such as age and sex (Pardo and Schott 2014; Sapelli and Vial 2003). For some people, the mandatory health insurance contribution, corresponding to 7% of their salary, would be enough to cover the premium for a certain health plan; in another cases, for example a women of reproductive age, the mandatory contribution has to be supplemented with out of pocket payments to match the premium price. Furthermore, a premium is set for every dependent so out of pocket expenditures increase with the number of dependents. Additionally, Isapres can reject prospective clients if they anticipate high healthcare costs for that particular individual. Fonasa, on the other hand, determines the premium to be paid only according to income and there is no extra charge for dependents. Thus, historically, Fonasa ends up covering the riskier population and, consequently, has a higher proportion of women and old and sick individuals in its pool (Pardo and Schott 2014; Sapelli and Vial 1998; Vergara-Iturriaga and Martinez-Gutierrez 2006).
1.1.1 Public health insurance Indigents and very poor individuals who cannot afford to pay for health insurance and
people who have decided to purchase public insurance compose the publicly insured group. As a result, the publicly insured fall into four categories by income level (Figure 1).
3 Health insurance membership extracted from the Boletín Estadístico Fonasa 2011-2012. www.fonasa.cl. [01/09/2014] 4 In 2009

2
Figure 1. Fonasa income categories benefits and out of pocket expenditure for primary care services.
Benefits: Primary care services Out of pocket expenditure for a general physician visit c
Group Income bracket and eligibility criteria
Public Healthcare Network
In-network private providers5
Publicd Privatee
% of the total populat-ion covered in 2011
A Indigent, people receiving certain social welfare subsidies, pregnant women up to 6 months after delivery and children under 6 years.
Free of charge None $0 - 22.5%
B Head of household monthly taxable income equal or less than CLPa 210,001 (app. USD 400), people receiving certain social security benefits.
70/30b coinsurance. Prices set by a national charge list.
60/40 coinsuranceb for visits and 40/60
for diagnostic tests,
procedures and other services.
$2.29 $7.58 23.7%
C Head of household monthly taxable income: more than CLP 210,001 (app. USD 400) and equal or less than CLP 306,000 (app. USD 612). With more than 3 dependants, the beneficiary and his/her family will fall into the B group.
50/50 coinsurance. Prices set by a national charge list.
60/40 coinsurance for visits and 40/60
for diagnostic tests,
procedures and other services.
$3.82 $7.58 12.9%
D Head of household monthly taxable income: more than CLP 306,000 (app. USD 612). With more than 3 dependants, the beneficiary and his/her family will fall into the C group.
20/80 of billed
charges. Prices set by a national charge list.
60/40 coinsurance for visits and 40/60
for diagnostic tests,
procedures and other services.
$6.11 $7.58 17.1%
a CLP= Chilean Pesos b A 70/30 coinsurance policy means that the insurer pays 70% of the billed charges and the patient pays 30%. c Out of pocket expenditures are in US dollars. d The total cost of a general physician visit in the public sector is set by Fonasa at 4,050 Chilean pesos, approximately $8. e For reimbursement purposes Fonasa considers the total cost of a general physician visit in the public sector to be 10,050 Chilean pesos, approximately $20. Coinsurance was calculated using this reference price. However, providers can set their prices freely so an individual may have to pay their coinsurance rate and the extra amount that it is not covered by Fonasa. Adapted from Fonasa website. http://www.fonasa.cl/wps/wcm/connect/internet/sa-general/asegurados/plan+de+salud/cobertura+plan+de+salud/swfplancoberturas [01/09/2014]
5 Prices vary by provider

3
Individuals enrolled in Fonasa have access to private services through “bonos” or vouchers. Although in the US context the use of vouchers has been discussed related to the purchase of health insurance (Aaron 2011; Emanuel and Fuchs 2005; Jung and Tran 2009), vouchers in the Chilean system are issued by Fonasa to allow enrollees in public health plans to buy health services directly in the private sector. The process is as follows: a Fonasa enrollee pays their portion of the coinsurance rate directly to providers who later collect the other portion of the total cost of the service from Fonasa. Private providers are free to set prices at any level although Fonasa will only reimburse a percentage of the cost of a certain service based on a price list developed by Fonasa itself. If a provider sets a price higher than the Fonasa price list, the patient is responsible for paying the full cost difference between the voucher’s value and the price of the service.
The Fonasa A health plan does not allow beneficiaries to have access to the private sector through vouchers since this category is reserved for “indigent” people that are not supposed to be able to afford the coinsurance rate associated with it. Individuals enrolled in other public health plans (B-D) can buy a voucher to access private care. Eligible Fonasa enrollees use vouchers to purchase ambulatory services, such as visits and tests, since the amount paid by Fonasa is similar to the price set by most providers. On the other hand, inpatient services are seldom purchased using a voucher since hospitals have set the price of these services at a much higher level than the amount that Fonasa is willing to pay, so enrollees prefer to use the public system for these types of services. Another important feature of this purchase process is that payment happens before care actually takes place so the patient knows exactly how much the service will cost. Additionally, members of health plans other than Fonasa A have to pay a certain out of pocket payment for services rendered in the public sector so they have weaker incentives to use public services as opposed to private.
1.1.2 Private health insurance Individuals that decide to enroll in Isapres have access to a myriad of health plans with
very dissimilar benefits and coverage (Holst, Laaser, and Hohmann 2004). High-income individuals have access to better plans and better coverage, which enables them to buy primary care services in private hospitals with high standards of care. Middle-income populations can buy a “closed” plan, meaning that they are totally restricted to the plan healthcare network (often termed an EPO or “exclusive provider organization” in the United States context) or “open” plans which have a preferred network but allow patients to get services out of network (i.e. a PPO or “Preferred Provider Organization”). These types of plans allow beneficiaries to have access to a very heterogeneous group of providers in terms of quality of care. A sample of the health plans offered in the Chilean health insurance market is presented in Figure 2. As it was discussed previously, plans are more expensive and offer fewer benefits for women and older people since the premium is risk-adjusted. The table also shows how premiums are higher for individuals with dependents.

4
Figure 2. Isapres selected health plans6. Demographic characteristics Monthly
supplemental contribution to premiumc
Benefits: Primary care services (coinsurance)
Out of pocket expenditure for a general physician visit
Sex Agea Salaryb Dependents EPOd PPO EPO PPO EPOe PPOf
Man 30 $4,000 None $0 $0 70% 90% $15 $7
Man 30 $4,000 Wife and 10 year old son $148 $0 70% 50% $14 $36
Man 30 $1,000 Wife and 10 year old son $289 $54 70% 50% $14 $36
Man 55 $1,000 None $190 $5 70% 50% $14 $36 Woman 30 $4,000 None $116 $0 70% 70% $14 $22 Woman 55 $1,000 None $99 $26 70% 50% $19 $36
a Isapres only accept people younger than 60 years old. b Currency is US dollars 2014 for the entire table. c This contribution refers to the extra amount of money that has to be paid by the enrollee if their mandatory 7% social security payment for health does not cover the entire premium for her and her family. d EPO: Exclusive provider organization - PPO: Preferred provider organization e Out of pocket payments associated with general medical visits in a EPO were calculated using the price for a general visit informed by the corresponding provider on their website. f Out of pocket payments associated with general medical visits in a PPO were calculated using the price for a general visit informed by one of the most expensive providers (Clinica Alemana) on their website.
In general, for research and evaluation purposes, the population insured by the Isapres
has been considered fairly homogeneous, thus type of health insurance may be considered a “proxy” variable for income7.
Neither public nor private health insurance pools, however, are homogeneous in terms of income. Figure 3 shows that every health insurance category covers individuals in almost every income decile of the Chilean population, although high-income individuals are more likely to be privately insured.
6 All plans were retrieved from one specific Isapre website (www.cruzblanca.cl) on 03/27/2014. 7 For example, the public health records have health insurance data but for the most part do not contain income data.

5
Figure 3. Type of health insurance by per capita income decile8
Source: Data from the National Socioeconomic Survey, CASEN 2011 1.2 Healthcare provision
In terms of the provision of services, the public sector provides healthcare services through a network of healthcare facilities ranging from municipality-run primary care centers to nationally administered specialty hospitals spread throughout the country.
The private sector includes private healthcare facilities ranging from an individual doctor’s practice to large integrated systems that offer highly specialized medical care to their contributing members and to the general public. Although researchers in Chile and outside have extensively examined the health insurance market (Bronfman 2011; Höfter 2006; Pardo and Schott 2014; Sapelli 2004; Sapelli and Torche 2001; Sapelli and Vial 1998; 2003), the healthcare providers market has not been the object of much scrutiny.
8 People with a monthly per capita income larger than two million pesos (app. 4000 dollars) are not included in this graph. They account for 0.24% of the total sample and approximately 53% of them were privately insured.
0%
10%
20%
30%
40%
50%
60%
70%
80%
90%
100%
1 2 3 4 5 6 7 8 9 10
Other
Isapre
Fonasa D
Fonasa C
Fonasa B
Fonasa A
Perc
enta
ge o
f the
pop
ulat
ion
cove
red
Per capita Income decile

6
1.2.1 Primary care systems: basic concepts The term primary healthcare was popularized at the Alma-Ata International
Conference in 1978 and refers to “essential health care based on practical, scientifically sound, and socially acceptable methods and technology made universally accessible to individuals and families in the community through their full participation and at a cost that the community and country can afford to maintain at every stage of their development in the spirit of self-reliance and self-determination … It is the first level of contact of individuals, the family, and community with the national health system, bringing health care as close as possible to where people live and work, and constitutes the first element of a continuing health-care process” (Lawn et al. 2008). As it can be appreciated, primary healthcare is a much more richer than the traditional concept of primary care understood purely as individual preventive and curative services provided in the first level of care (Keleher 2001; Nnaji 2011). Evidence about differences in outcomes for both approaches is lacking.
In a study assessing the contribution of primary care systems to health outcomes for the OECD countries, Starfield, Shi and Macinko (Starfield, Shi, and Macinko 2005) identified practice features and structural characteristics of primary care that may be associated with health outcomes. A summary of structural characteristics and practice features of primary care systems is shown in Figure 4.
In this context, the Chilean public primary care network is explicitly based on three principles: longitudinality, comprehensiveness and continuity of care (which includes accessibility and coordination) (Ministerio de Salud de Chile 2012). The government also identifies family/community orientation and a focus on prevention and health promotion as “ethical aspects of the primary care practice”. Additionally, being the first contact with the health system and responsibility for a well-identified population are identified as key elements of primary care practice.

7
Figure 4. Structural characteristics and practice feature of primary care systems
Summarized from (Macinko, Starfield, and Shi 2003; Starfield, Shi, and Macinko 2005; World Health Organization 2008)
As the main hypothesis of this dissertation postulates that individuals who use the
public system have higher utilization of preventive services and primary care services after controlling for need, it is necessary to explore the differences between public and private primary care arrangements. The next section tries to answer the following question: Are public and private primary care systems different?
The first distinction that is important to make is between formal and informal private providers. Many studies include informal private providers when comparing both sectors, so their conclusions need to be qualified by this inclusion. For this dissertation the private sector includes only licensed professionals and excludes informal providers such as “quacks”, lay health workers, drug sellers and shopkeepers.
Two recent literature reviews have explored the differences between public and private providers in low and middle-income countries in terms of performance and quality of care (Basu et al. 2012; Berendes et al. 2011). Basu et al. included all levels of care and found that the private sector failed to follow medical standards of care more frequently and had worst outcomes than the public sector. Moreover, private providers were found to dispense unnecessary medication and procedures and charge higher user fees than the public sector. On the other hand, the private sector was found to have shorter wait times and better hospitality than public facilities. Berendes et al. focused on ambulatory care and found similar results although in terms of clinical practice (adherence to clinical guidelines or standard care procedures) they found the private sector to be “marginally better” (Berendes et al. 2011). Additionally, these authors found that private providers fared better in terms of effort, i.e. “length of consultation
Primary care systems
Structural characteristics • Physician inputs • Regular source of care • Source of financial
resources • Providers payment
mechanism • Financial and logistical
accessibility
Practice features • First-contact access for
every new need • Longitudinality • Comprehensiveness • Coordination of care • Family and community
orientation • Focus on prevention
and health promotion • Continuity of care • Responsibility for a
well-defined population
8
time, whether a physical examination is performed…[and] …number of explanations given”.
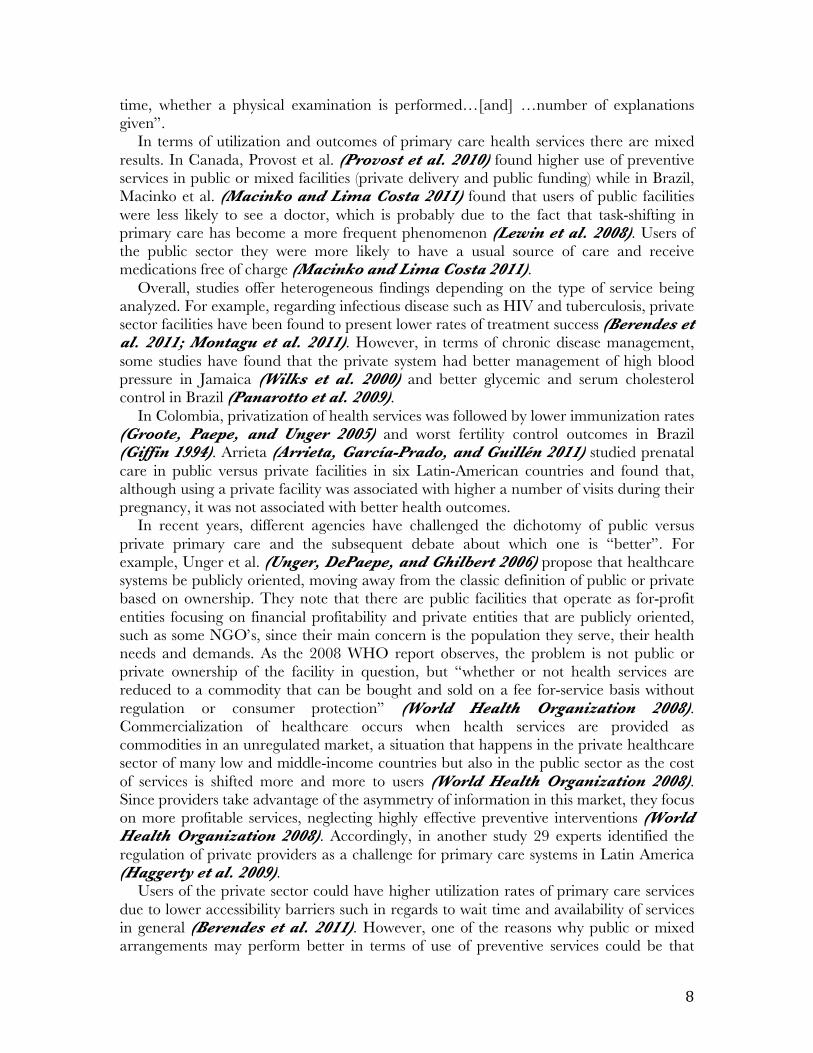
In terms of utilization and outcomes of primary care health services there are mixed results. In Canada, Provost et al. (Provost et al. 2010) found higher use of preventive services in public or mixed facilities (private delivery and public funding) while in Brazil, Macinko et al. (Macinko and Lima Costa 2011) found that users of public facilities were less likely to see a doctor, which is probably due to the fact that task-shifting in primary care has become a more frequent phenomenon (Lewin et al. 2008). Users of the public sector they were more likely to have a usual source of care and receive medications free of charge (Macinko and Lima Costa 2011).
Overall, studies offer heterogeneous findings depending on the type of service being analyzed. For example, regarding infectious disease such as HIV and tuberculosis, private sector facilities have been found to present lower rates of treatment success (Berendes et al. 2011; Montagu et al. 2011). However, in terms of chronic disease management, some studies have found that the private system had better management of high blood pressure in Jamaica (Wilks et al. 2000) and better glycemic and serum cholesterol control in Brazil (Panarotto et al. 2009).
In Colombia, privatization of health services was followed by lower immunization rates (Groote, Paepe, and Unger 2005) and worst fertility control outcomes in Brazil (Giffin 1994). Arrieta (Arrieta, García-Prado, and Guillén 2011) studied prenatal care in public versus private facilities in six Latin-American countries and found that, although using a private facility was associated with higher a number of visits during their pregnancy, it was not associated with better health outcomes.
In recent years, different agencies have challenged the dichotomy of public versus private primary care and the subsequent debate about which one is “better”. For example, Unger et al. (Unger, DePaepe, and Ghilbert 2006) propose that healthcare systems be publicly oriented, moving away from the classic definition of public or private based on ownership. They note that there are public facilities that operate as for-profit entities focusing on financial profitability and private entities that are publicly oriented, such as some NGO’s, since their main concern is the population they serve, their health needs and demands. As the 2008 WHO report observes, the problem is not public or private ownership of the facility in question, but “whether or not health services are reduced to a commodity that can be bought and sold on a fee for-service basis without regulation or consumer protection” (World Health Organization 2008). Commercialization of healthcare occurs when health services are provided as commodities in an unregulated market, a situation that happens in the private healthcare sector of many low and middle-income countries but also in the public sector as the cost of services is shifted more and more to users (World Health Organization 2008). Since providers take advantage of the asymmetry of information in this market, they focus on more profitable services, neglecting highly effective preventive interventions (World Health Organization 2008). Accordingly, in another study 29 experts identified the regulation of private providers as a challenge for primary care systems in Latin America (Haggerty et al. 2009).
Users of the private sector could have higher utilization rates of primary care services due to lower accessibility barriers such in regards to wait time and availability of services in general (Berendes et al. 2011). However, one of the reasons why public or mixed arrangements may perform better in terms of use of preventive services could be that

9
commercialization of care is occurring exclusively in private systems. When commercialization of care does not occur we could expect private facilities to behave as public facilities in terms of provision of preventive services. In Chile, there are a few initiatives that link private provision with public funding (capitation), such as the partnership between the Ministry of Health and the Pontifical Catholic University of Chile. These primary healthcare centers have showed slightly better results than the public system in an array of indicators (Peñaloza, Leisewitz, and Bastías 2010), but have also better results than the private system in the use of preventive services such as pap smears (Téllez T and Aguayo T 2008).
In summary, public or private ownership is increasingly becoming an obsolete indicator for measuring the degree of commercialization of healthcare in low and middle-income countries. However, in Chile, public or private ownership still maps exceptionally well with the degree of commercialization to which primary care users are exposed. The Chilean primary care system will be analyzed in detail in the next chapter.
1.2.2 Public primary care in Chile Chile is more affluent than most other Latin American countries, and thus has been
able to finance a more extensive public health system. As discussed above, Chile has a well-defined public primary care system working along with a private sector composed of a multitude of autonomous small private providers offering primary care services along with secondary and even tertiary care. In the case of the public sector, the first big expansion of the network started in 1924 with the creation of the Seguro Obrero, which collected funds from employers and workers to finance their healthcare (Bass del Campo 2012). In 1952 all primary care centers were transferred to the National Health System until 1980 when the military dictatorship of Augusto Pinochet decentralized the primary care system to local government entities called municipalities, a reform that was never reversed by subsequent democratically elected governments (Becerril-Montekio, Reyes, and Manuel 2011; Manuel 2002). Although decentralization had positive effects such as the empowerment of local authorities to set priorities according to their population’s need, centers have achieved limited autonomy because financing remains centralized and insufficient in itself to cover the Family Health Plan package (Gideon 2001). There is also limited local political autonomy since the Ministry of Health retains considerable priority-setting power for the whole system (Gideon 2001) as well as technical expertise. The process has also been more challenging for rural centers that are even less autonomous due mostly to financial constrains (Atkinson et al. 2008).
In 1998 the Concertación (center-left coalition) government started a process to transform all primary care centers into family health centers. First, a few pilot sites were given special funding to develop care based on the principles of family medicine (Gideon 2001). Currently, most primary care centers have been certified as family health centers.
The last system-wide health reform in Chile was implemented between 2003 and 2005 under the Lagos administration. Its main initiative was the General Guarantees in Health (GGH) Law that created a “system of explicit guarantees in predefined health conditions for access, opportunity, quality of services and financial protection” for the whole population9 (Letelier and Bedregal 2006). For a predetermined list of conditions the
9 In reality, the guarantees are valid for the population that is covered by FONASA or Isapres; 93.1% of the total population in 2011 (fonasa.cl)

10
user has information about the treatment plan that will be applied and how much she or he will have to pay as a user fee10. These health guarantees are fulfilled mostly in the public primary care system; almost 80% of the new health services provided by the GGH plan are being provided in this setting (Bass del Campo 2012). A renewed focus on the primary care system translated into a considerable growth of its budget (Helmke 2011).
In terms of coverage, almost 78% of the Chilean population was actually enrolled in a public primary care center in 201211. Chileans covered by public health plans are eligible to enroll in a public primary care center a process that enables them to receive healthcare in that facility. The public primary care center receives a monthly per capita payment from the central government for every person enrolled. Primary healthcare services are provided in “594 primary health care centers: 258 general clinics located in urban areas and 151 rural clinics; 115 primary health care clinics attached to hospitals; and 70 family health centers” (Pan American Health Organization PAHO - World Health Organization WHO 2007). Medical, nutrition and reproductive healthcare services, laboratory services, low complexity procedures and other primary care services such as pap smears and dental care are available in each primary healthcare center as part of a Family Health Plan. This plan is updated every few years and contains all the services that will be provided in public primary care centers in return for financial resources that are distributed to health centers using a capitation formula (Montero et al. 2008; Verónica Vargas 2006). Health services are organized by stage of development such as infancy, adolescence, adulthood and advanced adulthood (Ministerio de Salud de Chile 2012). A special category is also included for women’s health. A description of the complete package of health services offered through Chile’s Family Health Family Health Plan can be found in Appendix 1.
Since 1965, the Ministry of Health has implemented standardized health programs for children and women of reproductive age (Szot Meza 2002). Health programs for teenagers, adults and seniors were implemented in the nineties. Guidelines for all these programs are communicated to public primary care centers periodically and generic goals are set for them. Financial incentives are transferred to municipalities if goals are met. The guidelines issued by the Ministry of Health specify a list of health services to be offered to the corresponding population; preventive services such as wellness visits and screening for common diseases. Currently, there are three populations that are prioritized in the public primary care system: children, women in reproductive age and senior citizens. These groups receive more intensive services and a higher proportion of people in these groups (compared to non-prioritized groups) have received primary care services under the program. The private system replicates a few of these programs–to some extent–but there is no supervision over private physicians’ practice.
10 Isapre members that have one of the guaranteed health conditions can chose to be covered by the GGH plan in which case they are assigned to a preferred healthcare provider or to be covered by their usual health insurance policy retaining freedom of choice of provider but losing the guarantee aspect of the plan. 11 Percentage calculated using the number of total enrollees in the public system from the Chilean Municipalities Association Information system (http://www.sinim.gov.cl/indicadores/busq_serie_var.php, accessed 2/14/14) and preliminary information of the Chilean Census 2012 http://www.ine.cl/canales/menu/publicaciones/calendario_de_publicaciones/pdf/COMPENDIO_2013.pdf, accesed 2/14/14)

11
As it was mentioned previously, services included in the Family Health Plan are financed by funds allocated by the central government to each municipality using a capitation formula that takes into account the following criteria: urban/rural status, income level of the municipality and percentage of population over 65 years-old (Torche 2009; Verónica Vargas 2006). There are no adjustments for sex composition of the population or their individual income level. Although there are standardized guidelines and goals for every public primary care center based on the same features discussed in Chapter 1 (Ministerio de Salud de Chile 2012), municipalities are not homogeneous in terms of availability of financial resources and productivity since (Alvarado 2002; Arteaga, Astorga, and Pinto 2002) municipalities divert extra funds to healthcare and education as they see fit and are available.
In theory, a capitation scheme should incentivize providers to focus on preventive care (Barnum, Kutzin, and Saxenian 1995) since they could extract more profit from the capitation payment if the population they are responsible for is healthier and does not use services intensively. However, this situation does not operate exactly in this way in practice since capitation payments are transferred to municipalities who distribute the funds at discretion to primary care centers. Furthermore, doctors are salaried so most of the incentives, beneficial or not, of capitation are diluted. A shortcoming of this kind of payment mechanism is that it could incentivize under provision of services and enrollment of low-risk patients to reduce costs (Barnum, Kutzin, and Saxenian 1995) the services that are being provided and there is no patient selection. In fact, these incentives do not apply to public health centers since, as it was mentioned before, they are paid mostly through a global budget by the municipality they belong to. Furthermore, by law, public health centers cannot withhold services or cherry pick low-risk patients and are not allowed to turn away patients that want to enroll (unless they are Isapre members or do not live or work near the center).
In terms of a prevention focus, the Chilean public primary care system is organized on the principles of the Comprehensive Care Model defined as the “set of actions that promote and facilitate efficient, effective and timely care that addresses the person considered in their physical and mental integrity, as social beings belonging to different families and communities which are in constant process of integration and adaptation to their physical environment, social and culture, rather than treating a disease or the person as isolated entities”. The model is based on the principles of person-centeredness, comprehensiveness and continuity of care. It defines a catchment area for the public primary care center and defines its responsibility to keep their population healthy. Given the incentives for prevention and keeping people healthy, the public primary care system has implemented outreach services that are not performed in the private sector such as patient reminders and house visits. For example, if a woman has her women’s health check due, someone from the center would call her to schedule an appointment. In the case of vulnerable individuals such as very poor individuals or bed-ridden senior citizens, the public primary care centers would send a doctor or a nurse to perform the needed care. The supply of these services however is highly variable and there information about these programs is scarce.
One of the main challenges of the Chilean public primary care system is the lack and high turnover of primary care physician (Bass del Campo 2012). Chile has one of the lowest rates of doctors per capita in the OECD (OECD 2013) to begin with and only 9% of these doctors actually work in the public primary care system (Bass del Campo

12
2012) probably due to scarce opportunities for professional development, a busy work schedule and salaries that do not match the ones that can be earned in the private system or as a specialist (Bass del Campo 2012).
Another main concern about the operation of the primary care system is its resolutive capacity, i.e. the ability to deal with a health need within the primary care system avoiding referral to the secondary or tertiary level of care. Although primary care centers refer only 2 to 4% of all cases, there is room for improvement, especially associated with a more intense use of family doctors instead of generalists (Bass del Campo 2012; Püschel et al. 2013).
1.2.3 Private primary care in Chile Regarding the private sector, private healthcare providers flourished after the creation
of Isapres in 1981 and the expansion of the voucher system in Fonasa in the eighties. In the last decade, the private healthcare provider market has been steadily growing in terms of services provided and revenue collected (Leon-Vargas and Martinez-Becerra 2011). Currently, there is no private primary care system as such. Three large ambulatory healthcare networks–which are also vertically integrated with Isapres and hospitals–dominate the ambulatory services market in the private sector. However, approximately 75% of spending in ambulatory care in the private sector corresponds to services provided by small doctors’ associations or solo practices (Leon-Vargas and Martinez-Becerra 2011). As is the case in most Latin American countries and other developing countries, the private healthcare provider market is highly heterogeneous in terms of use of standardized clinical and operational procedures, integration of care and organizational arrangements (Bastias et al. 2008; Basu et al. 2012; Berendes et al. 2011). Therefore, although populations with access to primary care private providers could have a better chance of obtaining the type of health service they seek, the private system does not necessarily provide superior or even equivalent care to that offered through the public system (Arrieta, García-Prado, and Guillén 2011). Evidence about the quality of care of private primary care providers is lacking.
Ambulatory services provided by the private sector are paid using a fee for service scheme through a voucher, i.e. is a fee for service scheme that entails an out of pocket payment, which has been shown to be a deterrent to access and continuity of care (World Health Organization 2008). Fee for service is also associated with supplier induced-demand and rising costs of services whether appropriate or not (Barnum, Kutzin, and Saxenian 1995). This has been the case in the private sector in Chile where costs increases for health services are inflationary12. Furthermore, Isapres do not have incentives to perform care management to promote primary care services since they are vertically integrated; the money they have to spend in health services to provide coverage for their members, they recover on health services performed by their own hospitals and medical centers13.
12 Superintendencia de Salud calcula que IPC referencial para prestaciones IPC referencial para prestaciones de Isapres es de 2,47% http://www.latercera.com/noticia/nacional/2013/03/680-512024-9-superintendencia-de-salud-calcula-que-ipc-referencial-para-prestaciones-de.shtml. (Accesed 4/3/14) 13 Hector Sanchez. ¿Sirve el IPC de la salud? http://diario.latercera.com/2014/03/27/01/contenido/opinion/11-160772-9-sirve-el-ipc-de-la-salud.shtml(Accesed 4/5/14)
13
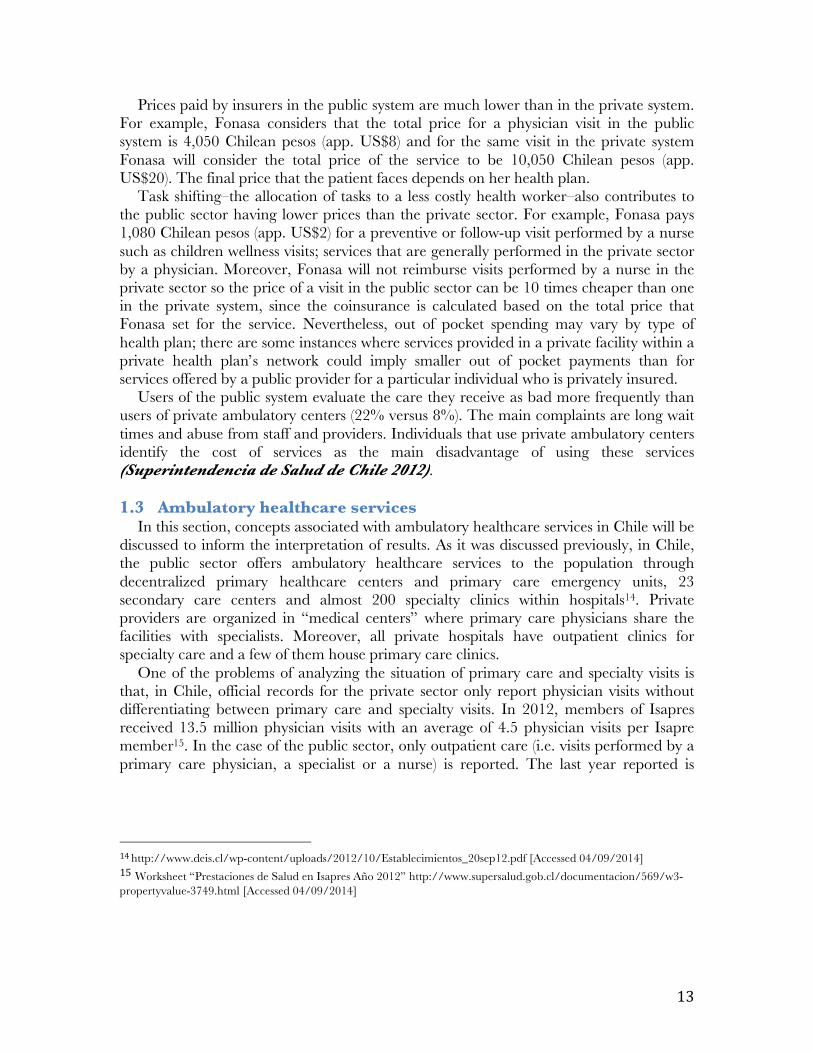
Prices paid by insurers in the public system are much lower than in the private system. For example, Fonasa considers that the total price for a physician visit in the public system is 4,050 Chilean pesos (app. US$8) and for the same visit in the private system Fonasa will consider the total price of the service to be 10,050 Chilean pesos (app. US$20). The final price that the patient faces depends on her health plan.
Task shifting–the allocation of tasks to a less costly health worker–also contributes to the public sector having lower prices than the private sector. For example, Fonasa pays 1,080 Chilean pesos (app. US$2) for a preventive or follow-up visit performed by a nurse such as children wellness visits; services that are generally performed in the private sector by a physician. Moreover, Fonasa will not reimburse visits performed by a nurse in the private sector so the price of a visit in the public sector can be 10 times cheaper than one in the private system, since the coinsurance is calculated based on the total price that Fonasa set for the service. Nevertheless, out of pocket spending may vary by type of health plan; there are some instances where services provided in a private facility within a private health plan’s network could imply smaller out of pocket payments than for services offered by a public provider for a particular individual who is privately insured.
Users of the public system evaluate the care they receive as bad more frequently than users of private ambulatory centers (22% versus 8%). The main complaints are long wait times and abuse from staff and providers. Individuals that use private ambulatory centers identify the cost of services as the main disadvantage of using these services (Superintendencia de Salud de Chile 2012).
1.3 Ambulatory healthcare services
In this section, concepts associated with ambulatory healthcare services in Chile will be discussed to inform the interpretation of results. As it was discussed previously, in Chile, the public sector offers ambulatory healthcare services to the population through decentralized primary healthcare centers and primary care emergency units, 23 secondary care centers and almost 200 specialty clinics within hospitals14. Private providers are organized in “medical centers” where primary care physicians share the facilities with specialists. Moreover, all private hospitals have outpatient clinics for specialty care and a few of them house primary care clinics.
One of the problems of analyzing the situation of primary care and specialty visits is that, in Chile, official records for the private sector only report physician visits without differentiating between primary care and specialty visits. In 2012, members of Isapres received 13.5 million physician visits with an average of 4.5 physician visits per Isapre member15. In the case of the public sector, only outpatient care (i.e. visits performed by a primary care physician, a specialist or a nurse) is reported. The last year reported is
14 http://www.deis.cl/wp-content/uploads/2012/10/Establecimientos_20sep12.pdf [Accessed 04/09/2014] 15 Worksheet “Prestaciones de Salud en Isapres Año 2012” http://www.supersalud.gob.cl/documentacion/569/w3-propertyvalue-3749.html [Accessed 04/09/2014]

14
200616 when the public system performed 71.5 million visits and 0.47 visits per Fonasa member on average17.
1.3.1 Preventive visits
In the National Socioeconomic Characterization Survey, the most comprehensive survey in Chile regarding social services, preventive care visits such as health checkups are identified as “controles”. Health checkups for children and prenatal care are the most salient types of visit that are identified by the Chilean population as a “control”. Other types of care considered “controles” are wellness visits for teenagers, women and adults in general. In the public system, general practitioners, nurses and other healthcare professionals perform these types of visits. General practitioners and specialists such as pediatricians and ob-gyn doctors perform these types of services in the private sector. Although pediatricians and ob-gyn doctors are considered specialists rather than primary care physicians, a wellness visit performed by these professionals is considered a “control” and not a specialty care visit.
Chileans also identify as “controles” follow up visits for chronic conditions such as hypertension or diabetes that are performed by primary care physicians in the public sector and specialists in the private sector, so this concept includes services other than true preventive visits.
1.3.2 Acute care visits
For Chileans, acute care visits are known as “consultas de morbilidad” which generally take place in a public primary care center and are performed by a primary care physician. Although primary care physicians can perform acute care visits in the private sector, specialists perform an unknown number of these visits. As a result, in this case, an acute care visit would be considered a specialty visit. For example, someone with an unspecific stomach discomfort may go to a gastroenterologist in the private sector instead of going to a primary care physician and would report this activity as a specialist visit.
1.3.3 Specialty visits
All visits performed by a specialist, excepting wellness visits and prenatal care, are considered specialist visits in Chile. Chileans consider all doctors as specialists except general practitioners and family doctors (although the Chilean specialty accreditation entity, CONACEM, recognizes family medicine as a specialization18). In the public sector, access to a specialist is subjected to “gate keeping” by a primary care doctor. Long wait lists for specialty care have been a chronic problem in the public sector, mitigated lately by the GGH program (Bitrán, Escobar, and Gassibe 2010; Letelier and Bedregal 2006; Paraje and Vásquez 2012).
16 Calculations from Fonasa worksheet “Actividad”. http://www.fonasa.cl/wps/wcm/connect/e99efa2e-0d7d-4434-8b24-70cb397b752d/Copia+de+03+-+Actividad_pagina_web_20131021.xls?MOD=AJPERES&attachment=true&id=1313787950472 [Accessed 04/09/2014] 17 In 2006, Isapre members used 11.2 million visits with an average of 4.2 visits per Isapre member. http://www.supersalud.gob.cl/documentacion/569/w3-article-3854.html [Accessed 04/09/2014] 18 http://www.conacem.cl/requisitos_especialidad.asp?submit=yes [Accesed 04/17/2014]
15
1.3.4 Emergency care visits Emergency care is performed in every public healthcare facility although most of the
care is provided in hospital emergency rooms and primary care emergency units which are sometimes next to a public primary care center and sometimes stand-alone facilities (Ipinza Riveros 2005). In the private sector, emergency care is only offered in hospitals. In 2011, there were 15.3 million emergency care visits in the public sector; only 400.000 of them required hospitalization19.
Emergency care sometimes is a relief valve for the demand of non-urgent care that cannot be met in public primary healthcare centers (Alvo and Aguirre 2010; Galaz et al. 2004; J. Medina et al. 2007) due to a myriad of reasons: limited availability of appointments in primary care centers, perception of better quality of services in the emergency room, access to specialists, lack of knowledge about the healthcare network, time convenience, and geographic closeness (Galaz et al. 2004; Miranda Viorklumds et al. 2007). There are a few recent studies about the magnitude of this phenomenon; the percentage of people that attend emergency services with a non-urgent condition varies from 26,8% to 76% (Galaz et al. 2004; J. Medina et al. 2007). Most of these conditions are supposed to be treated in the primary care system so emergency visits will be included in the analysis to try to capture this way of accessing primary care services. Unfortunately there is no research regarding use of emergency services in the private system but the Ministry of Health reports that private facilities provided 2.600.166 emergency visits in 201120.
1.4 Cross-utilization of health services between the private and the
public sector The private and public systems are not fully separated; as was discussed previously,
some of the people covered by the public system choose to be treated in private facilities and vice versa. There are three ways in which Fonasa pays private providers for services provided to its members. (i) The first is the voucher system also known as Modalidad Libre Elección or MLE (free-choice system) presented in section 1.1. The others are ii) the direct purchase of highly complex services from private hospitals and dialysis centers and iii) the issuing of GGH vouchers when the public system cannot fulfill the guarantee for a certain member, even members belonging to Fonasa A, who are otherwise not eligible to buy vouchers.
Unfortunately, physician visits are not disaggregated by primary and specialist care in the Fonasa database so it is impossible to know the percentage of primary care visits that were provided using the free choice system. In 2006 –the last available year in the Fonasa indicators series- Fonasa recorded 34,444,110 acute care visits in the public primary care system and 25,766,729 visits in the secondary and tertiary care levels in the public sector21. That same year Fonasa bought 11,352,016 physicians visits (from generalist and specialists) through the free choice system, accounting for 16% of all ambulatory care 19 http://deis.minsal.cl/AtencionesUrgencia/Total_Atenciones_urgencia_2011.htm (Accessed 5/12/14) 20 http://intradeis.minsal.cl/ReportesRemsas/2011/consultas_urgencia/consultas_urgencia.aspx (Accessed 5/12/14) 21 “Actividad” worksheet. http://www.fonasa.cl/wps/wcm/connect/internet/sa-general/informacion+corporativa/estadisticas+institucionales/estadisticas+institucionales (Accessed 2/15/14)

16
(public and private) bought by Fonasa in that year22. The other two ways in which Fonasa purchases services (direct purchase and GGH vouchers) in the private sector are related with the secondary and tertiary level of care. Both mechanisms represented 4% of total Fonasa regular money transfers in 201223.
In 2012, Isapre members demanded 12,224,487 generalist and specialist physician visits24 in the private sector and only 515,254 visits in the public sector. Isapres paid more per visit to private providers than public providers but out-of-pocket spending was 5 times higher in the private sector due to higher prices and differences in coinsurance rates25. For example, Isapres paid on average $40.9 per physician visit in the private sector and $29.3 for the same service in the public sector. Since the mean coinsurance rate was 60.7% in the private sector and 87.9% in the public sector, mean out of pocket payments per visit were $16.3 and $3.5 respectively26.
Gap in the literature with respect to the patterns of cross-utilization of services between
the private and public sector
It is commonly understood in Chile, that middle-income individuals (either publicly or privately insured) will go to the private sector for inexpensive services and will prefer the public sector for more costly services. Low-income populations may demand services in the private sector in cases of long waitlists in the public sector. However, the individual socio-demographic factors associated with the decision of demanding services in the private sector and the actual pattern of use of private and public providers by different population groups have not yet been explored. This dissertation will add to the literature by exploring these relationships.
1.5 The relationship between socioeconomic status, health insurance and utilization of primary care services in Chile
Healthcare utilization inequities in Chile have been documented over the last two decades. For this dissertation, health inequalities or disparities have to be “systematically associated with social advantage” and subsequently considered unfair and unjust to be considered health inequities (Braveman and Gruskin 2003). Social advantage has been traditionally defined by socioeconomic status, gender, educational level and occupational status among others (Braveman and Gruskin 2003).
Since the 1990s, studies have shown important socioeconomic inequalities in health services utilization associated with ambulatory care in Chile (Figure 5). In terms of income, Vega et al. found no association between income and use of preventive visits (Vega et al. 2001). However, a series of studies have found a positive relationship 22 Ibid. 23 “Balance Presupuestario” worksheet. http://www.fonasa.cl/wps/wcm/connect/internet/sa-general/informacion+corporativa/estadisticas+institucionales/estadisticas+institucionales (Accessed 2/15/14) 24 Ambulatory visits are not disaggregated by level of care 25 Data from the Chilean Health Superintendence http://www.supersalud.gob.cl/documentacion/569/w3-article-8342.html (Accessed 2/15/14) 26 Ibid.

17
between high income and utilization of ambulatory services (Balsa, Rossi, and Triunfo 2009; Jadue H et al. 2004; Olavarria 2005; Wallace and Gutierrez 2005). This is probably explained by the fact that individuals with higher incomes can access private providers more easily than low-income people can since both public and private plans for middle and high-income individuals allow them to have access to physician visits if they are willing to pay the associated out-of-pocket costs personally. A recent study focusing on the evaluation of the GGH plan found that the association of income and unmet needs disappeared after the implementation of the plan suggesting that low-income individuals with a condition covered by the plan are not foregoing care (Frenz et al. 2013).
Regarding the use of screening tests, income inequalities were found for prostate exams and mammograms, but not for pap smears or breast exams in individuals 60 years or older in Santiago, the capital of Chile (Balsa, Rossi, and Triunfo 2009). Visits to general practitioners were inconsistently associated with income in two studies using concentration and horizontal inequality indexes (Paraje and Vásquez 2012; Vásquez, Paraje, and Estay 2013).
Results are also inconsistent for health insurance. Vega et al. found that being publicly insured was associated with a higher probability of having had a preventive visit and a visit to a general practitioner in the last three months when controlling for age, sex and income (Vega et al. 2001). This study only used two categories of type of health insurance (public and private) and analyzed its association with utilization of preventive visits conditional to having reported being sick or having had an accident. Furthermore, other factors affecting healthcare utilization such as health need, geographic location of the patient and education were not included in the analysis. Another study showed a similar relationship between public insurance and receiving any healthcare services when demanding them (Jadue H et al. 2004). In contrast, two studies showed a positive relationship between being privately insured and having a physician visit in the last 4 months (Balsa, Rossi, and Triunfo 2009; Wallace and Gutierrez 2005). These two studies do not differentiate between primary care visits or specialty visits. Finally, Frenz et al. showed no association between health insurance type and unmet health care needs, before or after the implementation of GGH (Frenz et al. 2013).
Gap in the literature regarding key gradients in health services utilization in Fonasa health plans
To date, studies have only compared Fonasa enrollees with Isapre members. Some
studies have added a category for uninsured and no published studies have distinguished key gradients in Fonasa health plans, which offer different benefits in terms of access to private services and coinsurance rates. This dissertation will add to the existing literature by studying the association of different public healthcare plans vis-à-vis being privately insured with the use of primary care services in the private sector and the subsequent utilization of primary care services in Chile (both preventive and acute care).

18
Figure 5. Literature review matrix: Primary health care services utilization by income and type of health insurance in Chile Independent variables Authors Data and
Methods
Income Type of health insurance
Need Other Outcome variable
Inequalities?
Preventive visits Yes. Favoring low income Sapelli, Vial (1998)
CASEN 271994 • Logistic regression • Concentration indices
(Wagstaaf and van Doorslaer)
Income quintiles No Yes Age, sex Acute care visits
Yes. Favoring high income. Only for the highest quintile.
Preventive visits Public insurance was protective. Lowest quintile has a higher probability of a preventive care visit
Vega, Bedregal, Jadue, Delgado (2001)
CASEN 1994-1998 • Logistic regression
Income quintiles Fonasa, Isapre and other
Yes Age, sex
Acute care visits Public insurance is protective. Quintiles, other way round
Jadue, Delgado, Sandoval, Cabezas, Vega (2004)
CASEN 2000 • Logistic regression
Income quintiles Fonasa, Isapre and other
Yes Age, sex, ethnicity, residing in rural areas.
Receiving healthcare services after having a health problem and demanding healthcare
Private health insurance and pertaining to the lower income quintile associated with lack access to health care.
Olavarria (2005) CASEN 1987-2000 • Probit regression
Socio-economic classification (indigent, almost poor, poor and middle/high-income)
No Yes Age, sex, residing in rural areas and marital status
Receiving healthcare services after having a health problem and demanding healthcare
Yes, favoring the middle/high-income group
Wallace, Gutierrez (2005)
SABE28 2000 • Logistic regression
Wealth (asset index)
Public, Private, military and none
Yes
Age, sex, educational level
Medical visit in the last 12 months
Yes. Lowest wealth quintile and public insurance worse off
27 The CASEN is a nationally representative survey of the entire population 28 The Survey on Health, Well-Being and Aging (SABE) was administered to people 60 years old and over in Santiago de Chile, the capital city of Chile, in 2000.

19
Figure 5 continued Independent variables Authors Data and
Methods
Income Type of health insurance
Need Other
Outcome variable
Inequalities?
Balsa, Rossi, Triunfo (2009)
SABE 2000 • Concentration indices
(Wagstaaf and van Doorslaer)
Imputed household income from nationally representative household surveys contemporan-eous to SABE (log income)
Fonasa, Isapre and no insurance at all
Yes.
Alcohol consumption, sedentary life, use of tobacco and diet
Physician visit in the past 4 months
Horizontal inequity favoring the rich in access to physician visits in the past 4 months and prostate exams (income but not health insurance) and in mammograms (income and health insurance) No evidence of inequities in pap smears and breast exams.
Paraje & Vasquez, (2012)
Casen 2003 &2009 • Concentration and
Horizontal Inequity indices
Income per equivalent adult
Fonasa, Isapre and no insurance at all
No Age, sex, working status, area and political region
Number of visits to general practitioners, specialists, ER and other.
Visits to general practitioners went from a moderately pro-poor CI to moderately pro-rich. Specialty visits became slightly more pro-poor.
Vasquez, Paraje and Estay (2013)
Casen 2000, 2003 & 2009 • Concentration and
Horizontal Inequity indices
Disposable income per equivalent adult
Fonasa, Isapre and no insurance at all
Yes Age, sex, country region, education, employment, activity, ethnicity, rural or urban residence
Health status variables Number of visits to general practitioners, specialists, ER and others.
Use of GP visits has a pro-poor distribution but specialist visits are pro-rich. Major contributors to this inequality are private health insurance and education.
Frenz, Delgado, Jaufman and Harper (2013)
Casen 2000 & 2009 multivariable logistic regression
Income quintiles Fonasa, Isapre, Armed forces and none
No Education level, ethnicity, urban–rural residence, sex and age, AUGE treatment.
Unmet need for healthcare
Considerable drop in the estimated proportion who had not received formal health system services for their recent problem In 2009 neither income nor type of health insurance predicted unmet healthcare needs.
20
1.6 Summary of the overview of the Chilean Healthcare System Despite a growing body of literature on health and healthcare access inequities in
Chile, the relationship between use of services in the private sector by type of health insurance plan and its association with healthcare utilization has not been explored. A wider scope than the one used in previous research is needed to shed light on the diverse factors that determine access to different types of primary care delivery systems and subsequently to primary care services i.e. preventive services and acute care visits. It is now clear that in Chile, those with higher income have higher ambulatory care utilization in general, and that being insured is critical for gaining healthcare access (Jadue H et al. 2004; Sapelli and Vial 2003). However, due to the structure of the Chilean healthcare system, some of these relationships can be more complex than they first appear. Low-income individuals are generally publicly insured and have access mainly to the public system where they are immersed in a primary care system that operates roughly based on the principles of Alma Ata, a very different scheme than the one in operation in the private sector. As people gain more income they can pay for more services, but they also have the option of getting health insurance in the private or public sector, and of getting access to a myriad of health plans with highly heterogeneous coverage packets and benefits. Plans for middle-income individuals are not as generous as the ones being offered to high-income individuals. Further research is needed on the extent to which Chileans access private providers for primary care, the mechanisms that mediate access to various types of healthcare services and its consequences for primary care utilization.

21
Chapter 2. Conceptual Framework, research questions and hypotheses
The conceptual framework underpinning the proposed research is based on the Andersen model of healthcare access (Andersen 1995).
2.1 Andersen model: Health services utilization
Andersen and Aday have studied healthcare access and its determinants since 1960. Their theory has evolved into a comprehensive model depicted in Figure 6 (Andersen 1995).
Figure 6. An Model of Healthcare Access
Source: Andersen (1995)
When first proposed, this framework defined healthcare access as use of health services or healthcare utilization. With subsequent revisions (Andersen 1995), the model expanded to include health outcomes, i.e., health status (perceived and evaluated) and consumer satisfaction. Traditionally, health services utilization has been measured in discrete units of service such as physician visits or days of inpatient care. More recently other measures such as “type, site, purpose or coordinated care received in case of illness” have been developed and used to assess access to care (Andersen 1995). In any case, the type of service we focus on will determine which of the predictors of access to care is more important, for example, inpatient care would be influenced more by need factors than dental visits (Andersen 1995).
Andersen starts his model with the environment, specifically with the healthcare system and the external environment (physical, political and economic). Next, he describes predisposing characteristics of the individual, such as age, gender, social structure (e.g., occupation, education and ethnicity), health beliefs, genetic factors and psychological

22
characteristics which are factors that promote or discourage an individual’s use of health services thereby affecting health outcomes. Enabling resources, both individual and collective, are generally necessary but not sufficient for healthcare utilization, and they affect health outcomes as well. Health personnel and facilities, income, health insurance, a regular source of care and travel and waiting times are frequently used to measure enabling resources. In his 1995 revision of the model, Andersen explicitly mentions the need to include in some way more detailed organizational factors that could be affecting health services utilization and the specific health insurance benefits that an individual has (Andersen 1995) instead of general measures such as does/does not have or public/private health insurance. Need, both perceived and evaluated, is considered the proximal determinant of the use of health services and of health outcomes. Perceived need of healthcare is largely a social phenomenon “explained by social structure and health beliefs” while evaluated need is defined by health professionals based on the individual’s health status. Finally, Andersen proposes that personal health practices are impacted by the aforementioned factors but are also predictors of health outcomes (Andersen 1995).
It is critical to note that, in this revised version, Andersen sets up his model with the determinants influencing each other, health behavior and health outcomes. These factors also influence some of the previous groups of factors (Andersen 1995), a fact which translates into a real methodological challenge in terms of the endogeneity of the dependent and independent variables involved.
In his model, Andersen describes two types of access: potential and realized. Potential access is simply defined as the “presence of enabling resources” (Andersen 1995). Realized access, sometimes also called achieved access, is the “observed use of services” (Wallace and Gutierrez 2005) or healthcare utilization, which is a measure of health access, that too often is overly “broad and nonspecific” (Andersen 1995). Generally, health services use is operationalized by measuring the number of physician visits in a determined period of time or the rate of surgeries in a defined population. A problem using these measures is that they generally assume that, after controlling for need, a higher use of physician visits is inherently good (Aday et al. 2004). This depends on the type of visit and the control variables available to adjust for health need. Regarding preventive visits, it is safe to assume that more is better, especially if these preventive services are provided in the context of a standardized health plan which prevents doctors from ordering unnecessary procedures and screening test (Farley et al. 2010; Maciosek et al. 2006). Assuming health needs have been controlled for properly, the inherent usefulness of acute care visits and specialty visits is related to the specific conditions associated with the visit. For instance, it may be good for a woman with cancer to use the healthcare system more intensively, while for another woman with a minor surgical condition two or three visits should suffice. In the case of emergency visits, it is debatable whether a higher utilization rate is good. It may be useful in places where there is no access to hospitals and doctors. On the other hand a high utilization rate of emergency visits can be a reflection of a very sick community living in a dangerous location.
Additionally, both health services use and health insurance choice are endogenous variables, since being insured increases the probability of use of services (moral hazard), and more use of services would predict a higher probability of choosing to be insured (self selection). Both phenomena have been documented in the Chilean health system (Sanhueza and Ruiz-Tagle 2002; Sapelli and Vial 2003). Use of services can also be

23
endogenous to health status or health outcomes. As shown in Andersen’s model, positive health outcomes will influence not only predisposing and enabling factors but would directly decrease healthcare utilization. 2.2 Conceptual model, research question 1 and hypotheses: Choice
of primary care provider in the private sector in Chile The overall goal of this dissertation is to assess whether using public providers rather
than private providers as a preferred venue for seeking primary care services associated with higher utilization of primary care services.
To answer this question two derived research questions are posited. The first one relates to the decision of various population sub-groups to seek primary healthcare in a public or a private healthcare facility. Given the fact that the goal of the dissertation is to assess whether individuals that use the public system rather than private providers have higher utilization of primary care services, the analyses will focus on the differentials in utilization of services between Fonasa A enrollees (who are supposed use intensively the public) compared with individuals enrolled in Fonasa B, C, D and in ISAPRES. Future work will explore differences between specific Fonasa plans besides Fonasa A, but these analyses are beyond the scope of this dissertation.
The conceptual models that guide this research are depicted in the next two figures. The first model illustrates the relationship between health services utilization in primary care and predisposing, enabling and need factors, focusing specifically on choice of primary healthcare provider (Figure 7). Type of health insurance is expected to be strongly correlated with choice of private versus public provider for various types of visits. Individuals enrolled in Fonasa A would be the least likely to choose a private provider since they have no financial access to private providers through their plan, while individuals enrolled in Fonasa B, C and D would more likely choose a private provider than Fonasa enrollees A because they can get partial reimbursement for the services they buy. Isapre members will be the most likely to choose a private provider since they have better coverage of services in the private sector and because having a strong preference for private providers is associated with choosing private insurance. Income is expected to be highly correlated with choosing a private provider since use of private providers requires out-of-pocket payments.
To explore the relationship between type of health insurance and choice of private provider and subsequently with primary care services utilization, preventive and acute care visits were used as dependent variables. Sensitivity analyses also included utilization of specialty and emergency care visits, since primary care services might have been misclassified by respondents as specialty visits or emergency care as it was discussed in section 1.3.
In sum, for this dissertation purposes, primary care services refer to preventive and
acute care visits and ambulatory care services refer to a combination of preventive, acute care, specialist and emergency care visits.
Other determinants of choice of private providers such as price of services,
geographic location of the provider, perceived service and amenities, expected wait time and perceived quality of care were explored qualitatively. We would expect that price of

24
services deters individuals from choosing a private provider. In terms of geographic location, there is no clear prediction about which type of provider is considered more convenient to people and how much users value this feature of service. Private providers tend to concentrate in high and middle-income urban areas where there is a sufficiently large percentage of Isapres enrollees or individuals that have access to Fonasa vouchers. As it was explained in Chapter 1, the public healthcare network reaches almost every location of the national territory, however there is no published research about the availability of private services in urban and low-income areas. In general, private services are expected to be associated with shorter wait time and better (perceived) service, amenities and perceived quality of care.
• Research question 1: What are the determinants of choice of private versus public
primary healthcare provider in Chile? o Research question 1.1: Is type of health insurance (Fonasa A versus all
other public and private plans) associated with choice of private versus public provider after controlling for socio-demographic characteristics?
! H1.1.a. Individuals enrolled in Fonasa A will be less likely to have chosen a private provider for all types of visits (preventive, acute care, specialty and emergency care) than individuals in other health insurance groups.
o Research question 1.2: How do out of pocket expenditures associate to services, geographic location of the provider, perceived service and amenities, perceived quality of care and expected wait time influence the choice of private versus public primary care provider?
! H1.2.a. Higher out of pocket expenditure associated with services in the private sector will deter individuals from choosing private providers.
! H1.2.b. Geographic location of private centers will be deemed more convenient than geographic location of public centers.
! H1.2.c. Respondents will perceive quality of care as better in private primary care centers.
! H1.2.d. Respondents will expect to have a shorter wait time in private primary care centers.
! H1.2.e. Respondents will perceive service and amenities as better in private primary care centers.
Hypothesis 1.1.a. will be tested using regression models; H1.2.a to H1.2.d and H1.3.a were explored using qualitative data.

25
Figure 7. Conceptual model: Choice of delivery organization
2.3 Conceptual model, research question 2 and hypotheses: Health services utilization in primary healthcare in Chile The second conceptual framework (Figure 8) links type of health insurance to health
services utilization. In this model, predisposing factors are directly associated with health services utilization and health needs act as mediators. Women, children, older people and groups with low education levels have higher health needs and consequently demand primary healthcare services more frequently (Aguilar Cavallo 2008; Jadue H et al. 2004; Vega et al. 2001). Living in a rural area or in a municipality where there is low availability of healthcare providers has been shown to predict a lower probability of utilizing health services (Jadue H et al. 2004; Olavarria 2005) and belonging to an indigenous group has also being associated with lower rates of health services utilization (Cohen and Crabtree 2008; Jadue H et al. 2004). Income level influences utilization through various pathways. In Chile, a higher income is associated with a higher probability of being privately insured (Salud 2010; Sanhueza and Ruiz-Tagle 2002; Sapelli and Vial 2003) and having lower healthcare needs (Basu et al. 2012; Subramanian and Blakely 2003).
Given the Chilean health system structure, income is expected be positively associated with utilization particularly for individuals who seek care in the private sector, due to co-payments (Holst, Laaser, and Hohmann 2004). Finally, choice of healthcare provider could be associated with utilization. Seeking primary healthcare

26
services in the private healthcare network is hypothesized to be associated with a lower probability of primary care services utilization; an hypothesis that will be tested using type of health insurance as a proxy for choice of private versus public provider. We postulate that publicly insured enrollees in plans other than Fonasa A who have access to non-accredited private providers and may be inserted in a system that does not incentivize preventive care thereby decreasing use of primary care services.
The rationale for conducting sensitivity analyses using specialty and emergency care visits as alternative measures of primary care services utilization was presented previously for research question 1. For utilization of services, rather than analyze the association between type of health insurance and specialist and emergency visits directly, an indicator of ambulatory care called “combined visits” will be used as a dependent variable to explore the possibility that individuals that use the private system as a preferred venue (such as Fonasa D and Isapre members) get their preventive services in other settings such as the specialist office as it was discussed in section 1.3.
The out of pocket expenditures associated with the services patients regularly use, appointment availability and the use of reminders and outreach activities use may have also an impact on utilization of primary care services. These factors were explored qualitatively.
The second research question explores the effect of type of health insurance on primary care services utilization. If type of health insurance (specifically being enrolled in Fonasa A) is found to be associated with choice of private versus public provider (research question 1), the former will be used as a proxy of a private preferred venue for getting primary care services in order to answer the overall research question.
• Research question 2: What are the determinants of primary care services utilization in Chile?
o Research question 2.1: Is type of health insurance associated with having had a primary care visit in the last three months after controlling for socio-demographic characteristics?
! H2.1.a. Fonasa A enrollees will be more likely to have had a primary care visit in the last three months than individuals enrolled in Fonasa B, C, D or in Isapres.
! H2.1.b. The magnitude of the association between type of health insurance and primary care services utilization described above will be larger for priority groups in the public system (children and elderly over age 65)
! H2.1.c. Priority groups will report having less access barriers for primary care services than other age groups.
o Research question 2.2: Is type of health insurance associated with having had an ambulatory care visit (any preventive, acute care, specialist care or emergency care visit) in the last three months after controlling for socio-demographic characteristics?
! H2.2.a. Non-priority groups (teenagers and adults) enrolled in Fonasa A will be less likely to have had an ambulatory care visit in the last three months compared with their counterparts enrolled in Fonasa B, C, D or in Isapres.

27
! H2.2.b. For priority groups, there will be no difference in ambulatory care services utilization between Fonasa A enrollees compared with their counterparts enrolled in Fonasa B, C, D or in Isapres.
o Research question 2.3: How do hypothesized determinants of utilization of primary care services such as out-of-pocket expenditures associated with services patients regularly use, appointment availability, use of reminders and outreach activities and comprehensiveness of care differ between public and private providers?
! H2.3.a. Respondents will report higher out-of-pocket expenditures for primary care services in the private sector.
! H2.3.b. Respondents will report better appointment availability in the private sector.
! H2.3.c. Public sector providers and users of public services will report a more intense use of reminders and outreach activities
! H2.3.d. Patients and providers will report more comprehensive services in the public sector.
Hypotheses 2.1.a., 2.1.b, 2.2.a and 2.2.b were tested using regression models;
Hypotheses 2.1.c and 2.3.a to 2.3.d were explored using qualitative data. It is worth noting that, Fonasa A enrollees are expected to be less likely to have had
a specialty visits than other health insurance groups, however results for this analysis are beyond the scope of this dissertation and not reported in the results section so this hypothesis is not included in this section.
In the same vein, although emergency care visits were included in the analysis to build a combined indicator of ambulatory care utilization, there is not a clear prediction of how type of health insurance influence utilization in this case so emergency care has not been included in the hypotheses section for research question 2.
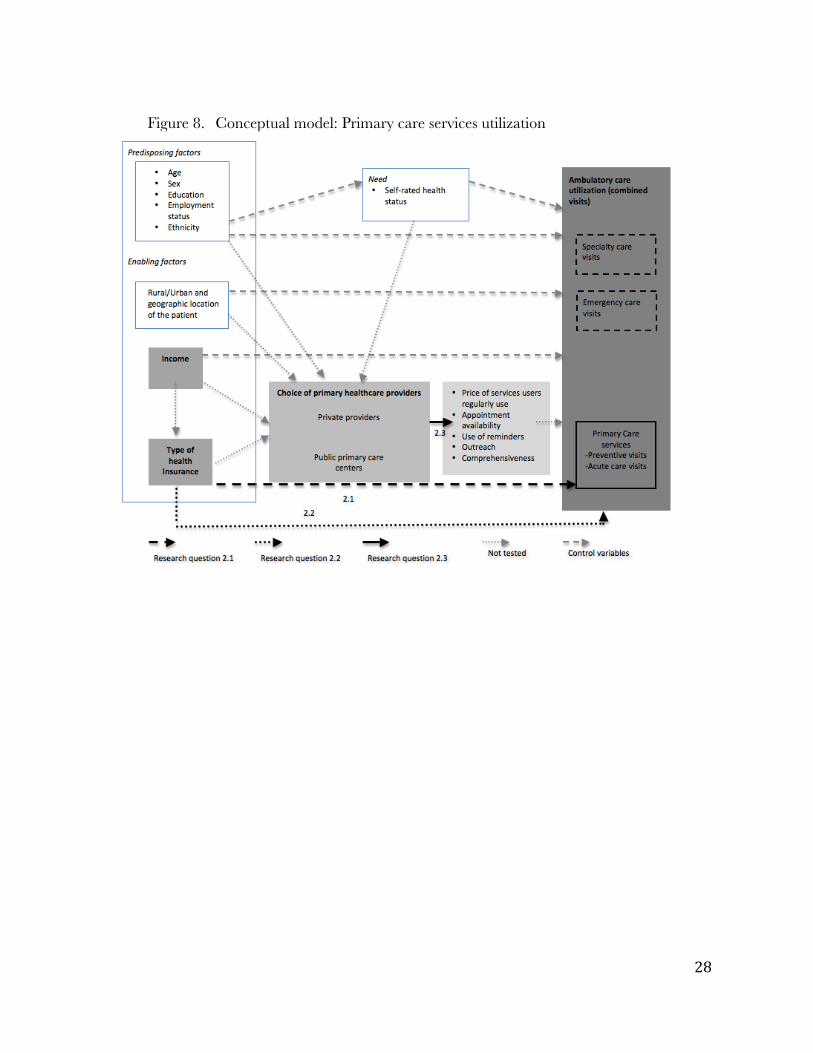
28
Figure 8. Conceptual model: Primary care services utilization

29
Chapter 3. Quantitative methods
The proposed research requires a mixed-methods approach. First, a cross-sectional database was used to answer the following research questions:
• Research question 1.1: Is type of health insurance (Fonasa A versus all other public and private plans) associated with choice of private versus public provider after controlling for socio-demographic characteristics?
• Research question 2.1: Is type of health insurance associated with having had a primary care visit in the last three months after controlling for socio-demographic characteristics?
• Research question 2.2: Is type of health insurance associated with having had an ambulatory care visit (any preventive, acute care, specialist care or emergency care visit) in the last three months after controlling for socio-demographic characteristics?
It is important to note that only individuals enrolled in Fonasa and Isapres were included in the analyses since they represent approximately 94% of the population29. As it was described in Chapter 1, Fonasa and Isapres insure the majority of the population in Chile but there is still some portion of the population who is insured by the Armed Forces system or has no insurance at all. Weighted proportions are shown in Table 1.
Table 1. Type of health insurance, CASEN 2011.
Type of health insurance Weighted % Fonasa A 33.2% Fonasa B 25.7% Fonasa C 11.2% Fonasa D 7.5% Fonasa-don't know letter 3.8% Armed Forces health insurance 1.9% Isapre 12.6% None 2.6% Other 0.5% Don't know 1.1% Total 100%
Fonasa insures approximately 81% of the population, while Isapres only insure 12.6%.
The other options amount to 6% of the whole population. Only individuals enrolled by Fonasa and Isapres, the two largest groups, will be included in the analysis. It is important to note that 3.8% of Fonasa enrollees do not know in which plan they are enrolled. In terms of sex and income, this group is similar to Fonasa D, but they are older than other groups, similar to the Fonasa B group (analyses not shown). People who did not know which Fonasa plan they were enrolled in were omitted from the analyses (listwise deletion).
29 Percentage calculated using the CASEN 2011 survey. In the CASEN everybody is allowed to report only one insurance type. Furthermore, it is not possible to be enrolled in Fonasa and Isapre at the same time, so we did not have to deal with dual membership to one type of health insurance.

30
The results of quantitative analyses were complemented with qualitative data that explore in depth some of the pathways through which the observed relationships between type of health insurance and private provider choice and primary care services utilization might be established. This chapter will focus on the quantitative methodology of the dissertation. 3.1 Data Sources and sample Characteristics
Research question 1.a and 2.a was addressed using de-identified cross-sectional data from the Chilean Socioeconomic Characterization Survey (CASEN) 2011 that contains health services utilization data. The CASEN is a comprehensive survey that collects data grouped in six modules: 1) socio-demographic30, 2) education, 3) labor, 4) income, 5) health and 6) housing.
The last version of this nationally representative survey sampled 57,357 households (200,302 individuals) between November 2011 and January 2012. The sample was drawn using a multistage sampling technique. Strata were geographically defined by combining the municipality level with urban or rural status of zones within each municipality. Ultimately, 583 strata were defined. The primary sampling units corresponded to census tracts (households conglomerates), and secondary sampling units were defined as households within those sections. Consequently, the weighted survey sample is representative of the population at the municipality level (for a total of 324 municipalities).
3.2 Variables
Research Question 1 Although the database contains a question about choice of public or private
provider, the question is only asked of respondents who reported having had a visit in the previous months, which makes it impossible to calculate a utilization rate for individuals that regularly choose the private sector for primary care services versus a rate for those who usually chooses the public sector. Such a rate would need to be calculated dividing the people who used healthcare services and prefer private services by the total population that regularly chooses private services. For this motive, we will use type of health insurance (which is reported for everyone in the sample) as a proxy of preferring a private or a public venue for getting primary care services. However, this preference is not dichotomous. Theoretically, there is a gradient where Fonasa A enrollees use the public system the most since they have no access to vouchers to buy health services. Individuals in the remaining public health plans are expected to use the private system increasingly (since they are wealthier as they approach the D plan) while Isapre members are expected to use private services almost all of the time. To make an argument about health insurance group membership actually being a proxy of using the public or private system as a preferred venue ⎯and later explore if regular use of the private system is related to lower or higher utilization of primary care services (preventive and acute care visits)⎯we will determine, for those people who actually had access to a determined type of visit, how strong the relationship between type of health insurance and choice of 30 This module is divided into two modules; module 1 “Registro de Residentes” includes traditional socio-demographic information such as sex, age and marital status; module 2 “Residentes” collects information such as father’s and mother’s education, ethnicity and access to technology.

31
provider actually is, controlling for other variables that are associated with choice of provider such as age and education.
Since some users may be getting primary care services from specialists or at the emergency room, choice of private provider for these services were added as a sensitivity analysis. The reason for including specialist visits is because some people that regularly use the private sector do not demand primary care services from general practitioners or family doctors but rather go directly to a specialist. For example, someone that has recently been diagnosed with hypertension would directly demand services from a cardiologist instead of visiting a family doctor like it would be the case in the public sector.
In the case of emergency services, as it was discussed in section 1.3.4, individuals demand care in a emergency room for non-urgent basic care when they cannot have access to public primary care centers or office hours are not convenient. For this reason, analysis of this type of visits was included.
In summary, choice of private provider was analyzed for preventive, acute care, specialty and emergency visits.
The percentage of people choosing to go to a private healthcare provider for each health insurance group by type of health service was calculated taking into account complex survey features of the CASEN. Hypotheses were tested using the following variables.
• Dependent Variables:
o Choice between a private and a public healthcare provider (0=private, 1= public) for the last visit (preventive, acute care, specialist and emergency care) using the following survey question, “If you have had a [the corresponding type of visit] in the last three months, in what kind of institution did you access [the corresponding type of visit] the last time?” The categories are public (public primary care facility, public rural medical center, public specialty medical center, public primary care emergency service, public hospital emergency room, public hospital) or private (private clinic, medical center or hospital, armed forces facility, private emergency room, occupational hospital, student health services, other). Choice of private provider was analyzed for preventive, acute care, specialty and emergency visits in the last three months.
• Independent Variables o Type of health insurance: Fonasa A (reference category), B, C, D and Isapre.
• Control variables o At the individual level a vector representing the variables in the following table
(Table 2) was added to the regression.
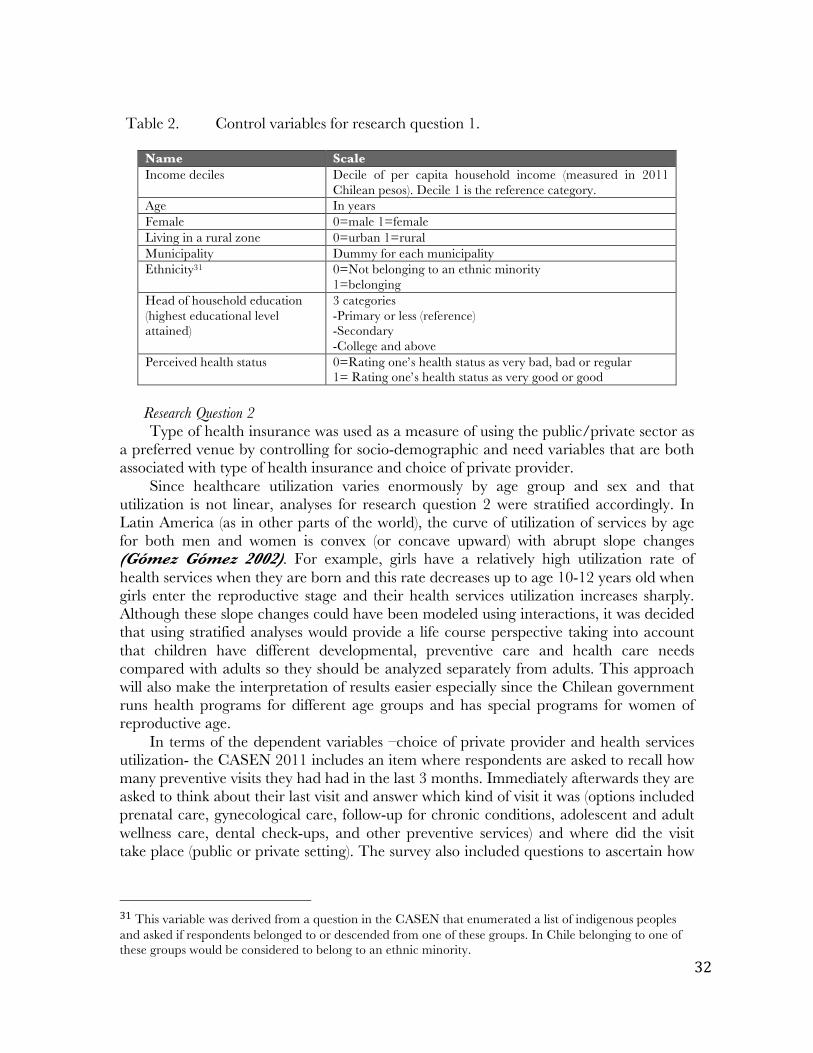
32
Table 2. Control variables for research question 1.
Name Scale Income deciles Decile of per capita household income (measured in 2011
Chilean pesos). Decile 1 is the reference category. Age In years Female 0=male 1=female Living in a rural zone 0=urban 1=rural Municipality Dummy for each municipality Ethnicity31 0=Not belonging to an ethnic minority
1=belonging Head of household education (highest educational level attained)
3 categories -Primary or less (reference) -Secondary -College and above
Perceived health status 0=Rating one’s health status as very bad, bad or regular 1= Rating one’s health status as very good or good
Research Question 2 Type of health insurance was used as a measure of using the public/private sector as
a preferred venue by controlling for socio-demographic and need variables that are both associated with type of health insurance and choice of private provider.
Since healthcare utilization varies enormously by age group and sex and that utilization is not linear, analyses for research question 2 were stratified accordingly. In Latin America (as in other parts of the world), the curve of utilization of services by age for both men and women is convex (or concave upward) with abrupt slope changes (Gómez Gómez 2002). For example, girls have a relatively high utilization rate of health services when they are born and this rate decreases up to age 10-12 years old when girls enter the reproductive stage and their health services utilization increases sharply. Although these slope changes could have been modeled using interactions, it was decided that using stratified analyses would provide a life course perspective taking into account that children have different developmental, preventive care and health care needs compared with adults so they should be analyzed separately from adults. This approach will also make the interpretation of results easier especially since the Chilean government runs health programs for different age groups and has special programs for women of reproductive age.
In terms of the dependent variables –choice of private provider and health services utilization- the CASEN 2011 includes an item where respondents are asked to recall how many preventive visits they had had in the last 3 months. Immediately afterwards they are asked to think about their last visit and answer which kind of visit it was (options included prenatal care, gynecological care, follow-up for chronic conditions, adolescent and adult wellness care, dental check-ups, and other preventive services) and where did the visit take place (public or private setting). The survey also included questions to ascertain how
31 This variable was derived from a question in the CASEN that enumerated a list of indigenous peoples and asked if respondents belonged to or descended from one of these groups. In Chile belonging to one of these groups would be considered to belong to an ethnic minority.
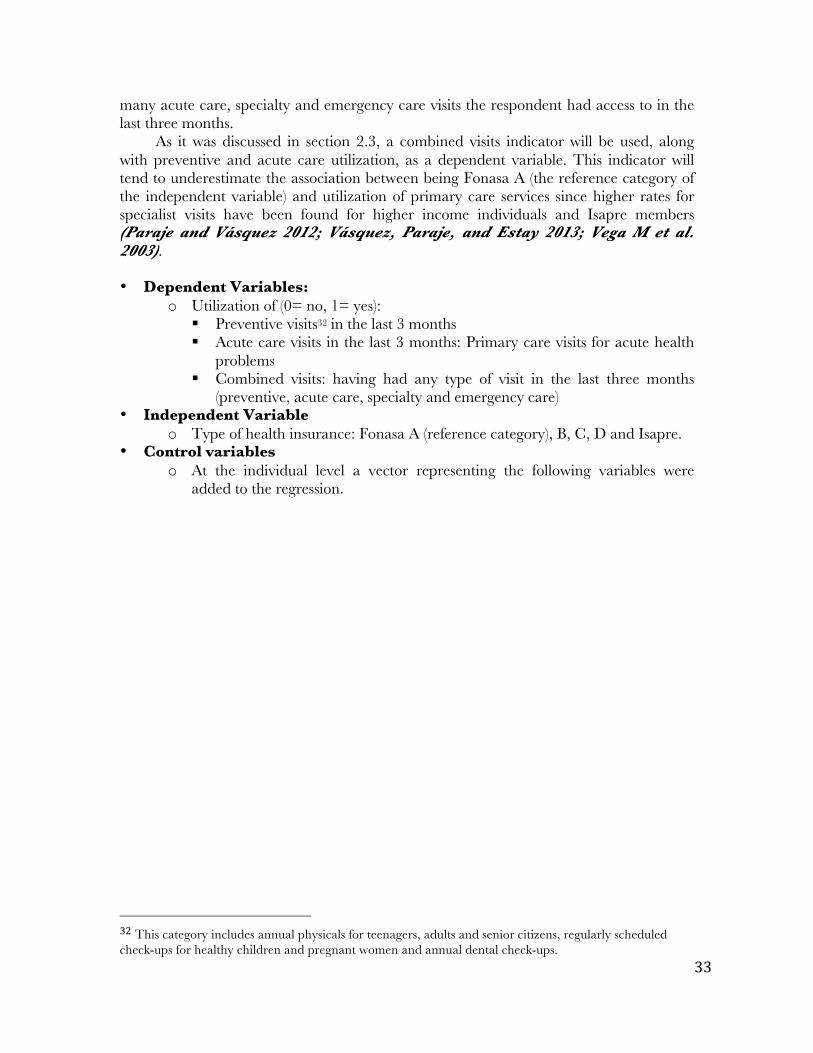
33
many acute care, specialty and emergency care visits the respondent had access to in the last three months.
As it was discussed in section 2.3, a combined visits indicator will be used, along with preventive and acute care utilization, as a dependent variable. This indicator will tend to underestimate the association between being Fonasa A (the reference category of the independent variable) and utilization of primary care services since higher rates for specialist visits have been found for higher income individuals and Isapre members (Paraje and Vásquez 2012; Vásquez, Paraje, and Estay 2013; Vega M et al. 2003). • Dependent Variables:
o Utilization of (0= no, 1= yes): ! Preventive visits32 in the last 3 months ! Acute care visits in the last 3 months: Primary care visits for acute health
problems ! Combined visits: having had any type of visit in the last three months
(preventive, acute care, specialty and emergency care) • Independent Variable
o Type of health insurance: Fonasa A (reference category), B, C, D and Isapre. • Control variables
o At the individual level a vector representing the following variables were added to the regression.
32 This category includes annual physicals for teenagers, adults and senior citizens, regularly scheduled check-ups for healthy children and pregnant women and annual dental check-ups.
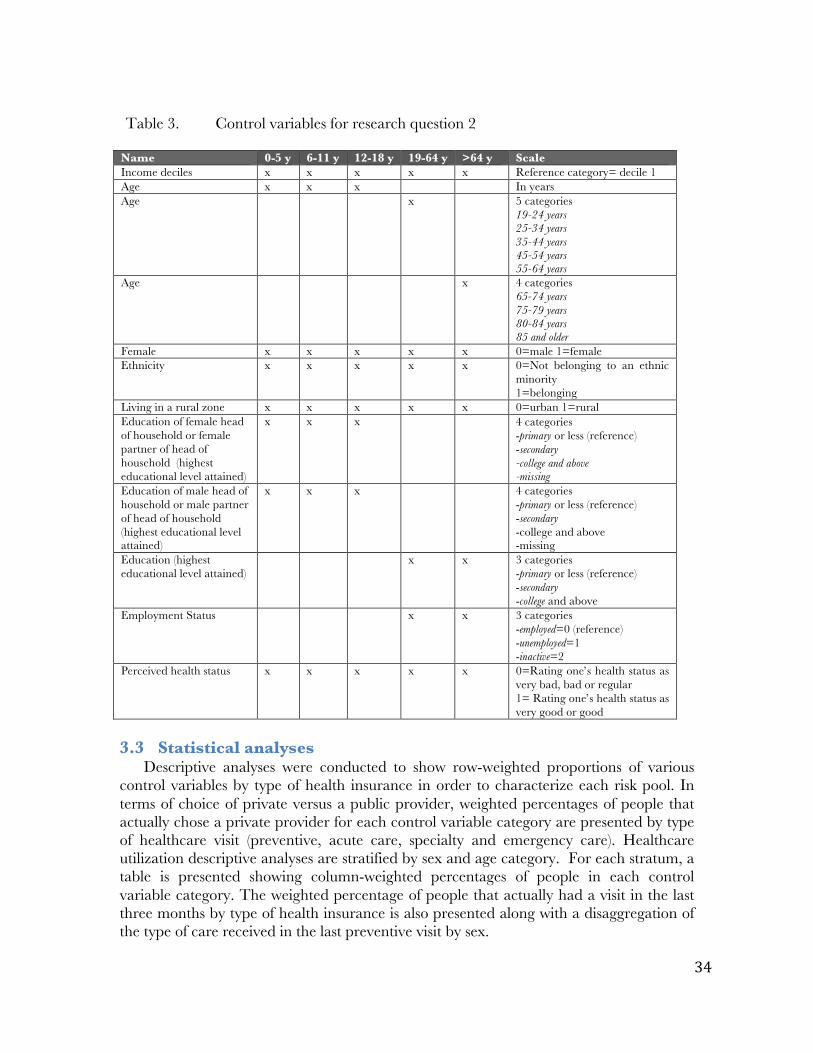
34
Table 3. Control variables for research question 2
Name 0-5 y 6-11 y 12-18 y 19-64 y >64 y Scale Income deciles x x x x x Reference category= decile 1 Age x x x In years Age x 5 categories
19-24 years 25-34 years 35-44 years 45-54 years 55-64 years
Age x 4 categories 65-74 years 75-79 years 80-84 years 85 and older
Female x x x x x 0=male 1=female Ethnicity x x x x x 0=Not belonging to an ethnic
minority 1=belonging
Living in a rural zone x x x x x 0=urban 1=rural Education of female head of household or female partner of head of household (highest educational level attained)
x x x 4 categories -primary or less (reference) -secondary -college and above -missing
Education of male head of household or male partner of head of household (highest educational level attained)
x x x 4 categories -primary or less (reference) -secondary -college and above -missing
Education (highest educational level attained)
x x 3 categories -primary or less (reference) -secondary -college and above
Employment Status x x 3 categories -employed=0 (reference) -unemployed=1 -inactive=2
Perceived health status x x x x x 0=Rating one’s health status as very bad, bad or regular 1= Rating one’s health status as very good or good
3.3 Statistical analyses
Descriptive analyses were conducted to show row-weighted proportions of various control variables by type of health insurance in order to characterize each risk pool. In terms of choice of private versus a public provider, weighted percentages of people that actually chose a private provider for each control variable category are presented by type of healthcare visit (preventive, acute care, specialty and emergency care). Healthcare utilization descriptive analyses are stratified by sex and age category. For each stratum, a table is presented showing column-weighted percentages of people in each control variable category. The weighted percentage of people that actually had a visit in the last three months by type of health insurance is also presented along with a disaggregation of the type of care received in the last preventive visit by sex.

35
Since the dependent variables are dichotomous variables, logistic regression was most appropriate to use. To account for geographic clustering in the error term due to important geographic disparities of ambulatory and inpatient care supply in the Chilean health system (Arteaga, Astorga, and Pinto 2002; Berer 2011; Mainardi 2007), we controlled for municipality-level fixed effects to reduce any upward bias in the effect of type of health insurance on primary care services utilization rates, since the number of primary healthcare providers in a geographical area would be positively correlated to private insurance and positively correlated to primary care services utilization. The Breusch-Pagan Test and the joint-effect test of municipalities were used to test for the significance of error clustering. If clustering existed, fixed effects and random effects models were estimated and the more appropriate model was selected using a Hausman test.
All models are written in the equations below with utilization of preventive visits as the dependent variable. The same models were estimated with other dependent variables as well, regressing acute care, specialty and emergency visits on the independent variable and socio-demographic factors.
3.4 Statistical methods
Quantitative analyses were performed using Stata version 11 (STATA Corp., TX, USA). Logistic transformations of the following equations were tested taking into account complex survey features (svy command) and not. Survey features changed significantly the results of the analyses so results are presented only for regressions using complex survey features. These hypotheses were tested treating µj as random effects and then treating them as fixed effects (adding a vector for municipality dummies). Results are similar so, to be conservative, fixed effects are used to better control for confounders. All predicted probabilities were calculated using marginal effects at the mean. H1.1.a Models
€
Choiceprivateij = f (β0 + β1Insuranceij + β2Cij + µ j +υij ) Where,
i indicates the individual level, and j indicates the municipality level
€
Choiceprivateij = choosing a private healthcare provider in the context of a healthcare visit (preventive, acute care, specialty and emergency)
€
β1Insuranceij = vector representing type of health insurance
€
Cij = vector representing socio-demographic characteristics and health needs
(Table 2).
€
µ j= municipality-specific error component
€
υ ij= idiosyncratic individual-level error component.

36
H2.1.a. Models
€
Previj = f (β0 + β1Insuranceij + β2Cij + µ j +υij ) Where,
i indicates the individual level, and j indicates the municipality level
€
Previj = having had a preventive visit in the last three months (The same model will be used for acute care and combined visits)
€
β1Insuranceij = vector representing type of health insurance
€
Cij = vector representing socio-demographic characteristics and health needs
(Table 3).
€
µ j= municipality-specific error component
€
υ ij= idiosyncratic individual-level error component.

37
Chapter 4. Qualitative methods
To explore the research questions 1.2 (How do out of pocket expenditures associated with services, geographic location of the provider, perceived service and amenities, perceived quality of care and expected wait time influence the choice of private versus public primary care provider?) and 2.3 (How do hypothesized determinants of utilization of primary care services such as out-of-pocket expenditures associated with services patients regularly use, appointment availability, use of patient reminders and outreach activities and comprehensiveness of care differ between public and private providers?), healthcare providers and patients of the private and public systems were asked to assess structural characteristics and practice features of the systems they usually used. An analysis of interview data along with a description of how qualitative findings complement quantitative findings is presented in Chapter 5.
4.1 Design
The design is cross-sectional, using interviews with both providers and patients. For providers, the study used in depth semi-structured interviews of key-informants (clinic managers) to collect data, since this part of the study aims to provide the researcher with detailed descriptions of how primary care systems fare vis-à-vis the various primary care features and structural characteristics mentioned in Figure 4, and what aspects of this evaluation seem most relevant in the Chilean context.
4.2 Study site
Data were collected in the municipality of San Miguel in Santiago, Chile. This municipality was selected because it has good representation of low and middle-income populations and has a small number of public and primary care centers, which allows for inclusion in the sample of the majority of primary care providers in a municipality. Actually, the totality of public primary healthcare centers (2) and 5 private centers out of 8 were included in the final providers sample.
4.3 Sample and recruitment
Sample and recruitment strategies for providers and patients are described in the following sections. 4.3.1 Providers
Clinic managers and practicing physicians from the two public primary care centers in San Miguel were interviewed (1 clinic manager and 1 physician in each center). Clinic managers and physicians from five private primary care centers were selected at random from a list obtained from the yellow pages and were interviewed. In terms of organizational size, the sample for providers was composed by two large centers with more than 100 healthcare professionals and a broad offer in terms of ambulatory care; and three small practices with less than 20 healthcare professionals each. We were not able to contact physicians from two small private centers. All interviewees were contacted by phone and appointments were set up at their earliest convenience either in their offices

38
or in an office in the University of Chile School of Public Health. None of the providers refused to participate in the study.
4.3.2 Patients
Focus groups were conducted to explore how users of public healthcare facilities make sense of the experience of seeking and receiving primary care services and their assessment of the systems that provide them. A purposive sample stratified by income was used to conduct 3 focus groups with patients of public primary care centers Focus groups were composed of 6 to 8 people. Participants for the focus groups were contacted after a fitness session organized by one of the public primary care centers. Before the session, the interviewer provided the potential subject with an information sheet and requested the person’s consent to participate in the study. Focus groups were unbalanced in terms of sex and age; more than two thirds of participants were women over 60 years old so data is likely to reflect this group’s opinion about primary care instead of the opinion of all users of the system. More than three-fourths of respondents in the three focus groups were Fonasa A enrollees. Unfortunately, individual socio-demographic characteristics of focus groups participants cannot be linked to specific responses in the focus groups transcripts. Given the fact that respondents were participating in fitness sessions, it can be assumed that they are a healthier subset of public primary care users. Also, since they are participating in an activity hosted by the center, they are likely to have a better opinion about it than individuals that do not participate in such events.
Short interviews were employed with 30 patients who sought care in the private primary care sector since it was not possible to organize focus groups for this population. Private sector patients were selected at random in the waiting room of a private medical center. More than two-thirds of respondents were women. Half of all respondents were adults between 31 and 50 years old and Isapre members accounted for half the sample. Patients were asked to step into a small room to be interviewed for about 45 minutes. The refusal rate for private patients was 66%. Compared to study participants, refusers were more likely to be males and young adults. Additionally, since respondents were contacted while using healthcare services, the final sample may contain a larger proportion of people with a worse health status than the general population.
4.4 Data collection and analysis
I collected all the data for this portion of the dissertation. In both interviews and focus groups, open-ended questions were asked using an interview guide and probes where appropriate. Both methods of data collection were audio-recorded and transcribed after their completion. After a couple of interviews the researcher determined what changes needed to be made in terms of pursuing emergent themes and/or changing the recruitment strategy. This process was repeated a couple of times to allow for reflexivity in the research process. To increase reliability, after transcription, the researcher and another research assistant coded and analyzed all interviews using the Dedoose research tool33. To minimize researcher bias the author of the dissertation secured the help of one research assistant (24 year old Chilean male) while conducting interviews and focus groups and another one (23 year old American female) for the coding and analyzing of data. 33 www.dedoose.com

39
Individual socio-demographic characteristics (age, sex and type of health insurance) of short interview respondents were inputted in the Dedoose research tool to perform stratified analyses. An audit trail was maintained after transcription by the production of various types of memos.
The interview guide for both providers and users of primary care systems contained questions asking them to assess the following structural characteristics and practice features of their primary health care system and their impact on healthcare utilization and health outcomes:
Figure 9. Qualitative component: Structural characteristics and practice features assessed by providers and users of primary care systems.
The users’ interview guides additionally included questions querying respondents
about the reasons for choosing either a public or private provider as their preferred provider of primary care services.
The interview guide was developed before the final research questions were determined by the author and contain much more information that the one that was actually used for this dissertation. The analytic strategy then was to look for codes that were related to each specific hypothesis and summarize the corresponding main ideas. All ideas related to each specific hypothesis are presented in the results section, highlighting the ones that help explain quantitative results.
The complete interview guide for providers and users can be found in the Appendices section (Appendix 4). Other fieldwork material such as recruitment letters (Appendix 2) and informed consent forms (Appendix 3) are also found in this section.
Structural characteristics • Physician inputs: Availability of trained primary care
physicians versus specialists • Accessibility of services: Patients’ ability to use primary care
services when they need it
Practice features • First contact: the extent that primary care provides entry into
the health system • Coordination: the ability of primary care providers to
coordinate use of other levels of health care • Comprehensive care: includes curative, preventive, and
rehabilitative services • Longitudinality: the extent to which the system is designed to
provide a regular source of care over time. • Family and/or community orientation • Continuity of care: being seen by the same provider at each
visit or having a medical home.

40
4.5 Human Subjects Protection and Ethical Considerations The University of California, Berkeley Committee for Protection of Human Subjects
(Protocol # 2012-04-4189) and the University of Chile Institutional Review Board approved this study. Measures were taken to protect confidentiality of study data. Informed consent was sought from each prospective subject.

41
Chapter 5. Results
In this section, descriptive results will be displayed in section 5.1 for type of health insurance, the main independent variable. Later, both descriptive and analytic results will be presented in section 5.2 for choice of primary care provider and section 5.3 for healthcare utilization. Qualitative results related to choice of provider and healthcare utilization will be presented in the corresponding sections.
5.1 Health insurance
Almost 60% of Fonasa A enrollees belong to the first four deciles of income (Table 4). However, it is interesting to note that even some individuals in the tenth decile (the richest) are able to acquire this kind of insurance that should be reserved to individuals with no or very little income. This group of people is older and has a higher percentage of men than other income groups.
Isapre members, on the other hand, belong mainly to the three top income deciles. Fonasa B and C enrollees belong to the deciles in the middle and Fonasa D enrollees most frequently belong to the top 5 deciles (Table 4). In this regard, there are no noticeable differences between men and women (data not shown). People in plans other than Fonasa or Isapre, belong to the top four income deciles (analysis not shown). Table 4. Health insurance type by per capita household income decile, CASEN
2011 (n=181,561) Column % (weighted) Per capita
household income decile
Fonasa A (n= 72,101)
Fonasa B (n= 52,903)
Fonasa C (n= 21,862)
Fonasa D (n= 14,075)
Isapre (n= 20,620) Total
1 19.0% 6.6% 4.9% 1.8% 1.6% 9.8% 2 14.9% 9.2% 7.6% 3.1% 1.5% 9.5% 3 13.5% 11.1% 9.8% 5.2% 1.2% 9.9% 4 11.7% 11.4% 11.1% 6.6% 2.1% 9.7% 5 11.8% 12.7% 11.5% 7.7% 3.2% 10.5% 6 9.4% 12.1% 13.5% 12.0% 5.1% 10.3% 7 7.2% 12.2% 11.2% 14.3% 6.0% 9.5% 8 6.2% 10.9% 12.3% 15.2% 11.4% 9.8% 9 4.3% 8.0% 10.9% 18.1% 20.4% 9.6% 10 2.0% 5.9% 7.4% 16.1% 47.6% 11.4% Total 100% 100% 100% 100% 100% 100%

42
Table 5. Per capita household income decile by health insurance type, CASEN 2011 (n=181,561) Row % (weighted) Per capita
household income decile
Fonasa A (n= 72,101)
Fonasa B (n= 52,903)
Fonasa C (n= 21,862)
Fonasa D (n= 14,075)
Isapre (n= 20,620) Total
1 71.2% 19.1% 6.0% 1.5% 2.3% 100.0% 2 57.9% 27.5% 9.7% 2.7% 2.2% 100.0% 3 50.2% 31.8% 12.0% 4.3% 1.7% 100.0% 4 44.4% 33.3% 13.8% 5.5% 3.0% 100.0% 5 41.8% 34.6% 13.3% 6.0% 4.3% 100.0% 6 33.8% 33.7% 15.9% 9.5% 7.1% 100.0% 7 27.9% 36.6% 14.3% 12.3% 9.0% 100.0% 8 23.6% 31.8% 15.3% 12.7% 16.7% 100.0% 9 16.5% 24.0% 13.8% 15.4% 30.4% 100.0% 10 6.5% 14.7% 7.8% 11.5% 59.5% 100.0% Total 36.9% 28.5% 12.1% 8.2% 14.3% 100.0%
Table 5 shows how the proportion of people enrolled in Fonasa A decrease as
income rises. In every income decile there is a sizeable portion of the population that is enrolled in Fonasa B and this is most striking in the 9th and 10th deciles where Fonasa B enrollees are more numerous than Fonasa D enrollees although most of them would fall in the D category in terms of income. Approximately a third of people in the 9th decile are enrolled in Isapres but almost a quarter was also enrolled in Fonasa B, not the highest Fonasa income category. The 10th income decile is the only one that shows a large proportion of people enrolled in Isapre (59.5%). Characteristics of the health insurance enrollees in the public and private insurance market differ as shown in Table 6. In terms of age, Fonasa A insures a higher proportion of children and also women 19-54 years of age, while the proportion of adults enrolled in Fonasa B increases with age. Enrollment in Fonasa D and Isapre peaks at 25-34 years old and decreases steadily with age (Table 6) for both women and men (analyses not shown here). Also consistent with cherry picking is the fact that a higher proportion of men are enrolled in Isapres.
Almost ethnic minorities are enrolled in Fonasa A. Enrollment in Isapre is much lower than for individuals that don’t belong to an ethnic minority. A similar situation occurs for individuals living in rural areas; in fact the percentage of people that live in a rural area and is an Isapre member is so small that findings may not be generalizable to these areas.
In terms of education, college education educated heads of households are mostly are mostly enrolled in Isapres, while those having a primary education or less are mostly publicly insured in the Fonasa A health plan. Less than 3% of heads of household with no more than a primary education are enrolled in Isapres.
As expected, unemployed and inactive individuals are mostly enrolled in Fonasa A whereas individuals who are employed are mostly enrolled in Fonasa B (32%) followed by Fonasa A (26%) and Isapres (18%). Lastly, individuals that report having a health status less than good are disproportionally enrolled in Fonasa A and are less frequently enrolled in Isapres than individuals that report having a good or very good health status (15.7% versus 6.4% respectively).

43
Table 6. Type of health insurance by control variables, CASEN 2011 (n=181,561)
Variable CASEN 2011 Row weighted% Fonasa A
(n= 72,101)
Fonasa B (n= 52,903)
Fonasa C (n= 21,862)
Fonasa D (n= 14,075)
Isapre (n= 20,620)
Women Male 33.7% 28.6% 12.9% 9.1% 15.7% Female 39.8% 28.5% 11.5% 7.3% 13.0%
Age 0-5 46.6% 20.0% 12.1% 8.9% 12.4% 6-11 44.8% 22.4% 12.9% 7.0% 12.8% 12-18 40.7% 24.5% 14.0% 7.1% 13.8% 19-24 36.3% 28.1% 12.7% 7.1% 15.8% 25-34 32.3% 24.5% 13.8% 11.0% 18.4% 35-44 32.9% 26.7% 15.1% 8.6% 16.6% 45-54 32.6% 28.9% 13.4% 8.7% 16.3% 55-64 35.3% 34.5% 8.7% 7.9% 13.6% 65-69 38.5% 43.2% 5.7% 5.4% 7.2% 70-74 35.9% 44.7% 4.4% 7.8% 7.2% 75_79 37.4% 47.9% 3.7% 5.9% 5.1% 80_84 37.1% 46.6% 5.9% 6.0% 4.4% 85 and older 35.7% 48.1% 5.6% 6.0% 4.5%
Belongs to an ethnic minority No 35.6% 28.8% 12.3% 8.3% 15.0% Yes 51.1% 25.6% 10.6% 7.1% 5.7%
Living in a rural area No 34.2% 28.4% 12.7% 8.8% 15.9% Yes 55.2% 29.1% 8.6% 3.7% 3.4%
Education of head of household (for people 0-18 years old)
Primary or less 60.5% 22.9% 9.5% 4.4% 2.7% Secondary 32.8% 26.2% 19.2% 10.2% 11.6% College and above 9.5% 13.1% 11.2% 12.5% 53.8%
Education (for people 19 and older)
Primary or less 48.2% 35.9% 8.3% 5.1% 2.5% Secondary 27.4% 30.4% 15.7% 10.5% 16.0% College and above 7.7% 15.9% 11.5% 13.3% 51.7%
Employment status (for people 19 and older)
Employed 26.0% 31.6% 14.4% 10.1% 18.0% Unemployed 55.1% 21.7% 9.3% 5.5% 8.4% Inactive 43.6% 31.0% 8.2% 6.3% 10.9%
Perceived health status Fair, poor and very poor 44.9% 32.8% 9.0% 7.0% 6.4% Good or very good 35.4% 27.8% 12.7% 8.4% 15.7%

44
In summary, most people are enrolled in Fonasa A or B. Only the 9th and 10th decile have a sizeable Isapre population; Fonasa mostly insures people in every decile, except the 10th.
5.2 Choice of private provider
People in Fonasa B, C or D choose a private provider more frequently than Fonasa A enrollees as did Isapre members who were the group that used private services more intensively (Table 7).
Notably, Fonasa A enrollees buy specialist services in the private sector almost half of the time, although they cannot get any reimbursement for them. Additionally, almost a third of Fonasa A enrollees looking for emergency services decided to use a private provider (Table 7). It is interesting to note that even though Fonasa D enrollees can get services from private providers, only 37% of them chose to do so when seeking preventive care.
In terms of differences in choice of provider by age group, infants and older adults chose to go to a private provider less frequently than other age groups for preventive and acute care visits. All other types of visits are very similar (analyses not shown here). Table 7. Chose a private provider by type of health insurance and type of visit,
CASEN 2011.
Table 7 shows that there is a marked proportion of individuals who seek primary
care services in the public sector but go to the private sector when they need specialty services. This behavior is particularly evident among Fonasa A enrollees.
As income increases the percentage of individuals who choose a private provider increases for every type of visit (Table 8).
% of people that chose a private provider in the last three months by type of visit
Insurance Preventive (n= 44,172)
Acute care (n= 28,112
Specialty (n= 16,548)
Emergency care (n= 17,234)
Fonasa A 4.84% 4.28% 44.96% 29.72% Fonasa B 14.43% 16.68% 67.12% 34.27% Fonasa C 29.52% 31.69% 75.30% 39.32% Fonasa D 36.69% 43.09% 82.07% 52.49% Isapre 93.76% 83.71% 98.73% 90.27% Total 22.19% 25.22% 72.05% 39.74%

45
Table 8. Chose a private provider by type of visit and per capita household income decile, CASEN 2011.
Weighted % of people that chose a private provider for each type of visit Per capita
household income decile
Preventive (n= 44,172)
Acute care (n= 28,112
Specialty (n= 16,548)
Emergency care (n= 17,234)
1 6.28% 6.99% 49.00% 35.09% 2 7.06% 9.51% 60.75% 26.66% 3 10.81% 9.35% 59.21% 32.52% 4 11.29% 12.63% 62.60% 35.06% 5 11.12% 12.91% 54.22% 28.94% 6 17.70% 18.22% 65.29% 33.70% 7 20.92% 21.99% 71.35% 39.55% 8 33.00% 32.32% 76.82% 48.72% 9 49.21% 51.50% 87.11% 57.07% 10 71.43% 68.69% 91.83% 80.16%
More women seek care in the private sector and specialists are the type of care most
sought out by users of any age, gender, ethnicity, income and health status (Table 9). In terms of age, choice of a private provider peaks at 19 to 34 years old and it is
more frequent for college educated and employed individuals. The expected patterns are observed for education and employment. People with a higher education level and that are employed choose a private provider more frequently. As expected, people living in a rural area and belonging to an ethnic minority is correlated with choosing a private primary care provider less frequently.

46
Table 9. Choice of private provider by various control variables, CASEN 2011.
Variable CASEN 2011 (n=200,302) Weighted % of people that chose a private provider
for each type of visit Preventive Acute care Specialty Emergency
care Women
Female 25.4% 36.7% 77.1% 45.0% Male 22.8% 32.9% 69.9% 37.5%
Age 0-5 20.7% 29.2% 71.4% 41.4% 6-11 31.5% 34.6% 77.4% 39.2% 12-18 31.9% 36.5% 77.8% 37.1% 19-24 32.5% 46.2% 71.3% 48.0% 25-34 38.6% 43.7% 79.8% 46.2% 35-44 32.3% 31.7% 79.0% 42.8% 45-54 28.6% 25.2% 70.3% 37.5% 55-64 20.9% 19.8% 72.2% 35.4% 65-69 17.2% 14.2% 66.4% 39.4% 70-74 13.3% 12.8% 61.9% 39.0% 75-79 19.0% 14.2% 58.8% 39.9% 80-84 15.8% 14.6% 70.8% 38.5% 85 and older 16.6% 16.5% 77.4% 39.0%
Belongs to an ethnic minority No 24.5% 27.6% 73.0% 40.8% Yes 15.2% 14.4% 67.4% 38.4%
Living in a rural area No 26.0% 28.9% 73.1% 40.7% Yes 10.4% 11.4% 68.1% 39.1%
Head of household or partner education (for people 0-18 years old)
Primary or less 9.9% 14.7% 63.1% 31.2% Secondary 24.1% 35.2% 71.2% 36.6% College and above 66.9% 74.7% 94.2% 73.2%
Education (for people 19 and older) Primary or less 11.0% 9.9% 57.8% 32.8% Secondary 34.6% 36.0% 75.0% 46.5% College and above 71.6% 65.5% 93.9% 66.4%
Employment status (for people 19 and older)
Employed 34.8% 35.7% 78.8% 44.4% Unemployed 26.2% 23.6% 63.9% 36.3% Inactive 17.8% 16.5% 65.8% 38.2%
Perceived health status Fair, poor and very poor 18.1% 14.9% 65.7% 36.6% Good or very good 26.1% 32.3% 75.9% 42.4%

47
5.2.1 Regression results The Breusch-Pagan test and the joint-effect test of the municipality dummies showed
a significant amount of clustering in all regression models. For most regression models, the Hausman test between random effects and fixed effects models using unweighted data rejected the null hypothesis that both estimators were consistent. For this reason, and given that the unweighted models overestimated the effect of the independent variable on the outcome, the weighted fixed effect estimator is reported for comparison purposes.
5.2.1.1 Health insurance Hypothesis 1.1.a
For both women and men, health insurance is a predictor of choice of provider (i.e. public versus private) for every type of visit, controlling for all relevant variables (Table 10 and Table 11). The marginal effect of insurance34 on the predicted probability of choosing a private provider is larger for preventive and specialty visits than for acute care and emergency care visits. The magnitude of the effect of being enrolled in Isapre on choosing a private provider is rather large. For example, women enrolled in an Isapre had a 83 percentage point higher probability of choosing a private provider, rather than a public provider, for a preventive visit compared to women enrolled in Fonasa A (marginal effect calculations not shown). Also for preventive visits, women enrolled in Fonasa C and D had a 33 percentage point higher likelihood of choosing a private provider than women enrolled in Fonasa A, while women in Fonasa B had a 12 percentage point higher likelihood. Interestingly, emergency visits follow a similar pattern. Regarding acute care visits, differences in choice of private versus public provider are more marked for Fonasa enrollees, for example women enrolled in Fonasa D have a 52 percentage point higher likelihood of choosing a private provider than a Fonasa A enrollee. Differences between Fonasa A and other health plans are more attenuated in the case of specialty visits, given the fact that, as we observed in Table 7 almost 45% of all specialty visits for Fonasa A enrollees are provided in the private sector.
Women were slightly less likely to choose a private provider for specialty and emergency care visits (2 to 4 percentage point in analyses not shown).
In summary, type of health insurance is a strong predictor of choice of a private provider for every type of visit, even after controlling for income and other relevant variables for both men and women.
5.2.1.2 Covariates
For both women and men, education of the head of household is positively associated with use of a private provider for preventive and acute care visits (Table 10 and Table 11) after controlling for all other covariates. Income is also a predictor of choice of private provider especially for preventive and acute care visits for both sexes and for specialty visits for women. Having a good health status is associated with being more likely to choose a private provider for acute care visits after controlling for health insurance, income, age and education.
34 Marginal effects calculations not shown.
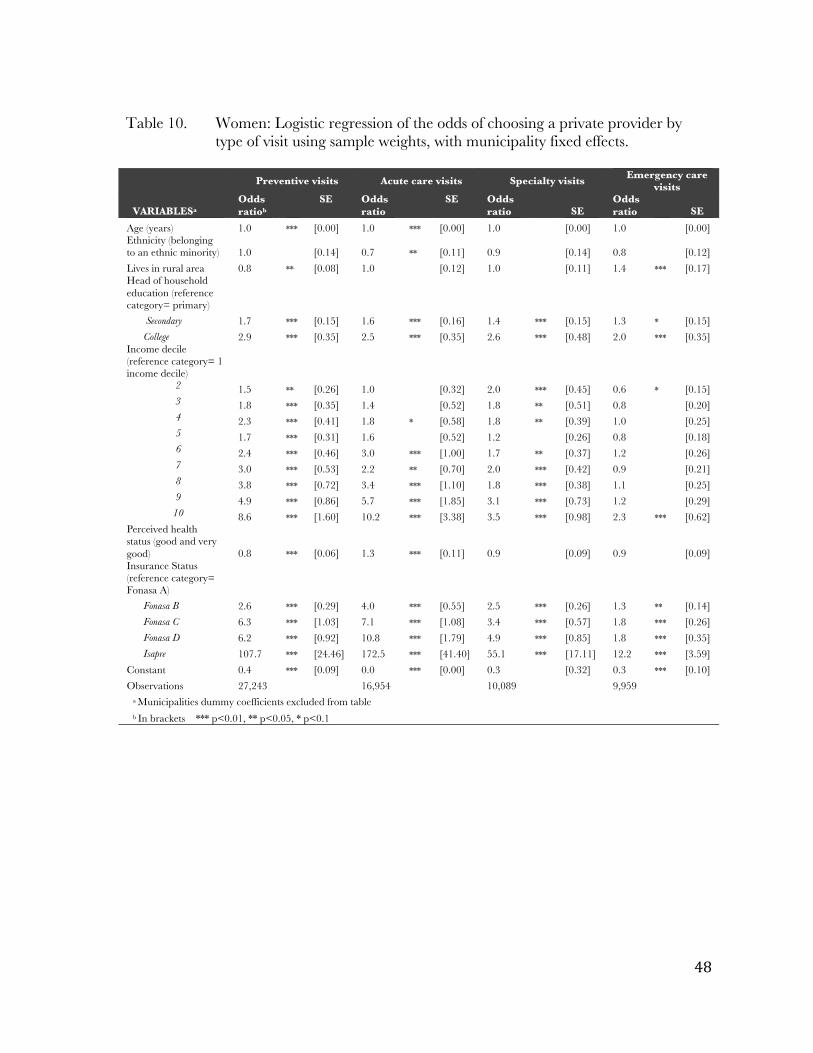
48
Table 10. Women: Logistic regression of the odds of choosing a private provider by
type of visit using sample weights, with municipality fixed effects.
Preventive visits Acute care visits Specialty visits Emergency care visits
VARIABLESa Odds ratiob
SE Odds ratio
SE Odds ratio
SE
Odds ratio SE
Age (years) 1.0 *** [0.00] 1.0 *** [0.00] 1.0 [0.00] 1.0 [0.00] Ethnicity (belonging to an ethnic minority) 1.0 [0.14] 0.7 ** [0.11] 0.9 [0.14] 0.8 [0.12] Lives in rural area 0.8 ** [0.08] 1.0 [0.12] 1.0 [0.11] 1.4 *** [0.17] Head of household education (reference category= primary)
Secondary 1.7 *** [0.15] 1.6 *** [0.16] 1.4 *** [0.15] 1.3 * [0.15] College 2.9 *** [0.35] 2.5 *** [0.35] 2.6 *** [0.48] 2.0 *** [0.35]
Income decile (reference category= 1 income decile)
2 1.5 ** [0.26] 1.0 [0.32] 2.0 *** [0.45] 0.6 * [0.15] 3 1.8 *** [0.35] 1.4 [0.52] 1.8 ** [0.51] 0.8 [0.20] 4 2.3 *** [0.41] 1.8 * [0.58] 1.8 ** [0.39] 1.0 [0.25] 5 1.7 *** [0.31] 1.6 [0.52] 1.2 [0.26] 0.8 [0.18] 6 2.4 *** [0.46] 3.0 *** [1.00] 1.7 ** [0.37] 1.2 [0.26] 7 3.0 *** [0.53] 2.2 ** [0.70] 2.0 *** [0.42] 0.9 [0.21] 8 3.8 *** [0.72] 3.4 *** [1.10] 1.8 *** [0.38] 1.1 [0.25] 9 4.9 *** [0.86] 5.7 *** [1.85] 3.1 *** [0.73] 1.2 [0.29]
10 8.6 *** [1.60] 10.2 *** [3.38] 3.5 *** [0.98] 2.3 *** [0.62] Perceived health status (good and very good) 0.8 *** [0.06] 1.3 *** [0.11] 0.9 [0.09] 0.9 [0.09] Insurance Status (reference category= Fonasa A)
Fonasa B 2.6 *** [0.29] 4.0 *** [0.55] 2.5 *** [0.26] 1.3 ** [0.14] Fonasa C 6.3 *** [1.03] 7.1 *** [1.08] 3.4 *** [0.57] 1.8 *** [0.26] Fonasa D 6.2 *** [0.92] 10.8 *** [1.79] 4.9 *** [0.85] 1.8 *** [0.35] Isapre 107.7 *** [24.46] 172.5 *** [41.40] 55.1 *** [17.11] 12.2 *** [3.59]
Constant 0.4 *** [0.09] 0.0 *** [0.00] 0.3 [0.32] 0.3 *** [0.10] Observations 27,243 16,954 10,089 9,959
a Municipalities dummy coefficients excluded from table b In brackets *** p<0.01, ** p<0.05, * p<0.1
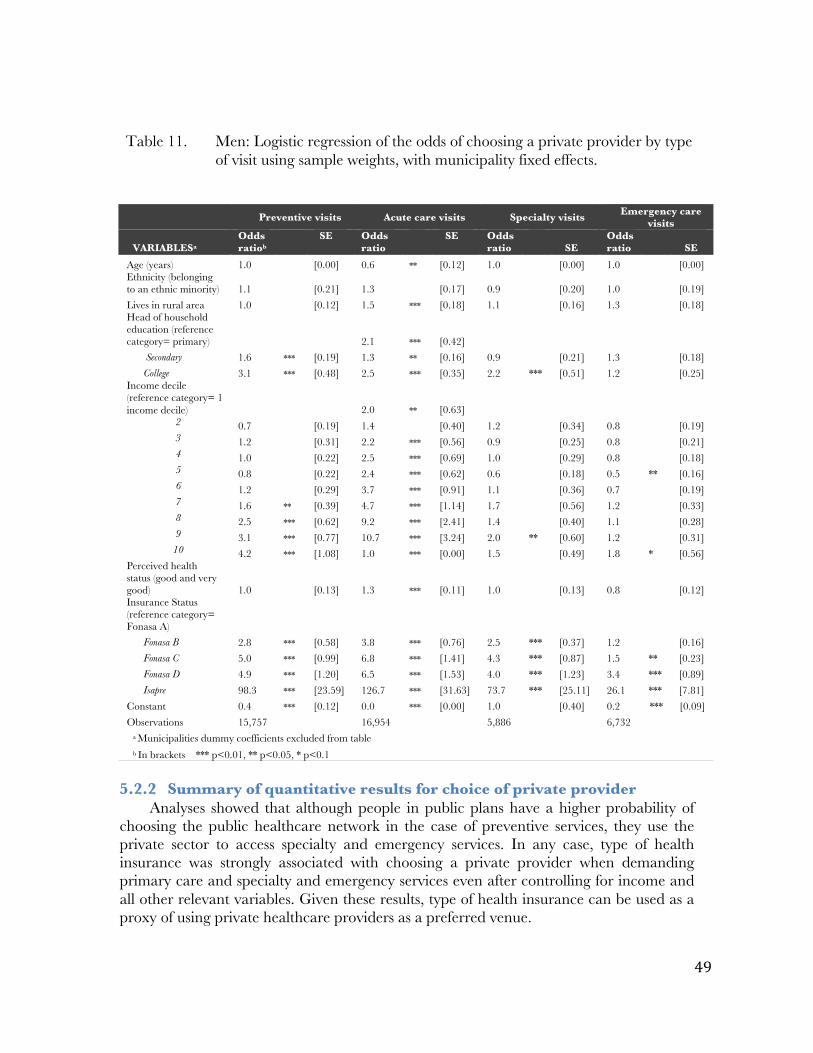
49
Table 11. Men: Logistic regression of the odds of choosing a private provider by type
of visit using sample weights, with municipality fixed effects.
5.2.2 Summary of quantitative results for choice of private provider
Analyses showed that although people in public plans have a higher probability of choosing the public healthcare network in the case of preventive services, they use the private sector to access specialty and emergency services. In any case, type of health insurance was strongly associated with choosing a private provider when demanding primary care and specialty and emergency services even after controlling for income and all other relevant variables. Given these results, type of health insurance can be used as a proxy of using private healthcare providers as a preferred venue.
Preventive visits Acute care visits Specialty visits Emergency care visits
VARIABLESa Odds ratiob
SE Odds ratio
SE Odds ratio
SE
Odds ratio SE
Age (years) 1.0 [0.00] 0.6 ** [0.12] 1.0 [0.00] 1.0 [0.00] Ethnicity (belonging to an ethnic minority) 1.1 [0.21] 1.3 [0.17] 0.9 [0.20] 1.0 [0.19] Lives in rural area 1.0 [0.12] 1.5 *** [0.18] 1.1 [0.16] 1.3 [0.18] Head of household education (reference category= primary) 2.1 *** [0.42]
Secondary 1.6 *** [0.19] 1.3 ** [0.16] 0.9 [0.21] 1.3 [0.18] College 3.1 *** [0.48] 2.5 *** [0.35] 2.2 *** [0.51] 1.2 [0.25]
Income decile (reference category= 1 income decile) 2.0 ** [0.63]
2 0.7 [0.19] 1.4 [0.40] 1.2 [0.34] 0.8 [0.19] 3 1.2 [0.31] 2.2 *** [0.56] 0.9 [0.25] 0.8 [0.21] 4 1.0 [0.22] 2.5 *** [0.69] 1.0 [0.29] 0.8 [0.18] 5 0.8 [0.22] 2.4 *** [0.62] 0.6 [0.18] 0.5 ** [0.16] 6 1.2 [0.29] 3.7 *** [0.91] 1.1 [0.36] 0.7 [0.19] 7 1.6 ** [0.39] 4.7 *** [1.14] 1.7 [0.56] 1.2 [0.33] 8 2.5 *** [0.62] 9.2 *** [2.41] 1.4 [0.40] 1.1 [0.28] 9 3.1 *** [0.77] 10.7 *** [3.24] 2.0 ** [0.60] 1.2 [0.31]
10 4.2 *** [1.08] 1.0 *** [0.00] 1.5 [0.49] 1.8 * [0.56] Perceived health status (good and very good) 1.0 [0.13] 1.3 *** [0.11] 1.0 [0.13] 0.8 [0.12] Insurance Status (reference category= Fonasa A)
Fonasa B 2.8 *** [0.58] 3.8 *** [0.76] 2.5 *** [0.37] 1.2 [0.16] Fonasa C 5.0 *** [0.99] 6.8 *** [1.41] 4.3 *** [0.87] 1.5 ** [0.23] Fonasa D 4.9 *** [1.20] 6.5 *** [1.53] 4.0 *** [1.23] 3.4 *** [0.89] Isapre 98.3 *** [23.59] 126.7 *** [31.63] 73.7 *** [25.11] 26.1 *** [7.81]
Constant 0.4 *** [0.12] 0.0 *** [0.00] 1.0 [0.40] 0.2 *** [0.09] Observations 15,757 16,954 5,886 6,732
a Municipalities dummy coefficients excluded from table b In brackets *** p<0.01, ** p<0.05, * p<0.1

50
5.2.3 Key qualitative results for choice of private provider Research question 1.2 (How do out of pocket payment associated with primary care
services, geographic location of the provider, perceived service and amenities, perceived quality of care and expected wait time influence the choice of a private primary care provider?) will be addressed in the following section. This section shows results of the qualitative component regarding the influence of out of pocket expenditures associated with services, geographic location of the provider, perceived service and amenities, perceived quality of services and expected wait time on choice of a private primary care provider. Results regarding the effect of type of health insurance and income on the previously mentioned relationship are displayed in each subsection as well as a comment on how these results inform quantitative findings.
5.2.3.1 Out of pocket expenditures
Hypothesis 1.2.a As expected, one of the reasons that patients enrolled in public healthcare centers do
not attend private facilities is the money that they would have to pay to access these services. This idea was mentioned in the three focus groups transcripts. A couple of respondents commented how they feel they do not have another alternative and are “forced” to get their services in the public sector.
Although participants in two focus groups report being satisfied with the services they receive, other participants in the same focus groups commented that they would use the private system if they had the money to do so.
Interviewees in all three focus groups relate that they use the primary care center for non-serious health needs but when they need to have access to secondary care they sometimes buy services in the private sector using a voucher. All focus groups discussion revolved around the lack of specialists in the public sector and the impact that this scarcity has in participant’s lives.
On the other hand, users of private services have mixed opinions about the money they have to spend when getting services in the private sector. Isapre and Fonasa D enrollees do not think that out of pocket expenditures in the private sector are a problem for them in terms of access, however Fonasa B and D enrollees report that sometimes they do not have the financial resources to pay for the service.
It is interesting to note that a couple of respondents express their concern about their ability to pay for health services in the future, especially if they lose their job. Some users are worried about their ability to pay for inpatient services if they need it. Given that copayments and coinsurance depend on the health plan, almost all Isapre members are acutely aware of which facilities belong to their health insurance’s network and they seek services from these providers.
5.2.3.2 Geographic access
Hypothesis 1.2.b In terms of geographic access both individuals in the public and private sector
mention proximity of the healthcare center as one of the main (if not the only) factor to choose a healthcare provider. However, I did not find any evidence that proximity affects choice of a private provider vis a vis a public provider. Proximity was mentioned as one of the main reasons why people chose a particular provider in13 short interviews and 2 focus groups, however participants never reported choosing a private provider over a

51
public one because of geographical access. A couple of patients that use private services indicated that providers located somewhere between the user’s home and their workplace and near a metro station are the most convenient.
5.2.3.3 Perceived quality of services
Hypothesis 1.2.c. The majority of users of private services express negative associations with public
healthcare centers. When asked why they do not attend public healthcare centers, many respondents either a) recounted personal encounters with the public centers where they experienced poor health outcomes (they did not “get better”) or b) reported that they did not ever attend because of what they had heard from others.
In all focus groups, participants evaluated positively the quality of care in public primary care centers but they were not asked explicitly to compare the quality of services with the private system.
Interestingly, users of both systems associate good health outcomes with a specific doctor rather than with a type of healthcare facility. A couple of users of the private system mention choosing a healthcare facility based on the specific doctor so family members might attend different centers. For instance, a woman might take her children to see a pediatrician at one center, while she has her own doctor at another. Participants in two focus groups and 8 private patients express the belief that the doctor alone (rather than the center) is responsible for and has the capacity to achieve positive health outcomes for the patient. Few respondents explicitly recognize that the system in which the doctor works influences his or her ability to provide good care.
5.2.3.4 Perceived service, amenities and wait time
Hypotheses 1.2.d and 1.2.e Regarding perceived services such as attitude, waiting time and amenities, most male
respondents chose to attend private centers because they feel they are saving time, not only because they can get an appointment more rapidly but they also believe that the wait time once in the healthcare center is less than in a public facility. Some of them have experienced long wait times and others have heard about this situation and want to avoid it at all costs.
One of the concepts that emerged spontaneously from the interviews is the cleanliness of the facilities. Notably, respondents that use the public system in all three focus groups highlighted how clean and organized the facilities they attend are. However, a few users of the private system list cleanliness as one of the main reasons why they do not seek services in the public sector.
Another reason users of private services mention for choosing a private provider is the length of the visit, which is regarded by many interviewees as too short in the public sector. Furthermore, one user of a small private healthcare center included in the sample also complained about the length of visit being too short in lager private healthcare centers.
5.2.3.5 Other factors related to choice of private provider Another feature that emerged spontaneously in a few interviews and focus groups
was that many patients choose their center based on advice from friends or family

52
members. It is also interesting to note that three private patients mentioned that one of the reasons they do not attend healthcare centers in the public sector is that they would be taking attention away from other, poorer patients who have nowhere else to go. There seems to be an understanding among Chileans that if you can pay to go to a private center, you do so, not only for your own sake, but also because that is one less person attending the overcrowded public centers. 5.2.3.6 Summary of qualitative results for choice of provider
The main emergent themes and salient quotes for choice of private versus public provider are presented in Table 12. Table 12. Summary table: Emergent themes and salient quotes for research question
1.2 Emergent theme Quote Fonasa enrollees feel locked into the public sector due to their lack of financial resources to buy services in the private sector
“I’m forced to go [to the public primary healthcare center)], because I'm enrolled in Fonasa, [one] is forced to get services in the Consultorio (public primary care center), and you go to the check-ups and everything, so if something happens, you go to the hospital and if you are not enrolled in the Consultorio they don’t take you in…”
Focus group 3 Out of pocket expenditures are not a problem for Isapre members
“Interviewer: To what degree you feel able to have access to the services offered here? Financially able... Respondent: Well, I have no problem with that in financial terms, I have no problem”
Young men, Isapre member, user of a big private medical center Patients report choosing a private provider because they perceive they can get an appointment faster than in the public sector, wait time is shorter, the provider is in their health plan preferred network and they want to be able to choose a doctor they can trust in
“Interviewer: Now, public primary care centers? Respondent: have never been to public primary care centers, never because, well, more than anything because of what you hear about the wait time, the service, one can be all morning if not more, more than anything because of that, I'd rather pay a little and that the service was better. For me and for my children”.
Female young adult, Fonasa C, user of a small private medical center
Fonasa enrollees who frequently use public primary healthcare centers report choosing a private provider for “more serious conditions” or conditions that need to be addressed in the secondary level of care
“Respondent 3: I'm also in Fonasa, I go to the public primary care center, but when I have more serious problems I have to see a private physician through Fonasa”
Focus group 1
Isapre members report not knowing if they would be able to have access to the private sector if they need hospital services.
Interviewer: … to what degree are you able to access health services offered here? And the first idea is financially, how financially capable… Respondent: Look, that’s a hard question difficult because I can tell you, because you know outpatient care is cheap Interviewer: OK. Respondent: But if I have to get hospitalized I would not know how much would that cost…I come here more for the outpatient part [but] … if I had to get hospitalized or have surgery I go to a hospital, I do not come here.
Male adult, Isapre member, user of a big private medical center Fonasa enrollees feel locked into the public sector due to their lack of financial
resources to buy services in the private sector. This is consistent with quantitative findings that show that Fonasa A enrollees are more prone to access public services than any other health insurance category. Likewise, people enrolled in Fonasa B and C report having

53
trouble paying for user fees in the private system. On the other hand, out of pocket expenditures are not a problem for Isapre members.
Patients report choosing a private provider because they perceive they can get an appointment faster than in the public sector, wait time is shorter, the provider is in their health plan preferred network and they want to be able to choose a doctor they can trust in.
Notably, Fonasa enrollees who frequently use public primary healthcare centers report choosing a private provider for “more serious conditions” or conditions that need to be addressed in the secondary level of care. This is consistent with quantitative findings that show that Fonasa enrollees demand secondary care services in the private sector almost half of the time (Table 7). Conversely, Isapre members report not knowing if they would be able to have access to the private sector if they need hospital services.
5.3 Healthcare Utilization
Descriptive results for all age groups will be presented in the following sub-sections of 5.3.1. After that, regression results for each type of visit will presented. Finally, relevant findings from the qualitative portion of this dissertation will be presented in sub-sections of 5.3.2.
5.3.1 Descriptive results
Weighted estimates of the proportion of respondents with preventive, acute care, specialist and emergency care are presented in Table 13. Missing observations for all these variables represent less than 1% of the entire sample and were dropped throughout the analysis. Table 13. Dependent variables: Preventive, acute care, specialty and emergency care
visits
Almost a quarter of the population has had a preventive visit in the last three
months. Overall, almost 40% of the population has had at least one ambulatory care visit in the last three months (either a preventive, acute care, specialist or emergency visit). 5.3.1.1 Children 0 to 5 years old
Summary statistics for children 0 to 5 are presented in Table 14. There are 17,298 children in this age group. Boys and girls are balanced in terms of age. In terms of health insurance, approximately 45% of children are insured in the Fonasa A plan. Only 12% of all children 0 to 5 are insured in Isapre.
Regarding income, lower income deciles are overrepresented. Both sexes display similar proportions of children belonging to a particular ethnic minority and living in a
Had at least one visit in the last 3 months (weighted %)
Preventive visits
Preventive visits 23.0% Acute care visits 16.5% Specialty visits 10.5% Emergency care visits 8.6% Combined visits 38.9%

54
rural area (approximately 10%). Education of the head of household was calculated instead of maternal or paternal education since the survey includes multiple families in each household. Overall, almost half of the head of households in children’s homes have primary education or less.
Regarding utilization of healthcare services, more than two-thirds of children had at least one preventive visit in the last 3 months but only 10% had a specialty visit in the same period. When we add other types of visits such as acute care, specialty or emergency visits more than 75% of the children had a healthcare visit in the last three months.

55
Table 14. Summary statistics for children 0-5 years old, CASEN 2011.
By examining utilization by type of health insurance we can see that children in
plans other than Fonasa A have higher utilization of healthcare services in general (combined visits). The unadjusted percentages show this trend for acute care visits and more markedly for specialty visits. However, this trend is not so marked for acute care
35 Preventive healthcare visits include: prenatal care, gynecological care, follow-up for chronic conditions, adolescent and adult wellness care, dental check-ups, and other preventive services.
Variable CASEN 2011 (n=17,298) Boys
(n=8,869) Girls
(n=8,429) Weighted
% Weighted
% Age
0 16.0% 18.3% 1 16.5% 17.5% 2 18.3% 16.3% 3 18.0% 17.5% 4 15.4% 16.1% 5 15.8% 14.3%
Belongs to an ethnic minority 10.0% 10.4% Living in a rural area 12.2% 11.9% Head of household education
Primary or less 47.2% 48.6% Secondary 36.7% 37.4% College and above 16.1% 14.0%
Income (deciles) 1 15.5% 15.4% 2 13.7% 15.0% 3 13.2% 11.3% 4 10.0% 10.9% 5 9.6% 10.0% 6 8.7% 9.0% 7 7.7% 6.8% 8 6.8% 7.4% 9 6.2% 7.8% 10 8.7% 6.5%
Perceived health status: good or very good 92.6% 92.1% Insurance
Fonasa A 45.6% 47.7% Fonasa B 20.1% 19.9% Fonasa C 12.3% 11.8% Fonasa D 9.3% 8.5% Isapre 12.7% 12.1%
Had at least one preventive visit in the last 3 months35 66.4% 64.4% Had at least one acute care visit in the last 3 months 23.6% 20.7% Had at least one specialty visit in the last 3 months 10.8% 10.2% Had at least one emergency visit in the last 3 months 16.8% 16.6% Had at least one visit in the last 3 months (any type) 77.4% 75.0%

56
and emergency care visits (Table 15 and Table 16). Interestingly, children in Isapre and Fonasa D seem to have a lower utilization rate of preventive visits but they could be getting these services in an acute care visit or even in a specialist visit. Therefore it is important to further examine this once we control for all other relevant variables such as income and reported health status. Table 15. Girls 0 to 5 years old: Had at least one visit in the last 3 months by type of
visit and health insurance (n=7,850)
Table 16. Boys 0 to 5 years old: Had at least one visit in the last 3 months by type of
visit and health insurance (n=8,275)
As expected, in this age group the most frequent type of preventive care is wellness
care visits (Table 17).
Table 17. Children 0 to 5 years old: Break down of type of preventive care by sex
Type of care of the last preventive visit
Male (n=6,065)
Female (n=5,642)
% % Child wellness care 93.6% 94.0% Follow-up for chronic conditions 2.7% 2.2% Dental check-ups 0.4% 0.6% Other preventive services 3.2% 3.1% Don’t know/don’t remember 0.1% 0.1%
Had at least one visit in the last 3 months (weighted %): Girls Type of health insurance
Preventive visits
Acute care visits
Specialty visits
Emergency visits
Combined visits
Fonasa A 65.5% 19.4% 5.4% 18.5% 74.5% Fonasa B 70.6% 23.1% 9.3% 16.7% 79.3% Fonasa C 62.3% 18.6% 14.7% 17.0% 73.9% Fonasa D 58.8% 23.9% 13.3% 12.3% 72.7% Isapre 62.0% 23.3% 22.6% 14.2% 78.4%
Had at least one visit in the last 3 months (weighted %): Boys Type of health insurance
Preventive visits
Acute care visits
Specialty visits
Emergency visits
Combined visits
Fonasa A 67.5% 19.7% 7.2% 16.9% 75.8% Fonasa B 70.8% 22.0% 10.3% 15.4% 80.2% Fonasa C 66.8% 31.7% 11.9% 19.7% 79.1% Fonasa D 65.1% 36.5% 11.4% 21.9% 80.9% Isapre 64.8% 24.4% 23.1% 14.7% 80.6%

57
5.3.1.2 Children 6-11 years old Summary statistics for children 6 to 11 years old are very similar to children 0 to 5
(Table 18). The only important difference is that children in this age group have much lower utilization rates of preventive visits. Specialty care visit utilization rates are very similar to the preceding age group. Overall, the combined utilization rate drops from ~75% in the previous age group to ~32% in this age group.

58
Table 18. Summary statistics for children 6-11 years old, CASEN 2011.
Boys 6 to 11 years old that are enrolled in Fonasa A show somewhat similar utilization rates of preventive visits and of emergency visits as boys in other health plans. Consistently though, they have half the utilization rate of acute care, specialty and
36 Preventive healthcare visits include: prenatal care, gynecological care, follow-up for chronic conditions, adolescent and adult wellness care, dental check-ups, and other preventive services.
Variable CASEN 2011 (n=17,245 ) Boys
(n=8,741) Girls
(n=8,504) Weighted
% Weighted
% Age
6 17.6% 15.2% 7 13.6% 16.4% 8 15.7% 15.6% 9 16.6% 17.5% 10 18.1% 17.6% 11 18.4% 17.7%
Belongs to an ethnic minority 10.7% 10.8% Living in a rural area 13.1% 13.4% Head of household education
Primary or less 49.7% 46.9% Secondary 36.0% 37.7% College and above 14.4% 15.4%
Income (deciles) 1 16.6% 15.4% 2 13.1% 14.8% 3 12.5% 11.9% 4 9.3% 10.6% 5 10.9% 9.6% 6 9.4% 8.6% 7 7.0% 7.6% 8 6.6% 6.6% 9 7.5% 8.3% 10 7.1% 6.6%
Perceived health status: Good or very good 93.6% 94.1% Insurance
Fonasa A 45.3% 43.4% Fonasa B 21.9% 23.3% Fonasa C 13.9% 12.4% Fonasa D 6.4% 7.7% Isapre 12.5% 13.2%
Had at least one preventive visit in the last 3 months36 11.5% 11.8% Had at least one acute care visit in the last 3 months 13.6% 15.9% Had at least one specialty visit in the last 3 months 9.1% 7.3% Had at least one emergency visit in the last 3 months 10.3% 9.5% Had at least one visit in the last 3 months (any type) 31.3% 32.1%

59
combined visits. Girls show a similar trend except they also show a lower utilization rate for preventive visits. It is interesting to note that Fonasa D and Isapre utilization rates are relatively similar in this age group.
Table 19. Girls 6-11 years old: Had at least one visit in the last 3 months by type of
visit and health insurance (n=7,901)
Had at least one visit in the last 3 months (weighted %): Girls Type of health insurance
Preventive visits
Acute care visits
Specialty visits
Emergency visits
Combined visits
Fonasa A 11.3% 13.8% 5.4% 10.6% 29.9% Fonasa B 11.1% 11.9% 5.2% 9.4% 26.6% Fonasa C 9.6% 15.5% 7.3% 8.7% 31.4% Fonasa D 16.5% 31.0% 15.4% 7.3% 44.3% Isapre 15.6% 18.7% 14.0% 8.5% 41.3%
Table 20. Boys 6-11 years old: Had at least one visit in the last 3 months by type of
visit and health insurance (n=8,193)
Had at least one visit in the last 3 months (weighted %): Boys Type of health insurance
Preventive visits
Acute care visits
Specialty visits
Emergency visits
Combined visits
Fonasa A 11.5% 12.5% 6.9% 11.0% 30.0% Fonasa B 9.6% 12.1% 6.9% 10.6% 27.1% Fonasa C 11.9% 17.0% 10.2% 11.8% 34.9% Fonasa D 18.0% 16.7% 14.0% 7.2% 38.2% Isapre 12.7% 17.3% 19.5% 9.0% 41.8%
In terms of type of care of the last preventive visit, a third of the children went to a
child wellness visit; another third got unspecified preventive services (Table 21). A fifth of the time preventive care was associated with follow-up for chronic conditions, a fact that it is important to note since this type of care could be considered as specialty care in the private sector making it necessary to include an indicator for combined visits for sensitivity analysis. Table 21. Children 6-11 years old: Break down of type of preventive care by sex.
Type of care of the last preventive visit
Male (n=933)
Female (n=898)
% % Child wellness care 30.5% 28.8% Follow-up for chronic conditions 20.5% 17.4% Adolescent wellness care 3.3% 4.8% Dental check-ups 14.1% 17.3% Other preventive services 31.0% 31.5% Don’t know/don’t remember 0.6% 0.3%

60
5.3.1.3 Teenagers (12-18 years old)
Summary statistics for teenagers are presented in Table 22. In general, socio-demographic statistics are very similar the previous age groups. In terms of healthcare utilization, teenagers use less frequently the services being analyzed such as preventive and specialty visits than children. Overall, only 7.3% of teenagers had had a preventive visit in the last 3 months. For the first time, there are noticeable differences between males and female healthcare utilization; with females having almost twice the rate of preventive visits and 30% more combined visits (Table 22). This difference is due mostly to the utilization of prenatal and gynecological care (Table 25).

61
Table 22. Summary statistics for teenagers, CASEN 2011.
37 Preventive healthcare visits include: prenatal care, gynecological care, follow-up for chronic conditions, adolescent and adult wellness care, dental check-ups, and other preventive services.
Variable CASEN 2011 (n=23,753) Boys
(n=12,113) Girls (n=11,640)
Weighted % Weighted% Age
12 13.1% 13.0% 13 12.5% 13.9% 14 13.5% 13.3% 15 14.7% 13.3% 16 13.3% 13.6% 17 16.6% 14.9% 18 16.4% 18.0%
Belongs to an ethnic minority 9.9% 9.4% Living in a rural area 12.9% 12.3% Head of household or partner education
Primary or less 50.9% 51.4% Secondary 34.0% 35.1% College and above 15.1% 13.5%
Income (deciles) 1 13.7% 13.6% 2 11.4% 12.6% 3 12.1% 12.9% 4 10.9% 10.5% 5 9.8% 11.3% 6 10.5% 10.1% 7 7.5% 7.8% 8 7.2% 7.2% 9 8.3% 7.4% 10 8.5% 6.7%
Perceived health status: Good or very good 94.0% 94.6% Insurance
Fonasa A 38.9% 42.0% Fonasa B 24.8% 24.5% Fonasa C 14.0% 13.9% Fonasa D 7.6% 6.5% Isapre 14.7% 13.1%
Had at least one preventive visit in the last 3 months37 5.7% 10.3% Had at least one acute care visit in the last 3 months 10.3% 13.7% Had at least one specialty visit in the last 3 months 7.5% 8.4% Had at least one emergency visit in the last 3 months 6.6% 8.0% Had at least one visit in the last 3 months (any type) 20.9% 28.0%

62
A higher proportion of boys in Fonasa C, D and Isapre have had had at least one preventive visit in the last three months compared to boys in Fonasa A (Table 24). Women do not show the same trend (Table 23). For both sexes, teenagers in Fonasa B access preventive services less frequently. Teenagers enrolled in Fonasa D have considerably higher utilization rates of acute care, specialty and combined visits than teenagers enrolled in the remaining Fonasa groups. This group also has a similar utilization rate of specialty and combined visits to Isapre members in both sexes. Table 23. Teenage girls: Had at least one visit in the last 3 months by type of visit
and health insurance (n=10,812)
Had at least one visit in the last 3 months (weighted %): teenage girls Type of health insurance
Preventive visits
Acute care visits
Specialty visits
Emergency visits
Combined visits
Fonasa A 11.4% 12.2% 7.0% 8.9% 25.9% Fonasa B 7.6% 11.8% 5.9% 8.2% 25.1% Fonasa C 11.0% 10.0% 6.3% 6.8% 24.8% Fonasa D 9.1% 22.6% 18.5% 7.9% 36.8% Isapre 11.9% 21.4% 15.3% 5.4% 38.4%
Table 24. Teenage boys: Had at least one visit in the last 3 months by type of visit
and health insurance (n=11,208)
Had at least one visit in the last 3 months (weighted %): teenage boys Type of health insurance
Preventive visits
Acute care visits
Specialty visits
Emergency visits
Combined visits
Fonasa A 5.3% 8.2% 3.9% 7.0% 17.6% Fonasa B 3.6% 7.7% 5.0% 6.2% 17.0% Fonasa C 7.2% 10.1% 7.7% 6.3% 21.3% Fonasa D 10.8% 23.9% 19.7% 6.8% 34.6% Isapre 6.9% 13.6% 15.1% 6.8% 30.3%
Less than 10% all visits corresponded to wellness visits. The most frequent type of care is follow up visits for chronic conditions and other preventive services (Table 25). Almost a third of all girls that had a preventive visit in the last three months received prenatal or gynecological care.

63
Table 25. Teenagers: Break down of type of preventive care by sex
Type of care of the last preventive visit
Male (n=672)
Female (n=1,070)
% % Prenatal care 0.0% 15.0% Follow-up for chronic conditions 25.2% 13.9% Gynecological care 0.0% 15.1% Adolescent wellness care 10.1% 7.6% Dental check-ups 17.4% 17.8% Other preventive services 46.7% 29.4% Don’t know/don’t remember 0.6% 1.3%
5.3.1.4 Adults 19 to 64 years old
Summary statistics for adults 19 to 64 years old are presented in Table 26. Proportions are very similar to other age groups in terms of belonging to an ethnic minority and living in a rural area. However, there are important differences with previous age groups especially regarding income where there is an overrepresentation of higher income deciles, especially for men. There are also differences in terms of type of health insurance where there is a higher proportion of people enrolled in Fonasa C, D and Isapre compared to other age groups. A higher proportion of women are enrolled in Fonasa A and a lower proportion are enrolled in Isapre compared to men. No differences were found between sexes in terms of education, but in regards to occupation, women are less frequently employed and more frequently inactive than men.
A lower percentage of people in this age group reported to have a good health status compared to other age groups (86,9% for men and 82.2% for women).

64
Table 26. Summary statistics CASEN 2011, Adults 19-64 years
38 Preventive healthcare visits include: prenatal care, gynecological care, follow-up for chronic conditions, adolescent and adult wellness care, dental check-ups, and other preventive services.
Variable CASEN 2011 (n=23,753) Men
(n=12,113) Women (n=11,640)
Weighted %
Weighted%
Age 19-24 22.3% 20.2% 25-34 21.8% 20.9% 35-44 19.7% 20.4% 45-54 21.4% 22.3% 55-64 14.8% 16.2%
Belongs to an ethnic minority 7.6% 7.6% Living in a rural area 13.1% 11.8% Education
Primary or less 39.3% 39.4% Secondary 46.1% 45.5% College and above 14.6% 15.2%
Employment status Employed 77.3% 48.2% Unemployed 5.3% 5.1% Inactive 17.3% 46.8%
Income (deciles) 1 6.4% 9.0% 2 7.2% 8.7% 3 7.9% 9.3% 4 8.5% 9.6% 5 9.7% 10.7% 6 10.7% 10.0% 7 10.8% 9.8% 8 11.7% 10.1% 9 12.0% 10.4% 10 15.2% 12.5%
Perceived health status: Good or very good 86.9% 82.2% Insurance
Fonasa A 29.0% 38.1% Fonasa B 28.7% 27.6% Fonasa C 13.9% 12.2% Fonasa D 9.9% 7.7% Isapre 18.5% 14.5%
Had at least one preventive visit in the last 3 months38 8.9% 21.8% Had at least one acute care visit in the last 3 months 13.9% 24.2% Had at least one specialty visit in the last 3 months 6.9% 12.2% Had at least one emergency visit in the last 3 months 5.4% 8.8% Had at least one visit in the last 3 months (any type) 22.3% 40.1%

65
Compared to teenagers, men present lower health services utilization rates, particularly of specialty and emergency visits. Women however have a much higher utilization rate than teenage girls for preventive, acute care and specialty visits, probably associated with gynecological and obstetric care. Overall, women have double the utilization rate of combined services than men.
Table 27 and Table 28 show that for both men and women the Fonasa A group has a higher proportion of people having had at least one preventive visit in the last three months than other health insurance categories. Differences in utilization of specialty care are specially striking in this age group. The proportion of Isapre members that used a specialist is 5 times larger for men and twice for women.
Table 27. Women 19 to 64 years old: Had at least one visit in the last 3 months by
type of visit and health insurance (n=57,769)
Had at least one visit in the last 3 months (weighted %): Women Type of health insurance
Preventive visits
Acute care visits
Specialty visits
Emergency visits
Combined visits
Fonasa A 25.6% 24.4% 9.0% 11.6% 40.1% Fonasa B 22.6% 26.2% 11.4% 8.2% 40.3% Fonasa C 19.2% 22.7% 11.1% 8.0% 39.0% Fonasa D 19.9% 27.1% 14.6% 7.8% 44.2% Isapre 18.6% 23.8% 22.6% 5.9% 44.3%
Table 28. Men 19 to 64 years old: Had at least one visit in the last 3 months by type
of visit and health insurance (n=48,967)
Had at least one visit in the last 3 months (weighted %): Men Type of health insurance
Preventive visits
Acute care visits
Specialty visits
Emergency visits
Combined visits
Fonasa A 10.8% 14.3% 3.8% 6.9% 21.8% Fonasa B 9.5% 14.1% 5.7% 5.2% 21.3% Fonasa C 7.5% 13.2% 5.8% 5.3% 21.1% Fonasa D 9.2% 16.5% 9.9% 6.3% 26.2% Isapre 8.9% 16.6% 14.0% 4.7% 29.0%
Almost half of all preventive visits correspond to follow-up of chronic conditions.
Men have a higher proportion of follow-ups visits for chronic care (57.1% versus 42.8%). For women, prenatal and gynecological care comprises almost 30% of all preventive care.

66
Table 29. Adults: Break down of type of preventive care
Type of care of the last preventive visit
Male (n=5,364)
Female (n=14,648)
% % Prenatal care 0.0% 8.2% Follow-up for chronic conditions 57.1% 42.8% Gynecological care 0.0% 21.3% Adult wellness care 8.8% 7.7% Adolescent wellness care 0.3% 0.1% Dental check-ups 4.2% 2.0% Other preventive services 28.8% 17.3% Don’t know/don’t remember 0.8% 0.6%
5.3.1.5 Adults 65 years and older
Summary statistics for adults 65 years and older are presented in Table 30. This age group has the lowest proportion of Isapre members and the highest proportion of Fonasa B enrollees. This is expected since a considerable portion of older adults receives some kind of social security benefits that would make them eligible for this health plan. On the other hand, higher income deciles are overrepresented in this age group.
As expected the proportion of people in older age groups within this particular population is lower as age increases. The percentage of individuals belonging to an ethnic minority is lower than other age groups, but the proportion of older adults living in a rural area is higher especially for men.
In terms of educational level, three quarters of individuals in this age group attained only primary education or less. Most older adults are inactive, especially women. In this regard it is interesting to note that approximately 25% of older men are still employed. As anticipated, older adults report having a good health status much less frequently than other age groups.
Regarding healthcare utilization, older adults use all types of health services intensively. Overall, women use slightly more visits than men, especially preventive care. Almost half of this population has had a preventive visit in the last three months and more than two-thirds of all older adults have used ambulatory services.

67
Table 30. Summary statistics CASEN 2011, Adults 65 years and older
39 Preventive healthcare visits include: prenatal care, gynecological care, follow-up for chronic conditions, adolescent and adult wellness care, dental check-ups, and other preventive services.
Variable CASEN 2011 (n=22,473) Men
(n=9,858) Women (n=12,615)
Weighted %
Weighted%
Age 65-69 34.6% 29.8% 70-74 26.9% 26.1% 75_79 17.8% 18.1% 80_84 12.6% 13.6% 85 and older 8.1% 12.4%
Belongs to an ethnic minority 6.4% 5.1% Living in a rural area 18.0% 13.1% Education
Primary or less 75.3% 78.6% Secondary 15.9% 15.6% College and above 8.8% 5.8%
Employment status Employed 25.9% 7.9% Unemployed 0.6% 0.3% Inactive 73.6% 91.8%
Income (deciles) 1 5.4% 4.6% 2 5.1% 4.9% 3 9.2% 7.2% 4 9.8% 9.4% 5 11.9% 11.6% 6 12.2% 13.0% 7 11.2% 13.1% 8 12.8% 12.8% 9 10.3% 11.8% 10 12.1% 11.5%
Perceived health status: good or very good 67.7% 63.5% Insurance
Fonasa A 33.6% 39.8% Fonasa B 45.5% 45.2% Fonasa C 5.7% 4.5% Fonasa D 8.2% 4.9% Isapre 6.9% 5.6%
Had at least one preventive visit in the last 3 months39 48.6% 56.1% Had at least one acute care visit in the last 3 months 42.3% 45.9% Had at least one specialty visit in the last 3 months 18.2% 20.1% Had at least one emergency visit in the last 3 months 9.6% 11.5% Had at least one visit in the last 3 months (any type) 65.0% 71.9%

68
In terms of preventive visits, Fonasa A enrollees have access to preventive visits more frequently than people in Fonasa D or Isapre. Fonasa B enrollees had also a higher utilization rate than these groups. Regarding specialty visits, the same pattern as the one observed in other age groups is present here, but Fonasa enrollees have higher utilization rates of acute care visits and combined visits, a phenomenon that we had not encountered before. This higher utilization rate may be explained by worse health status for Fonasa beneficiaries so it is necessary to control for this factor in the regression analysis. However, utilization is higher as we approach the Fonasa D group so may be a sign that people in Fonasa B, C and D have the option of having access both to the public and the private sector. As discussed before, Isapre members have a strong preference for private providers and are disincentivized by the delivery system to receive care in the public sector, so it may be that income is playing a role in this observed lower utilization, since they can only have access to private providers which require higher out of pocket payments than the public network.
Table 31. Women 65 years and older: Had at least one visit in the last 3 months by
type of visit and health insurance (n=11,561)
Had at least one visit in the last 3 months (weighted %): Women Type of health insurance
Preventive visits
Acute care visits
Specialty visits
Emergency visits
Combined visits
Fonasa A 59.3% 44.5% 14.1% 13.0% 71.8% Fonasa B 58.2% 49.7% 20.3% 12.6% 74.5% Fonasa C 51.1% 42.6% 28.9% 6.1% 70.0% Fonasa D 52.7% 45.4% 25.0% 10.9% 69.1% Isapre 35.3% 28.8% 36.2% 4.6% 61.4%
Table 32. Men 65 years and older: Had at least one visit in the last 3 months by type
of visit and health insurance (n=9,024)
Had at least one visit in the last 3 months (weighted %): Men Type of health insurance
Preventive visits
Acute care visits
Specialty visits
Emergency visits
Combined visits
Fonasa A 47.5% 43.9% 12.8% 10.0% 63.1% Fonasa B 54.5% 44.8% 17.6% 11.4% 67.9% Fonasa C 43.3% 34.2% 24.3% 6.4% 65.1% Fonasa D 46.5% 50.5% 24.6% 6.0% 71.1% Isapre 32.9% 27.6% 34.0% 6.6% 58.2%
Given that Chile has been implementing care guidelines for older adults for decades,
it is expected that a large proportion of preventive visits will correspond to wellness care visits. Indeed, almost half of all preventive visits are wellness care visits; the other half corresponds to follow-up for chronic conditions (Table 33).

69
Table 33. Adults 65 years and older: Break down of type of preventive care
Type of care of the last preventive visit
Male (n=4,781)
Female (n=7,215)
% % Older adult wellness care 45.6% 47.5% Follow-up for chronic conditions 45.4% 44.5% Gynecological care 0.0% 0.6% Dental check-ups 0.2% 0.3% Other preventive services 8.1% 6.7% Don’t know/don’t remember 0.7% 0.4%
5.3.2 Regression results
The Breusch-Pagan test and the joint-effect test of the municipality dummies showed a significant amount of clustering in all regression models for this section. For most regression models, the Hausman test between unweighted versions of random effects and fixed effects models rejected the null hypothesis and unweighted models overestimated the effect of the independent variable on the outcome. Therefore, the weighted fixed effect estimator is reported for comparison purposes. A summary of results for all outcome variables (preventive, acute care, specialty, emergency care and combined visits) is presented in Appendix 5.
The analyses for this section refer to the following tables: Table 34, Table 35, Table 36, Table 37, Table 38 and Table 39.
5.3.2.1 Health insurance
Hypothesis 2.1.a and 2.2.a For teenagers, there is no difference in preventive care utilization between people in
Fonasa D and Isapre compared with Fonasa A enrollees once we control for income and other relevant variables (Table 34 and Table 37). Teenagers in Fonasa B are less likely to have had a preventive visit compared to teenagers in Fonasa A. On the other hand, teens in Fonasa D and Isapre are between 7 and 9 percentage points more likely to have had any type of visit in the last three months than Fonasa A enrollees (Table 36 and Table 39). Acute care utilization shows the same results (Table 35 and Table 38).
Adults enrolled in Isapres had the same probability of having had a preventive visit as Fonasa A enrollees (Table 34 and Table 37). Moreover, women enrolled in Fonasa B, C and D have a lower probability of having a preventive visit in the last three months than women in Fonasa A (Table 34). The magnitude of this effect though is less than 3 percentage point for every group. For men, health insurance has no effect on preventive care utilization (Table 37). For both adult women and men being in any other plan (except Fonasa B) is associated with higher utilization of acute care visits compared to Fonasa A (Table 35 and Table 38). In terms of combined visits, being in Fonasa D and Isapre was associated with a higher probability of having had any type of visit in the last three months in both adult women (5.5 and 7 percentage point effect respectively) and adult men (7 percentage point effect for both Fonasa D and Isapre) (Table 36 and Table 39). In the case of adult men, being enrolled in Fonasa B and C was also associated with a

70
higher probability (2 percentage point effect) of having any type of visit (Table 36 and Table 39).
Hypothesis 2.1.b and 2.2.b Regarding type of health insurance, the independent variable, results show that, for
both girls and boys 0 to 5 years old, there is no difference in preventive care or acute care utilization for any health insurance group compared to Fonasa A after controlling for income and other relevant variables (Table 34). Not only that, but children in the Fonasa A group are also not worse off in terms of combined visits. Type of health insurance is also not significantly associated with healthcare utilization for preventive visits in children 6 to 11 years old. Children in Isapre and Fonasa have a higher probability of having had an acute care visit or a combined visit in the last three months than children in Fonasa A. Also in the case of combined visits, children in Fonasa B had lower utilization rates than children in Fonasa A (less than 6% percentage point effect). Girls in Fonasa D had 9 percentage point higher probability of having had any type of visit in the last three months than girls in Fonasa A (Table 36). Boys enrolled in Isapre were 7 percentage point more likely to have had any type of visit in the last three months than boys in Fonasa A (Table 39).
Type of health insurance is not associated with utilization of preventive or combined visits in older women except for individuals enrolled in Isapres who are actually less likely to have had a preventive or acute care visit in the last three months compared to women in Fonasa A (Table 34). For older men, the only group that has a higher utilization rate of both preventive and combined visits is Fonasa B (Table 37 and Table 39). Other groups are not significantly different to Fonasa A. Acute care visits utilization is not significantly related to type of health insurance for older women (Table 35) and being enrolled in Isapres is associated with a lower probability of having access to an acute care visit for older men (Table 38).
5.3.2.2 Covariates
In terms of age, children are less likely to have had a preventive, acute care or a combined visit in the last three months the older they are. This is an expected finding since the Healthy Children program from the Ministry of Health prescribes more frequent wellness checks in the first years of life. Age is inversely related to healthcare utilization for teenage boys but positively associated with preventive care utilization in teenage girls since prenatal and gynecological care increases with age. For adults and seniors, healthcare utilization of preventive, acute care and combined visits increase with age for both sexes as expected (results not show in tables).
In the 0 to 11 years old group, belonging to an ethnic minority was associated with a higher probability of having had a preventive and a combined visit for both sexes and a preventive visit for boys. Ethnicity is not significantly associated with healthcare utilization in other age groups. Furthermore, ethnicity is not associated with acute care utilization.
As expected, living in a rural area is a predictor of lower utilization of healthcare services except preventive visits for infants and small children. Additionally, living in a rural area is not associated with a lower probability of getting preventive services for older women.
Education of head of household or education of the interviewee is not consistently associated with healthcare utilization. Surprisingly, for adult women, having a higher

71
education level is inversely correlated with preventive care utilization. One explanation could be that women with higher education may have fewer children, which in turn would explain a lower utilization rate of prenatal care.
Only some income deciles are significantly associated with a higher probability of receiving preventive care or any ambulatory care at all compared to the first income decile. This may be due to the fact that the health insurance categorization is already picking up most of the income effect since income level is highly associated with the health plan that a person is able to have access to and ultimately choose. In the case of older women a higher income is associated with a higher probability of having had a preventive or any type of visit. Income was not associated with healthcare utilization in the case of older men.
As expected, if the mother of an infant reported that the child health status was good or very good, children were less likely to have had an acute care or combined visit in the last three months but they had the same preventive visit utilization than children whose mothers reported their health status being worse than good. In the case of children 6 to 11 years old, a good or very good health status is associated with 17% lower probability of having had preventive visit and 41 percentage point lower probability of having any type of visit in the last three months for girls. Similar figures are obtained for boys (11 percentage point and 34 percentage point respectively). Teenagers and adults followed the same trend. Health status is also negatively associated with acute care and combined visits utilization.

72
Table 34. Girls and women all ages: Fixed effects regression for preventive care using sample weights.
Preventive visits in the last 3 months 0-5 years olds 6-11 years olds 12-18 year olds 19-64 years old 65 years and older VARIABLESa Odds ratiob SE Odds ratiob SE Odds ratiob SE Odds ratiob SE Odds ratiob SE Age (years)c 0.7 *** [0.02] 0.7 *** [0.03] 1.1 *** [0.05] - - - - - - Ethnicity (belonging to an ethnic minority) 1.4 ** [0.24] 1.7 *** [0.33] 0.9 [0.16] 1.0 [0.06] 0.8 [0.11] Rural 1.0 [0.11] 0.8 [0.14] 0.6 *** [0.11] 1.0 [0.04] 1.0 [0.09] Head of household education (for children and teens) or education (reference category= primary)
Secondary 0.8 [0.09] 0.9 [0.15] 0.9 [0.13] 0.8 *** [0.05] 0.9 [0.12]
College 0.8 [0.17] 0.8 [0.24] 1.2 [0.27] 0.9 * [0.07] 1.0 [0.18]
Employment status Unemployed - - - - - - - - - 1.1 [0.13] 3.2 ** [1.73] Inactive - - - - - - - - - 1.4 *** [0.07] 1.7 *** [0.30] Income (reference category= 1 income decile)
2 1.1 [0.21] 1.0 [0.26] 1.1 [0.25] 1.0 [0.09] 1.2 [0.26] 3 1.2 [0.24] 1.5 [0.45] 0.7 [0.18] 1.2 * [0.12] 1.6 ** [0.33] 4 1.3 [0.35] 1.6 * [0.44] 1.4 [0.35] 1.0 [0.12] 1.4 [0.28] 5 1.1 [0.24] 1.4 [0.41] 1.3 [0.33] 1.0 [0.09] 1.7 *** [0.36] 6 1.3 [0.31] 2.5 *** [0.76] 1.2 [0.40] 1.2 * [0.11] 2.0 *** [0.41] 7 1.4 [0.33] 1.1 [0.35] 0.4 *** [0.13] 1.2 ** [0.12] 1.7 ** [0.37] 8 1.0 [0.27] 3.7 *** [1.19] 1.0 [0.28] 1.0 [0.10] 1.6 ** [0.36] 9 0.9 [0.24] 1.5 [0.62] 1.7 [0.59] 1.1 [0.10] 1.3 [0.33] 10 0.9 [0.29] 1.6 [0.73] 1.2 [0.45] 1.4 *** [0.17] 1.6 ** [0.33]
Perceived health status (good and very good) 1.1 [0.22] 0.3 *** [0.07] 0.2 *** [0.04] 0.4 *** [0.02] 0.7 *** [0.05]
Insurance Status (reference category= Fonasa A) Fonasa B 1.2 [0.16] 0.9 [0.15] 0.7 ** [0.12] 0.9 ** [0.05] 1.0 [0.09] Fonasa C 0.9 [0.17] 0.7 [0.19] 1.2 [0.25] 0.9 ** [0.07] 0.8 [0.14] Fonasa D 1.0 [0.21] 1.4 [0.54] 1.0 [0.29] 0.8 * [0.10] 0.9 [0.16] Isapre 1.2 [0.29] 1.4 [0.34] 1.2 [0.44] 0.9 [0.10] 0.5 *** [0.11] Constant 5.4 ** [4.55] 2.8 ** [1.51] 0.2 [0.31] 0.0 *** [0.03] 2.3 [1.97] Observations 7,663 6,844 9,873 57,576 11,500 a Municipalities dummy coefficients excluded from table b In brackets *** p<0.01, ** p<0.05, * p<0.1 c Age categories (not shown) and employment status only for adults analyses

73
Table 35. Girls and women all ages: Fixed effects regression for acute care visits using sample weights.
Acute care visits in the last 3 months 0-5 years olds 6-11 years olds 12-18 year olds 19-64 years old 65 years and older VARIABLESa Odds ratiob SE Odds ratiob SE Odds ratiob SE Odds ratiob SE Odds ratiob SE Age (years)c 0.9 ** [0.03] 0.9 ** [0.03] 1.0 [0.04] - - - - - - Ethnicity (belonging to an ethnic minority) 1.2 [0.20] 1.2 [0.26] 1.2 [0.21] 1.1 [0.10] 1.1 [0.16] Rural 0.6 *** [0.08] 0.7 ** [0.11] 0.7 ** [0.10] 0.8 *** [0.04] 0.8 ** [0.07] Head of household education (for children and teens) or education (reference category= primary)
Secondary 1.2 [0.20] 1.4 ** [0.23] 1.2 [0.19] 1.1 [0.06] 1.2 [0.15]
College 1.0 [0.22] 1.1 [0.27] 1.6 ** [0.34] 1.1 [0.09] 0.9 [0.19]
Employment status Unemployed - - - - - - - - - 1.1 [0.15] 1.3 [0.62] Inactive - - - - - - - - - 1.0 [0.05] 1.0 [0.18] Income (reference category= 1 income decile)
2 1.1 [0.26] 1.3 [0.31] 1.1 [0.25] 1.0 [0.11] 0.9 [0.22] 3 1.1 [0.29] 1.0 [0.23] 1.0 [0.26] 1.1 [0.14] 1.1 [0.26] 4 0.8 [0.21] 0.9 [0.21] 1.2 [0.28] 1.0 [0.13] 1.2 [0.27] 5 1.2 [0.33] 0.9 [0.27] 1.4 [0.35] 1.0 [0.12] 1.2 [0.26] 6 0.9 [0.23] 0.9 [0.25] 1.0 [0.31] 1.0 [0.12] 1.1 [0.26] 7 1.9 ** [0.61] 0.7 [0.22] 0.9 [0.26] 0.9 [0.12] 1.5 * [0.36] 8 0.9 [0.27] 1.1 [0.32] 0.9 [0.26] 1.2 [0.14] 1.5 * [0.36] 9 1.7 [0.56] 0.7 [0.25] 1.6 * [0.49] 1.2 [0.15] 1.2 [0.34] 10 2.0 ** [0.65] 1.7 [0.68] 1.4 [0.48] 1.4 ** [0.18] 1.4 [0.41]
Perceived health status (good and very good) 0.4 *** [0.08] 0.2 *** [0.05] 0.2 *** [0.05] 0.4 *** [0.02] 0.5 *** [0.04] Insurance Status (reference category= Fonasa A) Fonasa B 1.0 [0.19] 0.9 [0.15] 1.0 [0.17] 1.1 [0.06] 1.1 [0.10] Fonasa C 0.8 [0.16] 1.3 [0.29] 0.8 [0.17] 1.2 * [0.10] 0.9 [0.17] Fonasa D 1.1 [0.24] 2.2 *** [0.50] 2.1 *** [0.57] 1.4 *** [0.18] 1.0 [0.22] Isapre 0.8 [0.21] 1.1 [0.35] 1.7 ** [0.47] 1.2 * [0.12] 0.6 ** [0.14] Constant 0.9 [0.25] 3.5 * [2.35] 0.4 [0.69] 0.2 *** [0.04] 1.0 [0.57] Observations 7,475 7130 9,901 57,562 11,471
a Municipalities dummy coefficients excluded from table b In brackets *** p<0.01, ** p<0.05, * p<0.1 c Age categories (not shown) and employment status only for adults analyses

74
Table 36. Girls and women all ages: Fixed effects regression for combined visits using sample weights.
Combined visits in the last 3 months 0-5 years olds 6-11 years olds 12-18 year olds 19-64 years olds 65 years and older VARIABLESa Odds ratiob SE Odds ratiob SE Odds ratiob SE Odds ratiob SE Odds ratiob SE
Age (years)c 0.7 *** [0.03] 0.8 *** [0.02] 1.0 [0.03] - - - - Ethnicity (belonging to an ethnic minority) 1.3 * [0.21] 1.5 *** [0.23] 1.1 [0.14] 1.0 [0.07] 1.0 [0.17] Rural 0.8 [0.10] 0.6 *** [0.08] 0.7 *** [0.07] 0.9 *** [0.04] 0.8 * [0.08] Head of household education (for children and teens) or education (reference category= primary) Secondary 0.9 [0.12] 1.1 [0.12] 1.1 [0.12] 0.9 [0.05] 0.9 [0.13] College 1.1 [0.24] 1.3 [0.26] 1.4 ** [0.24] 1.0 [0.07] 1.0 [0.17] Employment status - - - - - - - - - Unemployed - - - - - - - - - 1.0 [0.12] 2.0 [1.06] Inactive - - - - - - - - - 1.3 *** [0.06] 1.5 ** [0.26] Income (reference category= 1 income decile)
2 1.1 [0.23] 1.1 [0.18] 1.1 [0.18] 1.0 [0.09] 1.1 [0.28] 3 1.4 [0.28] 1.4 * [0.27] 0.9 [0.14] 1.2 * [0.11] 1.8 *** [0.40] 4 1.0 [0.26] 1.1 [0.19] 1.1 [0.19] 1.1 [0.10] 1.4 [0.32] 5 1.2 [0.27] 1.2 [0.24] 1.1 [0.19] 1.0 [0.09] 1.7 ** [0.38] 6 1.1 [0.27] 1.3 [0.26] 1.2 [0.20] 1.2 ** [0.10] 2.1 *** [0.49] 7 1.6 * [0.44] 1.0 [0.21] 0.8 [0.17] 1.2 [0.11] 1.9 *** [0.45] 8 1.0 [0.32] 2.1 *** [0.47] 0.9 [0.17] 1.2 ** [0.10] 2.0 *** [0.52] 9 0.8 [0.26] 1.1 [0.26] 1.8 *** [0.39] 1.2 ** [0.11] 1.3 [0.35] 10 1.4 [0.44] 1.8 ** [0.52] 1.2 [0.29] 1.7 *** [0.17] 2.0 *** [0.49]
Perceived health status (good and very good) 0.5 * [0.18] 0.2 *** [0.03] 0.2 *** [0.03] 0.3 *** [0.02] 0.5 *** [0.04]
Insurance Status (reference category= Fonasa A) Fonasa B 1.2 [0.16] 0.8 [0.10] 0.9 [0.09] 1.0 [0.06] 1.1 [0.12] Fonasa C 1.0 [0.20] 0.9 [0.16] 0.9 [0.14] 1.1 [0.08] 1.0 [0.20] Fonasa D 1.1 [0.26] 1.6 * [0.39] 1.4 * [0.27] 1.3 ** [0.12] 0.9 [0.17] Isapre 1.2 [0.36] 1.0 [0.22] 1.5 ** [0.29] 1.3 *** [0.12] 0.8 [0.16] Constant 10.5 *** [9.52] 9.3 *** [4.84] 0.7 [1.03] 0.3 *** [0.05] 1.0 [0.34] Observations 7,497 7,736 10,653 57,576 11,418 a Municipalities dummy coefficients excluded from table b In brackets *** p<0.01, ** p<0.05, * p<0.1 c Age categories (not shown) and employment status only for adults analyses
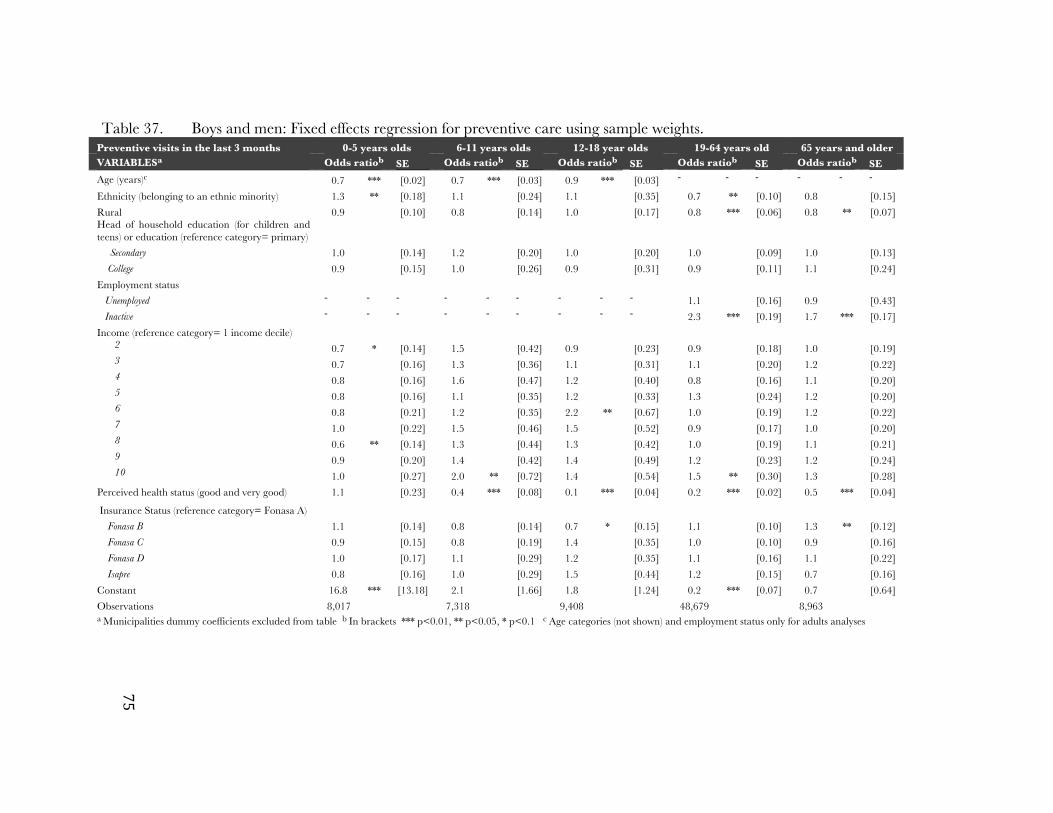
75
Table 37. Boys and men: Fixed effects regression for preventive care using sample weights. Preventive visits in the last 3 months 0-5 years olds 6-11 years olds 12-18 year olds 19-64 years old 65 years and older VARIABLESa Odds ratiob SE Odds ratiob SE Odds ratiob SE Odds ratiob SE Odds ratiob SE Age (years)c 0.7 *** [0.02] 0.7 *** [0.03] 0.9 *** [0.03] - - - - - - Ethnicity (belonging to an ethnic minority) 1.3 ** [0.18] 1.1 [0.24] 1.1 [0.35] 0.7 ** [0.10] 0.8 [0.15] Rural 0.9 [0.10] 0.8 [0.14] 1.0 [0.17] 0.8 *** [0.06] 0.8 ** [0.07] Head of household education (for children and teens) or education (reference category= primary) Secondary 1.0 [0.14] 1.2 [0.20] 1.0 [0.20] 1.0 [0.09] 1.0 [0.13] College 0.9 [0.15] 1.0 [0.26] 0.9 [0.31] 0.9 [0.11] 1.1 [0.24] Employment status Unemployed - - - - - - - - - 1.1 [0.16] 0.9 [0.43] Inactive - - - - - - - - - 2.3 *** [0.19] 1.7 *** [0.17] Income (reference category= 1 income decile)
2 0.7 * [0.14] 1.5 [0.42] 0.9 [0.23] 0.9 [0.18] 1.0 [0.19] 3 0.7 [0.16] 1.3 [0.36] 1.1 [0.31] 1.1 [0.20] 1.2 [0.22] 4 0.8 [0.16] 1.6 [0.47] 1.2 [0.40] 0.8 [0.16] 1.1 [0.20] 5 0.8 [0.16] 1.1 [0.35] 1.2 [0.33] 1.3 [0.24] 1.2 [0.20] 6 0.8 [0.21] 1.2 [0.35] 2.2 ** [0.67] 1.0 [0.19] 1.2 [0.22] 7 1.0 [0.22] 1.5 [0.46] 1.5 [0.52] 0.9 [0.17] 1.0 [0.20] 8 0.6 ** [0.14] 1.3 [0.44] 1.3 [0.42] 1.0 [0.19] 1.1 [0.21] 9 0.9 [0.20] 1.4 [0.42] 1.4 [0.49] 1.2 [0.23] 1.2 [0.24] 10 1.0 [0.27] 2.0 ** [0.72] 1.4 [0.54] 1.5 ** [0.30] 1.3 [0.28]
Perceived health status (good and very good) 1.1 [0.23] 0.4 *** [0.08] 0.1 *** [0.04] 0.2 *** [0.02] 0.5 *** [0.04]
Insurance Status (reference category= Fonasa A) Fonasa B 1.1 [0.14] 0.8 [0.14] 0.7 * [0.15] 1.1 [0.10] 1.3 ** [0.12] Fonasa C 0.9 [0.15] 0.8 [0.19] 1.4 [0.35] 1.0 [0.10] 0.9 [0.16] Fonasa D 1.0 [0.17] 1.1 [0.29] 1.2 [0.35] 1.1 [0.16] 1.1 [0.22] Isapre 0.8 [0.16] 1.0 [0.29] 1.5 [0.44] 1.2 [0.15] 0.7 [0.16] Constant 16.8 *** [13.18] 2.1 [1.66] 1.8 [1.24] 0.2 *** [0.07] 0.7 [0.64] Observations 8,017 7,318 9,408 48,679 8,963 a Municipalities dummy coefficients excluded from table b In brackets *** p<0.01, ** p<0.05, * p<0.1 c Age categories (not shown) and employment status only for adults analyses

76
Table 38. Boys and men: Fixed effects regression for acute care visits using sample weights. Acute care visits in the last 3 months 0-5 years olds 6-11 years olds 12-18 year olds 19-64 years old 65 years and older VARIABLESa Odds ratiob SE Odds ratiob SE Odds ratiob SE Odds ratiob SE Odds ratiob SE Age (years)c 0.9 *** [0.03] 0.9 ** [0.03] 1.0 [0.04] - - - - - - Ethnicity (belonging to an ethnic minority) 1.2 [0.21] 1.4 [0.36] 1.6 * [0.37] 1.0 [0.11] 0.9 [0.22] Rural 0.6 *** [0.08] 0.6 *** [0.10] 0.7 ** [0.11] 0.8 *** [0.05] 0.7 *** [0.07] Head of household education (for children and teens) or education (reference category= primary) Secondary 1.3 [0.19] 1.2 [0.19] 1.3 [0.20] 1.1 [0.09] 0.9 [0.13] College 1.7 ** [0.41] 1.6 ** [0.36] 2.2 *** [0.50] 1.1 [0.15] 0.7 [0.15]
Employment status Unemployed - - - - - - 1.0 [0.14] 0.5 [0.23] Inactive - - - - - - 1.3 ** [0.11] 1.0 [0.12] Income (reference category= 1 income decile)
2 1.3 [0.29] 1.2 [0.30] 1.2 [0.30] 0.8 [0.15] 1.2 [0.26] 3 1.0 [0.24] 0.8 [0.19] 0.9 [0.22] 1.1 [0.20] 0.8 [0.18] 4 0.9 [0.20] 1.3 [0.33] 0.8 [0.23] 0.8 [0.15] 0.8 [0.18] 5 1.1 [0.25] 1.2 [0.36] 0.8 [0.21] 1.1 [0.21] 1.0 [0.21] 6 1.1 [0.26] 0.7 [0.22] 1.1 [0.29] 0.9 [0.16] 0.6 ** [0.14] 7 0.7 [0.23] 1.0 [0.28] 1.0 [0.34] 0.9 [0.18] 0.9 [0.20] 8 0.8 [0.20] 0.7 [0.23] 0.9 [0.27] 1.0 [0.18] 1.1 [0.24] 9 0.9 [0.25] 1.1 [0.37] 1.5 [0.48] 1.2 [0.22] 0.8 [0.19] 10 1.1 [0.34] 0.8 [0.32] 1.2 [0.38] 1.5 * [0.29] 0.8 [0.20]
Perceived health status (good and very good) 0.3 *** [0.06] 0.3 *** [0.06] 0.2 *** [0.06] 0.3 *** [0.03] 0.5 *** [0.04] Insurance Status (reference category= Fonasa A) Fonasa B 1.1 [0.17] 1.0 [0.17] 1.0 [0.19] 1.1 [0.09] 0.9 [0.11] Fonasa C 1.5 ** [0.28] 1.3 [0.27] 1.4 [0.29] 1.3 *** [0.14] 1.0 [0.21] Fonasa D 1.2 [0.36] 1.1 [0.33] 2.3 *** [0.57] 1.6 *** [0.21] 1.4 [0.37] Isapre 1.0 [0.24] 1.6 * [0.48] 1.5 [0.39] 1.6 *** [0.19] 0.9 [0.22] Constant 2.5 [1.74] 0.4 [0.30] 0.7 [0.60] 0.1 *** [0.07] 4.2 ** [3.07] Observations 7,907 7,131 10,101 48,545 8,838 a Municipalities dummy coefficients excluded from table b In brackets *** p<0.01, ** p<0.05, * p<0.1 c Age categories (not shown) and employment status only for adults analyses

77
Table 39. Boys and men: Fixed effects regression for combined visits using sample weights. Combined visits in the last 3 months 0-5 years olds 6-11 years olds 12-18 year olds 19-64 years old 65 years and older VARIABLESa Odds ratiob SE Odds ratiob SE Odds ratiob SE Odds ratiob SE Odds ratiob SE Age (years)c 0.7 *** [0.03] 0.9 *** [0.03] 0.9 *** [0.02] - - - - - - Ethnicity (belonging to an ethnic minority) 1.5 *** [0.22] 1.2 [0.19] 1.3 ** [0.20] 1.0 [0.10] 1.1 [0.18] Rural 0.7 ** [0.10] 0.6 *** [0.08] 0.8 ** [0.08] 0.8 *** [0.04] 0.7 *** [0.07] Head of household education (for children and teens) or education (reference category= primary) Secondary 1.1 [0.15] 1.4 *** [0.15] 1.1 [0.13] 1.1 [0.06] 1.0 [0.13] College 1.0 [0.19] 1.6 *** [0.26] 1.7 *** [0.27] 1.1 [0.10] 1.1 [0.20] Employment status Unemployed - - - - - - - - - 1.0 [0.11] 1.1 [0.48] Inactive - - - - - - - - - 1.5 *** [0.09] 1.9 *** [0.18] Income (reference category= 1 income decile)
2 0.8 [0.16] 1.3 [0.25] 1.0 [0.18] 0.9 [0.12] 1.0 [0.19] 3 0.7 [0.16] 1.2 [0.20] 0.8 [0.15] 1.3 * [0.16] 1.1 [0.19] 4 1.0 [0.21] 1.2 [0.24] 0.9 [0.16] 0.8 [0.11] 1.1 [0.19] 5 0.8 [0.17] 1.5 ** [0.29] 1.0 [0.18] 1.2 [0.16] 1.2 [0.21] 6 0.9 [0.29] 1.2 [0.22] 1.5 ** [0.27] 1.0 [0.12] 1.1 [0.22] 7 1.1 [0.25] 1.1 [0.27] 1.3 [0.26] 1.1 [0.13] 1.0 [0.18] 8 0.6 ** [0.13] 0.8 [0.18] 1.0 [0.21] 1.0 [0.13] 1.5 ** [0.27] 9 0.8 [0.19] 1.2 [0.27] 1.2 [0.27] 1.2 [0.16] 1.1 [0.21] 10 1.2 [0.34] 1.3 [0.32] 1.0 [0.23] 1.8 *** [0.24] 1.2 [0.28]
Perceived health status (good and very good) 0.5 *** [0.11] 0.2 *** [0.05] 0.2 *** [0.04] 0.3 *** [0.02] 0.4 *** [0.04] Insurance Status (reference category= Fonasa A) Fonasa B 1.2 [0.17] 0.8 ** [0.09] 0.9 [0.12] 1.1 * [0.07] 1.3 *** [0.13] Fonasa C 1.2 [0.24] 0.9 [0.14] 1.2 [0.16] 1.2 ** [0.09] 1.3 [0.27] Fonasa D 1.2 [0.32] 1.1 [0.21] 1.6 ** [0.28] 1.5 *** [0.16] 1.3 [0.28] Isapre 1.2 [0.27] 1.5 ** [0.28] 1.6 *** [0.30] 1.5 *** [0.14] 1.0 [0.22] Constant 22.5 *** [8.60] 2.0 [1.37] 1.9 [1.32] 0.2 * [0.16] 5.4 *** [2.86] Observations 7,838 8,078 10,945 48,753 8,920 a Municipalities dummy coefficients excluded from table b In brackets *** p<0.01, ** p<0.05, * p<0.1 c Age categories (not shown) and employment status only for adults analyses

78
5.3.3 Summary of quantitative results for visits utilization In terms of preventive care utilization, there were no significant differences between
Fonasa A enrollees and other health insurance groups except for adult and older adult women where being in Fonasa A was associated with a higher probability of having had a preventive visit. In terms of acute care and combined visits, for both infants and older people–groups that use intensively the healthcare system–there is no difference in healthcare utilization. For other age groups, Fonasa A enrollees are generally less likely to have had any type of visit in the last three months.
5.3.4 Key qualitative results for healthcare utilization Qualitative results related to accessibility, out of pocket expenditures, patient
reminders, outreach activities, comprehensiveness and their relationship with healthcare utilization are presented in the following section. This section addresses hypotheses associated with research questions 2.1 and 2.3.
5.3.4.1 Priority groups access to primary care services
Hypothesis 2.1.c It is important to note that respondents that use the public sector were significantly
older than the ones interviewed in the private sector and in two focus groups reported short wait times and no wait lists for primary care services. However, these same respondents noted that this is the case only for their age range and that younger people have a difficult time trying to access primary care services.
This situation is consistent with quantitative results that showed no difference in ambulatory healthcare utilization for people 65 and older but did show that adults enrolled in Fonasa A had lower utilization rates than people enrolled in other public health plans or Isapres. In terms of accessibility for children, 4 women reported long wait times for children and explained that they did not choose the public system for them since they feel doctors in the public system are not “good” or spend too little time with the children. In two cases, the children attended both the public primary care center and the private sector.
5.3.4.2 Out of pocket expenditures associated with services patients
regularly use Hypothesis 2.3.a In terms of out of pocket expenditures, respondents in two focus groups reported
being incentivized to use the services that are offered by the fact that they do not have to pay for them and also because they get their medicines for free.
Another interesting finding is related to the fact that even though some Fonasa enrollees can buy a voucher for a specialist visit, at least two private patients and one provider reported that they could be subsequently unable to pay for the tests that the physician orders or for the drugs that are prescribed to them in this context. Because utilization of tests and use of drugs were not included as outcomes in the quantitative section, this situation was not detected in that section of the dissertation.

79
5.3.4.3 Appointment availability Hypothesis 2.3.b As it was discussed in section 6.2.3, respondents in the focus groups and private
patients report longer wait times and wait lists in the public sector, which could be affecting their ability to use primary care services. In terms of specialty visits, a majority of Fonasa enrollees (both in focus groups and contacted in private centers) report great difficulty in getting access to specialized care. In this regard, respondents were sometimes confused about the definition of continuity of care that we used in the interview, namely being seen by the same provider at each visit or having a medical home. It seems that in the Chilean context continuity of care is associated with being able to access different levels of care as needed, especially being able to access secondary and tertiary care. It is understandable that they would refer to this situation as continuity of care since in the public sector the continuum of care seems to be broken. This is consistent with quantitative findings that show that Fonasa A enrollees had lower utilization rates of specialty visits (Appendix 5). Both providers and patients attribute this lack of specialists in the public system to low salaries for doctors in the public system.
Chileans have found some ways to get access to secondary care when they need it. One way is to pay for services in the private sector (through a voucher or paying in full). A variant of this strategy, described by one physician in the sample, is to bypass the waitlist in the public sector by attending a doctor’s private practice. If this doctor works in a public hospital he or she will get an appointment for his or her client in this organization. This mechanism is described for patients that cannot pay for further tests and drugs in the private system. For example, a patient will go to a gastroenterologist in the private system and if this doctor works in a nearby hospital she will send that patient to the hospital and ask to see him directly during the times she works in the hospital. Doctors call these kinds of appointments "fuera de agenda" or “sobrecupo” meaning there is some slots assigned for people that the doctor wants to examine from outside the regular appointment system. Ultimately, paying a private doctor’s visit will ensure a specialist visit in the hospital and eventually an expedited access to procedures such as exams or surgeries or to referrals to another specialist.
5.3.4.4 Use of patient reminders and outreach activities
Hypothesis 2.3.c Another factor that could be associated with higher utilization of services is the use of
patient reminders and outreach activities such as home visits by primary care providers. In that sense, a few users of both systems reported receiving reminders about scheduled appointments and, to a lesser extent, reminders about preventive services such as vaccinations or follow-up visits.
One public provider reported having reminders for preventive services for certain populations while all providers in the private sector mentioned that reminders for preventive services are not implemented as an administrative procedure and doctors decide on an individual basis if they want to use them or not. One private manager explains that they do not implement reminders for preventive services since they focus on curative medicine. Conversely, both managers and clinicians from the public sector report working following the family medicine model which focus on prevention and continuity of care.

80
In terms of outreach activities, providers in the public sector and users of the public sector value home visits, especially for senior citizens. Private providers do not report offering home visits for their patients. Qualitative results regarding reminders and outreach activities are consistent with quantitative findings that show that in general, there are no differences in terms of utilization of preventive services between Fonasa A enrollees and the rest of the population. Since Fonasa A enrollees cannot buy vouchers to get preventive services they should have lower utilization rates than people in other plans if there are long waitlists in the public healthcare sector, however, the use of reminders and outreach activities could be counterbalancing this effect by encouraging individuals to demand preventive services.
5.3.4.5 Comprehensiveness
Hypothesis 2.3.d Providers from the private system felt confident about the quality of their curative
services, but all of them identified comprehensiveness as a weakness, referring specifically to inadequate preventive and rehabilitative services. Many explained that prevention at the population level was completely absent from their programs, and that rehabilitation was limited and individual rather than group-oriented. One doctor explained that the system does not focus on prevention because people (and their health insurance plans) will not pay for services such as health education or outreach activities and he argued that the state must mandate that private health insurance companies contribute to prevention efforts. This situation is also consistent with quantitative findings showing that users of private services such as people in Fonasa D and Isapres are not better off in terms of preventive services utilization than Fonasa A enrollees who generally use the public system which seems to be focused on prevention more than the private sector.
When asked about comprehensiveness in the public system, participants in the three focus groups reported being satisfied with comprehensiveness in the facilities they attend. A few users of the private system associated comprehensiveness with access to specialty care in the same facility where they get primary care services. Moreover, respondents from small private medical center complain about not having all services in the same site like laboratory tests and x-rays.
5.3.4.6 Summary of qualitative results for healthcare utilization
The main emergent themes and salient quotes for healthcare utilization are presented in Table 40.
Hypothesis 2.1.c Older people report not having problems to access primary care services in the
public system but acknowledge that other age groups struggle more to get an appointment in this setting.
Hypothesis 2.3.a Users of the public system value the fact that services and supplies such as drugs are
free while users of the private sector report having trouble paying for tests and procedures after they are able to pay for an appointment. Not only that but some of them worry about their solvency once they need more expensive services such as surgeries or hospitalizations.

81
Hypothesis 2.3b As expected, appointment availability and wait time are listed as an obstacle to
healthcare access in the public system and respondents in general would prefer to have access to the private system especially because they would save time when demanding health services. This situation is aggravated in the case of specialty visits; Fonasa enrollees either pay for services in the private sector or try to bypass the waitlist in the public sector by buying a voucher for a doctor that works in the public system.
Hypotheses 2.3.c and 2.3.d Patient reminders and outreach activities seem to be used more intensively in the
public system. Furthermore, based on reports of focus groups participants and private providers, the public system seems to be doing a better job than the private sector in terms of preventive care. Participants of all three focus groups are satisfied with comprehensiveness of care in the public system, however, users of the private system are not aware of the public system’s better performance in terms of preventive services. As it was discussed before, these patients mostly focus on access to specialty services since this is the feature of the public system that has been found lacking by users of both systems.

82
Table 40. Summary table: Emergent themes and salient quotes for research question 2.3
Emergent theme Quote Older people report not having problems to access primary care services in the public system but acknowledge that other age groups struggle more to get an appointment in this setting
Respondent 3: And asking for an appointment, it actually costs nothing, Respondent 1: No, it costs nothing. Respondent 3: But for the elderly, because young people have to be there at 7 am.
Focus group 1
Users of the public system value the fact that services and supplies such as drugs are free
Interviewer: I have a question; we want to see a bit is why are you enrolled where you are enrolled? Is it because it is close to you, is it because it is cheaper, is it because what there is, is ... Respondent 2: First, you do not pay anything, they give you the drugs when they are generic, they give them to you, the other kind [brand name drug] they cannot [give it to you].
Focus group 2 Users of the private sector report having trouble paying for tests and procedures after they are able to pay for an appointment.
Respondent 5: Getting a voucher and all that [to have access to private services]. Respondent 3: The thing that’s expensive is the drugs… …Respondent 3: There’s where my daughter grounds to a halt, the tests, the drugs.
Focus group 2 As expected, appointment availability and wait time are listed as an obstacle to healthcare access in the public system
Interviewer: Public primary care center, discarded? Why? Respondent: Unless it is an emergency, the weekend or at night where there is no access to this private service. Respondent 2: Because the queue is very large. They made us wait a lot, once they made us almost beg them to put a filling on one of my daughters and having {unintelligible (01:38)} and they get a voucher for 6 years-old.
Female adult, Fonasa B, user of a small private medical center In the case of specialty visits, Fonasa enrollees either pay for services in the private sector or try to bypass the waitlist in the public sector by buying a voucher for a doctor that works in the public system.
Respondent: If … the patient is in my area and I refer him, hey go, look, this issue will cost you a lot of money, you don’t have money to pay, because you have a right to this or this {unintelligible}, you are from Pudahuel or Renca, or something like that, then you belong to my… OK! Come to see me the specialty clinic of my hospital, the Felix Bulnes… I refer them to myself. Interviewer: Ah! Perfect! Respondent: To me, that is, I say, go there on Tuesday, Wednesday, I work at the polyclinic there and that’s it.
Physician, manager of a small private medical center Patient reminders and outreach activities seem to be used more intensively in the public system.
Interviewer: ... are efforts made in the center, for example, to call people if they missed and appointment? Say to them, hey! Let’s make the appointment again for a health checkup or immunization and then they are called? Is there a follow-up of patients? …Respondent: The pediatrician calls them. But he is not chasing the patient either… it's more a personal thing. Physician, manager of a small private medical center
The public system seems to be doing a better job than the private sector in terms of preventive care.
Respondent: The doctor who sees me is very good to me, she examines me completely, she takes my blood pressure and asks me how I feel, how I am, OK, she says, since you are well you can leave, but your cholesterol is a little high, go to the nutritionist, she takes care of everything, you go to the physiotherapist, to have her... she sends me to the nurse so the nurse makes a follow up, I mean, she worries overall for everybody’s health and like she gets boring, she ask me questions of the mind too, so that 's why I go because she takes care of you as a whole .
Focus group 1

83
Chapter 6. Discussion
In this section results of the analyses for both survey and interview and focus group
data will be discussed in light of the existing literature both in Chile and in the world. The discussion will be organized by research question and will also include a section where descriptive results related to health insurance in Chile will be discussed. Finally, limitations of this dissertation and future research topics will be set forth.
6.1 Choice of private provider Research Question 1.1 The first research question asked was if type of health insurance was associated with
choice of private versus public provider after controlling for socio-demographic characteristics, in order to use type of health insurance as a proxy using the private or public system as a preferred venue for seeking primary care services. Hypothesis 1.1.a posed that, Fonasa A enrollees would be less likely to have chosen a private provider for all types of visits (preventive, acute care, specialty and emergency care) than people in other health insurance groups, which was found to be true, even after controlling for income. This is explained by the fact that individuals in plans other than Fonasa A can buy vouchers to have access to services in the private sector. Furthermore, Isapre members have access to plans with better benefits and coinsurance rates than individuals enrolled in public plans (Holst, Laaser, and Hohmann 2004; Sapelli and Torche 2001). This association between type of health insurance and choice of private versus public provider allows for the use of type of health insurance as a proxy of having a private provider as a preferred venue to receive healthcare services and it was determined that it could be used in the subsequent analysis of primary care services.
Remarkably, Fonasa A enrollees buy specialist and emergency services in the private sector almost half and a third of the time respectively, even when they cannot get any reimbursement for them (Table 7). Both situations are probably associated with waitlists and long wait times in the public sector for these types of care. It is unlikely that some of these patients may have been referred to private providers in the context of the GGH plan since, nationally, only 1.3% of all patients in the GGH waitlist were referred to a private provider (Consulting 2013).
Findings associated with control variables and not with the main outcome do not present many surprises. As expected, the higher the income the higher the probability of choosing a private provider for preventive, acute care and specialty visits. The association between income and choice of private provider (after controlling for type of health insurance) can be explained by two main pathways; individuals with higher income 1) are able to pay for more expensive services (or user fees associated with those services) which generally is the case with private services in the Chilean system (as it was shown in section 1.2.1) and around the world (Basu et al. 2012; Berendes et al. 2011; Montagu et al. 2011) and 2) those payments represents a smaller proportion of their overall income (Ministerio de Salud de Chile 2007).
The only unexpected finding is that reporting having a good health status is associated with being more likely to choose a private provider for acute care visits.

84
Intuitively, individuals who are sicker would have a bigger incentive to choose a private provider since they would want to get their services as soon as possible, instead of having to wait for an appointment in the public sector but the direction of the relationship goes in the other direction. One reason why I find this association may be that sicker individuals have to spend more of their income in copayments and drugs so they are more prone to choose a public provider, which generally is cheaper and has drugs available for free or at a very low price.
Research Question 1.2 Research question 1.2 asked how do out of pocket expenditures associated with
services, geographic location of the provider, perceived quality of services, perceived service and amenities, and expected wait time influence the choice of a private primary care provider. In depth and focus group results suggest that higher out of pocket expenditures associated with services in the private sector does deter individuals from choosing private providers, especially Fonasa A enrollees. Individuals in this group would use private providers if they had the money to do so. Frequent users of the private system do not seem to be concerned with out of pocket expenditures associated with services but they do worry about their ability to pay for private services in the future, a rational apprehension since older people tend to need more health services, see their income decrease and their private health insurance premiums increase; all these situations make access to private services, which are more expensive than public providers, more difficult.
Contrary to prediction, geographic location of private providers was not deemed as more convenient than geographic location of public centers. Interestingly though, both public and private sector users highlight the proximity (to their houses, their workplace or to a metro station) of the center they attend as a decisive factor for choosing that particular provider. These findings are consistent with the literature (Exworthy and Peckham 2006) although one study found that in the case of government facilities people may choose a facility that is more distant since they may regard that facility, generally a hospital, as a better choice in terms of quality of care, especially in the case of a more severe condition (Habtom and Ruys 2007). Since participants were asked explicitly about primary care services this should not be a problem in this study.
Users of private services did perceive quality of those services as better in private primary care centers. Quality of services is attributed mainly to specific physicians and not to the overall system. On the other hand, respondents in the public sector report the quality of services received in the public sector as very good although no comparison about the quality of care between the public and private sector is available in the data collected from this group. In Chile, as in other health systems in Latin America, patient satisfaction with services received is better for the private system although questions about effectiveness of care are conflated with amenities and other related concepts (Gouveia et al. 2005; Ministerio de Salud de Chile 2007). As it was discussed in section 1.2.1 there is no clear evidence that, in low and middle-income contexts, the private sector provides better quality care than the public system. There is a consensus about the need for more research in this area (Basu et al. 2012; Berendes et al. 2011; Montagu et al. 2011), and this is especially crucial for primary care services that may be outsourced to the private sector in low and middle income settings.
Regarding wait time and services and amenities, results were consistent with data found in Chile (Ministerio de Salud de Chile 2007; Superintendencia de Salud

85
de Chile 2012) and in other countries (Basu et al. 2012; Berendes et al. 2011) that show that private services perform better in these dimensions.
6.2 Utilization of primary care services
Research questions 2.1 and 2.2 A possible association between type of health insurance and ambulatory care
utilization was explored in research questions 2.1 and 2.2. In terms of preventive visits, no such relationship was found for children, teenagers, male adults and male older adults (Hypothesis 2.1.a). The fact that, for these groups, there are no differences in preventive services utilization between Fonasa A enrollees and other insurance groups may be explained by special efforts by the public system to provide these services to the population they serve counterbalancing better access to services that individuals in the private sector experience given the existence of the voucher system. Strategies such as patient reminders, small media and one-on-one education, all of them used in the public sector much more intensively at least theoretically, have been associated with higher use of preventive services (Baron et al. 2008). Not only that, but it has been suggested that such interventions work better in a centralized healthcare system where doctors are salaried like the public system in Chile (Ballard et al. 2007; Casalino 2006; Mehrotra 2006). A force driving lower use of preventive services in the private sector can also be the existence of user fees for preventive services in some health plans. User fees have been found associated with lower preventive services utilization, however, free care alone was found to be insufficient to achieve recommended levels of preventive care (Lurie et al. 1987; Ridde and Morestin 2011). The use of vouchers (and other fee for service payment mechanism) as a strategy to incentivize the use of certain health services has been found to increase the uptake of primary care goods and services (Lewin et al. 2008), however this effect was not found in this study for preventive visits although the use of vouchers is strongly correlated with higher utilization of specialist care. This may be due to the fact that preventive care visits reimbursement is low compared to the rate for specialist visits.
For children, teenagers, male adults and male older adults, being enrolled in Fonasa A was associated with lower utilization of acute care services (contrary to the hypothesized relationship in 2.1.a) and combined visits (consistent with the hypothesized relationship in 2.2.a). This lower utilization of Fonasa A enrollees may be explained by the fact that they do not have access to private services through the voucher system.
Adult women and older women, groups traditionally targeted by the public system (Kaempffer and Medina 2006; Ministerio de Salud de Chile 2014; 2012) enrolled in Fonasa A are, as hypothesized in 2.1.a and 2.1.b, more likely to have had a preventive visit than other health insurance groups. The fact that adult and older women have higher utilization of preventive can be explained by the fact that preventive services such as pap smears and mammograms are aggressively pursued by the public system that has annual targets to reach associated with financial incentives as it was explained in section 1.2.1. It is improbable that women in the public sector have better access to reproductive care such as prenatal care or contraception services since there is no evidence that, in Chile, poor people actually have better indicators of perinatal mortality (Donoso S 2004; Frenz and González 2010) or use of contraceptives (other than emergency contraception which should be a last resort strategy to prevent unwanted pregnancies at the population level) (Faúndes 2013). Most probably, some of these

86
preventive visits were misclassified as specialty care since a gynecologist performs prenatal care and wellness visits in the private sector, thus making necessary to perform sensitivity analyses including all ambulatory care visits included in the CASEN survey. These analyses show that adult women enrolled in Fonasa A are actually less likely to have had an ambulatory care visit in the last three months than women enrolled in other health plans, so the latter explanation for findings regarding preventive visits in adult women may be true.
In the case of older women the lower use of preventive services by Isapres enrollees may be associated with user fees that might be more difficult to absorb by this age group although this effect is not observed in older men.
If adult and older women enrolled in Fonasa A were actually more likely to have a preventive visit and this association was not explained by misclassification of preventive visits as specialist visits, an increased utilization of acute care services for individuals in other health plans can be expected for these age groups. This is the case for adult women, although this situation can be explained by access to vouchers. In the case of older women, individuals enrolled in Isapres are actually less likely to seek acute care than Fonasa A enrollees. This may be explained by higher copayments in the private sector for this kind of services.
Finally, older women and children show no differences in terms of ambulatory care utilization. One interpretation of this finding in older women (who have a higher utilization rate of preventive services for Fonasa A enrollees) may be that the public system is equalizing utilization for this group probably by increasing preventive services use since Isapre members and other public health plans should have higher ambulatory care utilization rates after controlling for health need by the mere fact that they have access to vouchers.
For children, who present no difference in preventive visits utilization, the lack of an association between type of health insurance and ambulatory care may be due to the fact that children require less specialist care which has the higher access barriers for individuals confined to the public system as it was discussed in section 1.3.3, although, they frequently do require acute care whose accessibility was found to be better for health plans other than Fonasa A.
In terms of access barriers for primary care services, focus group data revealed that senior citizens do report having better access especially in terms of availability of services (Hypothesis 2.1.c), which is consistent with quantitative findings about utilization rates of preventive services in older women. Since mainly older adult women composed the three focus groups that were organized, questions about accessibility of services were not posed to other priority groups in the public sector such as women in reproductive age or mothers or small children. Research question 2.3
Regarding differences between public and private providers in terms of hypothesized determinants of utilization of primary care services findings were consistent with the proposed hypotheses. As it has been found in other low and middle-income countries (Basu et al. 2012; Berendes et al. 2011), private providers were reported to perform better than public providers in terms of appointment availability⎯which would theoretically increase utilization of services⎯but were also linked with higher copayments

87
which are supposed to disincentivize use of unnecessary (and sometimes necessary) care (Chernew and Newhouse 2008; Gruber 2006).
Since patient reminders have been found to increase use of preventive services such as pap smears (Kaczorowski et al. 2013; MacLaughlin et al. 2014) and immunizations (Jacobson Vann and Szilagyi 2005), specific questions about this type of activities were included in the interviews and focus groups guides (Hypothesis 2.3.c). Public providers reported having a system to remind certain populations about services that are due although we almost did not find patients from the public sector that had been targeted by this strategy. Private providers do not systematically remind patients about missing appointments or preventive services that are due shortly. Use of reminders may be contributing to the fact that for some populations such as adult and older women, utilization of preventive care is larger in the public system.
Outreach activities in the public sector, specifically home visits for bedridden senior citizens were spontaneously reported both by patients and public providers (Hypothesis 2.3.c). This kind of activities was not described for the private sector although respondents were asked specifically about outreach activities. This may be partially associated with the family medicine model that has been implemented in the public sector, which allows them to use reminders and outreach activities intensively which may be explaining why older women enrolled in Fonasa A, which are “stuck” in the public system and have to deal with longer waitlists and wait times, have higher utilization rates of preventive services than women enrolled in Isapres.
In terms of comprehensiveness of services (Hypothesis 2.3.d), both public and private providers report that the provision of preventive services is a weakness of the private sector, a finding that is consistent with the literature for low and middle-income countries (Groote, Paepe, and Unger 2005; Provost et al. 2010). This situation may be associated with the fee for service payment mechanism that fails to fund services such as health education or outreach activities.
All these determinants of healthcare utilization may be working in opposite directions and eventually cancelling each other in the cases where no differences were found between users of the public and the private sector. For example, families with children who are frequent users of the public sector may be incentivized to schedule a wellness visit for that child given the fact that they are reminded about that visit being due at a certain date and the inexistence of a user fee, however, they may encounter an access barrier if they cannot find an available appointment slot opportunely or they anticipate a long wait time once they arrive to the facility.
6.3 Health insurance In terms of health insurance, it is interesting to note that Fonasa insures most people.
Some individuals that belong to the richest income deciles are enrolled in Fonasa A (Table 4 and Table 5), although this category is reserved for people that are qualified as indigent. Even though these results could be explained by miscategorization of these respondents, it may be the case that these individuals correspond to “falsos indigentes” or false indigents, individuals that falsify their financial information to be able to get

88
healthcare services for free in the public system. Recent efforts to identify these individuals have been successful40.
Another remarkable situation that can be observed in section 5.1 is evidence of cherry-picking by private health insurance plans. By design, the Chilean healthcare system allows Isapres to cherry-pick their members (Vergara-Iturriaga and Martinez-Gutierrez 2006) since there is no guaranteed issuance of healthcare policies and Isapres set their premiums according to age and sex (Sapelli and Torche 2001) although recently the Constitutional Tribunal Court has set some limits to risk adjustment by Isapres especially regarding age adjustments (Aguilar Cavallo 2008). Not only that but Fonasa acts as a public option and operates as a fallback insurance scheme since premiums are not risk-adjusted but correspond to a percentage of the member income. Evidence of cherry-picking can be observed in Table 6. A higher percentage of women are enrolled in Fonasa, especially in Fonasa A. Also, young adults, college educated individuals; people living in urban areas and individuals with good or very good health status are disproportionally enrolled in Isapres.
6.4 Limitations In this section, limitations of the quantitative study will be discussed followed by
limitations of the qualitative section. Reverse causality between type of health insurance and utilization of services can be
a problem on research question 2. It is perfectly possible that a preference for a higher utilization of health services could influence the choice between public and private health insurance (Sapelli 2004; Sapelli and Vial 2003). People who tend to utilize any type health services more frequently would choose to be privately insured since access to services from private providers and their quality is presumed to be better and private providers are more likely to accept private than public insurance. In this case, the estimators found in this study could be biased down since utilization preferences were not controlled for. The use of an instrumental variable or panel data would help in controlling for this omitted variable bias.
The lack of appropriate dependent variables to be used as proxies of use preventive care in the Chilean health system is also an important limitation. Preventive visits are good indicators of utilization of preventive services but more specific measures of preventive care are needed to evaluate whether the observed relationship is maintained when other types of services such as immunizations or diagnostic procedures are analyzed. On the other hand, the question used for measuring preventive visits considers follow-up visits for chronic conditions as preventive care so using this measure could be underestimating the effect of type of health insurance on preventive care utilization. A more refined measure of wellness visits could allow us to actually find results consistent with the proposed hypotheses in this dissertation.
One considerable assumption of the conceptual model of this study is that the more primary care services a person uses (controlling for health status) the better they are in terms of health outcomes. This may or may not be true especially since there is no information about the quality of these services and their actual effectiveness. Furthermore, performance of public providers has been shown to be heterogeneous 40 http://www.fonasa.cl/wps/wcm/connect/4df9570f-71b8-4a97-800e-864965fae6b9/Fonasa+Informa+2013+01.PDF?MOD=AJPERES [Consulted on 3/4/14]

89
(Alvarado 2002; Emanuel and Fuchs 2005; Jung and Tran 2009), so the true relationship between type of health insurance and utilization of services could be mediated by which specific provider one has access to rather than by which type of delivery organization provides the health services being demanded.
Another limitation of the analyses is that regression results for older adults, in terms of the effect of health insurance on utilization, are difficult to interpret because higher health services utilization may be associated with worse health status, in this case for Fonasa A enrollees. Undoubtedly, Isapre members report having a good health status more frequently than Fonasa enrollees, especially than Fonasa A enrollees (Table 41). This situation can lead to overestimation of the magnitude of the association between being in Fonasa A and using primary care services (although not necessarily with preventive services). Actually, reporting having a good or very good health status is associated with lower use of services for all three types of outcomes (preventive, acute care and combined visits). Using health status, as a control variable should have solved this problem, however this indicator is a crude measure of overall health status and may not be capturing its total effect on utilization. This situation will remain a limitation of the study.
Table 41. Adults 65 years and older: Perceived health status by type of health
insurance
Perceived health status: good or very good (row weighted %) Total
Fonasa A 60.6% 100% Fonasa B 64.2% 100% Fonasa C 75.4% 100% Fonasa D 66.8% 100% Isapre 81.8% 100% Total 64.7% 100%
The qualitative section of this dissertation also presents some important limitations
that will be addressed in the following paragraphs. Since fieldwork for this portion of the dissertation was done in a limited period of
time, the number of respondents was somewhat smaller than the required to achieve saturation of all emerging topics. This means that there may be another topics or viewpoints that are not reflected in this work.
In terms of transferability to other research settings (Hannes and Macaitis 2012), data collected from providers and patients in the municipality of San Miguel are limited since this results are probably transferable only to urban low and middle-income localities in Chile. Not only that but there were some imbalances in the composition of focus groups that does not allow the author to apply most qualitative findings to other age/sex groups that use the public system such as adult men or children.
Because of the nature of qualitative research, researcher bias is inescapable and needs to be acknowledged in order to help the reader with the interpretation of results (Cohen and Crabtree 2008). The author of this dissertation is a 39-year-old Chilean
90
female, physician and Master in Public Health, member of an Isapre and frequent user of the private healthcare system, who knows the Chilean Healthcare System mainly through academic work. She has political views that would be identified in the United States as liberal/socialist although she does not belong to any political party, neither in Chile nor in the United States. The author was participating in an advocacy project while writing this dissertation called “SaludxChile” whose aim is to push for health reform to achieve equal healthcare for all being understood as equal access to equal quality of care for all people, regardless of background, ability to pay, preexisting diseases, sex, age and location41.
6.5 Future research Future research will focus on three aspects. First, there is a need to develop
documents that explore descriptively the private ambulatory healthcare sector in Chile. There is an appalling lack of information about who are these providers, where are they located, what is their services portfolio, their productivity and financing schemes.
A second line of investigation is related to explore differences in utilization of services between Fonasa plans other than A and Isapres. An interesting analysis can compare utilization of services between Fonasa D enrollees and Isapre members that have a similar health plan to Fonasa D to explore if Fonasa D enrollees’ higher preference for the public sector is associated with differential use of preventive services between otherwise similar populations. This subject can be approached in two ways. Analyses may be expanded to explore this problem using the same methodology presented in this dissertation. The approach would involve a prospective study design in order to address reverse causality problems and also include a qualitative appraisal of the kind of services that are being offered in the context of a preventive visit in public and private settings and the quality of these services. It would also be interesting to explore quantitative and qualitatively any associations of hypothetic determinants of utilization of primary care services included in this dissertation (such as out-of-pocket expenditures for the services patients regularly use, appointment availability, use of reminders and outreach activities and comprehensiveness of care) and utilization of primary care services and the how these associations vary by choice of public and private provider.
A third avenue of inquiry is related to directly measuring structural characteristics and practice features of primary care systems in a selected group of public and private providers to explore their impact on differential rates of utilization and health outcomes for all income/insurance groups.
41 www.saludxchile.cl

91
Chapter 7. Conclusion and policy implications In Chile, as well as in Latin America, research about the role of private primary care
providers is lacking. Given the multiple waves of neoliberal health reforms that the Latin-American health systems have gone through, it is time for an evaluation of the impacts of the recent design of mixed health care systems in Latin America on health care utilization among different socio-economic groups. Chile, being one of the early adopters of these types of reforms is a particularly interesting case to study, as privatization efforts are cyclical, depending on the political coalition in power.
The fact that the Chilean Health system has various types of health insurance that interact differently with the healthcare system provides an opportunity to compare how both delivery arrangements, public and private, perform in terms of access to health services and how the different health insurance schemes determine which type of providers are being used and most importantly how are they being used.
Findings of this dissertation can inform two different health policies that were under revision in the former administration and will be revised again by the newly elected government of Michelle Bachelet.
The first policy is the use of vouchers to increase access to ambulatory healthcare services for members of the public health plans. In July 2012, the government of Sebastian Piñera, leader of the right-wing coalition, extended the use of vouchers for members of Fonasa A that received a government pension. He also sent a Bill to the Congress to extend the use of vouchers for ambulatory care to everybody in the Fonasa A health plan.
The second policy that is constantly under revision is the existence of a private health insurance market that is part of the social security scheme in Chile since it collects the mandatory social security payment for health. Shortly after being elected, Piñera convened a “Health Commission” which was mandated to propose several structural reforms to the Chilean health system to address the public’s discontent with the public healthcare network (Holst, Laaser, and Hohmann 2004). One of the chief recommendations of the Commission was to create a universal health plan with a community-rated premium, supplemented by a risk compensation fund. Above a determined income level, Chileans would be able to choose, if they wanted, to use their subsidized premium to buy public or private insurance (Salud 2010). This subsidy would likely give a boost to the Chilean private health insurance market and subsequently generate growth in the private providers market.
In March 2014, the Bachelet administration tossed away the Bill and convened its own Commission, which is expected to reform the private health insurance market to specifically address problems of discrimination and risk-segregation.
The evidence found in this dissertation suggests that 1) Isapre members and enrollees in public health plans other than Fonasa A use the private healthcare sector more frequently than Fonasa A enrollees and 2) the public system is equalizing preventive care utilization for all groups and ambulatory healthcare utilization in the groups that it focuses on. For these groups, the public system seems to be compensating a lower utilization of specialty visits with a higher utilization of preventive visits, which may be more efficient if health outcomes are similar for users of the public and the private system, an issue that will be pursued by the author of this dissertation in the future. This replacement of specialty visits with preventive visits should give policymakers pause when

92
evaluating policies attempting to increase the use of primary care private providers such as increased use of vouchers in public plans or the expansion of the private health insurance market. Not only would this present a problem in terms of the focus of the delivery system on prevention, which has been found in the qualitative part of this dissertation to be somewhat lacking in the private sector but also because it has been observed in other settings that increasing services in the private sector has lead to crowding out of resources (financial, human and others) from the public to the private sector (Basu et al. 2012).
This may be counterbalanced by qualitative results suggesting that, policies that increase the use of private providers however, may be effective in improving access to ambulatory specialty care, although the main findings of this dissertation do not address directly this problem.
In light of these findings, proposals to further expand private health insurance coverage or use of private providers in the Chilean population should take into consideration that this could lead not only to care focused on curative versus preventive services but also to a less efficient distribution of primary care services, since some of the people that need primary care services may be substituting preventive services for specialist services, which are more expensive and less comprehensive than preventive visits. However, the use of private providers may be the only short-term solution in terms of access to some ambulatory and specialist services.

93
Chapter 8. References
Aaron, Henry J. 2011. “How Not to Reform Medicare.” The New England journal of medicine
364(17): 1588–89.
Aday, LA, C Begley, D Lairson, and R Balkrishnan. 2004. 3rd Edition Health Administration Press Evaluating the Healthcare System: Effectiveness, Efficiency, and Equity.
Aguilar Cavallo, Gonzalo. 2008. “Principio De Solidaridad Y Derecho Privado: Comentario a Una Sentencia Del Tribunal Constitucional.” Ius et Praxis 14(2): 593–610.
Alvarado, J. 2002. “Evaluating Technical Efficiency of Primary Health Care in the Local Governments of Chile.” webs2002.uab.es. http://webs2002.uab.es/dep-economia-empresa/Jornadas/Papers/2006_11/IVJornadas_paper_JRAlvarado.pdf (February 9, 2011).
Alvo, A, and S Aguirre. 2010. “Perfil Epidemiológico De La Atención De Urgencias en Un Hospital Tipo 4 De La Región Metropolitana, Chile..” Revista ANACEM 4(1): 18–21.
Andersen, RM. 1995. “Revisiting the Behavioral Model and Access to Medical Care: Does It Matter?.” Journal of health and social behavior 36(1): 1–10.
Arrieta, Alejandro, Ariadna García-Prado, and Jorge Guillén. 2011. “The Private Health Care Sector and the Provision of Prenatal Care Services in Latin America.” World Development 39(4): 579–87.
Arteaga, O, I Astorga, and AM Pinto. 2002. “Inequalities in Public Health Care Provision in Chile.” Cadernos de Saúde Pública 18: 1053–66.
Atkinson, Sarah, Amélia Cohn, Maria E Ducci, Lucília Fernándes, and Fiona Smyth. 2008. “Promotion and Prevention Within a Decentralized Framework: Changing Health Care in Brazil and Chile..” The International journal of health planning and management 23(2): 153–71.
Ballard, David J, David A Nicewander, Huanying Qin, Cliff Fullerton, F David Winter, and Carl E Couch. 2007. “Improving Delivery of Clinical Preventive Services: a Multi-Year Journey..” AMEPRE 33(6): 492–97.
Balsa, A, M Rossi, and P Triunfo. 2009. “Horizontal Inequity in Access to Health Care in Four South American Cities.” ECINEQ Working Papers Series 131.
Barnum, H, J Kutzin, and H Saxenian. 1995. “Incentives and Provider Payment Methods..” The International journal of health planning and management 10(1): 23–45.
Baron, Roy C, Barbara K Rimer, Rosalind A Breslow, Ralph J Coates, Jon Kerner, Stephanie Melillo, Nancy Habarta, Geetika P Kalra, Sajal Chattopadhyay, Katherine M Wilson, Nancy C Lee, Patricia Dolan Mullen, Steven S Coughlin, Peter A Briss, Task Force on Community Preventive Services. 2008. “Client-Directed Interventions to Increase Community Demand for Breast, Cervical, and Colorectal

94
Cancer Screening a Systematic Review.” AMEPRE 35(1 Suppl): S34–S55.
Bass del Campo, Camilo. 2012. “Family Health Model in Chile and Greater Resoluteness of Primary Health Care: Contradictory or Complementary?.” Medwave 12(11): e5571–71.
Bastias, G, T Pantoja, T Leisewitz, and V Zarate. 2008. “Health Care Reform in Chile.” Canadian Medical Association Journal 179(12): 1289–92.
Basu, Sanjay, Jason Andrews, Sandeep Kishore, Rajesh Panjabi, and David Stuckler. 2012. “Comparative Performance of Private and Public Healthcare Systems in Low- and Middle-Income Countries: a Systematic Review.” PLoS Medicine 9(6): e1001244.
Becerril-Montekio, Víctor, Juan de Dios Reyes, and Annick Manuel. 2011. “Salud Pública De México - the Health System of Chile.”
Berendes, Sima, Peter Heywood, Sandy Oliver, and Paul Garner. 2011. “Quality of Private and Public Ambulatory Health Care in Low and Middle Income Countries: Systematic Review of Comparative Studies.” PLoS Medicine 8(4): e1000433.
Berer, Marge. 2011. “Privatisation in Health Systems in Developing Countries: What's in a Name?.” Reproductive health matters 19(37): 4–9.
Bitrán, R, L Escobar, and P Gassibe. 2010. “After Chile's Health Reform: Increase in Coverage and Access, Decline in Hospitalization and Death Rates.” Health Affairs 29(12): 2161–70.
Braveman, P, and S Gruskin. 2003. “Defining Equity in Health.” Journal of Epidemiology & Community Health 57: 254–58.
Bronfman, Javier. 2011. “Health Insurance Choice, Moral Hazard and Adverse Selection: a Study of the Chilean Case Using Panel Data.” The Public Purpose IX(Spring 2011): 33–48.
Casalino, Lawrence P. 2006. “Which Type of Medical Group Provides Higher-Quality Care?.” Annals of Internal Medicine 145(11): 860–61.
Chernew, M, and J Newhouse. 2008. “What Does the RAND Health Insurance Experiment Tell Us About the Impact of Patient Cost Sharing on Health Outcomes? .” The American journal of managed care 14(7): 412–14.
Clinicas de Chile AG. 2013. Dimensionamiento Del Sector De Salud Privado en Chile. ed. undefined author.
Cohen, Deborah J, and Benjamin F Crabtree. 2008. “Evaluative Criteria for Qualitative Research in Health Care: Controversies and Recommendations..” Annals of family medicine 6(4): 331–39.
Consulting, DCS. 2013. Informe Final: Evaluación Del Bono AUGE De FONASA Donoso S, Enrique. 2004. “Desigualdad en Mortalidad Infantil Entre Las Comunas De
La Provincia De Santiago.” Revista médica de Chile 132(4): 461–66.
Emanuel, E J, and V R Fuchs. 2005. “Health Care Vouchers—a Proposal for Universal Coverage.” The New England journal of medicine 352(12): 1255–60.

95
Exworthy, Mark, and Stephen Peckham. 2006. “Access, Choice and Travel: Implications for Health Policy.” Social Policy & Administration 40(3): 267–87.
Farley, Thomas A, Mehul A Dalal, Farzad Mostashari, and Thomas R Frieden. 2010. “Deaths Preventable in the U.S. by Improvements in Use of Clinical Preventive Services.” American journal of preventive medicine 38(6): 600–609.
Faúndes, JM Morán. 2013. “La Anticoncepción De Emergencia en Chile: Estructuración De Su Demanda en Función De Variables Socioeconómicas.” Revista Brasileira de Estudos de População 30(1): 125–44.
Frenz, P, and C González. 2010. “Aplicación De Una Aproximación Metodológica Simple Para El Análisis De Las Desigualdades: El Caso De La Mortalidad Infantil en Chile.” Revista médica de Chile 138(9): 1157–64.
Frenz, Patricia, Iris Delgado, Jay S Kaufman, and Sam Harper. 2013. “Achieving Effective Universal Health Coverage with Equity: Evidence From Chile..” Health Policy and Planning.
Galaz, César, Rodrigo Godoy, Javier Cisternas, Gladys Yentzen, and María De la Fuente. 2004. “Patrones De Conducta De Los Usuarios De Un Servicio De Urgencia Adosado a Hospital Tipo 4.” Revista Chilena de Salud Pública 8(2): 84–92.
Gideon, Jasmine. 2001. “The Decentralization of Primary Health Care Delivery in Chile.” Public Administration and Development 21(3): 223–31. http://onlinelibrary.wiley.com/doi/10.1002/pad.175/abstract.
Giffin, K. 1994. “Women's Health and the Privatization of Fertility Control in Brazil.” Social science & medicine (1982) 39(3): 355–60.
Gouveia, Giselle Campozana, Wayner Vieira de Souza, Carlos F Luna, Paulo Roberto Borges de Souza-Júnior, and Célia Landmann Szwarcwald. 2005. “Health Care Users' Satisfaction in Brazil, 2003..” Cad Saúde Pública 21 Sup: S109–18.
Gómez Gómez, Elsa. 2002. “Gender, Equity, and Access to Health Services: an Empirical Approximation.” Rev Panam Salud Publica 11(5-6): 327–34.
Groote, Tony De, Pierre De Paepe, and Jean-Pierre Unger. 2005. “Colombia: in Vivo Test of Health Sector Privatization in the Developing World.” International journal of health services : planning, administration, evaluation 35(1): 125–41.
Gruber, Jonathan. 2006. The Role of Consumer Copayments for Health Care: Lessons From the RAND Health Insurance Experiment and Beyond. Menlo Park: Henry J. Kaiser Family Foundation.
Habtom, GebreMichael, and Pieter Ruys. 2007. “The Choice of a Health Care Provider in Eritrea..” Health Policy 80(1): 202–17.
Haggerty, Jeannie L, Natalia Yavich, Ernesto Pablo Bascolo, and Grupo de Consenso sobre un Marco de Evaluación de la Atención Primaria en América Latina. 2009. “Un Marco De Evaluación De La Atención Primaria De Salud en América Latina.” Rev Panam Salud Publica 26(5): 377–84.
Hannes, Karin, and Kirsten Macaitis. 2012. “A Move to More Systematic and Transparent Approaches in Qualitative Evidence Synthesis: Update on a Review of

96
Published Papers.” Qualitative Research.
Helmke, Irene. 2011. “A Decade Towards Better Health in Chile.” Bulletin of the World Health Organization 89(10): 710–11.
Holst, J, U Laaser, and J Hohmann. 2004. “Chilean Health Insurance System: a Source of Inequity and Selective Social Insecurity.” Journal of Public Health 12(4): 271–82.
Höfter, Ricardo Henríquez. 2006. “Private Health Insurance and Utilization of Health Services in Chile.” Applied Economics 38(4): 423–39.
Ipinza Riveros, M. 2005. “Estudio De La Red Pública De Atención De Urgencia De La Región Metropolitana.” Cuad Med Soc (Chile) 45: 199–216.
Jacobson Vann, Julie C, and Peter Szilagyi. 2005. “Patient Reminder and Patient Recall Systems to Improve Immunization Rates.” The Cochrane database of systematic reviews (3): CD003941.
Jadue H, L, I Delgado B, H Sandoval O, L Cabezas M, and J Vega M. 2004. “Analysis of the New Health Module of the National Socioeconomic Characterization Survey 2000.” Revista médica de Chile 132: 750–60.
Jung, J, and C Tran. 2009. “Health Care Financing Over the Life Cycle, Universal Medical Vouchers and Welfare.” Towson University, Department of Economics, Working Paper (2010-03).
Kaczorowski, Janusz, Stephen J C Hearps, Lynne Lohfeld, Ron Goeree, Faith Donald, Ken Burgess, and Rolf J Sebaldt. 2013. “Effect of Provider and Patient Reminders, Deployment of Nurse Practitioners, and Financial Incentives on Cervical and Breast Cancer Screening Rates..” Canadian family physician Médecin de famille canadien 59(6): e282–89.
Kaempffer, Ana, and Ernesto Medina. 2006. “Mortalidad Infantil Reciente en Chile: Éxitos Y Desafíos.” Rev Chil Pediatr 77: 492–500.
Keleher, Helen. 2001. “Why Primary Health Care Offers a More Comprehensive Approach to Tackling Health Inequities Than Primary Care.” Australian Journal of Primary Health 7(2): 57.
Lawn, Joy E, Jon Rohde, Susan Rifkin, Miriam Were, Vinod K Paul, and Mickey Chopra. 2008. “Alma-Ata 30 Years on: Revolutionary, Relevant, and Time to Revitalise.” Lancet 372(9642): 917–27.
Leon-Vargas, E A, and A Martinez-Becerra. 2011. “Estructura Y Comportamiento Del Mercado De Salud en Chile.” ed. Jorge Katz. Universidad de Chile.
Letelier, Luz M, and Paula Bedregal. 2006. “Health Reform in Chile.” Lancet 368(9554): 2197–98.
Lewin, S, JN Lavis, AD Oxman, G Bastías, M Chopra, A Ciapponi, S Flottorp, SG Martí, T Pantoja, and G Rada. 2008. “Supporting the Delivery of Cost-Effective Interventions in Primary Health-Care Systems in Low-Income and Middle-Income Countries: an Overview of Systematic Reviews.” The Lancet 372(9642): 928–39.
Lurie, N, W G Manning, C Peterson, G A Goldberg, C A Phelps, and L Lillard. 1987.

97
“Preventive Care: Do We Practice What We Preach?.” American journal of public health 77(7): 801–4.
Macinko, James, and Maria F Lima Costa. 2011. “Access to, Use of and Satisfaction with Health Services Among Adults Enrolled in Brazil’s Family Health Strategy: Evidence From the 2008 National Household Survey.” Tropical Medicine & International Health 17(1): 36–42.
Macinko, James, Barbara Starfield, and Leiyu Shi. 2003. “The Contribution of Primary Care Systems to Health Outcomes Within Organization for Economic Cooperation and Development (OECD) Countries, 1970-1998..” Health Services Research 38(3): 831–65.
Maciosek, Michael V, Ashley B Coffield, Nichol M Edwards, Thomas J Flottemesch, Michael J Goodman, and Leif I Solberg. 2006. “Priorities Among Effective Clinical Preventive Services: Results of a Systematic Review and Analysis..” AMEPRE 31(1): 52–61.
MacLaughlin, Kathy L, Kristi M Swanson, James M Naessens, Kurt B Angstman, and Rajeev Chaudhry. 2014. “Cervical Cancer Screening: a Prospective Cohort Study of the Effects of Historical Patient Compliance and a Population-Based Informatics Prompted Reminder on Screening Rates.” Journal of evaluation in clinical practice 20(2): 136–43.
Mainardi, Stefano. 2007. “Unequal Access to Public Healthcare Facilities: Theory and Measurement Revisited.” Surveys in Mathematics and its Applications 2: 91–112.
Manuel, A. 2002. “The Chilean Health System: 20 Years of Reforms.” Salud Pública de México 44(1): 60–68.
Medina, J, C Ghezzi, D Figueredo, D León, G Rojas, L Cáceres, J Kegler, C Orué, L Recalde, H Dávalos, and M Canata. 2007. “Triage: Experiencia en Un Servicio De Urgencias Pediátricas.” Rev Chil Pediatr 78(2).
Mehrotra, Ateev. 2006. “Do Integrated Medical Groups Provide Higher-Quality Medical Care Than Individual Practice Associations?.” Annals of Internal Medicine 145(11): 826.
Ministerio de Salud de Chile. 2007. Estudio Nacional Sobre Satisfacción Y Gasto en Salud. Santiago de Chile: Ministerio de Salud de Chile.
Ministerio de Salud de Chile. 2014. Orientación Técnica Para La Atención De Salud De Las Personas Adultas Mayores en Atención Primaria. Ministerio de Salud de Chile.
Ministerio de Salud de Chile, Subsecretaría de Redes Asistenciales División de Atención Primaria. 2012. Ministerio de Salud de Chile Orientaciones Para La Implementación Del Modelo De Atención Integral De Salud Familiar Y Comunitaria. Ministerio de Salud de Chile.
Miranda Viorklumds, Carolina, Felipe Martínez Gambaro, Jade Fariña Hurtado, and Catalina Mihovilovic Alvarado. 2007. “Consultas en Servicio De Urgencia Hospital Roberto Del Río: ¿Cuáles Son Las Razones De Esta Preferencia Por Sobre El Nivel Primario De Atención?.” Pediatría (Santiago de Chile) 4(2): 3–10.
Montagu, D D, A Anglemyer, M Tiwari, K Drasser, G W Rutherford, T Horvath, G E Kennedy, L Bero, and N Shah. 2011. Private Versus Public Strategies for Health Service

98
Provision for Improving Health Outcomes in Resource-Limited Settings. San Francisco, CA: Global Health Sciences, University of California, San Francisco.
Montero, J, V Vargas, F Poblete, and A Torche. 2008. Análisis Del Modelo De Asignación Financiera en La Atención Primaria Chilena: Pertinencia Del Percápita Actual Y Uso De Variables en Su Cálculo Para Asegurar Concordancia Entre La Situación Epidemiológica Actual Y El Modelo De Atención. Ed. Pontificia Universidad Católica de Chile.
Nnaji, Godswill Amechi. 2011. “Shifting Focus of Primary Health Care in the Context of Health Systems Reform in Resource Poor Settings.” Primary Health Care: Open Access 1(1): 1–5.
OECD. 2013. Health at a Glance 2013: OECD Indicators. OECD Publishing. http://dx.doi.org/10.1787/health_glance-2013-en.
Olavarria, M. 2005. “Acceso a La Salud en Chile.” Acta Bioethica 11(1): 47–64.
Pan American Health Organization PAHO - World Health Organization WHO. 2007. Health in the Americas Vol 2 - Country Profiles 2007 Health in the Americas. Washington, DC: Pan American Health Organization.
Panarotto, Daniel, Henrique de Araújo Vianna Träsel, Michele Salibe de Oliveira, Lívia Brancher Gravina, and Alisson Roberto Teles. 2009. “[Glycemic Control in Type 2 Diabetic Patients in Public and Private Healthcare Service].” Arquivos brasileiros de endocrinologia e metabologia 53(6): 733–40.
Paraje, Guillermo, and Felipe Vásquez. 2012. “Health Equity in an Unequal Country: the Use of Medical Services in Chile..” International Journal for Equity in Health 11: 81.
Pardo, Cristian, and Whitney Schott. 2014. “Health Insurance Selection in Chile: a Cross-Sectional and Panel Analysis..” Health Policy and Planning 29(3): 302–12.
Peñaloza, B, T Leisewitz, and G Bastías. 2010. “Metodología Para La Evaluación De La Relación Costo-Efectividad en Centros De Atención Primaria De Chile.” Rev Panam Salud Publica 28(5): 367–87.
Pribble, J. 2010. “Universalizing Healthcare Policy in Chile and Uruguay.” In Washington, DC.
Provost, Sylvie, Raynald Pineault, Jean-Frédéric Levesque, Stéphane Groulx, Geneviève Baron, Danièle Roberge, and Marjolaine Hamel. 2010. “Does Receiving Clinical Preventive Services Vary Across Different Types of Primary Healthcare Organizations? Evidence From a Population-Based Survey.” Healthcare Policy 6(2): 67–84.
Püschel, K, A Téllez T, J Montero, Astrid Brunner, B Peñaloza, M Paulina Rojas, F Poblete, and T Pantoja. 2013. “Hacia Un Nuevo Modelo De Atención Primaria en Salud.” Estudios Públicos 130: 23–52.
Ridde, Valéry, and Florence Morestin. 2011. “A Scoping Review of the Literature on the Abolition of User Fees in Health Care Services in Africa.” Health Policy and Planning 26(1): 1–11.
Salud, Comision Presidencial de. 2010. Informe Comision Presidencial De Salud Diciembre 2010. http://www.alames.org/documentos/comisionchile.pdf.

99
Sanhueza, R, and J Ruiz-Tagle. 2002. “Choosing Health Insurance in a Dual Health Care System: the Chilean Case.” Journal of Applied Economics 5(1): 157–84.
Sapelli, C. 2004. “Risk Segmentation and Equity in the Chilean Mandatory Health Insurance System.” Social Science & Medicine 58: 259–65.
Sapelli, C, and A Torche. 2001. “The Mandatory Health Insurance System in Chile: Explaining the Choice Between Public and Private Insurance.” International journal of health care finance and economics 1: 97–110.
Sapelli, C, and B Vial. 1998. “Utilización De Prestaciones De Salud en Chile: ¿Es Diferente Entre Grupos De Ingreso?.” Latin American Journal of Economics-formerly Cuadernos de Economía 35(106): 343–82.
Sapelli, C, and B Vial. 2003. “Self-Selection and Moral Hazard in Chilean Health Insurance.” Journal of health economics 22: 459–76.
Savedoff, WD. 2009. “A Moving Target: Universal Access to Healthcare Services in Latin America and the Caribbean.” Inter-American Development Bank Working paper (667).
Sánchez, H, and C Albala. 2004. “Inequalities in Health. Adult Mortality in Communities of Metropolitan Santiago.” Revista médica de Chile 132: 453–60.
Silva, Margarita Bernales. 2013. “Chilean Men's Health: Perceptions and Relationships with the Public Health Care Syste.” The University of Auckland.
Starfield, Barbara, Leiyu Shi, and James Macinko. 2005. “Contribution of Primary Care to Health Systems and Health..” The Milbank quarterly 83(3): 457–502.
Subramanian, S, and T Blakely. 2003. “… : Income Inequality as a Public Health Concern: Where Do We Stand? Commentary on $# X0201c; Is Exposure to Income Inequality a Public Health Concern? ….” Health Services Research.
Superintendencia de Salud de Chile. 2012. Estudio De Opinión Y Satisfacción De Usuarios. Criteria Research.
Szot Meza, J. 2002. “Reseña De La Salud Pública Materno-Infantil Chilena Durante Los Últimos 40 Años: 1960-2000.” Revista chilena de obstetricia y ginecología 67: 129–35.
Téllez T, A, and E Aguayo T. 2008. “Results of a Private Primary Health System Based on a Family Health Care Model in Chile.” Revista médica de Chile 136: 873–79.
Torche, A. 2009. Documentos de Trabajo Introducción De Factores De Riesgo en El Financiamiento De La Salud Primaria en Chile. Instituto de Economía. Pontificia Universidad Católica de Chile.
Unger, J, P DePaepe, and P Ghilbert. 2006. “Integrated Care: a Fresh Perspective for International Health Policies in Low and Middle-Income Countries.” International journal of integrated care 6: 1–10.
Vargas, V, and S Poblete. 2008. “Health Prioritization: the Case of Chile.” Health Affairs 27(3): 782–92.
Vásquez, Felipe, Guillermo Paraje, and Manuel Estay. 2013. “Income-Related Inequality in Health and Health Care Utilization in Chile, 2000-2009.” Rev Panam Salud Publica 33(2): 98–106.

100
Vega M, Jeanette, Paula Bedregal G, Liliana Jadue H, and Iris Delgado B. 2003. “Equidad De Género en El Acceso a La Atención De Salud en Chile.” Revista médica de Chile 131(6): 669–78.
Vega, J, P Bedregal, L Jadue, and I Delgado. 2001. Santiago de Chile. Disponible en: http://www. puc. cl/equidadechile/genero. pdf (Consultado el 21/09/2003) Equidad De Género en El Acceso Y Financiamiento De La Atención De Salud en Chile. Departamento de Salud Pública/Facultad de Medicina. Pontificia Universidad Católica de Chile. http://www. puc. cl/equidadechile/genero. pdf.
Vergara-Iturriaga, M, and M Martinez-Gutierrez. 2006. “Financiamiento Del Sistema De Salud Chileno.” Salud Publica Mex 48: 512–21.
Verónica Vargas, L. 2006. “Incrementar la'Equidad en Atención Primaria: Revisión De La Formula Per Capita.” Rev Chil Med Fam 7(2): 76–83.
Wallace, SP, and V Gutierrez. 2005. “Equity of Access to Health Care for Older Adults in Four Major Latin American Cities.” Revista Panamericana Salud Publica 17(5/6): 394–409.
Wilks, R, L A Sargeant, M Gulliford, M Reid, and T Forrester. 2000. “Quality of Care of Hypertension in Three Clinical Settings in Jamaica.” West Indian Medical Journal 49(3): 220–25.
World Health Organization. 2008. The World Health Report 2008 : Primary Health Care Now More Than Ever. Geneva: WHO.

101
Appendices
Appendix 1. Health Services provided by the Family healthcare plan in the public system
SALUD DE LA INFANCIA 1. Control de salud del nin ̃o sano 2. Evaluacio ́n del DSM 3. Control de malnutricio ́n 4. Control de lactancia materna 5. Educacio ́n a grupos de riesgo 6. Consulta nutricional 7. Consulta de morbilidad
8. Control de enfermedades cro ́nicas 9. Consulta por de ́ficit del DSM 10. Consulta Kine ́sica 11. Consulta de salud mental 12. Vacunacio ́n 13. PNAC 14. Atencio ́n a domicilio
SALUD DEL ADOLESCENTE
15. Control de salud 16. Consulta de morbilidad 17. Control de cro ́nico 18. Control prenatal 19. Control de puerperio 20. Control de regulacio ́n de fecundidad 21. Consejeri ́a en salud sexual y reproductiva
22. Control ginecolo ́gico preventivo 23. Educacio ́n grupal 24. Consulta morbilidad obste ́trica 25. Consulta morbilidad ginecolo ́gica 26. Intervencio ́n psicosocial 27. Consulta y/o consejeri ́a salud mental 28. PNAC 29. Atencio ́n en domicilio
SALUD DE LA MUJER
30. Control prenatal 31. Control de puerperio 32. Control de regulacio ́n de fecundidad 33. Consejeri ́a en salud sexual y reproductive 34. Control ginecolo ́gico preventivo
35. Educacio ́n grupal 36. Consulta morbilidad obste ́trica 37. Consulta Morbilidad ginecolo ́gica 38. Consulta nutricional 39. PNAC 40. Ecografi ́a obste ́trica del primer trimestre
SALUD DEL ADULTO 41. Consulta de morbilidad 42. Consulta control de enfermedades cro ́nicas 43. Consulta nutricional 44. Control de salud 45. Intervencio ́n psicosocial 46. Consulta y/o consejeri ́a de salud mental
47. Educacio ́n grupal 48. Atencio ́n a domicilio 49. Atencio ́n podologi ́a a pacientes con pie diabe ́tico 50. Curacio ́n de Pie diabe ́tico 51. Intervencio ́n Grupal de Actividad Fi ́sica

102
SALUD DEL ADULTO MAYOR
52. Consulta de morbilidad 53. Consulta y control de enfermedades cro ́nicas 54. Consulta nutricional 55. Control de salud 56. Intervencio ́n psicosocial 57. Consulta de salud mental 58. Educacio ́n grupal
59. Consulta kine ́sica 60. Vacunacio ́n antiinfluenza 61. Atencio ́n a domicilio 62. Programa de Alimentacio ́n Complementaria del Adulto Mayor 63. Atencio ́n podologi ́a a pacientes con pie diabe ́tico 64. Curacio ́n de Pie Diabe ́tico
ACTIVIDADES ASOCIADAS A TODO EL CICLO VITAL SALUD ORAL ACTIVIDADES GENERALES 65. Examen de salud 66. Educacio ́n grupal 67. Urgencias 68. Exodoncias 69. Destartraje y pulido coronario 70. Obturaciones temporales y definitivas 71. Aplicacio ́n sellantes 72. Pulpotomi ́as 73. Barniz de Fluor 74. Endodoncia 75. Rayos X dental
76. Educacio ́n grupal ambiental 77. Consejeri ́a familiar 78. Visita domiciliaria integral 79. Consulta social 80. Tratamiento y curaciones 81. Extensio ́n Horaria 82. Intervencio ́n Familiar Psicosocial 83. Diagno ́stico y control de la TBC 84. Exa ́menes de Laboratorio Ba ́sico
ACTIVIDADES CON GARANTIAS EXPLICITAS EN SALUD 85. Diagno ́stico y tratamiento de hipertensio ́n arterial primaria o esencial: consultas de
morbilidad y controles de cro ́nicos para personas de 15 an ̃os y ma ́s, en programas de adolescente, adulto y adulto mayor.
86. Diagno ́stico y tratamiento de Diabetes Mellitus tipo 2: Consultas de morbilidad y controles de cro ́nicos en programas del nin ̃o, adolescente, adulto y adulto mayor.
87. Acceso a evaluacio ́n y alta odontolo ́gica integral a nin ̃os y nin ̃as de 6 an ̃os: prestaciones del programa odontolo ́gico.
88. Acceso a tratamiento de epilepsia no refractaria para los beneficiarios desde un an ̃o a menores de 15 an ̃os: consultas de morbilidad y controles de cro ́nicos en programas del nin ̃o y adolescente.
89. Acceso a tratamiento de IRA baja de manejo ambulatorio en menores de 5 an ̃os: consultas de morbilidad y kine ́sica en programa del nin ̃o.
90. Acceso a diagno ́stico y tratamiento de Neumoni ́a adquirida en la comunidad de manejo ambulatorio en personas de 65 an ̃os y ma ́s: consultas de morbilidad y kine ́sica en programa del adulto mayor.
91. Acceso a diagno ́stico y tratamiento de la Depresio ́n de manejo ambulatorio en personas de 15 an ̃os y ma ́s: consulta de salud mental, consejeri ́a de salud mental, intervencio ́n psicosocial y tratamiento farmacolo ́gico
92. Acceso a diagno ́stico y tratamiento de la enfermedad pulmonar obstructiva cro ́nica: consultas de morbilidad y controles de cro ́nicos; atencio ́n kine ́sica en programa de adulto mayor.
93. Acceso a diagno ́stico y tratamiento del asma bronquial moderada en menores de 15 an ̃os: consultas de morbilidad y controles de cro ́nicos en programas del nin ̃o y del adolescente; atencio ́n kine ́sica en programa del nin ̃o.
94. Acceso a diagno ́stico y tratamiento de presbicia en personas de 65 y ma ́s an ̃os: consultas de morbilidad, controles de salud y control de cro ́nicos en programa del adulto mayor.
95. Acceso a tratamiento me ́dico en personas de 55 an ̃os y ma ́s, con artrosis de cadera y/o rodilla, leve o moderada
96. Acceso a Diagno ́stico y tratamiento de la Urgencia odontolo ́gica Ambulatoria DSM= Desarrollo psicomotor. PNAC= Programa Nacional de Alimentacio ́n Complementaria

103
Appendix 2. Recruitment letter Provider
UNIVERSITY OF CALIFORNIA, BERKELEY
BERKELEY � DAVIS � IRVINE � LOS ANGELES � MERCED � RIVERSIDE � SAN DIEGO SAN FRANCISCO � SANTA BARBARA � SANTA CRUZ
Dr. Juan Perez Estación Central, Santiago, Chile
Date: June 15, 2012 Re: Request for your participation in a research study (Public and private health provision in Chile) Dear Dr. Perez, As a doctoral student of the University of California, Berkeley, I am conducting a research study to explore the quality of primary care services provided to low and middle-income populations. In particular, I am interested in your opinions about the characteristics and features of the primary care system that you work for such as continuity of care, coordination with other levels of care and comprehensiveness of care. The study is being conducted by me (Dr. Maria Soledad Martinez Gutierrez) under the supervision of Professor William Dow, Henry J. Kaiser Professor of Health Economics, at the School of Public Health, University of California, Berkeley. We are writing to request an in-person meeting with you during the period of July 5th and August 4th at the offices of the School of Public Health, University of Chile or another private location at a time convenient to you. In this meeting, we would ask you to participate in an interview of approximately one hour in length, where we would ask you about the primary care system that you work for, in particular your opinions about primary care physicians availability, accessibility of services that you provide and the extent to which the system is designed to provide a regular source of care over time. We are also interested in the role that your organization plays in the context of the overall healthcare system, your ability to coordinate use of other levels of health care, the comprehensiveness of care you provide, and whether your organization’s is family and/or community oriented. Prior to our interview, we would offer you an informed consent form for your review and signature. If you are interested in participating, we would be appreciative if you would email us and let us know what dates might be convenient for you ([email protected]).
If you have any questions prior to the meeting, please feel free to contact us:
Maria Soledad Martinez Gutierrez, MD MPH School of Public Health University of California, Berkeley
William Dow, PhD Henry J. Kaiser Professor of Health Economics � Chair, Health Services and Policy

104
247 University Hall Berkeley, CA 94720-‐7360 USA Tel: +1 510 8372920 msmartin@berkeley edu, skype: agatamar1
Analysis Graduate Group � Associate Director, Berkeley Population Center � School of Public Health University of California, Berkeley Tel: +1 510 643-5439 � Fax: +1 510 666-3052 239 University Hall Berkeley, CA 94720-‐7360 USA
Sincerely, (Signature) Maria Soledad Martinez Gutierrez
(Signature) William Dow
105
Appendix 3. Informed Consent Providers and Patients
CONSENT TO PARTICIPATE IN RESEARCH Public and private health provision in Chile
(In-depth interview for Primary Care providers) Introduction My name is Dr. Maria Soledad Martinez-Gutierrez. I am a doctoral candidate
working with Professor William Dow in the School of Public Health/Department of Health Policy and Management at the University of California, Berkeley. We are planning to conduct a research study, which I invite you to take part in.
We are inviting you to participate in this study because you work in a primary healthcare facility and therefore have important information about how primary care services are provided in your organization.
Purpose The purpose of this research study is to explore how health providers and low
and middle-income patients rate the primary care services they receive in public and private settings. Furthermore, this study will identify what characteristics of primary care delivery systems are relevant in the Chilean context.
Procedures If you agree to be in this study, you will be asked to do the following: • I will conduct an interview that will involve questions about the characteristics
and features of the primary care system that you work for such as continuity of care, coordination with other levels of care and comprehensiveness of care. It should last about one hour and a half.
• With your permission, I will make an audio recording and take notes during the interview. This is to accurately record information you provide, and will be used for transcription purposes only. If you choose not to be recorded, I will take notes instead. If you agree to being recorded but feel uncomfortable at any time during the interview, I can turn off the recorder at your request. Or if you don't wish to continue, you can stop the interview at any time. I will not use any recordings of you in any future presentation.
Study time Participation in this study will involve a total of 1.5 hours of your time. Study location All study procedures will take place in an office in the University of Chile, School
of Public Health or your own private office, whatever is more convenient for you. Benefits There is no anticipated benefit to subjects by participating. We hope that the
information gained from the study will help to support regulation of providers that

106
serve low and middle-income population in Chile in order to improve the quality of primary care services. In particular, this research is intended to increase understanding of provider and patients opinions about primary care for low and middle-income populations in Santiago de Chile and how the criteria for assessing quality in primary care systems, developed at the international level, translates to a local setting in Latin America.
Risks/Discomforts • Some of the research questions may make you uncomfortable or upset. You
are free to decline to answer any questions you don't wish to, or to stop the interview at any time.
• Breach of confidentiality: As with all research, there is a chance that confidentiality could be compromised; however, we are taking precautions to minimize this risk.
Confidentiality Your study data will be handled as confidentially as possible. If results of this
study are published or presented, individual names and other personally identifiable information will not be used unless you give explicit permission for this below.
To minimize the risks to confidentiality, we will do the following: • We will not maintain a link between your identity and the research data. • Personal identifiers will be removed as soon as possible after collection: we will
create an identity key of providers and store it in an encrypted file and will destroy the raw data (audio recordings) as soon as transcripts are produced. We aim to transcribe each interview and focus group session within two months of when it took place.
• Since the position you hold and the type of facility you work in is important for the interpretation of the data you are providing, we are requesting to use this information in reports and publications. While it is unlikely to occur, given the limited number of primary care facilities in Estación Central, it is possible that your identity might be guessed by someone other than the researchers of this study.
My position and the type of facility I work for can be used
in scientific publications and reports along with quotes of the information I am providing.
I do not agree with the above stipulation, but will still participate in this study. Information about my position and the type of facility I work in will not be included in reports and publications.
• Your research records, including audio recordings, will be stored in a locked cabinet, in a secured building, in an encrypted format, on a password-protected computer.
• Only my faculty advisor and I will have access to your study records. The transcriber will have access to your records only briefly.
Your personal information may be given out if required by law. Future use of study data

107
The audio recordings will be transcribed and the tapes will be erased at the end of the study.
Others or myself will maintain the transcripts for possible use in future research. I will retain this data for up to 2 years after the study is over. The same measures described above will be taken to protect confidentiality of this study data.
Costs You will not be charged for any of the study activities. Rights Participation in research is completely voluntary. You have the right to decline to participate or to withdraw at any point in this
study without penalty or loss of benefits to which you are otherwise entitled. Questions If you have any questions or concerns about this study, you may contact Soledad
Martinez at 2200479 or [email protected]. If you have any questions or concerns about your rights and treatment as a
research subject, you may contact the office of UC Berkeley's Committee for the Protection of Human Subjects, at 510-642-7461 or [email protected].
Consent When signing this form I am agreeing to voluntarily enter this study. I have had
a chance to read this consent form, and it was explained to me in a language that I use and understand. I have had the opportunity to ask questions and have received satisfactory answers. I understand that I can withdraw at any time. A copy of this signed Informed Consent Form has been given to me.
_______________ Participant's Name (please print) Date _______________ Participant's Signature Date _______________ Person Obtaining Consent Date

108
CONSENT TO PARTICIPATE IN RESEARCH
Public and private health provision in Chile (Focus groups for patients)
Introduction My name is Dr. Maria Soledad Martinez-Gutierrez. I am a doctoral candidate
working with Professor William Dow in the School of Public Health/Department of Health Policy and Management at the University of California, Berkeley. We are planning to conduct a research study, which I invite you to take part in.
We are inviting you to participate in this study because you are a patient at primary healthcare facility and therefore have important information about how primary care services are provided in your organization.
Purpose The purpose of this research study is to explore how health providers and low
and middle-income patients rate the primary care services they receive in public and private settings. Furthermore, this study will identify what characteristics of primary care delivery systems are relevant in the Chilean context.
Procedures If you agree to be in this study, you will be asked to do the following: • I will conduct an interview that will involve questions about the characteristics
and features of the primary care system you are a patient of such as continuity of care, coordination with other levels of care and comprehensiveness of care. It should last about 20-30 min.
• With your permission, I will make an audio recording and take notes during the interview. This is to accurately record information you provide, and will be used for transcription purposes only. If you choose not to be recorded, I will take notes instead. If you agree to being recorded but feel uncomfortable at any time during the focus group session, I can turn off the recorder at your request. Or if you don't wish to continue, you may leave the session at any time.
I will not use any recordings of you in any future presentation. Study time Participation in this study will involve a total of 30 hours of your time. Study location All study procedures will take place in your primary care center or at the
University of Chile, School of Medicine. Benefits There is no anticipated benefit to subjects by participating. We hope that the
information gained from the study will help to support the regulation of providers that serve low and middle-income population in Chile in order to improve the quality of primary care services. In particular, this research is intended to increase understanding of provider and patients opinions about primary care for low and

109
middle-income populations in Santiago de Chile and how the criteria for assessing quality in primary care systems, developed at the international level, translates to a local setting in Latin America.
Risks/Discomforts • Some of the research questions may make you uncomfortable or upset. You
are free to decline to answer any questions you don't wish to, or to leave the focus group session at any time.
• Breach of confidentiality: As with all research, there is a chance that confidentiality could be compromised; however, we are taking precautions to minimize this risk.
Confidentiality Your study data will be handled as confidentially as possible. If results of this
study are published or presented, individual names and other personally identifiable information will not be used.
To minimize the risks to confidentiality, we will do the following: • We will not maintain a link between your identity and the research data. Personal identifiers will be removed as soon as possible after collection: we will
create an identity key of patients and store it in an encrypted file and will destroy the raw data (audio recordings) as soon as transcripts are produced. We aim to transcribe each interview and focus group session within two months of when it took place.
• Your research records, including audio recordings, will be stored in a locked cabinet, in a secured building; in an encrypted format, on a password-protected computer.
• Only my faculty advisor and I will have access to your study records. The transcriber will have access to your records only briefly.
Your personal information may be given out if required by law. Future use of study data The audio recordings will be transcribed and the tapes will be erased at the end
of the study. Others or myself will maintain the transcripts for possible use in future research. I
will retain this data for up to 2 years after the study is over. The same measures described above will be taken to protect confidentiality of this study data.
Compensation/Payment In return for your travel expenses, you will be paid 2500 pesos for taking part in
this study at the end of the interview. Costs You will not be charged for any of the study activities. Rights

110
Participation in research is completely voluntary. You have the right to decline to participate or to withdraw at any point in this
study without penalty or loss of benefits to which you are otherwise entitled. Questions If you have any questions or concerns about this study, you may contact Soledad
Martinez at 2200479 or [email protected]. If you have any questions or concerns about your rights and treatment as a
research subject, you may contact the office of UC Berkeley's Committee for the Protection of Human Subjects, at 510-642-7461 or [email protected].
Consent When signing this form I am agreeing to voluntarily enter this study. I have had
a chance to read this consent form, and it was explained to me in a language that I use and understand. I have had the opportunity to ask questions and have received satisfactory answers. I understand that I can withdraw at any time. A copy of this signed Informed Consent Form has been given to me.
If you wish to participate in this study, please sign and date below. _______________ Participant's Name (please print) Date _______________ Participant's Signature Date _______________ Person Obtaining Consent Date

111
Appendix 4. Interview guide providers and patients
Providers’ In-depth Interview Guide Interview Guide Questions Before we start, I want to emphasize that we will do everything in our power to keep your name
and the answers that you give during this interview confidential. As mentioned on the consent form, I will be recording the interview. If at any time you wish me to stop recording, I will do so. We will use a number instead of your name on your interview form and on the digital audio recording. Once we transcribe the digital recording, we will destroy all copies of the digital file.
I assume that your answers will be based on your experience in this primary care center -- but
please do feel free to give broader answers based on your knowledge of the health sector in Chile generally. There are, of course, no wrong answers to the questions I am about to ask you. I want most of all to learn about what you think about the questions, because you are the one with the knowledge and experience and relevant opinions.
Thank you for taking the time to participate in this interview and to share your knowledge,
opinions and ideas! Background 1. First I’m going to give you a short form for you to answer and then we will
start the interview. (Gives the form to the interviewee, Annex 1) 2. Could you start off by giving me a little background on yourself? What was
your path to the position you now have? Primary Care Center 1. Please describe to me in general terms the type of patients you serve in this
health center (socioeconomic status, type of health insurance, place of residence, etc). (FOR CLINIC MANAGERS ONLY) 2. Approximately how many general morbidity visits does the health center have
in a month? 3. Roughly, how many people work in this primary care center? Structural Characteristics

112
(FOR CLINIC MANAGERS ONLY) 1. What medical specialties do you have in this center? How many primary care
physicians? How many specialists? 2. How many doctors in this center were trained as family doctors? If you
employ some family doctors, do you think the service they provide is better than the one that general practitioners provide? In what ways? (Probe: Could you give me an example?)
3. Have you had any trouble recruiting primary care physicians to work in this
facility? 4. Accessibility of service a. In general, how well are patients of your primary care center able to access
primary care services when they need it (either at your center or in another center)? b. If patients have trouble accessing primary care services, what do you think are
the most important reasons? (Probes: Geographic? Financial? Open hours conflict with work schedule? Waiting list? Patients want immediate care once they feel the symptoms?)
5. What characteristic or characteristics of your primary care center or aspects of
the way you organize care do you think is the most important for facilitating healthcare services utilization?
6. What characteristic or characteristics of your primary care center or aspects of
the way you organize care do you think is the most important for achieving good health outcomes in the population you serve?
Practice features 1. First contact a. To what extent do you think your organization provides entry into the health
system? (Probe: In your experience, do a lot of people access the health system through the secondary (specialist, ambulatory) or tertiary (hospitals) level(s) of care?)
2. Coordination a. How would you rate your organization’s ability to coordinate with other levels
of health care? Why would you rate it this way? b. Are there mandatory procedures for transferring patient information between
your facility and other levels of the health care system? c. Are guidelines for transferring information available, even if they are not
required?

113
d. Do you have any other ways to coordinate with other levels of care? (Clinical
meetings, informal contact, etc) 3. Comprehensive care a. How comprehensive are the primary care services and procedures that this
center offers for all age groups? (Probes: do they offer a wide range of services? Do they offer curative, preventive, and rehabilitative services? Could you give me some examples?)
b. What about compared with other facilities in the area? 4. Longitudinality a. To what extent would you say that your primary care system is designed to
provide a regular source of care over time? (Probe: Do you use individual patient lists in this primary care center?)
b. Do you reach out to the patient to remind him/her about missed follow-up appointments, immunizations due, etc.? Do you go out in the community to offer services such as health education?
c. How do you carry out reminders and patient outreach? 5. Continuity of care a. Can you describe how does this Center provide continuity of care? b. Are patients assigned to a specific doctor or health team? How? Do they
generally get their care with the same provider at each visit? 6. Family centeredness a. How do you organize patient records? (By individual, by family, some other
way?) 7. Community orientation a. Do you make efforts to:
i. Define and characterize the community you serve? How? ii. Identify community health problems? How? iii. Modify programs to address these problems? How? (Probe: Could you give
me an example?) iv. Monitor the efficacy of the program modifications? How? (Probe: Could you
give me an example?) b. Do you allow any community members to participate in primary care
management or in health priority-setting processes? In what ways? Healthcare access and health outcomes

114
Now, I will give you a list of characteristics and features of primary care systems (the ones we have been talking about) (Annex 2). I want you to keep this list in mind as you answer the following questions (Gives the list to the interviewee):
1. Thinking of the features listed here, where do you think that your facility has
most problems? What is it good at? 2. What do you see as the most important obstacles to patient utilization of
services at your facility? And to getting good health outcomes? 3. What do you see as the most important strengths of this facility to get patients
to utilize services? And to getting good health outcomes? 4. In your experience, which of these characteristics are most strongly associated
with better healthcare access (utilization of services)? (Probe: Could you give me an example how that characteristic is associated with better healthcare access?)
5. Why do you think this characteristic or feature of a primary care system is
associated with better healthcare access (Probe: what are the pathways through which this characteristic or feature can have an impact on healthcare access?)
(NOTE: “pathways” meaning the chain of events or effects that would connect
the characteristic mentioned with healthcare access) 6. In your experience, which of these characteristics are most strongly associated
with better health outcomes (for example mortality for specific health conditions or being able to quit smoking)? (Probe: Could you give me an example how that characteristic is associated with better health outcomes?)
7. Why do you think this characteristic or feature of a primary care system is
associated with better health outcomes? (Probe: what are the pathways through which this characteristic or feature can have an impact on health outcomes)
(NOTE: “pathways” meaning the chain of events or effects that would connect
the characteristic mentioned with health outcomes) Wrap-up Questions 1. Which of these features are the most significant for your facility? And for the
primary care system in Chile? 2. Which ones of these characteristics and features do you think are better
realized in a public primary care center in this Municipality? And in a private primary care center in this Municipality?
3. Are there any other points related to the topics that we have been talking about that you think I should hear?

115
Annex 1
General Information
Providers’ In-depth Interview Guide Please provide the following information about yourself by circling one
response for each question. 1. What is your gender? a. Male b. Female 2. What is your age? a. 18-30 b. 31 – 50 c. 51 or older 3. Are you a physician? a. Yes b. No 4. How long have you worked in your profession? (years ) _________ 5. How long have you worked for or been associated with this Center?
a. Less than one year b. One to two years c. Two to five years
d. Five to ten years e. Ten or more years
6. What is your position at this Center? ___________________________________________________________________________________
_
For internal use only ID Code ________________________
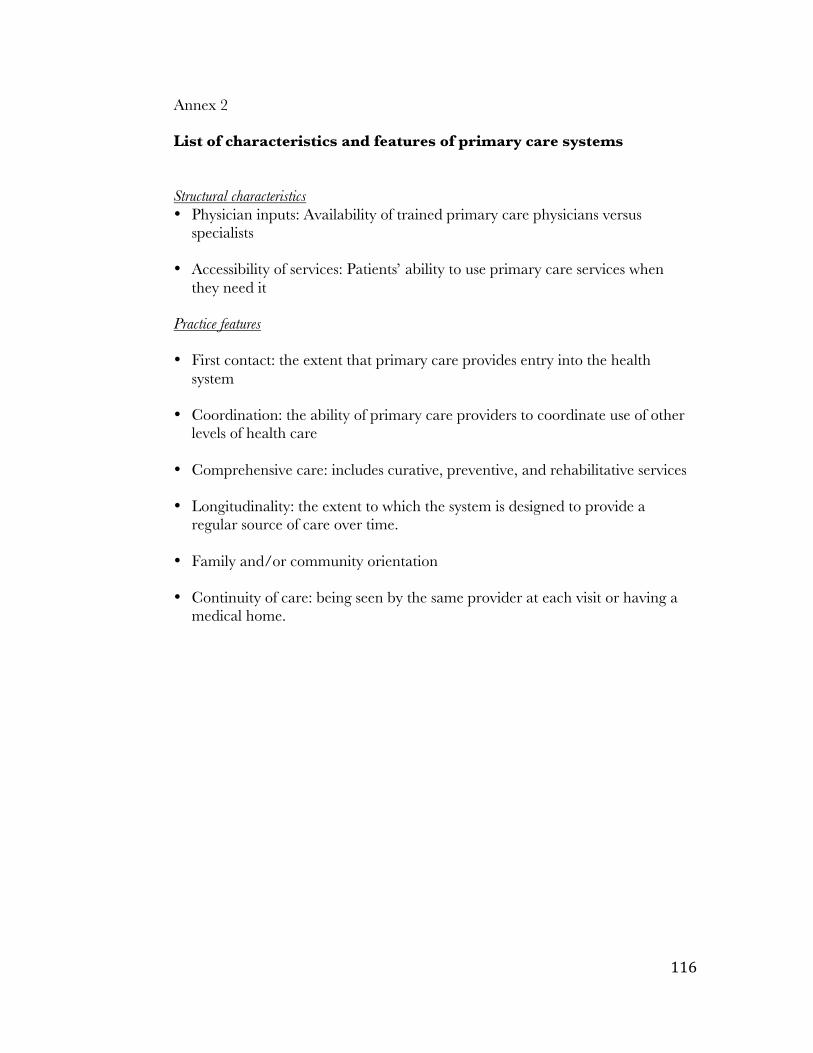
116
Annex 2 List of characteristics and features of primary care systems Structural characteristics • Physician inputs: Availability of trained primary care physicians versus
specialists • Accessibility of services: Patients’ ability to use primary care services when
they need it Practice features • First contact: the extent that primary care provides entry into the health
system • Coordination: the ability of primary care providers to coordinate use of other
levels of health care • Comprehensive care: includes curative, preventive, and rehabilitative services • Longitudinality: the extent to which the system is designed to provide a
regular source of care over time. • Family and/or community orientation • Continuity of care: being seen by the same provider at each visit or having a
medical home.

117
Patients’ Focus Group Interview Guide
Interview Guide Questions Before we start, I want to emphasize that we will do everything in our power to keep your names and the answers that you give during this session confidential. As mentioned on the consent form, I will be recording the session. If at any time any of you wish me to stop recording, I will do so. Once we transcribe the digital recording, we will destroy all copies of the digital file. I assume that your answers will be based on your experience as a patient. There are, of course, no wrong answers to the questions I am about to ask you. I want most of all to learn about what you all think about the questions, because you are the one with the knowledge and experience and relevant opinions. Thank you for taking the time to participate in this session and to share your knowledge, opinions and ideas! Background
3. First I’m going to give you a short form for you to answer and then we will start the session. (Gives the form to the participants, Annex 1)
Primary Care Center
4. Please describe what do you like about this primary care center. (Probe: do you like the way the staff treats you? Is it close to your home? Do you like the facility?)
5. Please describe what do you don’t like about this primary care center. (Probe: do you have trouble getting an appointment? Have you had problems with the staff?)
6. What characteristic or characteristics of the primary care center you are a
patient of or aspects of the way they organize care do you think is the most important for facilitating healthcare services utilization?
7. What characteristic or characteristics of the primary care center you are a
patient of or aspects of the way they organize care do you think is the most important for achieving good health outcomes in the population you serve?
Structural Characteristics
7. Accessibility of service a. In general, how well are you able to access primary care services (not
specialty care) when you need it (either at this center or in another center)? (Probe: Primary care services can be appointments with your doctor, a nurse or other health provider at your health care center.

118
They can be for check-ups, immunizations or when you are feeling sick)
b. If you have trouble accessing primary care services, what are the most important reasons? (Probes: Geographic? Financial? Open hours conflict with work schedule? Waiting list?)
Practice features
8. First contact a. Is this center or any other primary care center your first point of
contact with the healthcare system? (Probe: Or do you access the health system through the secondary (specialist, ambulatory) or tertiary (hospitals, emergency room) level(s) of care?)
9. Coordination a. How would you rate this center’s ability to coordinate with other levels
of health care? Why would you rate it this way? b. Have you had any problems to get referred to specialty care or to the
hospital? What problems?
10. Comprehensive care a. How comprehensive are the primary care services and procedures that
this center offers for all age groups? (Probes: do they offer a wide range of services? Do they offer curative, preventive, and rehabilitative services? Could you give me some examples?)
b. What about compared with other facilities in the area?
11. Longitudinality a. To what extent would you say that this primary care system is designed
to provide a regular source of care over time? (Probe: Do you think this center is designed so you would come here again if you had another health problem?)
b. Does the center reach out to you to remind you about missed follow-up appointments, immunizations due, etc.? Do they go out in the community to offer services such as health education?
c. If so, how do they carry out reminders and patient outreach?
12. Continuity of care a. Have you been assigned to a specific doctor or health team? How? Do
you generally get care with the same provider at each visit? b. How important is being assigned to a specific doctor for you? Why?
13. Family centeredness
a. Is each of your family members patients of this center? Do doctors or nurses know your family or have their clinical information available to them if they need it?

119
14. Community orientation a. Does this center make efforts to:
i. Define and characterize the community you serve? How? ii. Identify community health problems? How? iii. Modify programs to address these problems? How? (Probe:
Could you give me an example?)
b. Does this center allow any community members to participate in primary care management or in health priority-setting processes? In what ways?
Healthcare access and health outcomes Now, I will give you a list of characteristics and features of primary care systems (the ones we have been talking about) (Annex 2). I want you to keep this list in mind as you answer the following questions (Gives the list to the interviewee):
8. Thinking of the features listed here, where do you think this facility has most problems? What is it good at?
9. What do you see as the most important obstacles for you to use services to patient utilization of services at this facility? And to get good health outcomes?
10. What do you see as the most important strengths of this facility to get patients
to utilize services? And to getting good health outcomes?
11. In your experience, which of these characteristics are most strongly associated with better healthcare access (utilization of services)? (Probe: Could you give me an example how that characteristic is associated with better healthcare access?)
12. Why do you think this characteristic or feature of a primary care system is associated with better healthcare access (Probe: what are the pathways through which this characteristic or feature can have an impact on healthcare access?) (NOTE: “pathways” meaning the chain of events or effects that would connect the characteristic mentioned with healthcare access)
13. In your experience, which of these characteristics are most strongly associated
with better health outcomes (for example mortality for specific health conditions or being able to quit smoking?) (Probe: Could you give me an example how that characteristic is associated with better health outcomes?)
14. Why do you think this characteristic or feature of a primary care system is
associated with better health outcomes? (Probe: what are the pathways
120
through which this characteristic or feature can have an impact on health outcomes) (NOTE: “pathways” meaning the chain of events or effects that would connect the characteristic mentioned with health outcomes)
Wrap-up Questions
4. Which of these features are the most significant for you as a patient? 5. Which ones of these characteristics and features do you think are better
realized in a public primary care center in this Municipality? And in a private primary care center in this Municipality?
6. Are there any other points related to the topics that we have been talking about that you think I should hear?

121
Annex 1 General Information
Patients’ Focus Group Interview Guide
Please provide the following information about yourself by circling one response for each question.
7. What is your gender? a. Male b. Female
8. What is your age? b. 18-30 b. 31 – 50 c. 51 or older
9. What kind of health insurance do you have?
a. Public System Group A (Indigent)
c. Public System Group B d. Public System Group C e. Public System Group D f. Public System. Don’t
know which group
g. Armed Forces health insurance
h. Isapre i. None j. Another type k. Don’t know
10. Are you enrolled in a public primary care center?
a. Yes b. No c. Don’t know
11. How much is your family’s monthly income (add up all income sources for all family members) __________________________________ pesos
12. How many people are there in your family (including children)?
___________________________
13. How long have you been a patient of this center? f. Less than one year g. One to two years h. Two to five years i. Five to ten years j. Ten or more years
For internal use only ID Code ________________________

122
Annex 2 List of characteristics and features of primary care systems Structural characteristics
• Physician inputs: Availability of trained primary care physicians versus specialists
• Accessibility of services: Patients’ ability to use primary care services when they need it
Practice features
• First contact: the extent that primary care provides entry into the health system
• Coordination: the ability of primary care providers to coordinate use of other levels of health care
• Comprehensive care: includes curative, preventive, and rehabilitative services
• Longitudinality: the extent to which the system is designed to provide a regular
source of care over time.
• Family and/or community orientation
• Continuity of care: being seen by the same provider at each visit or having a medical home.

123
Appendix 5. Summary of regression results for preventive, acute care, specialty and emergency care visits.
Key 0 = no significant association - = Statistically significant/negative relationship (p<0.05) + = Statistically significant/positive relationship (p<0.05) Women
Preventive Acute care Specialty Emergency Combined Fonasa B 0 0 + 0 0 Fonasa C 0 0 + 0 0 Fonasa D 0 0 + 0 0
Children 0-5 years old
Isapre 0 0 + 0 0 Fonasa B 0 0 0 0 - Fonasa C 0 0 0 0 0 Fonasa D 0 + + 0 +
Children 6-11 years old
Isapre 0 0 0 0 0 Fonasa B - 0 0 0 0 Fonasa C 0 0 0 0 0 Fonasa D 0 0 0 0 +
Teenagers (12-18 years)
Isapre 0 0 0 0 + Fonasa B - 0 0 - 0 Fonasa C - 0 0 - 0 Fonasa D - + + - +
Adults (18-64 years old)
Isapre 0 0 + - + Fonasa B 0 + + 0 0 Fonasa C 0 0 + - 0 Fonasa D 0 0 0 0 0
Older adults (65 and older)
Isapre - - + - 0 Men
Preventive Acute care Specialty Emergency Combined Fonasa B 0 0 0 0 0 Fonasa C 0 + 0 0 0 Fonasa D 0 0 0 0 0
Children 0-5 years old
Isapre 0 0 0 0 0 Fonasa B 0 0 0 0 - Fonasa C 0 0 0 0 0 Fonasa D 0 0 0 0 +
Children 6-11 years old
Isapre 0 0 + 0 0 Fonasa B 0 0 0 0 0 Fonasa C + 0 0 0 0 Fonasa D 0 0 0 0 +
Teenagers (12-18 years)
Isapre 0 0 0 0 + Fonasa B 0 0 + 0 + Fonasa C 0 0 + 0 + Fonasa D 0 + + 0 +
Adults (18-64 years old)
Isapre 0 + + 0 + Fonasa B + 0 + 0 + Fonasa C 0 0 + 0 0 Fonasa D 0 0 0 0 0
Older adults (65 and older)
Isapre 0 0 + 0 0