Embed Size (px)
Citation preview
1
THE ROLE OF VISUAL LITERACY
ON GRADE 11 LEARNERS’
CONCEPTUAL UNDERSTANDING OF
GRAPHICAL FUNCTIONAL
RELATIONSHIPS
RAJESH RAMPERSAD
January 2009
2
The Role of Visual Literacy on Grade 11
Learners’ Conceptual Understanding of
Graphical Functional Relationships
BY
RAJESH RAMPERSAD
(207525538)
Thesis
Submitted to the Department of Science, Mathematics and
Technology Education at the University of KwaZulu-Natal
(Edgewood Campus) in partial fulfilment of the requirements for the
Degree of Master of Education with specialisation in Mathematics
Education.
Supervisor: Dr.V.Mudaly
January 2009
3
DEDICATION
To
The glory of God and Our Divine Master His Holiness Sri Swami
Sivananda and His Holiness Sri Swami Sahajananda.
4
DECLARATION
I, Rajesh Rampersad, declare that the research involved in my
dissertation submitted in partial fulfilment for the M.Ed Degree in
Mathematics Education, entitled The Role of Visual Literacy on
Grade 11 Learners’ Conceptual Understanding of Graphical
Functional Relationships, represents my own and original work.
_______________________
RAJESH RAMPERSAD
_____________
DATE
_______________________
DR. V. MUDALY
5
ACKNOWLEDGEMENTS
I offer my deepest gratitude to:
1. My supervisor Dr. Vimolan Mudaly for his constant guidance,
encouragement, comments and critical ideas. His passion for visual
literacy and visualisation in mathematics initiated this research study and
was a motivation to me.
2. My precious family for their understanding, patience and perseverance
during the study. To my loving wife Mala Rampersad and my dear
children Ashmika, Yuvti and Keshava for being my watchful and
comforting angels at all times.
3. The ten Grade 11 learners and the two educators who consented to being
part of the study.
4. Dr. Sarah Bansilal for arranging partial funding.
5. Rakesh Singh and Anand Sookraj for assisting in editing parts of the
study.
6
TABLE OF CONTENTS
Page
Acknowledgements i
Table of contents ii
List of figures and tables v
Abstract vi
CHAPTER ONE: INTRODUCTION AND OVERVIEW 1
1.1 Preamble to the study 1
1.2 Background of the study 2
1.3 Aim and objectives of the study 5
1.4 Chapter outline 6
CHAPTER TWO: LITERATURE REVIEW 8
2.1 Introduction 8
2.2 A critique of visual literacy 8
2.3 The role of visual literacy in teaching and learning 11
2.4 Graphical visual representations 16
2.4.1 Related mathematical research 16
2.4.2 Graphs and computer technology 20
2.4.3 The National Curriculum Statement 22
2.5 Graphical actions and visualisation skills 24
2.6 Developing a conceptual understanding of graphical 29
representations
2.6.1 Introduction 29
7
2.6.2 Conceptual versus procedural understanding 31
2.7 The role of imagery, analogies, metaphors and diagrams 33
2.8 Educators‟ mathematical knowledge of graphical functional 37
relationships
2.9 Conclusion 38
CHAPTER THREE: THEORETICAL FRAMEWORK 39
3.1 Introduction 39
3.2 The process-object perspective 40
3.3 The Visualizer/Analyzer model 43
3.4 Semiotics 44
3.4.1 The inter-relationship between Peircean semiotics and 44
vehicles of reasoning
3.4.2 Vygotsky‟s semiotic mediation 48
3.5 Conclusion 51
CHAPTER FOUR: RESEARCH DESIGN AND METHODOLOGY 52
4.1 The research design 52
4.2 Population and sample 53
4.3 Data collection methods 54
4.4 Triangulation 55
4.5 Data analysis methods 56
CHAPTER FIVE: DATA ANALYSIS 58
5.1 Introduction 58
5.2 A statistical presentation 58
5.3 Learners‟ understanding of graphical representation of functions 61
5.3.1 The understanding of the Cartesian plane, notation and symbols 61
8
5.3.2 Learners‟ interpretation of graphical terminology 71
5.3.3 The effect of graphical representations on learners‟ visual 83
literacy skills
5.3.4 A semiotic analysis 90
5.3.5 Semiotic mediation 94
5.4 Educators‟ understanding of graphical representation of functions 96
5.4.1 The understanding of the Cartesian plane, notation and symbols 96
5.4.2 The educators‟ interpretation of graphical terminology 100
5.4.3 The effect of graphical representations on educators‟ visual 102
literacy skills
5.5 Conclusion 104
CHAPTER SIX: CONCLUSION 105
6.1 Introduction 105
6.2 Main arguments 106
6.3 Limitations 108
6.4 Recommendations 109
BIBLIOGRAPHY 111
APPENDIX
Appendix A: Letter of consent 119
Appendix B: Worksheets One, Two and Three 123
Appendix C: Interview Schedule 126
9
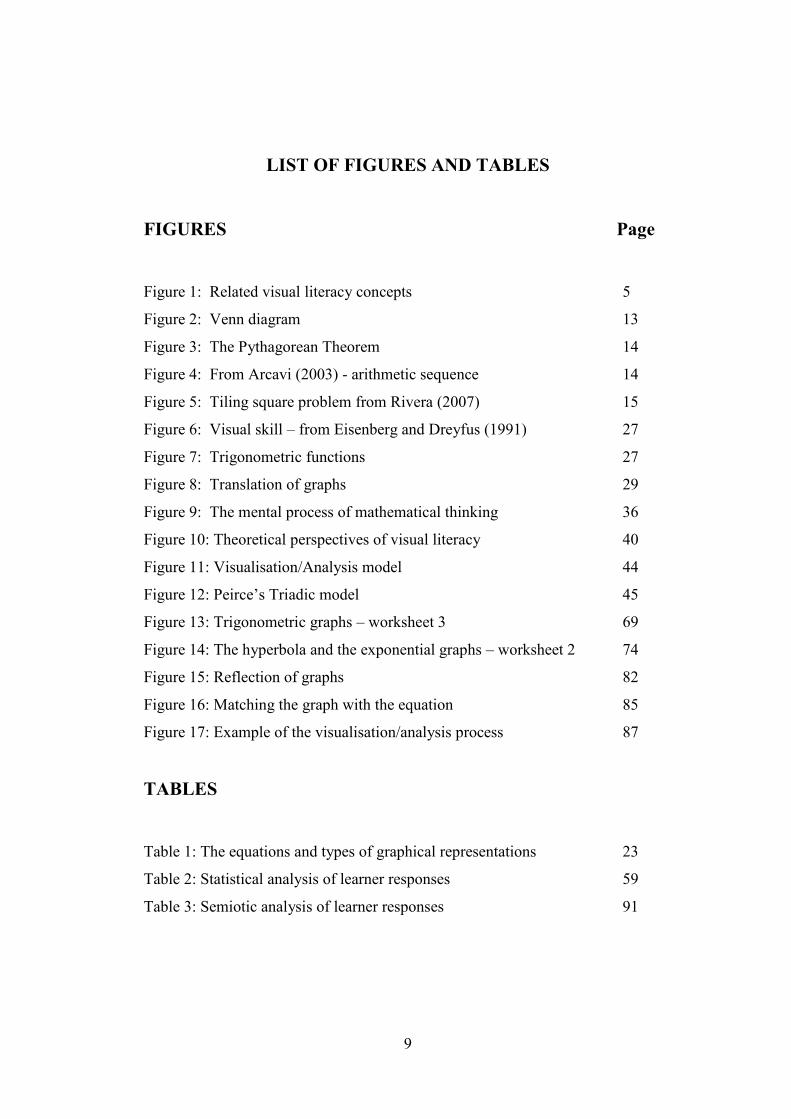
LIST OF FIGURES AND TABLES
FIGURES Page
Figure 1: Related visual literacy concepts 5
Figure 2: Venn diagram 13
Figure 3: The Pythagorean Theorem 14
Figure 4: From Arcavi (2003) - arithmetic sequence 14
Figure 5: Tiling square problem from Rivera (2007) 15
Figure 6: Visual skill – from Eisenberg and Dreyfus (1991) 27
Figure 7: Trigonometric functions 27
Figure 8: Translation of graphs 29
Figure 9: The mental process of mathematical thinking 36
Figure 10: Theoretical perspectives of visual literacy 40
Figure 11: Visualisation/Analysis model 44
Figure 12: Peirce‟s Triadic model 45
Figure 13: Trigonometric graphs – worksheet 3 69
Figure 14: The hyperbola and the exponential graphs – worksheet 2 74
Figure 15: Reflection of graphs 82
Figure 16: Matching the graph with the equation 85
Figure 17: Example of the visualisation/analysis process 87
TABLES
Table 1: The equations and types of graphical representations 23
Table 2: Statistical analysis of learner responses 59
Table 3: Semiotic analysis of learner responses 91
10
ABSTRACT
This study intends to foreground visual literacy within the wider context of
visualisation and visual thinking in mathematics teaching and learning.
Visualisation in general has been receiving attention in mathematics education
research. I distinguish visual literacy from visualisation by referring to visual
literacy as the combination of visualisation and logical thought. Visual literacy
emphasises construction of meaning through the process of decomposition,
comprehension and analysis of visual representations. The section on functional
relationships is located in the National Curriculum Statement (NCS) for
mathematics in the Further Education and Training (FET) phase for Grades 10-12
(Department of Education, 2003). Graphical functional relationships, which form
an integral part of functions and algebra in the FET phase for Grades 10-12,
demand visual literacy, which includes graphical interpretation and
comprehension skills. Therefore, the conceptual understanding associated with
graphs is dependent on the way graphs are presented.
This study examines learners‟ and educators‟ procedural and conceptual
understanding of the graphs they sketch and interpret in the FET curriculum. The
data analysis contributes towards the fast growing body of knowledge on
visualisation in mathematics with the significant impact visual literacy has on the
conceptual understanding of mathematical graphs. The analysis reveals that the
overarching theoretical framework of constructivism embracing the Process-
Object, Visualizer-Analyzer and Semiotic models are useful in illustrating and
justifying the link between visual literacy and the conceptual understanding of
learners.
In examining the visual understanding of graphical representations of ten Grade
11 learners and the two mathematics educators that teach them, the data reveals
that learners display a somewhat skewed understanding of the nature of the
Cartesian plane, the characteristics of graphs, functional notation and graphical
11
terminology. In fact their educators, in some instances, displayed similar
understandings. Learners display procedural understanding of graphical
representations to a large extent. The educators‟ visual understanding does suggest
that learners‟ interpretation of graphs is in some way influenced by the way they
teach. The overriding contribution of the research study is that visual literacy
plays a significant role in the conceptual understanding of functional graphical
relationships. The relationship between graphical representations and logical
thought is central to visual literacy.
Key concepts: visual literacy, conceptual understanding, graphical representations,
visualisation, analytical thinking, constructivism, process-object, Visualizer /
Analyzer, semiotics and vehicles of reasoning.
12
CHAPTER ONE
INTRODUCTION AND OVERVIEW
1.1 Preamble to the study
This study serves to locate visual literacy as a learning strategy for mathematics
teaching and learning. Visual literacy is an emerging heuristic discipline that
establishes itself within the context of visualisation, visual thinking and analytical
thinking. The emphasis is on the demand for higher order skills in thinking.
Therefore, the focus of the study is on the exploration of the role of visual literacy
on the conceptual understanding of Grade 11 mathematics learners and their
mathematics educators of graphical functional relationships. The National
Curriculum Statement for Grades 10-12 (NCS) in mathematics stipulates
functional relationships as a key learning outcome. Learners are expected to apply
higher order investigative, analytical and descriptive skills in the section on
graphical representations (Department of Education, 2003).
As a mathematics educator, the researcher has found that learners in Grades 10-12
encounter difficulties with graphical skills and graphical interpretation.
Frequently, learners engage in graphical tasks without much understanding of
what they are doing and why they do such tasks. As a result of this, the limited
understanding they acquire in Grade 10 affects them in the future grades.
Consequently, the emphasis in this research study is on the learners‟ interpretation
of graphs. The researcher claims that graphs through their visual structure of
patterns, symbols, lines and geometric curves influences learners‟ conceptual
understanding of graphical functional relationships. Therefore the main purpose is
to explore the relationship between visual literacy, graphs and learners‟
conceptual understanding of graphical concepts. In doing so, the researcher probes
the meaning Grade 11 learners have of the characteristics of graphs (major study)
13
and examines the impact of the educator‟s knowledge of graphs (minor study) on
learners‟ construction of meaning.
1.2 Background of the study
The thrust of the study originates with the significance accorded to visual literacy
and visualisation as essential proponents of teaching and learning in mathematics
classrooms. The current trend in mathematical inquiry is the predominant theme
of the role of visual representations depicted through data representations,
pictures, diagrams, graphs, symbols, words and patterns in the development of
mathematical thought. Visual – spatial learning has been a major component of
the mathematical discourse. The role of visual literacy in mathematics is
emphasised through the following quotations:
“No soul thinks without a mental image”, by Aristotle cited in Zazkis,
Dubinsky and Dautermann (1996).
“The element of thought is visual”, by Einstein cited in Thornton (2002).
“A picture is worth a thousand words” by Thornton (2002).
“Seeing the unseen” by Arcavi (2003).
“Seeing the big picture” by Silverman (2002).
Presmeg (1997) notes that visualisation has been “devalued” in mathematics,
while Arcavi (2003) reports that visual representations have been considered as
“second-class citizens”. This might be due to the prominence of traditional
teaching methodologies intended for the „auditory-sequential learner‟ stressing
logical, sequential steps in problem solving and computations which are enforced
by the educator‟s „verbal-logic‟ approach to teaching (Thornton, 2002). A
paradigm shift from this traditional view entails a transformation to visualisation
skills such as multiple perceptions, pattern finding, graphical and creative thinking
(Silverman, 2002). Since visual literacy has been neglected, the need to integrate
the visual approach into the traditional curriculum and teaching and learning
14
methods is essential. The prevalence of the proliferation of visual presentations in
various media and resource materials is certain to influence mathematics
education in the 21st century. We are faced with a visual culture that demands our
attention to consider, generate, communicate, and understand images. However
Arcavi (2003) affirms that from a socio-cultural perspective, we are faced with
obstacles to visualisation. Some views tend to portray visualisation as an easier
method in contrast to the view that visualisation requires high cognitive demands.
The other difficulty is the dilemma of cultures that are more visually exposed to
resources as opposed to disadvantaged visual cultures, with inadequate visual
resources.
The paradigm shift in the way we respond to visual representations and in
particular to graphical representations is highlighted by van Dyke (2002) whereby
the emphasis is on adopting a “visual approach to the teaching of graphs”.
Romberg, Fennema and Carpenter (1993) maintain that research on graphical
representations of functions is insufficient. Williams (1993) on the other hand
insists that functions and graphs are distinct from number concepts and
computational skills and claims that research on graphs has not investigated the
content domain of graphs appropriately.
Graphs have the potential to provide deeper insight and revelation through its
symbolic nature and geometrical formation of points, lines, arrows, curves and
axes. Functional relationships are regarded as the most influential and valuable
notation in mathematics. While there are numerous studies in other countries on
improving graphical skills through the use of computers and graphic calculators,
this is not the case in the South African education system. Students rely on paper
and pencil images and graphical representations that appear in study material such
as in text books. The question that reflects this situation is as Williams (1993)
portrays: What kinds of expertise with graphical representations are really
needed?
15
The traditional curriculum on graphical representations included the use of tables,
formula and graphs. Kieran (1993) suggests that using algebraic and graphical
representations present a new psychological impression in approaching functions.
Therefore, the transformation from the traditional approach includes the
assimilation of the numerical, algebraic and graphical representations of functions
through the emphasis on global features of graphs, unscaled axes, exploration of
relationships within the fundamental families of graphs and the utilisation of
graphs in modelled contexts. It is within this framework and paradigm shift that
the researcher consigns the use of visual literacy in graphical interpretation as an
emerging discipline of cognitive development.
Arcavi (2003) enlists the various visualisation skills necessary for graphical
analysis. These include transcending beyond the procedural application of rules
and procedures to the conceptual application of visual, algebraic and analytical
reasoning which are supported by symbols and verbalization. Consequently, the
researcher employs Zimmermann and Cunningham‟s (1991) description of the
study of mathematics as “the visual metaphor of patterns” to identify visual
literacy as a heuristic instrument in studying graphical representations.
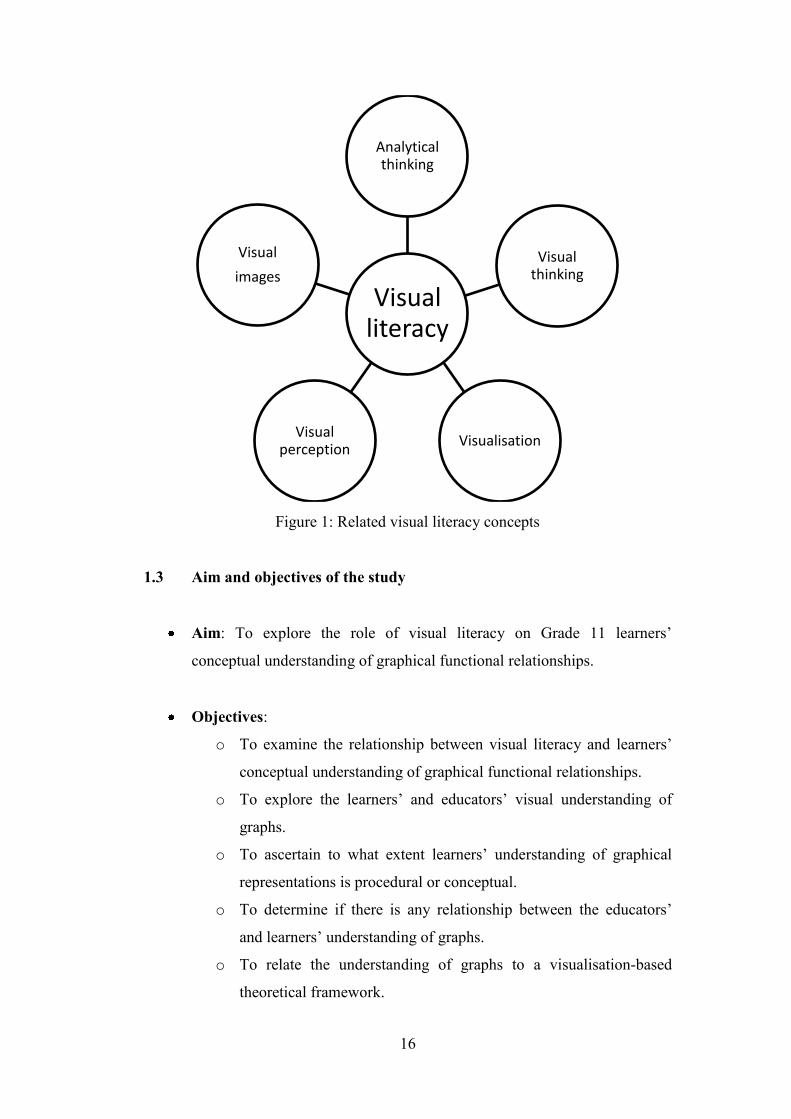
Therefore the visual literacy processes involving graphical interpretation may be
conceptualised in a progressive manner commencing with the formation of visual
images, both physical and mental images. Due to visual perception, objects are
perceived through the sense of sight. At this stage visualisation occurs, where the
nature of what is seen enters the process of meaning construction. Visualisation
associates the mental image with the physical image. Through visualisation, visual
thinking ensues with the formation of thought originating from visual images. The
eventual cognitive process of analytical thinking occurs. As a result visual literacy
may be located within the broad framework of associated visualisation disciplines
and represented as follows:
16
Figure 1: Related visual literacy concepts
1.3 Aim and objectives of the study
Aim: To explore the role of visual literacy on Grade 11 learners‟
conceptual understanding of graphical functional relationships.
Objectives:
o To examine the relationship between visual literacy and learners‟
conceptual understanding of graphical functional relationships.
o To explore the learners‟ and educators‟ visual understanding of
graphs.
o To ascertain to what extent learners‟ understanding of graphical
representations is procedural or conceptual.
o To determine if there is any relationship between the educators‟
and learners‟ understanding of graphs.
o To relate the understanding of graphs to a visualisation-based
theoretical framework.
Visual literacy
Analytical thinking
Visual thinking
VisualisationVisual
perception
Visual
images
17
o To highlight the importance of using visual literacy skills in the
teaching and learning of graphical representations in Grades 10-12.
1.4 Chapter outline
Chapter one presents the overview of the study. It provides a description of the
motivation for the research with the emphasis on visual literacy and graphical
functional relationships as it appears in the secondary school curriculum. The
background of the study traces the role of visual literacy in mathematics and the
impact of graphical representations in mathematical learning. It also sets out the
aims and objectives of the study.
Chapter two commences with a critique of visual literacy within the broad
conceptual framework of visualisation and visual thinking; and provides
definitions of the related visualisation concepts. It then proceeds to identify visual
literacy as it appears in the teaching and learning situation with special emphasis
on mathematics. The significance and development of graphical representations is
portrayed and evidence of related mathematical research is provided focussing on
learners‟ understanding of graphs. The effect of technology related activities is
examined in terms of the effect it has on graphical skills. Graphical
representations are then examined within the Grades 10-12 curriculum detailing
the various types and characteristics of graphs. However to engage in graphical
tasks, requires the implementation of graphical and visualisation skills, which are
discussed in this chapter. The understanding of graphs is discussed from the
procedural versus conceptual dichotomy, outlining the significance and use of
both methods of understanding graphs. The role of analogies, imagery and
metaphors in mathematics is detailed with reference to graphs. Lastly, the chapter
ends with a brief outline on the educators‟ mathematical knowledge of graphical
representations as they appeared in past research.
Chapter three focuses on related visualisation theoretical frameworks that the
researcher bases the study and findings on. Visual literacy is positioned within the
18
overarching theory of constructivism on the basis that knowledge is constructed
by learners and educators in relation to the social environment. An exposition of
the various visualisation theories follow thereafter. It commences with the
process-object perspective highlighting the APOS theory as a means of advanced
mathematical thinking. Then it demonstrates the applicability of the
Visualizer/Analyzer model which involves the cyclic process of using
visualisation and analysis. As graphical representations constitute signs, symbols
and tools, an examination of the role of semiotics as exemplified by Peirce is
conducted and illustrated through the inter-relationship between semiotics and
vehicles of reasoning. The chapter concludes with Vygotsky‟s semiotic mediation
as a means of constructing knowledge.
Chapter four discusses the research design and methodologies used in the study.
The study is located within the qualitative research paradigm. An explanation of
qualitative data collection methods and measures of validity and reliability are
provided. The chapter concludes with how the researcher intends analysing the
data and the key research questions are identified.
Chapter five focuses on the analysis of the data. Firstly, a statistical analysis of
learners‟ responses to the worksheets is conducted, which classifies learners
understanding as poor or good. Secondly, a qualitative analysis ensues, whereby a
detailed and in-depth analysis is presented on learners and educators responses to
the interview questions. Their responses are classified according to research sub
questions and are further critiqued from the theoretical perspectives. A semiotic
analysis is conducted as well as the role of semiotic mediation is considered. The
chapter concludes with the analysis of the educators‟ responses.
Chapter six reports on conclusions gathered from the research process and makes
recommendations for further research. The conclusions are based on the key
research questions and provide insight into the relationship between visual literacy
and conceptual understanding of graphical representations for Grades 10-12.
19
CHAPTER TWO
LITERATURE REVIEW
2.1 Introduction
The investigation of visual literacy and graphical functional relationships is
influenced by a plethora of factors. The study of graphical representations, visual
literacy and conceptual understanding indicate their inter-relationships and
importance to mathematical teaching and learning. It is therefore necessary to
explore the roles of visual literacy, visualisation, graphs, computer technology,
graphical skills, conceptual understanding and vehicles of reasoning. In this way,
an overall perspective of visual literacy and graphical representations would be
obtained.
2.2 A critique of Visual Literacy
Literacy has always been associated with language and linguistic forms, especially
with being able to read and write. The demand for literacy as a learning tool has
broadened due to acquisition of basic skills, knowledge and competencies in
various other fields. Stokes (2002) identified print literacy, aural literacy, media
literacy, computer literacy, social literacy and eco-literacy as other forms of
literacy. In recent developments, mathematical literacy has emerged as a basic
necessity in society and is therefore included in the school curriculum. Visual
literacy gained prominence with the advent of technological media, computers,
movies and television (Silverman, 2002). Burns (2006) refers to the world as
consisting of a variety of graphics or multimedia displayed by images on
billboards, television, films, computers and the internet. This paradigm shift can
be described as the change from typography to graphics (Burns, 2006), from the
Age of Literacy to the Age of Information (Silverman, 2002) , from the reign of
20
the left hemisphere of the brain to the right hemisphere (Williams, 1983) and from
print culture to visual culture (Arcavi, 2003).
Visual literacy is related to our sense of vision or seeing, with visualisation and
visual thinking being related constructs. On a very superficial or literal level,
seeing involves the use of vision which we engage in our daily experiences.
Seeing can be a physical or mental process, such as formation of a mental picture
of a parabola (Mudaly, 2008). However, seeing forms an aspect of our visual
perception. It is not uniquely related to the sense of sight and extends beyond the
concrete given information to include interpretation and analysis of visual images
(Arcavi, 2003; Elkins, 2003; Pylyshyn, 2003). Zimmerman and Cunningham
(1991) appropriately describe seeing as “to see is not necessarily to understand”.
Imagistic processes form a significant aspect of visual reasoning whereby
pictures, sketches and diagrams result in the formation of images (Wheatley,
1997). This now leads to the concept of visualisation which is a very commonly
used teaching and learning strategy.
Visualisation is described in many different ways. Zazkis et al (1996) summarise
the issues and debate around visual thinking in terms of the dichotomies of
“visual versus verbal, visualized versus actual, memory images versus present
perceptions, spatial versus abstraction, static images versus dynamic images and
visualisation versus analytical”. In the psychological field visualisation is related
to human reasoning through the construction of an image (Zimmermann &
Cunningham, 1991). The image may be regarded as a mental representation in the
mind‟s eye and is therefore not concrete or physical. Pylyshyn (2003) maintains
that one can think with or without visualisation. He makes reference to visualising
an office by picturing the appearance of the room, but thinking about the room
without visualising entails focusing on selected components of the office and is
not necessarily thinking. Therefore, in this case visualisation excludes thinking.
However, Arcavi (2003) links visual thinking to visualisation and defines
visualisation as “the ability, process and the product of creation, interpretation, use
21
of and reflection upon pictures, images and diagrams in our minds”. According to
Williams (1993) visual thinking consists of seeing, representing information
graphically and visualisation. This is similar to visualisation perceived as the
ability to “recall and construct visual images within the mind” (Williams, 1983).
Visual thinking is mathematical thought derived through visual images
(Zimmermann & Cunningham, 1991). According to Zimmermann and
Cunningham (1991) visualisation in mathematics focuses on understanding,
interpretation and self discovery resulting from the formation of mental images,
using pencil and paper or technological means. Zazkis et al (1996) define
visualisation as “an act of connection between an internal construct and an
external object or event gained through the senses”. Presmeg (1997) also adopts
this interpretation and refers to visualisation as “the process of constructing and
transforming visual mental images, as well as those in drawings, diagrams or
computer screens”.
In describing visual thinking, Piaget distinguishes between static mental images
(figurative knowledge) and the active visualisation, manipulation and
transformation of the image in the mind (operative knowledge) (Fisher, 2005).
Visual literacy is based on the transformation and manipulation of images in the
mind. Mudaly (2008) distinguishes between visual literacy and visualisation by
emphasising that visual literacy is “visualisation combined with logical thought”.
Visual literacy is very often literally or mechanically understood. For example, the
numerous road signs symbolise and convey meaning to pedestrians and drivers
thereby forcing them to react in certain ways (Mudaly, 2008). The pictures and
concrete objects we see from as early as childhood are visual stimuli that
influences our visual perception and due to some past experiences we think , feel
and act in appropriate ways. Visual literacy goes beyond this basic understanding
of utilising visual materials to promote recognition, recall or retention of concepts.
The following definitions locate visual literacy as an emerging heuristic
instrument where it is defined as the ability:
22
to interpret images as well as to generate images for communicating ideas
and concepts (Stokes, 2002).
to decode, comprehend and analyse images in order to construct meaning
from visual representations of ideas and concepts (Burns, 2006).
to understand, use (write), think and learn in images (Horton in Cuoco,
2001)
These definitions are connected to Mudaly‟s (2008) view of the reference of
visual literacy to “internal processes of the mind” as a result of physical or mental
visual stimuli. Visualisation skills are related to the distinction in the cognitive
function between the right and left hemisphere of the brain (Silverman, 2002;
Stokes, 2002; Thornton, 2002; Williams, 1983). Accordingly, while the left
hemisphere of the brain processes sequentially, analytically and is verbally
oriented, the right hemisphere operates spatially and is visually-spatially oriented.
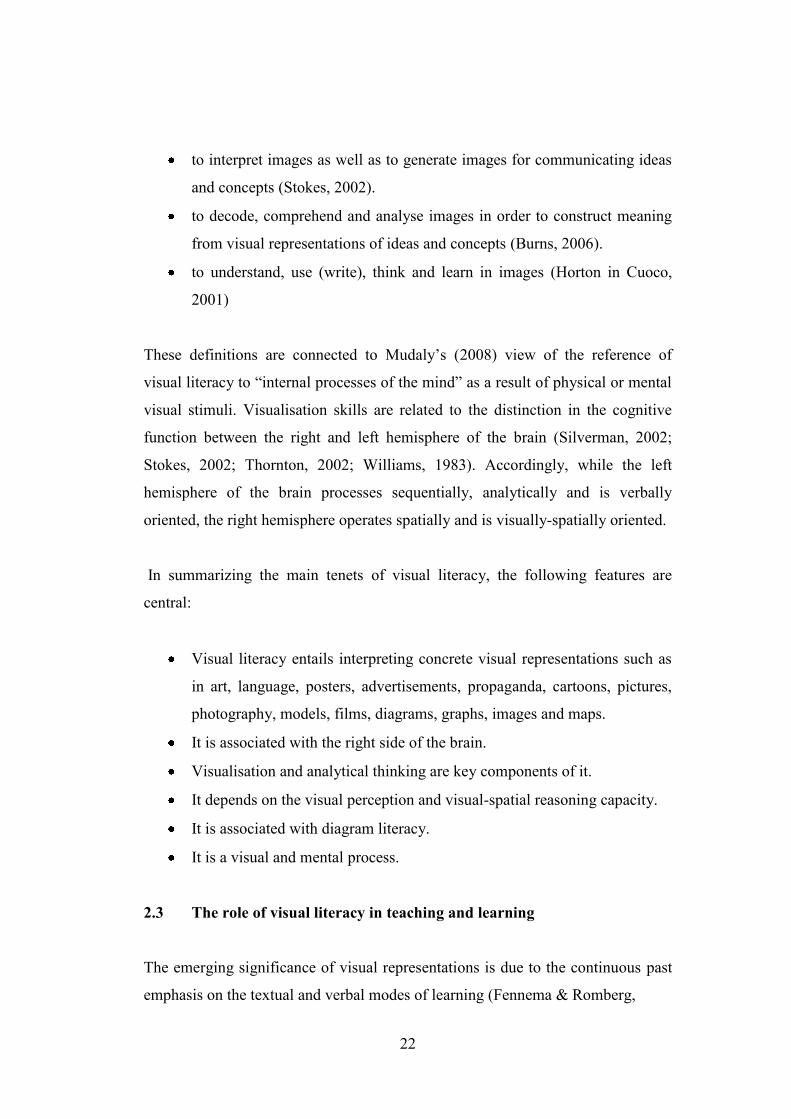
In summarizing the main tenets of visual literacy, the following features are
central:
Visual literacy entails interpreting concrete visual representations such as
in art, language, posters, advertisements, propaganda, cartoons, pictures,
photography, models, films, diagrams, graphs, images and maps.
It is associated with the right side of the brain.
Visualisation and analytical thinking are key components of it.
It depends on the visual perception and visual-spatial reasoning capacity.
It is associated with diagram literacy.
It is a visual and mental process.
2.3 The role of visual literacy in teaching and learning
The emerging significance of visual representations is due to the continuous past
emphasis on the textual and verbal modes of learning (Fennema & Romberg,
23
1999). Learning through visualisation techniques increases the capacity to learn
(Stokes, 2002). The use of pictures and other visual representations assists in the
learning process (Kadunz & Sträßer, 2004). From the South African education
perspective visual literacy is also entrenched in the curriculum. The policy
document by the Department of Education (2003) stipulates “critical and creative
thinking, analysis of information, communicating effectively using visual,
symbols and language and demonstrating an understanding of the world and
problem solving” as critical outcomes of educational practices.
While learning is still largely text based (Burns, 2006), children are exposed to
visual thinking through words, numbers, pictures, images, patterns, signs and
symbols from a very early age (Fisher, 2005). The use of pictures, maps, diagrams
and charts are visual strategies that make understanding easier (Williams, 1983).
Venn diagram representations are useful visual aids that results in the conversion
from abstract to spatial orientation and promotes reasoning (Pylyshyn, 2003).
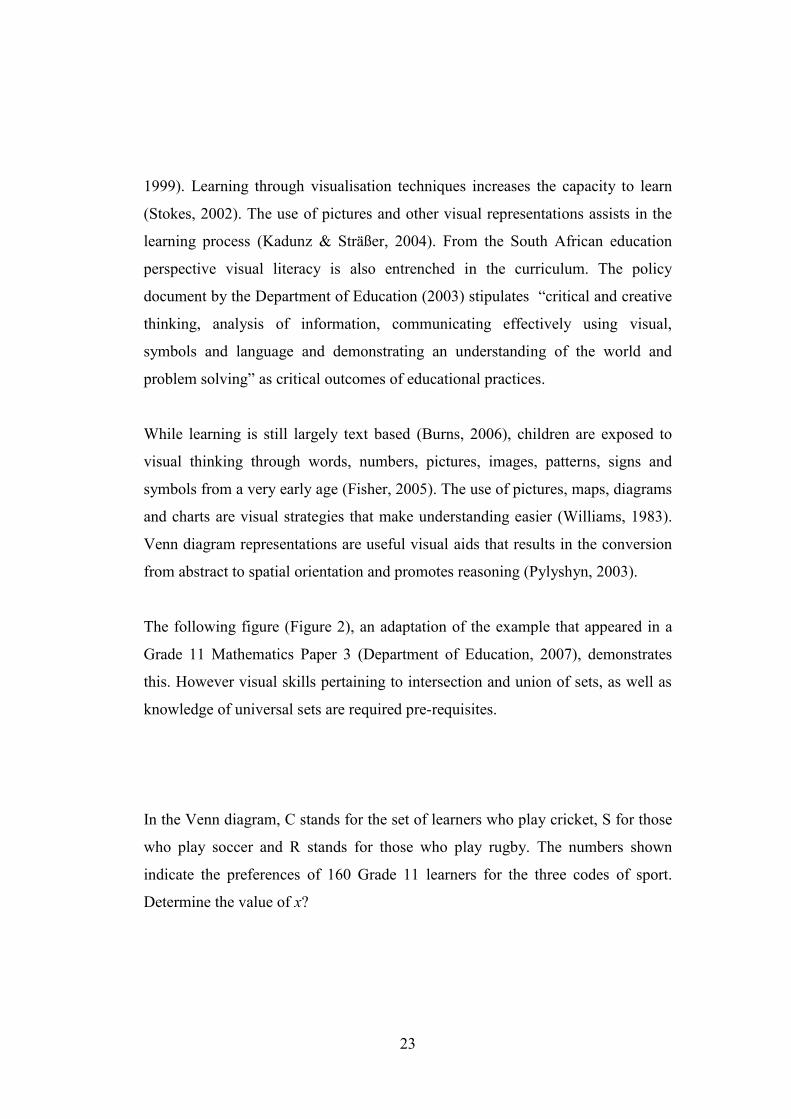
The following figure (Figure 2), an adaptation of the example that appeared in a
Grade 11 Mathematics Paper 3 (Department of Education, 2007), demonstrates
this. However visual skills pertaining to intersection and union of sets, as well as
knowledge of universal sets are required pre-requisites.
In the Venn diagram, C stands for the set of learners who play cricket, S for those
who play soccer and R stands for those who play rugby. The numbers shown
indicate the preferences of 160 Grade 11 learners for the three codes of sport.
Determine the value of x?
24
Figure 2: Venn diagram
A distinction is usually made between visual and verbal thinkers (Silverman,
2002; Pylyshyn, 2003; Presmeg, 2006). Silverman (2002) identifies the learning
skills of verbal learners as auditory-sequential and those of visual thinkers as
visual-spatial. Auditory sequential proficiencies include rote learning, verbal-
logic, listening and reading. Visual-spatial skills include complex concept
formation, mathematical reasoning and problem solving.
Arcavi (2003) identifies visualisation as being central in mathematical thinking
through concept formation, graphical analysis, mathematical proofs, problem
solving and visual reasoning. Through graphical representation and data analysis,
information that is readily accessible can be obtained by introspecting on factors
beyond what is seen. Arcavi (2003) refers to this as “seeing the unseen”, a process
of conceptual development when encountering visual representations. In visual
interpretation the use of symbols and words are applicable and complementary
(Arcavi, 2003). The use of visual proofs in mathematics has been a debatable
issue and is often looked down upon in preference for analytical methods of
proving (Thornton, 2002; Arcavi, 2003). For Presmeg (1997), this type of reaction
is symbolic of a decreasing value accorded to visualisation.
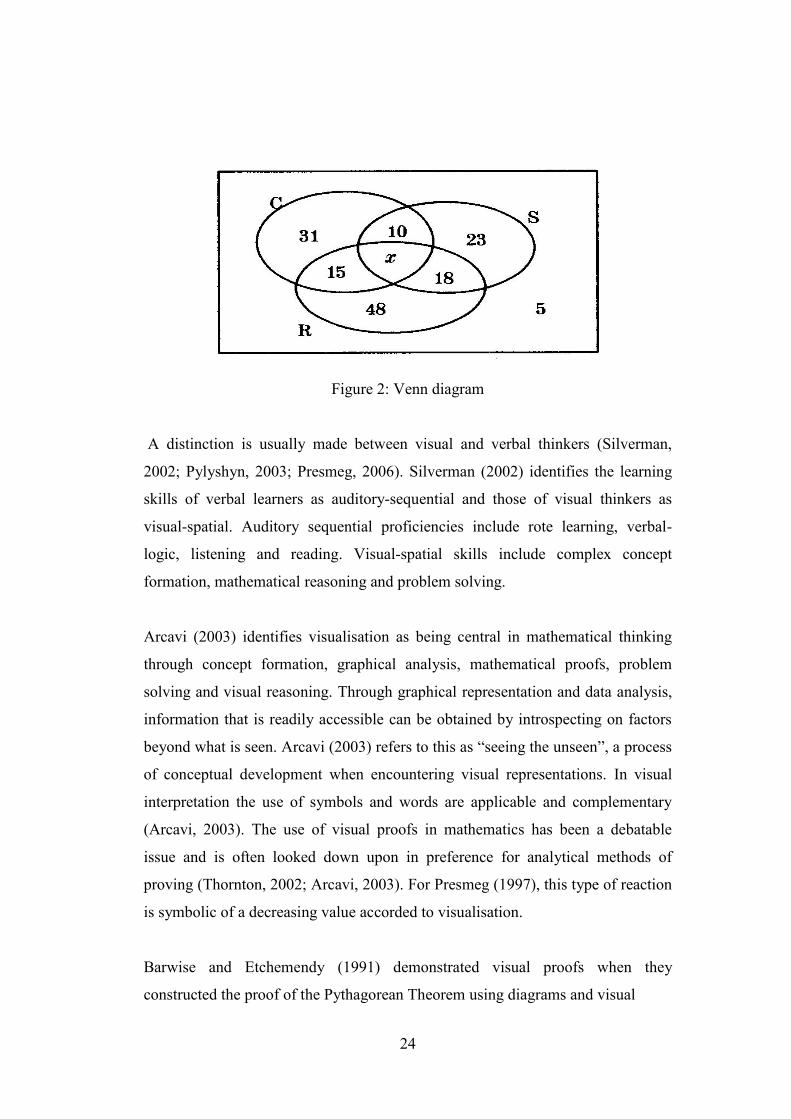
Barwise and Etchemendy (1991) demonstrated visual proofs when they
constructed the proof of the Pythagorean Theorem using diagrams and visual
25
analysis like looking at a diagram and then deriving in the mind the properties of
the given facts. This is shown in figure 3 below:
Figure 3: The Pythagorean Theorem
By constructing a square and congruent triangles to the first figure, the area of
square ABCD is shown to be (a + b) 2
since AB = a + b. However, the area of
ABCD can also be expressed as c2 + 4( a b) which is equal to c
2 + 2a b.
Therefore (a + b) 2 = c
2 + 2a b which becomes a
2 + b
2 = c
2. This example depicts
the use of geometrical and algebraic techniques, and is largely visually oriented.
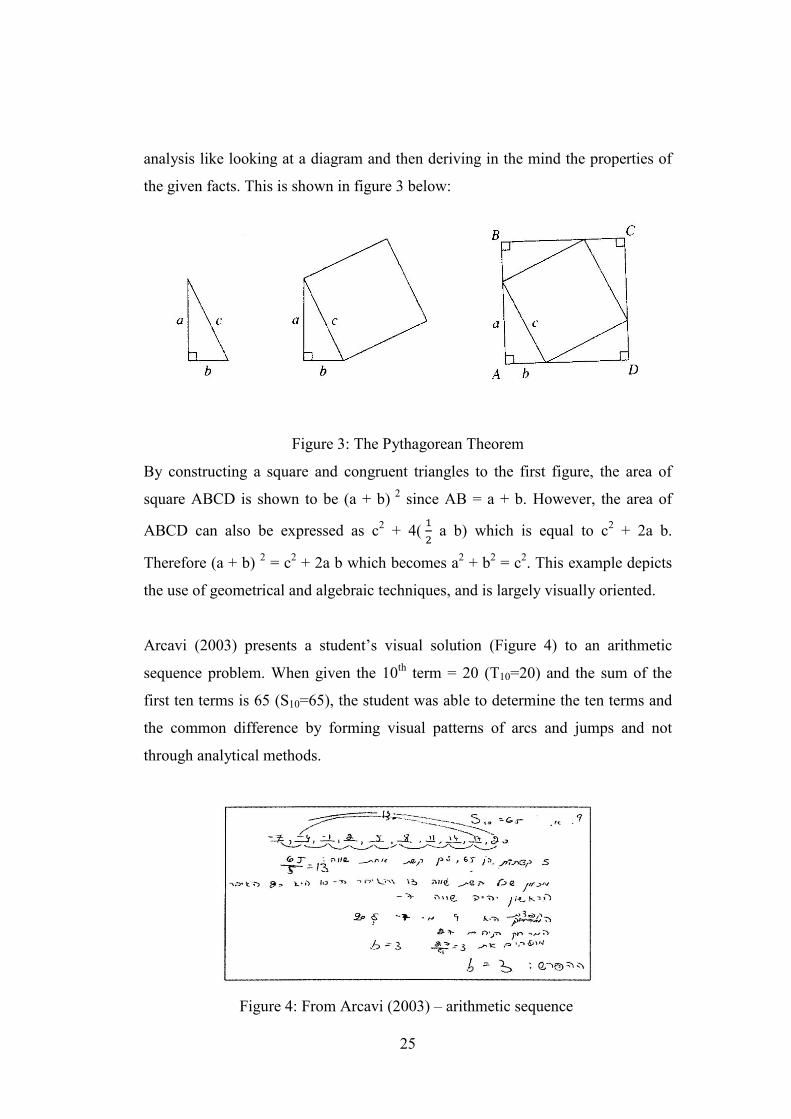
Arcavi (2003) presents a student‟s visual solution (Figure 4) to an arithmetic
sequence problem. When given the 10th
term = 20 (T10=20) and the sum of the
first ten terms is 65 (S10=65), the student was able to determine the ten terms and
the common difference by forming visual patterns of arcs and jumps and not
through analytical methods.
Figure 4: From Arcavi (2003) – arithmetic sequence
26
The formation of a gestalt image or solution is related to visual analysis as
displayed by Thornton (2002) through the use of diagrams and visual clues in
problem solving. Thornton (2002) exemplifies the significant role patterns play in
inductive and deductive reasoning. Through visual thinking, learners engage in
pattern generalisation activities in algebraic and geometric patterns. The
derivation of proofs in geometry and the comprehension of algebraic concepts are
supplemented through diagrams and visual pattern analysis. The use of dots,
squares and arrays facilitate the interpretation of patterns and formulation of
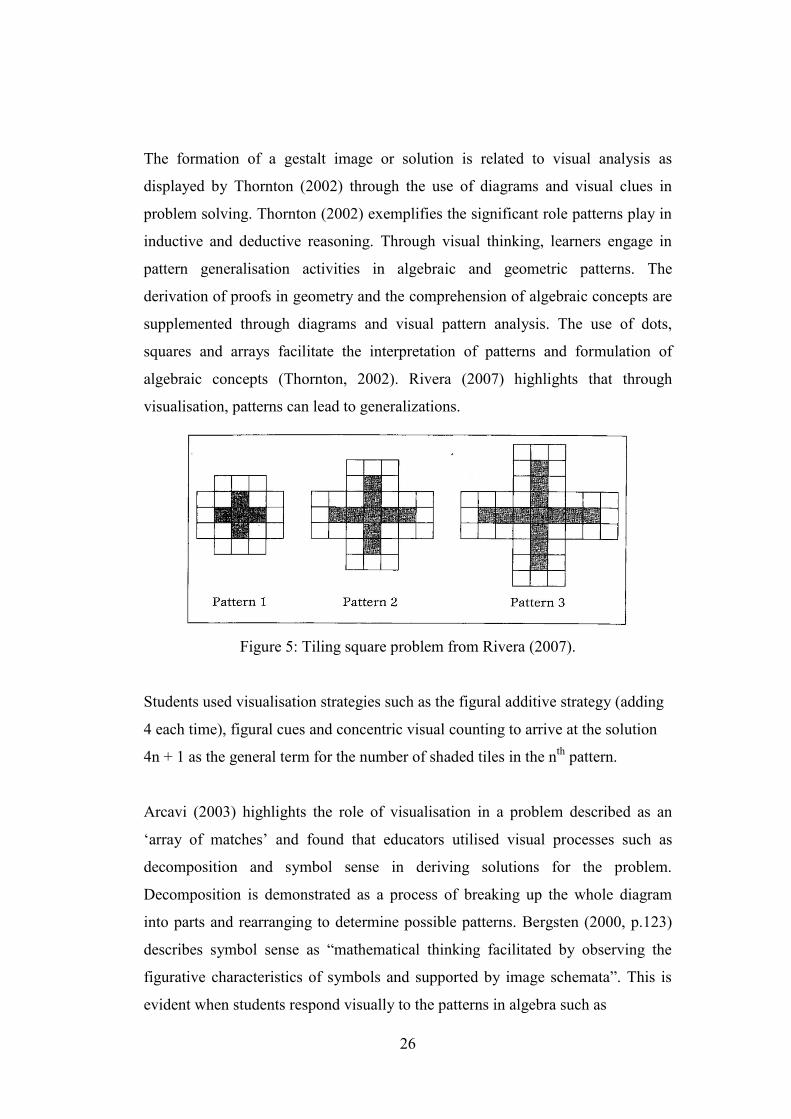
algebraic concepts (Thornton, 2002). Rivera (2007) highlights that through
visualisation, patterns can lead to generalizations.
Figure 5: Tiling square problem from Rivera (2007).
Students used visualisation strategies such as the figural additive strategy (adding
4 each time), figural cues and concentric visual counting to arrive at the solution
4n + 1 as the general term for the number of shaded tiles in the nth
pattern.
Arcavi (2003) highlights the role of visualisation in a problem described as an
„array of matches‟ and found that educators utilised visual processes such as
decomposition and symbol sense in deriving solutions for the problem.
Decomposition is demonstrated as a process of breaking up the whole diagram
into parts and rearranging to determine possible patterns. Bergsten (2000, p.123)
describes symbol sense as “mathematical thinking facilitated by observing the
figurative characteristics of symbols and supported by image schemata”. This is
evident when students respond visually to the patterns in algebra such as
27
x²- y² = (x + y) (x - y) by manipulating the given symbols (Kirshner & Awtry,
2004). Kruteski and Moses cited in Thornton (2002) show the success of using
visual stimulation and creativity in solving analytical geometry problems. Other
uses of visual representations in mathematical reasoning include the use of
images, metaphors and diagrams (Kadunz & Sträßer, 2004) and the use of concept
maps in making learning meaningful (Afamasaga-Fuata'i, 2004).
2.4 Graphical Visual Representations
2.4.1 Related mathematical research
Historically, graphs were used in mathematics in the study of the physical and
natural science and thereafter developed as a component of functional relationship
through the introduction of the x and y variables, depicting independent and
dependent variables (Kieran, 1993). Anderson (2008) traces the historical
development of graphs as pictorial representations as way back as 300 BCE.
Nicole Oresme (1323-1382) had connected a table of values to a graph. Graphs
had progressed to be used as scientific tools depicting the relationship between
two quantities. This influenced René Descartes (1596-1650) to connect geometry
with algebra and formulate a co-ordinate axis which today is known as the
Cartesian plane. However, it was due to the efforts and contributions of
mathematicians such as Fermat, Newton and Leibniz that led to the modern
graphs that we encounter today.
Kleiner (1993) describes a function as represented by a formula, a rule, a
correspondence, a relation between variables, a table of values, a graph, a
mapping, a transformation, an operation or a set of ordered pairs. The visual and
symbolic nature of functional relationships is portrayed through tables, formulae
and graphs. The usual instructional technique of learning functions is
characterised by the three core representation system (O'Callaghan, 1998). This is
referred to as NAG- numerical (table), algebraic (formula) and graphical (Verhage
et al., 2000). The Cartesian graph depicts a functional relationship usually drawn
28
by first tabulating values that satisfy the equation, corresponding points are plotted
and the points are eventually joined freehand (Skemp, 1986). Janvier (1987) refers
to diagrams, tables, Cartesian graphs, letters and brackets as abstract modes of
representations. Visual dimensions, referred to as specifiers, such as lines, marks
on the graphs and the labels are part of graphical representations (Friel, Curcio &
George, 2001).
The Cartesian plane, its representation including the number line, the x and y axes,
co-ordinates and arrowheads is a complex metaphorical structure (English, 1997)
and a meaningful and structured representational system for discovery of patterns
(Goldin & Shteingold, 2001). Goldin & Shteingold (2001) differentiates between
the external representational systems comprising the conventions of algebraic
notation, the number line and Cartesian co-ordinates and the internal
representational system comprising of the student‟s own spatial understanding of
the Cartesian plane. According to Dörfler (2000), the number line being a
prototype for the set of integers (Z), is regarded as an operative prototype because
actions needs to be performed on the number line in order to obtain rational
numbers. Likewise, the Cartesian graph is classified as a relational prototype
whereby the graph on paper has to be used for further operations. The number line
and the Cartesian graph can therefore be regarded as carriers of meaning.
A graph is defined as “information transmitted by the position of a point, line or
area of a two dimensional surface” (Friel et al, 2001). It is referred to as a
diagrammatic representation by Kadunz and Sträßer (2004), as a geometric
representation and pictures of relationships by Romberg et al (1993) and very
commonly referred to as a collection of points in the Cartesian plane. The
Cartesian graphs of linear functions are referred to as “an underlying
representation of conceptual structures” (Arcavi, 2003). Graphs are meant for
visual interpretation and their symbolic features possess meaning which have to
be „read‟ (Pimm, 1995).
29
Graphical interpretation has posed challenges for many students and they have
displayed numerous misconceptions and alternate conceptions. Initial research
evidence relate to students confusing the physical aspect of lines on graphs
depicting real-life situations (Kieran, 1993). This is similar to Pimm‟s (1995)
reference to research where students made literal interpretations of graphs such as
positive gradients depicting uphill walks in a distance versus time graph. This is
referred to as figurative association where the visual feature of the shape of the
graph is related to the problem. Arcavi (2003) refers to this as “pictorial
distraction” where visually salient information is interpreted and the underlying
meanings are not considered. Kieran (1993) also cites research when students
were asked to justify whether the co-ordinates (4; 5) existed on y = x² - 3x +1. The
students displayed finite orientation by their failure to associate the graphical with
the algebraic and resulted in the misconception of not believing that any number
can be substituted into the formula.
According to Norman (1992), students favour the symbolic rather than the
graphical form due to an inadequate visual understanding of the aspects
entrenched in graphs. This relationship between the graph and the equation is
referred to as “Cartesian connection” and always poses difficulty for learners
(Anderson, 2007). The metaphorical structure of the Cartesian plane appears
complex to students, especially with difficulties on the recognition of rational and
irrational numbers on the number line where students indicated that there are no
numbers between two whole numbers, as well as the infinite extension of the
number line (English, 1997). According to Williams (1993) the “topology of the
real line” as represented in graphs, refers to the understanding of the correlation
between the curve and a point, and continuity of curves. In a study conducted by
Williams (1993) students gave alternate conceptions of the meaning of graphs
such as “there is like a point and in that point there are many more points”.
The ability to transfer knowledge of graphical functional relationships to real
world situations is of great significance (Van Streun, 2004). Verhage et al (2000)
explored the interrelationships between graphs, formulae and tables in
30
mathematical modelling tasks relating graphs to real-life contexts. They
ascertained that learners experienced difficulties in discussing the behaviour of
graphs when describing maximum, minimum, increasing and decreasing
functions. Similar research on real-life contexts referred to as “Global Graphs”
found that learners‟ misconceptions were related to their interpretation and
understanding of the qualitative features such as the shape of the graph, rise, fall
and the x and y axes, all of which are visually interpreted (Julie et al., 1998).
Research studies confirm that learners lack graphing skills in mathematics and
even in other subjects like physical science (Asli, 2001). This might be related to
the order in which graphs are introduced to learners referred to as the translation
process of going from one mode to another such as from table to graph sketching
(Janvier, 1987). Graphs are usually taught after the numerical and symbolic stages
(Romberg et al, 1993). However the use of qualitative graphs (graphs that depict
relationships between a graph and a verbal statement or practical situation) should
be done first (Van Dyke, 2002). Thereafter, the quantitative graphs (tables or
algebraic expressions) should be taught and lastly the equation (abstract) must be
presented. Graphs are usually taught as an end in itself and the global meanings
are ignored in mathematics classrooms (Asli, 2001). Van Dooren (2008) cites
research examples when students often depict a fixation with the linearity concept.
These include students drawing a straight line when asked to draw a graph of any
function through two points and searching for straight line relationships when
viewing a parabolic curve.
Since Cartesian graphs form part of functional relationships, the understanding of
the function concept is relevant. Sierpinska (1992) emphasised that the function
concept depicted relationships of change where the x and the y represent changing
objects which are visible numerically and geometrically through activities such as
rotation, translation and reflection. A change in one quantity sometimes producing
a change in the other in a pattern-like manner is typical of visual graphical actions.
English (1997) further describes the formation of the Cartesian function as a blend
of the numerical and geometrical, whereby the ordered pairs become a curved or a
31
straight line trajectory. According to Sierpinska (1992) students displayed
difficulties in understanding the connection among the different modes of
functional representations. To the students f(x) meant substituting into the formula
and then computing its value.
Visual representations have played a significant role in the curriculum reform
process where understanding and interpretation of calculus concepts and
applications depended on graphical or diagrammatical representations
(Zimmermann & Cunningham, 1991). Calculus concepts such as continuity,
derivatives, increasing and decreasing values of a function, convexity, local
maximum and minimum and the definite integral can be taught using visual forms
(Eisenberg & Dreyfus, 1991; Tall, 1991). Students were found to follow the
algorithmic method of solving calculus problems rather than employing visual
techniques. This might be the reason for students performing well in differential
and integral calculus, but failing to internalise relationships among first and
second derivatives, limits and continuity(Cooley, Trigueros, & Baker, 2007).
Other difficulties include the derivative of a curve at a point in relation to the
tangent concept (Tall, 1991). Asiala et al (1997) introduced a visual instructional
treatment where students formed mental constructions and improved their
understanding of derivative, tangent and slope. Further studies included the
diagrammatical representations high school students formulated when answering
calculus problems (Bremigan, 2005). The significant role of visual
representations, as well as the effect of the symbolic and verbal representations on
mathematical thinking was identified. Through modification and reconstruction of
diagrams, students were able to make progress when concentrating on important
aspects of their diagrams.
2.4.2 Graphs and computer technology
Graphic calculators and computer technology have contributed to students
understanding of graphical functional relationships (Romberg et al, 1993;
32
Zimmermann & Cunningham, 1991). Pimm (1995) however shows his
dissatisfaction with computers and graphic calculators as they might prevent
students‟ engagement and development of understanding in mathematics. This is
in line with Mudaly‟s (2008) argument that whilst one can see an object,
understanding only occurs when „seeing‟ requires some active mental reaction to
what is seen. The calculator, for example, enables learners to derive the salient
points that learners need in order to sketch a graph of the function f(x) = sin 2x.
By using particular buttons on the calculator the student can draw a fairly accurate
graph of the function f(x), but with little understanding of the actual function
itself. By rote, they memorise the basic shape of graphs and are able to construct
transformations of f(x) by using the calculator, without any knowledge of the
transformation involved.
The process of visualisation is related to computers, and as such computers are
regarded as visualisation tools. Computer-based visualisation may be static,
dynamic or interactive, transforming the symbolic into geometric (Zimmermann
& Cunningham, 1991). While technology primarily generates a visual picture
graphically of the function, Romberg et al (1993) maintain that there is the
potential to allocate secondary significance to the use of formula. The use of
numeric, symbolic and graphical representations is essential for visualisation. The
use of technology should not be seen as an end in itself, but when used together
with pencil and paper graphical activities, provides a viable means to problem
solving , understanding and development of visualisation skills (Zimmermann &
Cunningham, 1991).
According to Dugdale in Romberg et al (1993) computer software such as Eureka,
Pathfinder and Green Globs influence students understanding of the global
meanings of graphs beyond merely plotting of points and reading of values.
Research on children‟s interpretation of graphs found that they could comprehend
computer generated graphs even without being taught about graphs (Pimm, 1995).
Students lacked the conceptual understanding of the qualitative features of graphs
and comprehension was limited to the physical features of graphs (Cates, 2002).
33
Kieran (1993) displays the role of computer technology in performing
transformations of graphs such as in y = -2(x – 3)² + 2. The transformation process
starts with the graph of y = -x², and then shifts three units to the right and two
units up. The Green Globs provides dynamic exposure to basic graph concepts in
a concrete form such as transforming y = x² into y = x² + 3 as well as the gradient
and y-intercept of y = m x + c focusing on straight lines such as y = 3x +1, y = 2x
+ 1 and y = 4x + 1 (Beigie, 2005). However in a study conducted by Magidson (as
reported in Arcavi, 2003), where these linear functions were used to analyse
student‟s interpretation, the students focussed on other visual descriptions other
than the y-intercept concept. The intended connection between the equation and
the graph was not derived.
The effects of the parameters on graphs can be investigated through the dynamic
display of graphs using the Geometer‟s Sketchpad and Autograph (Boshoff,
2007). These effects such as m, and c in y = m x + c; a, h and k in y = a (x - h) ²
+ k ; a, b and c in y = ax² + bx + c and a and q in y = a sin(x) + q can be
deduced through interactive procedures. Research conducted by Mudaly (2008)
showed that learners improved their understanding of geometrical problems after
undergoing visual investigations on the Geometers Sketchpad. In this study the
Geometers Sketchpad allowed learners to visualise, analyse, discover and make
conjectures about their observations.
2.4.3 The National Curriculum Statement
The National Curriculum Statement Grade 10-12 (Department of Education,
2003) policy document for mathematics stipulates four learning outcomes which
indicate what learners are to achieve in each learning outcome. According to
Learning Outcome Two (LO2), stated as Functions and Algebra:
“The learner is able to investigate, analyse, describe and represent a wide range of
functions and solve related problems”.
34
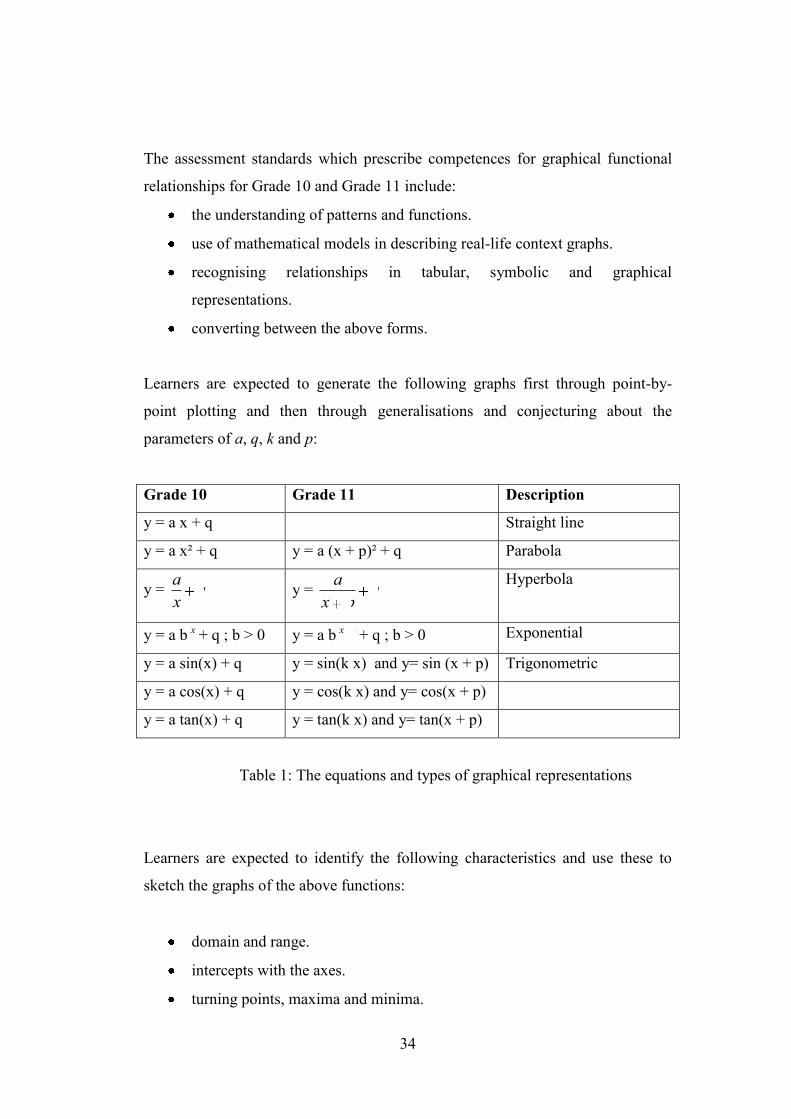
The assessment standards which prescribe competences for graphical functional
relationships for Grade 10 and Grade 11 include:
the understanding of patterns and functions.
use of mathematical models in describing real-life context graphs.
recognising relationships in tabular, symbolic and graphical
representations.
converting between the above forms.
Learners are expected to generate the following graphs first through point-by-
point plotting and then through generalisations and conjecturing about the
parameters of a, q, k and p:
Grade 10 Grade 11 Description
y = a x + q Straight line
y = a x² + q y = a (x + p)² + q Parabola
y = qx
a y = q
px
a
Hyperbola
y = a b x + q ; b > 0 y = a b px + q ; b > 0 Exponential
y = a sin(x) + q y = sin(k x) and y= sin (x + p) Trigonometric
y = a cos(x) + q y = cos(k x) and y= cos(x + p)
y = a tan(x) + q y = tan(k x) and y= tan(x + p)
Table 1: The equations and types of graphical representations
Learners are expected to identify the following characteristics and use these to
sketch the graphs of the above functions:
domain and range.
intercepts with the axes.
turning points, maxima and minima.
35
asymptotes.
shape and symmetry.
intervals on which increasing and decreasing functions occur.
discrete and continuous nature of graphs.
periodicity and amplitude.
Learners are expected to perform operations such as drawing a sketch graph given
the equation, determining the equation of a graph given the sketch of the graph,
apply knowledge of above characteristics, investigate the properties of graphs and
perform transformations of graphs. These expectations of learners demand higher
order interpretive skills. The parameters together with the graphical concepts have
a visual starting point and are hence associated with visual literacy skills.
2.5 Graphical actions and visualisation skills
Particular graphical actions and skills are necessary components for visual
learning or visual literacy to occur. Tabulation, plotting of points, curve sketching
and reading off values are the usual graphical skills emphasised in the past by
textbooks and educators (Kieran, 1993). According to Kieran (1993), this
traditional skill has undergone change with the emphasis now on interpreting
qualitative features of graphs, examining the role of parameters and the
application of graphs to problem solving, contextual situations. The interpretive
and comprehension skills are inherently linked to the understanding of graphs.
Friel, Curcio and George (2001) in their study with statistical graphs refer to graph
comprehension and graph sense as abilities to gain meaning from graphs. They
emphasise comprehension activities such as translation (descriptive level),
interpretation (seeking relationships), and extrapolation and intrapolation
(consequences of graphs). This exemplifies that graphs have the potential to
bypass symbolic notation.
36
O‟ Callaghan (1998) refers to translation as a procedural skill in advancing from
tabular to symbolic to graphical. However Janvier (1987) regards the translation
process of computing values and plotting of points as a traditional form. He
suggests a problem based ideology where the focus is on the interpretative aspect
of graphs. In alternating between the visual form of tables, words, symbols and
graphs various skills and processes are identified. These are pattern finding,
parameter recognition, data generation and qualitative graphical interpretation.
Many authors proclaim that the interpretation of graphical representations is more
superior to merely sketching of graphs (Dugdale in Romberg et al, 1993).
Yerushalmy and Schwartz (1993) utilise operations such as translating, dilation
and reflection, while O‟Callaghan (1998) highlights four competencies in
modelling, interpreting, translating and reifying. These conceptual skills have
consequences for linking the visual skills to higher mental operations.
Zimmermann and Cunningham (1991) identify various graphical and visual skills
pertinent to calculus understanding in reinforcing visualisation as a mathematical
skill. These include:
Focusing on pertinent mathematics detail in the Cartesian plane,
connecting information and thoughts and the removal of conflicting
information.
Elementary function sketching skills and intuitive plotting of functions.
The recognition of the visual structure in graphs.
A geometrical awareness to be able to understand symmetry,
transformations and similarity, as well as engaging in pattern
recognition.
To move between a graphical (geometric) and an analytical (algebraic)
approach.
Perhaps the visual index skill proposed by Pylyshyn (2003) whereby diagrams
could be visually targeted by focussing on parts of the representation, could be
37
applied to graphical representations. This is similar to decomposing diagrams as
exemplified by Arcavi (2003). However pre-knowledge is an important
requirement before engaging in a graphical procedure such as cited by Tall in
Zimmerman and Cunningham (1991) whereby students‟ intuitive understanding of
limits depended on the gradient concept. Furthermore, the rules, conventions and
notations of a graph must be understood well for visual understanding to occur.
This implies that symbol sense is essential for visual analysis to occur.
Goldenberg in Zimmerman and Cunningham (1991) relates graphical skills to
computer technology, which are applicable to pencil and paper graphs as they
reinforce a visual focal orientation. These skills include the modification of
functions by changing the parameters such as the c in y = m x + c, observing the
effect of p in y = (x - p) ², comparing functions such as f(x) = sin x and g(x) = sin
x + 2. Further skills mentioned is the identification of regions and markings of
graphs, such as the vertex, x and y intercepts, and the turning point, all of which
are significant visual starting points. Perhaps the most important skill for learners
to possess is to have a sense for functions and to be able to visualise graphs
(Eisenberg, 1992). Eisenberg (1992) affirms that to have function sense is to be
able to sketch the graphs of f (k x), f (x ± k), f´ (x) and f -1
(x) when given the
graph of f(x). In this way reversing a particular action is a graphical skill that will
test the level of understanding.
Arcavi (2003) demonstrates the importance of contexts in which diagrams or
images are presented. In this respect the visual implications when presented with
three parallel lines on the Cartesian plane are highlighted. These include that the
lines are linear functions, belong to the equation y = a x + b, have the same
gradient and that there is no simultaneous equation. When examining the
following example cited by Eisenberg and Dreyfus (1991) and used by Asiala et al
(1997) in their research, the task of identifying the intended visual implications
and graphical skills is pertinent:
38
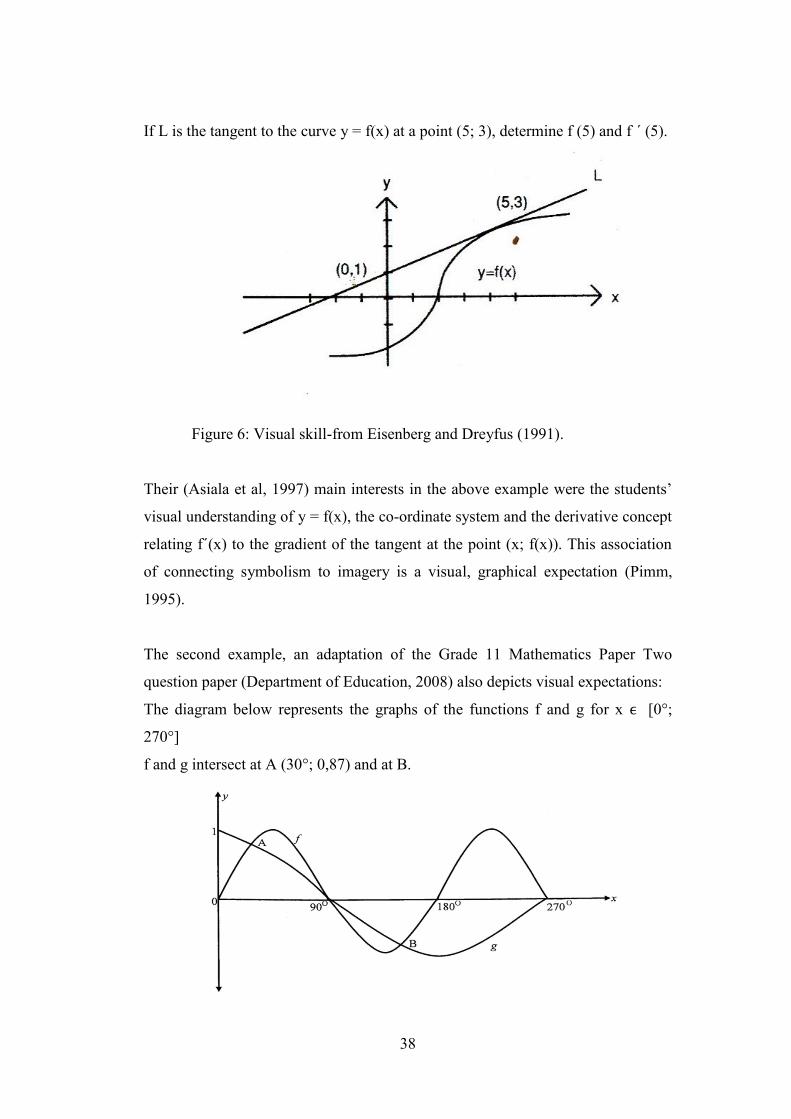
If L is the tangent to the curve y = f(x) at a point (5; 3), determine f (5) and f ´ (5).
Figure 6: Visual skill-from Eisenberg and Dreyfus (1991).
Their (Asiala et al, 1997) main interests in the above example were the students‟
visual understanding of y = f(x), the co-ordinate system and the derivative concept
relating f´(x) to the gradient of the tangent at the point (x; f(x)). This association
of connecting symbolism to imagery is a visual, graphical expectation (Pimm,
1995).
The second example, an adaptation of the Grade 11 Mathematics Paper Two
question paper (Department of Education, 2008) also depicts visual expectations:
The diagram below represents the graphs of the functions f and g for x ϵ [0°;
270°]
f and g intersect at A (30°; 0,87) and at B.
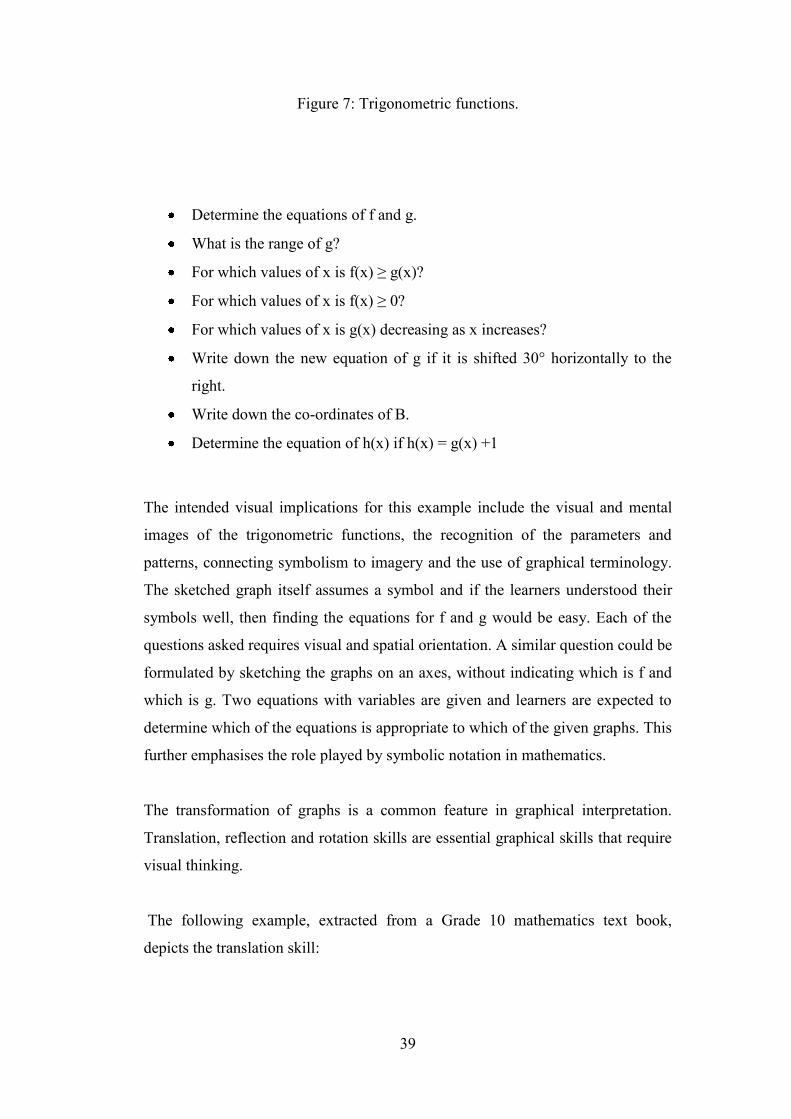
39
Figure 7: Trigonometric functions.
Determine the equations of f and g.
What is the range of g?
For which values of x is f(x) ≥ g(x)?
For which values of x is f(x) ≥ 0?
For which values of x is g(x) decreasing as x increases?
Write down the new equation of g if it is shifted 30° horizontally to the
right.
Write down the co-ordinates of B.
Determine the equation of h(x) if h(x) = g(x) +1
The intended visual implications for this example include the visual and mental
images of the trigonometric functions, the recognition of the parameters and
patterns, connecting symbolism to imagery and the use of graphical terminology.
The sketched graph itself assumes a symbol and if the learners understood their
symbols well, then finding the equations for f and g would be easy. Each of the
questions asked requires visual and spatial orientation. A similar question could be
formulated by sketching the graphs on an axes, without indicating which is f and
which is g. Two equations with variables are given and learners are expected to
determine which of the equations is appropriate to which of the given graphs. This
further emphasises the role played by symbolic notation in mathematics.
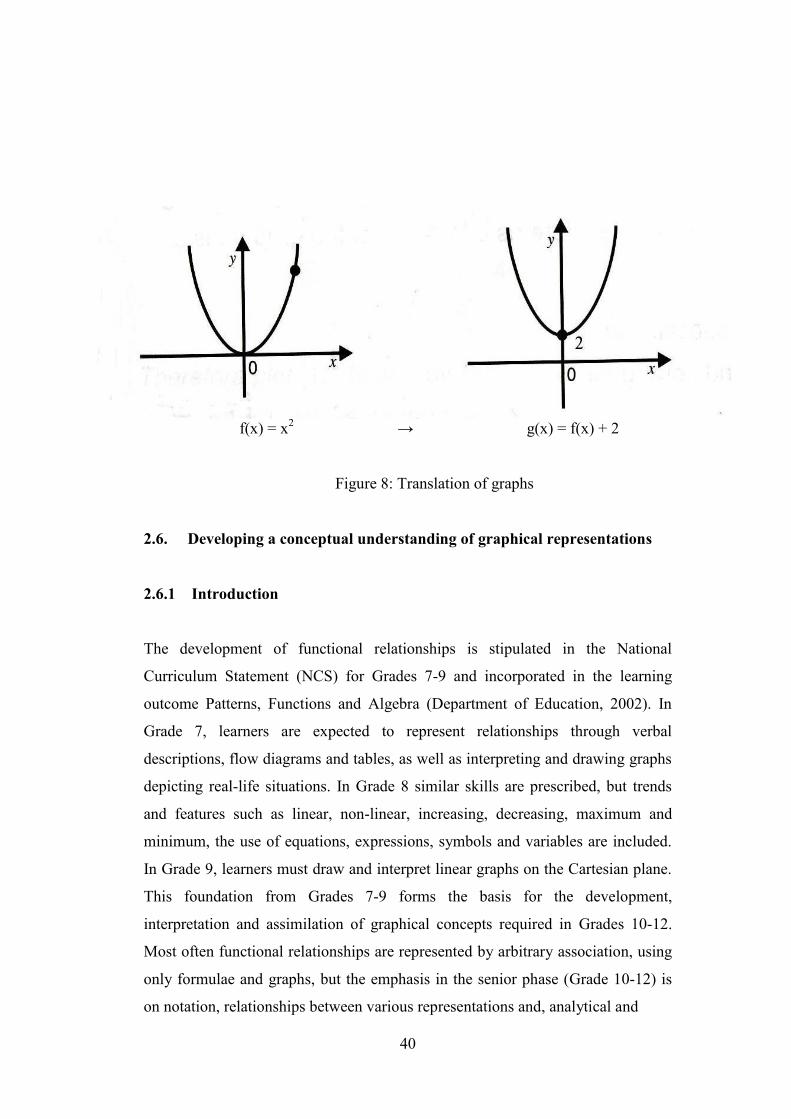
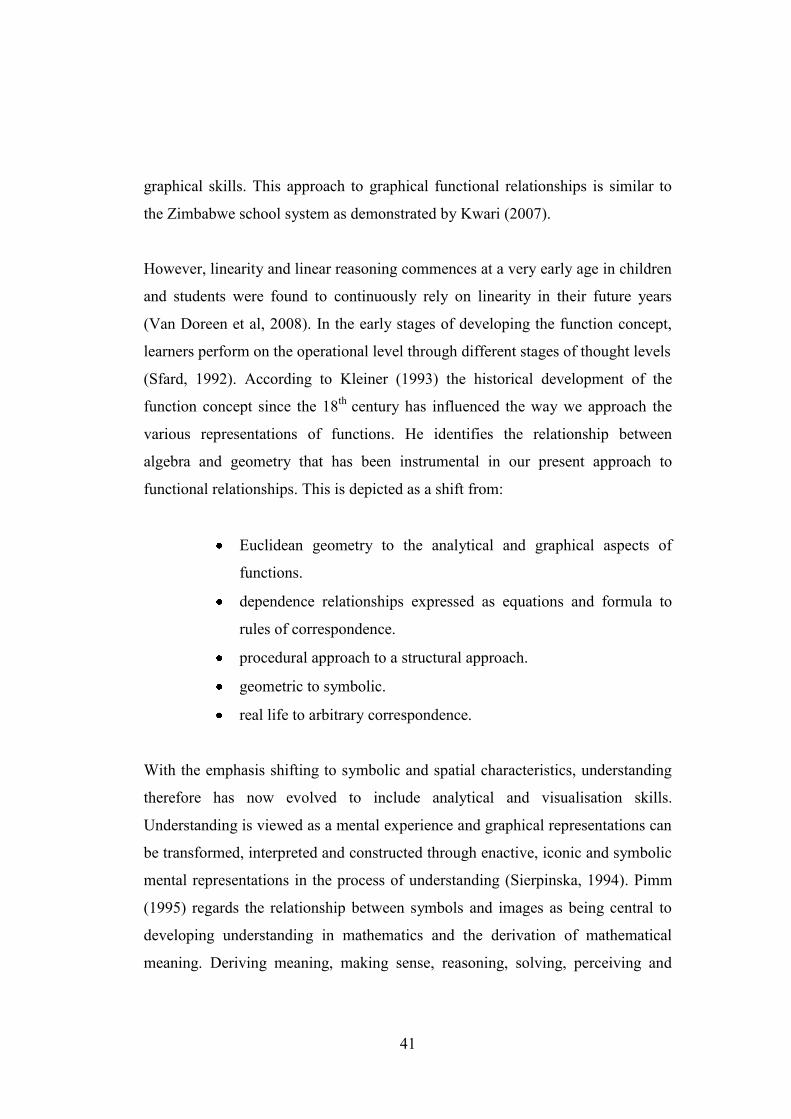
The transformation of graphs is a common feature in graphical interpretation.
Translation, reflection and rotation skills are essential graphical skills that require
visual thinking.
The following example, extracted from a Grade 10 mathematics text book,
depicts the translation skill:
40
f(x) = x2 → g(x) = f(x) + 2
Figure 8: Translation of graphs
2.6. Developing a conceptual understanding of graphical representations
2.6.1 Introduction
The development of functional relationships is stipulated in the National
Curriculum Statement (NCS) for Grades 7-9 and incorporated in the learning
outcome Patterns, Functions and Algebra (Department of Education, 2002). In
Grade 7, learners are expected to represent relationships through verbal
descriptions, flow diagrams and tables, as well as interpreting and drawing graphs
depicting real-life situations. In Grade 8 similar skills are prescribed, but trends
and features such as linear, non-linear, increasing, decreasing, maximum and
minimum, the use of equations, expressions, symbols and variables are included.
In Grade 9, learners must draw and interpret linear graphs on the Cartesian plane.
This foundation from Grades 7-9 forms the basis for the development,
interpretation and assimilation of graphical concepts required in Grades 10-12.
Most often functional relationships are represented by arbitrary association, using
only formulae and graphs, but the emphasis in the senior phase (Grade 10-12) is
on notation, relationships between various representations and, analytical and
41
graphical skills. This approach to graphical functional relationships is similar to
the Zimbabwe school system as demonstrated by Kwari (2007).
However, linearity and linear reasoning commences at a very early age in children
and students were found to continuously rely on linearity in their future years
(Van Doreen et al, 2008). In the early stages of developing the function concept,
learners perform on the operational level through different stages of thought levels
(Sfard, 1992). According to Kleiner (1993) the historical development of the
function concept since the 18th
century has influenced the way we approach the
various representations of functions. He identifies the relationship between
algebra and geometry that has been instrumental in our present approach to
functional relationships. This is depicted as a shift from:
Euclidean geometry to the analytical and graphical aspects of
functions.
dependence relationships expressed as equations and formula to
rules of correspondence.
procedural approach to a structural approach.
geometric to symbolic.
real life to arbitrary correspondence.
With the emphasis shifting to symbolic and spatial characteristics, understanding
therefore has now evolved to include analytical and visualisation skills.
Understanding is viewed as a mental experience and graphical representations can
be transformed, interpreted and constructed through enactive, iconic and symbolic
mental representations in the process of understanding (Sierpinska, 1994). Pimm
(1995) regards the relationship between symbols and images as being central to
developing understanding in mathematics and the derivation of mathematical
meaning. Deriving meaning, making sense, reasoning, solving, perceiving and
42
being insightful constitute understanding in mathematics (Sierpinska, 1994).
Graphs which serve as display representations are meant for visual interpretation
and this leads to the formation of images where understanding occurs through
connections and associations (Pimm, 1995).
It is significant to ascertain what it really means to understand graphical
representations. Williams (1993) interrogates what it really means to do and know
graphical functional representations. He regards understanding as being inclusive
of interpreting qualitative features of graphs, engaging in understanding functions
as a process and as an object, and lastly translating among the three modes of
representations. These include the meaning inferred by:
Describing functions as defined, non-defined, increasing, decreasing,
continuous and smooth.
Extracting the components of a function such as zeros, derivatives and
infinity.
Performing operations such as plotting of points and calculating values
such as f (2).
Utilising functions for representing relationships, modelling,
predicting, interpolating and approximating.
Understanding that y = 2x + 3 represents a linear function.
Yerushalmy in Romberg et al (1993) advocates pre-requisites for graphical
understanding and these resemble visual skills. These include the understanding of
the three mode representational system, the translation process, classification of
graphs, the role of parameters and geometrical spatial transformation.
2.6.2. Conceptual versus procedural understanding
43
Although this study focuses on the conceptual understanding of graphical
representations, the distinction between conceptual and procedural understanding
has always dominated mathematical inquiry in the pedagogical domain. These two
dimensions of learning have always been interpreted and represented in different
ways. Kilpatric, Swafford and Findell (2001) identify conceptual understanding
and procedural fluency as two mathematical proficient strands. They differentiate
between these where the former pertains to comprehension of and relationships
among concepts, while the latter refers to the application of rules, procedures and
skills in computations. This distinction is similar to Skemp‟s (1976) reference to
relational understanding as a means of knowing how to perform mathematical
actions with providing reasons, and instrumental understanding as a means to the
application of rules and procedures without providing reasons. The dichotomy
between these two constructs of understanding is described as conceptual
knowledge and procedural knowledge (Eisenhart et al, 1993; White &
Mitchelmore, 1996; Long, 2005).
Conceptual knowledge is described as constructing and creating relationships
between mathematical objects that exist within the given mathematical problem or
it might incorporate new forms of knowledge. This aspect of linking and
connecting mathematical ideas is the underlying structure of mathematics
according to Eisenhart et al (1993) and is the cornerstone of conceptual
understanding. Procedural knowledge implies knowing the formal aspect of
mathematics, algorithms, rules, definitions and strategies for performing tasks and
is regarded as a computational skill.
The debate and tension around these two theories of understanding include
whether conceptual or procedural understanding should occur first and whether
these two are linked (Long, 2005; Pimm, 1995). According to Eisenhart et al
(1993) teaching for understanding should include both procedural and conceptual
knowledge. Pimm (1995) emphasises “understanding before doing” or
understanding before mastery. Kilpatric et al (2001), in recognising the
significance of procedural proficiency in mathematics, discusses the link between
44
conceptual understanding and procedural fluency where procedural fluency can
actually support conceptual understanding and advocates a combination of these
two constructs referred to as proceptual understanding. Long (2005) motivates for
the inter-relationship and correlation of the two as well as the integration of
procedures with the understanding of concepts.
The development of conceptual understanding is shown to be influenced by
introducing teaching and learning activities in the development of a graphical
understanding of the derivative and function concepts (Asiala et al, 1997). White
and Mitchelmore (1996) identified students‟ failure to identify relationships and
deriving meaning when working with maximising functions. These students
displayed manipulations and procedural techniques when using x and y symbols.
Conceptual understanding therefore depends on the meaning that is derived or
transmitted. Noss, Healy and Hoyles (1997) point out the disadvantages in
„pattern-spotting‟ exercises in algebra and geometry where students draw tables to
derive generalisations, but with little or no conceptual understanding. Here
Thornton (2002) emphasises the advantages of visualising the relationships as a
means to conceptual understanding. Very often, rules and definitions can be
memorized mechanically or by rote with little or no conceptual understanding
(Goldin & Shteingold, 2001).
However, in this process learners may experience cognitive obstacles when faced
with the conflict between their personal, internal psychological meaning of
symbols, notations and graphs and the conventional mathematical meaning taught
to them (Goldin & Shteingold, 2001). Sierpinska (1994) highlighted the effect of
cultural constraints on understanding. The cultural background, language, beliefs
and communication may lead to the formation of epistemological obstacles in the
process of understanding. Williams (1993) identified the role of the student‟s
“phenomenal world” incorporating the social and cultural practices as influencing
their cultural understanding of graphs.
2.7 The role of imagery, analogies, metaphors and diagrams.
45
Our conceptual understanding of graphs is dependent on the way graphs are
presented. Graphs by their very diagrammatic nature and symbolic forms are
impregnated with visual imagery, whether concrete or abstract. The relationship of
mathematical concepts to something else or something similar is a common trend
in mathematics. Therefore, the application of analogies, metaphors, metonyms and
images to mathematical reasoning is linked to the way learners mentally construct
mathematical ideas (Presmeg, 1997). These have a bearing on visualisation since
analogies and metaphors are used to comprehend images and diagrams by
providing meaning of the words and visual representations (Kadunz & Sträßer,
2004). The analogies, metaphors and images are referred to as “vehicles of
thought” as they contribute to conceptual understanding (English, 1997).
Although imagery has been traditionally associated with the formation of pictures
in the mind, an image is expressed in various ways. It is defined as a “mental
construct depicting visual or spatial information” (Presmeg, 1997), a “mental
construction which can be constructed, re-presented and transformed” (Wheatley,
1997) and a representation of many relations (Kadunz & Sträßer, 2004). Pylyshyn
(2003) outlined how a visual image is formed through this simple mathematical
problem: “John is taller than Mary, but shorter than Susan. Who is the tallest?”
Imagery can be perceived according to the distinction of concrete-abstract, static-
dynamic and holistic-sequential (Presmeg, 1997). In her 1985 research study on
the role of visual processes in Grade 11 mathematics tasks in algebra, geometry
and trigonometry, Presmeg focussed on Grade 11 learners who preferred visual
thinking. These learners were referred to as visualisers. Her study revealed the
following:
Imagery is commonly used by learners in mathematical reasoning and
problem solving.
The learners displayed concrete, pattern, kinaesthetic, dynamic and
memory imagery.
46
The first forms of imagery that learners formed (prototypical imagery)
such as in triangles, circle theorems in geometry and the parabola, were
obstacles to their cognitive development. This imagery is referred to as
uncontrollable imagery.
Learners interpreted lines as parallel if they looked parallel.
Learners who used dynamic imagery found them useful in solving
mathematical problems.
Learners often use visualisation in constructing mathematical meaning.
Mathematical learning is viewed as taking place through the continual
complementary and metaphorical link between images and diagrams (Kadunz &
Sträßer, 2004). In this situation, learners can formulate analogies with the
representations they work with, or transform these representations metaphorically.
They may also want to use algorithms in this process; the choice is really theirs.
Metaphors (normally used in literary circles as a figure of speech) are seen to be
transporters of meaning in mathematics, creating similarities and new knowledge.
Its validity is dependent on the creation of a mental conceptualization when
comparing to another (English, 1997; Kadunz & Sträßer, 2004). The relation of
metaphors to the cognitive domain is further confirmed by describing metaphors
as “a matter of thought” (Lakoff & Núňez, 1997). An analogy is a relational
correspondence of transferring information from one part to another by matching
and mapping processes (English, 1997). Graphical representations on the
Cartesian plane are diagrams that have been created according to recognised rules
and procedures.
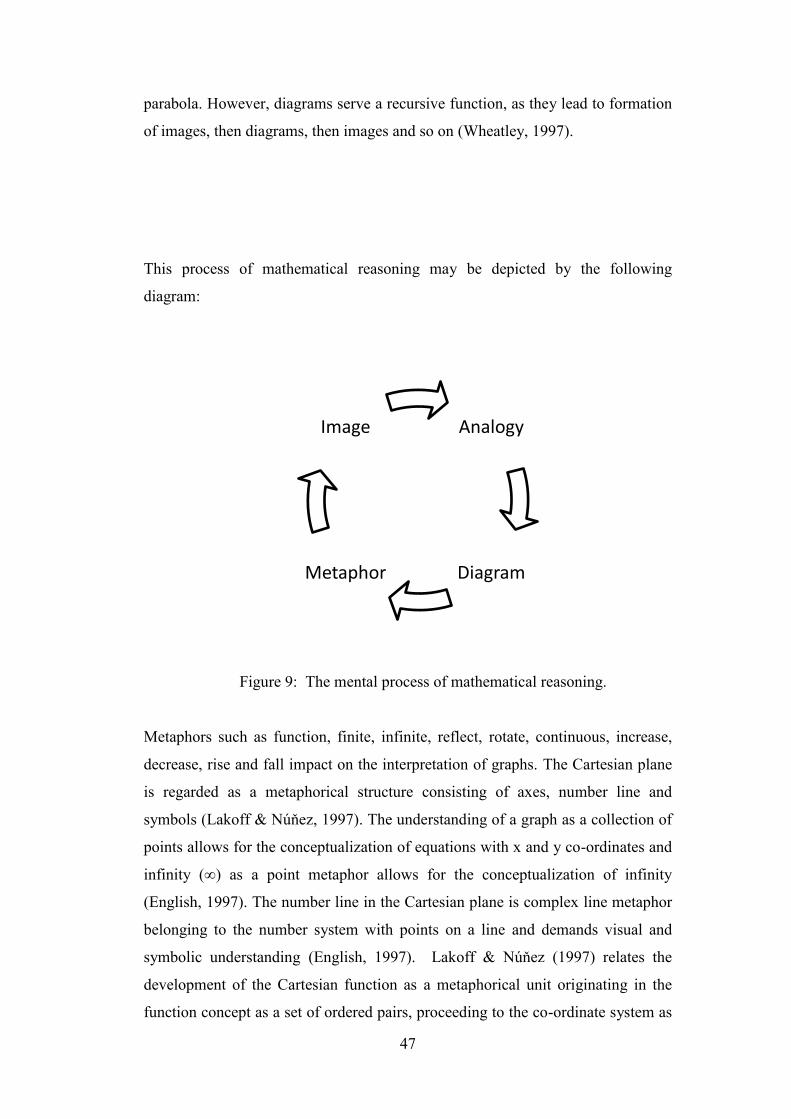
However, according to Wheatley (1997), “diagrams do not communicate, they
evoke thoughts in an imagistic form”. As an example, when a student encounters
y = x² - 5x, he undergoes image-based reasoning and formulates an image of the
47
parabola. However, diagrams serve a recursive function, as they lead to formation
of images, then diagrams, then images and so on (Wheatley, 1997).
This process of mathematical reasoning may be depicted by the following
diagram:
Figure 9: The mental process of mathematical reasoning.
Metaphors such as function, finite, infinite, reflect, rotate, continuous, increase,
decrease, rise and fall impact on the interpretation of graphs. The Cartesian plane
is regarded as a metaphorical structure consisting of axes, number line and
symbols (Lakoff & Núňez, 1997). The understanding of a graph as a collection of
points allows for the conceptualization of equations with x and y co-ordinates and
infinity (∞) as a point metaphor allows for the conceptualization of infinity
(English, 1997). The number line in the Cartesian plane is complex line metaphor
belonging to the number system with points on a line and demands visual and
symbolic understanding (English, 1997). Lakoff & Núňez (1997) relates the
development of the Cartesian function as a metaphorical unit originating in the
function concept as a set of ordered pairs, proceeding to the co-ordinate system as
Analogy
DiagramMetaphor
Image
48
consisting of co-ordinate lines with points as intersection metaphors and
eventually the graph as a collection of points.
2.8 Educators’ mathematical knowledge of graphical functional
relationships
Research on educators‟ mathematical knowledge and how their knowledge
influences the teaching and learning of mathematical concepts has been scarce
(Norman, 1992; Hill, Deborah & Schilling, 2008). In particular, Norman (1992),
remarks on the insufficient investigations conducted on educators‟ knowledge and
application of functions. Ascertaining the educators‟ conceptual understanding of
functional relationships is related to understanding the way they teach and
organise their classroom activities around the concept of functions (Norman,
1992). Hill, Deborah and Schilling (2008) present a model of mathematical
knowledge for teaching that distinguishes between the pedagogical content
knowledge (PCK) and the subject matter knowledge. Pedagogical content
knowledge comprises of the knowledge of content and students (KCS), the
knowledge of content and teaching (KCT) and the knowledge of the curriculum.
However, these authors maintain that there has been little attempt to study the
effect of PCK on student success in mathematics.
Cooney and Wilson (1993) maintain that the conceptual understanding held by
educators, affects their classroom practise. Norman (1992) classifies the
understanding of functional relationships by educators according to three
categories. These are the exemplification and characterization of functions,
application of functions and functional reasoning. In the first category
understanding is related to definitions and characteristics of functions such as
continuity, domain and range. The second category comprises the application to
modelled contexts while the third entails analytical and interpretive skills. In the
study with ten educators on their interpretation of the function concept, Norman
(1992) concluded that while educators display diverse cognitive views, they
49
display certain types of graphical actions. Educators were fixed on single
techniques in graphical interpretation of the function concept, preferred graphical
rather than algebraic forms and employed the traditional methods when
commencing with functions.
Presmeg (2006) refers to the teaching visuality levels of educators in her study to
classify the role of educators in using visualisation techniques in the classroom.
She examined visual thinking strategies such as pictorial representations, use of
educator‟s own imagery, spatial inscriptions, pattern seeking methodology and
delayed use of symbolism. It was concluded that educators‟ teaching visuality
score did not correspond to their level of knowledge of mathematical visuality.
2.9 Conclusion
The literature review provides a basis for the positioning of visual literacy in
mathematics teaching and learning. The relationships between graphical
interpretation and visualisation skills have been endorsed in some areas of
mathematical research such as through computer technology and the calculus
reform process. Furthermore, graphs by their very nature of its Cartesian
presentation and syntactical significance have been well recognised in
mathematics. The development of graphical functional relationships over the years
has lead to a demand for new skills, such as visual literacy, to be included in
graphical interpretation. The various types of graphical visual literacy skills
intertwined with imagery, analogies, metaphors and diagrams impacts on
visualisation techniques.
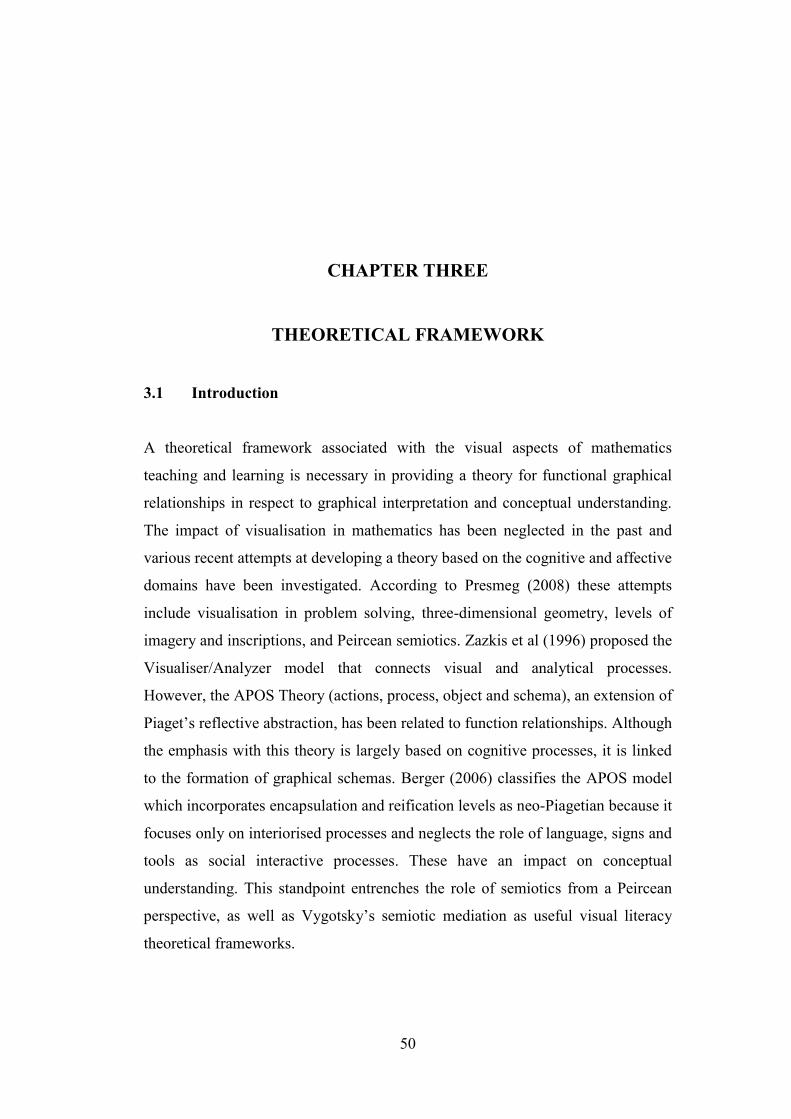
50
CHAPTER THREE
THEORETICAL FRAMEWORK
3.1 Introduction
A theoretical framework associated with the visual aspects of mathematics
teaching and learning is necessary in providing a theory for functional graphical
relationships in respect to graphical interpretation and conceptual understanding.
The impact of visualisation in mathematics has been neglected in the past and
various recent attempts at developing a theory based on the cognitive and affective
domains have been investigated. According to Presmeg (2008) these attempts
include visualisation in problem solving, three-dimensional geometry, levels of
imagery and inscriptions, and Peircean semiotics. Zazkis et al (1996) proposed the
Visualiser/Analyzer model that connects visual and analytical processes.
However, the APOS Theory (actions, process, object and schema), an extension of
Piaget‟s reflective abstraction, has been related to function relationships. Although
the emphasis with this theory is largely based on cognitive processes, it is linked
to the formation of graphical schemas. Berger (2006) classifies the APOS model
which incorporates encapsulation and reification levels as neo-Piagetian because it
focuses only on interiorised processes and neglects the role of language, signs and
tools as social interactive processes. These have an impact on conceptual
understanding. This standpoint entrenches the role of semiotics from a Peircean
perspective, as well as Vygotsky‟s semiotic mediation as useful visual literacy
theoretical frameworks.
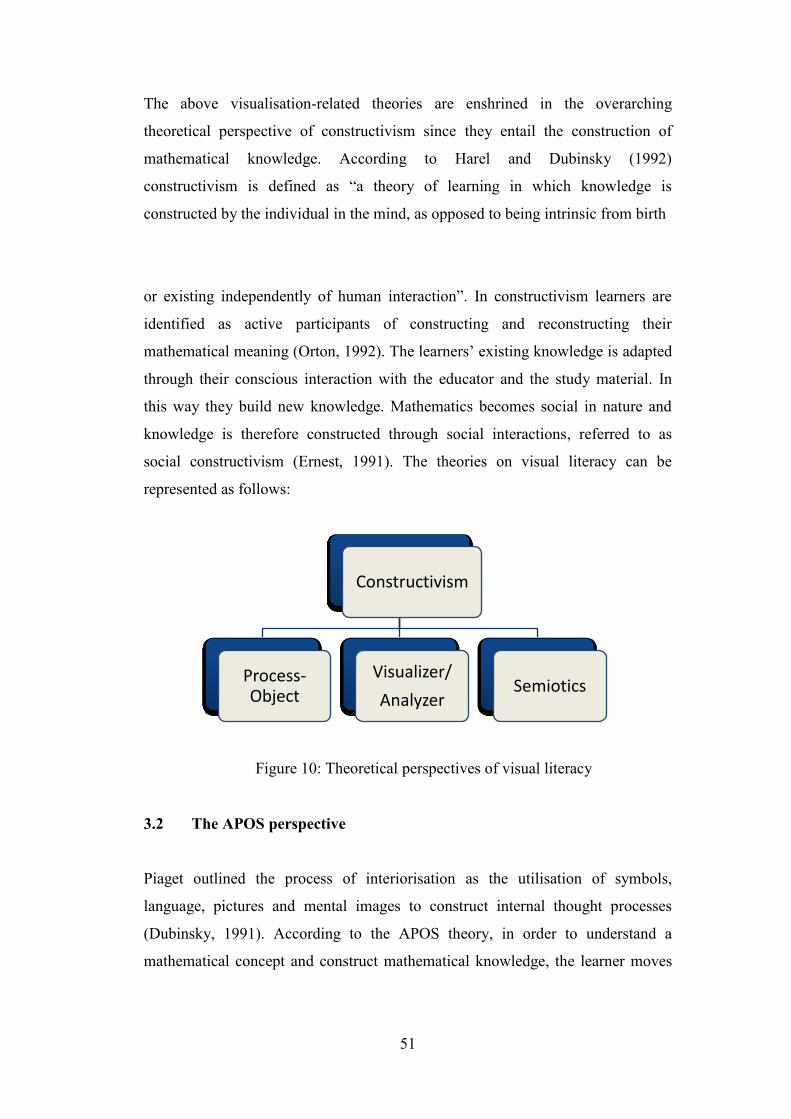
51
The above visualisation-related theories are enshrined in the overarching
theoretical perspective of constructivism since they entail the construction of
mathematical knowledge. According to Harel and Dubinsky (1992)
constructivism is defined as “a theory of learning in which knowledge is
constructed by the individual in the mind, as opposed to being intrinsic from birth
or existing independently of human interaction”. In constructivism learners are
identified as active participants of constructing and reconstructing their
mathematical meaning (Orton, 1992). The learners‟ existing knowledge is adapted
through their conscious interaction with the educator and the study material. In
this way they build new knowledge. Mathematics becomes social in nature and
knowledge is therefore constructed through social interactions, referred to as
social constructivism (Ernest, 1991). The theories on visual literacy can be
represented as follows:
Figure 10: Theoretical perspectives of visual literacy
3.2 The APOS perspective
Piaget outlined the process of interiorisation as the utilisation of symbols,
language, pictures and mental images to construct internal thought processes
(Dubinsky, 1991). According to the APOS theory, in order to understand a
mathematical concept and construct mathematical knowledge, the learner moves
Constructivism
Process-Object
Visualizer/
AnalyzerSemiotics
52
between different stages of the process-object theory (Berger, 2006). Bowie
(2000) describes the following four conceptions in the APOS theory:
The action conception is the transformation of objects by repeated physical
or mental operations.
Reflection upon an action with subsequent mental transformation and
interiorisation is referred to as the process.
A process becomes an object conception when actions and processes
become a totality.
The co-ordination of a collection of objects and processes result in the
formation of a schema.
Reflective abstraction guides the construction of mathematical knowledge from a
lower to a higher level as from action to representation (Cooley, Trigueros &
Baker, 2007). Dubinsky (1991) outlines five notions of constructions that
characterise advanced mathematical thinking. Firstly, interiorisation occurs
through the conscious reflection on actions and inter-relationships. When two or
more processes combine to form a new one, co-ordination takes place. Once the
process has been mastered, the process becomes detached and the object is
conceptualised through reification (Sfard, 1992) or encapsulated according to
Dubinsky (1991). When schemas are transferred to different contexts
generalisation occurs. Finally, reversal takes place when a new process is
constructed by reversing an interiorised thought process.
The development of the graphical schema is demonstrated by Yerushalmy and
Schwartz (1993) using the process-object standpoint. Initially, an action is
performed on an object such as the symbolic expression. The object of the action
transcends to the process stage which thereafter becomes encapsulated into a new
object. According to these authors the process perspective is highlighted through
the symbolic representation, while the graphical representation produces an entity
appearance. The process-object view is further elaborated by Moschkovich,
53
Schoenfeld and Arcavi (1993) where the process aspect is related to the x and y
links in functions. The object perspective is only considered by executing actions
on it through transforming functional relationships. Graphical actions such as
rotation and translation portray the object aspect. The process actions are depicted
by examples such as:
Given y = 3x + 2, determine the value of y when x = 5.
Why is 4 the y intercept in y = 3x + 4?
Determine the x intercept in y = 2x - 2.
In accordance with Skemp‟s (1976) description of understanding, these examples
might depict procedural or instrumental understanding. The following example
which is used to highlight the object perspective, is similar to relational or
conceptual understanding:
Given f(x) = x3
- 3x2
+ 2x, determine the y values when x = 0; 1; 2; 3 and
4.
If g(x) = x3
- 3x2
+ 2x + 1, determine the y values when x = 0; 1; 2; 3 and
4.
If one computes g(x) without referring to f(x), then one is functioning in the
process level and if one ascertains that g(x) = f(x) + 1, then functioning occurs at
the object level. In interpreting functional relationships, connection and flexibility
between both the process and object perspectives allows for movement between
graphs and equations (Moschkovich et al, 1993).
Sfard (1992) describes the process-object model in terms of the process occurring
at the operational level and the object at the structural level. Concept development
occurs through interiorisation, condensation and reification processes, of which
reification portrays advanced, structural mental constructions. Tall et al (1998)
describes Sfard‟s operational-structural dichotomy when “boys outnumber the
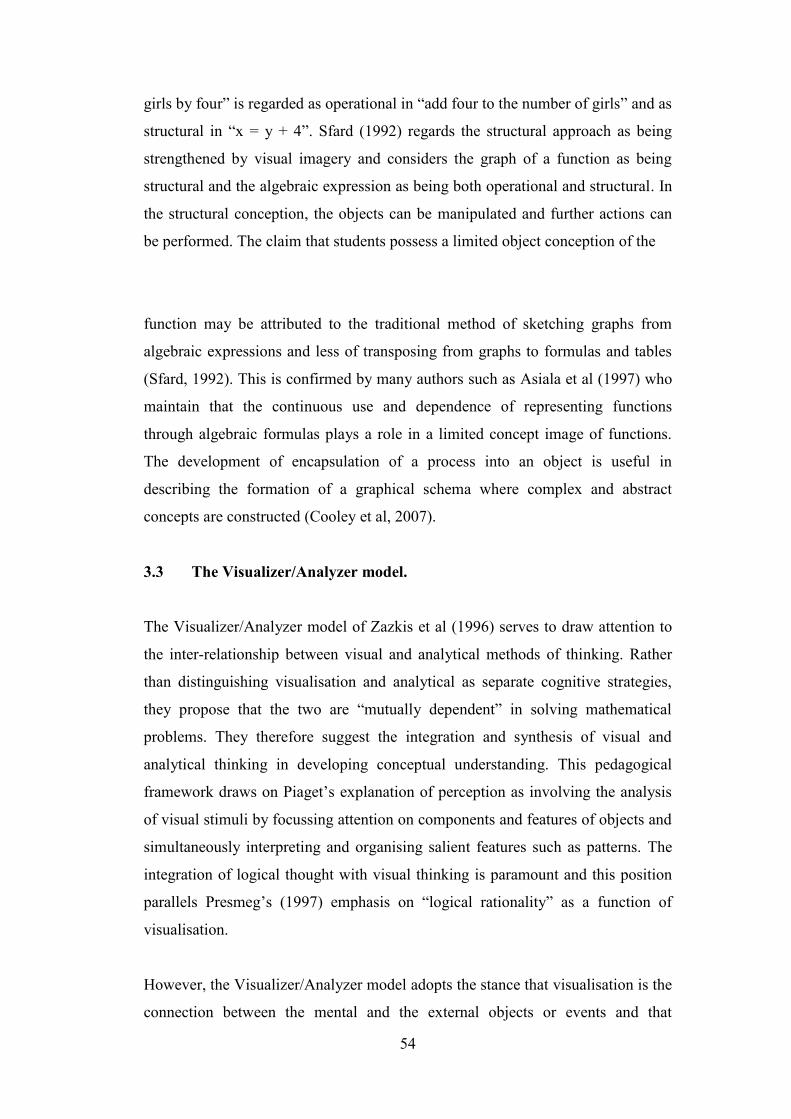
54
girls by four” is regarded as operational in “add four to the number of girls” and as
structural in “x = y + 4”. Sfard (1992) regards the structural approach as being
strengthened by visual imagery and considers the graph of a function as being
structural and the algebraic expression as being both operational and structural. In
the structural conception, the objects can be manipulated and further actions can
be performed. The claim that students possess a limited object conception of the
function may be attributed to the traditional method of sketching graphs from
algebraic expressions and less of transposing from graphs to formulas and tables
(Sfard, 1992). This is confirmed by many authors such as Asiala et al (1997) who
maintain that the continuous use and dependence of representing functions
through algebraic formulas plays a role in a limited concept image of functions.
The development of encapsulation of a process into an object is useful in
describing the formation of a graphical schema where complex and abstract
concepts are constructed (Cooley et al, 2007).
3.3 The Visualizer/Analyzer model.
The Visualizer/Analyzer model of Zazkis et al (1996) serves to draw attention to
the inter-relationship between visual and analytical methods of thinking. Rather
than distinguishing visualisation and analytical as separate cognitive strategies,
they propose that the two are “mutually dependent” in solving mathematical
problems. They therefore suggest the integration and synthesis of visual and
analytical thinking in developing conceptual understanding. This pedagogical
framework draws on Piaget‟s explanation of perception as involving the analysis
of visual stimuli by focussing attention on components and features of objects and
simultaneously interpreting and organising salient features such as patterns. The
integration of logical thought with visual thinking is paramount and this position
parallels Presmeg‟s (1997) emphasis on “logical rationality” as a function of
visualisation.
However, the Visualizer/Analyzer model adopts the stance that visualisation is the
connection between the mental and the external objects or events and that
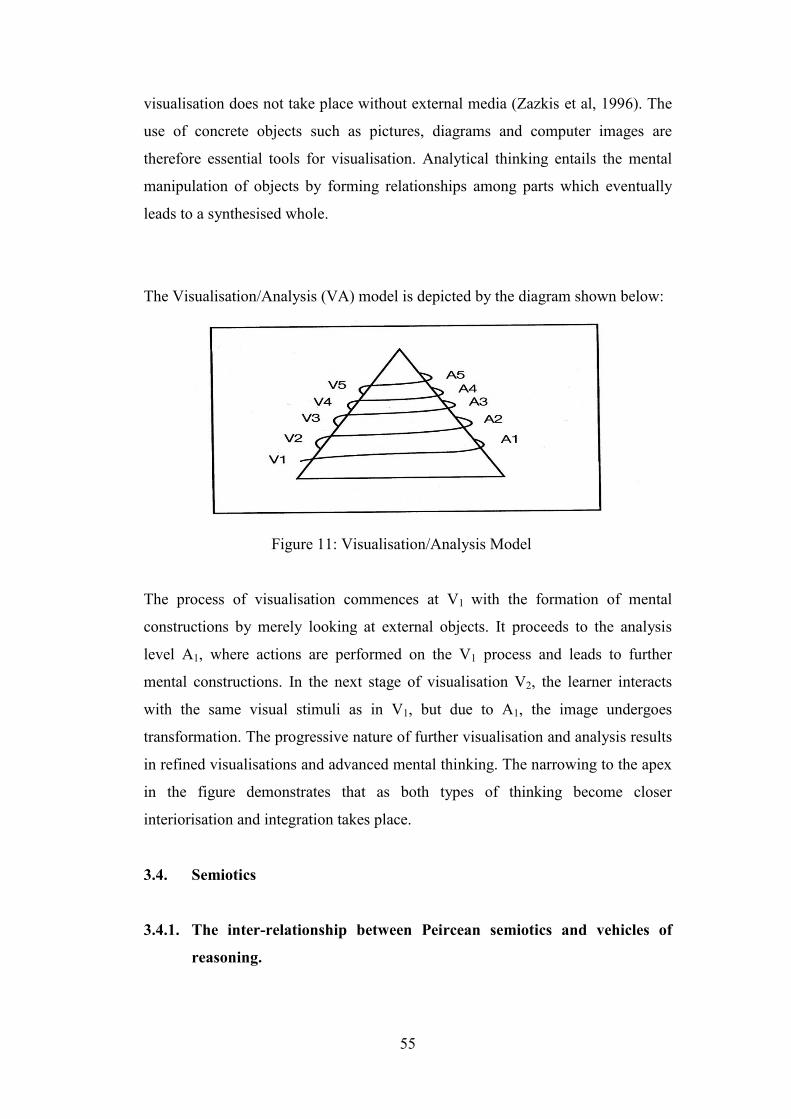
55
visualisation does not take place without external media (Zazkis et al, 1996). The
use of concrete objects such as pictures, diagrams and computer images are
therefore essential tools for visualisation. Analytical thinking entails the mental
manipulation of objects by forming relationships among parts which eventually
leads to a synthesised whole.
The Visualisation/Analysis (VA) model is depicted by the diagram shown below:
Figure 11: Visualisation/Analysis Model
The process of visualisation commences at V1 with the formation of mental
constructions by merely looking at external objects. It proceeds to the analysis
level A1, where actions are performed on the V1 process and leads to further
mental constructions. In the next stage of visualisation V2, the learner interacts
with the same visual stimuli as in V1, but due to A1, the image undergoes
transformation. The progressive nature of further visualisation and analysis results
in refined visualisations and advanced mental thinking. The narrowing to the apex
in the figure demonstrates that as both types of thinking become closer
interiorisation and integration takes place.
3.4. Semiotics
3.4.1. The inter-relationship between Peircean semiotics and vehicles of
reasoning.
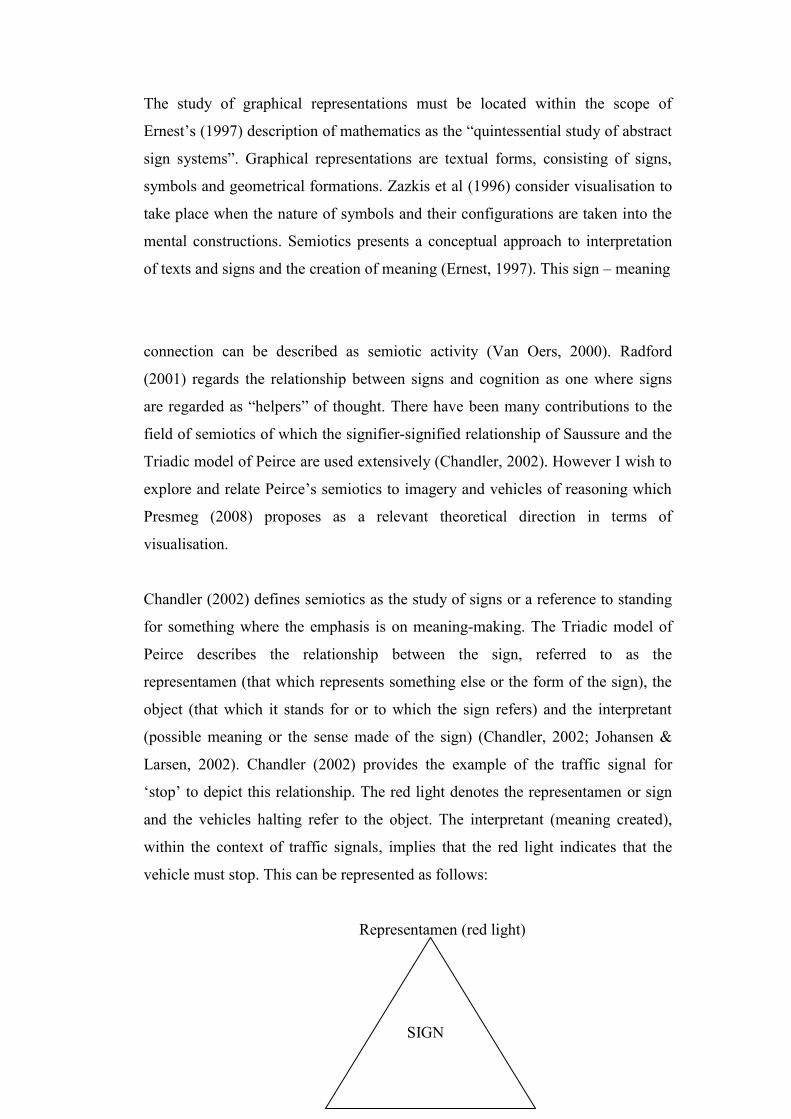
56
The study of graphical representations must be located within the scope of
Ernest‟s (1997) description of mathematics as the “quintessential study of abstract
sign systems”. Graphical representations are textual forms, consisting of signs,
symbols and geometrical formations. Zazkis et al (1996) consider visualisation to
take place when the nature of symbols and their configurations are taken into the
mental constructions. Semiotics presents a conceptual approach to interpretation
of texts and signs and the creation of meaning (Ernest, 1997). This sign – meaning
connection can be described as semiotic activity (Van Oers, 2000). Radford
(2001) regards the relationship between signs and cognition as one where signs
are regarded as “helpers” of thought. There have been many contributions to the
field of semiotics of which the signifier-signified relationship of Saussure and the
Triadic model of Peirce are used extensively (Chandler, 2002). However I wish to
explore and relate Peirce‟s semiotics to imagery and vehicles of reasoning which
Presmeg (2008) proposes as a relevant theoretical direction in terms of
visualisation.
Chandler (2002) defines semiotics as the study of signs or a reference to standing
for something where the emphasis is on meaning-making. The Triadic model of
Peirce describes the relationship between the sign, referred to as the
representamen (that which represents something else or the form of the sign), the
object (that which it stands for or to which the sign refers) and the interpretant
(possible meaning or the sense made of the sign) (Chandler, 2002; Johansen &
Larsen, 2002). Chandler (2002) provides the example of the traffic signal for
„stop‟ to depict this relationship. The red light denotes the representamen or sign
and the vehicles halting refer to the object. The interpretant (meaning created),
within the context of traffic signals, implies that the red light indicates that the
vehicle must stop. This can be represented as follows:
Representamen (red light)
SIGN
57
object interpretant
(vehicles halting) (red light meaning to stop)
Figure 12: Peirce‟s Triadic model
Sfard (2000) describes the Triadic relationship in terms of graphical
representations by making use of the parabolic function. The symbol f(x) = x2 is
the representamen which generates a reaction to draw a parabola. The parabola is
the interpretant of the sign. Peirce developed trichotomies of sign relationships
that exist within the signs (Smith, 1997; Chandler, 2002). These include the
relationship between:
the sign and itself (Firstness) - qualisign, sinsign and legisign.
the sign and its object (Secondness) - icon, index and symbol.
the sign and its interpretant (Thirdness) - rheme, dicisign and argument.
Sfard (2000) refers to the Secondness relationship between the sign and its object
as object mediation, described as “a set of discursive competencies and underlying
psychological processes”. Through the link between the iconic, indexical and
symbolic modes meaning could be obtained by object mediation. According to
Chandler (2002) iconic signs represent its object mainly by similarity, for
example, the picture of a mountain directs one to an idea of how the mountain
appears. Therefore, the physical resemblance between the sign vehicle and the
object is applicable (Presmeg, 2008). Indexical signs focus the attention to the
objects by contiguity and a physical connection and not through intellectual
operations. For example, the label on a medicine bottle or a sign bearing a street
name is in „direct connection‟ to the object (Johansen & Larsen, 2002). The
arrows at the end of the x and y axes conjuring up a continuous axes is an
indexical property. The symbolic forms are conventional signs which refer to the
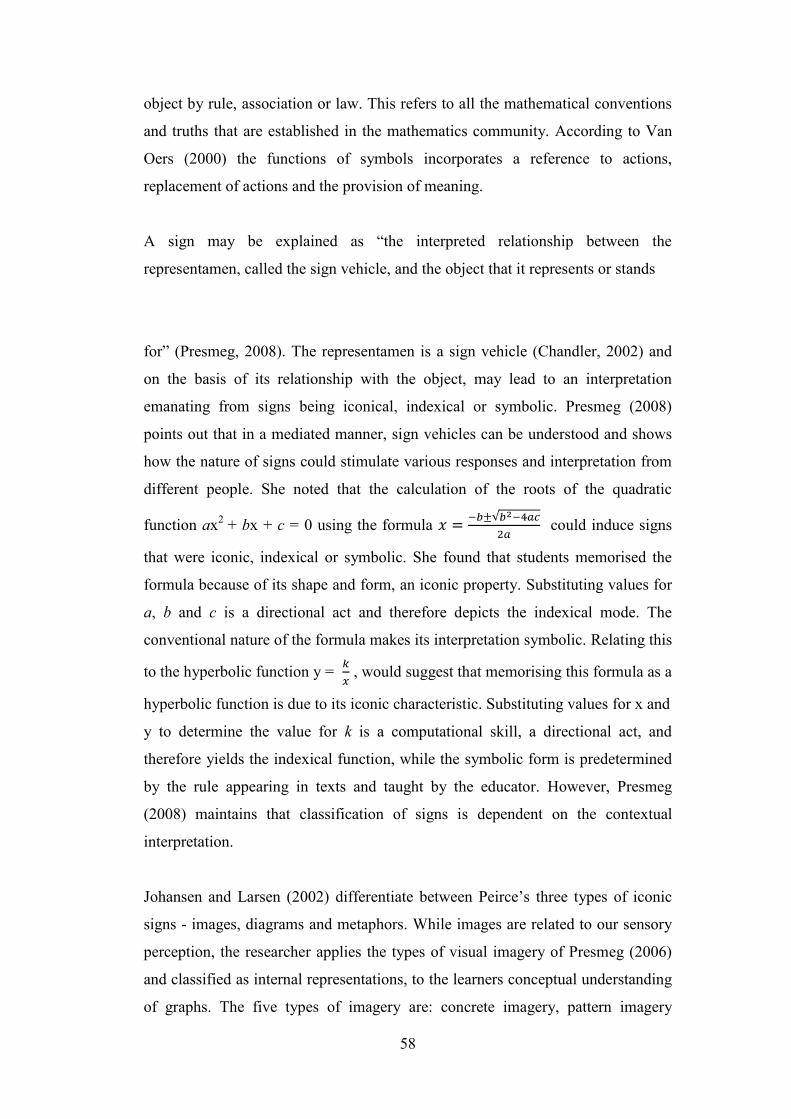
58
object by rule, association or law. This refers to all the mathematical conventions
and truths that are established in the mathematics community. According to Van
Oers (2000) the functions of symbols incorporates a reference to actions,
replacement of actions and the provision of meaning.
A sign may be explained as “the interpreted relationship between the
representamen, called the sign vehicle, and the object that it represents or stands
for” (Presmeg, 2008). The representamen is a sign vehicle (Chandler, 2002) and
on the basis of its relationship with the object, may lead to an interpretation
emanating from signs being iconical, indexical or symbolic. Presmeg (2008)
points out that in a mediated manner, sign vehicles can be understood and shows
how the nature of signs could stimulate various responses and interpretation from
different people. She noted that the calculation of the roots of the quadratic
function ax2
+ bx + c = 0 using the formula could induce signs
that were iconic, indexical or symbolic. She found that students memorised the
formula because of its shape and form, an iconic property. Substituting values for
a, b and c is a directional act and therefore depicts the indexical mode. The
conventional nature of the formula makes its interpretation symbolic. Relating this
to the hyperbolic function y = , would suggest that memorising this formula as a
hyperbolic function is due to its iconic characteristic. Substituting values for x and
y to determine the value for k is a computational skill, a directional act, and
therefore yields the indexical function, while the symbolic form is predetermined
by the rule appearing in texts and taught by the educator. However, Presmeg
(2008) maintains that classification of signs is dependent on the contextual
interpretation.
Johansen and Larsen (2002) differentiate between Peirce‟s three types of iconic
signs - images, diagrams and metaphors. While images are related to our sensory
perception, the researcher applies the types of visual imagery of Presmeg (2006)
and classified as internal representations, to the learners conceptual understanding
of graphs. The five types of imagery are: concrete imagery, pattern imagery
59
(based on relationships), memory imagery, kinaesthetic imagery (physical
movement) and dynamic imagery (transforming an image). While diagrams
represent structural relationships with the objects, metaphors are signs “which
represent the character of the representamen by representing a parallelism in
something else” (Johansen & Larsen, 2002). According to Presmeg (2008)
metaphors link the source (tenor) to the target (sign vehicle). The metaphorical
usage of graphical terminology may be depicted as follows:
increasing → rising
decreasing → falling
maximum → high
minimum → low
The use of metonymy as sign vehicles in mathematics is depicted through the
example „Washington stands for the Government of the USA‟ (Presmeg, 2008).
This might be correlated to f(x) stands for the y as in f(x) > 0, the y values greater
than zero.
Presmeg (2008) makes reference to Marcou and Gagatsis‟ taxonomy of
inscriptions that are connected to the iconic, indexical and symbolic sign vehicles.
Three such sign vehicles are examined and these include the descriptive-depictive,
polysemic-monosemic and the autonomous-auxiliary. Descriptive and depictive
sign vehicles refer to symbolic and iconic modes respectively. Therefore, words
and symbols may be regarded as descriptive and the visual forms that characterise
structure as depictive. The polysemic-monosemic dichotomy is demonstrated
through polysemic sign vehicles, where the same sign produces different but
connected interpretations. Mathematical concepts that can stand on their own are
autonomous in structure while diagrams are auxiliary sign vehicles.
3.4.2 Vygotsky’s semiotic mediation
60
For Vygotsky, “the central fact about our psychology is the fact of mediation”
(Vygotsky, 1999). The formation of mathematical meaning and construction of
mathematical concepts is theorised by Vygotsky in terms of higher and lower
mental functions, semiotic mediation and the use of psychological tools (Nicholl,
1998). Signs are regarded as the “prostheses of the mind” (Radford, 2001). Vile
(1993) describes mathematical signs such as words, symbols, diagrams, graphs
and schemas as psychological tools that link the lower mental function to higher,
more complex thinking through mediated social interaction. These tools and signs
perform the mediatory task that link the external reality to internal mental
processes. This process is referred to as semiotic mediation. Conceptual
development originates with the social and then undergoes internalisation through
semiosis (Vile, 1993). Berger (2006) maintains that the usage of these
mathematical signs is the first step in the conceptual process that occurs before
deriving mathematical meaning. Language is perceived as a significant
psychological tool that mediates action and thoughts (Vygotsky, 1999). The
process is depicted as follows: symbolisation constitutes objects and language
makes the appearance of an object possible. According to Vygotsky “the
relationship to an object is mediated from the start by some other object”
(Vygotsky, 1999).
Making meaning of mathematical objects in Vygotskian terms occurs through
mediation where psychological instruments or signs act as stimuli that influence
another stimulus (Van der Veer & Valsiner, 1993). The use of signs implies
psychological structural changes such as the reformulation of cognitive structures.
The implication here is that external signs lead to internal psychological change.
This theory, therefore emphasises mathematical learning as a social activity
brought about by language, signs and tools in contrast to learning viewed as
interiorised and encapsulated (Berger, 2006). The central tenet of Vygotsky‟s
theory of concept formation is the focus on the individual and the social relations
that the individual engages in. This social, interactive process is the underlying
factor for the individual to perform higher mental functions. Since this study
involves the role of visual literacy in graphical representations as presented in
61
textual form and the pedagogical relationship with the educator, conceptual
understanding depends on societal influences. Berger (2006) highlights the
essential components of the functional use of signs:
The use of words is essential for communication and conceptual
development prior to concepts being fully developed.
The meaning of concepts in the social world, as determined by experts in
texts and mathematical dialogue influences conceptual understanding.
Semiotic mediation is necessary for advanced mathematical thinking where
mathematical knowledge is both cognitively and socially constructed.
The conceptual development stages of Vygotsky contain certain elements that
have a bearing on conceptual understanding. In the preconceptual stage,
development takes place in heaps, complexes and potential concepts (Berger,
2006). Complex thinking is non-logical and includes actions such as matching,
associations, imitations and manipulations. Associations occur in ways such as the
eccentric use of mathematical signs such as transferring properties of f(x) to f´(x).
Complex thinking leads to the formation of potential concepts. The use of
pseudoconcepts in Vygotskyian terms is a channel to conceptual understanding.
Quasi or pseudoconcept is a potential concept that leads to higher complex
psychological functions (Vygotsky, 1999). Pseudoconcepts are similar to the true
concept. For example, a student uses the definition of the derivative to compute
the derivative of a function before understanding the derivative concept (Berger,
2006). Nicholl (1998) maintains that during the course of semiotic mediation, the
semiotic potential is accomplished through the process of decontextualisation.
Decontextualisation, normally applied to the linguistic domain, refers to the
abstraction of words or texts from the main source, thereby these becoming the
objects of reflection.
62
Vile (1993), in a research study with students, provides a semiotic analysis of:
What does x mean in x – 3 = 5? A student responded that x is the sign for
multiply, while another saw x as a single number as in 8 – 3 = 5. He further
describes the following example as an interpretant on a process level, where the
steps denote procedural knowledge through rote manipulation:
3y + 2 = y + 6
3y – y = 6 – 2
2y = 4
y = 2
Furthermore, a distinction is made between high level of semiotic demand and
low level of semiotic understanding. This is demonstrated when a student solves
for A in 7 + 2A = 4A – 11. He arrives at the answer A = 9 by substituting various
values for A and equating the left hand side of the equation to the right hand side.
Vile (1993) regards the student as displaying low level of semiotic understanding,
when the equation had high semiotic demand.
3.5 Conclusion
The exposition of the theoretical framework incorporating the APOS theory,
Visualizer/Analyzer model and semiotics serves a useful foundation to make sense
of learners‟ responses. The significant contribution of these theories emphasises
their association with visual literacy. The APOS theory highlights the internal
cognitive processes focusing on actions as processes or objects. The
Visualizer/Analyzer model describes the relationship between the external images
and the internal thought processes. A connection between the APOS and
Visualizer/Analyzer theories might be perceived in terms of their similarity in
stressing the attainment of advanced mathematical thinking. The link between the
external and the internal processes is further perceived through the semiotic
63
model, whereby semiotic activity is paramount due to the impact of signs,
symbols, notation and textual forms on learners‟ understanding and interpretation.
CHAPTER FOUR
RESEARCH DESIGN AND METHODOLOGY
4.1. The research design
The research study is based on identifying what conceptual understandings Grade
11 learners have of the various characteristics of graphs. Graphs emanate from the
section on functional relations as stipulated in the FET Mathematics Curriculum
Statement (Department of Education, 2003). Through this study the researcher
aims to discover learners‟ construction of mathematical meaning pertaining to
graphical functional relationships. The examination of their understanding and
interpretation is conducted from a visual literacy and visualisation perspective.
Recent trends in mathematical inquiry have distinguished the social construction
of mathematical knowledge in relation to textual and social interactions (Long,
2005). A qualitative research methodology suits the study well as it encompasses
in depth inquiry, subjectivity and provides thick descriptions of phenomena
(Cohen, Manion, & Morrison, 2007; Creswell, 1998; Henning, 2004). Qualitative
research is descriptive and focuses on meaning and explanations (McEwan &
McEwan, 2003). Through qualitative methodology, the researcher intends probing
into learners‟ interpretations and cognitive constructions to gain a better
64
pedagogical understanding of the role of visual literacy in mathematics
classrooms.
This interpretive standpoint serves to guide the study in providing a theoretical
framework based on the interpretivist paradigm. Henning (2004) provides an
epistemological basis (how we come to know about this world) of interpretivist
philosophy that indicates that knowledge is constructed by describing peoples
actions, beliefs, values, understanding and construction of meaning. In this way
the researcher endeavours to explore how, why and what meaning learners
attribute when sketching and interpreting graphs and in particular how they create
knowledge of mathematical concepts. Thick data is used mostly in qualitative
research where the aim is to acquire as much meaning and interpretation of
situations and contexts as possible (Henning, 2004). According to Maree (2007)
the interpretive paradigm encompasses a descriptive analysis with the aim of
providing a deeper understanding of the social and human relationships. This is
relevant to the construction of mathematical knowledge.
4.2. Population and sample
Since the study pertains to the FET curriculum for Grades 10-12, the researcher
decided to focus on the Grade 11 learners as they would have encountered graphs
in Grade 10. In doing so, the intention is to somehow inform and locate in the
entire FET phase, the role of visual literacy in graphical relationships and
therefore Grade 11 learners would have suited this purpose adequately.
Qualitative sampling techniques such as non-probability sampling and purposive
sampling were used in the selection process because the research enquiry did not
aim to represent or make generalisations of the wider population (Cohen et al,
2007). According to Creswell (1998), in qualitative research purposeful sampling
involves the selection of participants who are knowledgeable of what is to be
investigated. Grade 11 learners were purposely selected as they had covered the
sections on graphs sufficiently enough to be able to respond to a range of
65
properties of graphs, thereby satisfactorily providing data on graphical
interpretation. The sample size consisted of ten grade 11 learners with five
learners each from two secondary schools. All grade 11 mathematics‟ learners in
each school were ranked according to their performance level in the June
examination. Learners were systematically sampled and selected by: frequency
= .
This sample consisted of different ability levels of learners
so that rich and varied data could be obtained. Two mathematics educators who
were teaching the ten learners were also interviewed. These educators were
experienced in teaching mathematics in the FET phase Grades 10-12. Educators
were used as a means to provide an overview of key issues around the learners‟
conceptual understanding and visual literacy. The two secondary schools were
randomly selected from the eThekwini region in the province of KwaZulu-Natal.
The study commenced after learners had completed the section on functional
relationships at their respective schools.
4.3. Data collection methods
The data collection process was conducted at each of the two schools and is
summarized as follows:
The five learners and the educator each completed three worksheets based
on graphs (Appendix B). This took approximately forty-five minutes per
participant.
Thereafter, the researcher interviewed each learner individually, followed
by interviewing the educator. The answers written on the worksheets were
used during the interview. For both groups of participants an interview
schedule (Appendix C) was used in the interview process. This process
took approximately one hour per participant. Each interview was audio
taped.
66
Qualitative data collection strategies include observations, interviews and
document analysis (Cohen et al, 2007). The data collection method is based on
qualitative interviews and in particular semi-structured interviews. An interview
schedule which comprised of open-ended questions based on graphical
interpretation was formulated and used in the interviews. The interviews reveal
the subjective reality of the learners through their thoughts, feelings and actions
(Henning, 2004). Niewenhuis in Maree (2007) illustrates semi-structured
interviews as consisting of a set of pre-determined questions, where the
interviewer and the interviewee have a degree of freedom to probe and clarify
questions and responses. This is similar to what Cohen et al (2007) refer to as the
less formal interview where the interviewer adapts the standardised questions to
suit the dialogue process. Open-ended questions allow for flexibility through in
depth responses, clarity of misunderstanding and obtaining true responses from
interviewees (Cohen et al, 2007). The questions were based on graphical content
and were structured in a manner to initiate dialogue that revealed graphical
understanding. The standardized wording and asking the same questions to more
interviewees increases the level of comparability and reduces interviewer effects
and bias (Cohen et al, 2007) and increases intersubjectivity (Henning, 2004).
Although questionnaires are similar to interviews (Cohen et al, 2007), the use of
open-ended questions in questionnaires rarely provide qualitative data. Through
the interviews the empirical data are related to the research aims. The researcher
probes learners‟ responses to the written worksheets by asking them to explain
and provide reasons or meanings for their understandings.
The worksheets were designed by the researcher intended to facilitate the learner‟s
understanding of the different characteristics of graphs. This assisted the
researcher in introspecting on the effect of visualisation strategies in conceptual
understanding. Throughout the interview, reference was made to the three
worksheets in respect to how they create knowledge of mathematical concepts.
The worksheets were criterion referenced and content related. Criterion-
referenced is normally associated with tests (Cohen et al, 2007). However the
items on the worksheet bear similarity with tests, in that it aims to provide
67
evidence on what the learner knows and can do with graphical concepts. The
worksheets contained graphs and graphical instructions that were based on the
way learners encountered graphical representations in mathematics textbooks and
examination papers. The worksheets were therefore within the ability level of the
learners.
4.4. Triangulation
To explore more fully the conceptual understanding of learners and to produce
credible data, the researcher triangulated the findings of the learners through
educator interviews. Triangulation is the use of the multi- method strategy of two
or more methods of collecting data (Cohen et al, 2007). However, the researcher
employed methodological triangulation as stipulated in Cohen et al (2007), where
the same method of interviewing was used for different participants. In this case
the same questions as per interview schedule were asked of the two educators.
Through triangulation “one comes from various points towards a measured
position” (Henning, 2004). Therefore, the role of visual literacy is observed from
the position of the learners and the educators, with the intention of providing a
unified approach to conceptual understanding of graphical representations. The
internal validity issues of credibility, dependability and authenticity are ensured
through triangulation of methods and respondent validation. Detailed explanations
are given in the research of the processes involved. Thick, in depth descriptions of
the learners and teachers responses are accounted for in the data analysis.
4.5. Data analysis methods
The purpose of the research is to describe, interpret, discover, generate, explore
and understand learners‟ conceptual understandings of graphs. Therefore,
analytical inductive techniques are used in the analysis of data. These include
categorising the data according to themes and providing detailed summaries of
individual transcripts (Niewenhuis in Maree, 2007). The data is organised
according to the research questions and around particular themes.
68
The presentation and analysis of data are aligned to the key research questions:
How do the learners‟ understand the graphical representation of
functions?
Is the learners‟ visual understanding of the different characteristics of
graphs procedural or conceptual?
Is the educator‟s visual understanding of graphs different from those of
learners?
When analysing the data of the learners and educators, the researcher focuses on
the following for research question one:
How do learners interpret the following signs and symbols:
the Cartesian plane, the geometric curves of graphs and
functional notation such as f(x) > 0?
What is the learners‟ interpretation of the graphical
terminology they use?
What is the effect of graphical representations on learners‟
visual literacy skills?
For research question two the researcher identifies areas where learners employed
procedural and conceptual understanding. For research question three the
researcher examines the data of two educators that teach these learners in terms of
their similar or different visual understanding to that of the learners. Maree (2007)
sums up the analysis procedures that relate the gathered data with the primary and
secondary research questions. Firstly, the researcher identifies themes, categories
and subcategories. Thereafter, the researcher engages in a pattern seeking
exercise. Lastly, the researcher compares the data with other theories. This is the
mode in which the researcher conducts the data analysis.
69
CHAPTER FIVE
DATA ANALYSIS
5.1. Introduction
The focus area in the study is on the relationship between visual literacy and
conceptual understanding and the interconnectedness of these two constructs. The
process-object theories focus on interiorisation and encapsulation as triggered off
by actions. Therefore, they emphasise the actions performed in cognition. The
analysis aim firstly to determine the extent learners understand graphs at the
process and object levels. This is related to the procedural-conceptual dichotomy.
Secondly, the responses are examined in terms of the visualisation-analytical
thinking dichotomy. Thirdly, the researcher claims that the visual literacy tools
that learners encounter or experience when working with graphical representations
cannot be separated from their semiotic character. Both the external, concrete
visual material and the internal psychological domains are relevant to their
conceptual understanding. Therefore, in the analysis, the researcher makes
meaning of their understanding of graphical representations in terms of both
external and internal objects as a means of creating an interpretation of the role of
visual literacy in mathematics. Mathematical signs, symbols and tools have
inherent potential to bring about mental constructions.
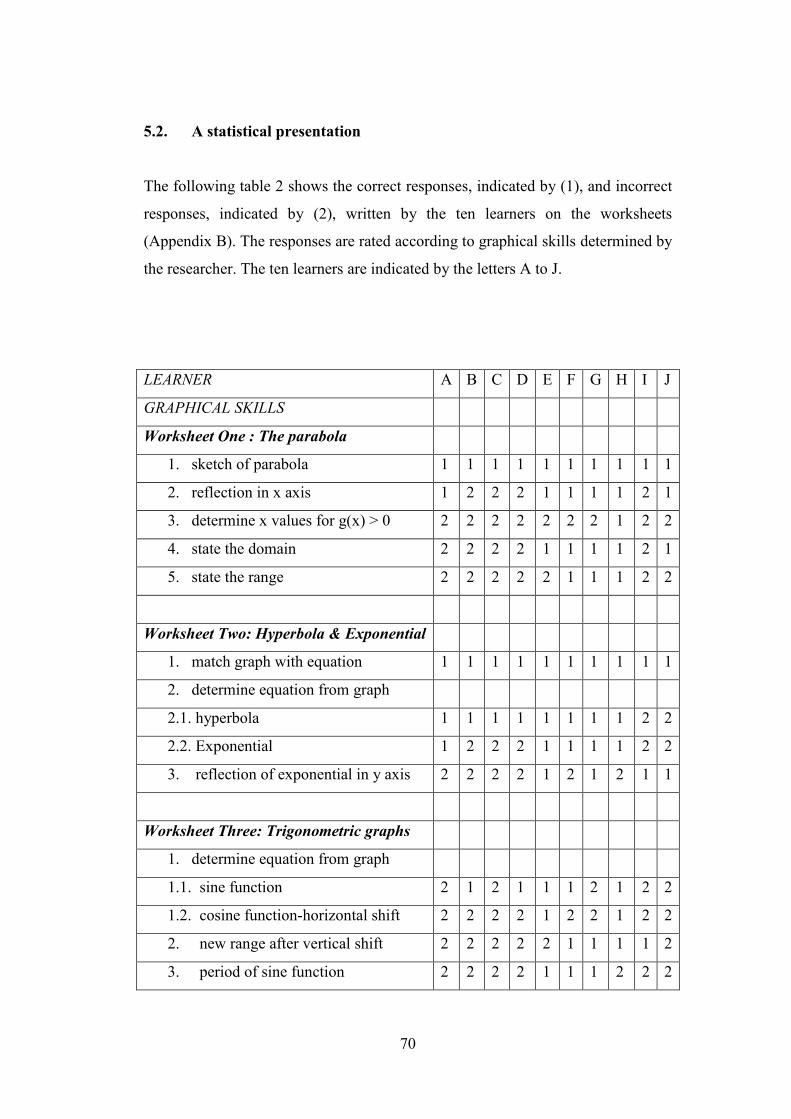
70
5.2. A statistical presentation
The following table 2 shows the correct responses, indicated by (1), and incorrect
responses, indicated by (2), written by the ten learners on the worksheets
(Appendix B). The responses are rated according to graphical skills determined by
the researcher. The ten learners are indicated by the letters A to J.
LEARNER A B C D E F G H I J
GRAPHICAL SKILLS
Worksheet One : The parabola
1. sketch of parabola 1 1 1 1 1 1 1 1 1 1
2. reflection in x axis 1 2 2 2 1 1 1 1 2 1
3. determine x values for g(x) > 0 2 2 2 2 2 2 2 1 2 2
4. state the domain 2 2 2 2 1 1 1 1 2 1
5. state the range 2 2 2 2 2 1 1 1 2 2
Worksheet Two: Hyperbola & Exponential
1. match graph with equation 1 1 1 1 1 1 1 1 1 1
2. determine equation from graph
2.1. hyperbola 1 1 1 1 1 1 1 1 2 2
2.2. Exponential 1 2 2 2 1 1 1 1 2 2
3. reflection of exponential in y axis 2 2 2 2 1 2 1 2 1 1
Worksheet Three: Trigonometric graphs
1. determine equation from graph
1.1. sine function 2 1 2 1 1 1 2 1 2 2
1.2. cosine function-horizontal shift 2 2 2 2 1 2 2 1 2 2
2. new range after vertical shift 2 2 2 2 2 1 1 1 1 2
3. period of sine function 2 2 2 2 1 1 1 2 2 2
71
Table 2: Statistical analysis of learner responses
The analysis procedure bears a similar resemblance to that conducted by Asiala et
al (1997). The above data, though not convincing enough to make any significant
conclusions about learners‟ interpretation of graphical concepts and utilisation of
graphical skills, may provide some commonalities that educators may be familiar
with in terms of learners‟ difficulties. The following analysis might not
sufficiently demonstrate learners‟ failing in conceptual understanding because
understanding of concepts is not reducible to correct and incorrect responses.
However, it may be useful in identifying the following:
Graphical skills where learners display poor graphical
understanding.
Graphical skills where learners display good graphical
understanding.
These may be classified as follows:
Poor understanding:
Determining values of x for which g(x) > 0.
Stating the domain and range of functions.
Reflection of graphs in the y axis.
Determining the equations of trigonometric graphs that
depict horizontal transformation.
Stating the period of trigonometric graphs.
Good understanding:
Sketching of parabola.
Reflection in the x-axis.
72
Matching hyperbolic and exponential graphs with their
equations.
Determining the equation of the hyperbolic function from
the given graph.
The table also indicates that as the graphical skills progress from the application
of rules and procedures to the interpretation level, the responses reveal an
increasing procedural understanding and a decline in conceptual understanding.
5.3 Learners’ understanding of graphical representations of functions
5.3.1 The understanding of the Cartesian plane, notation and
symbols
The purpose of this analysis is to determine whether learners understood basic
notation, symbols and the use of the Cartesian plane. This understanding is
determined in terms of the graphs of f(x) = x2 and g(x) = x
2 – 9, which they
sketched on worksheet 1 (Appendix B).
The following are learner responses when asked the question: Why did you use
arrows or why did you not use arrows at the end of your graph/axis?
Learner A: Yes, we had to use arrows. It shows that the graph is going up. There
will be no ending for the graph.
Researcher: Is there any need for the arrows at the end of your axis?
Learner A: Yes, the graph is not stopping.
Researcher: What does it mean to say that the graph is not stopping?
Learner A: I don‟t know, it just continues.
73
It is evident that learner A knew that arrows should be used, but had no idea why.
His claim that it never ends is not sufficient to demonstrate an understanding of
the symbol, although this might be perceived as partial understanding. This is
further illustrated by learner B, who claimed that arrows are used where the graph
ends and further confuses his response by then stating that the arrows can also
mean that the graph continues. These are two contradictory statements. Graphs
should either end at a point or continue forever. If the graph stops then it shows
that the function has a finite domain and range. This is quite different from an
infinite domain and range.
Learner B: It would be where the graph ends. Sometimes it can mean the graph
continues.
Learner F: The graph goes to infinity.
However when asked why the arrows are pointing upwards:
Learner F: Because the gradient is positive, so it points upwards. If the gradient is
negative it will point downwards.
Researcher: So you are relating the arrows with positive and negative gradients?
Learner F: Yes.
The above responses indicate the variety of interpretations learners possess of the
arrows at the end of graphs and the axes. The many varied linguistic meanings
offered indicate the role of language in mathematics as a means of thought. While
generally most of the ten interviewed learners used words like “no ending,
continues and infinity” as the purpose of the arrows, learner F related the arrows
to the concept of positive and negative gradients. This may have actually been her
relationship of the visual understanding of increasing and decreasing aspects of
the graph to the gradient. Learners therefore displayed limited understanding of
the arrows in terms of Cartesian functions and Cartesian planes and did not
actually relate the arrows to the depiction of all possible x and corresponding y
values that satisfy the Cartesian function. This issue will later be explored from
the educators‟ perspective.
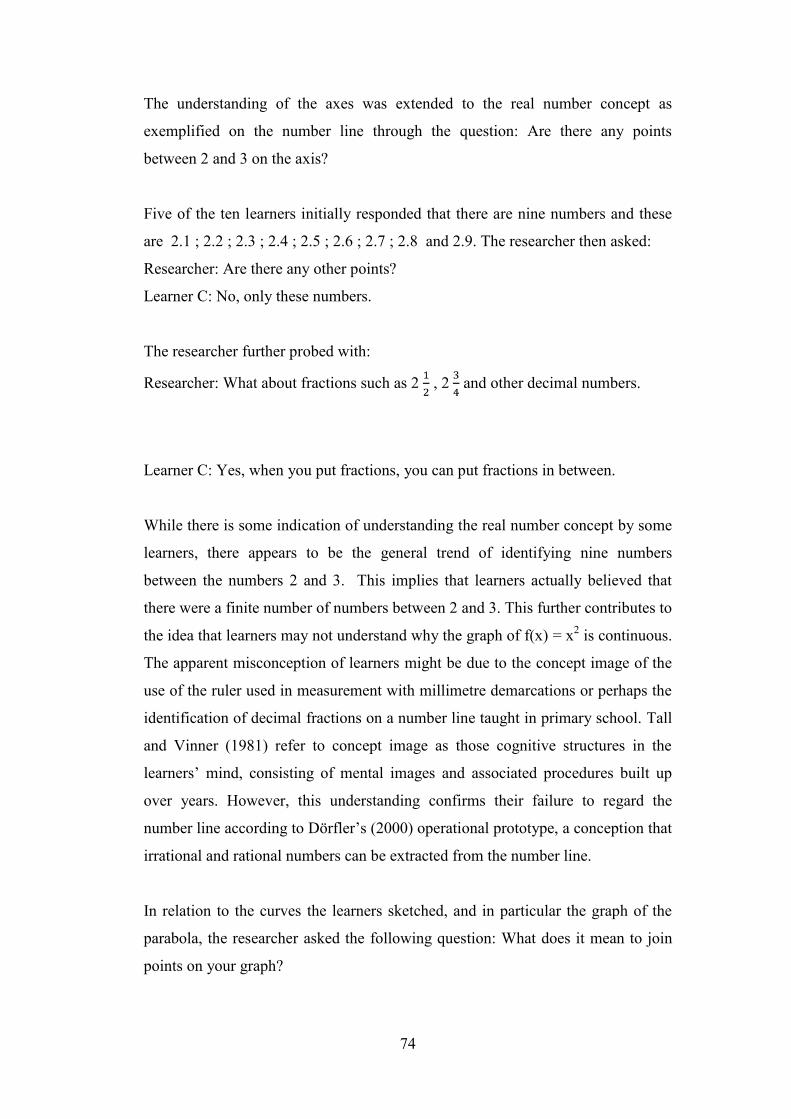
74
The understanding of the axes was extended to the real number concept as
exemplified on the number line through the question: Are there any points
between 2 and 3 on the axis?
Five of the ten learners initially responded that there are nine numbers and these
are 2.1 ; 2.2 ; 2.3 ; 2.4 ; 2.5 ; 2.6 ; 2.7 ; 2.8 and 2.9. The researcher then asked:
Researcher: Are there any other points?
Learner C: No, only these numbers.
The researcher further probed with:
Researcher: What about fractions such as 2 , 2 and other decimal numbers.
Learner C: Yes, when you put fractions, you can put fractions in between.
While there is some indication of understanding the real number concept by some
learners, there appears to be the general trend of identifying nine numbers
between the numbers 2 and 3. This implies that learners actually believed that
there were a finite number of numbers between 2 and 3. This further contributes to
the idea that learners may not understand why the graph of f(x) = x2 is continuous.
The apparent misconception of learners might be due to the concept image of the
use of the ruler used in measurement with millimetre demarcations or perhaps the
identification of decimal fractions on a number line taught in primary school. Tall
and Vinner (1981) refer to concept image as those cognitive structures in the
learners‟ mind, consisting of mental images and associated procedures built up
over years. However, this understanding confirms their failure to regard the
number line according to Dörfler‟s (2000) operational prototype, a conception that
irrational and rational numbers can be extracted from the number line.
In relation to the curves the learners sketched, and in particular the graph of the
parabola, the researcher asked the following question: What does it mean to join
points on your graph?
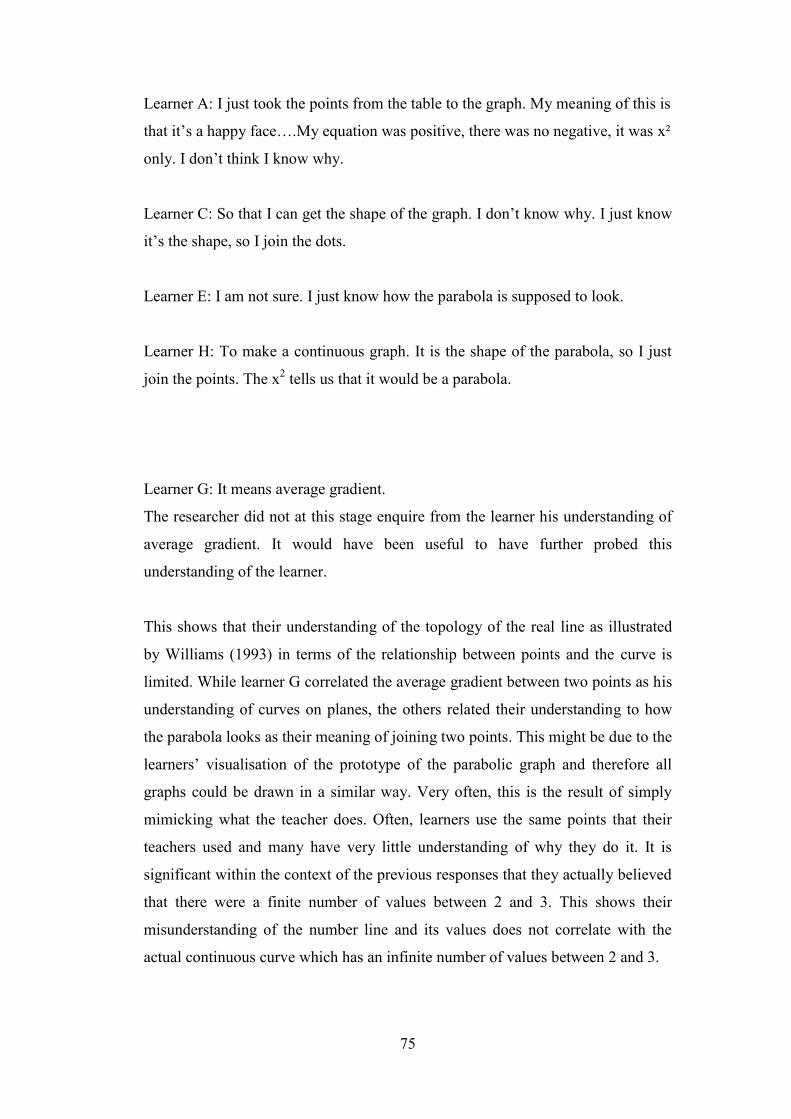
75
Learner A: I just took the points from the table to the graph. My meaning of this is
that it‟s a happy face….My equation was positive, there was no negative, it was x²
only. I don‟t think I know why.
Learner C: So that I can get the shape of the graph. I don‟t know why. I just know
it‟s the shape, so I join the dots.
Learner E: I am not sure. I just know how the parabola is supposed to look.
Learner H: To make a continuous graph. It is the shape of the parabola, so I just
join the points. The x2 tells us that it would be a parabola.
Learner G: It means average gradient.
The researcher did not at this stage enquire from the learner his understanding of
average gradient. It would have been useful to have further probed this
understanding of the learner.
This shows that their understanding of the topology of the real line as illustrated
by Williams (1993) in terms of the relationship between points and the curve is
limited. While learner G correlated the average gradient between two points as his
understanding of curves on planes, the others related their understanding to how
the parabola looks as their meaning of joining two points. This might be due to the
learners‟ visualisation of the prototype of the parabolic graph and therefore all
graphs could be drawn in a similar way. Very often, this is the result of simply
mimicking what the teacher does. Often, learners use the same points that their
teachers used and many have very little understanding of why they do it. It is
significant within the context of the previous responses that they actually believed
that there were a finite number of values between 2 and 3. This shows their
misunderstanding of the number line and its values does not correlate with the
actual continuous curve which has an infinite number of values between 2 and 3.
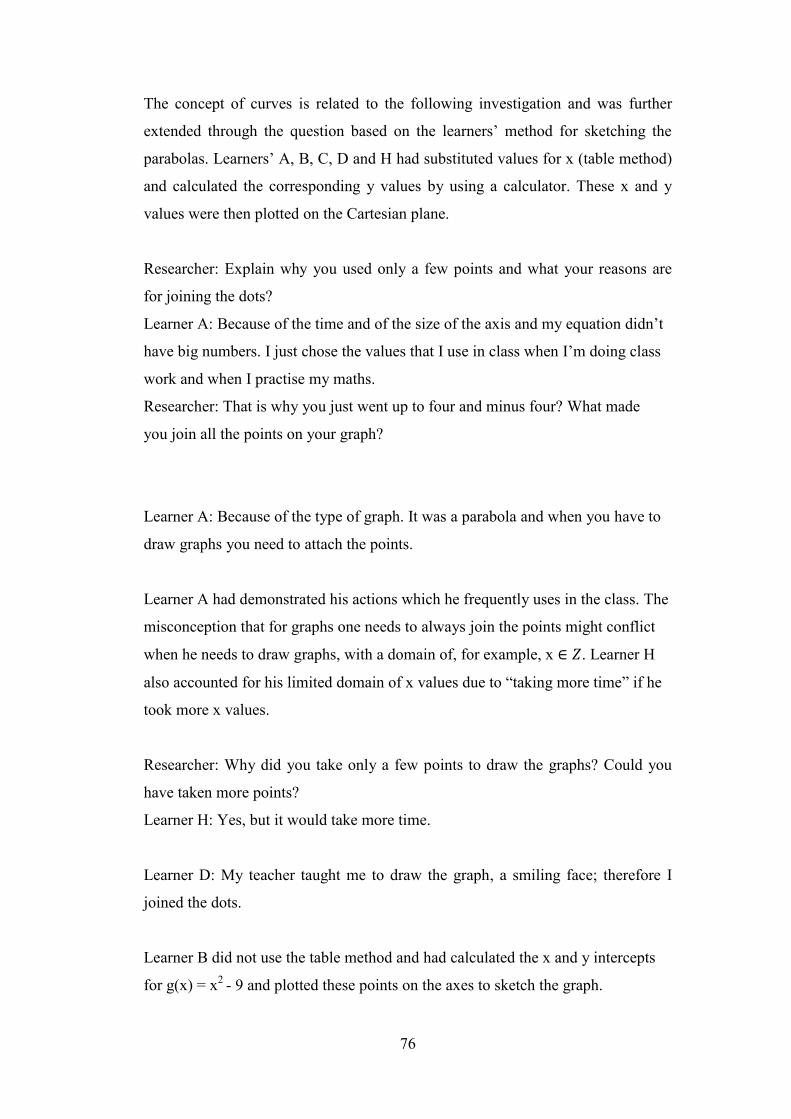
76
The concept of curves is related to the following investigation and was further
extended through the question based on the learners‟ method for sketching the
parabolas. Learners‟ A, B, C, D and H had substituted values for x (table method)
and calculated the corresponding y values by using a calculator. These x and y
values were then plotted on the Cartesian plane.
Researcher: Explain why you used only a few points and what your reasons are
for joining the dots?
Learner A: Because of the time and of the size of the axis and my equation didn‟t
have big numbers. I just chose the values that I use in class when I‟m doing class
work and when I practise my maths.
Researcher: That is why you just went up to four and minus four? What made
you join all the points on your graph?
Learner A: Because of the type of graph. It was a parabola and when you have to
draw graphs you need to attach the points.
Learner A had demonstrated his actions which he frequently uses in the class. The
misconception that for graphs one needs to always join the points might conflict
when he needs to draw graphs, with a domain of, for example, x . Learner H
also accounted for his limited domain of x values due to “taking more time” if he
took more x values.
Researcher: Why did you take only a few points to draw the graphs? Could you
have taken more points?
Learner H: Yes, but it would take more time.
Learner D: My teacher taught me to draw the graph, a smiling face; therefore I
joined the dots.
Learner B did not use the table method and had calculated the x and y intercepts
for g(x) = x2
- 9 and plotted these points on the axes to sketch the graph.
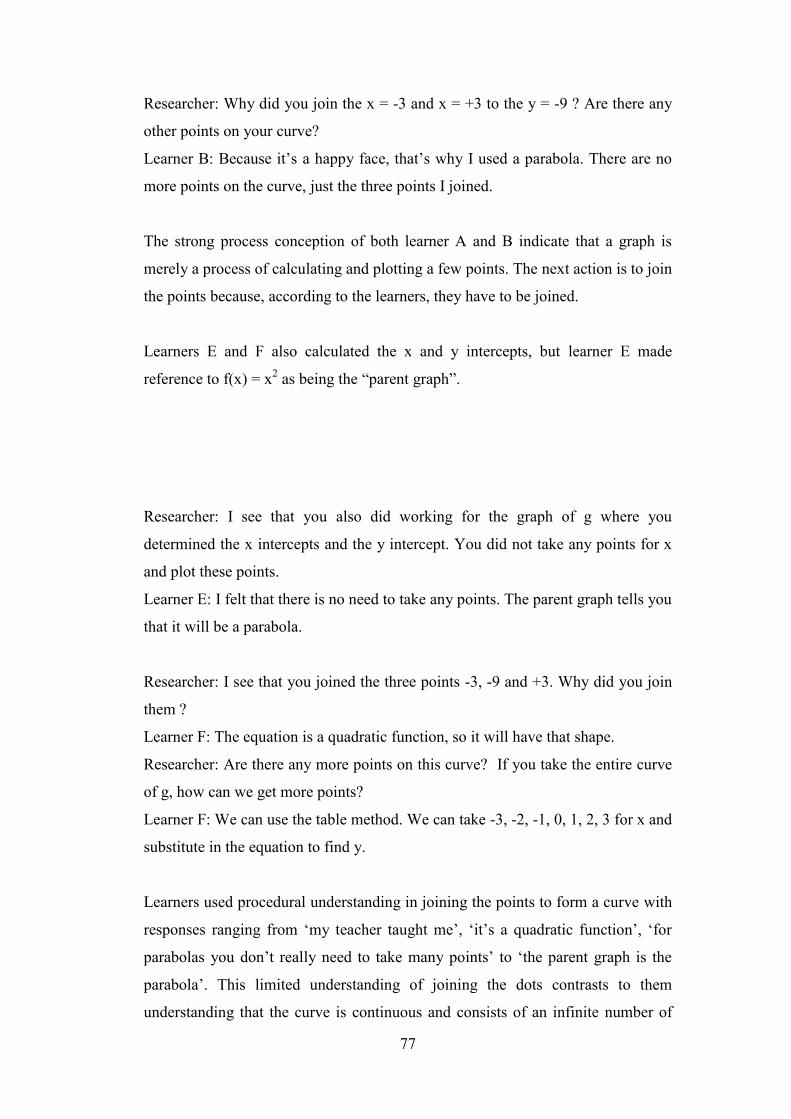
77
Researcher: Why did you join the x = -3 and x = +3 to the y = -9 ? Are there any
other points on your curve?
Learner B: Because it‟s a happy face, that‟s why I used a parabola. There are no
more points on the curve, just the three points I joined.
The strong process conception of both learner A and B indicate that a graph is
merely a process of calculating and plotting a few points. The next action is to join
the points because, according to the learners, they have to be joined.
Learners E and F also calculated the x and y intercepts, but learner E made
reference to f(x) = x2 as being the “parent graph”.
Researcher: I see that you also did working for the graph of g where you
determined the x intercepts and the y intercept. You did not take any points for x
and plot these points.
Learner E: I felt that there is no need to take any points. The parent graph tells you
that it will be a parabola.
Researcher: I see that you joined the three points -3, -9 and +3. Why did you join
them ?
Learner F: The equation is a quadratic function, so it will have that shape.
Researcher: Are there any more points on this curve? If you take the entire curve
of g, how can we get more points?
Learner F: We can use the table method. We can take -3, -2, -1, 0, 1, 2, 3 for x and
substitute in the equation to find y.
Learners used procedural understanding in joining the points to form a curve with
responses ranging from „my teacher taught me‟, „it‟s a quadratic function‟, „for
parabolas you don‟t really need to take many points‟ to „the parent graph is the
parabola‟. This limited understanding of joining the dots contrasts to them
understanding that the curve is continuous and consists of an infinite number of
78
points. However, though a strong visual understanding of the x2 allows them to
form a parabola, there is also the tendency of their action to be based on memory
or rote manipulation. Learner F exemplified the process level as stated by
Moschkovich et al (1993) when she explained substitution as a method of
identifying other points on the graph.
The procedural understanding was also ascertained when learners were asked how
they would determine f(3); f(4 and f(20) and also to show on their graphs what
this really means:
Researcher: Can you show me by means of your graph what you understand by
f(3) and where you would read off f(3)?
Learner A: I would plot it on the x axis between 0 and 5.
Researcher: Why are you plotting it on the x axis?
Learner A: Because it is the x value.
Researcher: And what does this mean?
Learner A: It is the x.
While learners B and D showed no understanding of f(3), learners E, F and G
when asked to show f(3) on the graph used analytical means and substituted x = 3
to obtain y = 9. When learners were asked to show f(4 they also pointed x = 4
on the x axis. However, when asked to show f(20) they responded that they might
have “ to extend the axis” or “we need to have a scale”.
Most learners were able to deduce that the 3, 4 and 20 represented the value for
x. However learners failed to understand that f(3) actually depicted the value for
y. According to Sfard (1991), learners possess a process conception of a function
more strongly than an object conception of the function. Although there might be
some resemblance to this, mistaking f(3) for 3 shows that the learner does not
understand the functional notation. While they could substitute 3 in f(x) = x2 and
get 9, they did not understand that this represented the co-ordinates (3; 9). Only
79
two of the ten learners could correctly show what this aspect of functional
notation meant with reference to the graph. Learners did not realise that there is no
need for scale or extending the axes when sketching graphical functional
representations.
Perhaps the use of a large figure f(20) prompted them to think in terms of scale.
They could hence, not explain adequately what f(4 meant and for the learners,
f(20) meant that they would have to extend the axis.
The understanding of the relationship between functional notation through
symbols and the corresponding correlation to graphs was also investigated through
the learners‟ responses:
Researcher: Explain the meaning of the values of x for which g(x) > 0 in
g(x) = x2 – 9. How did you arrive at the answer 2; 1; 0; -1; -2?
Learner A: I take the numbers from my table that are greater than 0.
Researcher: What are these numbers?
Learner A: It would be the y values greater than 0 and that would be 7.
Learner A had clearly not understood this question. However, he used the table
method to sketch the graph of g(x) = x2
- 9, by substituting x values and
determining the y values. So when x = 4, he deduced that y = 7. Therefore, he
replied that the answer is y = 7. However, there might be some indication that he
knew that g(x) represented the y values. This was in direct contrast to learner C
who listed positive whole numbers greater than zero.
Researcher: Explain the meaning of the values of x for which g(x) > 0?
Learner C: One, two three and so on.
Although learner E had the correct graphical understanding, the x < -3 was
incorrectly stated as x > -3.
Learner E: It would be where the x > 0. It would be positive answers.
80
Learner R: Why positive?
Learner E: Because it must be greater than zero. On the positive side of the x axis
we get positive answers and the graph is going up, so x > 3 and x > -3. For x > 3
we are going up and for x > -3 we are going up because we get positive y values.
However, learner G, who had also displayed a good graphical understanding for
g(x) > 0, failed to realise the meaning of the functional notation and replied as:
Learner G: For the x values less than -3 the y is greater than 0, and for the x values
greater than 3 the y is greater than 0.
Researcher: Why did you write your answer as 3 < x < -3?
Learner G: It‟s the same reason I told you sir.
The meaning of the functional notation was further probed in the question on the
interpretation of the trigonometric graphs (Appendix B - Worksheet 3) where
learners were asked to show on the given sketch of the graphs of f(x) = a sin b x
and g(x) = cos(x + q), the following: f(x) = g(x), f(x) > 0, g(x) > 0 and f(x) > g(x).
Many of the learners could indicate on the graph where the relationship f(x) = g(x)
occurs. However, when probed on how they would arrive at a solution to this
problem their responses varied:
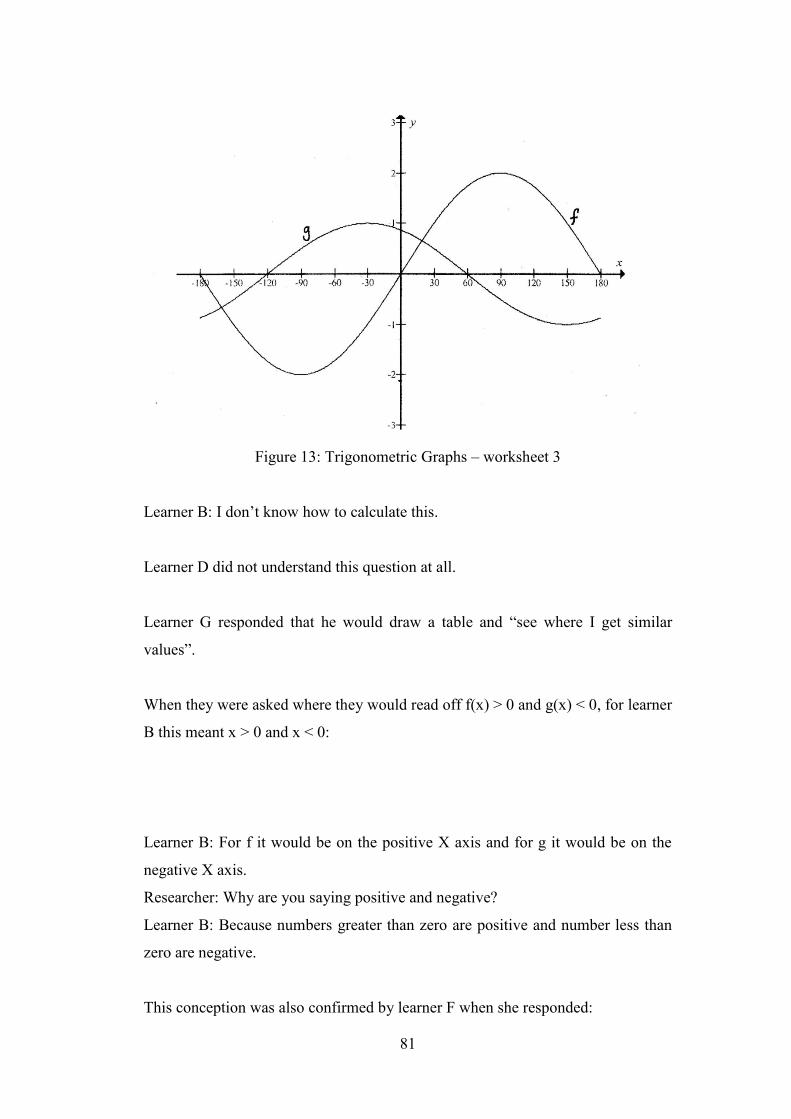
81
Figure 13: Trigonometric Graphs – worksheet 3
Learner B: I don‟t know how to calculate this.
Learner D did not understand this question at all.
Learner G responded that he would draw a table and “see where I get similar
values”.
When they were asked where they would read off f(x) > 0 and g(x) < 0, for learner
B this meant x > 0 and x < 0:
Learner B: For f it would be on the positive X axis and for g it would be on the
negative X axis.
Researcher: Why are you saying positive and negative?
Learner B: Because numbers greater than zero are positive and number less than
zero are negative.
This conception was also confirmed by learner F when she responded:
82
Researcher: And f(x) > 0?
Learner F: It‟s the part of the graph greater than 0 on the x axis, the x values.
Researcher: And g(x) < 0?
Learner F: It‟s the negative side of the axis.
However learners‟ E and G did show a good level of understanding of f(x) when
they responded that f(x) > 0 is “above the x axis”. Learner E was asked:
Researcher: How would you solve for f(x) > g(x)?
Learner E: It would be from the points of intersection where the f graph is above
the g graph?
Researcher: Why are you saying above?
Learner E: I learnt that when something is greater than the other, I just go to
where the first graph is greater than the other graph.
Researcher: What is your understanding of this?
Learner E: I do not know.
This shows that although learner E is correct in the analytical manipulation, she
lags behind in her graphical understanding. Although the learners provided
different conceptual views on f(x) = g(x), f(x) > 0, g(x) < 0 and f(x) > g(x); they
related the symbolic notation with the graphical representations.
5.3.2 Learners interpretation of the graphical terminology
In terms of graphical terminology, the use of words to convey meaning was
explored with reference to the graphical representations. The graphically related
words used were:
Increasing and decreasing.
83
Maximum and minimum.
Domain and range.
Asymptotes.
Gradient.
Reflection
Period
Learners where asked to describe the shape of their graphs. For f(x) = x2; they
used words such as “happy face, horse-shoe, smiling face, positive graph” to
illustrate their interpretation of the parabola. All of the learners assigned these
descriptions to the +x2. When asked to describe f(x) = -x
2 they used the words
“sad face and frown”. These depictions are similar to the metaphors that educators
use in mathematics classrooms.
Increasing and decreasing functions over a particular interval are applied in
algebraic and trigonometric graphs in Grade 10 and Grade 11. In Grade 12 this
aspect of graphical interpretation is extended to calculus in the section on curve
sketching. The understanding of increasing and decreasing functions over interval
periods is usually articulated as being dependent on the x value increasing from
the left of the number line. If the y values decrease, then the graph is decreasing
between x value intervals. If the y values increase, then the graph increases
between x value intervals. This concept is very much a visual skill.
Learners were asked: What does it mean when you say f(x) is increasing or
decreasing? Show on the graphs of f(x) = x2 and g(x) = x
2 - 9, where the graphs
are increasing or decreasing.
Learner A related increasing to positive x values and decreasing to negative x
values. The researcher categorises this as a misconception, due to the learner‟s
84
weak concept image of regarding increasing as positive numbers and decreasing
as negative numbers.
Researcher: Show me where your graph of f is increasing?
Learner A: It is increasing on the right hand side of the x axis.
Researcher: And where is it decreasing?
Learner A: On the left hand side.
Researcher: Why is it increasing on the right hand side and decreasing on the left?
Learner A: Because of the positive numbers on the right and the negative numbers
on the left.
Researcher: What do you mean by negative numbers on the left?
Learner A: The negative numbers decrease, therefore the graph decreases.
In this particular parabola the learner could not articulate the fact that the f(x)
increased as the x values decreased to the left of the zero. They did not understand
nor could they explain the fact that f(x) increased when x decreased to the left of
zero or when x increased to the right of the zero. Clearly f(x) increased as the x
values moved away from zero.
Learner H had related the concept of increasing to the graph pointing to positive
infinity on the y axis and decreasing when the graph points towards negative
infinity on the y axis.
Learner H: Yes, the f graph is increasing.
Researcher: Why do you say that the graph of f is increasing.
Learner H: It is going upwards, positive numbers.
Researcher: When would the graph be decreasing?
Learner H: When it is going downwards.
This misconception was also evident in the hyperbolic and exponential functions
(Worksheet 2 – Appendix B):
85
Learner A: For graph A, I don‟t know. For graph B it is increasing from the two
upwards on the right hand side of the axis.
Researcher: What about the left of the y axis?
Learner A: That is negative, so the graph is decreasing.
Learners B, C, D and E conceptualised „increasing as going up‟ and „decreasing as
going down‟. This shows the linguistic correlation and depicts a literal
configuration by interpreting the shape of the parabola as going up or coming
down. Learner F was able to provide the following visual explanation for
increasing and decreasing in f(x) = x2:
Learner F: The graph of f first decreases and then it increases.
Researcher: What makes you say that?
Learner F: If you take the f graph on the left hand side of the axis, it is decreasing
because the y values get smaller, like 10, 9, and 8 and so on. But on the right hand
side it increases because the y values increase from 0,1,2,3 and so on.
Researcher: What tells you that the graph is increasing or decreasing?
Learner F: The values of the y.
Researcher: Only the y values? What do you see in these y values?
Learner F: Yes, only the y values. I look at the graph from the left and notice that
as the graph comes down the y values decrease and as it goes up the y values
increase.
However, when classifying the hyperbolic and exponential graph as increasing or
decreasing, she provided a conflicting explanation.
Learner F: Graph A is increasing because it‟s going to the right. It‟s actually
decreasing on the y axis and increasing on the x axis. Graph B is increasing.
Researcher: Why is graph B increasing?
Learner F: Because of the way it‟s sloping. From decreasing it goes to increasing,
because the negative numbers are decreasing on the x axis and on the positive side
it‟s increasing.
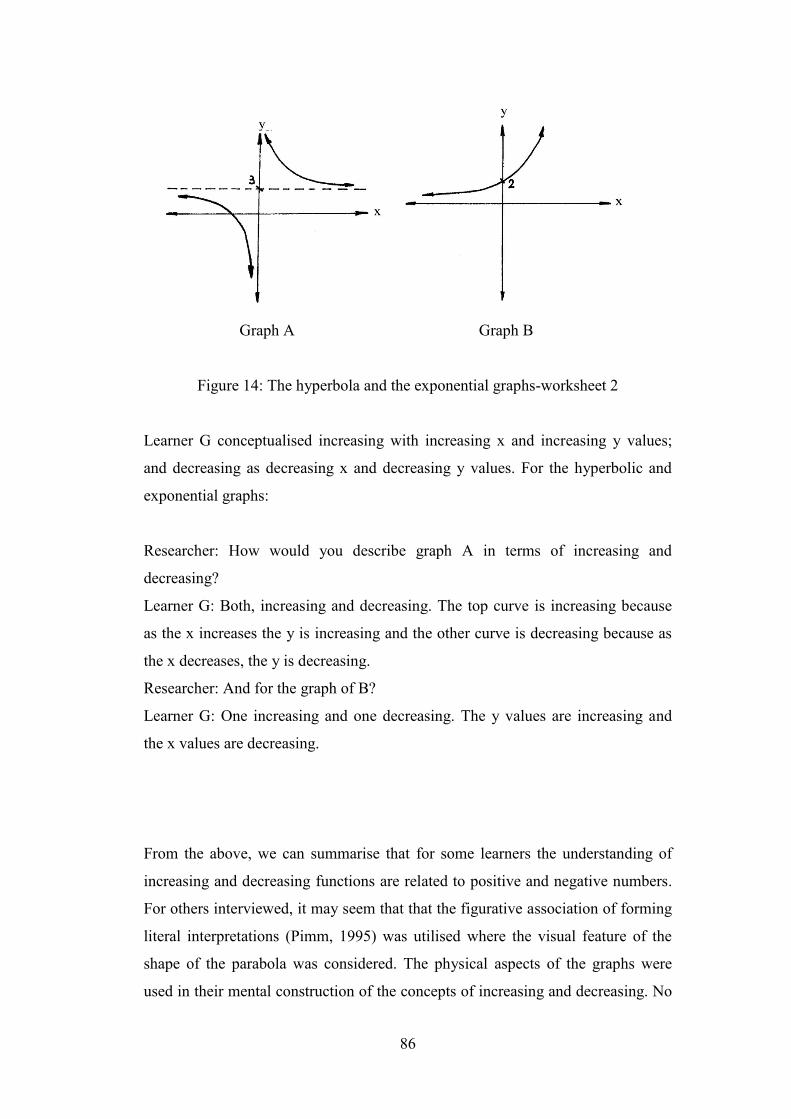
86
Graph A Graph B
Figure 14: The hyperbola and the exponential graphs-worksheet 2
Learner G conceptualised increasing with increasing x and increasing y values;
and decreasing as decreasing x and decreasing y values. For the hyperbolic and
exponential graphs:
Researcher: How would you describe graph A in terms of increasing and
decreasing?
Learner G: Both, increasing and decreasing. The top curve is increasing because
as the x increases the y is increasing and the other curve is decreasing because as
the x decreases, the y is decreasing.
Researcher: And for the graph of B?
Learner G: One increasing and one decreasing. The y values are increasing and
the x values are decreasing.
From the above, we can summarise that for some learners the understanding of
increasing and decreasing functions are related to positive and negative numbers.
For others interviewed, it may seem that that the figurative association of forming
literal interpretations (Pimm, 1995) was utilised where the visual feature of the
shape of the parabola was considered. The physical aspects of the graphs were
used in their mental construction of the concepts of increasing and decreasing. No
87
learner precisely stated that the graph increases as we move to the right and to the
left of the x axis. In other words, no response indicated a real understanding of the
function of f(x) = x2. Learners should have actually recognised that the graph
decreased as x increased from negative infinity to zero and increased from x equal
to zero 0 to positive infinity.
Although the notion of increasing and decreasing functions is very much a visual
judgement and linked to the physical features of graphs, the fixation of learners to
physical features of graphs was also noticed in the examination of the effect of the
words maximum and minimum on their graphical understanding. Learner E
viewed maximum and minimum in terms of the way the graphs were presented
and Learner F related the sign of the „a‟ in f(x) = ax2 + q in terms of the shape of
the graph.
Learner E: The graph is minimum because it is turning upwards. If it turns
downwards, then we will get a maximum turning point.
Learner F: The graph of g is minimum at y = -9 and the graph of f at zero.
Researcher: When can we describe the graph as maximum?
Learner F: When the equation is negative and the graph points downwards.
However, learner G used the terms “starting low” to refer to minimum and starting
“high and goes lower” to maximum.
Learner G: Yes, they are minimum graphs.
Researcher: Why do you say that?
Learner G: Because they are smiling face; they start at a lower point and goes
higher, the y value starts low and gets bigger.
Researcher: When would you get maximum?
Learner G: Maximum is the other way around, the frown.
Researcher: Can you explain the meaning of maximum in terms of your graph?
Learner G: The y value starts high and goes lower.
88
Learners had to state the domain for the graph of f(x) = x2 and the range for g(x) =
x2 – 9. From the statistical analysis conducted earlier learners showed limited
graphical understanding of these two concepts. It would seem that learners are
fixed on applying the domain as x R to any graphical representation, due to the
domain very frequently described as “all possible x values”. Where some learners
indicated that the domain for f(x) = x2 as being x , the same answer was given
when stating the domain for the hyperbolic function y = Learners appeared
to be fixed on the conception that the domain is always all the x values and that
the range is always the y values irrespective of how the graphs were drawn on the
Cartesian plane. The understanding of domain and range in terms of their graphs
is exemplified in various conceptual forms.
Learner A extracts the domain and range from the table.
Learner A: Domain is the x values. I just take it from my table.
Researcher: What do you understand by range?
Learner A: It‟s the y value. I just take it from my table.
Learners E and F explained the domain as “all possible x values” for f(x) = x2.
Although this is true, they could not explain what it means in terms of their
graphs, as values that satisfy the given function. Learner E explained that the
range for g(x) = x2 – 9 was given as y Z because “the range will be all the y
values”.
Learner F: x R, these include counting numbers, integers and not surds. I don‟t
know what it actually means in terms of the graph.
The learners understanding of asymptote was derived in terms of the graph A, the
hyperbolic function and graph B, the exponential function- (Refer to worksheet 2):
Learners displayed good memory imagery in identifying that the formula
89
y = represents the hyperbolic function and that the „q‟ stands for the
asymptote. The asymptote was identified as “the broken line”. When asked what
their understanding of asymptote was, the learners gave these responses:
Learner B: That the graph must not touch the line.
Learner G: The graph would go close to it but never touches it.
Learner H: The graph will go close to the asymptote and never touches it. The
asymptote is the q value in the equation.
This may be significant that learners associate the asymptote to the graph itself. In
reality the asymptote is an imaginary line that is really not part of the graph. There
is actually no need to construct this line. In terms of Vile‟s (1993) categorization
of low semiotic understanding, memorizing q as the asymptote and that the
asymptote is a line that the graph will not touch, denotes low understanding. There
was no evidence of any conceptual understanding for the asymptote. The
misunderstanding of the asymptote was also evident when learner A classified the
x and the y axis as being asymptotes of graph B. This might be due to the
correlation with the asymptotes of y = .
Researcher: For the equation of the graph of A, why did you write 3 for q?
Learner A: It is the asymptote. The equation says qx
k, the q stands for the
asymptote.
Researcher: What do you understand by asymptote?
Learner A: If q is positive the broken line will be by positive 3.
Researcher: Can you show me any other asymptotes?
Learner A: Yes. The x and the y, the original, are the asymptotes for graph A. The
x and y are also the asymptotes for graph B.
Researcher: Why are the curves not touching the x axis?
90
Learner A: I don‟t know why. The broken line means the graph shifted.
Learner C interpreted the asymptote as an indication that the graph is not
continuous.
Learner C: It must be a dotted line. It cannot be a straight line. The graph won‟t
carry on; it‟s where the graph has got to end.
There is a distinct difference in the way each of the learners A and C understood
the idea of an asymptote. Whilst neither showed an understanding of what an
asymptote represented, learner C thinks that an asymptote is the end of a graph.
Learner C can correctly recognise or draw the graph, but her understanding of the
asymptote is poor. There is a tendency of learners to learn mathematics by rote
with little understanding of their actions. Perhaps their understanding of the
asymptote arises from the description they encounter in text books. Goba and van
der Lith (2005) in a Grade 10 mathematics text book describe the asymptote “as a
line that the graph approaches but never meets, shown as a dotted line”. This idea
that the asymptote is always a dotted line bears consequences on the learners‟
understanding as depicted by learner H. Although graph A contained two
asymptotes, y = 3 and x = 0 and graph B one asymptote, y = 0, learner H was
fixed on the dotted line:
Researcher: How many asymptotes are there in graph A?
Learner H: Only one, the dotted line.
Researcher: Are there any asymptotes in graph B?
Learner H: No, there are no asymptotes.
Most of the interviewed learners indicated that the graph does not have a gradient
and that gradient was only associated with straight line graphs. This probably
stems from the idea that gradient is the same as slope and slope is then associated
with, for example, the incline of a hill. However, calculating the slope with the
lower grades has always been associated with straight lines. Two of the learners
91
did allude to the idea of an average gradient as an understanding of points on the
graph, but this was not clear.
Learner E: Gradient is used for straight line, but you can get average gradient.
Researcher: What does average gradient mean?
Learner E: You can take any two points and find the average gradient.
Researcher: What does the gradient mean?
Learner E: The distance, maybe. I just know the formula we use to find gradient.
Researcher: You say that this graph does not have a gradient?
Learner E: No, it does have a gradient. It has an average gradient.
This procedural interpretation of gradient was confirmed by learner G:
Researcher: Can you explain gradient by means of your graph?
Learner G: You take any two points and substitute into the gradient formula.
Researcher: Where would the gradient be equal to zero?
Learner G: At the origin for the graph of f, because the y value is zero and for the
graph of g at y = -9.
Researcher: Why at y = -9?
Learner G: I don‟t know.
Learner F had correlated the gradient with the arrows on the graph. The learner
probably interpreted the arrows going upwards as an increasing graph and
therefore the gradient is positive. The gradient of the linear function y = m x + c
was also related to the „a‟ in y = a x2.
Learner F: Because the gradient is positive, so it points upwards. If the gradient is
negative it will point downwards.
Researcher: What does gradient mean?
Learner F: The gradient means the slope. For the parabola graph it means the way
the graph is pointing (the researcher‟s emphasis).
Researcher: What is the gradient of y = x2?
92
Learner F: It is one… the number in front of x2.
In a straight line graph the arrow would indicate the continuation of the graph in
an identical way as it has done previously. It could be interpreted as the
continuation of the gradient as well. Hence, by extrapolation, the learner assumed
that all arrows on graphs indicate the continuation of the gradient. Learners
responded in various ways to the concept of gradient. A procedural understanding
was displayed when gradient meant substituting the co-ordinates into the gradient
formula. For others, it referred to the distance on the curve, the arrows on the
graph or the shape of the graph. All of these reflect that learners do possess a low
conceptual understanding of gradient.
The metaphoric implication of „reflection‟ in graphical representations was
highlighted through the „mirror-image‟ analogy, but emphasized by the learners
through the positive and negative signs expressed in formulas.
Researcher: With regards to the reflection of g(x) = x2
- 9 in the x axis, how did
you arrive at -x² + 9?
Learner A: The reflection must be the opposite. It‟s a sad face.
Learner A draws the graph of the reflection correctly without a table.
Researcher: What helped you to get this answer?
Learner A: The signs. Because of the positive in x² the reflection would be a
negative. The negative in the equation helped me to draw the sad face. I just used
the equation to get the reflection.
Learner B: The shape. The reflection of the happy would be the sad, that‟s why I
got y = -x² + 9.
Learner F: When the graph is reflecting, it is a mirror image. The signs are
opposite x2- 9, that means that the graph will be sloping the other way and the y
intercept will be +9. Instead of being a happy face, it will be a frown face.
Researcher: What helped you to get the answer?
Learner F: I just changed the signs around.
93
Researcher: What do you understand by reflection?
Learner G: It is still the same image but the other side of it.
Researcher: How did you get your answer for the reflection of g(x) = x2 - 9?
Learner G: When you reflect the g graph, it becomes sad and you just change the
signs, negative becomes positive and positive becomes negative.
Researcher: How did you get the reflection for the graph of B?
Learner G: I looked at the graph and folded on the y axis.
Learner G drew the reflection of the exponential graph B using a visual process.
The visual implication of reflection was further highlighted by Learner H who
understood reflection to be “upside down”. It would have been interesting to have
probed the idea of having a reflection of g(x) = x2 – 9 along line y = -9. This could
have perhaps indicated the learners‟ actual visual understanding of reflections.
However, for learners A, F and G the signs in the equation helped them to derive
the equation of the reflection. For learner B it was the shape of the graph that
assisted her. This indicates that both the formula and the graphical forms assist
learners in their visual understanding.
The understanding of reflection as a method of changing the signs was used for
the reflection of y = a.bx
for graph B in worksheet 2 by both learners A and F.
Both had drawn the reflection in the x axis when the question wanted the
reflection in the y axis.
Learner A: I changed the positive two on the y axis into negative two on the y
axis.
Learner F: I just did the same as previously. I just changed the signs.
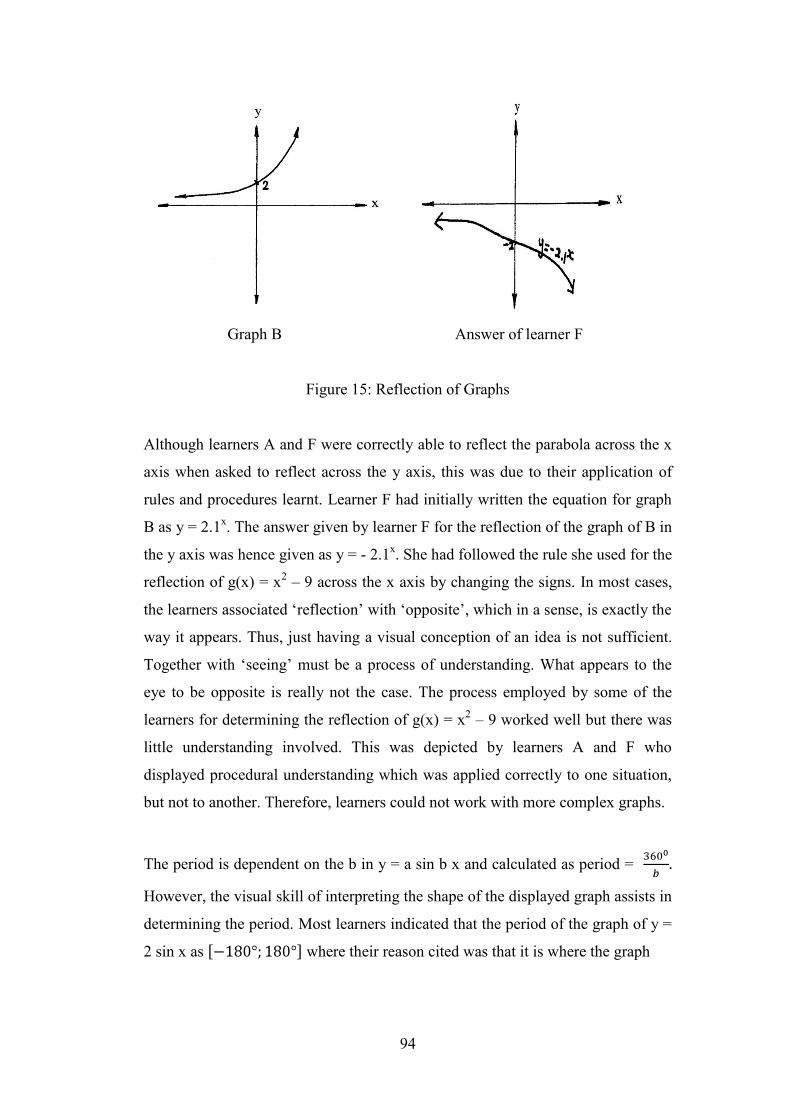
94
Graph B Answer of learner F
Figure 15: Reflection of Graphs
Although learners A and F were correctly able to reflect the parabola across the x
axis when asked to reflect across the y axis, this was due to their application of
rules and procedures learnt. Learner F had initially written the equation for graph
B as y = 2.1x. The answer given by learner F for the reflection of the graph of B in
the y axis was hence given as y = - 2.1x. She had followed the rule she used for the
reflection of g(x) = x2 – 9 across the x axis by changing the signs. In most cases,
the learners associated „reflection‟ with „opposite‟, which in a sense, is exactly the
way it appears. Thus, just having a visual conception of an idea is not sufficient.
Together with „seeing‟ must be a process of understanding. What appears to the
eye to be opposite is really not the case. The process employed by some of the
learners for determining the reflection of g(x) = x2 – 9 worked well but there was
little understanding involved. This was depicted by learners A and F who
displayed procedural understanding which was applied correctly to one situation,
but not to another. Therefore, learners could not work with more complex graphs.
The period is dependent on the b in y = a sin b x and calculated as period =
However, the visual skill of interpreting the shape of the displayed graph assists in
determining the period. Most learners indicated that the period of the graph of y =
2 sin x as where their reason cited was that it is where the graph
95
starts and where it ends. Learner H regarded the period as the “length of the
graph”. The following learners who indicated that the period was 360° related the
shape of the sine graph to a “wave cycle”:
Learner E: The parent graph starts at 0o and ends at 360
o. This graph starts at
-180o and ends at 180
o. So the period is 360
o.
The omission here is the fact that there is one complete cycle. Although this was
not mentioned, learner E had correctly stated the period. However the researcher
should have probed this understanding further with for example y = 2sinx, with
the domain [-180°; 180°].
Learner F: There is one wave cycle from -180° to +180° and it covers 360°.
Learner G: The graph starts at -180°and ends at 180° and that gives 360°, the
period for the sine graph is 360°.
It is perhaps a direct association to the domain in which they were expected to
draw their graphs. The researcher cannot hypothesise what their responses would
have been had the domain been [-180°; 270°].
5.3.3 The effect of graphical representations on learners’ visual literacy
skills
The effects of f(x) = x2 and g(x) = x
2 - 9 as symbols of mathematical instructions,
evoked in many learners the use of the table method of substituting x values to
obtain y values. Hence they plotted the co-ordinates on the Cartesian plane to
sketch the graphs. This appears to be procedural understanding. However, learner
E referred to y = ax2 and y = as „parent graphs‟ that she would always use or
picture in her mind” to draw and analyse the characteristics of y = ax2
+ q and
y = .
96
Researcher: Can you explain to me how you drew the graphs of f and g? I see that
you did not show any working for the graph of f.
Learner E: First I pictured the parent graph; the parabola in my head...the x2
indicated that it would be a parabola. I knew how the parent graph looks.
Researcher: Why is the graph of f turning at 0?
Learner E: It is the parent graph. My teacher told me that the parent graph will
always cut at 0 and if you have a -9 like the second graph it is a vertical shift; that
is why I started the second graph at -9.
Researcher: Why did you select graph A for 1.1?
Learner E: It‟s the hyperbola. I used the parent graph x
1 and this sign says that it
is x
k. I knew that it was this graph. For all graphs, we get it from the parent graph.
You can picture it in your mind and then you look at the shifts.
It is interesting to note that when learner A was asked to sketch the reflection of
g(x) = x2 – 9 in the x axis which he correctly indicated as y = -x
2 + 9, he did so
without a table (the researcher‟s emphasis), but when questioned initially on the
use of the tabular form of sketching f(x) = x2 and g(x) = x
2 - 9:
Researcher: Could you have drawn the graphs without the table?
Learner A: Yes, but it would be difficult.
Researcher: Why do you say difficult?
Learner A: The table shows clearly the points.
Researcher: Do you think the points are important?
Learner A: Yes, they are important.
The role of visual clues in co-ordinating visual sequences is an important feature
of visual literacy. Arcavi (2003) refers to visually-moderated sequences (VMS) as
a continuous process between visual clues (V) and procedures (P). The following
data, though not depicting a continuous process may identify with VMS. For
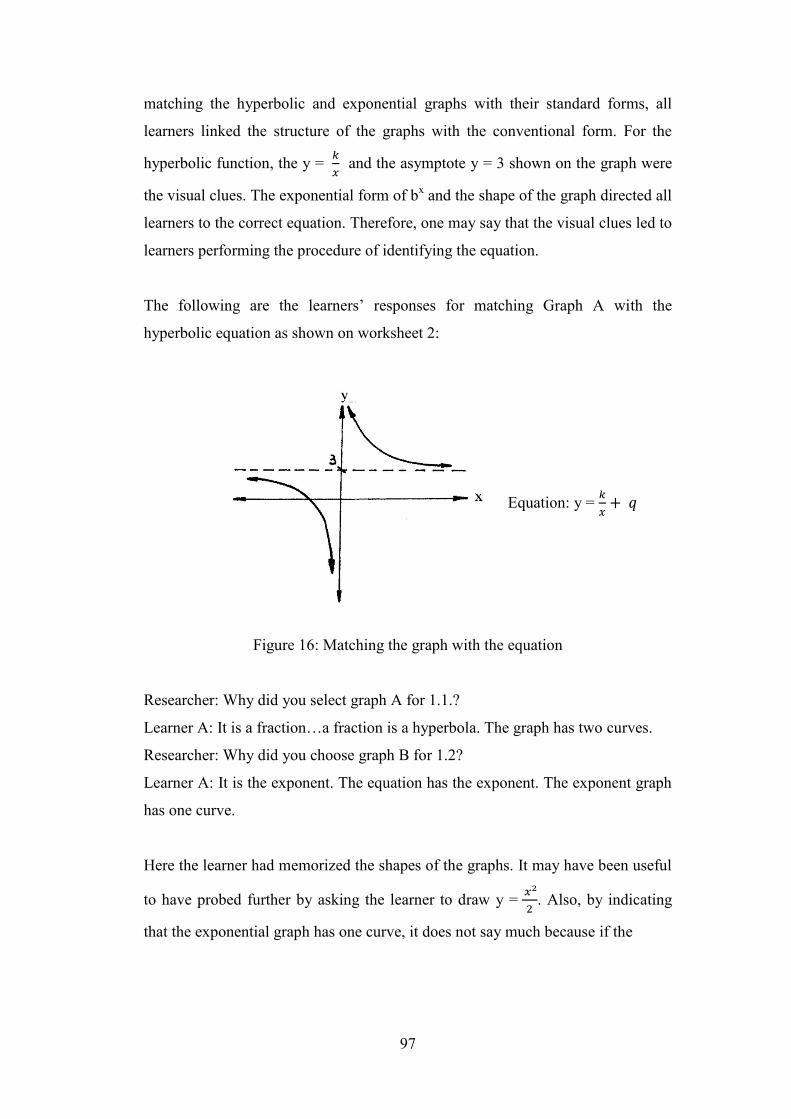
97
matching the hyperbolic and exponential graphs with their standard forms, all
learners linked the structure of the graphs with the conventional form. For the
hyperbolic function, the y = and the asymptote y = 3 shown on the graph were
the visual clues. The exponential form of bx and the shape of the graph directed all
learners to the correct equation. Therefore, one may say that the visual clues led to
learners performing the procedure of identifying the equation.
The following are the learners‟ responses for matching Graph A with the
hyperbolic equation as shown on worksheet 2:
Equation: y =
Figure 16: Matching the graph with the equation
Researcher: Why did you select graph A for 1.1.?
Learner A: It is a fraction…a fraction is a hyperbola. The graph has two curves.
Researcher: Why did you choose graph B for 1.2?
Learner A: It is the exponent. The equation has the exponent. The exponent graph
has one curve.
Here the learner had memorized the shapes of the graphs. It may have been useful
to have probed further by asking the learner to draw y = . Also, by indicating
that the exponential graph has one curve, it does not say much because if the
98
hyperbola was drawn with a limited domain, only one half of the graph could have
been drawn.
Learners C, D and F made use of the asymptotes:
Learner C: Because there‟s an asymptote.
Learner D: Because you get a broken line.
Researcher: What indicated to you that it is a hyperbolic function?
Learner F: The graph and the equation.
Researcher: What in the graph assisted you?
Learner F: Because of the way it is shaped, and it has two asymptotes.
Researcher: Which are the asymptotes?
Learner F: 3, the q value and the y axis, x = 0
Researcher: So, you indicated what helped you in the graph. What in the equation
is related to the graph?
Learner F: I don‟t know.
The role of visual clues was further evident in the identification of the equations
of trigonometric graphs f(x) = a sin bx and g(x) = cos(x + q) on worksheet 3 in
Annexure B. When given the sketch of these graphs they elicited these various
conceptual responses:
Researcher: How did you arrive at your answers for the equations of f and g? How
did you get a = 2 and b = 1 for the graph of f?
Learner A: The graph turns at y = 2. The wave, the curve just turns at two. I got
the information from the graph…from 90°. The b = 1 because the graph did not
shift.
Learner B: Because of the amplitude.
Researcher: How did you get the answer a = 2 for graph f?
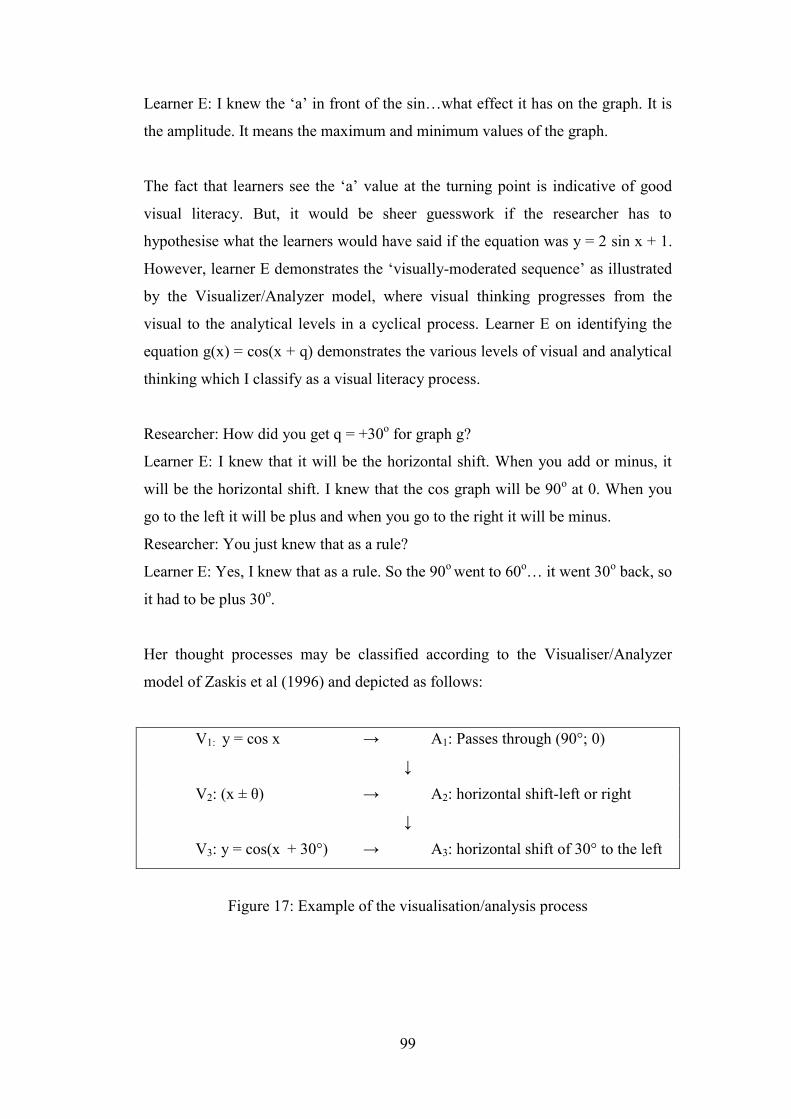
99
Learner E: I knew the „a‟ in front of the sin…what effect it has on the graph. It is
the amplitude. It means the maximum and minimum values of the graph.
The fact that learners see the „a‟ value at the turning point is indicative of good
visual literacy. But, it would be sheer guesswork if the researcher has to
hypothesise what the learners would have said if the equation was y = 2 sin x + 1.
However, learner E demonstrates the „visually-moderated sequence‟ as illustrated
by the Visualizer/Analyzer model, where visual thinking progresses from the
visual to the analytical levels in a cyclical process. Learner E on identifying the
equation g(x) = cos(x + q) demonstrates the various levels of visual and analytical
thinking which I classify as a visual literacy process.
Researcher: How did you get q = +30o for graph g?
Learner E: I knew that it will be the horizontal shift. When you add or minus, it
will be the horizontal shift. I knew that the cos graph will be 90o at 0. When you
go to the left it will be plus and when you go to the right it will be minus.
Researcher: You just knew that as a rule?
Learner E: Yes, I knew that as a rule. So the 90o went to 60
o… it went 30
o back, so
it had to be plus 30o.
Her thought processes may be classified according to the Visualiser/Analyzer
model of Zaskis et al (1996) and depicted as follows:
V1: y = cos x → A1: Passes through (90°; 0)
↓
V2: (x ± θ) → A2: horizontal shift-left or right
↓
V3: y = cos(x + 30°) → A3: horizontal shift of 30° to the left
Figure 17: Example of the visualisation/analysis process
100
The above learner first experiences (V1), the external image of y = cos x. This
mental formation directs her thoughts to an internal analytical process A1 by
deducing that the x intercept is (90°; 0). In the subsequent phase (V2), the addition
sign in (x ± θ) is the focal point that indicates the transformation of the graph (A2).
In the following phase, the learner visualises the horizontal shift in relation to y =
cos(x + 30°) advancing to 60° (V3) and prompts her to construct +30° to the left
(A3).
The following procedure illustrated by learner F, though erroneously indicating
that the equation was g(x) = cos (x + 60°), depicts visual and analytical processes
similar to that of learner E.
Researcher: For the graph of g, how did you get q = +60°?
Learner F: First I took cos x, it would be one wave cycle passing through the
origin. But now it shifted and it‟s on 60°. So, it shifted 60°. I took +60° because of
the plus in the equation.
The transformation of graphs includes translating, reflecting and rotating graphs
on the Cartesian plane. The researcher discussed reflection as a visualisation tool
earlier. In the following discussion, the researcher provides insight into the
learners‟ understanding of translating graphs in relation to the graphs f(x) = x2 and
g(x) = x2
- 9:
Researcher: I see you drew separate tables for f and g. Is there a relationship
between f and g?
Learner A: Yes the x². The both are parabolas.
Researcher: Can I get the graph of g from the graph of f?
Learner A: Yes, from f(x) you just have to minus nine.
Researcher: Let‟s say I gave you the f(x) graph and I told to use this to draw the
g(x), what would you do?
Learner A: I‟ll still use the table; just take the domain I used for f.
Researcher: Can you see the relationship with the minus nine.
Learner A: Yes, the minus nine makes the graph go down by nine units.
Researcher: Is there any need still for your table?
101
Learner A: Yes, there is a need.
It is necessary to note that this learner learnt the drawing of graphs in a very
procedural way (he had to use tables), although he might have done so for
accuracy. This is despite the fact that he knew that “you have to minus 9”. Most of
the other learners had good symbol-sense for firstly, the x2 depicting the parabola,
secondly that the y intercept is -9 derived from the equation y = x2
- 9 and thirdly
adding or subtracting a number at the end of the equation meant a vertical shift of
the graph. However, as with learner A and many of the other learners, the
sketching of graphs was done using the table of values. This might still be due to
what Janvier (1987) described as translating from tabular to graphical, a process
that is largely emphasised in mathematics classrooms.
Learner F: Yes, the f(x) does not have a y intercept. It is in the form y = ax2 and
the g(x) has a y intercept and is in the form y = ax2 + c.
Researcher: Now, tell me, can we get the graph of g from the graph of f?
Learner F: Yes, you‟re transforming it. You just draw it below that.
Researcher: But why did you not do this after you sketched f(x). You should have
transformed it then.
Learner F: I did not think of that.
Although this is not clearly stated, the learner recognised that it was a
transformation and it lay below. A closer look at Learner G, who had also used a
table of integer x values from -5 to +5 for f(x) = x2, shows us the various ways
learners want to transform graphs.
Researcher: Can I draw the graph of g from the graph of f?
Learner G: Yes, for the f graph there‟s no x intercepts and y intercepts. The y
intercept of g is -9. You decrease all the points on the f graph by +9. The 25
comes down to 16, the 16 comes down to 7 and so forth.
Translation as a visual skill was further evident when learners had to state the new
range of the graph of f(x) = 2 sin x after it underwent a vertical shift of 1 unit.
While learner A used the range of [2;-2] to assist in arriving at the new range of
[3;-1], learner F used the graph:
102
Researcher: What assisted you in getting the new range for f in question two?
Learner F: I used the graph. When we get a vertical shift the graph moves up one
unit, the -2 becomes -1 and the 2 becomes 3.
Researcher: Can you write down the new equation of f?
Learner F: It will be y = 2sinx +1.
On examination of the visualisation processes that learner F engaged in, the
Visualizer/Analyzer model is suitably aligned to the cognitive processes. To be
able to arrive at the equation after transformation, the following steps might be
apparent:
V1: y = sin x → A1: amplitude and wave cycle
↓
V2: y = 2 sin x → A2: vertical shift of 1
↓
V3: y = 2sin x + 1
The learner‟s first external picture was the trigonometric equation. The equation y
= sin x resulted in the analysis of amplitude and wave cycle. This made the learner
advance to the image of a vertical shift of one unit which resulted in the
manipulation of the graph to deduce the new range. The learner then visualised the
image of the function of y = 2 sin x together with the vertical shift, to arrive at the
equation of the new function.
5.3.4 A semiotic analysis
The signs and symbols that learners experience in graphical representations,
referred to as the representamen according to Peirce‟s Triadic model, are sign
vehicles that convey meaning to learners (Presmeg, 2008; Chandler, 2002). In the
following analysis in table 3, a summary of some of the previous results is
provided. This is according to the representamen, object and interpretant levels of
Peirce. The interpretant column consists of the learners‟ interpretations and
meanings of the signs they encounter in graphical representations.
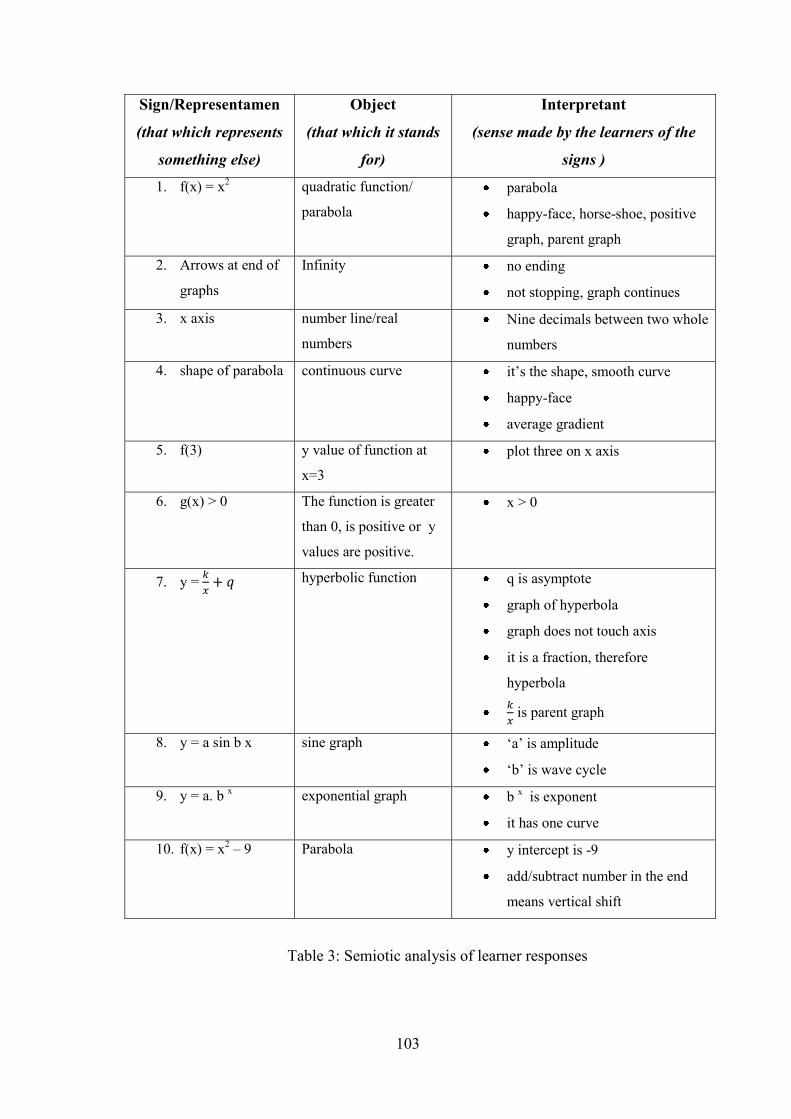
103
Sign/Representamen
(that which represents
something else)
Object
(that which it stands
for)
Interpretant
(sense made by the learners of the
signs )
1. f(x) = x2
quadratic function/
parabola
parabola
happy-face, horse-shoe, positive
graph, parent graph
2. Arrows at end of
graphs
Infinity no ending
not stopping, graph continues
3. x axis number line/real
numbers
Nine decimals between two whole
numbers
4. shape of parabola continuous curve it‟s the shape, smooth curve
happy-face
average gradient
5. f(3) y value of function at
x=3
plot three on x axis
6. g(x) > 0 The function is greater
than 0, is positive or y
values are positive.
x > 0
7. y = hyperbolic function q is asymptote
graph of hyperbola
graph does not touch axis
it is a fraction, therefore
hyperbola
is parent graph
8. y = a sin b x sine graph „a‟ is amplitude
„b‟ is wave cycle
9. y = a. b x exponential graph b
x is exponent
it has one curve
10. f(x) = x2 – 9 Parabola y intercept is -9
add/subtract number in the end
means vertical shift
Table 3: Semiotic analysis of learner responses
104
The object perspective of the Triadic model resembles the concept definition of
Tall and Vinner (1981) that is based on rules, laws and definitions that delineates
mathematical truths. Vile (1993) refers to the process of semiosis as a continuous
cycle where the interpretant develops into another sign and the semiotic cycle
resumes. The response provided by learner E to sketch the graphs of f(x) = x2 and
g(x) = x2 – 9 depicts this semiotic cycle:
Learner E: First I pictured the parent graph; the parabola in my head...the x2
indicated that it would be a parabola. I knew how the parent graph looks.
Researcher: Why is the graph of f turning at zero?
Learner E: It is the parent graph. My teacher told me that the parent graph will
always cut at zero and if you have a -9 like the second graph it is a vertical shift;
that is why I started the second graph at -9.
The first sign she experiences is the f(x) = x2, where the object is the quadratic
function and this leads her to deduce that it will be a parabola. However, upon
proceeding to g(x) = x2 - 9, the previous interpretation becomes the sign whereby
she relates this to the parent graph f(x) = x2. The object of the graph of g is to
translate f(x) which she interprets as shifting the graph nine units down. The
influence of semiotic behaviour is further noticed when learners interchange
between the equation and graph when making deductions. This was evident when
learners matched the equations of the hyperbola, exponential and the
trigonometric graphs to the semiotic character of the way these graphs were
presented. For example, relating the „broken line‟ with the asymptote, the with
the „fraction‟ and then the to the shape of the graph are semiotic cognitive
structures that impact on visual literacy. Therefore, the sign vehicles are
significant components of visual literacy.
The semiotic behaviour of the learners might be due to the effect of the iconic,
indexical and symbolic nature of the signs and symbols as presented in graphical
representations. The iconic effect occurs when the f(x) = x2 was related to the
105
parabola due to the shape and structure of the formula. The same sign invoked the
table method when learners substituted values for x to draw the graph. This
depicts the directional, indexical approach. The symbolic mode is depicted as of
the learners‟ cognitive structure. The iconic mode forms a significant part of the
learners‟ cognitive domain. The structure of y = y = a.bx, y = a sin b x and
y = cos (x + q) influenced their visual thinking. In terms of the taxonomy of
inscriptions of Marcou and Gagatsis as cited by Presmeg (2008), the descriptive-
depictive dichotomy as representative of the symbolic and iconic modes, plays a
key role in the learners semiotic actions.
Iconic signs are distinguished as they appear in images, diagrams and metaphors.
The researcher classifies some of the learners‟ responses in terms of the imagery
identified by Presmeg (2006). Concrete imagery is depicted in many of the
learners understanding of graphs. Some of these include the effect of the physical
structure of the Cartesian plane, the shape of graphs and the structure of the
equations. A further example is the recognition of the parabola by the presence of
x2. Pattern imagery is evident when learners formed relationships between the
graph of f(x) = x2 and g(x) = x
2 – 9 and between y = and y = . The use of
memory imagery by learners also largely influenced their level of understanding.
The rote application of the table method to sketch graphs, the identification of q as
the asymptote, memorising the various equations and the changing of signs in the
equation to determine the reflection of graphs denote aspects of memory imagery.
Lastly kinaesthetic imagery, where learners moved images with the sense of sight
assisted in their visual analysis. The determination of the new range of f(x) = 2 sin
x when f(x) made a positive vertical shift of one unit, engaged learners in a
physical manipulation of the graph with the corresponding amplitude change to
arrive at [3;-1].
The iconic characteristic of metaphorical imagery was apparent in the learners‟
interpretation of the various metaphors. Metaphors, according to Presmeg (2008),
link two domains by providing meaning to one domain through the similarity of
106
the other domain. The use of the words increasing, decreasing, maximum,
minimum and reflect provide conceptual understandings in learners through
concrete, analogous structures. Metaphors such as the „mountain is maximum‟ or
the „valley is minimum‟ can be related to the concept image the learners possess
of maximum as „start high and goes lower‟ or „turning downwards‟. The metaphor
that the „mirror-image is a reflection‟ assists learners to visually transform graphs
on the Cartesian plane.
5.3.5 Semiotic mediation
Semiotic mediation takes place within the context of the socio-cultural theory. The
use of words, symbols, diagrams, graphs and schemas underline the significance
of social activity as a key instrument of learning and conceptualisation as
exemplified by Vygotsky (Berger, 2006). The use of words in mathematical
communication, the meaning of mathematical truths as displayed in text materials
and the signs and psychological tools constitute semiotic mediation. This therefore
suggests that the learners‟ interpretation of graphs also be scrutinized according to
these lines. That language occupies a crucial component of their understanding of
graphs is evident in their description of the various characteristics of graphs which
have been alluded to in the previous analyses. The use of language mediated the
sign with their internal cognitive structure. Their conceptual understanding of the
structure of arrows on graphs was mediated through the arrows pointing upwards,
therefore as learner A indicated “the graph is going up, there is no ending”.
Learner B when asked how she would arrive at the reflection of g(x) = x2 – 9,
indicated that “the reflection of the happy would be a sad face”. Therefore, the
interaction between language and signs as a means of mathematical learning is
pertinent.
The interaction of the learners with the texts of graphs that they confront directs
them into a social interaction between themselves and the texts. According to
Berger (2006) the learner and the text can be characterized as a social relation, due
to the fact that the text books have mathematical expert authority. This framework
107
therefore mediates the individual learner‟s construction of meaning with the
socially accepted text book and the educators that teach them. The impact of the
educator is noticed in many instances such as in “my teacher told me”:
Researcher: Why are you saying that x R for the domain of f(x)? What do you
understand by this?
Learner E: My teacher told me that for the parabola it will be x R. If you had an
asymptote then the domain will change.
Learner D: My teacher taught me to draw the graph, a smiling face, a parabola.
Therefore I joined the dots.
The effect of classroom instruction and practice was further demonstrated by
learner A when he justified his use of the table method to sketch f(x) = x2:
Learner A: I just chose the values that I use in class when I‟m doing class work
and when I practise my maths.
Berger (2006) stresses that “it is not how the student uses the signs but that she
uses the signs” (italics-her emphasis). This is given prominence due to Vygotsky‟s
emphasis on using words associated with a concept before the concept is
internalised or understood. In terms of Vygotsky‟s (1999) preconceptual stages,
the cognitive processes occur in heaps, complexes and potential concepts.
However for Grade 11 learners to be dependent on these cognitive processes, then
their forms of thinking would be „primitive‟ in Vygotsky‟s terms. To the
researcher this might be perceived in terms of Vile‟s (1993) low level of semiotic
understanding while the interpretation pertains to high semiotic demand.
The interpretations such as the arrows at the end of graphs means „no ending, not
stopping‟ and that the curve on f(x) = x2 is „the shape‟ or „the parabola‟ portrays
thinking at the heap or low semiotic level. An example of complex thinking,
classified as non-logical, is when learner E regarded the gradient of y = x2 as one,
108
because of the co-efficient of x2, a concept transferred from the linear function of
y = m x + c.
However, according to Vygotsky (1999) the transition from complex thinking to
conceptual thinking is made possible through pseudoconcepts. These are similar
to the real concepts although thinking is still largely in the complex level. The use
of pseudoconcepts occurs just before full understanding of a concept. Examples
provided by the learners include calculating the average gradient between two
points before understanding what average gradient meant and stating that the
domain for y = x2 is x without understanding this concept. However, for
Vygotsky, this procedure is vital for conceptual thinking to occur. It will be
appropriate to mention here that some learners displayed high semiotic
understanding in instances such as relating f(x) = x2 to g(x) = x
2 -9 and to
; while the example on finding q in g(x) = cos (x + q), although not answered
well by many learners, had high semiotic demand because interpretation of the
signs and notation was required.
5.4 Educators’ understanding of graphical representation of functions
5.4.1 The understanding of the Cartesian plane, notation and symbols
The following analysis seeks to determine to what extent the educators‟ visual
understanding of graphs are different from those of the learners.
In terms of their understanding of the use of arrows at the end of graphs:
Educator T1: It means that the graph will continue as you take bigger x and
smaller x values.
Educator T2: The domain is real and the graph will go on indefinitely. As the x
increases the y increases. The arrows are pointing upwards because it‟s going in
that direction.
109
The two educators used words such as “continue” and “go on indefinitely” which
are similar to the learners‟ use of language as a means of describing this concept.
However, the reference by educator T2 to “domain is real, as x increases the y
increases and pointing upwards because it‟s going in that direction” depict a
diverse description of his understanding. It is also significant that educator T2
thought in a similar way to the learners when he stated that “as x increases the y
increases”. This is incorrect because for f(x) = x2 this is only true for x > 0. The
opposite is true for values less than 0.
In terms of indicating the values that are between 2 and 3, educator T2 indicated
that there will be an infinite number of points. However, though educator T1
understood that there will be many numbers, he seemed to parallel the learners‟
interpretation that there are nine numbers between 2 and 3, although he could have
been referring to particular decimal places, when he replied:
Educator T1: Yes, there is a whole lot of numbers between 2 and 3.
Researcher: About how many?
Educator T1: Depends how many decimal places you want to go. If you go one
decimal place, there will be ten numbers. If you go two decimal places, there will
be more numbers.
The understanding of the Cartesian plane was broadened to their understanding of
the parabola as a curve with a set of infinite values. Educator T1 understood the
parabola to be a set of corresponding x and y values, although no learner indicated
this, and that a continuous curve would be formed. He also alluded to the points
on the parabola not being in proportion.
Educator T1: Okay, if you take these points between 0 and 1, they won‟t be direct
proportion there. (0.1)2 and (0.2)
2 they won‟t be in proportion. That would be the
reason for getting a curve and not necessarily a straight line.
Researcher: And what is your reason for joining the five points?
110
Educator T1: Between say 1 and 2 there are corresponding points. Instead of just
leaving dots, you would have a continuous curve.
Researcher: What does it mean to join the two points to form a curve?
Educator T1: Those are all your corresponding x and y values.
Educator T2 related the concept of joining the two points to “you just know it has
to be a parabola”. This might be the reason why some learners asserted that their
meaning of joining the two points is because they knew that it was a parabola.
Researcher: What made you join the x intercepts to the y intercept to form a
curve?
Educator T2: Because you‟re teaching it for so long and you just know that it has
to be a parabola and the x2 indicated that it will be a parabola.
However the curve was related to his understanding of the gradient, which was
similar to the two learners‟ explanation of gradient.
Researcher: What do you understand by the curve that joins the two points?
Educator T2: Gradient, I would say, that‟s why we talk of a curve, because the
gradient is changing all the time.
The educators displayed different methods for sketching the graphs of f(x) = x2
and g(x) = x2 – 9. The educators used the table method and the x and y intercept
methods, which are the same methods that the learners employed.
Educator T1: For the first graph f(x) I used the table method and for the second
one I used the x and y intercept.
Researcher: For the first graph you said you used the table method; did you take
points?
Educator T1: Yes, I took x values from -2 to +2.
Educator T2: I looked at the equation of f(x) and what the rules are about the
parabola, about the impact of the „a‟ and so on. Just to get a rough idea about
where it lies in the Cartesian plane, I just took two points x = 1 and x = -1 and
plotted them.
Researcher: And how did you sketch the graph of g?
111
Educator T2: I looked at the equation as well and I calculated the x and y
intercept.
Therefore, the procedural understanding of sketching graphs was also evident with
the educators. For the researcher, a conceptual understanding of sketching g(x) =
x2 – 9, is to translate f(x) = x
2 nine units down. While educator T1 understood the
meaning of f(3) for f(x) = x2 in terms of the graph, educator T2 had to be guided
in his understanding:
Researcher: What does f(3) mean in terms of the graph?
Educator T1: That your corresponding y value for 3 is 9.
Researcher: And f(4 ?
Educator T1: It would be (42.
Researcher: And f(20), how would you show that on your graph?
Educator T1: Well, not on this one, it will be a large number, depends on your
scale.
Educator T2: By substitution, when x = 3 then y = 9.
Researcher: In terms of your graph, what does this mean?
Educator did not immediately answer. Researcher pointed out x = 3 and projected
on graph to find 9.
Educator T2: Yes, it is a point on the graph.
Researcher: How would you determine f(4 .
Educator T2: By substitution.
Researcher: How would you determine f(20) and explain this in terms of your
graph?
Educator T2: By substitution, but we cannot show it on this particular graph, it is
not accommodating. You can get 20 but you just have to adjust your scale.
Both educators understood that g(x) > 0 meant positive y values greater than zero
and displayed good visual understanding of this concept, as well as the f(x) > g(x)
112
when comparing the trigonometric graphs f(x) = 2 sin x and g(x) = cos (x+30°).
When comparing these graphs, they referred to one graph “above” the other graph
that assists them in arriving at a solution.
Researcher: How would you get f(x) > 0?
Educator T1: You look above the x axis, for positive y values.
Researcher: And f(x) > g(x)?
Educator T1: You look at your graphs physically, where your f graph is above the
g graph because that is where your values for f are bigger than the y values for g.
Researcher: How would you explain f(x) > g(x)?
Educator T2: Where the sine graph is lying above the cos graph and you can see it
at these two points.
Researcher: Why are you saying above?
Educator T2: Because of the greater than.
This level of visual understanding was not evident in most of the learners.
5.4.2 The educators’ interpretation of the graphical terminology.
While educators also used the terms happy face and sad face to describe the shape
of the parabolas, they displayed better visual understanding for increasing,
decreasing functions, domain and range, period, reflection and asymptote than the
learners. The educators displayed good visual skills in determining increasing and
decreasing functions: While educator T1 used “going down and goes up” that
assists him, educator T2 related this to the gradient. These are their responses for
f(x) = x2 and g(x) = x
2 – 9.
Educator T1: We look at the graph from left to right. The positive gradient will
give you increasing. Increasing will be from x > 0 and decreasing from x < 0 on
the x axis. As you take x values smaller than 0, the graph is going down, therefore
it is decreasing and as you take numbers bigger than 0, the graph goes up,
increasing.
113
Educator T2: It‟s related to the gradient. The function is decreasing when its
gradient is negative and increasing when its gradient is positive. Also we can say
that as the x increases, the y decreases and it will be a decreasing function. As the
x increases and the y increases, it will be an increasing function.
However, educator T1 indicated that the graph of f(x) = x2 does not have a
gradient but “it can have average gradient”. Learner E had also mentioned this.
Although, calculus is not taught in Grade 11, an explanation relating the derivative
of a curve to the gradient of the curve at a point or relating infinite tangents to the
curve with gradients, would have been useful although no question in this regard
was asked.
The concepts of domain and range was understood quite well by both educators
and explained with adequate visual understanding.
Educator T2: The domain is the x values and since I put my arrows in here the
domain would be real. It means that every point on the x axis is taken into
consideration.
The maximum and minimum was related to the highest and lowest points. The
asymptote of y = was explained in terms of the graph shifting.
Educator T1: It means that for the graph there is no corresponding y value at that
point, at y = 3 there is no x value; x is the denominator. The 3 means the graph has
shifted 3 units up.
Educator T2: The graph is undefined at that point y = 3. The other asymptote is
the y axis.
Researcher: Can you explain this concept of undefined?
Educator T2: I relate this to my primary school knowledge of division by 0 is
undefined, other than that there is nothing.
114
The learners did not explain the asymptote as the educators did. Although
educator T2 had explained the asymptote for graph A, for graph B he responded
as follows:
Researcher: Are there any asymptotes in the second graph?
(After much hesitation)
Educator T2: It does not cut the x axis, so I would assume that the x axis is the
asymptote.
For the concept of period a visual understanding was offered in terms of
wavelength and wave motion. Some learners also mentioned this:
Educator T2: I looked at half the graph of sin x, which is 180°, so the wavelength
is 360°.
Educator T1: If you look at what is given, it is one complete wave motion, starts at
-180° and ends at +180°, so the total is 360°.
5.4.3 The effect of graphical representations on educators’ visual literacy
skills
Both educators did see the relationship between f(x) = x2 and g(x) = x
2 - 9 in terms
of the f(x) shifting down nine units, a similar action by the learners. However,
they too, like the learners did not use this concept when sketching the graphs.
Educator T1: Yes, it‟s an identical graph, with adding -9; the graph has gone down
nine places.
Educator T2: Yes, we can; we shift it down nine units. It might be a parallel shift
to the curve of f(x) because of the average gradient. Here the „a‟ is constant in
both graphs, so I‟m just assuming the graphs are parallel.
Researcher: If we give learners to sketch h(x) = x2
+ 3, would they see a
relationship with f(x) = x2?
115
Educator T2: I think they would. With the new FET syllabus I think they would
see the shift. Previously we never taught like that. The transformations and the
shifts are making learners understand graphs better.
Although educator T2 made this comment, it would seem that learners are still
fixed with the table method of sketch graphs. This to the researcher is a very low
semiotic application of graphs, and hence a low visual literacy skill for Grade 11
learners. But, the educators‟ visual understanding of „reflection‟ depicted by the
reflection of g(x) to be -x2+9 serves to highlight the role of visual literacy in
graphical interpretation. It must be noted however, that the educators did not
mention changing of signs as that of the learners.
Educator T1: I looked at the original graph, and I reflected those points on the x
axis. I looked at the new graph, and because it is a sad face, the „a‟ is going to be
negative. The -9 on the original, if you reflect -9 it will be +9 on the y axis.
Educator T2: I just flipped it on the x axis and I saw this point being -9 and it will
just flip to 9. The reflection is a mirror-image. Every point is transformed about
the x axis in this case.
For establishing the equations of the trigonometric graphs as well as the new
range, the educators displayed the simultaneous use of visualisation and analytical
skills as displayed in the Visualizer/Analyzer model as described previously.
While learner E referred to the “parent graph”, the educators used the term
“normal graph”. It would seem that these graphs play a significant role in visual
literacy.
Researcher: Explain your answers f(x) = 2 sin 1x and g(x) = cos (x+30°)?
Educator T1: A normal sine graph goes up to 1 and -1, in terms of amplitude; and
this graph goes up to 2 and -2, so the amplitude is the a = 2. The sine graph if it
continues on the positive side it will end up at 360°, so the normal period of the
sine graph is 360°, so I did not have to interfere with the „b‟ at all; I just left it as it
is.
Researcher: How did you get q=30°?
116
Educator T1: Normally the cos graph at 0 is +1 on the y axis, so when I look at -
30°, it is giving me +1, so that graph has shifted 30° to the left, so the y=cos x
helped me to get this answer.
Educator T2: It is the cos graph which has transformed horizontally. I had the
picture of the normal cos in my mind. The normal cos would have cut the x axis at
90°, so I looked at this one cutting the x axis at 60° which told me it‟s being
transformed to the left by 30°, so I inserted that into the equation.
5.5 Conclusion
The data analysis reflect the impact of signs, symbols, the Cartesian plane, the
geometric curves of graphs, notation and graphical terminology on learners‟ and
educators‟ understanding of graphs. The learners‟ interpretation of graphical
representations and understanding of graphical terminology as they refer to
graphs, depict much procedural understanding. While this is a necessary skill in
graphical interpretation, the application of conceptual skills appears to be wanting
in learners. However, the effect of graphical visual clues and sign vehicles on the
learners‟ visual literacy skills is also adequately demonstrated by the learners.
117
CHAPTER SIX
CONCLUSION
6.1 Introduction
The research study on functional graphical representations reveals the following
findings about the ten learners and the two educators used in the study. These
findings do not in any way generalise to the wider mathematics community.
However, it does contribute to the fast evolving role of visualisation in
mathematics teaching and learning. In terms of the key research questions and
other pertinent issues, the findings reveal to a certain extent that:
Learners understand graphical functional representations mainly through
rules and procedures. Therefore, the procedural understanding of
graphical concepts is more prevalent than their conceptual understanding.
Learners display misconceptions in graphical interpretation.
Visual literacy does play a role in the visual understanding of graphs of
learners and educators.
The educators‟ utilise visual skills in the understanding of graphs, though
sometimes different from that of the learners, and this contributes to the
way learners interpret graphs.
The procedural-conceptual dichotomy is a useful tool to describe learners‟
interpretation of functional notation and the Visualizer/Analyzer Model
offers insight into the ways learners understand reflections, and shifting of
graphs. Thus the semiotic theory provides a visualization-based theoretical
framework that can be used to better understand learners‟ interpretation of
graphs.
118
6.2 Main arguments
The misconceptions that learners display point towards a low or literal level of
understanding of the Cartesian plane, the graphs they sketch and functional
notation. These are depicted in their comprehension of the arrowheads, the
number line and the joining of points to form graphs. This indicates that the
relationship between real numbers and the Cartesian plane has not been fully
established into their conceptual framework. The conceptualisation of the number
line as an operative prototype, as a process to act upon, and the parabola as a
relational prototype, a process to relate the parabola to aspects of graphical
understanding, was not evident in most of the learners. As a result, for them there
were nine decimals between the numbers 2 and 3 and that the parabola was merely
a curve. The understanding of notation such as f (3), g(x) > 0 and f(x) > g(x)
suggests a strong procedural conception and a weak conceptual understanding of
functional notation and graphical relevance. The fixation to the physical features
of graphs such as in “the graph is not stopping; I know it‟s a happy face, it‟s
increasing because it‟s going up” contribute to a basic understanding of graphs.
The procedural understanding is further demonstrated by a strong tendency to
draw graphs using the table method and substituting integer values for x that they
use in class. Most of the learners reacted doubtfully when asked to explain f (20)
and f (4 The assumption here is that the learners did not work with these
numbers in the classroom environment. Other examples include the understanding
of f (3) as substituting into the equation; and that of the gradient as substitution
into the gradient formula. This might be due to a strong emphasis in algebraic
computations in the classroom. The predominance of the concept image consisting
of the learners‟ personal beliefs and cognitive structures influenced their
understanding of graphical representations. Language played a significant part in
understanding graphical concepts as demonstrated through their personal use of
increasing, decreasing, maximum, minimum and reflection. The use of their words
in mediating their thoughts plays a vital role in the formation of a proper
understanding. The analysis indicates that learners to a great extent depend on
119
procedural understanding of sketching of graphs, as well as in determining the
equation of graphs when given visual information on the graph. However, learners
also display a weak conceptual understanding for concepts such as domain, range,
period, reflection, increasing, decreasing, asymptote and functional notation.
The level of visual understanding displayed by the learners indicates the
significant role visual literacy play in graphical comprehension. These are
exemplified in relating the name of the graph to its equation and then to its shape.
The description of the asymptote in relation to the graph and the equation also
indicates the application of visual literacy; though they did not demonstrate a
conceptual understanding of asymptotes. The learners also exhibit a good visual
understanding of reflecting graphs and translating graphs vertically on the axis.
The concept of amplitude was visually established and correctly related to the
trigonometric equation. The ability to perform advanced mathematical thinking
using visual literacy skills was illustrated by a few learners in explaining the
transformation of algebraic and trigonometric graphs.
From a theoretical perspective, learners displayed that they were able to construct
knowledge in their interaction with graphs through signs and psychological tools.
Graphical functional relationships represented in graphical, symbolic and tabular
forms possess sign vehicles that assist in the construction of meaning. The
numerous and varied meaning portrayed by the learners display signs as essential
components of visual literacy and conceptual understanding. The forms of
imagery such as iconic, indexical and symbolic influences their understanding; as
well as the types of imagery such as concrete, pattern, memory and kinaesthetic.
Thus, learners‟ understanding of graphical representations depends on the physical
form of equations and graphs, pattern identification, retrieving from memory and
transforming graphs. Therefore, semiotic mediation between the external concrete
image of signs, words and the text, and the internal psychological image,
constitute visual literacy processes. Graphs have a high semiotic demand that
require a good semiotic understanding. Learners were able to appreciate this
aspect of graphs to a certain extent.
120
The educators on the other hand, demonstrated good visual understanding of the
algebraic and trigonometric graphical representations. They also understood the
various graphical terminologies in relation to the graph. However, they did show
signs of similar understanding to those of the learners. Therefore, it is evident that
the way learners conceive graphical relationships is partly due to the way they are
taught in the classroom. The literal understanding of the arrows as “the graph will
continue and the graph is going in that direction” corresponds to learners
interpretations of the arrows. The educator‟s utterance of “you just know that it
has to be a parabola, because you‟re teaching it for so long” would certainly affect
the learners‟ conceptualisation of why points are joined to form a graph. Perhaps
the reason behind these answers is that educators feel that it is not important to
conceptualise these with the learners as they are not important for the
examinations.
6.3 Limitations
From a research perspective certain shortcomings in the research process could
affect the credibility and dependability of the data. According to Cohen, Manion
and Morrison (2007) the sample size should be large enough to generate ample
data. The study is also not a prolonged study. Prolonged engagement on the field
will ensure trustworthiness of research process. The type of questions on the
worksheet and the interview schedule might not be totally representative of visual
literacy concepts. The researcher is a male, mathematics educator. As a result bias
and subjectivity could have affected the interview process, such as in asking
leading questions. The ability by the researcher to use relevant prompts and
probes to allow the learners to explain, clarify and elaborate, produces rich, first
hand information (Maree, 2007). This is one of the shortcomings experienced in
the interview process. At certain instances the interview took on a question and
answer format. The researcher should have pursued the responses to the questions
further in order to acquire thick data.
121
From a mathematics perspective other visual literacy skills in graphical
interpretation could have been omitted in the research process. Since graphical
functional relationships is such a vast section, focussing on skills on one particular
graph excludes other graphs. As an example, the skill of curve sketching was
limited to parabolas. The conclusions made in respect to this graph might not be
representative of other graphs, such as the exponential graph.
6.4 Recommendations
The following are some recommendations for further research and consideration
by mathematics practitioners:
The use of graphic calculators and computers in improving
graphical skills has been widely researched in other countries. A
research study of similar type should be considered in the South
African context as a means of investigating visual literacy skills.
A longitudinal study involving Grades 10-12 might provide a more
detailed role of visual literacy on learners‟ conceptual
understanding of graphs.
In terms of curriculum planning and development, it should be
recognised that visual literacy and visualisation skills affect the
conceptual understanding of graphical relationships. This should be
emphasised in study materials and in the teaching and learning
situation. While procedural understanding is still necessary, the
role of visual literacy in advanced mathematical thinking involving
graphs is essential.
Educators should emphasise visual literacy skills in mathematics
classrooms when teaching functional graphical relationships. These
include:
122
o The comprehension of graphs in respect to the Cartesian
plane.
o Sketching of graphs without the table method.
o The meaning of graphical characteristics such as domain,
range, asymptote, increasing and decreasing functions.
o Developing a conceptual relationship between the graph
and the equation with emphasis on the effect of the
parameters and transformation of graphs.
o Emphasising the visual relationships between the symbolic
and graphical forms.
123
BIBLIOGRAPHY
Afamasaga-Fuata'i, K. (2004). Concept Maps & Vee Diagrams as Tools for
Learning New Mathematical Topics. Paper presented at the First
International Conference on Concept Mapping, Pamplona, Spain.
Anderson, G. M. (2007). The evolution of the "Cartesian Connection".
Mathematics Teacher, 102(2), 107-111.
Arcavi, A. (2003). The Role of Visual Representations in the learning of
Mathematics. Educational Studies in Mathematics, 52, 215-241.
Asiala, M., Cottrill, J., Dubinsky, E., & Schwingendorf, K. E. (1997). The
Development of Students' Graphical Understanding of the Derivative. The
Journal of Mathematical Behavior, 16(4), 399-431.
Asli, O. (2001). The Graphing Skills of Students in Mathematics and Science
Education.ERIC Digest [Electronic Version]. Retrieved 29 February, 2008
from http:www.ericdigests.org
Barwise, J., & Etchemendy, J. (1991). Visual Information and Valid Reasoning. In
W. Zimmermann & S. Cunningham (Eds.), Visualisation in Teaching and
Learning Mathematics (pp.9-24). Washington, DC: Mathematical
Association of America.
Beigie, D. (2005). Exploring Graphs in a Target-Oriented Environment.
Micromath, 21, 24-29.
Berger, M. (2006). Making mathematical meaning: from preconcepts to
pseudoconcepts to concepts. Pythagoras, 63, 14-21.
Bergsten, C. (2000). From Sense to Symbol Sense [Electronic Version]. Retrieved
10 July 2008 from http://www.fmd.uni-osnabrueck.de/ebooks/erme/cerme
1-proceedings/html
Blanche, M.T., & Durrheim, K. (2002). Research in Practice – Applied methods
for the social sciences. Cape Town: University of Cape Town Press.
Boshoff, H. (2007, 2-6 July). Generate graphs and generalise the effect of
parameters on graphs by means of Autograph and Sketchpad. Paper
presented at the 13th
Annual National Congress of the Association for
Mathematics Education of South Africa, Mpumalanga, South Africa.
124
Bowie, L. (2000). A learning theory approach to students' errors in calculus.
Pythagoras, 52, 2-14.
Bremigan, E. G. (2005). An Analysis of Diagram Modification and Construction
in Students' Solutions to Applied Calculus Problems. Journal for Research
in Mathematics Education, 36(3), 248-277.
Burns, M. (2006). A Thousand Words: Promoting Teachers' Visual Literacy
Skills. Retrieved 1 July, 2008, from file: // : \ visual literacy 12.htm
Cates, B. (2002). CBL Activities and Students' Conceptual Knowledge of
Functions. Retrieved 29 February, 2008, from http://archives.math.utk.edu
Chandler, D. (2002). Semiotics: The Basics. London: Routledge.
Cohen, L., Manion, L., & Morrison, K. (2007). Research methods in education.
(6th ed.). London: Routledge.
Cooley, L., Trigueros, M., & Baker, B. (2007). Schema Thematization: A
Framework and an Example. Journal for Research in Mathematics
Education, 38(4), 370-392.
Cooney, T. J., & Wilson, M. R. (1993). Teachers' thinking about functions:
historical and research perspectives. In T. A. Romberg, E. Fennema & T.
P. Carpenter (Eds.), Integrating research on the graphical representation
of functions (pp.133-158). New Jersey: Lawrence Erlbaum Associates.
Creswell, J. W. (1998). Qualitative inquiry and Research design- Choosing
among 5 Traditions. London: Sage.
Department of Education. (2002). National Curriculum Statement, Grades R-9:
Mathematics. Pretoria, South Africa: Department of Education.
Department of Education. (2003). National Curriculum Statement, Grades 10-12
(General): Mathematics. Pretoria, South Africa: Department of Education.
Department of Education. (2007). Grade 11 National Exemplar Paper 3. Pretoria,
South Africa: Department of Education.
Dörfler, W. (2000). Means for Meaning. In P. Cobb, E. Yackel & K. Mclain
(Eds.), Symbolizing and Communicating in Mathematics Classrooms-
Perspectives on discourse, tools and instructional design (pp.99-132).
Mahwah,NJ: Lawrence Erlbaum Associates.
Dubinsky, E. (1991). Reflective abstraction in advanced mathematical thinking. In
D. Tall (Ed.), Advanced mathematical thinking (pp.95-123). Dordrecht:
Kluvwer Academic Publishers.
125
Eisenberg, T. (1992). On the development of a Sense for Functions. In G. Harel &
E. Dubinsky (Eds.), The Concept of Function - Aspects of Epistemology
and Pedagogy (pp.153-174). Washington, DC: Mathematical Association
of America.
Eisenberg, T., & Dreyfus, T. (1991). On the Reluctance to Visualise in
Mathematics. In W. Zimmermann & S. Cunningham (Eds.), Visualisation
in Teaching and Learning Mathematics (pp.25-38). Washington, DC:
Mathematical Association of America.
Eisenhart, M., Borko, H., Underhill, R., Brown, C., Jones, D., & Agard, P. (1993).
Conceptual knowledge falls through the cracks: Complexities of learning
to teach mathematics for understanding. Journal for Research in
Mathematics Education, 24(1), 8-40.
Elkins, J. (2003). Visual Studies - A Skeptical Introduction. London: Routledge.
English, L. (Ed.). (1997). Mathematical Reasoning-Analogies,Metaphors and
Images. Mahwah: Lawrence Erlbaum Associates.
Ernest, P. (1994). Constructing mathematical knowledge: epistemology and
mathematical education. . London: The Falmer Press.
Ernest, P. (1997). Introduction: Semiotics, Mathematics and Mathematics
Education. Philosophy of Mathematics Education, Journal 10. [Electronic
Version]. Retrieved 4 November, 2008, from http://people.exeter.ac.uk/
PErnest/pome10/art1.htm
Fennema, E., & Romberg, T. A. (Eds.). (1999). Mathematics Classrooms That
Promote Understanding. London: Erlbaum.
Fisher, R. (2005). Teaching Children to Think. New Jersey: Erlbaum.
Friel, S. N., Curcio, F. R., & George, W. B. (2001). Making Sense of
Graphs:Critical Factors influencing Comprehension and Instructional
Implications. Journal for Research in Mathematics Education, 32(2), 124-
155.
Goba, B., & van der Lith, D. (2005). Study & Master Mathematics-Grade 10
Learner's book. Cape Town: Cambridge University Press.
Goldin, G., & Shteingold, N. (2001). Systems of representations and the
development of mathematical concepts. In A. Cuoco (Ed.), The Roles of
representations in school mathematics (pp.1-23). Reston Virginia:
National Council of Teachers of Mathematics.
126
Harel, G., & Dubinsky, E. (Eds.). (1992). The Concept of Function- Aspects of
Epistemology and Pedagogy. Washington, DC: Mathematical Association
of America.
Henning, E. (2004). Finding your way in qualitative research. Pretoria: van
Schaik.
Hill, H. C., Ball, D. L., & Schilling, S. G. (2008). Unpacking pedagogical content
knowledge: conceptualizing and measuring teachers' topic-specific
knowledge of students. Journal for Research in Mathematics Education,
39(4), 372-400.
Janvier, C. (Ed.). (1987). Problems of Representations in the Teaching and
Learning of Mathematics. London: Erlbaum.
Johansen, J. D., & Larsen, S. E. (2002). Signs in Use: An introduction to
semiotics. London: Routledge.
Julie, C., Cooper, P., Daniels, M., Fray, B., Fortune, R., Kasana, Z., et al. (1998).
"Global Graphs": a window on the design of learning activities for
outcomes-based education. Pythagoras, 46/47, 37-44.
Kadunz, G., & Sträßer, R. (2004). Image-Metaphor-Diagram:Visualisation in
Learning Mathematics. Paper presented at the 28th Conference of the
International Group for the Psychology of Mathematics Education,
Universitaet Klagenfurt - Austria/ Lulea tekniska universitet - Sweden.
Kieran, C. (1993). Functions, graphing and technology. In T. A. Romberg, E.
Fennema & T. P. Carpenter (Eds.), Integrating research on the graphical
representation of functions (pp.190-237). New Jersey: Lawrence Erblaum
Associates.
Kilpatric, J., Swafford, J., & Findell, B. (2001). Adding it up: Helping children
learn mathematics. Washington, DC: National Academy Press.
Kirshner, D., & Awtry, T. (2004). Visual Salience of Algebraic Transformations.
Journal for Research in Mathematics Education, 35(4), 224-257.
Kleiner, I. (1993). Functions: Historical and pedagogical aspects. Science &
Education, 2, 183-209.
Kwari, R. (2007). An investigation into the development of the function concept
through a problem-centred approach by Form 1 pupils in Zimbabwe, a
thesis submitted for the degree of Master of Education, UNISA, Durban.
KwaZulu-Natal Department of Education. (2008). Mathematics Paper 2 -Grade 11
Common Test - September 2008, Durban, South Africa: Department of
Education.
127
Lakoff, G., & Núňez, R. E. (1997). Cognitive foundation for a mind-based
mathematics. In L. D. English (Ed.), Mathematical Reasoning-Analogies,
metaphors and images (pp.21-92). New Jersey: Lawrence Erlbaum
Associates.
Long, C. (2005). Maths concepts in teaching: procedural and conceptual
knowledge. Pythagoras, 62, 59-65.
Maree, K. (Ed.). (2007). First steps in research. Pretoria: van Schaik.
McEwan, E. K., & McEwan, P. J. (2003). Making Sense of Research. What's
Good, What's Not, and How to Tell the Difference. Thousand Oaks: Sage.
Moschkovich, J., Schoenfeld, A. H., & Arcavi, A. (1993). Aspects of
understanding. In T. A. Romberg, E. Fennema & T. P. Carpenter (Eds.),
Integrating research on the graphical representation of functions (pp.69-
100). New Jersey: Lawrence Erlbaum Associates.
Mudaly, V. (2008, 6-13 July). Visual Literacy and Visualisation in Mathematics
Education. Paper presented at the Eleventh International Congress for
Mathematics Education(ICME 11), Universidad Autónoma de Nuevo
León,Monterrey, Mexico.
Nicholl, T. (1998). Vygotsky. Retrieved 5 March, 2008, from http://www.massey.
ac.nz/alock/virtual/trishvyg.htm
Norman, F. A. (1992). Teachers' mathematical knowledge of the concept of
function. In G. Harel & E. Dubinsky (Eds.), The concept of function-
aspects of epistemology and pedagogy (pp.215-232). Washington, DC:
Mathematical Association of America.
Noss, R., Healy, L., & Hoyles, C. (1997). The Construction of Mathematical
Meanings: Connecting the Visual with the Symbolic. Educational Studies
in Mathematics., 33(2), 595-610.
O'Callaghan, B. R. (1998). Computer-Intensive Algebra and Students Conceptual
Knowledge of Functions. Journal for Research in Mathematics Education,
29(1), 21-4.
Orton, A. (1992). Learning Mathematics - Issues, Theory and Classroom
Practice. (2nd ed.). New York: Casell.
Pimm, D. (1995). Symbols and Meanings in School Mathematics. London:
Routledge.
Presmeg, N. C. (1997). Generalization using imagery in mathematics. In L. D.
English (Ed.), Mathematical reasoning: Analogies, metaphors and images
(pp.299-312). Mahwah, New Jersey: Lawrence Erlbaum Associates.
128
Presmeg, N. C. (2006). Research on visualisation in learning and teaching
mathematics. In A. Gutiérrez & P. Boero (Eds.), Handbook of research on
the psychology of mathematics education: Past, present and future
(pp.205-235). Rotterdam: Sense Publishers.
Presmeg, N. C. (2008, 6-13 July). An overarching theory for research in
visualisation in mathematics education. Paper presented at the Eleventh
International Congress for Mathematics Education(ICME 11), Universidad
Autónoma de Nuevo León, Monterrey, Mexico.
Pylyshyn, Z. W. (2003). Seeing and Visualising - It’s Not What You Think.
Cambridge: MIT Press.
Radford, L. (2001, 12 July). On the relevance of semiotics in mathematics
education. Paper presented at the 25th
PME International Conference,
University of Utrecht, Netherlands.
Rivera, F. (2007). Visualising as a Mathematical Way of Knowing: Understanding
Figural Generalization. Mathematics Teacher, 101(1), 69-75.
Romberg, T. A., Fennema, E., & Carpenter, T. P. (Eds.). (1993). Integrating
research on the graphical representation of functions. Hillsdale,New
Jersey: Erlbaum.
Sfard, A. (1992). Operational origins of mathematical objects and the quandry of
reification-the case of function. In G. Harel & E. Dubinsky (Eds.), The
concept of Function: Aspects of Epistemology and Pedagogy (pp.59-84).
Washington, DC: Mathematical Association of America.
Sfard, A. (2000). Symbolizing mathematical reality into being-or how
mathematical discourse and mathematical objects create each other. In P.
Cobb, E. Yackel & K. Mclain (Eds.), Symbolizing and communicating in
mathematics classrooms: Perspectives on discourse, tools and
instructional design (pp.37-98). Mahwah,NJ: Lawrence Erlbaum
Associates.
Sierpinska, A. (1992). On understanding the notion of the function. In G. Harel &
E. Dubinsky (Eds.), The concept of function: aspects of epistemology and
pedagogy. (pp. 23-58). West La Fayette: Mathematical Association of
America.
Sierpinska, A. (1994). Understanding in Mathematics. London: RoutledgeFalmer.
Silverman, L. (2002). The Power of Images: Visual-Spatial Learners. Retrieved 6
March, 2008, from http://www.visualspatial.org
129
Simon, M. A., Tzur, R., Heinz, K., & Kinzel, M. (2004). Explicating a mechanism
for conceptual learning: Elaborating the construct of reflective abstraction.
Journal for Research in Mathematics Education, 35(5), 305-329.
Skemp, R. (1976). Relational understanding and instrumental understanding.
Mathematics Teaching, the bulletin for the Association of teachers of
Mathematics, 77, 1-20.
Skemp, R. (1986). The Psychology of Learning Mathematics. London: Penguin
Books.
Smith, H. A. (1997). Peirce's Sign and Mathematics Education: An introduction.
Philosophy of Mathematics Education, Journal 10 Retrieved 4 November,
2008, from http://people.exeter.ac.uk/PErnest/pome10/art3.htm
Stokes, S. (2002). Visual Literacy in Teaching and Learning: A literature
Perspective. Electronic Journal for the Integration of Technology in
Education, vol. 1, no. 1. Retrieved 3 June, 2007, from http://ejite.isu.edu/
Volume1 No1/pdfs/stokes.pdf
Tall, D. (1991). Intuition and Rigour: The role of visualisation in Calculus. In W.
Zimmermann & S. Cunningham (Eds.), Visualisation in Teaching and
Learning Mathematics (pp.105-120). Washington, DC: Mathematical
Association of America.
Tall, D., Thomas, M., Davis, G., Gray, E., & Simpson, A. (1998). What is the
object of the encapsulation of a process? Retrieved 4 November, 2008,
from http://www.crme.soton.ac.uk/publications/gdpubs/object.html
Tall, D., & Vinner, S. (1981). Concept Image and Concept Definition in
Mathematics with Particular Reference to Limits and Continuity.
Educational Studies in Mathematics, 12, 151-169.
Thornton, S. (2002). A Picture is Worth a Thousand Words. Retrieved 20 March,
2007 from http://www.math.unipa.it/~grim/AThornton 251.
Van der Veer, R., & Valsiner, J. (1993). Understanding Vygotsky: A quest for
Synthesis. Cambridge: Blackwell.
Van Doreen, W., De Bock, D., Janssens, D., & Verschaffel, L. (2008). The linear
imperative: An inventory and conceptual analysis of student's overuse of
linearity. Journal for Research in Mathematics Education, 39(3), 311-342.
Van Dyke, F. (2002). A Visual Approach to Functions. California: Curriculum
Press.
130
Van Oers, B. (2000). Appropriation of Mathematical Symbols. In P. Cobb, E.
Yackel & K. Mclain (Eds.), Symbolizing and Communicating in
Mathematics classrooms-Perspectives on discourse, tools and
instructional design (pp.133-176). Mahwah, NJ: Lawrence Erlbaum
Associates.
Verhage, H., Adendorff, S., Cooper, P., Engel, M., Kasana, Z., Roux, P., et al.
(2000). The interrelationship between graphs, formulae and tables:
exploring the relationship between mathematics and outcomes based
education. Pythagoras, 51, 37-42.
Vile, A. (1993). Is this a sign of the times? A semiotic approach to meaning-
making in mathematics education. Paper presented at the Annual meeting
of the American Educational Research Association, Chicago.
Vygotsky, L. S. (1999). The Function of Signs in the development of Higher
Mental Processes. In R. W. Rieber (Ed.), The collected works of
L.S.Vygotsky-Volume 6 Scientific Legacy. New York: Kluwer Academic.
Wheatley, G. H. (1997). Reasoning with images in mathematics activity. In L. D.
English (Ed.), Mathematical reasoning-Analogies, metaphors and images
(pp.281-298). New Jersey: Lawrence Erlbaum Associates.
White, P., & Mitchelmore, M. (1996). Introductory Calculus. Journal for
Research in Mathematics Education, 27(4), 70-95.
Williams, L. V. (1983). Teaching for the Two Sided Mind - A Guide to Right
Brain/Left Brain Education. New Jersey: Prentice Hall.
Williams, S. R. (1993). Functions, graphing and technology. In T. A. Romberg, E.
Fennema & T. P. Carpenter (Eds.), Integrating research on the graphical
representation of functions (pp.310-337). New Jersey: Lawrence Erblaum
Associates.
Yerushalmy, M., & Schwartz, J. L. (1993). Seizing the opportunity to make
algebra mathematically and pedagogically interesting. In T. A. Romberg,
E. Fennema & T. P. Carpenter (Eds.), Integrating research on the
graphical representations of functions (pp.42-68). New Jersey: Lawrence
Erlbaum Associates.
Zazkis, R., Dubinsky, E., & Dautermann, J. (1996). Co-ordinating visual and
analytical strategies: A study of of students' understanding of the Group
D4. Journal for Research in Mathematics Education, 27(4), 435-457.
Zimmermann, W., & Cunningham, S. (Eds.). (1991). Visualisation in Teaching
and Learning Mathematics. Washington, DC: Mathematical Association
of America.
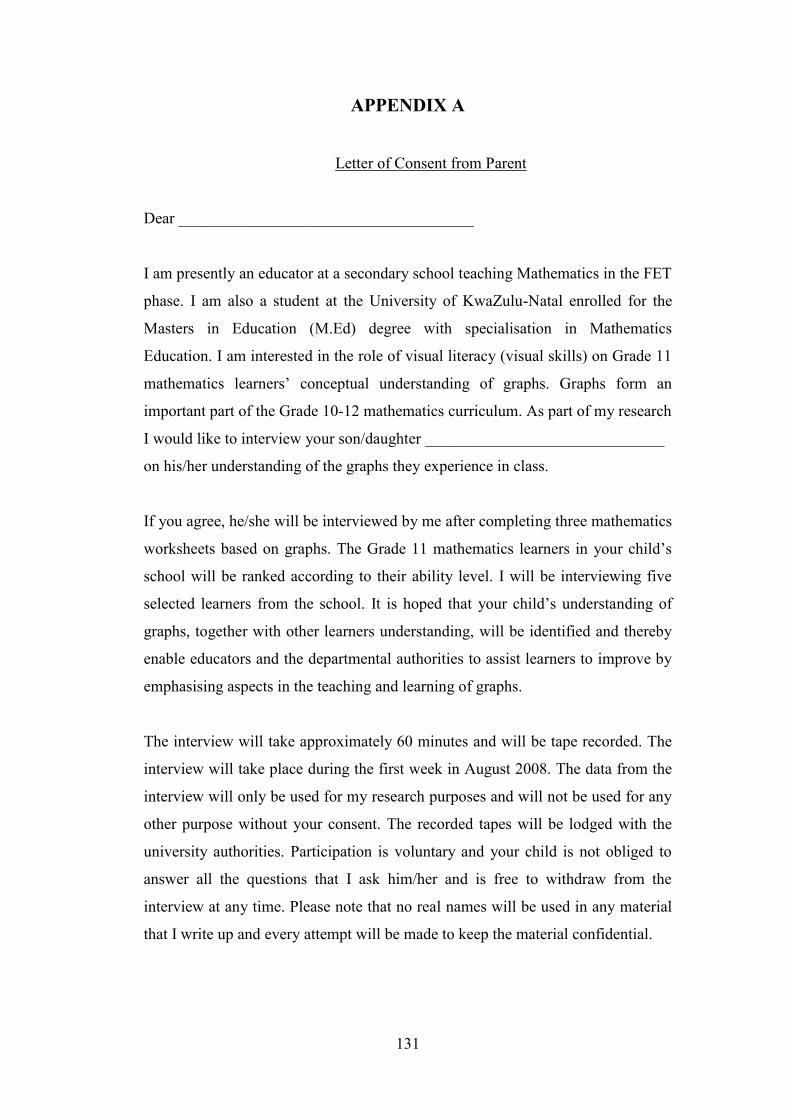
131
APPENDIX A
Letter of Consent from Parent
Dear _____________________________________
I am presently an educator at a secondary school teaching Mathematics in the FET
phase. I am also a student at the University of KwaZulu-Natal enrolled for the
Masters in Education (M.Ed) degree with specialisation in Mathematics
Education. I am interested in the role of visual literacy (visual skills) on Grade 11
mathematics learners‟ conceptual understanding of graphs. Graphs form an
important part of the Grade 10-12 mathematics curriculum. As part of my research
I would like to interview your son/daughter ______________________________
on his/her understanding of the graphs they experience in class.
If you agree, he/she will be interviewed by me after completing three mathematics
worksheets based on graphs. The Grade 11 mathematics learners in your child‟s
school will be ranked according to their ability level. I will be interviewing five
selected learners from the school. It is hoped that your child‟s understanding of
graphs, together with other learners understanding, will be identified and thereby
enable educators and the departmental authorities to assist learners to improve by
emphasising aspects in the teaching and learning of graphs.
The interview will take approximately 60 minutes and will be tape recorded. The
interview will take place during the first week in August 2008. The data from the
interview will only be used for my research purposes and will not be used for any
other purpose without your consent. The recorded tapes will be lodged with the
university authorities. Participation is voluntary and your child is not obliged to
answer all the questions that I ask him/her and is free to withdraw from the
interview at any time. Please note that no real names will be used in any material
that I write up and every attempt will be made to keep the material confidential.
132
Thank you for your assistance. If you require any further information, please
contact my course supervisor, Dr Vimolan Mudaly at 082 9770577 or contact me.
My details are – Rajesh Rampersad at 073 953 1018.
Yours sincerely
_____________________
R.Rampersad
DECLARATION
I, _____________________________________ (full name of
parent/guardian) confirm that I understand the contents of this document and
agree to allow my child_________________________________ to participate in
the above mentioned research study. I understand that my child‟s real name will
not be used in any write-up and that his/her responses will be treated
confidentially. I also understand that he/she will not be under any threat to
participate and is at liberty to withdraw from the study at any time.
Signature: _____________________________ Date: ______________
Thank you for your kind co-operation.
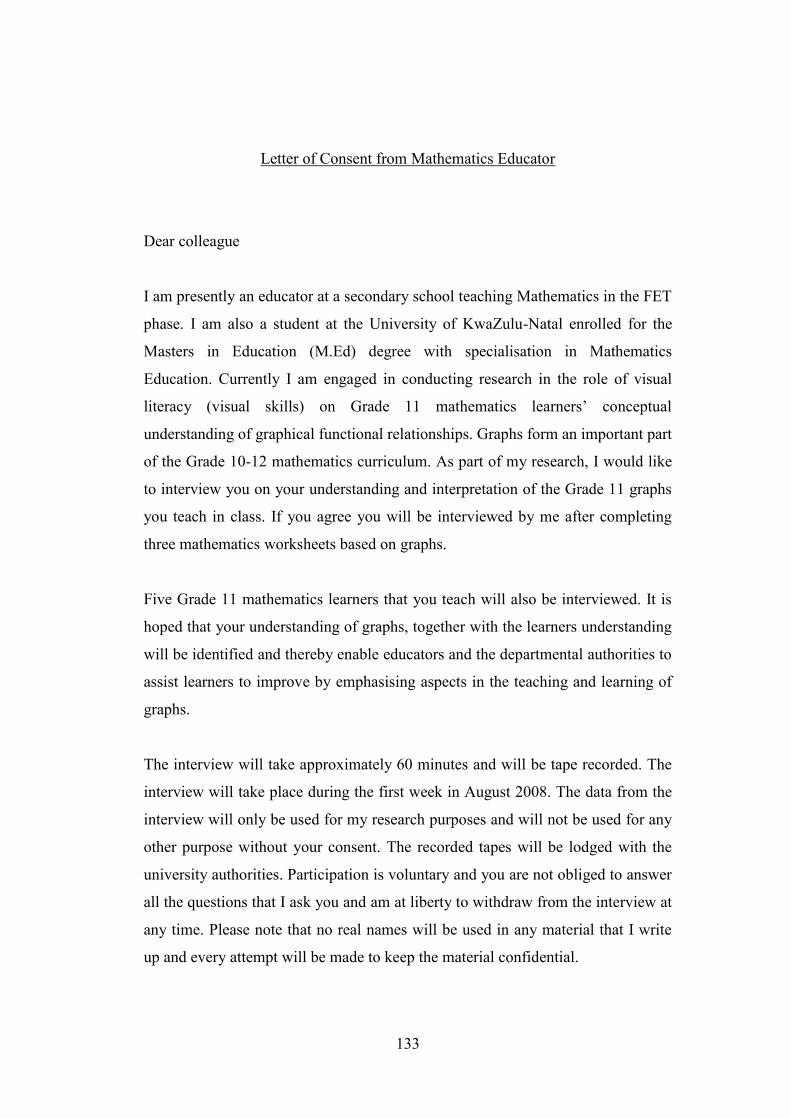
133
Letter of Consent from Mathematics Educator
Dear colleague
I am presently an educator at a secondary school teaching Mathematics in the FET
phase. I am also a student at the University of KwaZulu-Natal enrolled for the
Masters in Education (M.Ed) degree with specialisation in Mathematics
Education. Currently I am engaged in conducting research in the role of visual
literacy (visual skills) on Grade 11 mathematics learners‟ conceptual
understanding of graphical functional relationships. Graphs form an important part
of the Grade 10-12 mathematics curriculum. As part of my research, I would like
to interview you on your understanding and interpretation of the Grade 11 graphs
you teach in class. If you agree you will be interviewed by me after completing
three mathematics worksheets based on graphs.
Five Grade 11 mathematics learners that you teach will also be interviewed. It is
hoped that your understanding of graphs, together with the learners understanding
will be identified and thereby enable educators and the departmental authorities to
assist learners to improve by emphasising aspects in the teaching and learning of
graphs.
The interview will take approximately 60 minutes and will be tape recorded. The
interview will take place during the first week in August 2008. The data from the
interview will only be used for my research purposes and will not be used for any
other purpose without your consent. The recorded tapes will be lodged with the
university authorities. Participation is voluntary and you are not obliged to answer
all the questions that I ask you and am at liberty to withdraw from the interview at
any time. Please note that no real names will be used in any material that I write
up and every attempt will be made to keep the material confidential.
134
Thank you for your assistance. If you require any further information, please
contact my course supervisor, Dr Vimolan Mudaly at 082 9770577 or contact me.
Yours sincerely
_____________________
R.Rampersad
DECLARATION
I, _____________________________________ (full name of educator)
hereby confirm that I understand the contents of this document and the nature of
the research project, and I consent to participating in the research project. I
understand that my real name will not be used in any write-up and that my
responses will be treated confidentially. I also understand that I will not be under
any threat to participate and is at liberty to withdraw from the study at any time.
Signature: _____________________________ Date: ______________
Thank you for your kind co-operation.
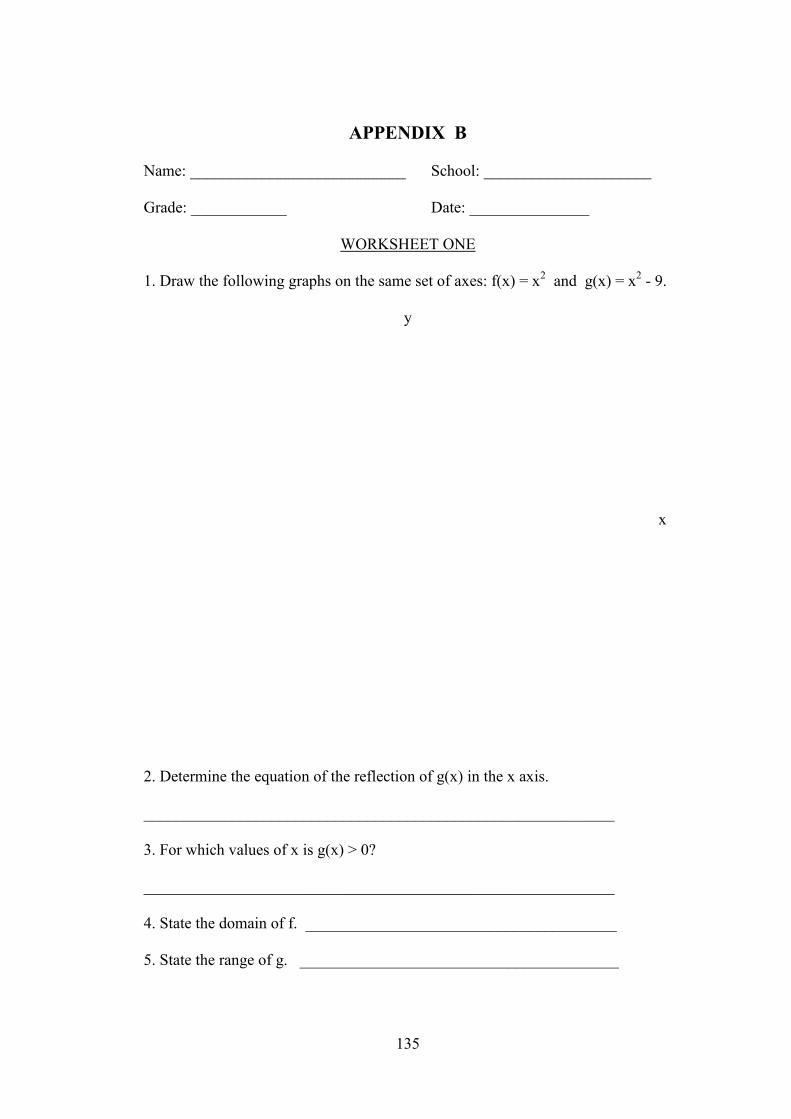
135
APPENDIX B
Name: ___________________________ School: _____________________
Grade: ____________ Date: _______________
WORKSHEET ONE
1. Draw the following graphs on the same set of axes: f(x) = x2 and g(x) = x
2 - 9.
y
x
2. Determine the equation of the reflection of g(x) in the x axis.
___________________________________________________________
3. For which values of x is g(x) > 0?
___________________________________________________________
4. State the domain of f. _______________________________________
5. State the range of g. ________________________________________
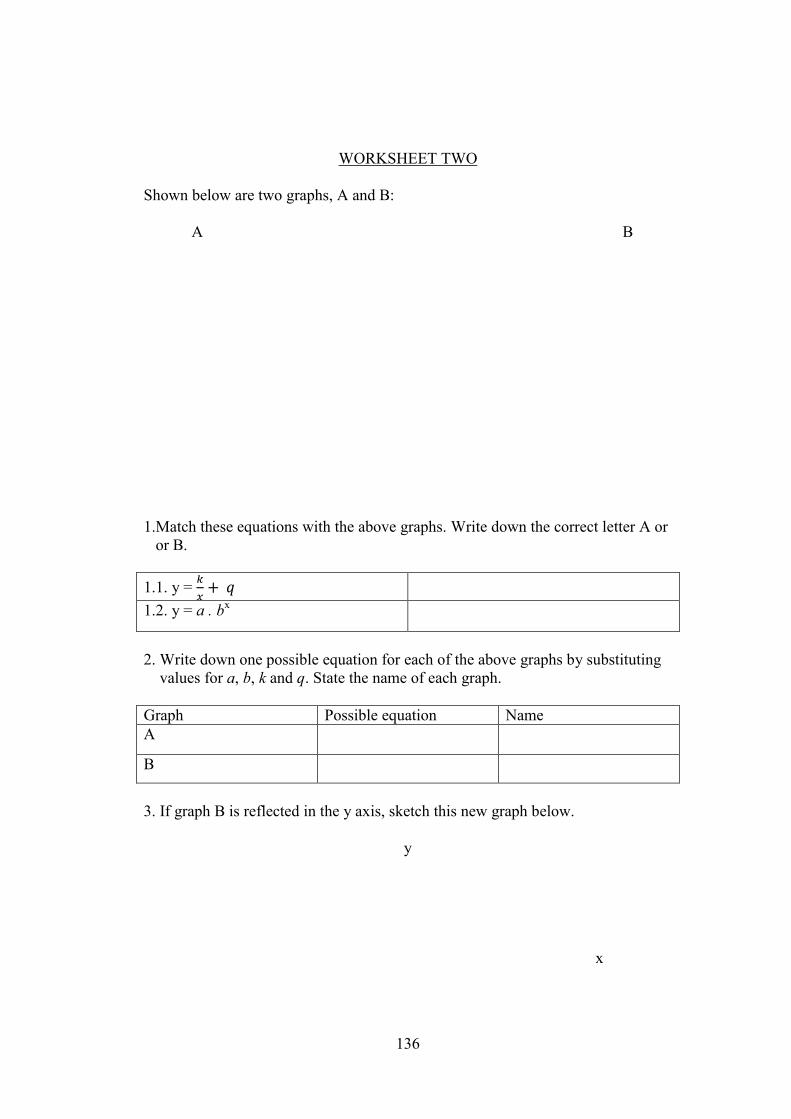
136
WORKSHEET TWO
Shown below are two graphs, A and B:
A B
1.Match these equations with the above graphs. Write down the correct letter A or
or B.
1.1. y =
1.2. y = a . bx
2. Write down one possible equation for each of the above graphs by substituting
values for a, b, k and q. State the name of each graph.
Graph Possible equation Name
A
B
3. If graph B is reflected in the y axis, sketch this new graph below.
y
x
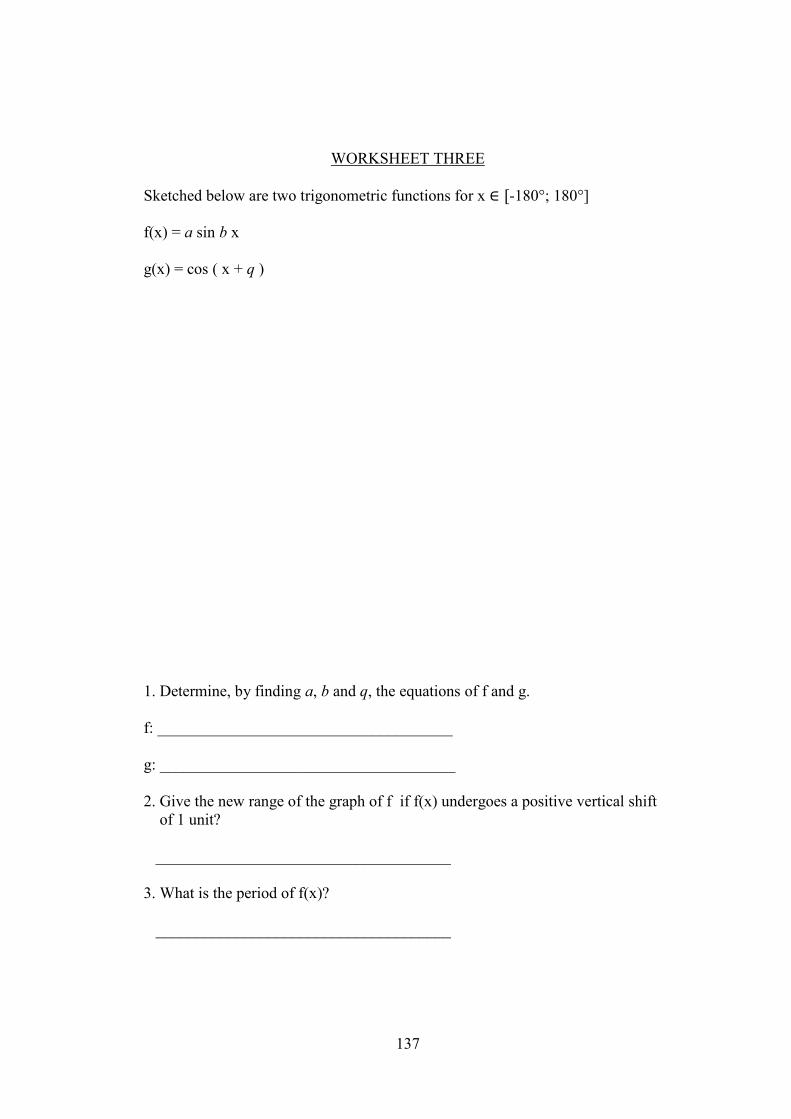
137
WORKSHEET THREE
Sketched below are two trigonometric functions for x -180°; 180°]
f(x) = a sin b x
g(x) = cos ( x + q )
1. Determine, by finding a, b and q, the equations of f and g.
f: _____________________________________
g: _____________________________________
2. Give the new range of the graph of f if f(x) undergoes a positive vertical shift
of 1 unit?
_____________________________________
3. What is the period of f(x)?
_____________________________________
138
APPENDIX C
INTERVIEW SCHEDULE
Worksheet One
1. Describe why you selected this particular method in sketching the graphs?
2. You used only a few points to draw the graphs. Explain why you used only a
few points, and what your reasons are for joining the dots?
3. What is the meaning of the curve between the two points?
4. Point using your pencil where on graph of f(x) = x², you would read off values
for f(3), f(42
1) and f(20)?
5. Why did you/ did not use arrows at the end of your graph/axis? What do the
arrows indicate on your graphs?
6. Why are the arrows pointing upwards?
7. Are there any points between 2 and 3 on the x axis? If yes, how many?
8. What words can you use to describe your graphs?
9. What does it mean when you talk of f(x) increasing or decreasing? Show me
on the graphs of f(x) and g(x) where the graphs are increasing.
10. Does the graph of f(x) have a gradient? Where is the gradient equal to 0?
11. Describe the transformation from f(x) to g(x). How can we get f(x) from g(x)?
12. Explain your answers obtained for question 2 to question 5 on your worksheet.
139
Worksheet Two
1. Explain with reasons your choices for questions 1 and 2? What visual
information assisted you?
2. How did you draw the reflection? Explain.
3. How are the two graphs similar or different? Briefly describe what you know
about these types of graphs.
4. What is the broken line in graph A called? What does it mean to us? Why is the
graph of B not touching the x axis?
5. Which curves are increasing or decreasing? Show me with your pencil on both
graphs where the graphs are increasing or decreasing.
Worksheet Three
1. Explain how you arrived at your answers for the equations of f and g?
2. What do you understand by range?
3. How did you arrive at your answer for question 2?
4. Explain your answer for question 3.
5. If the graph of g(x) goes 30º to the right, what would the equation of g(x) be?
6. For which values of x is f(x) increasing and g(x) decreasing?
7. Show me on your graphs where you would read off for f(x) = g(x), f(x) > 0 and
f(x) > g(x).
140
APPENDIX D
TRANSCRIPTS OF INTERVIEWS
INTERVIEW BETWEEN RESEARCHER (R) AND LEARNER (A)
Worksheet One
R: Why did you select this particular method of sketching the graph?
A: Sir, the table makes it easier for me to write my graph because I just write
down the f(x) points below the x points.
R: These x values that you took. Did you take any values for x?
A: I just chose the values that I used to use in class when I‟m doing class work
and when I practise my maths.
R: I see you used a few points for drawing the graph. Why did you use only a few
points?
A; Sir, because of the time and of the size of the axis and my equation didn‟t have
big numbers.
R: That is why you just went up to four and minus four? And why did you join all
the points on your graph?
A: Because of the type of graph. It was a parabola and when you draw graphs you
need to attach the points.
R: Can you tell me what the meaning of this curve between the two points is?
A: Sir, the meaning, I just took the points from the table to the graph. My meaning
is that it‟s a happy face….My equation was positive, there was no negative, it was
x² only. I don‟t think I know the meaning of this curve.
R: Show me on your graph where you would read off f (3). Which axis would you
look at?
A: I would plot it on the x axis between 0 and 5.
R: Show me where you would plot f (42
1) and f (20)
Learner shows on the x axis.
R: Now where is 3, 8 on the x axis.
A: It is here below 4.
R: I see you didn‟t use arrows at the end of your graph. Did we have to use
141
arrows? What is the purpose of the arrows?
A: Yes we had to use arrows. It shows that the graph is going up. I made a
mistake.
R: Is there going to be any ending for the graph?
A: There will be no ending for the graph.
R: If you take f (20) would it touch your graph?
A: Yes it would touch.
R: Is there any need for the arrows at the end of your axis?
A: Yes, the graph is not stopping.
R: Show me on your graph where 2 and 3 are. Tell me; are there any numbers
between 2 and 3?
A: Yes sir, 2, 1 up to 2, 9. You get 2,1 ; 2,2 ; 2,3 ; 2,4 ;2,5 ; 2,6 ; 2,7 ; 2,8 ; 2,9 and
then 3. It will be up to nine numbers altogether.
R: Let‟s take the shape of your graphs. What words can you use to describe the
shape of your graph?
A: It‟s a happy face.
R: Why are you saying it‟s a happy face?
A: The equation of this graph is positive.
R: Are there any other words?
A: Yes the parabola is like a horse shoe.
R: Why are the graphs turning on the y axis? What in the equations relates to these
turning points?
A: It‟s the number in the end. Minus nine of the g graph is the turning point and
there is no number for the f graph after x², so it turns at zero.
R: Could you have drawn the graphs without the table?
A: Yes, but it would be difficult.
R: Why do you say difficult?
A: The table shows clearly the points.
R: Do you think the points are important?
A: Yes, they are important.
R: Have you heard of these two words, increasing and decreasing?
A: Yes.
R: Show me where your f graph is increasing?
A: It is increasing on the right hand side of the x axis.
142
R: And where is it decreasing?
A: On the left hand side.
R: Why is it increasing on the right hand side and decreasing on the left?
A: Because of the positive numbers on the right and the negative numbers on the
left.
R: Okay, have you heard of gradient? What does it mean to you?
A: It is used with the straight line.
R: Can you get a gradient with these curves?
A: Yes. At any point, this point has x and y, you can get the gradient.
R: I see you drew separate tables for f and g. Is there a relationship between f and
g?
A: Yes the x². The both are parabolas.
R: Can I get the g graph from the f graph?
A: Yes. From f(x) you just have to minus nine.
R: Let‟s say I gave you the f(x) graph and I told to use this to draw the g(x), what
would you do?
A: I‟ll still use the table; just take the domain I used for f.
R: You can‟t see the relationship with the minus nine.
A: Yes, the minus nine makes the graph go down by nine units.
R: Is there any need still for your table?
A: Yes, there is a need.
R: With regards to your answer for number two, the reflection of g(x) in the x
axis. How did you arrive at -x² + 9?
A: The reflection must be the opposite. It‟s a sad face.
Learner draws the graph of the reflection correctly without a table.
R: What helped you to get this answer?
A: The signs. Because of the positive in x² the reflection would be a negative. The
negative in the equation helped me to draw the sad face. I just used the equation to
get the reflection.
R: What do you understand by g(x) > 0 ?
A: I take the numbers from my table that are greater than 0.
R: What do you understand by domain and how did you get your answer of
-4<x<4?
A: Domain is the x values. I just take it from my table.
143
R: Even if you missed your arrows, the domain is still -4 to +4?
A: Yes, I take it from my table.
R: What do you understand by range?
A: It‟s the y value. I just take it from my table.
Worksheet Two
R: What are the reasons for your selection for 1.1 and 1.2?
A: Graph A is the hyperbola.
R: How did you match this with 1.1?
A: It is a fraction…a fraction is a hyperbola. The graph has two curves.
R: Why did you choose graph B for 1.2?
A: It is the exponent. The equation has the exponent. The exponent graph has one
curve.
R: For the equation of the graph of A, why did you write 3 for q?
A: It is the asymptote. The equation says qx
k, the q stands for the asymptote.
R: What do you understand by asymptote?
A: If q is positive the broken line will be by positive 3.
R: Can you show me any other asymptotes?
A: Yes. The x and the y, the original, are the asymptotes for graph A. The x and y
are also the asymptotes for graph B.
R: For the equation of B, why did you choose 2 for the value of a?
A: It is the two from the graph.
R: How did you draw the reflection?
A: I changed the positive two on the y axis into negative two on the y axis.
R: How are the two graphs similar or different?
A: One has the fraction, the other is the exponent.
R: Can you draw for me the graph of y =x
6.
Learner draws on the page freehand.
R: Where are the asymptotes?
A: The x and y axis, the originals.
R: What are the equations of the axis?
A: The y axis is y=0 and the x axis is x=0.
144
R: Why are the curves not touching the x axis?
A: I don‟t know why. The broken line means the graph shifted.
R: Show me on your graphs where they are increasing or decreasing.
A: For graph A, I don‟t know. For graph B it is increasing from the two upwards
on the right hand side of the axis.
R: When will the y intercept of Graph B be one?
A: When it is written as 1.2 x .
Worksheet Three
R: How did you arrive at your answers for f and g? How did you get a=2 and b=1
for the f graph?
A: The graph turns at y=2. The wave, the curve just turns at two. I got the
information from the graph…from 90°. The b=1 because the graph did not shift.
R: Draw the graph of y= 10 sin x.
(Learner draws freehand and plots y=10 on the y axis in line with the turning
point.)
How would you draw y= 10sin x +2.
A: The graph would start at 2 on the y axis.
R: How did you get q= -1 for the g graph?
A: The graph is in line with -1 on the y axis.
R: Draw the graph of y = cos x. Where does this graph start?
A: It starts at one.
R: Can you use this graph to draw y= cos x -2.
A: Yes, the graph will shift two units down because of the minus two.
R: Can you give me the range for the f graph?
A: It will be 2 and -2.
R: Now what will be the range if the graph shifts one unit upward?
A: It will be 3 and -1.
R: What helped you to get this answer?
A: The previous range, I‟m getting the range from the graph.
R: How did you get your period for the graph of f to be -180°; 180°?
A: It is the starting and the ending.
145
INTERVIEW BETWEEN RESEARCHER (R) AND LEARNER (B)
Worksheet One
R: What method did you use to draw the two graphs?
B: I looked at the x² and saw it was positive, and then I knew it was a happy face.
For the g graph I found the x intercepts x=3 and x=-3, and y intercept=-9 and I
plotted these on the graph.
R: Why did you join the -3 to -9 and then to +3? Are there any points on your
curve? Why did you not use a straight line to draw the graph?
B: Because it‟s a happy face, that‟s why I used a parabola. There are no more
points on the curve, just the three points I joined.
R: If I put a negative in front of the x², what graph would we get? Can you draw
that for me?
B: It would be a sad face.
Learner draws the graph correctly without any working.
R: Can you show me on your graph f (3)? Do you understand the meaning of
f (3)?
B: I don‟t understand f (3).
Researcher shows learner how to get point on the graph.
R: Can we get any numbers between 2 and 3?
B: Yes we can get 2, 1; 2, 2; 2, 3; up to 2, 9 and then 3.
R: Show me where we can get f (42
1) and f (20).
Learner shows 42
1 on X axis.
B: For f (20) we need to have a scale, like 5, 10, 15 20.
R: Why did you not use arrows on your graph?
B: I just stopped.
R: If I put arrows, what would be the meaning of the arrows?
B: It would be where the graph ends. Sometimes it can mean the graph continues.
R: What is the relationship between the f and the g graphs?
B: The x² and the x². They are parabolas. The turning point of the f is 0 and the g
is -9.
146
R: Can you get these points from the equation?
B: Yes, you can.
R: If I give you the f graph, can you get the g graph from the f?
B: The g graph came wider and the turning point changed.
R: Did you hear of increasing and decreasing? Can we get it from your two
graphs?
B: The f and the g is increasing because its going up and the y= -x²+9 is
decreasing because its going down.
R: Can we get gradient on these curves?
B: No. We get it only for straight lines.
R: What helped you to get the answer for the reflection?
B: The shape. The reflection of the happy would be the sad, that‟s why I got
y=-x²-9.
Worksheet Two
R: What helped you to get the answer A for 1.1.?
B: I knew the shape of the hyperbola. This is the equation of the hyperbola.
R: Why did you choose B for 1.2.?
B: Because the exponential graph, the equation is like that.
R: How did you get the +3 in y = 31
1
x for the equation of A?
B: This broken line, the asymptote.
R: If I changed this to -3 what will happen?
B: It will be down, the asymptote.
R: Do we have asymptotes on graph B?
B: No, only the dotted line in graph A is the asymptote.
R: What helped you to draw the reflection of graph B in the y axis?
B: The +2 on the y axis. I just took -2 on the y axis.
R: Why is graph B not touching the X axis?
B: I don‟t know.
R: What does the asymptote mean?
B: That the graph must not touch the line.
R: How would you draw y=2 x and what would the y intercept be?
147
B: I would use a table. It would be like graph B. The y intercept would be 2,
because of the 2 in y=2 x .
Worksheet Three
R: How did you get y = 2 sin x for the graph of f?
B: Because of the amplitude.
R: Show me on your graph where f(x) = g(x).
Learner rings the two points where the graphs intersect each other correctly, but
could not show where to read off the values.
R: Where would you read off f(x) > 0 and g(x) < 0?
B: For f it would be on the positive X axis and for g it would be on the negative X
axis.
INTERVIEW BETWEEN RESEARCHER (R) AND LEARNER (C)
Worksheet One
R: Can you explain to me how you did the sketch of f?
C: I used my calculator. Then I drew a table and used x values. I then found the y
values and drew my graph. The equation told me that it would be a happy face.
R: What helped you to say that it would be a parabola?
C: The x2.
R: How did you draw the graph of g?
C: I used the x2 and the minus nine. When you minus nine the graph would go
down by nine units and when there‟s a positive sign here it‟s going up.
R: I see you used dots. Let‟s take two dots. You joined them using a curve. What
is the meaning of the curve?
C: So that I can get the shape of the graph. I don‟t know the meaning of the curve.
I just know it‟s the shape, so I join the dots.
R: Can you show me how you would get f(3), f(4½) and f (20)?
C: I can plot the 3 and the 4½ on the X axis and go up. The 20, no the graph is
small. I think if it was a straight line, yes it would touch.
R: What is the meaning of the arrows on the graph?
C: It means that the graph continues.
R: Are there any points between two and three on the X axis?
C: Yes, there are ten points, 2, 1; 2, 2; 2, 3; 2, 4 up to 2, 9 and then 3.
148
R: What words can you use to describe your graphs?
C: It‟s a happy face.
R: Have you heard of maximum and minimum? What would these graphs be?
C: Yes, I‟ve heard of it. This graph is a maximum.
R: Why do you say that?
C: When something starts there and carries on. It‟s a maximum. There‟s no
minimum.
R: Have you heard of increasing and decreasing?
C: Yes, I have. The graph is increasing because it‟s going up.
R: Is there a relationship between f and g?
C: Yes. From the normal graph, if you add or subtract a number, the graph goes
up or comes down.
R: I see you did not write down the reflection. Can you draw a sad face? That will
be the reflection.
Learner draws the reflection buts write down the equation as f(x) = -x2-9.
R: What numbers are greater than 0 as in g(x) > 0?
C: One, two three and so on.
Worksheet Two
R: Why did you choose the graph of A for 1.1.?
C: Because there‟s an asymptote.
R: What does the asymptote mean?
C: It must be a dotted line. It cannot be a straight line. The graph won‟t carry on,
It‟s where the graph has got to end.
R: You are getting the meaning from the graph. Can you get it from the equation?
C: Yes. The q number is the asymptote. You just add it in the end.
R: Are the graphs increasing or decreasing?
C: In A these graphs are increasing. In graph B ….I don‟t know.
Worksheet Three
R: I see that you did not write down the equations of f and g. It does not matter.
But, when you see the graph of f, what name comes into your head?
C: I don‟t know.
R: Draw the graph of y=sinx from 0o to 360
o.
Learner draws the graph correctly.
149
R: Can you now draw y = 2sinx.
Learner draws the graph and starts from 2.
C: Yes. The graph moves upwards…starts from 2.
R: How would the graph of y= sinx + 2 look.
C: Oh! I made a mistake with the previous one. It would be for this equation
y= sin x +2…the graph moves up.
INTERVIEW BETWEEN RESEARCHER (R) AND LEARNER (D)
Worksheet One
R: What method did you use to sketch the two graphs?
D: I used the table method. I took -2, -1, 0, 1, 2 for x and substituted into the
equation and plotted the points.
R: I see that you joined the five dots. Can you tell me why you joined the dots?
D: My teacher taught me to draw the graph-a smiling face-a parabola.
R: What in the equation led you to draw a parabola?
D: The x2.
R: What is the meaning of the curve between the two dots?
D: Sir, I don‟t know.
R: Are there more points on this curve besides the five you plotted?
D: Yes there are. I started at -2. If I start at -3 there will be more dots.
R: Can you take any points between 1 and 2?
D: Yes I can take 1½.
R: Do you know what the meaning of f (3) is?
D: No, I don‟t know.
R: Why did you use arrows at the end of your graph?
D: To show that the graph can still increase if there are more numbers.
R: Why did you not take more numbers to draw your graph?
D: Sir, because my teacher taught me to take the five numbers.
R: Could you have taken -3 and -4?
D: Yes. I‟ll still get the same shape.
R: Are there any numbers between 1 and 2 on the X axis?
D: Yes, we can get nine numbers 1,1; 1,2; 1,3; 1,4; up to 1,9.
R: What words can you use to describe your graph?
150
D: A smiling face.
R: Show me when we can get a sad face.
D: When we get y = -x2.
R: What do you think is the relationship between a sad and a happy face?
D: The negative makes it a sad face.
R: Are your graphs increasing or decreasing?
D: I think the one with the negative is decreasing..it‟s going down.
R: Can we get the graph of g from the graph of f? Is there any relationship
between the f and the g graphs?
D: Yes-the x2.
Worksheet Two
R: Why did you select graph A for 1.1.?
D: Because you get a broken line.
R: What is the relationship between the two curves?
D: The second curve is the exponential- it only has one curve. The hyperbola has
two curves.
R: Do you know the name of the broken line?
D: It‟s the asymptote.
R: What does asymptote mean to you?
D: No, I don‟t know.
R: Does the B graph have an asymptote?
D: No, it doesn‟t have- asymptote is only a broken line.
R: I see for your graph of A you had the value 3 for q. Why did you use 3?
D: Because the asymptote was 3.
R: How would you describe your graphs in terms of increasing or decreasing?
D: The hyperbola, the second curve here is going down so it is decreasing.
Worksheet Three
R: For the graph of f you wrote 2 sin x. Why did you write the 2 in front?
D: From the y axis.
R: If the graph of f was in line with y=1, what number would you place in front of
sinx ?
D: It will be one.
151
R: Can you draw the graph of y = 10 sin x for me on this page?
Learner draws the graph correctly and indicates 10 and -10 on the y axis.
R: Can you show me where on your graph f(x) = g(x)?
D: No.
INTERVIEW RESEARCHER (R) AND LEARNER (E)
Worksheet One
R: Can you explain to me how you drew the graphs of f and g? I see that you did
not do any working for the graph of f.
E: First I pictured the parent graph; the parabola in my head...the x2 indicated that
it would be a parabola. I knew how the parent graph looks.
R: Why is the graph of f turning at 0?
E: It is the parent graph. My teacher told me that the parent graph will always cut
at 0 and if you have a -9 like the second graph it is a vertical shift-that is why I
started the second graph at -9.
R: I see that you also did working for the graph of g where you determined the x
intercepts and the y intercept. You did not take any points for x and plot these
points.
E: I felt that there is no need to take any points. The parent graph tells you that it
will be a parabola.
R: What is the meaning of f(x)?
E: It is the y.
R: Can we get any points on your graph of f?
E: Yes, you can get. You get an infinite number of points. You can get positive
numbers; you cannot get negative points because the graph is turning at zero.
R: What is meaning of the curves on the parabola?
E: I am not sure. I just know how the parabola is supposed to look.
R: Can you show me where on your graph you would get f (3)?
E: First I would put 3 for x in x2. Then I would get 9. So where x=3, y=9.
R: Can you get f (42
1) on your graph?
E: Yes you can, by going up.
R: But your vertical line from 42
1 will not touch your graph.
152
E: Yes it can touch. The arrows at the end mean that the graph goes on, so we can
extend the line.
R: Can we get f (20) on the graph?
E: Yes, we can. We need to extend our axis and plot 20 on the x axis. We can also
substitute 20 for x in the equation and get y = 400.
R: Can we put arrows on the axis and what would the arrows mean?
E: Yes. It means that the positive side goes to positive infinity and the other side
goes to negative infinity.
R: Are there any numbers between 2 and 3?
E: Yes, there are lots of numbers, when you put fractions, you can put fractions in
between.
R: How would you describe your graph in terms of maximum and minimum?
E: The graphs are minimum because it is turning upwards. If it turns downwards,
then we will get a maximum turning point.
R: Would you say that your f graph is increasing or decreasing?
E: The f graph is increasing, because it carries on to positive infinity.
R: When would the graph be referred to as decreasing?
E: When it is facing downwards, it goes to negative infinity.
R: Can we get the gradient on the curve?
E: No. Gradient is used for straight line, but you can get average gradient.
R: What does average gradient mean?
E: You can take any two points and find the average gradient.
R: What does the gradient mean?
E: The distance, maybe. I just know the formula.
R: You say that this graph does not have a gradient?
E: No, it does have a gradient. It has a average gradient.
R: I see that you indicated earlier that we can get the graph of g from f. Can we
get f from g?
E: Yes. I‟ll just drop the -9 and draw it, because I know it‟s the parent graph.
R: Can you explain how you got the answer g(x) = -x2+9 for question 2, the
reflection of g in the x axis? Your answer is correct.
E: I knew that it would be the opposite of x2-
9.
R: Explain to me the meaning of g(x)>0?
E: It would be where the x >0. It would be positive answers.
153
R: Why positive?
E: R: What does the domain mean?
E: All possible x values.
R: Why are you saying that x R? What do you understand by this?
E: My teacher told me that for the parabola it will be x R. If you had an
asymptote then the domain will change.
R: How did you get the range?
E: The range will be all the y values. That is how I got y Z… all the y values.
Because it must be greater than zero. On the positive side of the x axis we get
positive answers and the graph is going up, so x>3 and x>-3. For x>3 we are
going up and for x>-3 we are going up because we get positive y values.
Worksheet Two
R: Why did you select graph A for 1.1?
E: It‟s the hyperbola. I used the parent graph x
1 and this sign says that it is
x
k. I
knew that it was this graph. For all graphs, we get it from the parent graph. You
can picture it in your mind and then you look at the shifts.
R: And the second graph?
E: It is the exponential. The x in y=abx is the exponent and the shape of the
exponential graph goes like that.
R: Why did you write 3 for the q value in question 2?
E: I know that from the parent graph this graph went 3 up, so q has to be 3, the
asymptote is 3.
R: What do you understand by asymptote?
E: The graph will come closer and closer to the asymptote but it will never touch.
R: Are there any other asymptotes in graph A?
E: Yes, it‟s the x and y, but for this graph it‟s the y, because it is not touching the
y.
R: And for graph B, does it have asymptotes?
E: Yes, it‟s the x axis.
R: Do you know why it is not touching?
E: Not really.
R: Do you know of any other graph that has asymptotes?
154
E: Yes, the tan graph, it does not touch at 90oand 270
o.
R: Why?
E: Because it contains the shape of the tan graph.
R: How did you get 2.2x for graph B?
E: I took the 2 from the graph. The „a‟ has to be 2 because bx is one1 for any
number of b because it will be raised to the 0 and that will be one.
R: Would you say that graph A and graph B is increasing or decreasing?
E: Both graphs are increasing and decreasing, increasing where it goes up and
decreasing where it goes down.
Worksheet Three
R: How did you get the answer a=2 for graph f?
E: I knew the „a‟ in front of the sin…what effect it has on the graph. It is the
amplitude. It means the maximum and minimum values of the graph.
R: Where did you get the 2 from?
E: From the y axis.
R: How did you get b=5?
E: Oh! I guessed that one.
R: How did you get q=+30o for graph g?
E: I knew that it will be the horizontal shift. When you add or minus, it will be the
horizontal shift. I knew that the cos graph will be 90o at 0. When you go to the left
it will be plus and when you go to the right it will be minus.
R: You just knew that as a rule?
E: Yes, I knew that as a rule. So the 90o
went to 60o… it went 30
o back, so it had
to be plus 30o.
R: How did you get your range to be 3;-3 for question 2?
E: When you go up one unit from 3, it will be 3 and -1. So your maximum is 3 and
your minimum is -1.
R: So, if you get 3 on top, you will get -1 at the bottom. If you get 4 at the top
what will you get at the bottom?
E: Yes, you will get -4 at the bottom.
R: Explain how you got the period to be 360o for the graph of f?
E: The parent graph starts at 0o and ends at 360
o. This graph starts at -180
o and
ends at 180o. So the period is 360
o.
155
R: Where would you solve for f(x) =g(x)? Where would you read your answer?
E: At where the graphs intersect each other. I will read from the x axis.
R: How would you solve for f(x)>0?
E: It would be above the x axis… all the positive values.
R: How would you solve for f(x) > g(x)?
E: It would be from the points of intersection where the f graph is above the g
graph?
R: So if the second point of intersection is 15o, what would be your answer?
E: It would be x > 15o .
INTERVIEW BETWEEN RESEARCHER (R) AND LEARNER (F)
Worksheet One
R: Describe the methods you used in sketching the graphs of f and g.
F: For my f graph I looked for the x intercept and since the equation is y=x2,
I
knew that it would start at the origin and since it is a positive it went upwards. For
the g graph I also worked the x and the y intercept. I worked out the x intercepts to
be +3 and -3and I plotted these on the axis. Then I worked out the y intercept to be
-9. Since its positive it goes upwards.
R: I see that you joined the three points -3,-9 and +3. Why did you join them and
make a curve?
F: The equation is a quadratic function, so it will have that shape.
R: Let me take two points that you joined on the g graph, -3 and -9. There is a
curve from -3 to -9. Do you know the meaning of this curve?
F: It is increasing. I don‟t know the meaning.
R: Are there any more points on this curve?
F: We can get two more points from -3 to -9.
R: If you take the entire curve of g, how can we get more points?
F: We can use the table method. We can take -3,-2,-1, 0,1,2,3 for x and substitute
in the equation to find y.
R: Now let us take f (3). What does this mean?
F: You substitute 3 for x in y = x2and you get 9.
R: What does this mean?
F: That the y value is 9.
156
R: Can we get f (42
1) and f (20)?
F: Yes. But for f (20) we have to draw a longer x axis and extend the graph.
R: I see that you inserted arrows at the end of your graphs. What do these arrows
mean?
F: That it goes to infinity.
R: Why are the arrows pointing upwards?
F: Because the gradient is positive, so it points upwards. If the gradient is negative
it will point downwards.
R: What does gradient mean?
F: The gradient means the slope. For the parabola graph it means the way the
graph is pointing.
R: What is the gradient of y = x2?
F: It is one… the number in front of x2.
R: If it was y = 3x2, what would the gradient be?
F: It would be three.
R: Let us take the number two and three on the x axis. Are there any points
between these points?
F: Yes, about ten, I think you can get 22
1 , 2
4
1 and so on.
R: What words can you use to describe your graphs?
F: Positive graphs.
R: How would you describe the graphs in terms of maximum and minimum?
F: The graph of g is minimum at y=-9 and the f graph at 0.
R: When can we describe the graph as maximum?
F: When the equation is negative and the graph points downwards.
R: What does increasing and decreasing mean in terms of your graphs?
F: The graph of f first decreases and then it increases.
R: Why makes you say that?
F: If you take the f graph on the left hand side of the axis, it is decreasing because
the y values get smaller, like 10, 9, and 8 and so on. But on the right hand side it
increases because the y values increase from 0,1,2,3 and so on.
R: What tells you that the graph is increasing or decreasing?
F: The values of the y.
157
R: Can you see any relationship between f and g?
F: Yes, the f(x) does not have a y intercept. It is in the form y=ax2 and the g(x) has
a y intercept and is in the form y=ax2 +c.
R: Now, tell me, can we get the graph of g from the graph of f?
F: Yes, you‟re transforming it. You just draw it below that.
R: Let us now take your answers for questions two to question five. What do you
understand by reflection?
F: When the graph is reflecting…mirror image.
R: Explain your answer –x2+9.
F: The signs are opposite x2+9, that means that the graph will be sloping the other
way and the y intercept will be +9. Instead of being a happy face, it will be a
frown face.
R: What helped you to get the answer?
F: I just changed the signs around.
R: Explain your answer of x>3 and x<-3 for finding values of x where g(x)>0.
F: For x>3 it will be values like 4, 5, 6 and -4,-5,-6 for x<-3.
R: Let us now take the next concept, the domain. What do you understand by
domain?
F: It is all the x values.
R: How are these values related to the graph of f?
F: xεR, these include counting numbers, integers and not surds. I don‟t know what
it actually means in terms of the graph.
R: And what would you say the range of the graph of g is and why?
F. The range is the y values, y≥-9 ; because the graph is going upwards from -9.
Worksheet Two
R: In the matching exercise why did you select Graph A for 1.1?
F: Because it‟s the hyperbolic function.
R: What indicated to you that it is a hyperbolic function?
F: The graph and the equation.
R: What in the graph assisted you?
F: Because of the way it is shaped, and it has two asymptotes.
R: Which are the asymptotes?
F: 3, the q value and the y axis, x=0
158
R: So, you indicated what helped you in the graph. What in the equation is related
to the graph?
F: I don‟t know.
R: You mentioned asymptotes; tell me what asymptotes mean to you?
F: The graph, when it goes near to the line, it does not touch.
R: Do you know why it would not touch?
F: No, I don‟t know.
R: For 1.2 what told you that it would be the graph of B?
F: It‟s an exponential function. The graph assisted me.
R: What in the equation assisted you?
F: It‟s the x exponent.
R: Are these two graphs similar or different in any way?
F: They are similar and different. Graph A has two curves and graph B has one
curve, and graph B is increasing.
R: Since you mentioned increasing, tell me whether the two graphs are increasing
or decreasing?
F: Graph A is increasing because its going to the right. It‟s actually decreasing on
the y axis and increasing on the x axis. Graph B is increasing.
R: Why is graph B increasing?
F: Because of the way it‟s sloping. From decreasing it goes to increasing, because
the negative numbers are decreasing on the x axis and on the positive side it‟s
increasing.
R: Can we get the y intercept of graph B is equal to one?
F: You mean where the graph touches?
R: Yes.
F: I don‟t know.
R: You explained the q=3 for 1.1. Can the k value be any number to get the same
shape as graph A?
F: Yes it can be any number, but just that the intercept would be different.
R: Explain your reflection for graph B in the y axis?
F: I just did the same as previously. I just changed the signs.
Worksheet Three
R: What helped you to get a=2 and b=1 for the graph of f?
159
F: „a‟ is the amplitude and the amplitude for the graph is 2 from the y axis.
R: And the b=1?
F: There, I saw how many wave cycles there are and there‟s one wave cycle.
R: For the graph of g, how did you get q=+60°?
F: First I took cos x, it would be one wave cycle passing through the origin. But
now it shifted and it‟s on 60°. So, it shifted 60°. I took +60° because of the plus in
the equation.
R: You spoke of a wave cycle in the graph of f. Can we get many cycles?
F: Yes, we can get many cycles.
R: What assisted you in getting the new range for f in question two?
F: I used the graph. When we get a vertical shift the graph moves up one unit, the
-2 becomes -1 and the 2 becomes 3.
R: Can you write for me the new equation of f?
F: It will be y= 2sinx +1.
R: That is correct. Tell me how did you get the period = 360° for the graph of f?
F: There is one wave cycle from -180° to +180° and it covers 360°.
R: If the graph of g goes 30° to the right, what would be the new equation?
F: It would be cos(x+90°).
R: What is the meaning of the curve of f?
F: That x>0.
R: What I really mean, like 1°, 30, 5° and so on.
F: Yes, we can get that. It will be a really big graph.
R: Let us describe f in terms of increasing and decreasing?
F: It decreases then increases and then decreases.
R: Where on the graph is f(x) =g(x)?
F: At the points of intersection.
R: And g(x)>0?
F: It‟s the part of the graph greater than 0 on the x axis, the x values.
R: And g(x) <0?
F: It‟s the negative side of the axis.
160
INTERVIEW BETWEEN RESEARCHER (R) AND LEARNER (G)
Worksheet One
R: Can you describe to me the method that you used to sketch the graphs of f and
g? What helped you to sketch these graphs?
G: For the f graph, seeing that there was no y value, I just took a few points for x
and substituted into the equation. I used my calculator.
R: What values did you use for x?
G: I started with 0 and then went up to 5 and -5. I also did the same for the graph
of g.
R: Can you tell me why you took only a few points to draw your graphs? Could
you have taken more points?
G: For parabolas you don‟t really need to take many points. It just goes the same
always and continues with the arrows.
R: I see that you joined the dots with curves. Why did you do use curves and not
straight lines?
G: We learnt that parabolas are not really straight. You have a sad face or a smiley
face.
R: What indicated to you that it would be a parabola?
G: Because of the x2.
R: If you take any two points on the curve, what is the meaning of the curve
between the two dots?
G: It means average gradient.
R: What do you understand by average gradient?
G: The x and the y values, as it increases it goes like that kind of way.
R: Does the curve mean anything to you?
G: No, it does not mean anything.
R: If I asked you to find f(3), how would you do that?
G: I‟d just substitute x with 3 in the equation and I would get 9.
R: Can you show me the meaning of f(3) on the graph.
Learner points to 3 on the x axis and goes across to 9.
R: Now can you show me on the graph f )2
14(
G: Same way as we got f(3).
161
R: Show me how you would get f(20)?
G: You‟d have to extend the x axis.
R: Would it touch your graph?
G: What do you mean by touch?
R: Like how we did f (3).
G: Yes it would.
R: I see that you did not use arrows at the end of your graph?
G: Oh! I was supposed to use arrows?
R: What would the arrows mean?
G: It would mean that the graph continues up to infinity.
R: Can the axes also have arrows?
G: Yes, it would mean that it can continue to infinity.
R: Let us take two points on the x axis, 2 and 3. Tell me; are there any points
between these two points?
G: Yes, many , comma something, comma many zeros.
R: Can you use any words to describe your graphs?
G: Yes, they are minimum graphs.
R: Why do you say that?
G: Because they are smiling face; they start at a lower point and goes higher, the y
value starts low and gets bigger.
R: When would you get maximum?
G: Maximum, is the other way around, the frown.
R: Can you explain the meaning of maximum in terms of your graph?
G: The y value starts high and goes lower.
R: Can you describe your graphs in terms of increasing and decreasing?
G: If you take the f graph, it increases and decreases, decreases down this way and
increases up this way or it can decrease this way and increase the other way on the
negative side of the x axis.
R: What tells you that the graph is increasing or decreasing?
G: The decreasing the x values increase and the increasing the x values increase.
R: Where would you get gradient on the your graph?
G: You take any two points and substitute into the gradient formula.
R: Where would the gradient be equal to 0?
162
G: At the origin for the graph of f, because the y value is 0 and for the graph of g
at y=-9.
R: Why at y=-9?
G: I don‟t know.
R: Is there any relationship between the graphs of f and g?
G: Yes, they are the same graphs, just that the g graph has gone through a vertical
shift.
R: Explain vertical shift to me?
G: Moving up or down and in this case moving down because of the -9 in the g
graph.
R: Can I draw g from the f?
G: Yes, the f graph there‟s no x intercepts and y intercepts. The y intercept of g is
-9. You decrease all the points on the f graph by -9. The 25 comes down to 16,
the 16 comes down to 7 and so forth.
R: What do you understand by reflection?
G: It is still the same image but the other side of it.
R: How did you get your answer?
G: When you reflect the g graph, it becomes sad and you just change the signs,
negative becomes positive and positive becomes negative.
R: How did you get the answer for the values of x when g(x)>0?
G: For the x values less than -3 the y is greater than 0, and for the x values greater
than 3 the y is greater than 0.
R: Explain the meaning of domain?
G: All the x values in your graph. For the f graph xεR because for any value of x
you would get a y value.
Worksheet Two
R: Can you explain why you selected A for 1.1?
G: Because of the hyperbola in the graph.
R: Anything in the equation helped you?
G: Yes, the q. The q would be the asymptote. The asymptote is at 3.
R: What do you understand by asymptote?
G: The graph would go close to it but never touches it.
R: Do you know of any other meaning?
163
G: No, it is just the q value.
R: How many asymptotes are there?
G: There are two, the other one is the y axis, the x-p =0, so p=0, therefore x-0=0,
so x=0, which is the y axis.
R: For 1.2, why did you select graph B?
G: The equation has something to the power of x, so that means it‟s the
exponential graph.
R: Describe the graph of A?
G: The standard form of the hyperbola is y=x
k and the x and y axis are the
asymptotes.
R: How did you get the equation for the graph of A?
G: The +3 is the asymptote, so the q value is +3.
R: How did you get the equation for the graph of B?
G: The answer is y = 2.2x. The first 2 I got from the graph because when x=0,
anything raised to the power 0 is equal to 1, so 2 times 1 is 2.
R: How did you get the reflection for the graph of B?
G: I looked at the graph and folded on the y axis.
R: How would you describe graph A in terms of increasing and decreasing?
G: Both, increasing and decreasing. The top curve is increasing because as the x
increases the y is increasing, and the other curve is decreasing because as the x
decreases, the y is decreasing.
R: And the graph B?
G: One increasing and one decreasing. The y values are increasing and the x
values are decreasing.
Worksheet Three
R: For the graph of f, how did you get a=2?
G: Because of the amplitude, the highest point on the graph, which I would read
from the y axis.
R: For the value of b, how did you do that?
G: I did not know.
R: Can we continue with the graph of f?
G: Yes.
164
R: Why is the graph stopping at 180°?
G: Because of the domain.
R: The given g graph, from where can we derive this graph?
G: The cos graph is stretched.
R: What would be the range of the f graph?
G: It would be from 2 to -2 on the y axis.
R: How did you get the answer for question 2?
G: The vertical shift of I unit, the -2 goes to -1 and the 2 goes to 3.
R: What would be the new equation of f for the vertical shift?
G: The a=2 would become a=3, it would affect the amplitude.
R: Explain the period of f(x)?
G: The graph starts at -180°and ends at 180° and that gives 360°, the period for
the sine graph is 360°.
R: How would you solve for f(x) = g(x)?
G: Here I would see where they intersect.
R: Where would you read off the values?
G: I would draw a table and where I see similar values I get my answers.
R: And where is f(x)>0?
G: Above the x axis, from 0° to 180°.
INTERVIEW BETWEEN RESEARCHER (R) AND LEARNER H
Worksheet One
R: Describe to me the method that you used to draw the graphs of f and g.
H: I used my calculator. I used -4 to +4 as the domain and I found the y values
and I plotted the points on the graph.
R: You did that for both the graphs?
H: Yes.
R: Why did you take only a few points to draw the graphs? Could you have taken
more points?
H: Yes, but it would take more time.
R: Can you tell me the reason for joining two points on the graph?
H: To make a continuous graph. It is the shape of the parabola, so I just join the
points. The x2 tells us that it would be a parabola.
165
R: Do you know the meaning of the curve between the two points?
H: I don‟t know what the meaning is.
R: Okay, can I get any more points on this curve?
H: Yes, by putting in more x values, you can get more points.
R: I see that you put arrows at the end of your graph. What is the meaning of the
arrows?
H: It shows that the graph is continuing, goes on.
R: What does f(3) mean?
H: I don‟t know. I think you would solve for f.
Researcher shows learner what it means in terms of the graph and substituting 3
into equation we get y = 9.
R: Can we get f(4 )?
H: Yes, by substituting into equation.
R: Can we get f(20)?
Learner pauses.
H: We can get it somewhere in the end of the x axis.
R: Let us take two of your x values, 2 and 3. Are there any numbers between these
two numbers?
H: There are many smaller numbers.
R: Why are the arrows pointing upwards?
H: It is pointing to positive.
R: Can you use any words to describe your graph?
H: A continuous graph, a smooth curve.
R: Can you use the words increasing and decreasing for your graphs?
H: Yes, the f graph is increasing.
R: Why do you say that the graph of f is increasing.
H: It is going upwards, positive numbers.
R: When would the graph be decreasing?
H: When it is going downwards.
R: Where are the graphs maximum or minimum?
H: These graphs are minimum at 0 and -9. If it is going down, then we would get a
maximum turning point.
R: Can we find the gradient of the graph?
166
H: Yes, in between any two points.
R: What does the gradient mean in terms of the curve?
H: I don‟t know.
R: Can I get the graph of g from the graph of f?
H: Yes, -9 means the f graph comes 9 units down.
R: What do you understand by reflection?
H: Something that is upside down.
R: How did you arrive at the answer for g(x) > 0 as x < -3 and x > 3?
H: For x < -3 the y values are positive and for x > 3 the y values are also positive.
R: How can you relate the domain of the graph of f, x , to your graph?
H: If you go on the positive x axis, we would get real numbers and also on the
negative axis we would get real numbers.
Worksheet Two
R: Can you explain why you selected graph A for 1.1?
H: I saw the asymptotes on the graph and the equation is the standard form for the
hyperbola.
R: What is the meaning of the asymptote?
H: The graph will go close to the asymptote and never touches it. The asymptote
is the q value in the equation.
R: How many asymptotes are there in graph A?
H: Only one, the dotted line.
R: Are there any asymptotes in graph B?
H: No, there are no asymptotes.
R: How did you get the answer y = 2.2x for graph B?
H: I used the 2 from the y axis for the 2x and then I used my calculator to get the
rest of the answer.
R: Can we get the y intercept to be one? If so, what would the equation be?
H: Yes, the equation would be y = 1x.
R: How did you draw the reflection of graph B?
H: I put a negative in front of y = 2.2x and then I used my calculator by taking x
values and finding y values.
R: How would you describe your graphs A and B in terms of increasing and
decreasing?
167
H: Graph A is decreasing because as the x increases, the y values decrease. Graph
B is increasing because as the x increases, the y values also increase.
Worksheet Three
R: How did you arrive at the answer f(x) = 2 sin 1 x?
H: For the a =2, I got this from the amplitude on the graph and for b = 1, since the
x values do not change, the b = 1.
R: How did you get q = 30° for the graph of g?
H: The graph is shifted horizontally to the left. The highest point of the cos graph
is normally 1 on the y axis. This point shifted to the left 30°.
R: How did you arrive at the answer of y = 2 sin x + 1 for the vertical shift of one
unit?
H: The graph moves up one unit and for vertical shift the number goes in the end.
The new range is now 3 and -1.
R: What do you understand by period?
H: It is the length of the graph. Therefore the period for f(x) is [-180°; 180°]. It
starts at 180° and ends at 180°.
R: How would you describe the graph of f in terms of increasing and decreasing?
H: It is increasing for positive x values and decreasing for negative x values.
R: How would you get f(x) > 0?
H: It would be above the x axis, the y values greater than 0, from 0° to 180°.
INTERVIEW BETWEEN RESEARCHER (R) AND
EDUCATOR/TEACHER (T1)
Worksheet One
R: Can you describe to me what method you used to sketch these two graphs?
T1: For the first graph f(x) I used the table method and for the second one I used
the x and y intercept.
R: For the first graph you said you used the table method; did you take points?
T1:Yes, I took x values from -2 to +2.
R: I notice that you joined the points for the graph of f. Why did you join these
points?
168
T1: Okay, If you take these points between 0 and 1, they won‟t be direct
proportion there. (0,1)2 and (0,2)
2 they won‟t be in proportion. That would be the
reason for getting a curve and not necessary a straight line.
R: And what is your reason for joining the five points?
T1: Between say 1 and 2 there are corresponding points. Instead of just leaving
dots, you would have a continuous curve.
R: What do you mean by continuous curve?
T1: For all x values you would get corresponding y values.
R: What does it mean to join the two points to form a curve?
T1: Those are all your corresponding x and y values.
R: How would you determine f (3)?
T1: I would substitute 3 for x in the equation.
R: What does f (3) mean in terms of the graph?
T1: That your corresponding y value for 3 is 9.
R: And f (4 ?
T1: It would be (42.
R: And f (20), how would you show that on your graph?
T1: Well, not on this one, it will be a large number, depends on your scale.
R: I see that you used arrows at the end of your graph. What is the meaning of the
arrows?
T1: It means that the graph will continue as you take bigger x and smaller x
values.
R: Let us take the number 2 and 3 on the x axis. Are there any numbers between
these two numbers?
T1: Yes, there is a whole lot of numbers between 2 and 3.
R: About how many?
T1: Depends how many decimal places you want to go. If you go one decimal
place, there will be ten numbers. If you go two decimal places, there will be more
numbers.
R: Can we get a set number of figures in between?
T1: No.
R: What words can you use to describe the shape of the graphs?
T1: Parabolic, happy face.
169
R: What is indicating to you that it will be a parabola?
T1: Yes, if you got x2, then that will indicate that it will be a parabola.
R: In terms of your graph, what does increasing and decreasing mean?
T1: If we look at the graph from left to right, the positive gradient will give you
increasing. Increasing will be from x>0 and decreasing from x<0 on the x axis. As
you take x values smaller than 0, the graph is going down, therefore it is
decreasing and as you take numbers bigger than 0, the graph goes up, increasing.
R: Does the graph have a gradient?
T1: No, but it can have average gradient.
R: Can we draw the graph of g from the graph of f?
T1: Yes, it‟s an identical graph, with adding -9, the graph has gone down nine
places.
R: Can we get the graph of f from the graph of g?
T1: Yes, you could, you just ignore the constant.
R: Can you explain how you arrived at the reflection of g(x) to be g(x) = -x2+9?
T1: I looked at the original graph, and I reflected those points on the x axis. I
looked at the new graph, and because it is a sad face, the a is going to be negative.
The -9 on the original, if you reflect -9 it will be +9 on the y axis.
R: Did you use the equation to help you?
T1: Yes.
R: What do you understand by g(x)>0?
T1: Where you are getting positive y values, When I look at my graph, from -3 to
+3 the graph is below the x axis, you are getting negative y values, but as you take
numbers >+3 and <-3, you are getting positive y values.
R: Explain your domain of f, x Z.
T1: For all values of x on the x axis there will be a y value.
R: What are integers?
T1: This should be real numbers.
R: How did you get the range of y ≥ -9 for the graph of g?
T1: I looked at the lowest point -9 and I took the values greater than -9 on the y
axis.
Worksheet Two
R: Why did you match graph A with 1.1?
170
T1: That‟s the standard form for the hyperbola and when you look at graph A, it is
the hyperbola.
R: And for 1.2?
T1: It‟s the same. The equation is the standard form for the exponential and I
matched it with the exponential graph B.
R: Is there any other information that helped you?
T1: No, I just related the equation to the graph.
R: If you take graph A, what is the name of the dotted line?
T1: Asymptote.
R: What do you understand by asymptote?
T1: It means that for the graph there is no corresponding y value at that point, at
y=3 there is no x value; x is the denominator. The 3 means the graph has shifted 3
units up.
R: Which graph?
T1: The hyperbola, normally at y=0 you get the asymptote, so it means the
asymptote has shifted 3 units up.
R: And what does asymptote generally mean?
T1: That the graph is undefined for that value y=3.
R: Explain your possible equations for Graphs A and B?
T1: I took the 3 as the asymptote for the q value and any value for k. For the graph
of B I wrote y = 2.2x; normally for the exponential graph where you get a
x, the y
intercept is 1, but this y intercept is 2, so the a in y=a.bx is 2.
R: How would you describe graph A in terms of increasing and decreasing?
T1: It is decreasing. As you take bigger x values the y values decrease.
R: So, this is different from the f(x) =x2.
T1: Yes.
R: Can we not use this same explanation for the parabola.
T1: Yes we can.
R: What helped you to draw the reflection of the graph of B in the y axis?
T1: I looked at the y line and if you take corresponding points, you will be able to
get an idea how the reflection will be.
R: What would be the equation of this reflection?
T1: It would be y = 2. (x.
171
R: It won‟t be 2.2-x
.
( after some hesitation)
T1:Yes.
Worksheet Three
R: Explain your answers f(x)= 2 sin 1x and g(x)= cos (x+30°)?
T1: A normal sine graph goes up to 1 and -1, in terms of amplitude; and this graph
goes up to 2 and -2, so the amplitude is the a = 2. The sine graph if it continues on
the positive side it will end up at 360°, so the normal period of the sine graph is
360°, so I did not have to interfere with the b at all, I just left it as it is.
R: How did you get q=30°?
T1: Normally the cos graph at 0 is +1 on the y axis, so when I look at -30°, it is
giving me +1, so that graph has shifted 30° to the left, so the y=cos x helped me to
get this answer.
R: How did you get the range for question 2?
T1: This graph will now shift 0ne unit up. The lowest point on the original is -2,
so if it shifts up the lowest point is -1 and the highest point is 3.
R: How did you arrive at the period of 360° for the graph of f?
T1: If you look at what is given, it is one complete wave motion, starts at -180°
and ends at +180°, so the total is 360°.
R: Why is f(x) ≠3?
T1: Because it is outside the range.
R: For which values of x is f(x) increasing?
T1: It will be from -90° to +90°?
R: What is helping you to get the answers so quickly?
T1: Just the x values and I look at the lines going up and coming down.
R: How would you get f(x)>0?
T1: You look above the x axis , for positive y values.
R: And f(x)>g(x)?
T1: You look at your graphs physically, where your f graph is above the g graph
because that is where your values for f is bigger than the y values for g.
INTERVIEW BETWEEN RESEARCHER (R) AND
EDUCATOR/TEACHER (T2)
172
Worksheet One
R: Can you describe to me the method you used to sketch the graphs of f and g?
T2: I looked at the equation of f(x) and what the rules are about the parabola,
about the impact of the a and so on. Just to get a rough idea about where it lies in
the Cartesian plane, I just took two points x=1 and x=-1 and plotted them.
R: And how did you sketch the graph of g?
T2: I looked at the equation as well and I calculated the x and y intercept.
R: What made you join the x intercepts to the y intercept to form a curve?
T2: Because you‟re teaching it for so long and you just know that it has to be a
parabola and the x2 indicated that it will be a parabola.
R: What do you understand by the curve that joins the two points?
T2: Gradient, I would say, that‟s why we talk of a curve, because the gradient is
changing all the time.
R: Can we get more points on this curve?
T2: Yes we can.
R: About how many?
T2: Numerous.
R: So you say that your understanding of the curve is related to the gradient?
T2: I would say that because of the gradient and of the equation having x2.
R: How would you determine f (3)?
T2: By substitution, when x=3 then y=9.
R: In terms of your graph, what does this mean?
Educator did not immediately answer. Researcher pointed out x=3 and projecting
on graph to find 9.
T2: Yes, it is a point on the graph.
R: How would determine f (4 .
T2: By substitution.
R: How would you determine f (20) and explain in terms of your graph?
T2: By substitution, but we cannot show it on this particular graph, it is not
accommodating. You can get 20 but you just have to adjust your scale.
R: What is your understanding of the arrows at the end of the graphs?
T2: The domain is real and the graph will go on indefinitely.
173
R: Can we say that for any value for x we will get a corresponding y.
T2: Yes, as the x increases the y increases. The arrows are pointing upwards
because it‟s going in that direction.
R: Are there any points between 2 and 3?
T2: Yes, infinite number of points.
R: Let‟s take the shape of the graph-what words can you use to describe the
shape?
T2: We normally use the smiling, happy and sad face.
R: Maximum and minimum? Did you use these words?
T2: Yes, looking at the shape of these graphs, you can see the lowest point,
therefore it‟s a minimum, at the turning point...the graph is changing direction.
R: And maximum?
T2: The highest point...the highest y value.
R: How do you normally teach this section on graphs?
T2: I start with the table method. Then I move on to the five point method, the x
and y intercept, turning point and axis of symmetry. Learners would use their
calculators to get the values for the table…now the calculators can do the table as
well, where learners just have to punch in the function and so on.
R: How would you describe the graph in terms of increasing and decreasing?
T2: It‟s decreasing to the left of 0 and increasing on the right.
R: Can you explain increasing and decreasing?
T2: It‟s related to the gradient. The function is decreasing when its gradient is
negative and increasing when its gradient is positive. Also we can say that as the x
increases, the y decreases and it will be a decreasing function. As the x increases
and the y increases, it will be an increasing function.
R: Is there a relationship between the graphs of f and g?
T2: The f has shifted 9 units down vertically.
R: Can we get the graph of g from the graph of f?
T2: Yes, we can- we shift it down nine units. It might be a parallel shift to the
curve of f(x) because of the average gradient. Here the a is constant in both
graphs, so I‟m just assuming the graphs are parallel.
R: If we give learners to sketch h(x) = x2+3, would they see a relationship with
f(x) = x2?
174
T2: I think they would. With the new FET syllabus I think they would see the
shift. Previously we never taught like that. The transformations and the shifts is
making learners understand graphs better.
R: How did you get the reflection of g(x) in the x axis?
T2: I just flipped it on the x axis and I saw this point being -9 and it will just flip
to 9. The reflection is a mirror-image. Every point is transformed about the x axis
in this case.
R: Can we say that when we flip this over, we just change the signs?
T2: Yes, we can, because the y changes sign.
R: What does g(x)>0 means?
T2: It‟s the y value greater than 0. We look above the x axis, because y>0 above
the x axis. So just looking at that I interpreted this question.
R: How did you get the domain?
T2: The domain is the x values and since I put my arrows in here the domain
would be real. It means that every point on the x axis is taken into consideration.
R: How did you work out the range/
T2: I looked at the lowest point on the graph and I can see that this graph is going
Up and I saw that it can only encounter numbers greater than or equal to -9.
Worksheet Two
R: Describe why you selected graph A for 1.1.?
T2: I looked at the asymptote line which is y=3. This stands for the q value in the
equation. Therefore I selected graph A.
R: Explain why you selected Graph B for 1.2.?
T2: Graph B has the shape of an exponential function. It is an increasing curve.
The equation is also in the exponent form. I therefore related both.
R: You mentioned asymptote; what do you understand by asymptote?
T2: The graph is undefined at that point y=3. The other asymptote is the y axis.
R: Can you explain this concept of undefined?
T2: I relate this to my primary school knowledge of division by 0 is undefined,
other than that there is nothing.
R: Are there any asymptotes in the second graph?
(After much hesitation)
T2: It does not cut the x axis, so I would assume that the x axis is the asymptote.
175
R: When would graph B have no asymptotes?
T2: After it has transformed.
R: Explain your possible equation for graph A, y = + 3?
T2: This graph does not have a y intercept. It has an x intercept. That is why I
wrote + 3. There is no horizontal shift. The 3 is the asymptote.
R: Explain your answer y = 2.2x for graph B?
T2: The first 2 is due to the y intercept being 2, because 20 is 1 and 1x2 =2.
R: Can the b in y =a bx be any value:
T2: No it cannot be anything. The graph is increasing, so b>1.
R: What would be the equation of the reflection of Graph B in the y axis?
T2: It would be y = 2.2-x
.
Worksheet 3
R: How did you get the equation of f(x)?
T2: The amplitude is 2, so a=2. For b=1, I looked at the period of the graph which
is 360°.
R: Explain the answer for the graph of g?
T2: It is the cos graph which has transformed horizontally. I had the picture of the
normal cos in my mind. The normal cos would have cut the x axis at 90°, so I
looked at this one cutting the x axis at 60° which told me it‟s being transformed to
the left by 30°, so I inserted that into the equation.
R: Explain your range for question 2?
T2: I looked at the amplitude again and we shifting this graph one unit up, so I
transformed this graph one unit up.
R: What do you understand by range?
T2: The range would be all the y values that the graph encounters.
R: Explain the period of to be 360°?
T2: I looked at half the graph of sin x, which is 180°, so the wavelength is 360°.
R: Why is f(x) ≠3?
T2: Because the amplitude in this case is 2, you won‟t get a value of 3 unless the
amplitude is 3.
R: How would you explain f(x) > g(x)?
176
T2: Where the sine graph is lying above the cos graph and you can see it at these
two points.
R: Why are you saying above?
T2: Because of the greater than.

177

178

179

180