Embed Size (px)
Citation preview
The SACMEQ III project in
A study of the conditions of schooling and the quality of education
Southern and Eastern Africa Consortium for Monitoring Educational Quality
BOTSWANA

iii
AUTHORS
Boikhutso Monyaku, Botswana Ministry of Education and Skills Development, Division of Planning Statistics and Research
Email: [email protected]
Onkabetse A. Mmereki, Botswana Ministry of Education and Skills Development, Division of Planning Statistics and Research
Email: [email protected]
iv
ACKNOWLEDGMENT
SACMEQ wish to acknowledge the generous financial assistance provided by the Ministry
of Foreign Affairs of the Government of the Netherlands in support of SACMEQ’s research
and training programmes.
v
TABLE OF CONTENTS
Introduction .................................................................................................................................. viii
SACMEQ Projects Coverage in Botswana ................................................................................ viii
Chapter 1 Setting the Scene ...................................................................................................... 1
1.1 Introduction ............................................................................................................................... 1
1.2 Background information on Botswana .................................................................................. 1
1.3 Background information on the education system of Botswana....................................... 2
1.4 The organization of the school system ................................................................................. 2
1.5 The administration of the education system ........................................................................ 5
1.6 Financing of education ............................................................................................................ 6
1.7 National policy on education and educational progress .................................................... 6
1.8 Main education policy issues on pre-primary and primary education .............................. 8
1.9 Government’s response to the policy concerns ................................................................ 10
1.10 Conclusion .............................................................................................................................. 12
Chapter 2 The Conduct of the Study....................................................................................... 13
2.1 Introduction ............................................................................................................................. 13
2.2 Population and sampling ...................................................................................................... 14
2.3 Training of trainers and data collectors .............................................................................. 16
2.4 Data collection ........................................................................................................................ 17
2.5 Data entry................................................................................................................................ 18
2.6 Data cleaning by stages........................................................................................................ 19
2.7 Data analysis .......................................................................................................................... 19
2.8 Expenditure ............................................................................................................................. 19
2.9 Conclusion .............................................................................................................................. 20
Chapter 3 Characteristics of Pupils, their Homes and Learning Environments ................. 21
3.1 Introduction ............................................................................................................................. 21
3.2 Interpretation of the results................................................................................................... 21
3.3 Age and gender distribution of pupils ................................................................................. 22
3.4 Home characteristics of pupils ............................................................................................. 24
3.5 Pupils and their learning environment ................................................................................ 29
3.6 Conclusion .............................................................................................................................. 37
vi
Chapter 4 Characteristics of Teachers, their Views on Classroom Resources and Professional Support........................................................................................ 39
4.1 Introduction ............................................................................................................................. 39
4.2 Personal characteristics of Standard 6 teachers .............................................................. 39
4.3 Professional characteristics of Standard 6 teachers ........................................................ 42
Chapter 5 Characteristics of School Heads and their Views on Education Infrastructure, Organisation, Operation of Schools and Problems..................... 47
5.1 Introduction ............................................................................................................................. 47
5.2 Personal characteristics of school heads ........................................................................... 48
5.3 Professional characteristics of school heads..................................................................... 50
5.4 Conclusion .............................................................................................................................. 53
Chapter 6 Provision of School Resources ............................................................................. 55
6.1 Introduction ............................................................................................................................. 55
6.2 Provision of school resources by region............................................................................. 56
Chapter 7 Reading and Mathematics Achievement and HIV and AIDS Knowledge Levels of Pupils and their Teachers ....................................................................... 59
7.1 Introduction ............................................................................................................................. 59
7.2 Pupil reading scores .............................................................................................................. 59
7.3 Teacher reading scores ........................................................................................................ 62
7.4 Pupils reaching various reading competency levels......................................................... 63
7.5 Teachers reaching various reading competency levels ................................................... 64
7.6 Pupil mathematics scores..................................................................................................... 65
7.7 Pupils reaching various mathematics competency levels ............................................... 67
7.8 Teacher mathematics scores ............................................................................................... 68
7.9 Teachers reaching acceptable mathematics competency levels ................................... 69
7.10 Pupil and teacher HIV and AIDS Knowledge levels ......................................................... 71
7.11 Attitudes about HIV and AIDS.............................................................................................. 76
7.12 Risk perception about HIV and AIDS.................................................................................. 80
7.13 Conclusion .............................................................................................................................. 81

vii
TThhee FFiifftteeeenn SSAACCMMEEQQ SScchhooooll SSyysstteemmss
400 450 500 550 600
Botswana
Kenya
Lesotho
Malawi
Mauritius
Mozambique
Namibia
Seychelles
South Africa
Swaziland
Tanzania
Uganda
Zambia
Zanzibar
Zimbabwe
Pupil reading scores
Source: SACMEQ Data, 2007
viii
Introduction The Southern and Eastern Africa Consortium for Monitoring Educational Quality (SACMEQ)
project is a major cross-national study on the quality of primary education in much of Sub-Saharan
Africa. The project mainly aims at building capacity in the member states’ ministries of education
to monitor and evaluate the quality of their primary education. It is coordinated by the SACMEQ
Coordinating Centre in partnership with UNESCO/IIEP which is situated in Paris. Fifteen
Ministries of Education – x Botswana, Kenya, Lesotho, Malawi, Mauritius, Mozambique, Namibia,
Seychelles, South Africa, Swaziland, Tanzania (Mainland), Tanzania (Zanzibar), Uganda, Zambia
and Zimbabwe – participate in this project. Since 1991 three SACMEQ studies (SACMEQ I, II, and
III) have been undertaken by SACMEQ member countries in collaboration with UNESCO/IIEP.
The SACMEQ I and II studies examined the conditions of schooling as well as the quality of
education across participating countries, and in particular collected accurate and detailed
information on the reading and mathematics performance of standard 6 pupils and their teachers.
Information was also collected on pupils’ home backgrounds, learning environments, and the
resources available in their schools. In addition to the above, teachers’ and school heads’
characteristics and their view points about the teaching and learning environments were also
captured. At the request of the SACMEQ education Ministers, an HIV and AIDS Knowledge test
(HAKT) was included to assess the knowledge levels of pupils and their teachers.
SACMEQ Projects Coverage in Botswana
SACMEQ I was conducted in 1995, however, Botswana did not participate. SACMEQ II was
implemented in 2000 with a sample of 170 primary schools, while SACMEQ III was conducted in
2007 with 160 participating schools. It should be noted that more pupils participated in the
SACMEQ III project than in SACMEQ II, since more students were sampled within each school.
There was a decrease in the number of teachers surveyed from 420 in SACMEQ II to 386 in
SACMEQ III. The 2007 sample was drawn from 784 primary schools (714 government, 13
government-aided and 57 private), which had a total number of standard 6 enrolments of 44113
(22088 males and 22025 females) and a total of 12989 standard 6 teachers.

ix
Table 1: SACMEQ Project coverage in Botswana
SACMEQ I SACMEQ II SACMEQ III
Schools Teachers Pupils Schools Teachers Pupils Schools Teachers Pupils
None None none 170 420 3322 160 386 3869
In addition to testing the reading, mathematics and HIV and AIDS-knowledge of students and
teachers, the survey included a number of questions regarding home-background and school
resources. At the school level, information was collected on teacher and school-head qualifications,
in-service training, teaching guides for reading and mathematics, pupils’ access to reading and
mathematics books, classroom writing boards, classroom/school libraries, pupils and teachers
furniture, in schools, radios, school infrastructure conditions. Questions regarding home-
background included parental education, extra-tuition, the number of books in the home, electronic
equipment, meals per day, sources of lighting, type of dwelling etc.
This report will provide information on seven thematic areas (outlined below). The analysis is sub-
divided by gender, region, socio-economic status and school location. The seven areas of coverage
in the report are as follows:
1. The setting of the study
2. The conduct of the study
3. Pupils’ characteristics and their learning environments
4. Teachers’ characteristics and their view points on teaching, classroom resources,
professional support and job satisfaction
5. School heads’ characteristics and their viewpoints on educational infrastructure, the
organisation and operation of schools, and problems with pupils and staff
6. Equity in the allocation of human and material resources both among regions and among
schools
7. Reading and mathematics achievement levels of pupils and teachers

Chapter 1 Setting the Scene
1.1 Introduction This chapter provides background information on Botswana and the country’s education system.
1.2 Background information on Botswana Botswana is a landlocked country located in the South of Africa, with a total surface area of
582 000 square kilometres. It shares its borders with Namibia to the west, South Africa to the south,
as well as Zimbabwe and Zambia to the north. Botswana is a member of the Commonwealth, the
African Union (AU) and the Southern African Development Community (SADC). It is also houses
the headquarters of the SADC. The country was a British Protectorate from 1885 to 1966, when it
acquired its independence. Botswana is a democratic country with elections every five years. The
last election before SACMEQ III was in 2004.
The people of Botswana are known as Batswana, and the country has a number of different tribes.
The most widely spoken language in Botswana is Setswana although there are a few other African
languages spoken by some tribes in the country. The official languages are English and Setswana,
although English is more widely used for official purposes.
For administrative purposes, Botswana is split into nine district councils, two city councils and five
town councils. The district councils are: Central, North-West, Ghanzi, Kgalagadi, Kweneng, South,
Kgatleng, North-East, and South-East. The district councils are further divided into sub-districts for
service delivery purposes. The two city councils are Gaborone and Francistown and the five town
councils are Jwaneng, Lobatse, Sowa, Selibe-Phikwe and Orapa. The first formal census was
conducted in 1971 with a population totalling 574,094. The population of Botswana was at
1,680,863 in 2001 when the last census took place (CSO; Population and Housing Census Report;
2001) and was projected to have grown to 1,736,396 in 2007(CSO; Population Projection Report,
2001). There was an average population growth rate of 2.4 percent from the 1991 census to 2001
census.

Chapter 1: Setting the Scene
2
1.3 Background information on the education system of Botswana The London Missionary Society came to Botswana in the 19th Century and was the first group of
people to provide formal education. The missionaries spread Christianity and education
concurrently to Batswana. The first school was established by David Livingstone among a tribe
called Bakgatla ba ga Mmanaana in the 1840s. In the later years the London Missionary Society
(LMS) started other schools among other tribes, providing education equivalent to primary
education. At that stage there was no education policy to guide the implementation of education
programmes and the general supervision of schools. By the time the country gained independence
in 1966 there were 251 primary schools and 9 secondary schools offering formal education, with
two primary teacher training colleges, one trade school and no university (SACMEQ II, 2005).
1.4 The organization of the school system The school system in Botswana can be categorised into five levels, namely pre-primary, primary,
secondary, post-secondary but non-tertiary (vocational and technical education), and tertiary.
(a) Pre-primary education
Pre-primary education is mainly provided by the private sector, individuals, communities, NGO’s
and to some extent local authorities (district councils). The Government recognizes the importance
of pre-primary education and therefore commits itself to the provision of support. This includes
policy formulation and curriculum development as well as strategies to improve the quality and
implementation of pre-primary education. In conjunction to this, the Ministry of Local Government
(through the district councils) provides support in the form of registration of schools, inspection of
facilities, provision of grants and the training of pre-school teachers.
(b) Primary education
Currently the education system of Botswana consists of seven years of primary education, making
up the majority of the ten years of basic education. Primary education is divided into two sub-levels,
lower-primary (standard 1 to 4) and upper-primary (standard 5 to 7). The official entry age into
primary school is five and a half to six for public schools and five years for private schools (Revised
The SACMEQ III Project in Botswana
3
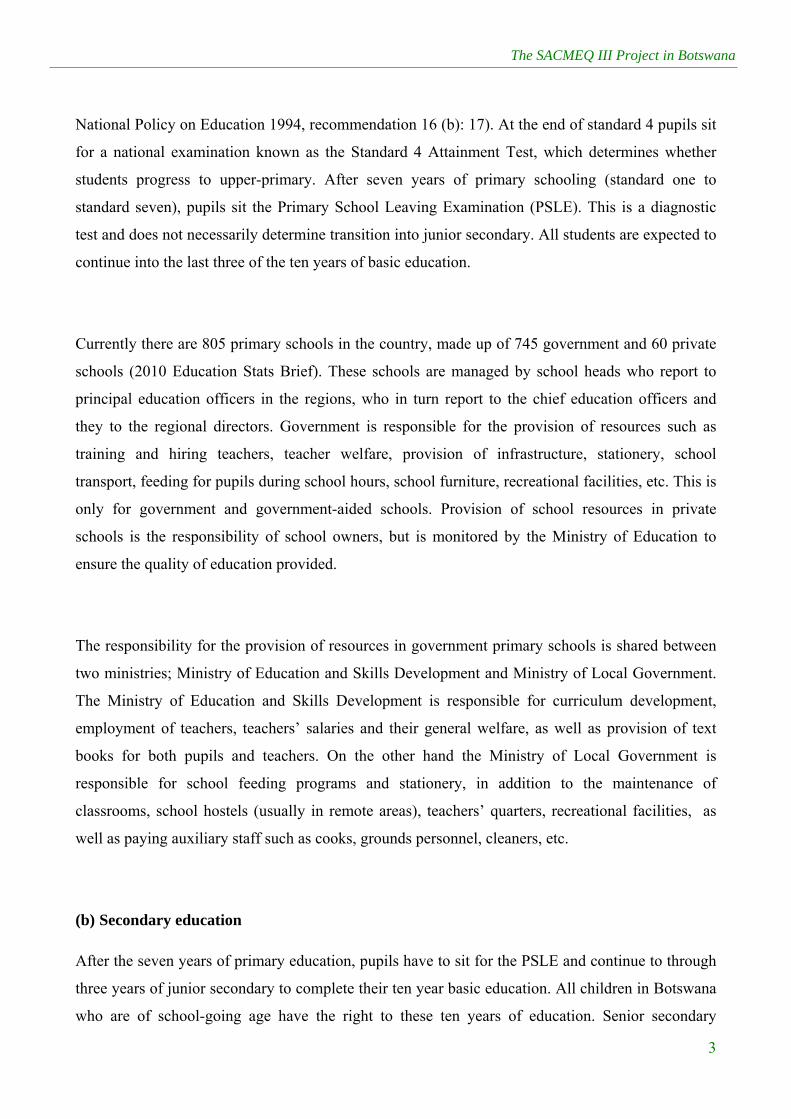
National Policy on Education 1994, recommendation 16 (b): 17). At the end of standard 4 pupils sit
for a national examination known as the Standard 4 Attainment Test, which determines whether
students progress to upper-primary. After seven years of primary schooling (standard one to
standard seven), pupils sit the Primary School Leaving Examination (PSLE). This is a diagnostic
test and does not necessarily determine transition into junior secondary. All students are expected to
continue into the last three of the ten years of basic education.
Currently there are 805 primary schools in the country, made up of 745 government and 60 private
schools (2010 Education Stats Brief). These schools are managed by school heads who report to
principal education officers in the regions, who in turn report to the chief education officers and
they to the regional directors. Government is responsible for the provision of resources such as
training and hiring teachers, teacher welfare, provision of infrastructure, stationery, school
transport, feeding for pupils during school hours, school furniture, recreational facilities, etc. This is
only for government and government-aided schools. Provision of school resources in private
schools is the responsibility of school owners, but is monitored by the Ministry of Education to
ensure the quality of education provided.
The responsibility for the provision of resources in government primary schools is shared between
two ministries; Ministry of Education and Skills Development and Ministry of Local Government.
The Ministry of Education and Skills Development is responsible for curriculum development,
employment of teachers, teachers’ salaries and their general welfare, as well as provision of text
books for both pupils and teachers. On the other hand the Ministry of Local Government is
responsible for school feeding programs and stationery, in addition to the maintenance of
classrooms, school hostels (usually in remote areas), teachers’ quarters, recreational facilities, as
well as paying auxiliary staff such as cooks, grounds personnel, cleaners, etc.
(b) Secondary education
After the seven years of primary education, pupils have to sit for the PSLE and continue to through
three years of junior secondary to complete their ten year basic education. All children in Botswana
who are of school-going age have the right to these ten years of education. Senior secondary
Chapter 1: Setting the Scene
4
education takes two years, making the education system a 7-3-2 structure. A Junior Certificate
Examination (JCE) taken at the end of junior secondary is used to determine progression into senior
secondary school (also known as form 4). It should be noted that students who fail to reach senior
secondary can enrol in vocational institutions and later upgrade to technical institutions. After
completion of senior secondary, depending on performance in the Botswana General Certificate of
Secondary Examination (BGCSE) or equivalent, individuals can enrol in vocational, technical or
tertiary institutions to acquire life skills and professional qualifications. Currently there are 276
secondary schools (238 government or government aided, and 38 privately owned) in Botswana.
Government schools are fully funded by the government, while grant-aided schools are mainly
operated by church organizations and receive government grants for their day-to-day operations.
Private schools are owned and operated by companies but are still monitored by the government.
Secondary schools, like primary schools, are managed by school heads who report to principal
education officers in the regions, with the line of authority extending to principal education officers,
chief education officers and regional directors. Government (through the Ministry of Education and
Skills Development) is responsible for the provision of all resources to government schools.
(c) Tertiary Education
Tertiary education is provided by both government and private institutions. Most tertiary level
students are funded by government through provision of loans, grants or partial grants, depending
on the perceived priority of the field of study. Tertiary education institutions in Botswana offer
certificates, diplomas and degrees in different fields of study, including the social sciences, natural
sciences, human resource management, accounting, business studies, education, as well as technical
training and vocational training. Currently there are six teacher training institutions, nine technical
colleges, 41brigades, nine institutes of health sciences, one college of agriculture, one accountancy
college, one public university, nine private colleges and one college of distance and open learning.
Every year some Batswana students are sent outside the country to study for courses which are not
available in the country and are of priority in addressing the country’s human resource needs. These
fields of study include medicine and some engineering courses.
The SACMEQ III Project in Botswana
5
1.5 The administration of the education system The Ministry of Education and Skills Development is responsible for the general administration of
the education system of the country. The ministry is comprised of nine departments, two supporting
divisions and three education councils and one training authority. The nine departments are as
follows:
Department of Corporate Services;
Department of Teaching Service Management;
Department of Technical and Vocational Education and Training;
Department of Out of School Education and Training;
Department of Curriculum Development and Evaluation;
Department of Pre and Primary Education;
Department of Secondary Education;
Department of Teacher Training and Development;
Department of Tertiary Education Financing.
The supporting divisions, training authority and councils are:
The Division of Planning, Statistics and Research is responsible for the planning and
provision of education statistics, school registration, research, and the monitoring and
evaluation of education programmes and projects. The research from this division is used to
inform future policy development, planning and programming.
The Division of Special Education is responsible for the education of special needs
children.
Botswana’s Examinations Council is responsible for the national examinations for primary
and secondary education.
The Tertiary Education Council coordinates the registration and accreditation of
institutions offering tertiary education from the diploma level.
Botswana’s Training Authority regulates institutions offering technical and vocational
education courses for certificates and below.
Chapter 1: Setting the Scene
6
1.6 Financing of education The education sector receives its funding from the government, donor agencies and development
partners. Parental contributions to the financing of education are mainly through
sports/development fees and minimal school fees at the secondary school level. However, it should
be noted that disadvantaged pupils whose parents/guardians cannot afford these costs are exempted
from paying. The role of donor agencies and development partners in education finance is very
important, as they play a significant role in enabling the Ministry to provide resources such as
infrastructure, equipment, teaching and learning materials, which are all needed for a conducive
learning environment.
The education sector receives a large proportion of the national budget for both recurrent and
development purposes. On average the Ministry of Education and Skills Development is allocated
an annual amount of approximately 19% of the total national development budget (though it
reached a high of 23.3% in 2009/10), while the recurrent expenditure on education averaged 28
percent of total recurrent expenditure in the three years to 2009/2010 (NDP10: 35). Despite this
large share of expenditure, the Ministry still has tight resource constraints.
The Ministry of Education provides grants to non-governmental organizations every year. This
indirectly contributes to the education system, e.g. in the provision of pre-schools, primary and
secondary schools, special education, and education research, to mention a few areas.
1.7 National policy on education and educational progress When Botswana became independent in 1966, the government instituted policies to address the
social, economic, political and educational standards of its people. This called for the development
of a National Development Plan (NDP), to be reviewed every five years. The NDP includes a
discussion on education policies and the appointment of commissions to review the policies in place
to address emerging issues.
The Ministry of Education and Skills Development has made and continues to make good progress
in ensuring that adequate educational facilities are made available to the entire population. A
number of efforts have been made to improve the quality of education through policy formulation,
curriculum development, as well as strategies to implement these policies. The main aim of

The SACMEQ III Project in Botswana
7
education policy is to equip students with the basic skills and knowledge required for livelihood
after completion of their formal education. To this end, the Ministry emphasises practical subjects
in order to prepare students for future careers.
National Policy on Education from 1977 to 1993
Since independence Botswana has under taken two major education policy reviews. The first policy
review was the 1976 Education for Kagisano, which emphasized the quantitative expansion of the
education system. The second was the 1993 National Commission on Education which aimed to
improve access to education as well as the quality of education provided in the country.
The 1977 education policy (Kagisano) was philosophically founded and named Education for
Kagisano which means “social harmony and embraces the concept of social justice,
interdependence and mutual assistance” (Kagisano report, 1977: 24). Education for Kagisano
recommended that the subject matter children learn should be relevant and practical. Setswana,
English, and mathematics were to be taught simply and sequentially. Government responded by
introducing 10 years of basic education, and the construction of secondary and tertiary institutions
such as the university, teacher training colleges etc. At this point (in 1976) most of the country was
not well developed.
Therefore there was a need to ensure that there was an equitable distribution of resources in terms
of teachers and the number of schools built in urban and remote, rural areas. To monitor this
process the ministry of education came up with a number of implementation, monitoring and
evaluation strategies. The Government introduced an umbrella body known as Teacher Employing
Agencies (TEA) to hire teachers to be posted to different schools as a strategy to ensure the
equitable distribution of qualified teachers to schools. TEA was later renamed the Unified Teaching
Services (UTS) and changed yet again to the Department of Teaching Service Management
(DTSM). There have been significant increases in the quality, quantity and diversity of educational
services since the inception of the first education policy. However, not all recommendations of
Kagisano were realized in the sixteen year period of its implementation. Subsequently, the policy
was reviewed in 1993 to address emerging issues in the education system.
Revised National Policy on Education (RNPE) 1994

Chapter 1: Setting the Scene
8
The Revised National Policy on Education (RNPE) of 1994 came as a result of recommendations
from the second National Commission on Education in 1993. The review was influenced by the fact
that over the years there have been significant changes in the economic needs of the country. The
Government therefore found it necessary to review the education policy and find strategies to make
the education system more compatible with the economy. The policy aimed to provide universal
access to schooling, to improve the quality of education, and to equip learners with relevant skills
which are required in the labour market. The policy also emphasizes the development of moral and
social values, the promotion of cultural values and a cultural identity, citizenship and the
development of a desirable work ethic.
One of the most important goals in primary education is to equip learners with basic skills such as
literacy, numeracy and problem solving skills. Some of the strategies related to this policy were the
reduction of primary school class sizes from 45 to 30, the introduction of English as a medium of
instruction at standard 3 and above, as well as the upgrading and training of primary school teachers
from certificate to diploma level. This was deemed necessary to enable teachers to handle new
educational challenges such as the breakthrough to Setswana, guidance and counselling etc. (RNPE
1994, para.10.5.9 (c)).
1.8 Main education policy issues on pre-primary and primary education
The Revised National Policy on Education (RNPE) 1994 outlines a number of policy
recommendations which are key to the country’s education developments in regard to pre-primary
and primary education:
i. Promoting access to basic education and training opportunities for all population sub-
groups, especially vulnerable children, primary-school age children and children with
special education needs. The education system should cater for the learning needs of young
people and adults in order to promote equity and social justice. [REC.73 par.8.4.5:(2), REC.
88 par. 9.6.2: (a)]
ii. Developing an effective and comprehensive policy on pre-primary schooling and linking
this to the formal education system, and introducing an element of special education in the
pre-service or in-service training of pre-primary teachers, Day Care Centre leaders and other
Early Childhood teachers. (RNPE no. 5.3, REC.95 par.9.6.31: (a) and (i)).
The SACMEQ III Project in Botswana
9
iii. Providing increased educational inputs in order to improve access to primary education and
address the declining educational achievement at this level. These include physical facilities,
quality teachers, effective supervision, efficient distribution of instructional materials and
the establishment of quality assurance systems for education and training. (RNPE no. 6.1,
REC.4 par. 2.3.37)
iv. Embarking on improved pre-service and in-service training, providing incentives and
improvements in the conditions of service aimed at raising the status and morale of teachers,
and placing more emphasis on remedial teaching techniques in existing teacher-training
programs [RNPE no. 12.3, REC.23. par.4.8.32:(d)]
v. Raising entry requirements for primary school teachers to a minimum of the Botswana
General Certificate of Secondary Education (BGCSE) or the equivalent of a Diploma
programme and upgrading the Certificate holders to Diploma in Primary Education. The
training should provide for subject specializations at upper primary level. [REC.100
par.10.5.9: (a) and (b)]
vi. Ensuring the primary teacher training curriculum prepares teachers for some more recent
educational innovations such as breakthrough to Setswana, the project method, continuous
assessment, guidance and counselling, special education, and remedial teaching. [REC.100
par.10.5.9: (c).
vii. Creation of learning opportunities outside the formal education system at all levels for those
who wish to pursue further learning. (RNPE no.10.3)
viii. Integration of AIDS and STD education into all levels and institutions of education,
starting at the primary school level, and extending to tertiary, teacher training and non-
formal institutions (Botswana National Policy on HIV and AIDS, 1998).
ix. The involvement of parents in the discussion of school-based HIV and AIDS education,
primarily through the Parent Teacher Associations (Botswana National Policy on HIV and
AIDS, 1998).
x. Developing a comprehensive language policy to address language barriers, particularly for
remote communities who speak home languages other than Setswana and English. (REC.3
par.2.3.30, Support Programme for Education in Remote Areas (SPERA) concept paper:
Nov. 2006).
Chapter 1: Setting the Scene
10
xi. Ensuring community participation in the development and management of education
through consultations with relevant bodies in the community. (RNPE no. 13.2)
1.9 Government’s response to the policy concerns The Ministry of Education and Skills Development has been undertaking various programmes,
initiatives and activities aimed at addressing these policy concerns. Significant progress has been
made in the expansion and consolidation of early childhood care and education (ECCE). Policies
have been developed for the integration of children with special education needs (SEN) into
mainstream education. However, the Government is not in a position to provide for special-needs
children at the pre-primary level.
The Ministry has undertaken several initiatives with the aim of improving the quality of primary
education. Some of these include reviewing and adapting the primary education curriculum to
incorporate emerging issues as well as improving accessibility for children with special education
needs. Government has also increased the provision of teaching and learning materials for children
with special needs, such as Braille resources. The country’s admission policy is flexible regarding
admission to standard 1, to ensure that children from remote areas and from vulnerable groups are
not excluded from the education system.
Some of government’s efforts in meeting the learning needs for young people and adults has been
focused on transforming the national literacy programme into three new programmes: 1) adult basic
education (which is equivalent to standard 7 formal primary education); 2) the educational
programme for out of school children; and 3) the skills training programme for both adults and out
of school children.
Strategies employed to achieve gender equity and equality in education include the introduction of
gender sensitive policies and mainstreaming gender issues in the curriculum, providing equal
opportunities to all students as well as maintaining flexible re-admission policies to encourage
learners to re-enter the education system at various levels. Life skills programmes have also been
introduced to assist learners to function effectively and to be able to make informed decisions.
In an effort to improve quality and ensure excellence in education, the Ministry of Education and
Skills Development embarked on several initiatives, such as the development of the National Credit
and Qualifications Framework (NCQF), the Organization and Methods (O&M) review to

The SACMEQ III Project in Botswana
11
rationalize functions and structures for timely delivery of services, and the introduction of
Performance Management Systems (PMS) to increase productivity, efficiency and the integration of
Information, Communication and Technology (ICT) in education delivery.
The Ministry of Education and Skills Development has been strategically placed to lead some of the
intervention programs to redress the adverse impact of HIV and AIDS on the nation. MoESD has a
duty to mainstream HIV and AIDS education into all areas of formal and non-formal education, as
outlined in the ministry’s Guidelines for Mainstreaming HIV & AIDS Life skills Education in the
Education Sector. This mainstreaming is guided by the following five goals contained in the same
document.
Goal 1: Prevention of HIV and AIDS infection – through the integration of HIV and AIDS into
teacher training and curriculum development, reviewing and revising current interactive methods,
highlighting the relationship between substance abuse and HIV and AIDS infection in life skills
classes, intensifying efforts for both boys and girls to delay the onset of sexual activities, and
increasing the involvement of parents and other appropriate stakeholders in conveying HIV and
AIDS information from schools to homes.
Goal 2: Provision of treatment, care and support – ensuring that learners have access to all
services related to HIV and AIDS, and Sexually Transmitted Infections (STI).
Goal 3: Management of the National response to HIV and AIDS – by conducting action research
on HIV and AIDS by both teachers and students especially at tertiary level, the Government aims to
increase its understanding of the epidemic.
Goal 4: Psycho-social and Economic Impact Mitigation – Interventions are in place to enable
orphans and vulnerable children to remain within the school system, and providing psycho-social
counselling and support within schools.
Goal 5: Provision of a strengthened legal and ethical environment – by facilitating the
development of policy concerning access to youth friendly services, and expanding education
around human rights issues especially relating to HIV and AIDS in both formal and non-formal
settings.
Chapter 1: Setting the Scene
12
1.10 Conclusion The education system in the country plays a critical role in the provision of training the human
resources required to drive the country’s economy. It thus become necessary to continually ensure
that the education policy remains aligned to the current, and emerging needs of the country. Among
these is the country’s long-term vision; Vision 2016: “Towards Prosperity for All.” This vision
outlines seven strategic goals to be achieved by the year 2016 with the overall aim of improving the
quality of Batswana’s lives. Education is an important ingredient for the success of Botswana and it
affects the performance of all socio-economic subsectors. The Ministry of Education and Skills
Development is mandated to monitor the achievement of two out of the seven strategic pillars,
namely; An ‘Educated and Informed Nation’, and ‘A Prosperous, Productive and Innovative
Nation’.
This Vision 2016 plan highlights the important role of education as a core aspect for the
empowerment of citizens, which is a prerequisite for the socio-economic development of the
country. The vision aims at an education system that is competitive, relevant and dynamic, as well
as able to adapt to the changing socio-economic needs of the country. Schools are seen as a vital
tool for improving productivity, developing new enterprises and generating economic growth.
Similarly, Vision 2016 emphasizes continued and universal education, partnership between the
public and private sectors in the provision of education, the development of life skills, as well as the
recognition and use of the different languages and public education to raise awareness on various
aspects of life.
The Ministry of Education and Skills Development also attaches great importance to the
declarations of the 1990 Jomtien World Conference on Education and the 2000 Dakar World
Education Forum. These declarations place emphasis on the need to achieve Education for All
(EFA) by 2015. The concept of EFA implies reflection on the nature and purpose of education in
each society so that recognized and measurable learning outcomes are achieved by all. The Ministry
also recognises the Millennium Development Goals 2015 and the country is committed to meeting
the goal of Universal Primary Education, among other goals. The ministry uses its education
statistics indicators to monitor the progress made by the country towards achieving this goal.
Chapter 2 The Conduct of the Study
2.1 Introduction As stated in chapter 1, Botswana is fragmented into nine district councils, two city council and three
town councils for government administrative purposes. However, for operational and management
of primary education up to the year 2008, Botswana had been divided into six primary education
regions, being; Central North, Central South, North, South, South Central, and West. Furthermore,
for the purpose of the SACMEQ project, Gaborone (the capital city) is considered as the seventh
primary education region. Therefore there were seven SACMEQ III regions in Botswana. The data
analysis and discussion in the following chapters are reported according to these seven regions. It
should be noted, however, that in 2009 the ministry subdivided the country into 10 education
regions with the objective of decentralising the management of education. The ten regions are
headed by the Regional Directors.
Below is information provided by the Central Statistics Office (Education Stats Brief Report, 2008)
about each SACMEQ III region:
Central North: This region has a total of 119 primary schools, 110 of which are government owned
and 9 privately owned. The number of standard 6 pupils enrolled in this region was 7375. Out of
these, 49.42 percent were girls.
Central South: There are 137 government primary schools and 7 private primary schools, making a
total of 144 primary schools in this region. The number of standard 6 pupils enrolled in this region
was at 8499, of which 49.82 percent were girls.
Gaborone: Gaborone is in the South Central region but because of its stature as the capital city of
Botswana and its high population, in the SACMEQ project it was regarded as a separate region.
Gaborone contains 32 government primary schools and 13 private primary schools. The number of
standard 6 pupils enrolled in this region was 3689. Of these, 52.37 percent were girls.
Chapter 2: The Conduct of the Study
14
North: The North has 75 primary schools, of which 70 are owned by the government and 5 are
privately owned. The number of standard 6 pupils enrolled in this region was 3995, 47.73 percent of
them girls.
South: This region has a total of 163 primary schools. The government owns 158 while the private
sector owns 5 of these primary schools. The number of standard 6 pupils enrolled in this region was
at 7009, 50.08 percent of which were girls.
South Central: For primary education administration purposes the region includes Gaborone city
and has the highest number of primary schools. For the SACMEQ project Gaborone is treated as a
separate region and therefore the rest of South Central region considered alone had 141 government
primary schools and 14 private primary schools, giving a total of 145 primary schools. The number
of standard 6 pupils enrolled in this region was 9480. Of these, 48.86 percent were girls.
West: Out of the 89 primary schools in this region, 83 are government schools while 6 are private
schools. There were 4616 standard 6 pupils enrolled in this region. Out of these, 50.06 percent were
girls.
2.2 Population and sampling The target population for the SACMEQ III study was the standard 6 primary school cohort in
Botswana, including private schools. The sampling frame for Botswana included all 774 primary
schools and indicated the regions, names of schools, total school enrolments and standard 6
enrolments as of January 2007. Schools that were then excluded for sampling purposes were those
who had no standard 6 pupils, schools specifically for children with disabilities such as the visually
impaired and the deaf, and a small number of schools with very poor accessibility by road. Due to
these reasons, 126 schools (16.2 percent of the sample) were exempted and the sampling frame was
reduced to 648 schools with a total of 42247 standard 6 pupils. The SACMEQ III country
coordinators met in Paris in June 2007 to calculate the country samples from the submitted country
sampling frames. This was accomplished using the data management software package SANDEM.
The SACMEQ III Project in Botswana
15
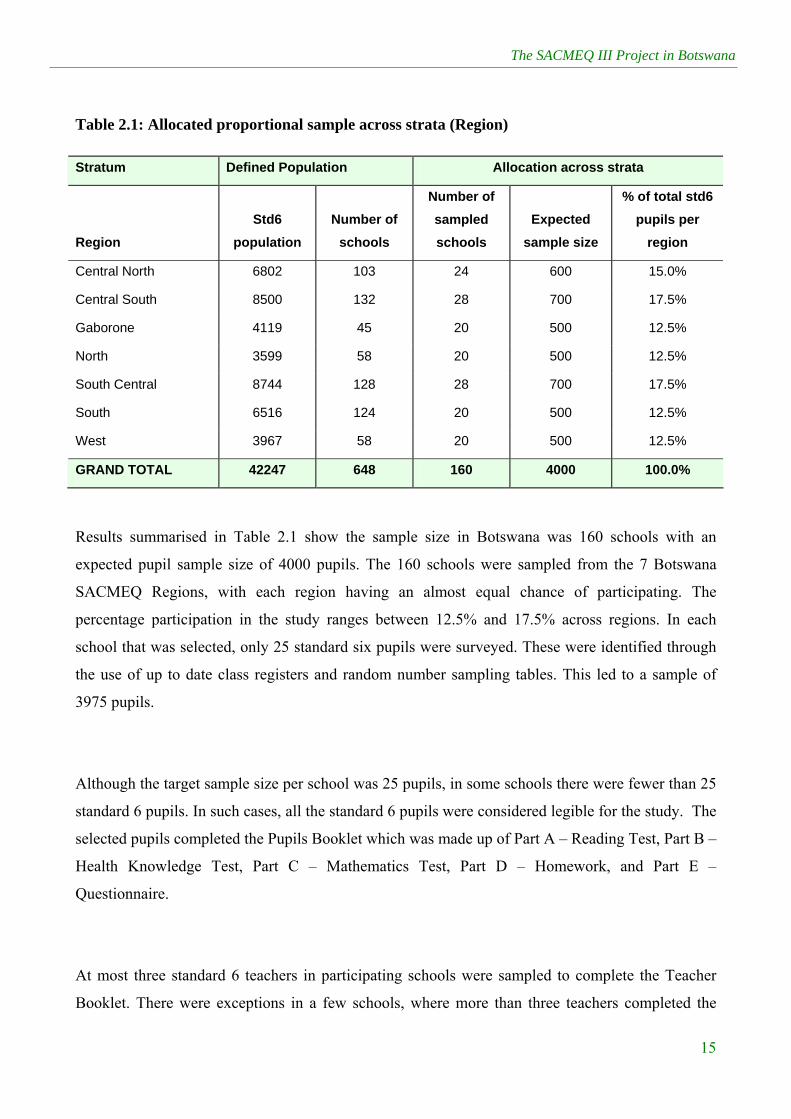
Table 2.1: Allocated proportional sample across strata (Region)
Stratum Defined Population Allocation across strata
Region
Std6
population
Number of
schools
Number of
sampled
schools
Expected
sample size
% of total std6
pupils per
region
Central North 6802 103 24 600 15.0%
Central South 8500 132 28 700 17.5%
Gaborone 4119 45 20 500 12.5%
North 3599 58 20 500 12.5%
South Central 8744 128 28 700 17.5%
South 6516 124 20 500 12.5%
West 3967 58 20 500 12.5%
GRAND TOTAL 42247 648 160 4000 100.0%
Results summarised in Table 2.1 show the sample size in Botswana was 160 schools with an
expected pupil sample size of 4000 pupils. The 160 schools were sampled from the 7 Botswana
SACMEQ Regions, with each region having an almost equal chance of participating. The
percentage participation in the study ranges between 12.5% and 17.5% across regions. In each
school that was selected, only 25 standard six pupils were surveyed. These were identified through
the use of up to date class registers and random number sampling tables. This led to a sample of
3975 pupils.
Although the target sample size per school was 25 pupils, in some schools there were fewer than 25
standard 6 pupils. In such cases, all the standard 6 pupils were considered legible for the study. The
selected pupils completed the Pupils Booklet which was made up of Part A – Reading Test, Part B –
Health Knowledge Test, Part C – Mathematics Test, Part D – Homework, and Part E –
Questionnaire.
At most three standard 6 teachers in participating schools were sampled to complete the Teacher
Booklet. There were exceptions in a few schools, where more than three teachers completed the
Chapter 2: The Conduct of the Study
16
Teacher Booklets and most of these were in private schools and a few government schools under
the subject specialisation pilot project. Eligible teachers were those who taught English,
Mathematics and Health Knowledge to standard 6 classes with higher enrolments. Teachers were
required to complete a Teachers Booklet (Parts A – Reading Test, Part B – Health Knowledge Test,
Part C – Mathematics Test, and Part D – Questionnaire). Although all teachers were required to
write the Health Knowledge test, only the Reading teacher had to write the Reading test and only
the Maths teacher had to write the Maths test.
If teaching in the school was not done through teachers specialising by subject, which is a common
in Botswana, eligible teachers had to complete all parts of the Teacher Booklet. Such teachers were
selected from the completed School Form.
The School Heads for all the sampled schools had to complete the School Form, School
Information and School Head Booklets. Where there was no School Head or the School Head was
engaged in other activities, the Deputy School Head or Senior Teacher was delegated to complete
these instruments. It should be noted that in these instances where the Head was not available, the
Deputy School Head provided information about the School Head and not about him/herself where
information on the Head was sought.
The Pupil Name Form was completed by the Data Collectors with the assistance of the School Head
using the most up to date standard 6 class register available. This instrument indicates the names,
class, and demographics of the sampled pupils.
2.3 Training of trainers and data collectors The SACMEQ Coordinating committee based at UNESCO/IIEP in Paris conducted a one day
Training of Trainers workshop for 15 Ministry of Education officials in August 2007. Most of the
participants were Principal Education Officers from the Department of Primary Education and had
participated in the 2000 SACMEQII project as well as the SACMEQIII pilot project held in 2006.
The purpose of this workshop was to instruct the Trainers in data-collection methods and to discuss
The SACMEQ III Project in Botswana
17
any potential problems in the survey to ensure that the data collected in SACMEQ III would be of a
high quality. During this training the trainers and trainees went through the Data Collectors' and
National Coordinators' Manuals step by step, familiarized themselves with the Random Number
Sampling tables as well as the six data collection instruments, the Pupil Booklet, Teacher Booklet,
School Head Booklet, School Information Booklet, School Form and Pupil Name Form.
The country National Research Coordinators (NRCs) conducted the Training of Trainers workshop
from the 27th to the 31st of August 2007. The training was meant to familiarize the prospective
Trainers with the instruments and the general methodology for data collection. The expectation was
that after this training, the trainers would be able to train data collectors in the various different
regions.
Training of Data Collectors was done from the 3rd to the 7th of September 2007. The total number
of trained data collectors per region was as follows: 42 to cover South Central and Central North
regions; 39 to cover Central North, West (Maun) and North Regions; and 39 for South, Gaborone,
and West (excluding Maun). In order to meet the personnel requirements for data-collection, some
Ministry of Education and Skills Development officials from different Departments participated as
Data Collectors as well as temporary contract staff. This was due to the general shortage of staff in
the responsible department within the Ministry.
2.4 Data collection The SACMEQ III data collection exercise in Botswana took place from the 18th to the 29th of
September 2007. All 160 participating primary schools from the seven different SACMEQ III
regions were covered during this period by the 120 data collectors involved countrywide, divided
into 40 teams of 3 data collectors each (including the team leader). Each team covered four schools
in ten working days. Most team leaders were from the Ministry of Education (Primary Education
Department) and had been involved in the 2006 SACMEQ III pilot project. The desired pupil
sample was 4000 standard 6 pupils and 3868 pupils actually participated, i.e. 97% of the desired
sample.
Chapter 2: The Conduct of the Study
18
On the first day of the study each of the teams of three data collectors met the school management
team to check if the School Form and School Information Booklets had been completed correctly.
The data collectors then used up to date standard 6 class registers to select a random sample of 25
pupils. After sampling, the data collectors completed the Pupil Name Form and entered Teacher IDs
in the Teacher Booklet. The data collectors also ensured that the testing room for the 25 sampled
pupils was ready with 25 sitting and writing places. The Teacher Booklet, School Head Booklet,
Pupil Reading and Health Knowledge Tests were completed on the 1st day of the study. The Team
leader supervised the teachers and school head during data collection, while the other two data
collectors were responsible for supervising the pupils.
On the second day of data collection the team leader worked with the school head to complete other
parts of the Pupil Name Form and toured the school to check if the facilities mentioned in the
School Information Booklet were indeed present in the school. The Mathematics test for pupils was
completed during the first session of the second day while completion of the Homework section and
the rest of the Questionnaire section was done during the second session of the second day. The data
collection exercise was done according to the suggested Timetable for Data Collection provided by
the SACMEQ III Coordinating Centre.
2.5 Data entry The Division of Planning, Statistics & Research bought 10 computers to be used for the SACMEQ
III project. Data was captured using the WINDEM software package provided by the SACMEQ
Coordinating Centre. Data entry started on the 21st of November 2007 started with Pupil and
Teacher Booklets Part B (Health Knowledge Test). The first and second entries for the two booklets
were completed on the 30th of November 2007. The data entry for parts A, C, D and E for both
Pupil and Teacher Booklets was completed by the 31st of January 2008. The data files from the ten
computers were merged on the 4th of February 2008. The first data entry for other instruments
(School Form, School Information, School Head and Pupil Name Form) was completed by the end
of February 2008. Second data entry and merging of data files were completed by the end of March
2008.
The SACMEQ III Project in Botswana
19
2.6 Data cleaning by stages On the 10th to the 14th of December 2007, the NRCs attended a Data Cleaning Workshop in
Windhoek, Namibia, coordinated by the SACMEQ Coordinating Committee. This Training
Workshop was meant to equip the country coordinators (NRCs) with skills required for using the
data cleaning softwares (WINDEM, Janitor and SPSS) provided by the SACMEQ Coordinating
centre. On the 21st of January 2008 the NRCs started data cleaning for Part B of the Pupil Booklet
(Health Knowledge Test) using WINDEM and Janitor. Data cleaning for this part was completed by
early April 2008 and the cleaned data was sent to the SACMEQ Coordinating Centre. The whole
data cleaning exercise for other parts of the booklet was completed by the 31st of October 2008.
2.7 Data analysis The data analysis and the interpretation of results included in this report focus on the seven thematic
areas outlined in Chapter 1. The unit of analysis throughout this report is the pupil. Most of the
analysis is descriptive in nature and is presented as cross tabulations by region. Since the results are
based on samples both for regional and national levels, all the statistical analysis are presented in
percentages with sampling errors provided alongside to allow estimation of the range of confidence
intervals.
2.8 Expenditure The government of Botswana through the Ministry of Education and Skills Development had a
financial provision (vote allocation) to carry out research and consultancy activities in the education
sector, including the SACMEQ III project. These funds were used to pay for conference rooms for
training, transport charges, accommodation, meals, imprests and subsistence allowances. It was also
used to pay for overtime for project personnel, salaries for temporary data collectors, printing of
instruments, and the purchasing of other materials and supplies.
To ensure that the project had sufficient funds during the data collection exercise, the Division of
Planning, Statistics and Research in collaboration with the Ministry of Finance and Development
Planning and the Ministry of Education and Skills Development Accounting office and Department
of Primary Education transferred part of the funds to the primary education regional offices’
Chapter 2: The Conduct of the Study
20
financial votes. The regional administrators, chief education officers and principal education
officers were charged with accountability for the funds. This arrangement was meant to facilitate
easy payments in the field during SACMEQ III project data collection.
2.9 Conclusion In conclusion, the SACMEQ III project in Botswana did not experience any major problems and
was carried out successfully and according to plan. Collaboration between the various government
departments and the SACMEQ coordinating team ensured that each stage of the project was
completed satisfactorily and within the stipulated time-frames. Data collection was done as per the
SACMEQ criteria and timeline.
Chapter 3 Characteristics of Pupils, their Homes and Learning
Environments
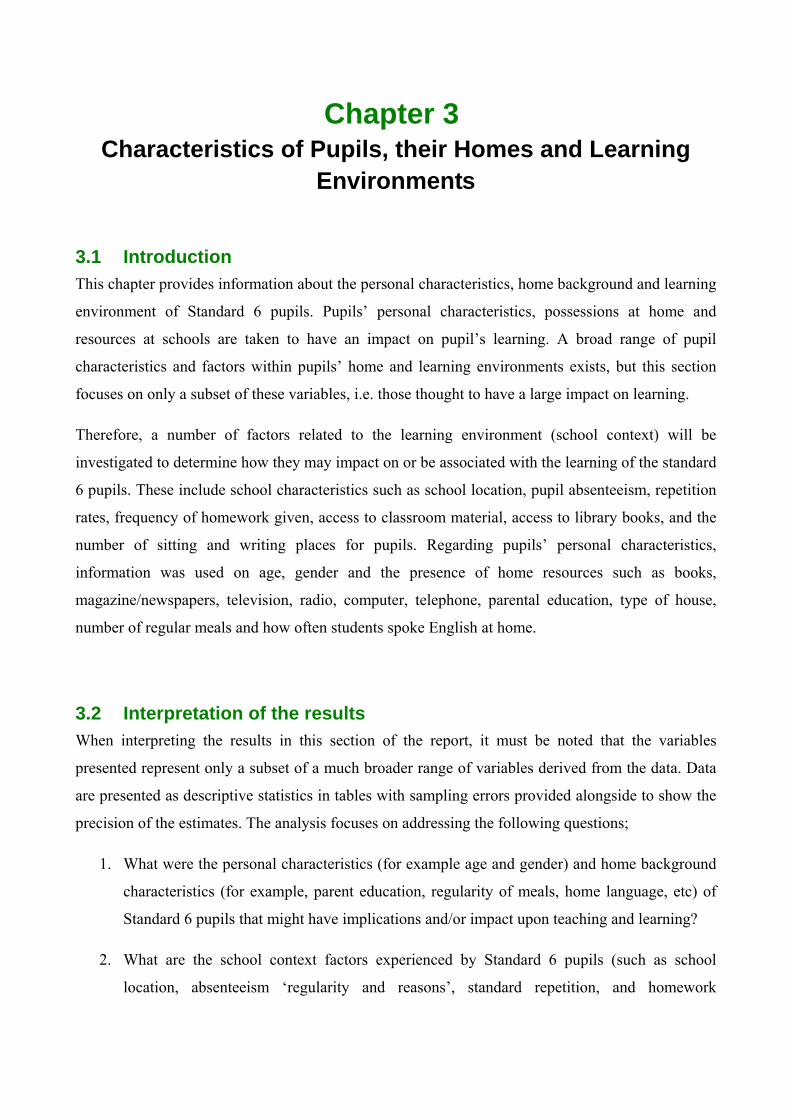
3.1 Introduction This chapter provides information about the personal characteristics, home background and learning
environment of Standard 6 pupils. Pupils’ personal characteristics, possessions at home and
resources at schools are taken to have an impact on pupil’s learning. A broad range of pupil
characteristics and factors within pupils’ home and learning environments exists, but this section
focuses on only a subset of these variables, i.e. those thought to have a large impact on learning.
Therefore, a number of factors related to the learning environment (school context) will be
investigated to determine how they may impact on or be associated with the learning of the standard
6 pupils. These include school characteristics such as school location, pupil absenteeism, repetition
rates, frequency of homework given, access to classroom material, access to library books, and the
number of sitting and writing places for pupils. Regarding pupils’ personal characteristics,
information was used on age, gender and the presence of home resources such as books,
magazine/newspapers, television, radio, computer, telephone, parental education, type of house,
number of regular meals and how often students spoke English at home.
3.2 Interpretation of the results When interpreting the results in this section of the report, it must be noted that the variables
presented represent only a subset of a much broader range of variables derived from the data. Data
are presented as descriptive statistics in tables with sampling errors provided alongside to show the
precision of the estimates. The analysis focuses on addressing the following questions;
1. What were the personal characteristics (for example age and gender) and home background
characteristics (for example, parent education, regularity of meals, home language, etc) of
Standard 6 pupils that might have implications and/or impact upon teaching and learning?
2. What are the school context factors experienced by Standard 6 pupils (such as school
location, absenteeism ‘regularity and reasons’, standard repetition, and homework

Chapter 3: Characteristics of Pupils, their Homes and Learning Environments
22
‘frequency, amount, correction, and family involvement’) that might impact upon
teaching/learning and general functioning of schools?
3. Did Standard 6 pupils have sufficient access to classroom materials (for example, textbooks,
readers, stationery) in order to participate fully in their lessons?
4. Did Standard 6 pupils have access to library books within their schools, and (if they did
have access) was the use of these books being maximized by allowing pupils to take them
home to read?
3.3 Age and gender distribution of pupils The gender and age distribution of pupils is important when taking into consideration the set targets
for 2015 Education For All (EFA) and the Millennium Development Goals (MDG) regarding
gender parity and equality in schools as well as universal primary education. According to the 2007
Botswana Education Statistics report there were 166,987 boys and 160,631 girls in primary schools,
indicating 6351 more boys in schools than girls. The female Net Enrolment Ratio (NER) was 88.1%
for girls aged 6-12 years and 85.7% for boys of similar age. This indicates a higher proportion of
girls in primary schools who were at the recommended primary school going age (6-12 years old)
than boys. The NER indicates the extent of participation in the education system for the official
age-group. The measure also gives an idea of the number of children who should be at school but
are actually not in the learning system. The limitation of this measure (NER) is that it does not take
into consideration which standard these pupils are in, and therefore, whether they started school at
the right age (usually age six in the case Botswana).
The gender distribution by region is provided in Table 3.1. Since the mean age and sex distribution
of pupils are drawn from the sample, the sampling error is provided along-side the results to allow
calculation of the range in which the true age value (mean age in months) and gender of standard 6
pupils are likely to fall with 95% certainty. When the sampling error is smaller it indicates that the
sample statistics is more precisely estimated (one can say with approximately 95% confidence that
the estimate lies within two sampling errors above or below the estimate. Where the sampling error
is high, this means that can have less confidence about the accuracy of the results.
The SACMEQ III Project in Botswana
23
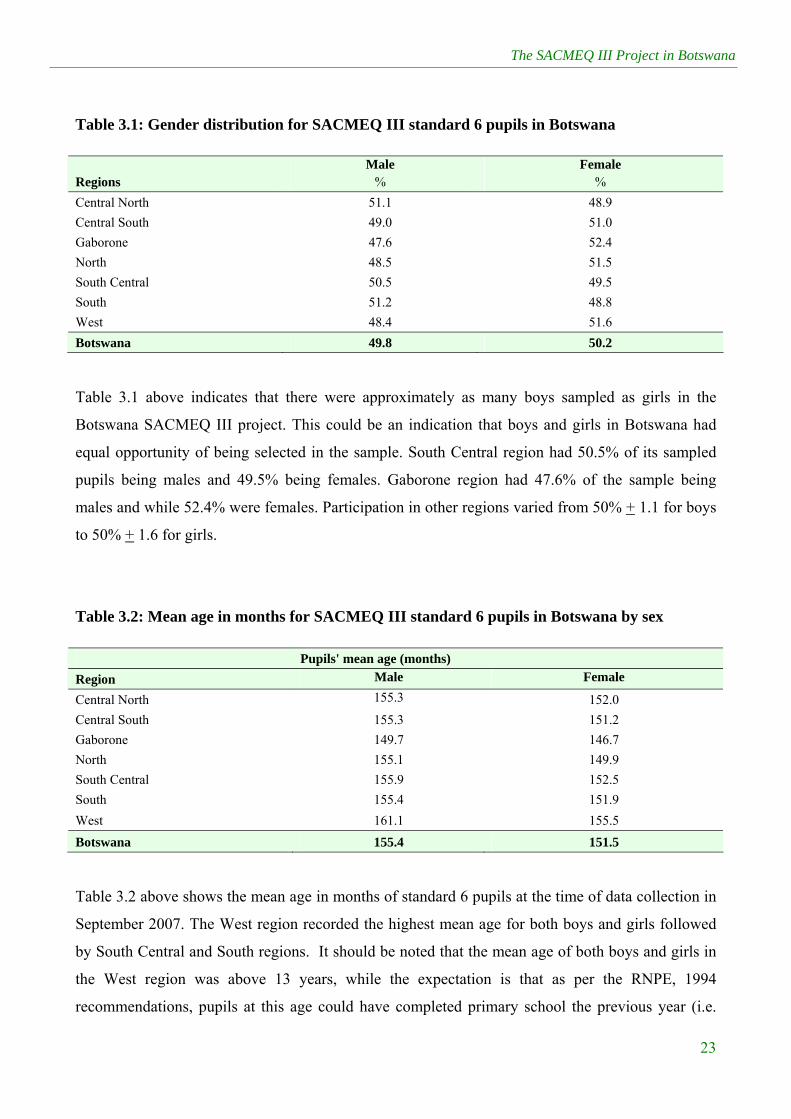
Table 3.1: Gender distribution for SACMEQ III standard 6 pupils in Botswana
Regions Male
% Female
%
Central North 51.1 48.9
Central South 49.0 51.0
Gaborone 47.6 52.4
North 48.5 51.5
South Central 50.5 49.5
South 51.2 48.8
West 48.4 51.6
Botswana 49.8 50.2
Table 3.1 above indicates that there were approximately as many boys sampled as girls in the
Botswana SACMEQ III project. This could be an indication that boys and girls in Botswana had
equal opportunity of being selected in the sample. South Central region had 50.5% of its sampled
pupils being males and 49.5% being females. Gaborone region had 47.6% of the sample being
males and while 52.4% were females. Participation in other regions varied from 50% + 1.1 for boys
to 50% + 1.6 for girls.
Table 3.2: Mean age in months for SACMEQ III standard 6 pupils in Botswana by sex
Pupils' mean age (months)
Region Male Female
Central North 155.3 152.0
Central South 155.3 151.2
Gaborone 149.7 146.7
North 155.1 149.9
South Central 155.9 152.5
South 155.4 151.9
West 161.1 155.5
Botswana 155.4 151.5
Table 3.2 above shows the mean age in months of standard 6 pupils at the time of data collection in
September 2007. The West region recorded the highest mean age for both boys and girls followed
by South Central and South regions. It should be noted that the mean age of both boys and girls in
the West region was above 13 years, while the expectation is that as per the RNPE, 1994
recommendations, pupils at this age could have completed primary school the previous year (i.e.

Chapter 3: Characteristics of Pupils, their Homes and Learning Environments
24
2006). The three regions with the highest pupil age cover most of the rural areas in the country and
some of their participating schools were located in remote areas. Therefore it could be concluded
that the school location and the flexibility of the education policy which stipulates that “the
maximum entry age should be kept flexible in order to allow children in remote areas the
opportunity to have access to primary education.” (Revised National Policy on Education 1994,
recommendation 16 (c) p.17) are influential in parent’s considerations to send the child to school.
The Standard 6 pupils in 2007 would have ideally started schooling in January 2002 at an official
minimum entry age of 5.5 years (66 months) for public schools and 5 years (60 months) for private
schools (Revised National Policy on Education 1994, recommendation 16 (b): 17). Therefore at the
time of data collection the average age of a Standard 6 pupil was expected to be approximately 120
months (10 years) for private school pupils and 132 months (11years) for public school pupils.
According to the Education Statistics Report of 2002, 22.5% of standard 1 pupils were 6 years old
or less and 77.5% were over the recommended entry age. Therefore it can be concluded that most of
pupils started school later than the recommended minimum entry age in Revised National Policy on
Education, 1994.
Policy Suggestion: Department of Pre- and Primary Education to embark on the education exercise to inform the communities on the recommended entry age to primary schools.
3.4 Home characteristics of pupils This section shows the breakdown of standard 6 pupils by their socioeconomic status. Other home
characteristics discussed include the number of books found at the pupils’ home, how often pupils
speak English outside school (especially at home), the education status of parents, regularity of
meals, sources of lighting at home, and where pupil’s stay during the school week.
What was the socio-economic status of SACMEQ III pupils?
The analysis under this section is drawn from pupils’ response to a question in the Pupil Booklet in
which they were requested to indicate whether each of 31 items were present in their homes. The
pupils’ answers on the items found in their homes were used to come up with a summary that
The SACMEQ III Project in Botswana
25
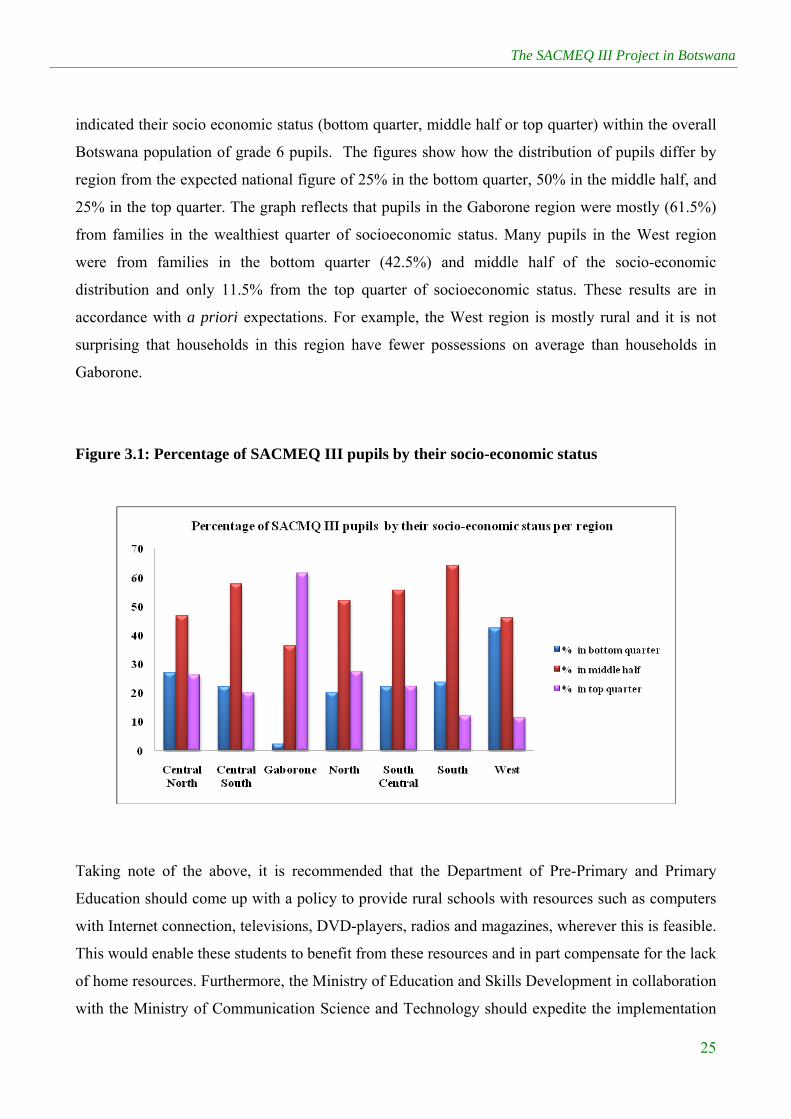
indicated their socio economic status (bottom quarter, middle half or top quarter) within the overall
Botswana population of grade 6 pupils. The figures show how the distribution of pupils differ by
region from the expected national figure of 25% in the bottom quarter, 50% in the middle half, and
25% in the top quarter. The graph reflects that pupils in the Gaborone region were mostly (61.5%)
from families in the wealthiest quarter of socioeconomic status. Many pupils in the West region
were from families in the bottom quarter (42.5%) and middle half of the socio-economic
distribution and only 11.5% from the top quarter of socioeconomic status. These results are in
accordance with a priori expectations. For example, the West region is mostly rural and it is not
surprising that households in this region have fewer possessions on average than households in
Gaborone.
Figure 3.1: Percentage of SACMEQ III pupils by their socio-economic status
Taking note of the above, it is recommended that the Department of Pre-Primary and Primary
Education should come up with a policy to provide rural schools with resources such as computers
with Internet connection, televisions, DVD-players, radios and magazines, wherever this is feasible.
This would enable these students to benefit from these resources and in part compensate for the lack
of home resources. Furthermore, the Ministry of Education and Skills Development in collaboration
with the Ministry of Communication Science and Technology should expedite the implementation
Chapter 3: Characteristics of Pupils, their Homes and Learning Environments
26
of NDP10 Recommendation 76 on Computer Refurbishment Project so that pupils have access to
computers at an early age. There is also a need to ensure that all schools are provided with
televisions so that disadvantaged pupils could also benefit from Educational Television, once this is
established as per the NDP 10 Recommendation 77.
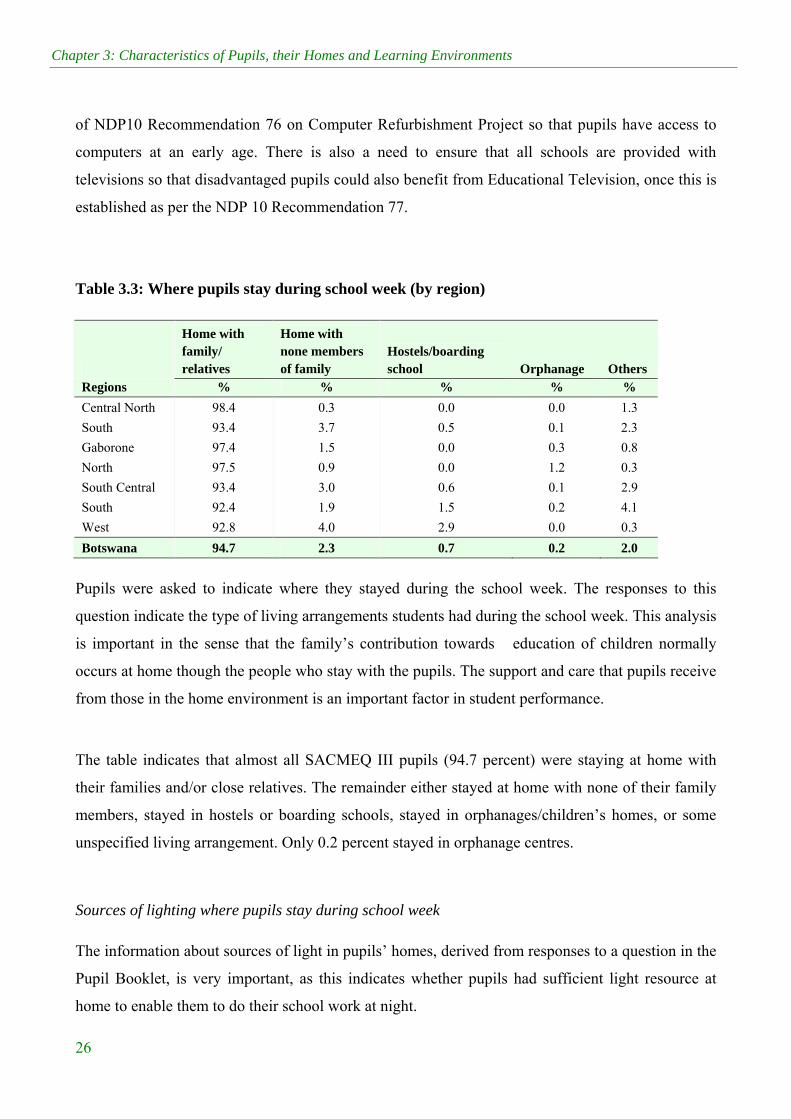
Table 3.3: Where pupils stay during school week (by region)
Home with family/ relatives
Home with none members of family
Hostels/boarding school Orphanage Others
Regions % % % % %
Central North 98.4 0.3 0.0 0.0 1.3
South 93.4 3.7 0.5 0.1 2.3
Gaborone 97.4 1.5 0.0 0.3 0.8
North 97.5 0.9 0.0 1.2 0.3
South Central 93.4 3.0 0.6 0.1 2.9
South 92.4 1.9 1.5 0.2 4.1
West 92.8 4.0 2.9 0.0 0.3
Botswana 94.7 2.3 0.7 0.2 2.0
Pupils were asked to indicate where they stayed during the school week. The responses to this
question indicate the type of living arrangements students had during the school week. This analysis
is important in the sense that the family’s contribution towards education of children normally
occurs at home though the people who stay with the pupils. The support and care that pupils receive
from those in the home environment is an important factor in student performance.
The table indicates that almost all SACMEQ III pupils (94.7 percent) were staying at home with
their families and/or close relatives. The remainder either stayed at home with none of their family
members, stayed in hostels or boarding schools, stayed in orphanages/children’s homes, or some
unspecified living arrangement. Only 0.2 percent stayed in orphanage centres.
Sources of lighting where pupils stay during school week
The information about sources of light in pupils’ homes, derived from responses to a question in the
Pupil Booklet, is very important, as this indicates whether pupils had sufficient light resource at
home to enable them to do their school work at night.

The SACMEQ III Project in Botswana
27
Table 3.4: Percentage of sources of light in homes where SACMEQ III pupils stay during
school week
Source of Lighting in Pupils' Homes
Electricity Paraffin/ oil Candle Gas Fire None
Regions % % % % % %
Central North 50.8 35.5 12.6 0.6 0.5 0.0
South 48.1 34.5 13.6 1.8 1.9 0.1
Gaborone 85.1 11.1 3.1 0.5 0.0 0.3
North 57.1 25.8 15.0 0.9 1.2 0.0
South Central 49.8 32.6 14.2 1.9 1.4 0.1
South 31.3 40.7 27.0 0.8 0.2 0.0
West 40.9 25.9 30.3 0.0 2.6 0.3
Botswana 50.1 31.4 16.2 1.1 1.1 0.1
Just over half (50.1%) of pupils stayed in homes where the source of lighting was electricity. This
reflects the fact that most villages in the country have access to electricity. The second commonly
reported source of lighting homes was paraffin/oil at 31.4 percent overall, followed by the use of
candles at 16.2 percent. Very few pupils (1.1%) reported using either gas or fire for lighting at
home; only 0.1% reported that they did not have any source of lighting at home. The South region
and the West region had the lowest percentages (31.3% and 40.9% respectively) of pupils who had
electricity, while pupils in Gaborone came from families which commonly used electricity as their
source of lighting (85.1%).
Table 3.5: Number of books found in pupils’ homes (by region)
% of pupils in each category of number of books at home
Regions None 1 to 5 6 to 30 31 to 75 76 to 150 Above 150 Central North 24.9 44.5 21.9 5.6 1.9 1.3
Central South 21.3 48.2 23.6 4.7 1.3 1.0
Gaborone 9.5 26.9 31.5 14.1 10.0 7.9
North 17.5 56.7 20.2 4.0 0.9 0.6
South Central 20.7 47.2 23.6 5.0 2.9 0.6
South 19.9 52.2 19.9 3.7 2.7 1.5
West 37.9 44.8 13.8 2.0 0.9 0.6
Botswana 21.5 46.3 22.4 5.4 2.7 1.7
Chapter 3: Characteristics of Pupils, their Homes and Learning Environments
28
Books and other reading materials found at home are believed to positively influence pupils’
learning at home. Pupils were asked to indicate the number of books found in their homes besides
their school books. In Gaborone only 9.5% indicated that there were no books where they stayed
during the school week, with 63.5% reporting that there are more than five books in their homes.
For the remaining six regions more than two-thirds of pupils fell within the categories who had no
books or less than six books in their homes. The worst off were the West region, where 37.9% of
pupils did not have any books in their homes and 44.8% more had less than less than six books in
their homes. Somewhat less serious was the situation in Central North region, where 24.9% of the
pupils had no books and another 44.5% at most five books in their homes.
The Department of Pre- and Primary should make sure that school libraries in the affected regions
are fully resourced and pupils are encouraged to borrow books to read in school and at home to
foster independent learning. On the other hand school, where pupils do have books at home, staff
should encourage pupils to make use of these books.
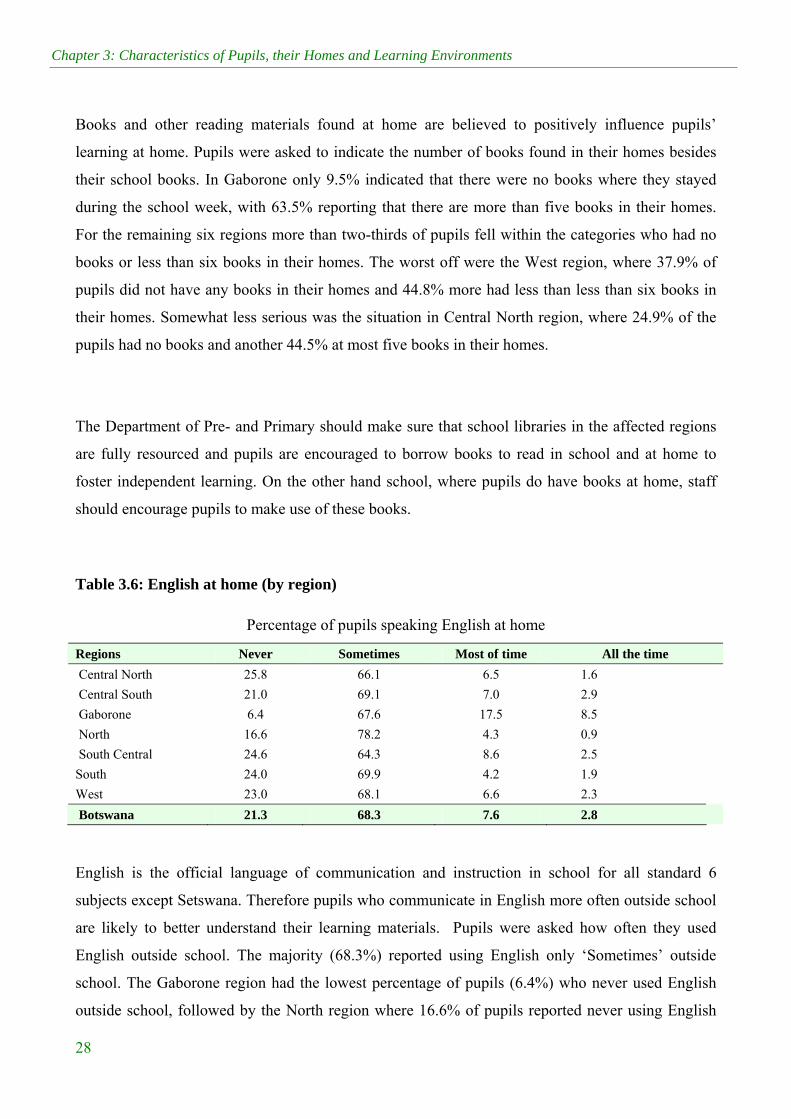
Table 3.6: English at home (by region)
Percentage of pupils speaking English at home
Regions Never Sometimes Most of time All the time
Central North 25.8 66.1 6.5 1.6
Central South 21.0 69.1 7.0 2.9
Gaborone 6.4 67.6 17.5 8.5
North 16.6 78.2 4.3 0.9
South Central 24.6 64.3 8.6 2.5
South 24.0 69.9 4.2 1.9
West 23.0 68.1 6.6 2.3
Botswana 21.3 68.3 7.6 2.8
English is the official language of communication and instruction in school for all standard 6
subjects except Setswana. Therefore pupils who communicate in English more often outside school
are likely to better understand their learning materials. Pupils were asked how often they used
English outside school. The majority (68.3%) reported using English only ‘Sometimes’ outside
school. The Gaborone region had the lowest percentage of pupils (6.4%) who never used English
outside school, followed by the North region where 16.6% of pupils reported never using English
The SACMEQ III Project in Botswana
29
outside school. The remaining regions ranged from 21% to 25.8% of students who never used
English outside school. Gaborone had the highest percentage (26%) of pupils who reported using
English ‘most of the time’ or ‘all the time’ outside school.
3.5 Pupils and their learning environment It is widely accepted that a conducive learning environment has a positive impact on learning.
Availability of resources – such as exercise books for each subjects, pencils, pens, textbooks for
mathematics and reading, pupils tables and chairs (sitting and writing space), teacher guides,
teachers’ tables and chairs, dictionaries for teachers’ use, writing boards, access to radio, and school
libraries – was used to determine the level of resources in the school. The listed items are believed
to be key in enabling teaching and learning. The analysis was drawn from pupil responses in the
Pupil Booklet, teacher responses in the Teacher Booklet and school head responses in the School
Information Booklet.
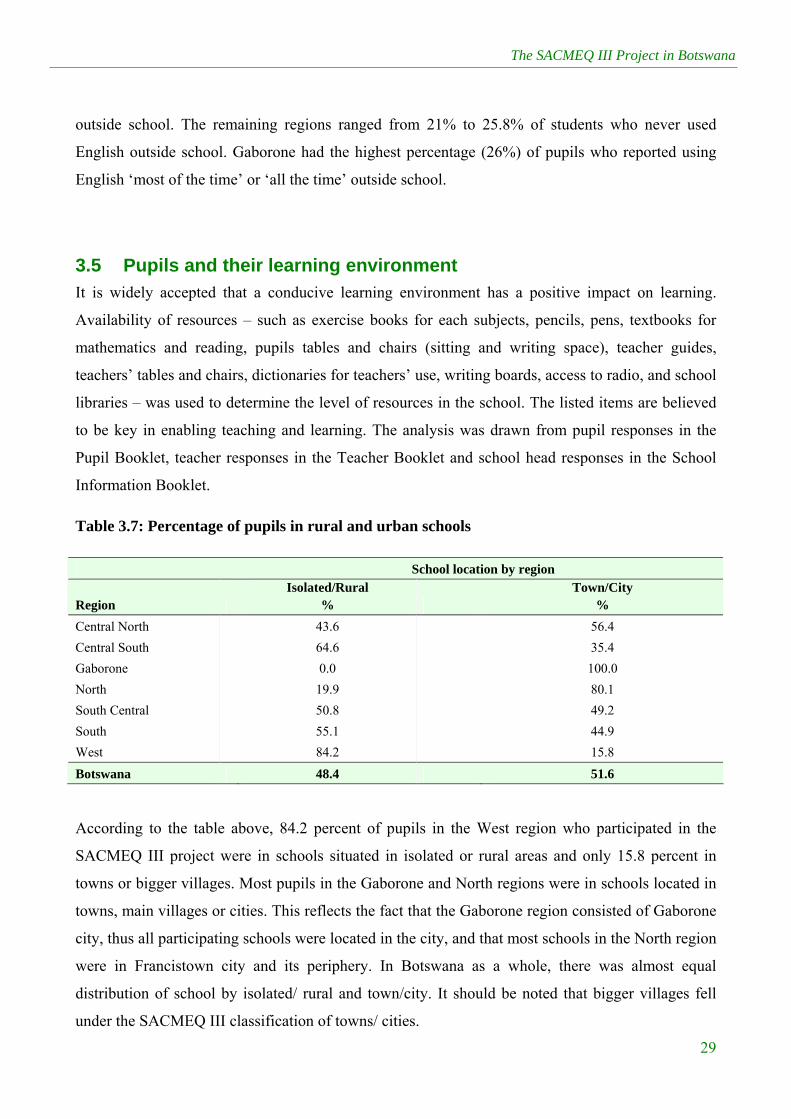
Table 3.7: Percentage of pupils in rural and urban schools
School location by region
Region Isolated/Rural
% Town/City
%
Central North 43.6 56.4
Central South 64.6 35.4
Gaborone 0.0 100.0
North 19.9 80.1
South Central 50.8 49.2
South 55.1 44.9
West 84.2 15.8
Botswana 48.4 51.6
According to the table above, 84.2 percent of pupils in the West region who participated in the
SACMEQ III project were in schools situated in isolated or rural areas and only 15.8 percent in
towns or bigger villages. Most pupils in the Gaborone and North regions were in schools located in
towns, main villages or cities. This reflects the fact that the Gaborone region consisted of Gaborone
city, thus all participating schools were located in the city, and that most schools in the North region
were in Francistown city and its periphery. In Botswana as a whole, there was almost equal
distribution of school by isolated/ rural and town/city. It should be noted that bigger villages fell
under the SACMEQ III classification of towns/ cities.
Chapter 3: Characteristics of Pupils, their Homes and Learning Environments
30
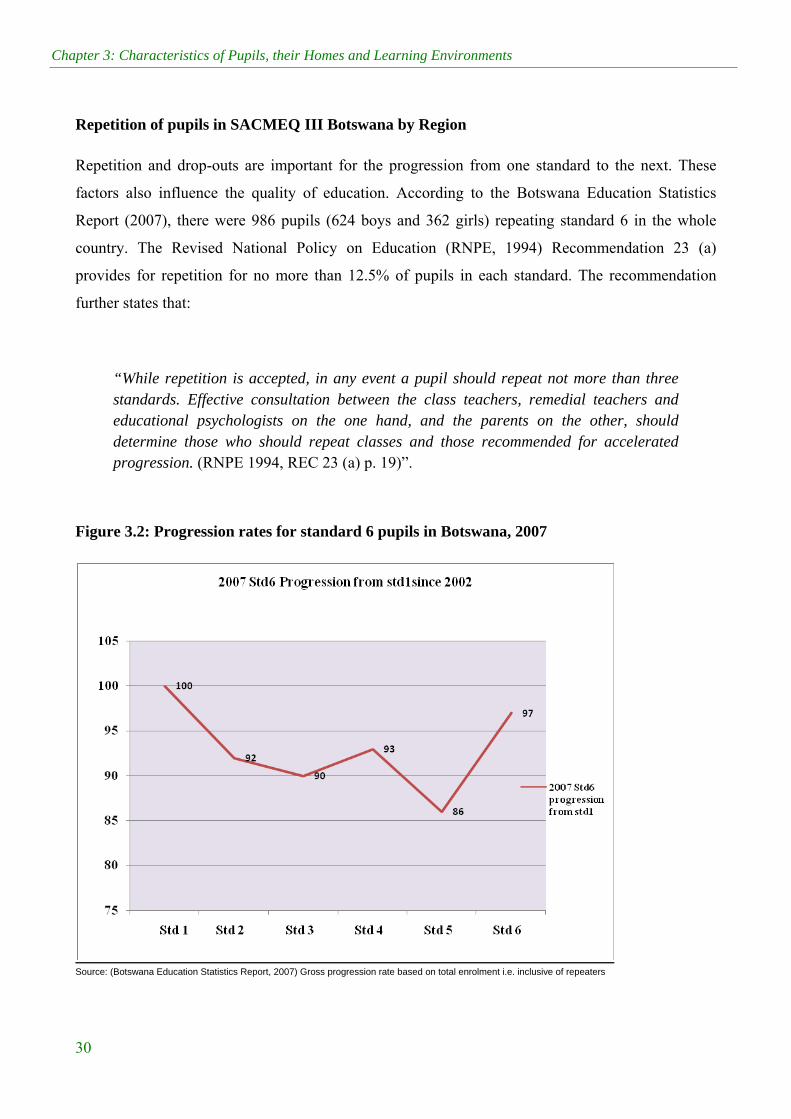
Repetition of pupils in SACMEQ III Botswana by Region
Repetition and drop-outs are important for the progression from one standard to the next. These
factors also influence the quality of education. According to the Botswana Education Statistics
Report (2007), there were 986 pupils (624 boys and 362 girls) repeating standard 6 in the whole
country. The Revised National Policy on Education (RNPE, 1994) Recommendation 23 (a)
provides for repetition for no more than 12.5% of pupils in each standard. The recommendation
further states that:
“While repetition is accepted, in any event a pupil should repeat not more than three standards. Effective consultation between the class teachers, remedial teachers and educational psychologists on the one hand, and the parents on the other, should determine those who should repeat classes and those recommended for accelerated progression. (RNPE 1994, REC 23 (a) p. 19)”.
Figure 3.2: Progression rates for standard 6 pupils in Botswana, 2007
Source: (Botswana Education Statistics Report, 2007) Gross progression rate based on total enrolment i.e. inclusive of repeaters
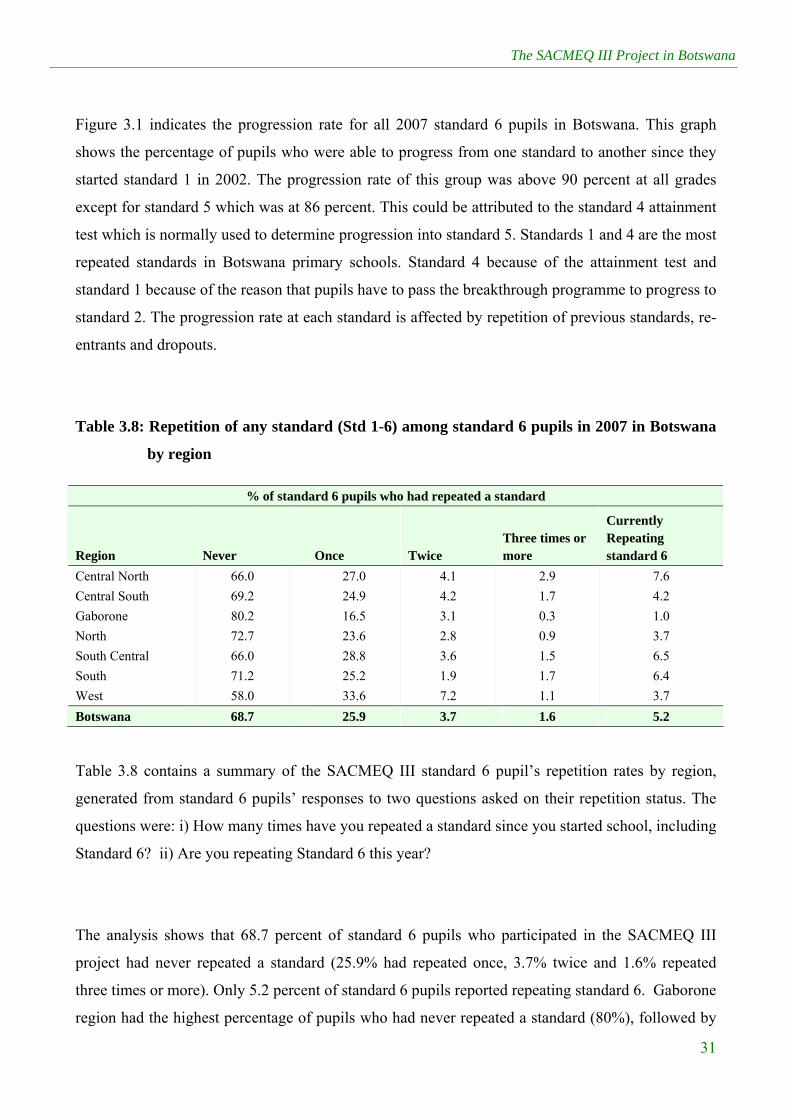
The SACMEQ III Project in Botswana
31
Figure 3.1 indicates the progression rate for all 2007 standard 6 pupils in Botswana. This graph
shows the percentage of pupils who were able to progress from one standard to another since they
started standard 1 in 2002. The progression rate of this group was above 90 percent at all grades
except for standard 5 which was at 86 percent. This could be attributed to the standard 4 attainment
test which is normally used to determine progression into standard 5. Standards 1 and 4 are the most
repeated standards in Botswana primary schools. Standard 4 because of the attainment test and
standard 1 because of the reason that pupils have to pass the breakthrough programme to progress to
standard 2. The progression rate at each standard is affected by repetition of previous standards, re-
entrants and dropouts.
Table 3.8: Repetition of any standard (Std 1-6) among standard 6 pupils in 2007 in Botswana
by region
% of standard 6 pupils who had repeated a standard
Region Never Once Twice Three times or more
Currently Repeating standard 6
Central North 66.0 27.0 4.1 2.9 7.6
Central South 69.2 24.9 4.2 1.7 4.2
Gaborone 80.2 16.5 3.1 0.3 1.0
North 72.7 23.6 2.8 0.9 3.7
South Central 66.0 28.8 3.6 1.5 6.5
South 71.2 25.2 1.9 1.7 6.4
West 58.0 33.6 7.2 1.1 3.7
Botswana 68.7 25.9 3.7 1.6 5.2
Table 3.8 contains a summary of the SACMEQ III standard 6 pupil’s repetition rates by region,
generated from standard 6 pupils’ responses to two questions asked on their repetition status. The
questions were: i) How many times have you repeated a standard since you started school, including
Standard 6? ii) Are you repeating Standard 6 this year?
The analysis shows that 68.7 percent of standard 6 pupils who participated in the SACMEQ III
project had never repeated a standard (25.9% had repeated once, 3.7% twice and 1.6% repeated
three times or more). Only 5.2 percent of standard 6 pupils reported repeating standard 6. Gaborone
region had the highest percentage of pupils who had never repeated a standard (80%), followed by
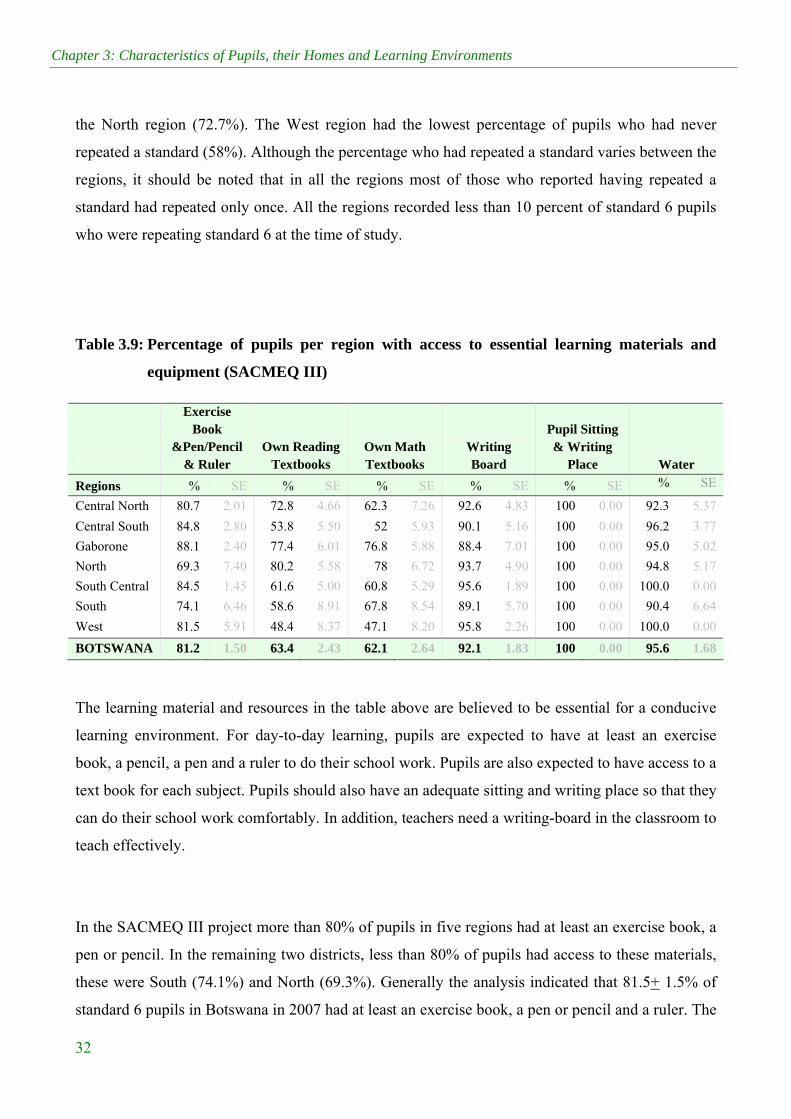
Chapter 3: Characteristics of Pupils, their Homes and Learning Environments
32
the North region (72.7%). The West region had the lowest percentage of pupils who had never
repeated a standard (58%). Although the percentage who had repeated a standard varies between the
regions, it should be noted that in all the regions most of those who reported having repeated a
standard had repeated only once. All the regions recorded less than 10 percent of standard 6 pupils
who were repeating standard 6 at the time of study.
Table 3.9: Percentage of pupils per region with access to essential learning materials and
equipment (SACMEQ III)
Exercise Book
&Pen/Pencil & Ruler
Own Reading Textbooks
Own Math Textbooks
Writing Board
Pupil Sitting & Writing
Place Water
Regions % SE % SE % SE % SE % SE % SE
Central North 80.7 2.01 72.8 4.66 62.3 7.26 92.6 4.83 100 0.00 92.3 5.37
Central South 84.8 2.80 53.8 5.50 52 5.93 90.1 5.16 100 0.00 96.2 3.77
Gaborone 88.1 2.40 77.4 6.01 76.8 5.88 88.4 7.01 100 0.00 95.0 5.02
North 69.3 7.40 80.2 5.58 78 6.72 93.7 4.90 100 0.00 94.8 5.17
South Central 84.5 1.45 61.6 5.00 60.8 5.29 95.6 1.89 100 0.00 100.0 0.00
South 74.1 6.46 58.6 8.91 67.8 8.54 89.1 5.70 100 0.00 90.4 6.64
West 81.5 5.91 48.4 8.37 47.1 8.20 95.8 2.26 100 0.00 100.0 0.00
BOTSWANA 81.2 1.50 63.4 2.43 62.1 2.64 92.1 1.83 100 0.00 95.6 1.68
The learning material and resources in the table above are believed to be essential for a conducive
learning environment. For day-to-day learning, pupils are expected to have at least an exercise
book, a pencil, a pen and a ruler to do their school work. Pupils are also expected to have access to a
text book for each subject. Pupils should also have an adequate sitting and writing place so that they
can do their school work comfortably. In addition, teachers need a writing-board in the classroom to
teach effectively.
In the SACMEQ III project more than 80% of pupils in five regions had at least an exercise book, a
pen or pencil. In the remaining two districts, less than 80% of pupils had access to these materials,
these were South (74.1%) and North (69.3%). Generally the analysis indicated that 81.5+ 1.5% of
standard 6 pupils in Botswana in 2007 had at least an exercise book, a pen or pencil and a ruler. The
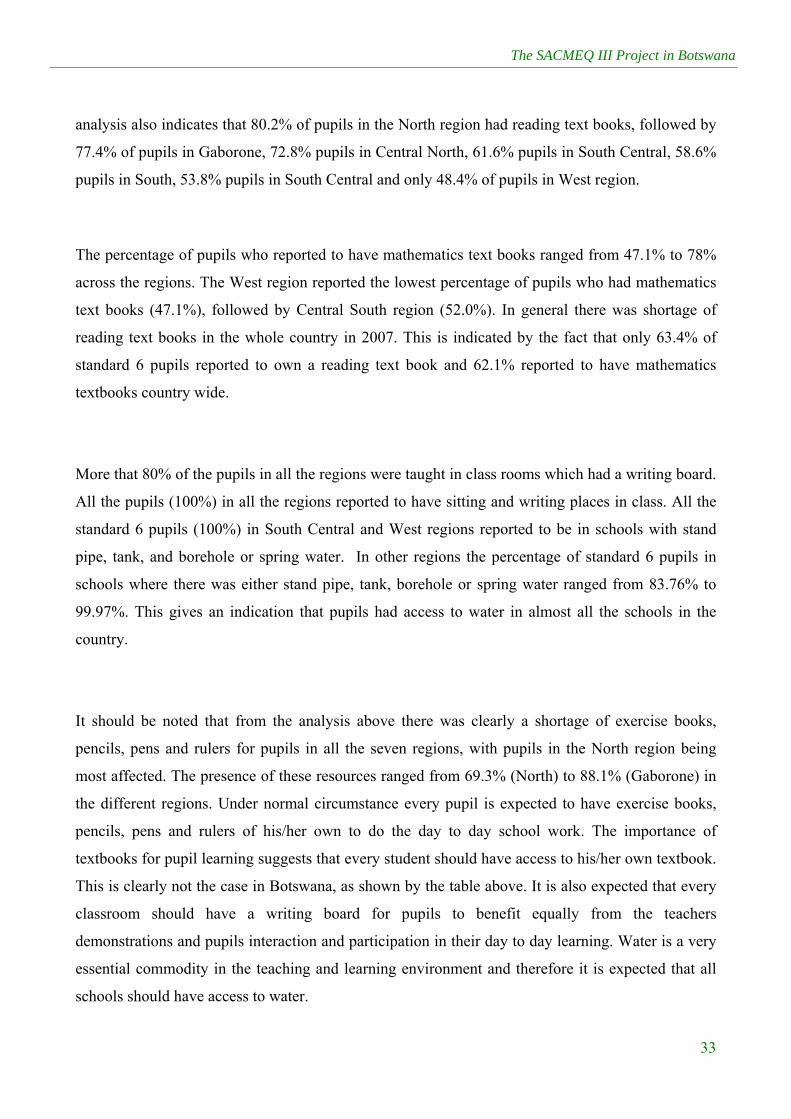
The SACMEQ III Project in Botswana
33
analysis also indicates that 80.2% of pupils in the North region had reading text books, followed by
77.4% of pupils in Gaborone, 72.8% pupils in Central North, 61.6% pupils in South Central, 58.6%
pupils in South, 53.8% pupils in South Central and only 48.4% of pupils in West region.
The percentage of pupils who reported to have mathematics text books ranged from 47.1% to 78%
across the regions. The West region reported the lowest percentage of pupils who had mathematics
text books (47.1%), followed by Central South region (52.0%). In general there was shortage of
reading text books in the whole country in 2007. This is indicated by the fact that only 63.4% of
standard 6 pupils reported to own a reading text book and 62.1% reported to have mathematics
textbooks country wide.
More that 80% of the pupils in all the regions were taught in class rooms which had a writing board.
All the pupils (100%) in all the regions reported to have sitting and writing places in class. All the
standard 6 pupils (100%) in South Central and West regions reported to be in schools with stand
pipe, tank, and borehole or spring water. In other regions the percentage of standard 6 pupils in
schools where there was either stand pipe, tank, borehole or spring water ranged from 83.76% to
99.97%. This gives an indication that pupils had access to water in almost all the schools in the
country.
It should be noted that from the analysis above there was clearly a shortage of exercise books,
pencils, pens and rulers for pupils in all the seven regions, with pupils in the North region being
most affected. The presence of these resources ranged from 69.3% (North) to 88.1% (Gaborone) in
the different regions. Under normal circumstance every pupil is expected to have exercise books,
pencils, pens and rulers of his/her own to do the day to day school work. The importance of
textbooks for pupil learning suggests that every student should have access to his/her own textbook.
This is clearly not the case in Botswana, as shown by the table above. It is also expected that every
classroom should have a writing board for pupils to benefit equally from the teachers
demonstrations and pupils interaction and participation in their day to day learning. Water is a very
essential commodity in the teaching and learning environment and therefore it is expected that all
schools should have access to water.
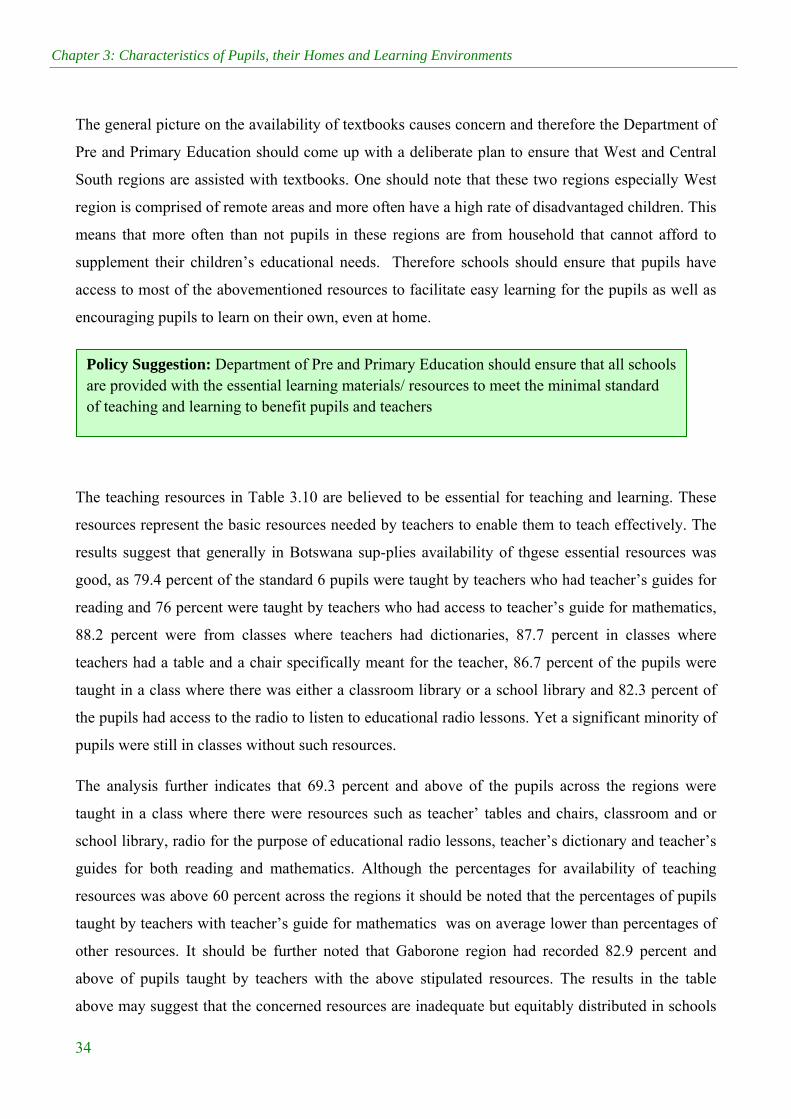
Chapter 3: Characteristics of Pupils, their Homes and Learning Environments
34
The general picture on the availability of textbooks causes concern and therefore the Department of
Pre and Primary Education should come up with a deliberate plan to ensure that West and Central
South regions are assisted with textbooks. One should note that these two regions especially West
region is comprised of remote areas and more often have a high rate of disadvantaged children. This
means that more often than not pupils in these regions are from household that cannot afford to
supplement their children’s educational needs. Therefore schools should ensure that pupils have
access to most of the abovementioned resources to facilitate easy learning for the pupils as well as
encouraging pupils to learn on their own, even at home.
The teaching resources in Table 3.10 are believed to be essential for teaching and learning. These
resources represent the basic resources needed by teachers to enable them to teach effectively. The
results suggest that generally in Botswana sup-plies availability of thgese essential resources was
good, as 79.4 percent of the standard 6 pupils were taught by teachers who had teacher’s guides for
reading and 76 percent were taught by teachers who had access to teacher’s guide for mathematics,
88.2 percent were from classes where teachers had dictionaries, 87.7 percent in classes where
teachers had a table and a chair specifically meant for the teacher, 86.7 percent of the pupils were
taught in a class where there was either a classroom library or a school library and 82.3 percent of
the pupils had access to the radio to listen to educational radio lessons. Yet a significant minority of
pupils were still in classes without such resources.
The analysis further indicates that 69.3 percent and above of the pupils across the regions were
taught in a class where there were resources such as teacher’ tables and chairs, classroom and or
school library, radio for the purpose of educational radio lessons, teacher’s dictionary and teacher’s
guides for both reading and mathematics. Although the percentages for availability of teaching
resources was above 60 percent across the regions it should be noted that the percentages of pupils
taught by teachers with teacher’s guide for mathematics was on average lower than percentages of
other resources. It should be further noted that Gaborone region had recorded 82.9 percent and
above of pupils taught by teachers with the above stipulated resources. The results in the table
above may suggest that the concerned resources are inadequate but equitably distributed in schools
Policy Suggestion: Department of Pre and Primary Education should ensure that all schools are provided with the essential learning materials/ resources to meet the minimal standard of teaching and learning to benefit pupils and teachers

The SACMEQ III Project in Botswana
35
across the country. The government should aim to improve the provision of resources such that
schools are adequately equipped with the educational resources needed for teaching and learning.
Table 3.10: Percentage of pupils per region taught by teachers with access to essential
teaching materials and equipment
TEACHING & LEARNING MATERIALS
Teacher Guide
(Reading) Teacher
Guide (Math) Dictionary Teacher Table
& Chair Library
(Class/School) Radio
Regions % SE % SE % SE % SE % SE % SE
Central North 81.9 7.22 75.1 8.30 89.7 5.36 95.4 4.54 83.0 6.87 76.3 8.77
Central South 75.1 7.16 70.5 7.85 89.9 5.21 90.0 5.17 86.8 6.05 92.9 4.95
Gaborone 86.5 6.42 86.7 5.62 93.7 5.05 85.8 7.02 82.9 8.02 84.9 8.24
North 85.9 7.17 69.3 9.73 91.0 5.47 90.9 5.45 91.8 5.78 80.1 9.13
South Central 75.0 6.48 77.6 6.17 90.8 3.67 85.4 5.20 85.2 6.51 83.3 7.08
South 82.8 7.49 75.5 8.42 76.4 8.38 79.8 7.75 87.6 6.25 70.3 10.47
West 75.3 7.21 81.3 7.63 87.4 6.78 86.5 6.89 94.9 5.07 86.2 7.66
BOTSWANA 79.4 2.79 76.0 3.02 88.2 2.23 87.7 2.30 86.7 2.56 82.3 3.08
Table 3.11 shows that there was a significant number of standard 6 pupils who took extra lessons,
ranging from 29.1% in Isolated/Rural areas to 27.1% in Towns/Cities.. The pupils reported different
methods of payment for their extra lessons. Most of the pupils in schools based in isolated or rural
areas indicated that they receive their extra lessons free of charge (72.1 %), while 18.8 percent used
money payment for their extra lesson, and around five percent used other kinds of payment, apart
from money and four percent used both money and other kind of payment. The percentage of pupils
in schools based in major villages, towns or cities who reported to be receiving their extra lessons
without payment was 66.2 percent, while 23.7 percent reported that they were paying with money
for their extra lessons and around six percent were paying with other kinds of payment other than
money, and four percent were paying with both money and any other kind of payment other than
money. It should be noted that the general picture of payment for extra lessons in Botswana no
matter where the school is located is that most of the pupils (69.1 percent) were receiving extra
lessons without paying, followed by 21.2 percent of those who were using money for payment, then
followed by those who used other kinds of payment and the least percentage of pupils across the
school locations were those who reported to be paying with both money and other kind of payment
other than money.
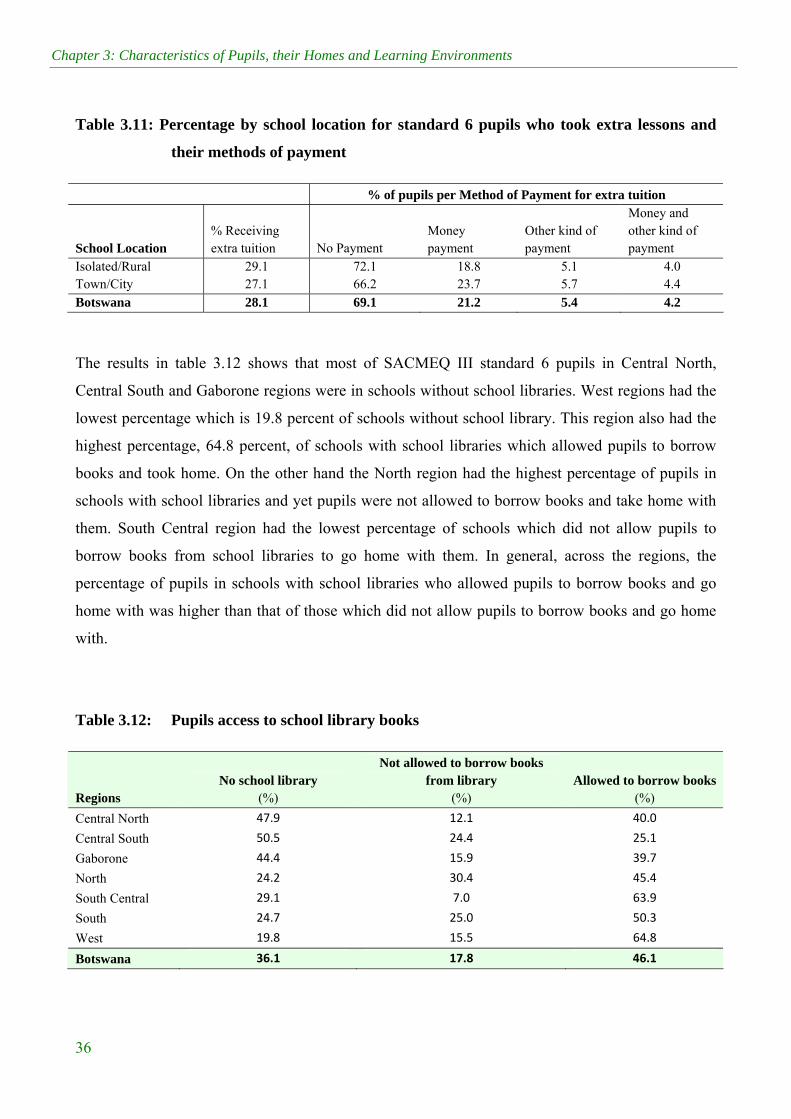
Chapter 3: Characteristics of Pupils, their Homes and Learning Environments
36
Table 3.11: Percentage by school location for standard 6 pupils who took extra lessons and
their methods of payment
% of pupils per Method of Payment for extra tuition
School Location % Receiving extra tuition No Payment
Money payment
Other kind of payment
Money and other kind of payment
Isolated/Rural 29.1 72.1 18.8 5.1 4.0 Town/City 27.1 66.2 23.7 5.7 4.4 Botswana 28.1 69.1 21.2 5.4 4.2
The results in table 3.12 shows that most of SACMEQ III standard 6 pupils in Central North,
Central South and Gaborone regions were in schools without school libraries. West regions had the
lowest percentage which is 19.8 percent of schools without school library. This region also had the
highest percentage, 64.8 percent, of schools with school libraries which allowed pupils to borrow
books and took home. On the other hand the North region had the highest percentage of pupils in
schools with school libraries and yet pupils were not allowed to borrow books and take home with
them. South Central region had the lowest percentage of schools which did not allow pupils to
borrow books from school libraries to go home with them. In general, across the regions, the
percentage of pupils in schools with school libraries who allowed pupils to borrow books and go
home with was higher than that of those which did not allow pupils to borrow books and go home
with.
Table 3.12: Pupils access to school library books
Regions No school library
(%)
Not allowed to borrow books from library
(%) Allowed to borrow books
(%)
Central North 47.9 12.1 40.0
Central South 50.5 24.4 25.1
Gaborone 44.4 15.9 39.7
North 24.2 30.4 45.4
South Central 29.1 7.0 63.9
South 24.7 25.0 50.3
West 19.8 15.5 64.8
Botswana 36.1 17.8 46.1
The SACMEQ III Project in Botswana
37
3.6 Conclusion The analysis in this chapter has provided information on pupils’ personal, home and learning
environment characteristics for the 2007 standard 6 pupils who participated in SACMEQ III project.
The provided information can be taken as baseline information about the primary school pupils in
Botswana and their learning environment. Among others the findings have revealed that there is
gender equity in terms of access for children to primary education. The analysis on school resources
in place at schools has also revealed a relatively equitable distribution of resources across the
country. Most of the SACMEQ III pupils reported that they stay at home with their families or
relatives. This is good for pupils’ since parents can provide guidance and assistance on school work.
Therefore, schools should take advantage of this and strengthen their Parent Teacher Associations
to ensure that parents participate in their children’s learning. There is need to address the prevailing
repetition rate of 31.3 percent through interventions such as remedial lessons for pupils who are
struggling. The survey results suggest that not every pupil had access to essential stationery such as
exercise books, pens, pencils, and rulers. Furthermore, there is a serious shortage of text books for both
reading and mathematics at the standard 6 level.
The Department of Pre and Primary education should ensure that all pupils are provided with basic
resources to meet their day to day learning needs. Resources such as teachers’ guides, libraries,
radios and writing boards were found to be adequate in schools and equitably distributed by regions.
The Ministry of Local Government should be commended for the provision of school furniture such
as teachers’ chairs and tables, and pupils’ chairs and tables.
There is evidence that most pupils (68.3 percent) speak English at home sometimes, therefore there
is need for school heads and teachers to encourage pupils to speak English more often even at home
to improve on their communication skills and grammar. Regarding extra lessons, 28.1 percent of
SACMEQ III pupils reported that they took extra lessons outside school hours. Most of these pupils
Policy Suggestion: Regional Education Directors should ensure that primary schools have
school libraries as per RNPE1994, REC 14, and that students are allowed to take library
books home.
Chapter 3: Characteristics of Pupils, their Homes and Learning Environments
38
reported that they were not making any payment for these lessons and this may suggest that the
pupils were referring to remedial lessons provided by their teachers. It is therefore very important
that managements for schools engages parents and encourage them to contribute towards their
children’s educations by engaging private tutors to assist their children with school work where
need be.
Parents should also be urged to encourage their children to use English at home more often where
possible and take advantage of books found in their homes to improve on their reading skills. To
ensure parents’ and guardians’ positive participation in their children’s education there should be
active Parents Teacher Associations in schools. The Ministry of Education through the regional
directors, in collaboration with the Ministry of Labour and Home Affairs (which is responsible for
the provision of library services) should ensure that primary schools have libraries where pupils
have access to books which they can borrow and take home. In the RNPE 1994, it is recommended
that a standard primary school should have a library.
Chapter 4 Characteristics of Teachers, their Views on Classroom
Resources and Professional Support
4.1 Introduction This chapter presents the characteristics and experiences of standard 6 in Botswana. The teachers’
views about teaching, classroom resources, professional support and their job satisfaction are some
of the key variables that one would like to evaluate if one is interested in monitoring educational
quality. These variables are likely to have a noticeable impact on pupil achievement
The key questions for this study that have been addressed under this chapter are as follows:
1. Personal characteristics of standard 6 teachers (for example; age, gender and socio-economic level) as well as the condition of their housing.
2. Professional characteristics of standard 6 teachers in terms of academic, professional and in-service training, and whether they considered in-service training to be effective in improving their teaching.
3. Standard 6 teachers’ allocation of their time among responsibilities concerned with teaching, preparing lessons and marking.
4. Standard 6 teachers’ views on a) pupil activities b) teaching goals c) teaching approach/strategies d) assessment procedures, and e) meeting and communicating with parents.
5. Availability of classroom furniture and classroom equipment in standard 6 classrooms.
6. Professional support given to standard 6 teachers.
7. The most significant determinants of teacher job satisfaction.
4.2 Personal characteristics of Standard 6 teachers
Age distribution for reading teachers
The age distribution of the teachers is indicated in Table 4.1 below. Information presented in Table
4.1a above has been summarized in Figure 4.1 below to indicate the pattern of average percentage
distribution of age.
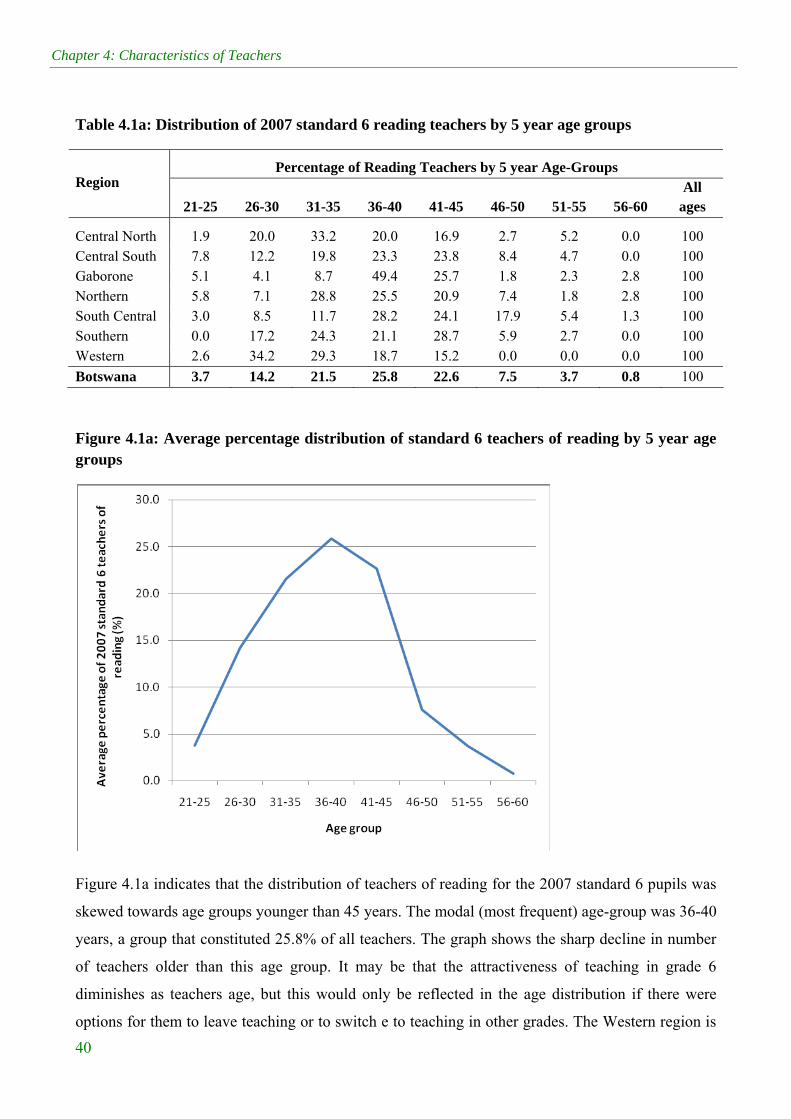
Chapter 4: Characteristics of Teachers
40
Table 4.1a: Distribution of 2007 standard 6 reading teachers by 5 year age groups
Percentage of Reading Teachers by 5 year Age-Groups Region
21-25 26-30 31-35 36-40 41-45 46-50 51-55 56-60 All
ages
Central North 1.9 20.0 33.2 20.0 16.9 2.7 5.2 0.0 100 Central South 7.8 12.2 19.8 23.3 23.8 8.4 4.7 0.0 100 Gaborone 5.1 4.1 8.7 49.4 25.7 1.8 2.3 2.8 100 Northern 5.8 7.1 28.8 25.5 20.9 7.4 1.8 2.8 100 South Central 3.0 8.5 11.7 28.2 24.1 17.9 5.4 1.3 100 Southern 0.0 17.2 24.3 21.1 28.7 5.9 2.7 0.0 100 Western 2.6 34.2 29.3 18.7 15.2 0.0 0.0 0.0 100
Botswana 3.7 14.2 21.5 25.8 22.6 7.5 3.7 0.8 100
Figure 4.1a: Average percentage distribution of standard 6 teachers of reading by 5 year age groups
Figure 4.1a indicates that the distribution of teachers of reading for the 2007 standard 6 pupils was
skewed towards age groups younger than 45 years. The modal (most frequent) age-group was 36-40
years, a group that constituted 25.8% of all teachers. The graph shows the sharp decline in number
of teachers older than this age group. It may be that the attractiveness of teaching in grade 6
diminishes as teachers age, but this would only be reflected in the age distribution if there were
options for them to leave teaching or to switch e to teaching in other grades. The Western region is
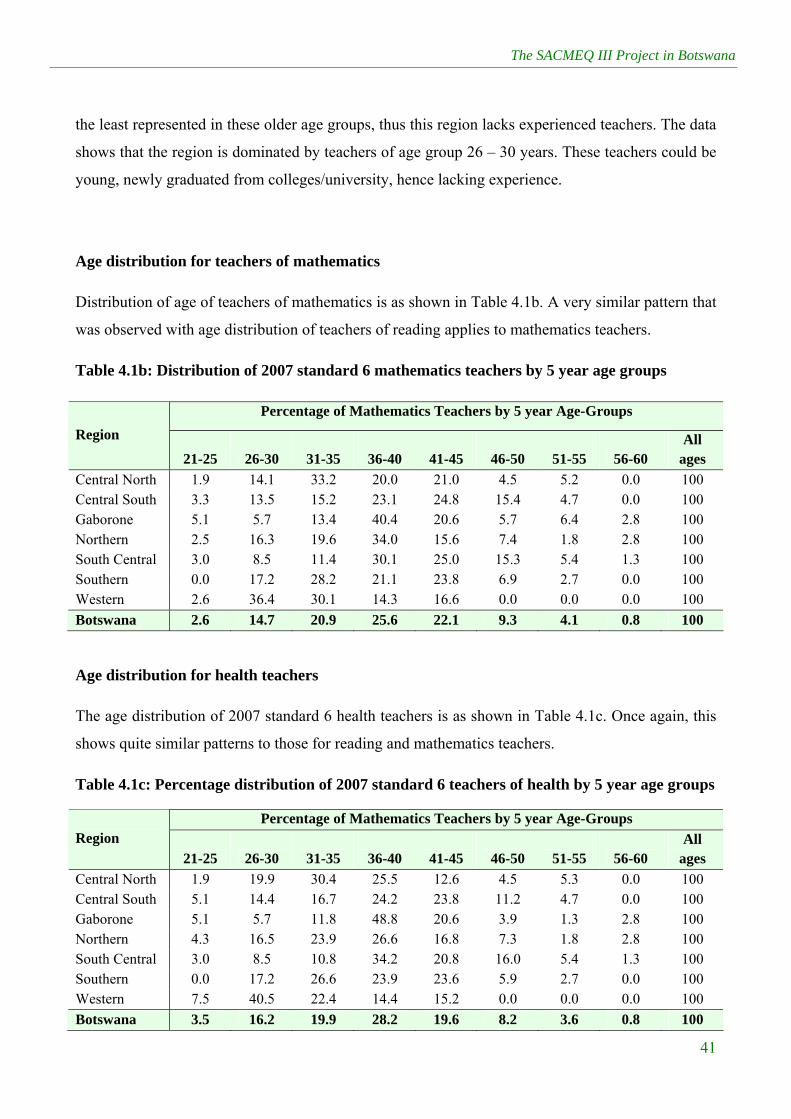
The SACMEQ III Project in Botswana
41
the least represented in these older age groups, thus this region lacks experienced teachers. The data
shows that the region is dominated by teachers of age group 26 – 30 years. These teachers could be
young, newly graduated from colleges/university, hence lacking experience.
Age distribution for teachers of mathematics
Distribution of age of teachers of mathematics is as shown in Table 4.1b. A very similar pattern that
was observed with age distribution of teachers of reading applies to mathematics teachers.
Table 4.1b: Distribution of 2007 standard 6 mathematics teachers by 5 year age groups
Percentage of Mathematics Teachers by 5 year Age-Groups
Region
21-25 26-30 31-35 36-40 41-45 46-50 51-55 56-60 All
ages
Central North 1.9 14.1 33.2 20.0 21.0 4.5 5.2 0.0 100 Central South 3.3 13.5 15.2 23.1 24.8 15.4 4.7 0.0 100 Gaborone 5.1 5.7 13.4 40.4 20.6 5.7 6.4 2.8 100 Northern 2.5 16.3 19.6 34.0 15.6 7.4 1.8 2.8 100 South Central 3.0 8.5 11.4 30.1 25.0 15.3 5.4 1.3 100 Southern 0.0 17.2 28.2 21.1 23.8 6.9 2.7 0.0 100 Western 2.6 36.4 30.1 14.3 16.6 0.0 0.0 0.0 100
Botswana 2.6 14.7 20.9 25.6 22.1 9.3 4.1 0.8 100
Age distribution for health teachers
The age distribution of 2007 standard 6 health teachers is as shown in Table 4.1c. Once again, this
shows quite similar patterns to those for reading and mathematics teachers.
Table 4.1c: Percentage distribution of 2007 standard 6 teachers of health by 5 year age groups
Percentage of Mathematics Teachers by 5 year Age-Groups Region
21-25 26-30 31-35 36-40 41-45 46-50 51-55 56-60 All
ages
Central North 1.9 19.9 30.4 25.5 12.6 4.5 5.3 0.0 100 Central South 5.1 14.4 16.7 24.2 23.8 11.2 4.7 0.0 100 Gaborone 5.1 5.7 11.8 48.8 20.6 3.9 1.3 2.8 100 Northern 4.3 16.5 23.9 26.6 16.8 7.3 1.8 2.8 100 South Central 3.0 8.5 10.8 34.2 20.8 16.0 5.4 1.3 100 Southern 0.0 17.2 26.6 23.9 23.6 5.9 2.7 0.0 100 Western 7.5 40.5 22.4 14.4 15.2 0.0 0.0 0.0 100
Botswana 3.5 16.2 19.9 28.2 19.6 8.2 3.6 0.8 100

Chapter 4: Characteristics of Teachers
42
Gender distribution of teachers of standard 6 pupils in 2007
The information presented in Table 4.2 indicates that there was no gender balance in the distribution
of teachers of standard 6 pupils in 2007: There were far more female than male teachers in all
regions except the Western Region. Observing the high numbers of male teachers in the Western
region, it seems necessary that Department of Pre- and Primary Education carry out an investigation
to determine factors that lead to this deviation from national norms. One would expect the small
number of male teachers to be more evenly distributed.
Table 4.2a: Gender distribution of teachers of 2007 standard 6 pupils
% of Standard 6 Reading Teachers by Sex
% of Standard 6 Mathematics Teachers by
Sex
% of Standard 6 Health Teachers by
Sex Region
Male Female Male Female Male Female
Central North 48.6 51.4 40.4 59.6 41.1 58.9 Central South 24.4 75.6 22.1 77.9 20.5 79.5 Gaborone 30.2 69.8 30.6 69.4 25.6 74.4 Northern 26.4 73.6 31.9 68.1 32.2 67.8 South Central 21.2 78.8 22.9 77.1 22.9 77.1 Southern 28.3 71.7 33.6 66.4 30.1 69.9 Western 80.2 19.8 76.3 23.7 81.3 18.7
Botswana 34.1 65.9 33.4 66.6 32.7 67.3
Policy Suggestion: Department of Pre and Primary Education carry out an investigation to determine factors that lead to more male teachers teaching in the Western region whereas the data reflects that there were more female teachers nationally.
4.3 Professional characteristics of Standard 6 teachers The professional characteristics of teachers that are assessed under this section include the number
of years of teacher training that the teachers completed, academic qualifications of teachers, their
experience in teaching standard 6, in-service courses attended, and their views on the effectiveness
of the in-service courses.
The distribution of years of teacher training by region is presented in Table 4.3a below. The data
show that 63.0% of Botswana pupils in 2007 standard 6 were taught reading by teachers who had

The SACMEQ III Project in Botswana
43
completed at least 3 years of teacher training. There is still a good number of pupils who were
taught reading by teachers who may not have received adequate training: 36.9% of the pupils were
taught by teachers who had received only 2 years of training or less.
Table 4.3a: Teacher training of reading teachers by region
% of Standard 6 Reading Teachers by years of teacher training completed
Region
1 Year 2 Years 3 Years >3 Years
Central North 0 35.8 41.4 22.8 Central South 1.8 39.0 31.8 27.4 Gaborone 0 22.6 26.0 51.4 Northern 0 24.5 33.4 42.0 South Central 0 47.1 22.3 30.6 Southern 1.5 42.7 23.0 32.8 Western 2.6 20.1 61.0 16.3
Botswana 0.8 36.1 32.2 30.8
Table 4.3b: Teacher training of mathematics teachers by region
% of Standard 6 Mathematics Teachers by years of teacher training completed
Region 1 Year 2 Years 3 Years >3 Years
Central North 0 40.0 36.0 24.0
Central South 1.8 35.6 28.2 34.4
Gaborone 0 26.4 21.8 51.8
Northern 0 32.5 31.6 35.9
South Central 0 45.4 24.9 29.7
Southern 1.5 37.3 22.8 38.3
Western 2.6 13.8 70.7 12.9
Botswana 0.8 35.4 31.4 32.3
Table 4.3b above shows that at least 36.2% of standard 6 pupils of 2007 were taught mathematics
by teachers who had received only 2 years of training or less. As for health teachers, the number of
students taught by teachers who were trained for at most 2 years was 37.6% (see Table 4.3c below).
These teachers may hold the Primary Teaching Certificate (PTC) qualification, which is a two year
program. The other educational qualification offered by the Botswana colleges of education is the
Diploma in Primary Education (DPE), which takes 3 years. In an attempt to improve the quality of
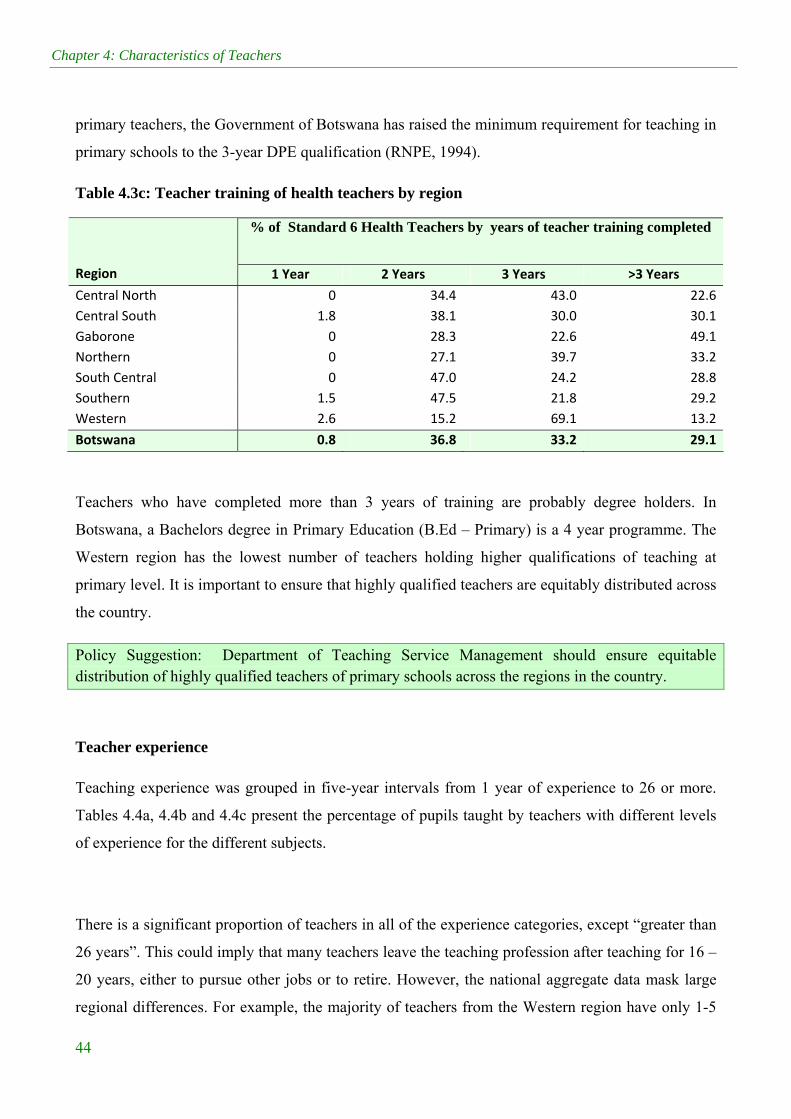
Chapter 4: Characteristics of Teachers
44
primary teachers, the Government of Botswana has raised the minimum requirement for teaching in
primary schools to the 3-year DPE qualification (RNPE, 1994).
Table 4.3c: Teacher training of health teachers by region
% of Standard 6 Health Teachers by years of teacher training completed
Region 1 Year 2 Years 3 Years >3 Years
Central North 0 34.4 43.0 22.6
Central South 1.8 38.1 30.0 30.1
Gaborone 0 28.3 22.6 49.1
Northern 0 27.1 39.7 33.2
South Central 0 47.0 24.2 28.8
Southern 1.5 47.5 21.8 29.2
Western 2.6 15.2 69.1 13.2
Botswana 0.8 36.8 33.2 29.1
Teachers who have completed more than 3 years of training are probably degree holders. In
Botswana, a Bachelors degree in Primary Education (B.Ed – Primary) is a 4 year programme. The
Western region has the lowest number of teachers holding higher qualifications of teaching at
primary level. It is important to ensure that highly qualified teachers are equitably distributed across
the country.
Policy Suggestion: Department of Teaching Service Management should ensure equitable distribution of highly qualified teachers of primary schools across the regions in the country.
Teacher experience
Teaching experience was grouped in five-year intervals from 1 year of experience to 26 or more.
Tables 4.4a, 4.4b and 4.4c present the percentage of pupils taught by teachers with different levels
of experience for the different subjects.
There is a significant proportion of teachers in all of the experience categories, except “greater than
26 years”. This could imply that many teachers leave the teaching profession after teaching for 16 –
20 years, either to pursue other jobs or to retire. However, the national aggregate data mask large
regional differences. For example, the majority of teachers from the Western region have only 1-5

The SACMEQ III Project in Botswana
45
years of experience. The same phenomenon is observed with the teachers of mathematics and
health, as shown in Tables 4.4b and 4.4c. It is worth noting that the West region has more rural
villages and settlements than the other regions. For teachers to be retained in this region, the issue
of incentives was raised in the European Development Fund (EDF) 9 Education and Training Sector
Policy Support Programme’s Joint Annual Appraisal recommendation 2.2.4 perhaps needs to be
considered.
Table 4.4a: Standard 6 Reading teacher experience by region
% of Standard 6 Reading Teachers by number of years of teaching
Region
1‐5 6‐10 11‐15 16‐20 21‐25 >26
Central North 20.2 36.3 12.7 20.5 6.4 3.8
Central South 23.4 19.5 17.3 24.0 9.5 6.2
Gaborone 9.3 7.2 25.5 38.7 14.2 5.2
Northern 18.5 16.6 24.9 28.3 10.2 1.5
South Central 9.6 13.9 18.2 38.1 12.3 7.9
Southern 25.0 21.5 16.0 11.3 23.5 2.7
Western 52.6 14.9 12.6 19.8 0.0 0.0
Botswana 21.1 19.5 17.6 25.9 11.4 4.6
Table 4.4b: Standard 6 Maths teacher experience by region
% of Standard 6 Mathematics Teachers by their number of years of teaching
Region
1‐5 6‐10 11‐15 16‐20 21‐25 >26
Central North 20.2 36.3 12.7 20.5 6.4 3.8
Central South 23.4 19.5 17.3 24.0 9.5 6.2
Gaborone 9.3 7.2 25.5 38.7 14.2 5.2
Northern 18.5 16.6 24.9 28.3 10.2 1.5
South Central 9.6 13.9 18.2 38.1 12.3 7.9
Southern 25.0 21.5 16.0 11.3 23.5 2.7
Western 52.6 14.9 12.6 19.8 0.0 0.0
Botswana 21.1 19.5 17.6 25.9 11.4 4.6
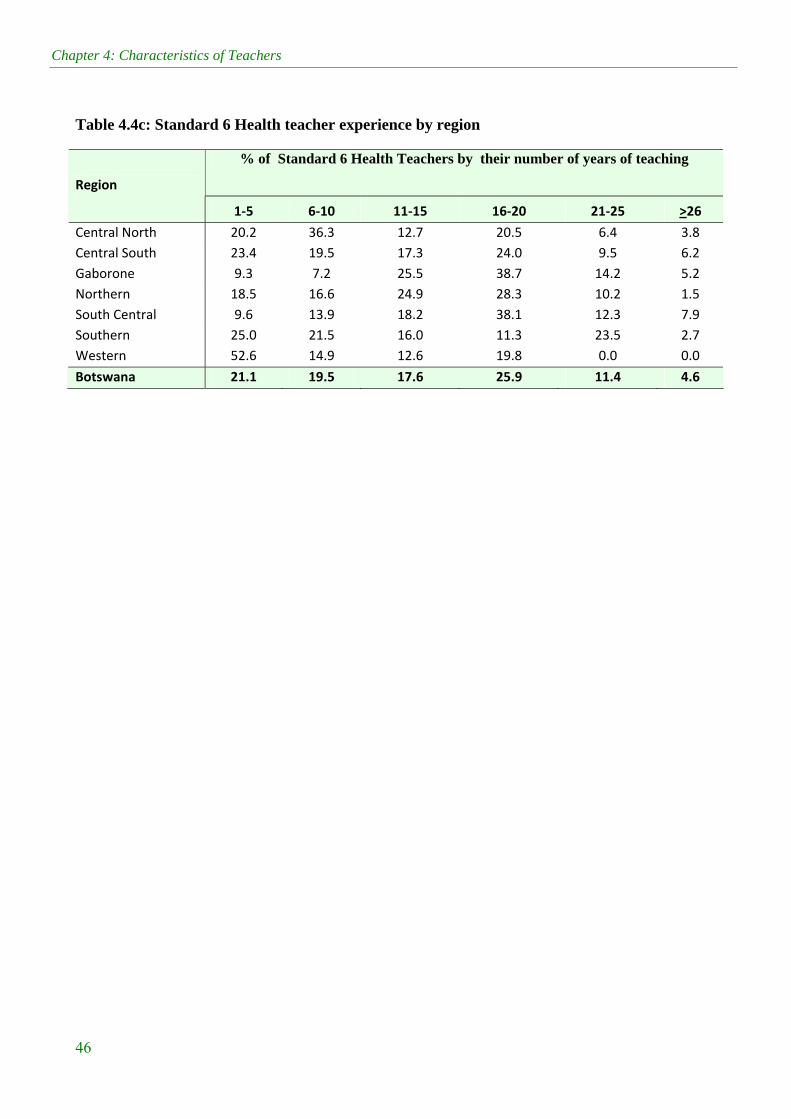
Chapter 4: Characteristics of Teachers
46
Table 4.4c: Standard 6 Health teacher experience by region
% of Standard 6 Health Teachers by their number of years of teaching
Region
1‐5 6‐10 11‐15 16‐20 21‐25 >26
Central North 20.2 36.3 12.7 20.5 6.4 3.8
Central South 23.4 19.5 17.3 24.0 9.5 6.2
Gaborone 9.3 7.2 25.5 38.7 14.2 5.2
Northern 18.5 16.6 24.9 28.3 10.2 1.5
South Central 9.6 13.9 18.2 38.1 12.3 7.9
Southern 25.0 21.5 16.0 11.3 23.5 2.7
Western 52.6 14.9 12.6 19.8 0.0 0.0
Botswana 21.1 19.5 17.6 25.9 11.4 4.6
Chapter 5 Characteristics of School Heads and their Views on Education Infrastructure, Organisation, Operation of
Schools and Problems
5.1 Introduction This chapter serves to provide personal information about school heads who participated in the
SACMEQ III project, as well as their views on school organisation, operation, infrastructure, and
problems experienced with both pupils and teachers. Information will be provided on age and
gender of school heads, their academic and professional qualifications, years of experience as
school heads and as teachers, views on conditions of school infrastructure, daily activities such as
teaching, school and community relations, pupil performance, availability of school policies and
procedures for addressing problems of pupils and teachers. All of these aspects are thought to be
important in respect to school management.
The analysis on the gender distribution of school heads is meant to provide information on how
males and females progress to senior positions in the teaching field. Gender equality in teacher
management and gender equity in teacher progression are both important considerations for the
Government of Botswana. The academic and professional qualifications of school heads are
believed to be key factors for the effective management of schools .School heads should also be
able to guide, mentor and coach teachers in their field of work and should be qualified as teachers
themselves. They should also be aware of the latest reforms being implemented in order to improve
on the performance of their schools. In-service and managerial courses for school heads are
important as these are expected to enhance school heads’ performance and their planning skills to
guide the day to day activities of the school. Furthermore, for a school to achieve its objectives
requires a positive relationship between the school team and the community where the school is
located. The school infrastructure should also be in good condition with all essential resources in
place. It should be noted that the information provided is as of September 2007 and is therefore no
longer current, i.e. some school heads may have retired or left the teaching profession and the newly
promoted may be of a different gender, age, or academic/professional qualification. Since the
Chapter 5: Characteristics of School Heads
48
SACMEQ III project in 2007, the Government of Botswana has increased its provision of school
resources and thus the situation on the ground may be slightly different to that reported in the
SACMEQ data. Also, because the number of school heads sampled is relatively small, sampling
errors may be quite large, particularly when smaller areas (e.g. regions) are considered, thus the
precision of estimates may not always be great.
Therefore to provide information on all of the above, the analysis will focus on four major
questions:
1. What were the personal characteristics of school heads (for example, age, and
gender)?
2. What were their professional characteristics (in terms of academic and professional
preparation, experience and specialised training)?
3. What were their views on general school infrastructure (for example, electrical and
other equipment, water, and basic sanitation) and the condition of school buildings?
4. What were their views on (a) daily activities (for example, teaching, school-
community relations, and monitoring pupil progress), (b) organisational policies (for
example school magazine, open days, and formal debates), (c) inspections, (d)
community input, and (e) problems with pupils and staff (for example, pupil
lateness, teacher absenteeism, and lost days of schools)?
5.2 Personal characteristics of school heads This section of the chapter provides information on the age and gender of school heads for all the
schools in the SACMEQ III project. It is important to know the age distribution of school heads as
this provides an indication of the predominant age groups (young or old) that fill this position and
can also inform Ministry management on the number of school heads who are in the retirement
category.
Figure 5.1 shows that, in all the regions except Central South, more than half of all standard 6
pupils in the SACMEQ III project were in schools where the school heads were females. The
national average shows that 64.3 percent of pupils were in schools where the heads were female.
This is a clear indication that more women than men progress to higher teaching positions, although
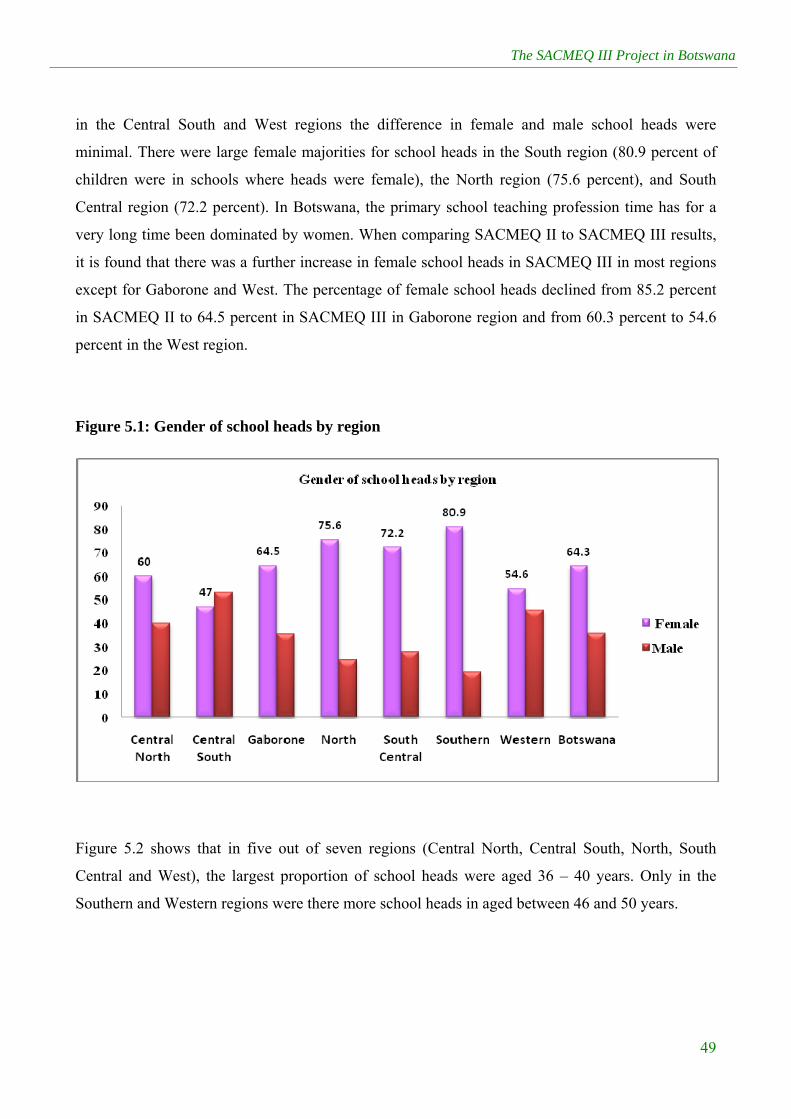
The SACMEQ III Project in Botswana
49
in the Central South and West regions the difference in female and male school heads were
minimal. There were large female majorities for school heads in the South region (80.9 percent of
children were in schools where heads were female), the North region (75.6 percent), and South
Central region (72.2 percent). In Botswana, the primary school teaching profession time has for a
very long time been dominated by women. When comparing SACMEQ II to SACMEQ III results,
it is found that there was a further increase in female school heads in SACMEQ III in most regions
except for Gaborone and West. The percentage of female school heads declined from 85.2 percent
in SACMEQ II to 64.5 percent in SACMEQ III in Gaborone region and from 60.3 percent to 54.6
percent in the West region.
Figure 5.1: Gender of school heads by region
Figure 5.2 shows that in five out of seven regions (Central North, Central South, North, South
Central and West), the largest proportion of school heads were aged 36 – 40 years. Only in the
Southern and Western regions were there more school heads in aged between 46 and 50 years.
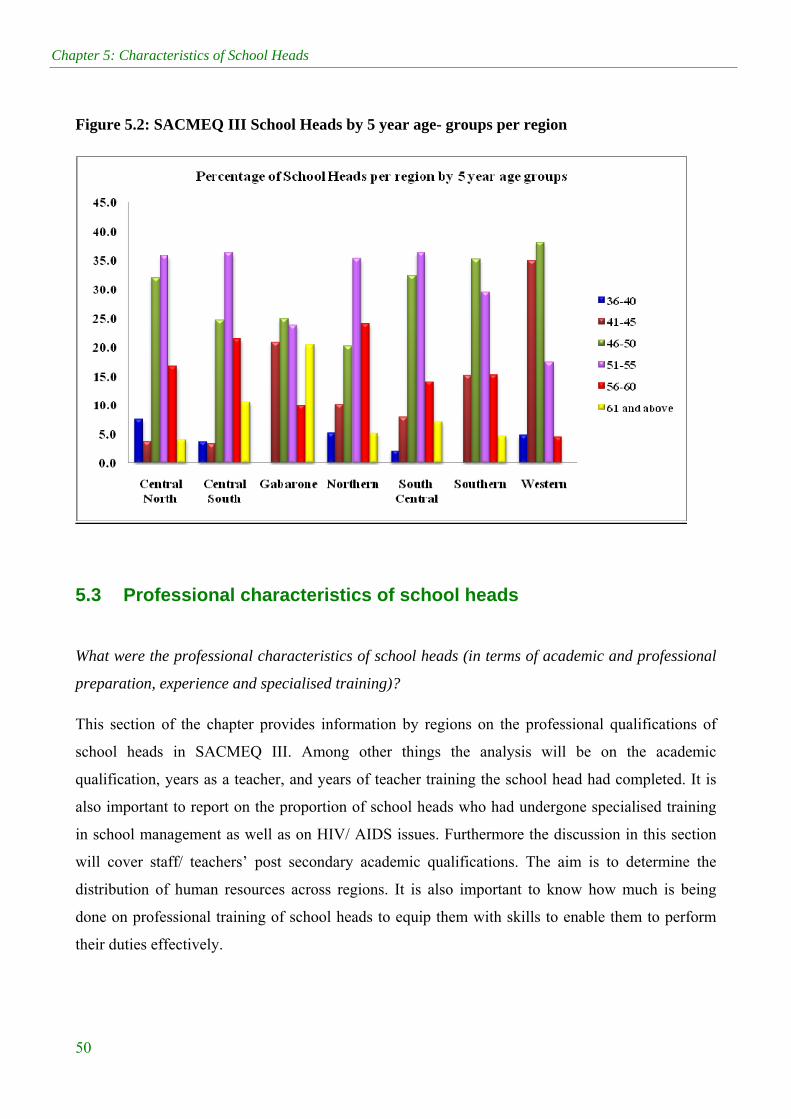
Chapter 5: Characteristics of School Heads
50
Figure 5.2: SACMEQ III School Heads by 5 year age- groups per region
5.3 Professional characteristics of school heads
What were the professional characteristics of school heads (in terms of academic and professional
preparation, experience and specialised training)?
This section of the chapter provides information by regions on the professional qualifications of
school heads in SACMEQ III. Among other things the analysis will be on the academic
qualification, years as a teacher, and years of teacher training the school head had completed. It is
also important to report on the proportion of school heads who had undergone specialised training
in school management as well as on HIV/ AIDS issues. Furthermore the discussion in this section
will cover staff/ teachers’ post secondary academic qualifications. The aim is to determine the
distribution of human resources across regions. It is also important to know how much is being
done on professional training of school heads to equip them with skills to enable them to perform
their duties effectively.
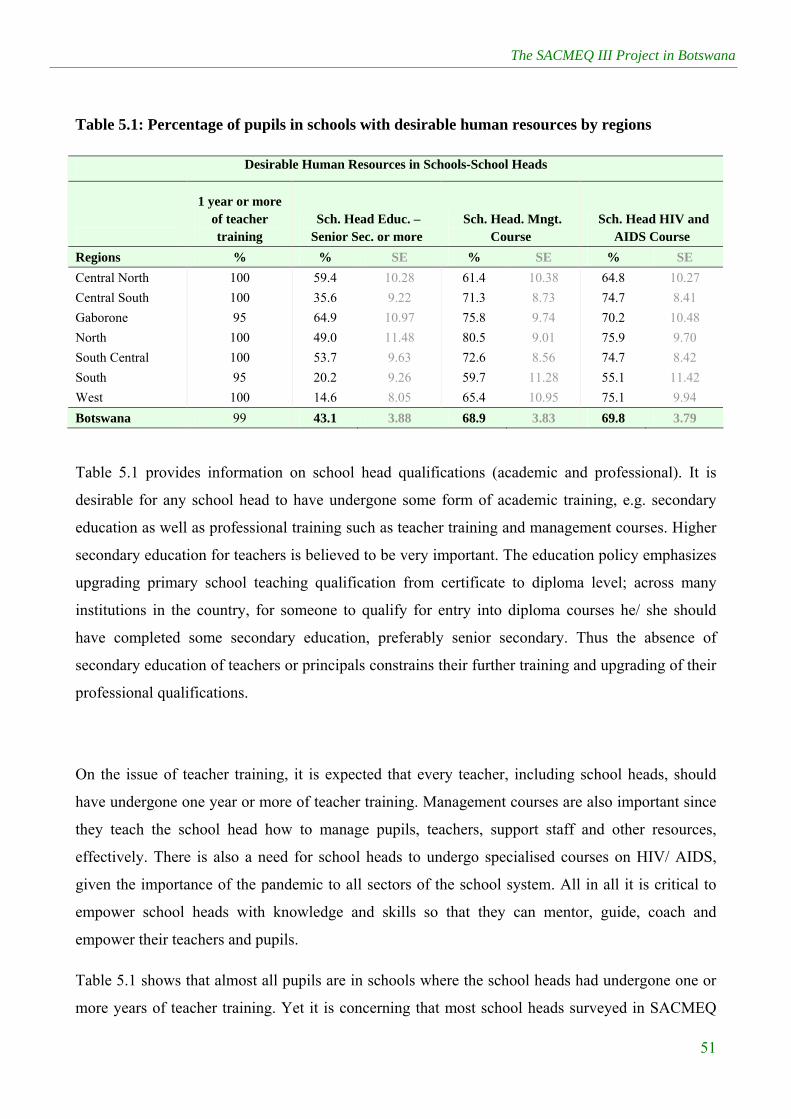
The SACMEQ III Project in Botswana
51
Table 5.1: Percentage of pupils in schools with desirable human resources by regions
Desirable Human Resources in Schools-School Heads
1 year or more of teacher training
Sch. Head Educ. – Senior Sec. or more
Sch. Head. Mngt. Course
Sch. Head HIV and AIDS Course
Regions % % SE % SE % SE
Central North 100 59.4 10.28 61.4 10.38 64.8 10.27
Central South 100 35.6 9.22 71.3 8.73 74.7 8.41
Gaborone 95 64.9 10.97 75.8 9.74 70.2 10.48
North 100 49.0 11.48 80.5 9.01 75.9 9.70
South Central 100 53.7 9.63 72.6 8.56 74.7 8.42
South 95 20.2 9.26 59.7 11.28 55.1 11.42
West 100 14.6 8.05 65.4 10.95 75.1 9.94
Botswana 99 43.1 3.88 68.9 3.83 69.8 3.79
Table 5.1 provides information on school head qualifications (academic and professional). It is
desirable for any school head to have undergone some form of academic training, e.g. secondary
education as well as professional training such as teacher training and management courses. Higher
secondary education for teachers is believed to be very important. The education policy emphasizes
upgrading primary school teaching qualification from certificate to diploma level; across many
institutions in the country, for someone to qualify for entry into diploma courses he/ she should
have completed some secondary education, preferably senior secondary. Thus the absence of
secondary education of teachers or principals constrains their further training and upgrading of their
professional qualifications.
On the issue of teacher training, it is expected that every teacher, including school heads, should
have undergone one year or more of teacher training. Management courses are also important since
they teach the school head how to manage pupils, teachers, support staff and other resources,
effectively. There is also a need for school heads to undergo specialised courses on HIV/ AIDS,
given the importance of the pandemic to all sectors of the school system. All in all it is critical to
empower school heads with knowledge and skills so that they can mentor, guide, coach and
empower their teachers and pupils.
Table 5.1 shows that almost all pupils are in schools where the school heads had undergone one or
more years of teacher training. Yet it is concerning that most school heads surveyed in SACMEQ
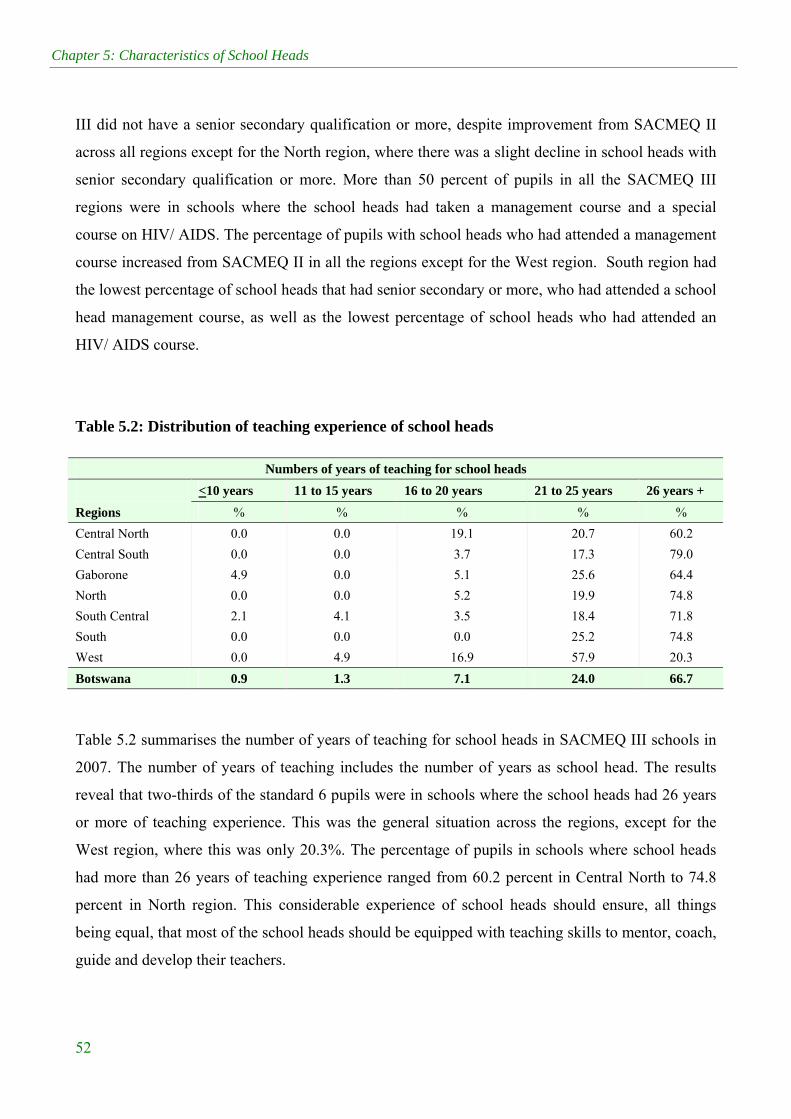
Chapter 5: Characteristics of School Heads
52
III did not have a senior secondary qualification or more, despite improvement from SACMEQ II
across all regions except for the North region, where there was a slight decline in school heads with
senior secondary qualification or more. More than 50 percent of pupils in all the SACMEQ III
regions were in schools where the school heads had taken a management course and a special
course on HIV/ AIDS. The percentage of pupils with school heads who had attended a management
course increased from SACMEQ II in all the regions except for the West region. South region had
the lowest percentage of school heads that had senior secondary or more, who had attended a school
head management course, as well as the lowest percentage of school heads who had attended an
HIV/ AIDS course.
Table 5.2: Distribution of teaching experience of school heads
Numbers of years of teaching for school heads
<10 years 11 to 15 years 16 to 20 years 21 to 25 years 26 years +
Regions % % % % %
Central North 0.0 0.0 19.1 20.7 60.2
Central South 0.0 0.0 3.7 17.3 79.0
Gaborone 4.9 0.0 5.1 25.6 64.4
North 0.0 0.0 5.2 19.9 74.8
South Central 2.1 4.1 3.5 18.4 71.8
South 0.0 0.0 0.0 25.2 74.8
West 0.0 4.9 16.9 57.9 20.3
Botswana 0.9 1.3 7.1 24.0 66.7
Table 5.2 summarises the number of years of teaching for school heads in SACMEQ III schools in
2007. The number of years of teaching includes the number of years as school head. The results
reveal that two-thirds of the standard 6 pupils were in schools where the school heads had 26 years
or more of teaching experience. This was the general situation across the regions, except for the
West region, where this was only 20.3%. The percentage of pupils in schools where school heads
had more than 26 years of teaching experience ranged from 60.2 percent in Central North to 74.8
percent in North region. This considerable experience of school heads should ensure, all things
being equal, that most of the school heads should be equipped with teaching skills to mentor, coach,
guide and develop their teachers.

The SACMEQ III Project in Botswana
53
Table 5.3: Percentage of pupils in schools with desirable physical resources by regions
Desirable Physical Resources
Regions
Satisfactory Building
Conditions School Head
Office Staff Room Electricity School Fence
% SE % SE % SE % SE % SE
Central North 71.5 9.41 83.6 7.71 75.9 8.85 72.5 9.20 92.5 5.26
Central South 67.5 9.05 78.5 7.92 70.9 8.79 89.3 5.95 89.6 5.79
Gaborone 75.7 9.76 89.8 7.02 85.4 8.05 100.0 0.00 84.8 8.27
North 70.6 10.41 85.4 8.04 65.5 10.89 95.1 4.94 90.5 6.59
South Central 50.8 9.66 75.3 8.28 69.5 8.80 96.5 3.51 82.2 7.36
South 76.0 9.68 75.2 9.90 80.3 9.09 74.8 10.00 95.3 4.69
West 67.0 11.14 66.6 10.76 85.4 8.02 81.6 8.65 85.2 8.12
Botswana 67.0 3.83 78.8 3.35 75.2 3.54 86.7 2.70 88.6 2.55
Table 5.3 shows that more than 60 percent of pupils in Botswana were in schools with desirable
physical resources such as good building conditions, availability of an office for the school head, a
staff room, electricity, tap water and school fence. The same situation was observed during the
SACMEQ II study. Although a good number of schools had the desirable resources, it should be
noted that there were a few schools which did not have adequate physical resources and therefore
there remains a need for the Ministries of Education and Local Government to ensure that such
schools are provided with more resources to ensure a conducive teaching and learning environment.
5.4 Conclusion It has been observed that most SACMEQ III standard 6 pupils in Botswana were in schools where
school heads were mainly females aged 46-55 years. Even in SACMEQ II most school heads were
females, with an average age 50 years. Almost all SACMEQ III school heads had one year or more
teacher training qualification, with 43.1 percent of them having completed senior secondary or
more. To enable their performance and ensure quality in their day to day running of the school, 68.9
percent of the school heads had attended management courses. One the other hand, given the
importance of HIV/ AIDS in Botswana, it is worrying that only 69.8 percent of school heads
surveyed in SACMEQ III reported that they had attended training courses on HIV/ AIDS. These
courses are normally meant to equip management with the skills needed to mitigate the impact of
Chapter 5: Characteristics of School Heads
54
the pandemic in schools. Most school heads (66 percent) were long service teachers with 26 years
of teaching experience including those years as school head, which is similar to what was found in
SACMEQ II.
Chapter 6 Provision of School Resources
6.1 Introduction The Ministry of Education and Skills Development is committed to increasing access to primary
education as well as the general quality of education in the country. To ensure this the Ministry
strives for equitable distribution of education resources across the regions in the country. These
resources include qualified teachers (including school heads), classrooms, classroom resources, well
equipped school libraries, maintained school infrastructures such as pupils’ toilets, teachers
accommodation, sporting grounds, availability of water and electricity in schools, etc.. To achieve
this, the Ministry has clearly stipulated the standard requirements for resources in primary schools
in Recommendations 14 and 15 of the Revised National Policy on Education 1994.
Recommendation 14 of the Revised National Policy on Education (1994) clearly stipulated that a
standard primary school should have (as a minimum) the following resources:
- An adequate number of classrooms up to a maximum of 22.
- An administration block with office space for the school head, deputy school head, typist, staff room and two storerooms for storage of books and pupils food.
- A library equipped with library books.
- A resource centre.
- A fully equipped science room.
- A sports field for various sporting activities.
- Teachers’ housing with a minimum of 2 bedrooms (each teacher should be provided with accommodation).
- Adequate toilet facilities, including provision for the disabled.
- Typewriters/ computers, photocopiers.
Further in Recommendation 15 the policy states that to increase access and equity in primary
schools, the Ministry should build more special schools for the disabled and improve the care,
supervision and support for these children in primary school hostels in order to reduce school drop-
outs in such schools. Furthermore, through the social welfare services the government has come up
with the initiatives of providing the orphans, needy and vulnerable children with basic needs such as
clothes, school uniforms, payment of any school fees that may be requested from parents, e.g. sports
and development fees, food at and after school, etc. All this is meant to boost children’s dignity and
ensure that they have access to education.

Chapter 6: Provision of School Resources
56
6.2 Provision of school resources by region The variables listed in Table 6.1 are key human resources that are believed to impact significantly
on pupil performance. It is desirable that teachers should be trained in the subjects they teach, have
sufficient knowledge of these subjects, should also have regular class attendance, and the class size
should also be no more than 40 pupils per class. The results in Table 6.1 above show that 64 percent
of standard 6 pupils were being taught reading by teachers who had reached a desired level of
subject knowledge, while only 41.2 percent were taught mathematics by teachers with the desired
subject knowledge. The highest percentage of pupils with teachers with desired knowledge in
reading was in West region (86%) followed by Gaborone (74.6). South Central region was the
lowest in terms of percentage (55.9%) of pupils being taught by teachers with desired knowledge in
reading.
In all the regions except for Central North, more than 50 percent of pupils were being taught by
teachers who had not reached an adequete level of mathematics knowledge. The percentages of
pupils taught by teachers with desired knowledge in mathematics ranged from South Central region
with 29.6 percent to North region with 46.5 percent and Central North region with 63.0 percent.
Table 6.1: Percentage of pupils per region in schools with desirable human resources
Desirable Human Resources in Schools
Reached desired teacher subject
knowledge in reading
Reached desired teacher subject knowledge in mathematics
Acceptable class size (≤ 40)
Teacher class attendance
Regions % SE % SE % SE % SE
Central North 61.5 9.37 63.0 9.10 100.0 0.00 88.1 6.63
Central South 56.2 7.97 32.5 7.00 100.0 0.00 93.0 4.89
Gaborone 74.6 7.23 35.3 8.70 100.0 0.00 100.0 0.00
North 63.4 7.78 46.5 8.39 100.0 0.00 90.1 6.84
South Central 55.9 6.27 29.6 6.27 100.0 0.00 86.1 6.59
South 68.6 8.25 45.7 10.01 100.0 0.00 90.0 6.86
West 86.3 3.84 42.8 8.06 100.0 0.00 90.1 6.84
Botswana 64.0 3.05 41.2 3.18 100.0 0.00 90.5 2.41
The table shows that all standard 6 pupils in Botswana were in classes that did not exceed 40 pupils.
A relatively low pupil-teacher ratio ensures that pupils have sufficient access to their teachers,

The SACMEQ III Project in Botswana
57
which is vital for pupil learning. However, it should be noted that there are many other factors that
affect pupil learning, including adequate teaching resources, teacher qualification and teacher skills.
Importantly, Botswana has managed to decrease average class sizes across the country. Further
evidence is provided by the 2007 National Education Statistics report, which revealed that the
country’s average pupil teacher ratio was at 25 pupils per teacher.
Given the still inadequate subject knowledge of many teachers, it appears as if there is need for
strategic in-service training for reading and mathematics teachers. This will help teachers to acquire
required knowledge of these subjects and in the end impact positively on pupil learning.
Policy Suggestion:
1. Department of Teacher Training and Development in collaboration with Department of Pre and Primary Education should intensify in-service training on mathematics and reading for primary school teachers.
2. The other option is to implement subject specialisation at primary school level. This will allow teachers to teach as per their lines of subject competency.

Chapter 6: Provision of School Resources
58
Chapter 7 Reading and Mathematics Achievement and HIV and AIDS Knowledge Levels of Pupils and their Teachers
7.1 Introduction This chapter presents the scores of pupils and their teachers in Mathematics and Reading tests. The
test scores of the present study are compared with those of SACMEQ II to determine if there has
been an improvement in standard 6 pupil achievement between 2000 and 2007 (SACMEQ III). As
is indicated in the SACMEQ II (2005) report, SACMEQ studies focus on literacy and numeracy
because these are the most important goals of primary education. The study further assessed pupils
and their teachers’ knowledge on HIV and AIDS. Knowledge about HIV and AIDS and the ability
to manage the pandemic are viewed as some of the most important factors for the country’s socio-
economic development (Botswana National Policy on HIV and AIDS, 1998). It is crucial that as
pupils progress through the foundation of basic education they learn about HIV and AIDS. The
current analysis shows both achievements and problems regarding the knowledge and skills that
pupils had acquired towards the end of their primary education. This report also highlights the level
of discrimination and stigmatization among students with respect to persons infected with HIV. The
extent at which primary school teachers and school heads are risk prone to HIV infections was also
assessed in the present analysis.
Analysis of the data indicates overall improvements in pupil achievements in both mathematics and
reading between 2000 and 2007. Counter to this trend, South and South Central regions recorded
declines. Another observation is that pupils in the cities performed much better than those in rural
areas. The impact of socio-economic status on student performance has been highlighted in
previous reports (Botswana SACMEQ II report, 2000; TIMSS report, 2007), and this report also
focuses on this impact. A trend in pupils’ performance by gender is still an area of interest in this
analysis, just as it was in SACMEQ II (2000).
7.2 Pupil reading scores Table 7.1a below shows pupils’ mean scores for reading for SACMEQ II (2000) and SACMEQ III
(2007). Comparison of the scores indicates whether there has been improvement in standard 6
pupils’ reading skills between 2000 and 2007.
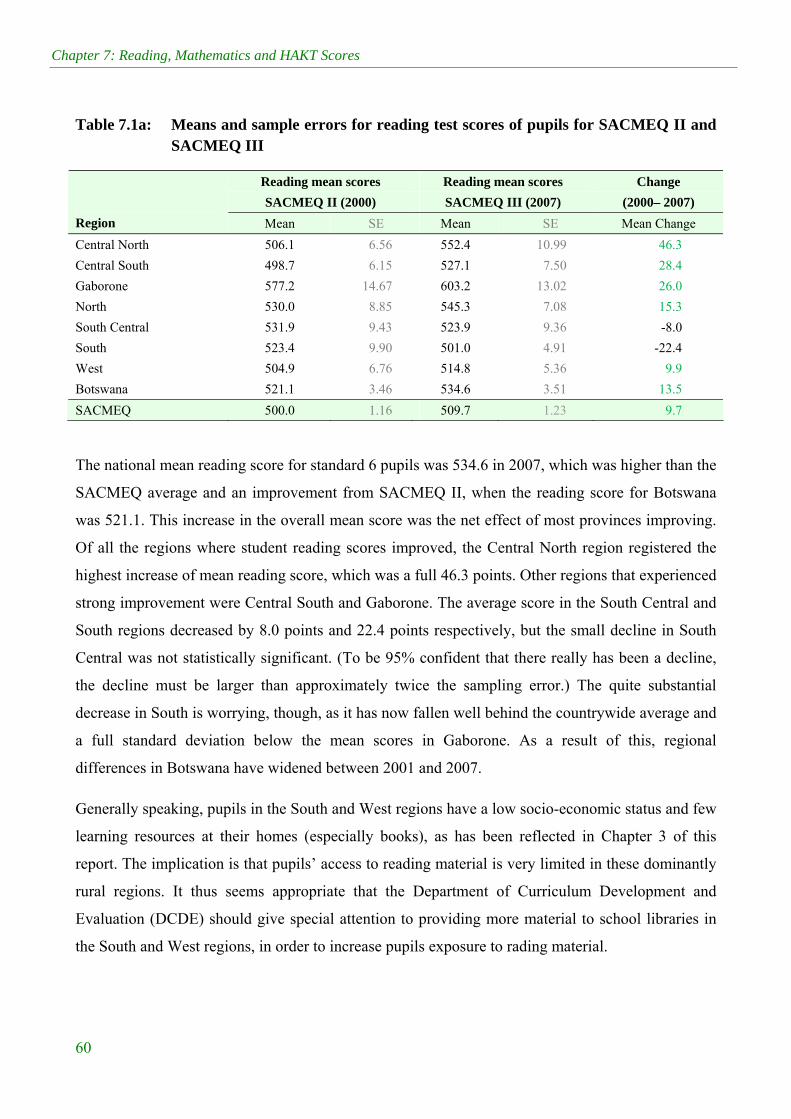
Chapter 7: Reading, Mathematics and HAKT Scores
60
Table 7.1a: Means and sample errors for reading test scores of pupils for SACMEQ II and SACMEQ III
Reading mean scores Reading mean scores Change
SACMEQ II (2000) SACMEQ III (2007) (2000– 2007)
Region Mean SE Mean SE Mean Change
Central North 506.1 6.56 552.4 10.99 46.3
Central South 498.7 6.15 527.1 7.50 28.4
Gaborone 577.2 14.67 603.2 13.02 26.0
North 530.0 8.85 545.3 7.08 15.3
South Central 531.9 9.43 523.9 9.36 -8.0
South 523.4 9.90 501.0 4.91 -22.4
West 504.9 6.76 514.8 5.36 9.9
Botswana 521.1 3.46 534.6 3.51 13.5
SACMEQ 500.0 1.16 509.7 1.23 9.7
The national mean reading score for standard 6 pupils was 534.6 in 2007, which was higher than the
SACMEQ average and an improvement from SACMEQ II, when the reading score for Botswana
was 521.1. This increase in the overall mean score was the net effect of most provinces improving.
Of all the regions where student reading scores improved, the Central North region registered the
highest increase of mean reading score, which was a full 46.3 points. Other regions that experienced
strong improvement were Central South and Gaborone. The average score in the South Central and
South regions decreased by 8.0 points and 22.4 points respectively, but the small decline in South
Central was not statistically significant. (To be 95% confident that there really has been a decline,
the decline must be larger than approximately twice the sampling error.) The quite substantial
decrease in South is worrying, though, as it has now fallen well behind the countrywide average and
a full standard deviation below the mean scores in Gaborone. As a result of this, regional
differences in Botswana have widened between 2001 and 2007.
Generally speaking, pupils in the South and West regions have a low socio-economic status and few
learning resources at their homes (especially books), as has been reflected in Chapter 3 of this
report. The implication is that pupils’ access to reading material is very limited in these dominantly
rural regions. It thus seems appropriate that the Department of Curriculum Development and
Evaluation (DCDE) should give special attention to providing more material to school libraries in
the South and West regions, in order to increase pupils exposure to rading material.
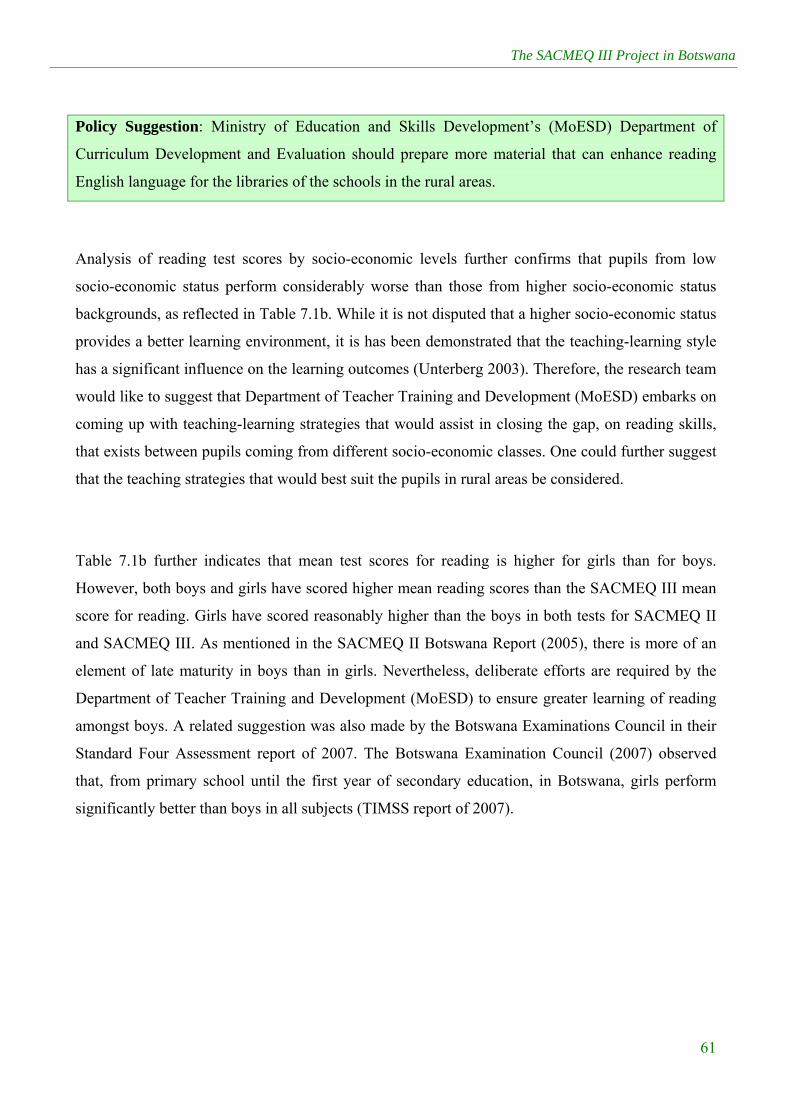
The SACMEQ III Project in Botswana
61
Policy Suggestion: Ministry of Education and Skills Development’s (MoESD) Department of
Curriculum Development and Evaluation should prepare more material that can enhance reading
English language for the libraries of the schools in the rural areas.
Analysis of reading test scores by socio-economic levels further confirms that pupils from low
socio-economic status perform considerably worse than those from higher socio-economic status
backgrounds, as reflected in Table 7.1b. While it is not disputed that a higher socio-economic status
provides a better learning environment, it is has been demonstrated that the teaching-learning style
has a significant influence on the learning outcomes (Unterberg 2003). Therefore, the research team
would like to suggest that Department of Teacher Training and Development (MoESD) embarks on
coming up with teaching-learning strategies that would assist in closing the gap, on reading skills,
that exists between pupils coming from different socio-economic classes. One could further suggest
that the teaching strategies that would best suit the pupils in rural areas be considered.
Table 7.1b further indicates that mean test scores for reading is higher for girls than for boys.
However, both boys and girls have scored higher mean reading scores than the SACMEQ III mean
score for reading. Girls have scored reasonably higher than the boys in both tests for SACMEQ II
and SACMEQ III. As mentioned in the SACMEQ II Botswana Report (2005), there is more of an
element of late maturity in boys than in girls. Nevertheless, deliberate efforts are required by the
Department of Teacher Training and Development (MoESD) to ensure greater learning of reading
amongst boys. A related suggestion was also made by the Botswana Examinations Council in their
Standard Four Assessment report of 2007. The Botswana Examination Council (2007) observed
that, from primary school until the first year of secondary education, in Botswana, girls perform
significantly better than boys in all subjects (TIMSS report of 2007).
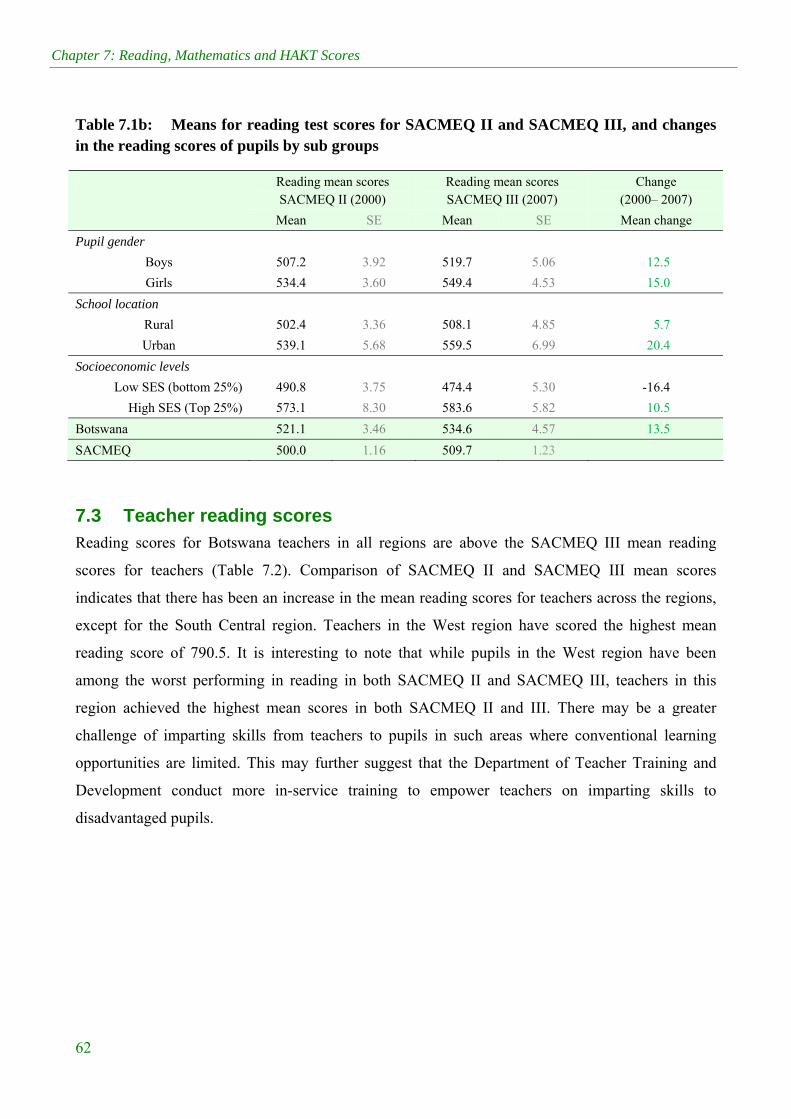
Chapter 7: Reading, Mathematics and HAKT Scores
62
Table 7.1b: Means for reading test scores for SACMEQ II and SACMEQ III, and changes in the reading scores of pupils by sub groups
Reading mean scores SACMEQ II (2000)
Reading mean scores SACMEQ III (2007)
Change (2000– 2007)
Mean SE Mean SE Mean change
Pupil gender
Boys 507.2 3.92 519.7 5.06 12.5
Girls 534.4 3.60 549.4 4.53 15.0
School location
Rural 502.4 3.36 508.1 4.85 5.7
Urban 539.1 5.68 559.5 6.99 20.4
Socioeconomic levels
Low SES (bottom 25%) 490.8 3.75 474.4 5.30 -16.4
High SES (Top 25%) 573.1 8.30 583.6 5.82 10.5
Botswana 521.1 3.46 534.6 4.57 13.5
SACMEQ 500.0 1.16 509.7 1.23
7.3 Teacher reading scores Reading scores for Botswana teachers in all regions are above the SACMEQ III mean reading
scores for teachers (Table 7.2). Comparison of SACMEQ II and SACMEQ III mean scores
indicates that there has been an increase in the mean reading scores for teachers across the regions,
except for the South Central region. Teachers in the West region have scored the highest mean
reading score of 790.5. It is interesting to note that while pupils in the West region have been
among the worst performing in reading in both SACMEQ II and SACMEQ III, teachers in this
region achieved the highest mean scores in both SACMEQ II and III. There may be a greater
challenge of imparting skills from teachers to pupils in such areas where conventional learning
opportunities are limited. This may further suggest that the Department of Teacher Training and
Development conduct more in-service training to empower teachers on imparting skills to
disadvantaged pupils.
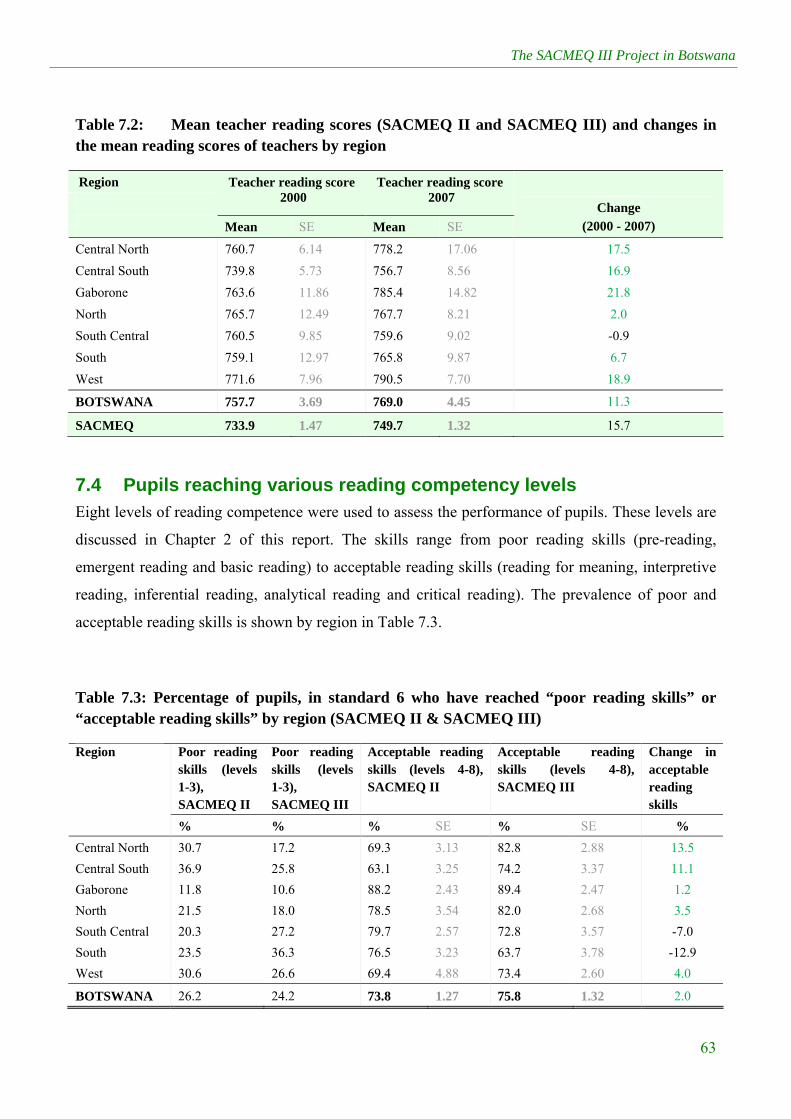
The SACMEQ III Project in Botswana
63
Table 7.2: Mean teacher reading scores (SACMEQ II and SACMEQ III) and changes in the mean reading scores of teachers by region
Region
Teacher reading score 2000
Teacher reading score 2007
Mean SE Mean SE
Change (2000 - 2007)
Central North 760.7 6.14 778.2 17.06 17.5
Central South 739.8 5.73 756.7 8.56 16.9
Gaborone 763.6 11.86 785.4 14.82 21.8
North 765.7 12.49 767.7 8.21 2.0
South Central 760.5 9.85 759.6 9.02 -0.9
South 759.1 12.97 765.8 9.87 6.7
West 771.6 7.96 790.5 7.70 18.9
BOTSWANA 757.7 3.69 769.0 4.45 11.3
SACMEQ 733.9 1.47 749.7 1.32 15.7
7.4 Pupils reaching various reading competency levels Eight levels of reading competence were used to assess the performance of pupils. These levels are
discussed in Chapter 2 of this report. The skills range from poor reading skills (pre-reading,
emergent reading and basic reading) to acceptable reading skills (reading for meaning, interpretive
reading, inferential reading, analytical reading and critical reading). The prevalence of poor and
acceptable reading skills is shown by region in Table 7.3.
Table 7.3: Percentage of pupils, in standard 6 who have reached “poor reading skills” or “acceptable reading skills” by region (SACMEQ II & SACMEQ III)
Poor reading skills (levels 1-3), SACMEQ II
Poor reading skills (levels 1-3), SACMEQ III
Acceptable reading skills (levels 4-8), SACMEQ II
Acceptable reading skills (levels 4-8), SACMEQ III
Change in acceptable reading skills
Region
% % % SE % SE %
Central North 30.7 17.2 69.3 3.13 82.8 2.88 13.5
Central South 36.9 25.8 63.1 3.25 74.2 3.37 11.1
Gaborone 11.8 10.6 88.2 2.43 89.4 2.47 1.2
North 21.5 18.0 78.5 3.54 82.0 2.68 3.5
South Central 20.3 27.2 79.7 2.57 72.8 3.57 -7.0
South 23.5 36.3 76.5 3.23 63.7 3.78 -12.9
West 30.6 26.6 69.4 4.88 73.4 2.60 4.0
BOTSWANA 26.2 24.2 73.8 1.27 75.8 1.32 2.0
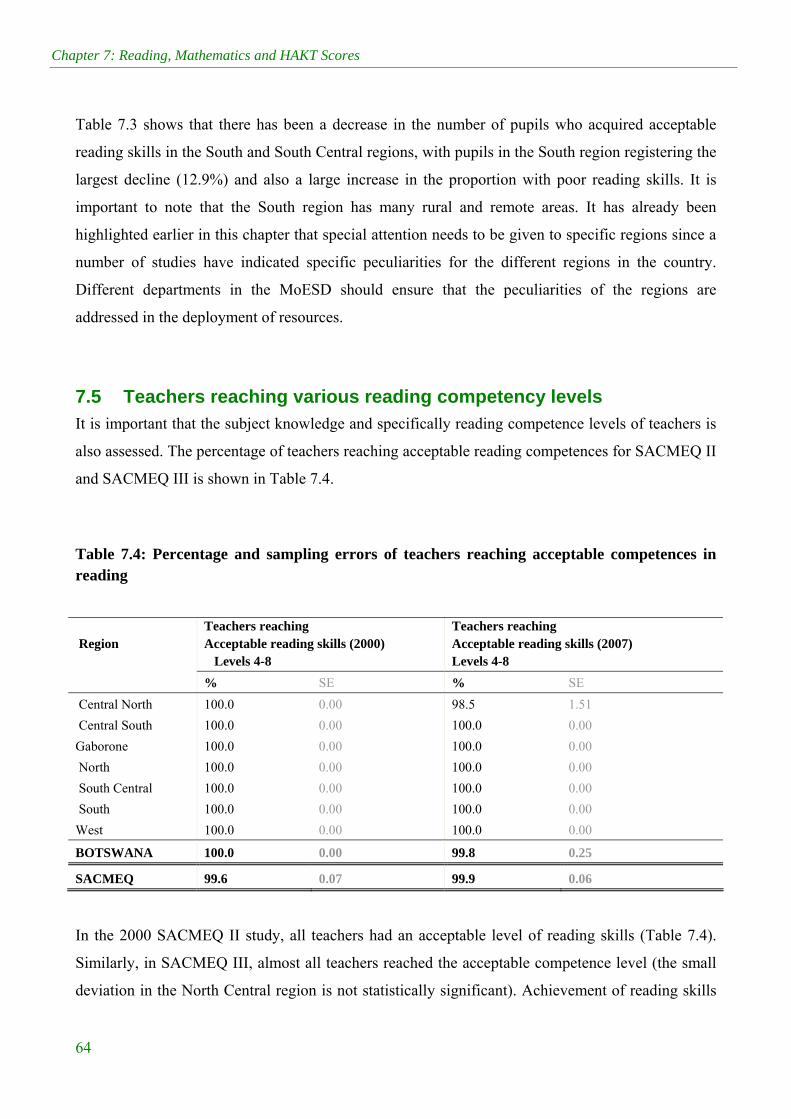
Chapter 7: Reading, Mathematics and HAKT Scores
64
Table 7.3 shows that there has been a decrease in the number of pupils who acquired acceptable
reading skills in the South and South Central regions, with pupils in the South region registering the
largest decline (12.9%) and also a large increase in the proportion with poor reading skills. It is
important to note that the South region has many rural and remote areas. It has already been
highlighted earlier in this chapter that special attention needs to be given to specific regions since a
number of studies have indicated specific peculiarities for the different regions in the country.
Different departments in the MoESD should ensure that the peculiarities of the regions are
addressed in the deployment of resources.
7.5 Teachers reaching various reading competency levels It is important that the subject knowledge and specifically reading competence levels of teachers is
also assessed. The percentage of teachers reaching acceptable reading competences for SACMEQ II
and SACMEQ III is shown in Table 7.4.
Table 7.4: Percentage and sampling errors of teachers reaching acceptable competences in reading
Region Teachers reaching Acceptable reading skills (2000) Levels 4-8
Teachers reaching Acceptable reading skills (2007) Levels 4-8
% SE % SE
Central North 100.0 0.00 98.5 1.51
Central South 100.0 0.00 100.0 0.00
Gaborone 100.0 0.00 100.0 0.00
North 100.0 0.00 100.0 0.00
South Central 100.0 0.00 100.0 0.00
South 100.0 0.00 100.0 0.00
West 100.0 0.00 100.0 0.00
BOTSWANA 100.0 0.00 99.8 0.25
SACMEQ 99.6 0.07 99.9 0.06
In the 2000 SACMEQ II study, all teachers had an acceptable level of reading skills (Table 7.4).
Similarly, in SACMEQ III, almost all teachers reached the acceptable competence level (the small
deviation in the North Central region is not statistically significant). Achievement of reading skills
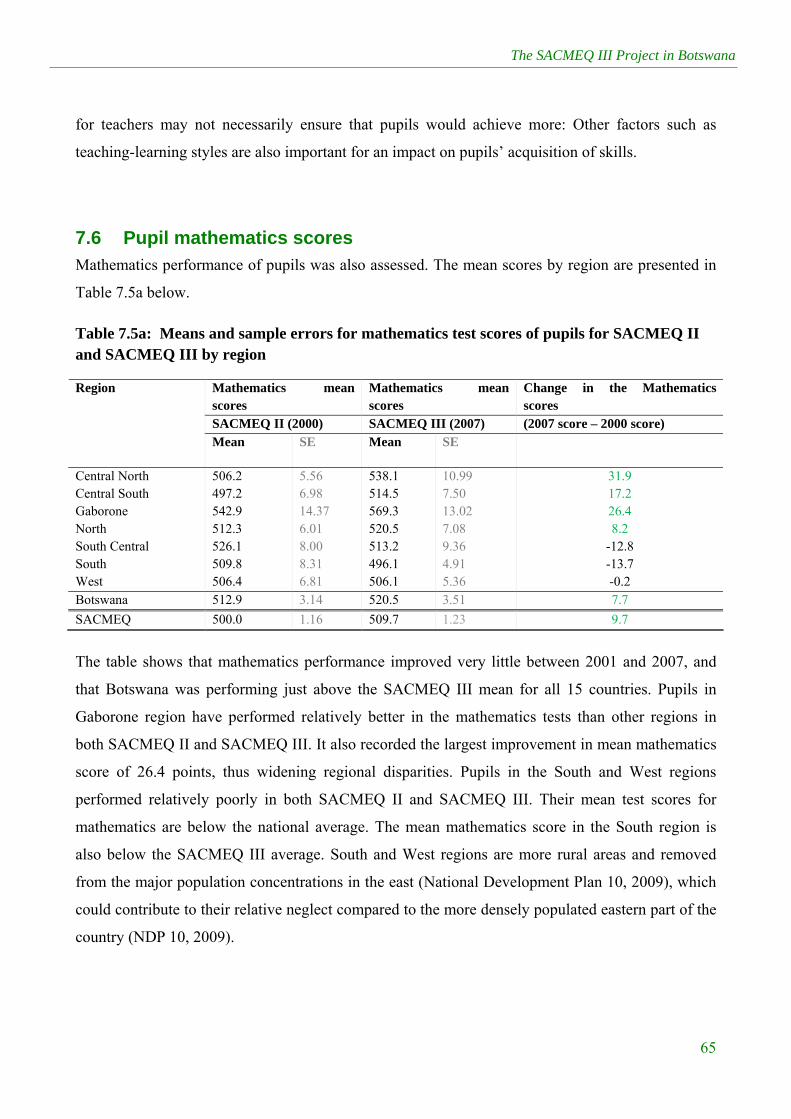
The SACMEQ III Project in Botswana
65
for teachers may not necessarily ensure that pupils would achieve more: Other factors such as
teaching-learning styles are also important for an impact on pupils’ acquisition of skills.
7.6 Pupil mathematics scores Mathematics performance of pupils was also assessed. The mean scores by region are presented in
Table 7.5a below.
Table 7.5a: Means and sample errors for mathematics test scores of pupils for SACMEQ II and SACMEQ III by region
Mathematics mean scores
Mathematics mean scores
Change in the Mathematics scores
SACMEQ II (2000) SACMEQ III (2007) (2007 score – 2000 score)
Region
Mean SE Mean SE
Central North Central South Gaborone North South Central South West
506.2 497.2 542.9 512.3 526.1 509.8 506.4
5.56 6.98 14.37 6.01 8.00 8.31 6.81
538.1 514.5 569.3 520.5 513.2 496.1 506.1
10.99 7.50 13.02 7.08 9.36 4.91 5.36
31.9 17.2 26.4 8.2
-12.8 -13.7 -0.2
Botswana 512.9 3.14 520.5 3.51 7.7
SACMEQ 500.0 1.16 509.7 1.23 9.7
The table shows that mathematics performance improved very little between 2001 and 2007, and
that Botswana was performing just above the SACMEQ III mean for all 15 countries. Pupils in
Gaborone region have performed relatively better in the mathematics tests than other regions in
both SACMEQ II and SACMEQ III. It also recorded the largest improvement in mean mathematics
score of 26.4 points, thus widening regional disparities. Pupils in the South and West regions
performed relatively poorly in both SACMEQ II and SACMEQ III. Their mean test scores for
mathematics are below the national average. The mean mathematics score in the South region is
also below the SACMEQ III average. South and West regions are more rural areas and removed
from the major population concentrations in the east (National Development Plan 10, 2009), which
could contribute to their relative neglect compared to the more densely populated eastern part of the
country (NDP 10, 2009).
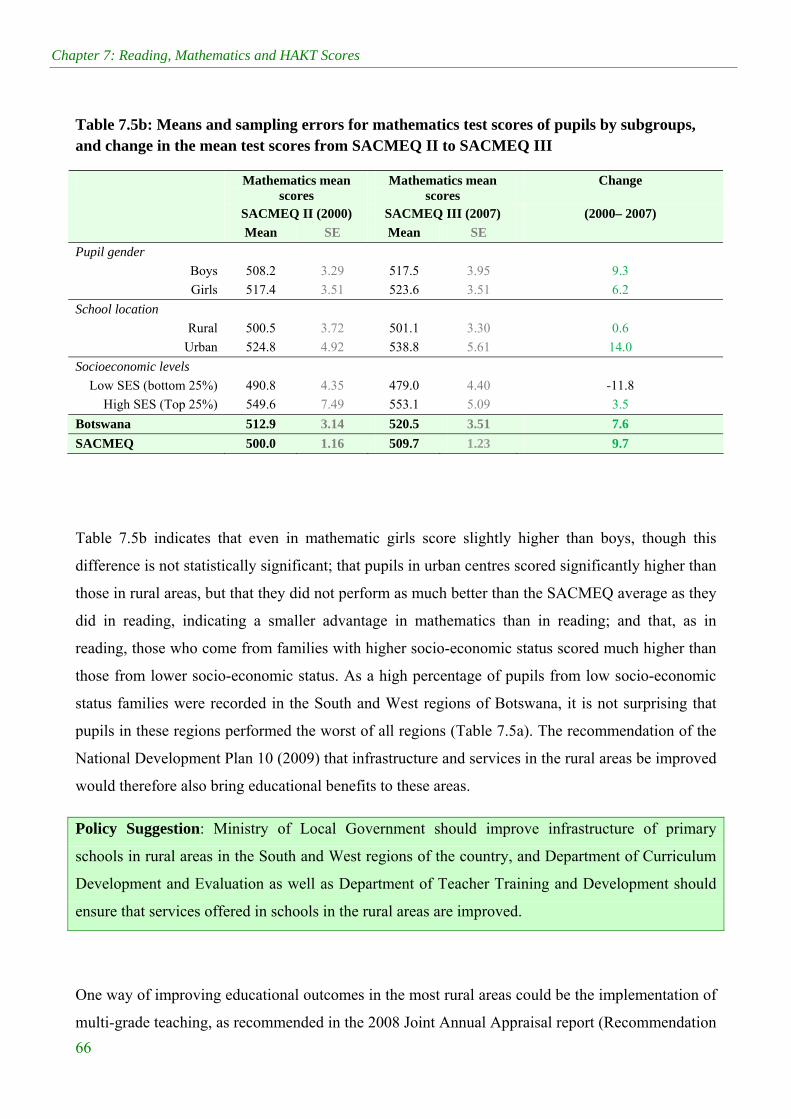
Chapter 7: Reading, Mathematics and HAKT Scores
66
Table 7.5b: Means and sampling errors for mathematics test scores of pupils by subgroups, and change in the mean test scores from SACMEQ II to SACMEQ III
Mathematics mean scores
Mathematics mean scores
Change
SACMEQ II (2000) SACMEQ III (2007) (2000– 2007)
Mean SE Mean SE
Pupil gender
Boys 508.2 3.29 517.5 3.95 9.3
Girls 517.4 3.51 523.6 3.51 6.2
School location
Rural 500.5 3.72 501.1 3.30 0.6
Urban 524.8 4.92 538.8 5.61 14.0
Socioeconomic levels
Low SES (bottom 25%) 490.8 4.35 479.0 4.40 -11.8
High SES (Top 25%) 549.6 7.49 553.1 5.09 3.5
Botswana 512.9 3.14 520.5 3.51 7.6
SACMEQ 500.0 1.16 509.7 1.23 9.7
Table 7.5b indicates that even in mathematic girls score slightly higher than boys, though this
difference is not statistically significant; that pupils in urban centres scored significantly higher than
those in rural areas, but that they did not perform as much better than the SACMEQ average as they
did in reading, indicating a smaller advantage in mathematics than in reading; and that, as in
reading, those who come from families with higher socio-economic status scored much higher than
those from lower socio-economic status. As a high percentage of pupils from low socio-economic
status families were recorded in the South and West regions of Botswana, it is not surprising that
pupils in these regions performed the worst of all regions (Table 7.5a). The recommendation of the
National Development Plan 10 (2009) that infrastructure and services in the rural areas be improved
would therefore also bring educational benefits to these areas.
Policy Suggestion: Ministry of Local Government should improve infrastructure of primary
schools in rural areas in the South and West regions of the country, and Department of Curriculum
Development and Evaluation as well as Department of Teacher Training and Development should
ensure that services offered in schools in the rural areas are improved.
One way of improving educational outcomes in the most rural areas could be the implementation of
multi-grade teaching, as recommended in the 2008 Joint Annual Appraisal report (Recommendation
The SACMEQ III Project in Botswana
67
2.2.6). This would allow smaller schools closer to pupils’ homes in isolated rural regions. If pupils
attend schools located in their settlement rather than having to travel long distances to schools or
staying in hostels, parental involvement in pupils’ school work would be higher and pupils would
be able to attend school activities more often. This could assist in improving performance.
Other resources that the Ministry of Education and Skills Development can utilize in the South and
West regions, where there are more rural areas and low socio-economic status, are teacher assistants
(Draft on Inclusive Education Policy for Botswana, 2010). This development is crucial, considering
that English is a third language for a reasonable number of pupils in these regions and some may
still struggle to understand it even when they reach standard 6. Pupils’ mother tongues in these
regions include Sesarwa, Sekgalagadi and Seherero, to mention but a few. A teacher aide could
help explain concepts in the pupils’ first language, since the medium of instruction in Botswana
schools is English (Draft on Inclusive Education Policy for Botswana, 2010).
7.7 Pupils reaching various mathematics competency levels Pupils were also assessed on their competence in mathematics. Similar to the reading competency
levels, mathematics competency levels ranged from pre-numeracy (level 1) to abstract problem
solving (level 8). Pre-numeracy pupils (level 1) are able to apply single step addition or subtraction
operations, recognize simple shapes, match numbers and pictures, and count in whole numbers.
Pupils at the abstract problem solving level (level 8) are able to identify the nature of an unstated
mathematical problem imbedded within verbal or graphic information and then translate the
problem into symbolic, algebraic, or equation form in order to solve the problem.
Details of the competency levels are outlined in Chapter 2 of this report. The distribution of student
competence according to poor and acceptable competency levels by region is shown in Table 7.6
below.

Chapter 7: Reading, Mathematics and HAKT Scores
68
Table 7.6: Percentage of pupils reaching poor and acceptable mathematics competence levels by region
Region Poor Acceptable
SACMEQ II SACMEQ III SACMEQ II SACMEQ III
Change in acceptable
competence level
% % % % %
Central North 68.0 45.7 32.0 54.3 22.3
Central South 71.5 58.5 28.5 41.5 13.0
Gaborone 51.6 34.9 48.4 65.1 16.7
North 64.4 54.2 35.6 45.8 10.2
South Central 58.0 62.4 42.0 37.6 -4.4
South 68.6 69.1 31.4 30.9 -0.5
West 68.0 62.5 32.0 37.5 5.5
BOTSWANA 64.9 56.5 35.1 43.5 8.4
SACMEQ 70.2 63.1 29.8 36.9 7.1
A high percentage (65.1%) of standard 6 pupils in Gaborone region had achieved acceptable
mathematics competence levels in the SACMEQ III test. This is remarkable, considering that only
48.4% had achieved acceptable competence levels in SACMEQ II (2000). The results indicate that
pupils living in the cities are doing better than those in other parts of the country. There are a
number of urban centers like Tutume, Tonota, Selebi Phikwe and Bobonong located in the Central
North region. This could have influenced the results observed in the region, where 54.3% of the
pupils achieved acceptable mathematics competence levels. While there has been improvement in
the percentage of pupils reaching acceptable competency levels in other regions, there has been a
decline in the percentage of the pupils in the South Central and South regions achieving acceptable
levels of mathematics competence.
7.8 Teacher mathematics scores Mathematics mean test scores for teachers are as presented in Table 7.7 below

The SACMEQ III Project in Botswana
69
Table 7.7: Mean scores and sampling errors for mathematics for teachers by regions for SACMEQ II and SACMEQ III, and the change in mathematics scores between the two SACMEQ tests
Teacher mathematics score
SACMEQ II Teacher mathematics score
SACMEQ III Change
Region Mean SE Mean SE (2000 - 2007)
Central North 761.1 8.45 817.3 12.06 56.1
Central South 740.9 10.70 771.0 11.48 30.0
Gaborone 752.2 13.91 777.0 14.88 24.9
North 750.6 9.37 794.3 12.84 43.6
South Central 757.2 15.54 750.3 10.38 -6.9
South 758.1 14.87 783.6 17.56 25.5
West 756.0 11.89 786.4 17.96 30.4
BOTSWANA 753.3 5.11 780.0 5.21 26.7
SACMEQ 791.6 2.23 789.0 1.89 -2.7
According to the results presented in Table 7.7 above, the mean test scores for teachers in Botswana
were below the SACMEQ mean for teachers. For SACMEQ II, all the mean test scores for the
regions were below the SACMEQ mean. However, teachers in the North and the Central North
regions managed to score mean test scores that were above the SACMEQ III mean test score. Since
the Central North region far outperformed the other regions, it could serve as a benchmark for
teachers from other regions wishing to enhance their mathematics skills.
Policy Suggestion: Regional Education Officers of Department of Pre and Primary Education
together with those of the Department of Teacher Training and Development should organize in-
service training aimed at enhancing teacher skills in mathematics to improve mastery of the
subjects. This is especial;ly pertinent as some teachers are teaching subjects that were neither their
major nor their minor during their professional training (Draft Report on Subject Specialisation,
Botswana, 2010).
7.9 Teachers reaching acceptable mathematics competency levels Table 7.8 shows the distribution of mathematics competency levels of teachers across Botswana’s
regions.
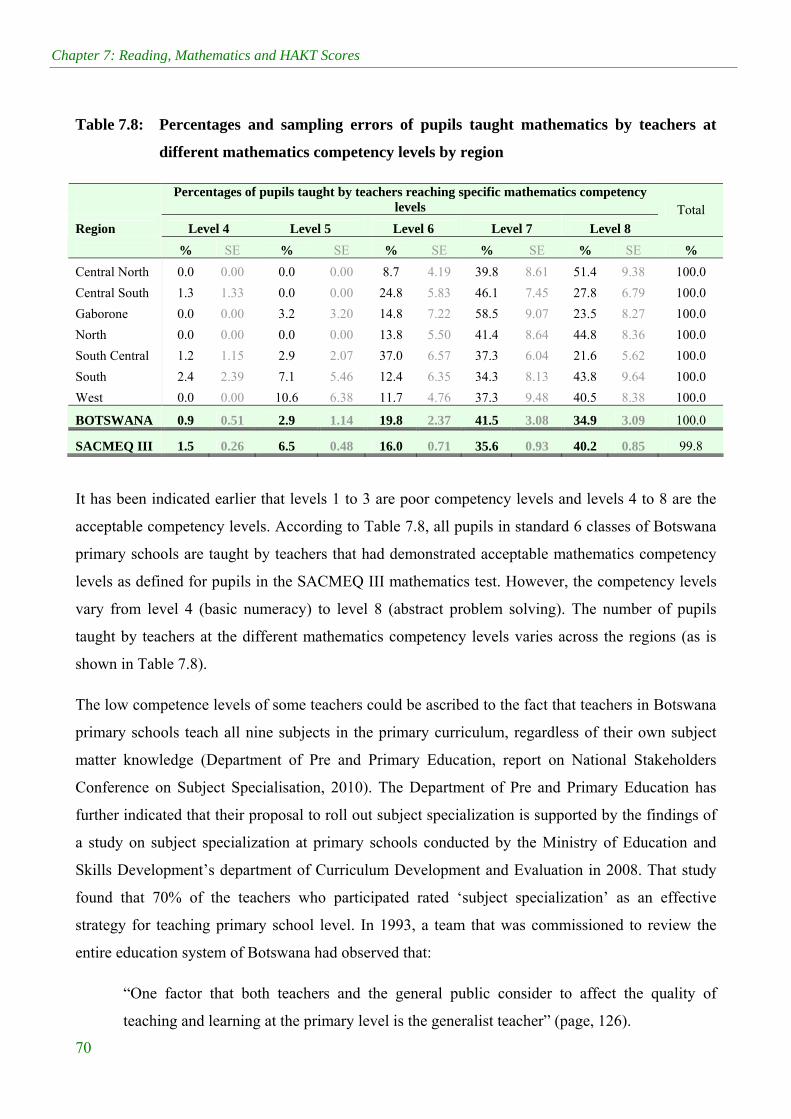
Chapter 7: Reading, Mathematics and HAKT Scores
70
Table 7.8: Percentages and sampling errors of pupils taught mathematics by teachers at
different mathematics competency levels by region
Percentages of pupils taught by teachers reaching specific mathematics competency
levels
Region Level 4 Level 5 Level 6 Level 7 Level 8
Total
% SE % SE % SE % SE % SE %
Central North 0.0 0.00 0.0 0.00 8.7 4.19 39.8 8.61 51.4 9.38 100.0
Central South 1.3 1.33 0.0 0.00 24.8 5.83 46.1 7.45 27.8 6.79 100.0
Gaborone 0.0 0.00 3.2 3.20 14.8 7.22 58.5 9.07 23.5 8.27 100.0
North 0.0 0.00 0.0 0.00 13.8 5.50 41.4 8.64 44.8 8.36 100.0
South Central 1.2 1.15 2.9 2.07 37.0 6.57 37.3 6.04 21.6 5.62 100.0
South 2.4 2.39 7.1 5.46 12.4 6.35 34.3 8.13 43.8 9.64 100.0
West 0.0 0.00 10.6 6.38 11.7 4.76 37.3 9.48 40.5 8.38 100.0
BOTSWANA 0.9 0.51 2.9 1.14 19.8 2.37 41.5 3.08 34.9 3.09 100.0
SACMEQ III 1.5 0.26 6.5 0.48 16.0 0.71 35.6 0.93 40.2 0.85 99.8
It has been indicated earlier that levels 1 to 3 are poor competency levels and levels 4 to 8 are the
acceptable competency levels. According to Table 7.8, all pupils in standard 6 classes of Botswana
primary schools are taught by teachers that had demonstrated acceptable mathematics competency
levels as defined for pupils in the SACMEQ III mathematics test. However, the competency levels
vary from level 4 (basic numeracy) to level 8 (abstract problem solving). The number of pupils
taught by teachers at the different mathematics competency levels varies across the regions (as is
shown in Table 7.8).
The low competence levels of some teachers could be ascribed to the fact that teachers in Botswana
primary schools teach all nine subjects in the primary curriculum, regardless of their own subject
matter knowledge (Department of Pre and Primary Education, report on National Stakeholders
Conference on Subject Specialisation, 2010). The Department of Pre and Primary Education has
further indicated that their proposal to roll out subject specialization is supported by the findings of
a study on subject specialization at primary schools conducted by the Ministry of Education and
Skills Development’s department of Curriculum Development and Evaluation in 2008. That study
found that 70% of the teachers who participated rated ‘subject specialization’ as an effective
strategy for teaching primary school level. In 1993, a team that was commissioned to review the
entire education system of Botswana had observed that:
“One factor that both teachers and the general public consider to affect the quality of
teaching and learning at the primary level is the generalist teacher” (page, 126).

The SACMEQ III Project in Botswana
71
The commission had recommended that specialized teachers be introduced at higher levels of
primary schools. They stated that it is important to adopt the strategy of using specialized teachers
for a holistic education programme that will ensure a smooth transition to junior secondary school.
This recommendation was adopted as is indicated in the Revised National Policy on Education’
1994, recommendation 24(c). The research team would like to recommend that the Department of
Pre and Primary Education embark upon a concentrated effort to expedite recommendation 24(c) of
RNPE 1994, so that primary school teachers could specialize in the subjects that they studied during
their college training.
Policy Suggestion: Department of Pre and Primary Education in collaboration with Department of Teaching Service Management should make a concerted effort to ensure the implementation of recommendation 24(c) of the Revised National Policy on Education of 1994.
7.10 Pupil and teacher HIV and AIDS Knowledge levels This section of the chapter presents the findings on the HIV-AIDS Knowledge Test (HAKT)
results. The test was taken by pupils, teachers and the school head of the schools where data were
collected. Variables that were assessed included HIV and AIDS knowledge by region, gender,
socio-economic status and school location. Further, attitudes and risk perceptions towards HIV
infection for the pupils, teachers and school heads were assessed.
HIV and AIDS knowledge levels by region, gender, socio-economic status and school location
Pupils’ performance on the HAKT by region
Table 7.9: Mean scores for pupils’ HIV-AIDS knowledge test and percentage of pupils reaching minimum and desirable levels of knowledge about HIV and AIDS
PUPILS
Transformed
score Reaching minimum level Reaching desirable level Region
Mean SE % SE % SE Central North 510.1 14.25 36.2 4.32 10.1 3.08 Central South 485.9 9.7 28 5.61 4.7 1.4 Gaborone 566.3 14.06 60.6 3.95 18.4 4.3 North 516 8.31 37.8 5.97 7.5 1.22 South Central 480.6 10.45 22.7 4.58 4.7 1.73 South 491.4 9.26 29.9 4.22 4.5 1.47 West 470.9 6.72 19.6 4.36 3.8 1.31
BOTSWANA 498.9 4.32 31.9 2.85 7.1 0.85
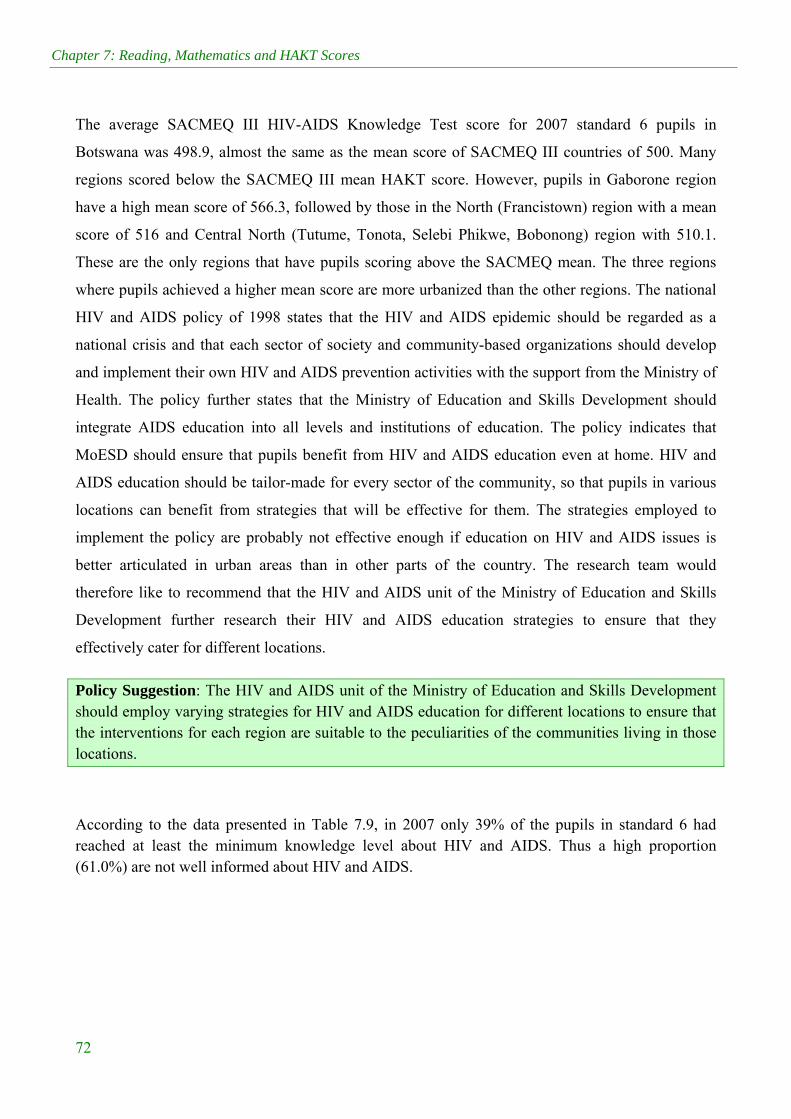
Chapter 7: Reading, Mathematics and HAKT Scores
72
The average SACMEQ III HIV-AIDS Knowledge Test score for 2007 standard 6 pupils in
Botswana was 498.9, almost the same as the mean score of SACMEQ III countries of 500. Many
regions scored below the SACMEQ III mean HAKT score. However, pupils in Gaborone region
have a high mean score of 566.3, followed by those in the North (Francistown) region with a mean
score of 516 and Central North (Tutume, Tonota, Selebi Phikwe, Bobonong) region with 510.1.
These are the only regions that have pupils scoring above the SACMEQ mean. The three regions
where pupils achieved a higher mean score are more urbanized than the other regions. The national
HIV and AIDS policy of 1998 states that the HIV and AIDS epidemic should be regarded as a
national crisis and that each sector of society and community-based organizations should develop
and implement their own HIV and AIDS prevention activities with the support from the Ministry of
Health. The policy further states that the Ministry of Education and Skills Development should
integrate AIDS education into all levels and institutions of education. The policy indicates that
MoESD should ensure that pupils benefit from HIV and AIDS education even at home. HIV and
AIDS education should be tailor-made for every sector of the community, so that pupils in various
locations can benefit from strategies that will be effective for them. The strategies employed to
implement the policy are probably not effective enough if education on HIV and AIDS issues is
better articulated in urban areas than in other parts of the country. The research team would
therefore like to recommend that the HIV and AIDS unit of the Ministry of Education and Skills
Development further research their HIV and AIDS education strategies to ensure that they
effectively cater for different locations.
Policy Suggestion: The HIV and AIDS unit of the Ministry of Education and Skills Development should employ varying strategies for HIV and AIDS education for different locations to ensure that the interventions for each region are suitable to the peculiarities of the communities living in those locations.
According to the data presented in Table 7.9, in 2007 only 39% of the pupils in standard 6 had reached at least the minimum knowledge level about HIV and AIDS. Thus a high proportion (61.0%) are not well informed about HIV and AIDS.
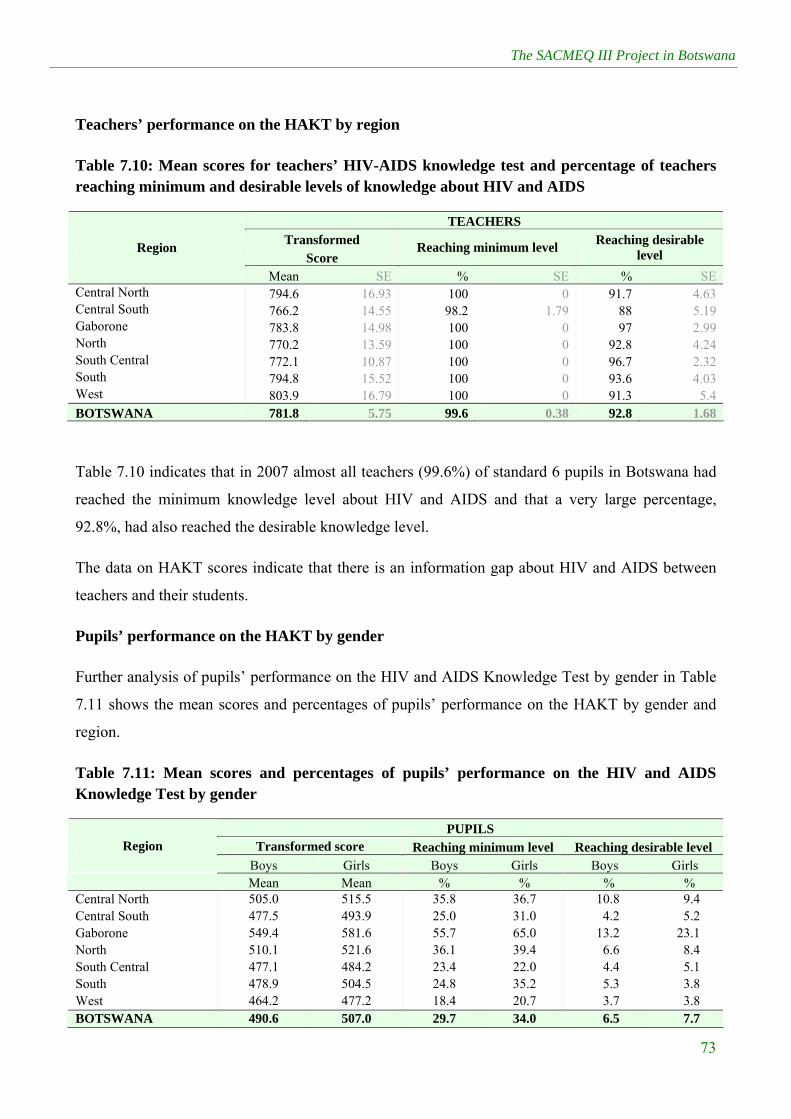
The SACMEQ III Project in Botswana
73
Teachers’ performance on the HAKT by region
Table 7.10: Mean scores for teachers’ HIV-AIDS knowledge test and percentage of teachers reaching minimum and desirable levels of knowledge about HIV and AIDS
TEACHERS Transformed
Score Reaching minimum level
Reaching desirable level
Region
Mean SE % SE % SE Central North 794.6 16.93 100 0 91.7 4.63 Central South 766.2 14.55 98.2 1.79 88 5.19 Gaborone 783.8 14.98 100 0 97 2.99 North 770.2 13.59 100 0 92.8 4.24 South Central 772.1 10.87 100 0 96.7 2.32 South 794.8 15.52 100 0 93.6 4.03 West 803.9 16.79 100 0 91.3 5.4 BOTSWANA 781.8 5.75 99.6 0.38 92.8 1.68
Table 7.10 indicates that in 2007 almost all teachers (99.6%) of standard 6 pupils in Botswana had
reached the minimum knowledge level about HIV and AIDS and that a very large percentage,
92.8%, had also reached the desirable knowledge level.
The data on HAKT scores indicate that there is an information gap about HIV and AIDS between
teachers and their students.
Pupils’ performance on the HAKT by gender
Further analysis of pupils’ performance on the HIV and AIDS Knowledge Test by gender in Table
7.11 shows the mean scores and percentages of pupils’ performance on the HAKT by gender and
region.
Table 7.11: Mean scores and percentages of pupils’ performance on the HIV and AIDS Knowledge Test by gender
PUPILS Transformed score Reaching minimum level Reaching desirable level Region
Boys Girls Boys Girls Boys Girls Mean Mean % % % % Central North 505.0 515.5 35.8 36.7 10.8 9.4 Central South 477.5 493.9 25.0 31.0 4.2 5.2 Gaborone 549.4 581.6 55.7 65.0 13.2 23.1 North 510.1 521.6 36.1 39.4 6.6 8.4 South Central 477.1 484.2 23.4 22.0 4.4 5.1 South 478.9 504.5 24.8 35.2 5.3 3.8 West 464.2 477.2 18.4 20.7 3.7 3.8 BOTSWANA 490.6 507.0 29.7 34.0 6.5 7.7
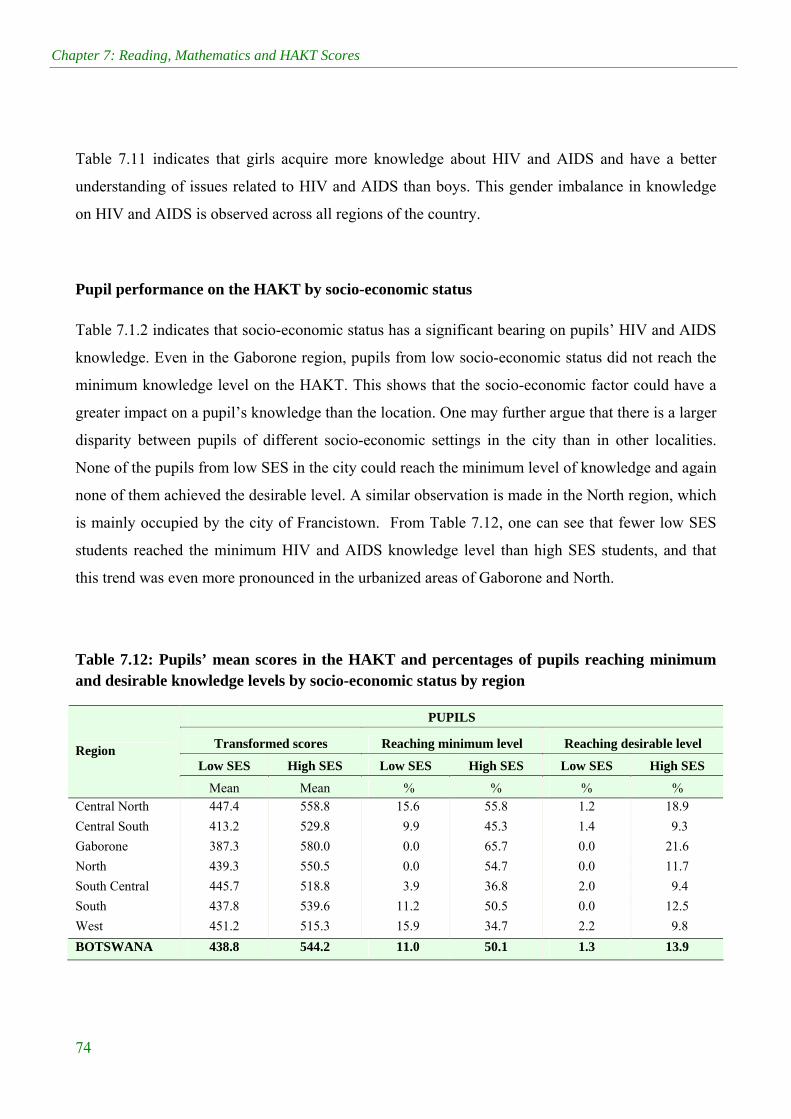
Chapter 7: Reading, Mathematics and HAKT Scores
74
Table 7.11 indicates that girls acquire more knowledge about HIV and AIDS and have a better
understanding of issues related to HIV and AIDS than boys. This gender imbalance in knowledge
on HIV and AIDS is observed across all regions of the country.
Pupil performance on the HAKT by socio-economic status
Table 7.1.2 indicates that socio-economic status has a significant bearing on pupils’ HIV and AIDS
knowledge. Even in the Gaborone region, pupils from low socio-economic status did not reach the
minimum knowledge level on the HAKT. This shows that the socio-economic factor could have a
greater impact on a pupil’s knowledge than the location. One may further argue that there is a larger
disparity between pupils of different socio-economic settings in the city than in other localities.
None of the pupils from low SES in the city could reach the minimum level of knowledge and again
none of them achieved the desirable level. A similar observation is made in the North region, which
is mainly occupied by the city of Francistown. From Table 7.12, one can see that fewer low SES
students reached the minimum HIV and AIDS knowledge level than high SES students, and that
this trend was even more pronounced in the urbanized areas of Gaborone and North.
Table 7.12: Pupils’ mean scores in the HAKT and percentages of pupils reaching minimum and desirable knowledge levels by socio-economic status by region
PUPILS
Transformed scores Reaching minimum level Reaching desirable level
Low SES High SES Low SES High SES Low SES High SES Region
Mean Mean % % % % Central North 447.4 558.8 15.6 55.8 1.2 18.9
Central South 413.2 529.8 9.9 45.3 1.4 9.3
Gaborone 387.3 580.0 0.0 65.7 0.0 21.6
North 439.3 550.5 0.0 54.7 0.0 11.7
South Central 445.7 518.8 3.9 36.8 2.0 9.4
South 437.8 539.6 11.2 50.5 0.0 12.5
West 451.2 515.3 15.9 34.7 2.2 9.8
BOTSWANA 438.8 544.2 11.0 50.1 1.3 13.9

The SACMEQ III Project in Botswana
75
Pupils’ performance on the HAKT by school location
Pupils’ performance on the HAKT was analysed by region and school location and ixs presented in
Table 7.13.
Table: 7.13: Pupils’ mean score for HAKT and their distribution according to achieving minimum and desirable levels by school location by region
PUPILS
Transformed scores Reaching minimum level Reaching desirable level
Rural Urban Rural Urban Rural Urban Region
Mean Mean % % % %Central North 485.2 529.4 24.8 45.1 3.9 14.9
Central South 465.0 524.0 20.4 42.0 2.1 9.4
Gaborone . 566.3 . 60.6 . 18.4
North 482.9 524.3 19.8 42.3 4.2 8.4
South Central 465.2 496.5 15.1 30.5 3.3 6.2
South 475.9 510.3 26.3 34.2 1.6 8.2
West 471.2 469.5 20 17.3 3.5 5.3
BOTSWANA 471.5 524.5 20.8 42.2 2.8 11.1
The data indicates that, on average, pupils in urban areas achieve higher HIV and AIDS knowledge
than those in rural area. However, in the West region there is not much difference between pupils
from urban areas and those from rural areas. This is most probably because the lifestyles of people
living in Maun and Ghanzi (urbanized villages) do not differ much from those of people living in
the areas around those centres.
Teachers’ performance on the HAKT by school location
Teachers’ performance on the HAKT was also assessed. Almost all teachers of standard six pupils
reached at least the minimum level of knowledge on HIV and AIDS (Table 7.14).

Chapter 7: Reading, Mathematics and HAKT Scores
76
Table 7.14: Teachers mean scores on HAKT and their distribution by region and gender
TEACHERS
Transformed scores Reaching minimum
level Reaching desirable level
Male Female Male Female Male Female Region
Mean Mean % % % % Central North 821.2 767.2 100 100 89.2 94.3
Central South 795.5 756.7 92.7 100 89.3 87.6
Gaborone 797.3 779.9 100 100 93.8 97.9
North 792.1 762.2 100 100 89.9 93.9
South Central 795.1 765.7 100 100 100 95.8
South 857 768.5 100 100 100 90.9
West 811.7 772.2 100 100 91.7 89.4
BOTSWANA 813.1 765.5 98.9 100 92.9 92.7
It is reasonable to expect that teachers reach very high knowledge levels on HIV and AIDS
knowledge assessment. Teachers obviously have a higher exposure to HIV and AIDS information
than pupils. Teachers are well informed to empower the pupils with knowledge on issues of HIV
and AIDS. There is a need for the school environment to prepare pupils by providing them with
knowledge about issues of HIV and AIDS, especially in the rural areas. The reason for the massive
knowledge gap between teachers and their students needs to be explored further.
7.11 Attitudes about HIV and AIDS
Stigma
The attitudes of pupils, teachers and school heads towards pupils infected with HIV were assessed
(Table 7.15a). Respondents were asked if a pupil who is infected with HIV should be allowed to
continue attending school. The intention of the question was to find out if there was still a stigma
attached to pupils infected with HIV.
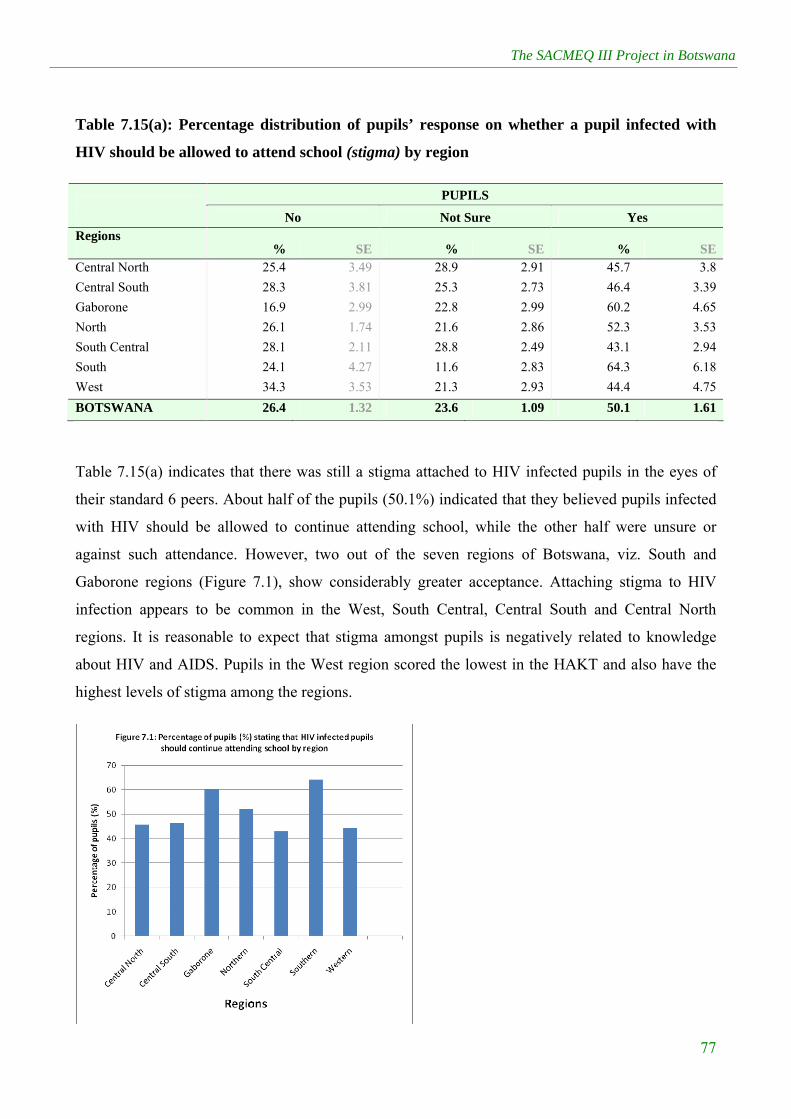
The SACMEQ III Project in Botswana
77
Table 7.15(a): Percentage distribution of pupils’ response on whether a pupil infected with
HIV should be allowed to attend school (stigma) by region
PUPILS
No Not Sure Yes Regions
% SE % SE % SE Central North 25.4 3.49 28.9 2.91 45.7 3.8
Central South 28.3 3.81 25.3 2.73 46.4 3.39
Gaborone 16.9 2.99 22.8 2.99 60.2 4.65
North 26.1 1.74 21.6 2.86 52.3 3.53
South Central 28.1 2.11 28.8 2.49 43.1 2.94
South 24.1 4.27 11.6 2.83 64.3 6.18
West 34.3 3.53 21.3 2.93 44.4 4.75
BOTSWANA 26.4 1.32 23.6 1.09 50.1 1.61
Table 7.15(a) indicates that there was still a stigma attached to HIV infected pupils in the eyes of
their standard 6 peers. About half of the pupils (50.1%) indicated that they believed pupils infected
with HIV should be allowed to continue attending school, while the other half were unsure or
against such attendance. However, two out of the seven regions of Botswana, viz. South and
Gaborone regions (Figure 7.1), show considerably greater acceptance. Attaching stigma to HIV
infection appears to be common in the West, South Central, Central South and Central North
regions. It is reasonable to expect that stigma amongst pupils is negatively related to knowledge
about HIV and AIDS. Pupils in the West region scored the lowest in the HAKT and also have the
highest levels of stigma among the regions.
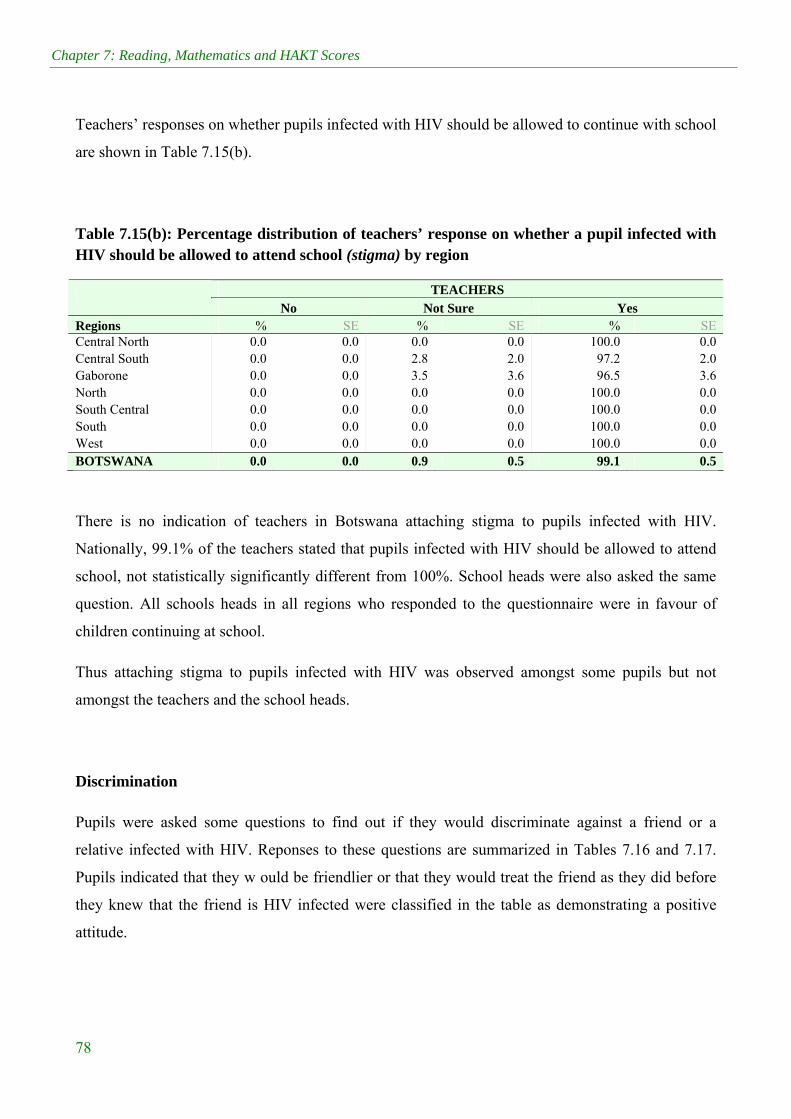
Chapter 7: Reading, Mathematics and HAKT Scores
78
Teachers’ responses on whether pupils infected with HIV should be allowed to continue with school
are shown in Table 7.15(b).
Table 7.15(b): Percentage distribution of teachers’ response on whether a pupil infected with HIV should be allowed to attend school (stigma) by region
TEACHERS
No Not Sure Yes Regions % SE % SE % SE Central North 0.0 0.0 0.0 0.0 100.0 0.0 Central South 0.0 0.0 2.8 2.0 97.2 2.0 Gaborone 0.0 0.0 3.5 3.6 96.5 3.6 North 0.0 0.0 0.0 0.0 100.0 0.0 South Central 0.0 0.0 0.0 0.0 100.0 0.0 South 0.0 0.0 0.0 0.0 100.0 0.0 West 0.0 0.0 0.0 0.0 100.0 0.0 BOTSWANA 0.0 0.0 0.9 0.5 99.1 0.5
There is no indication of teachers in Botswana attaching stigma to pupils infected with HIV.
Nationally, 99.1% of the teachers stated that pupils infected with HIV should be allowed to attend
school, not statistically significantly different from 100%. School heads were also asked the same
question. All schools heads in all regions who responded to the questionnaire were in favour of
children continuing at school.
Thus attaching stigma to pupils infected with HIV was observed amongst some pupils but not
amongst the teachers and the school heads.
Discrimination
Pupils were asked some questions to find out if they would discriminate against a friend or a
relative infected with HIV. Reponses to these questions are summarized in Tables 7.16 and 7.17.
Pupils indicated that they w ould be friendlier or that they would treat the friend as they did before
they knew that the friend is HIV infected were classified in the table as demonstrating a positive
attitude.
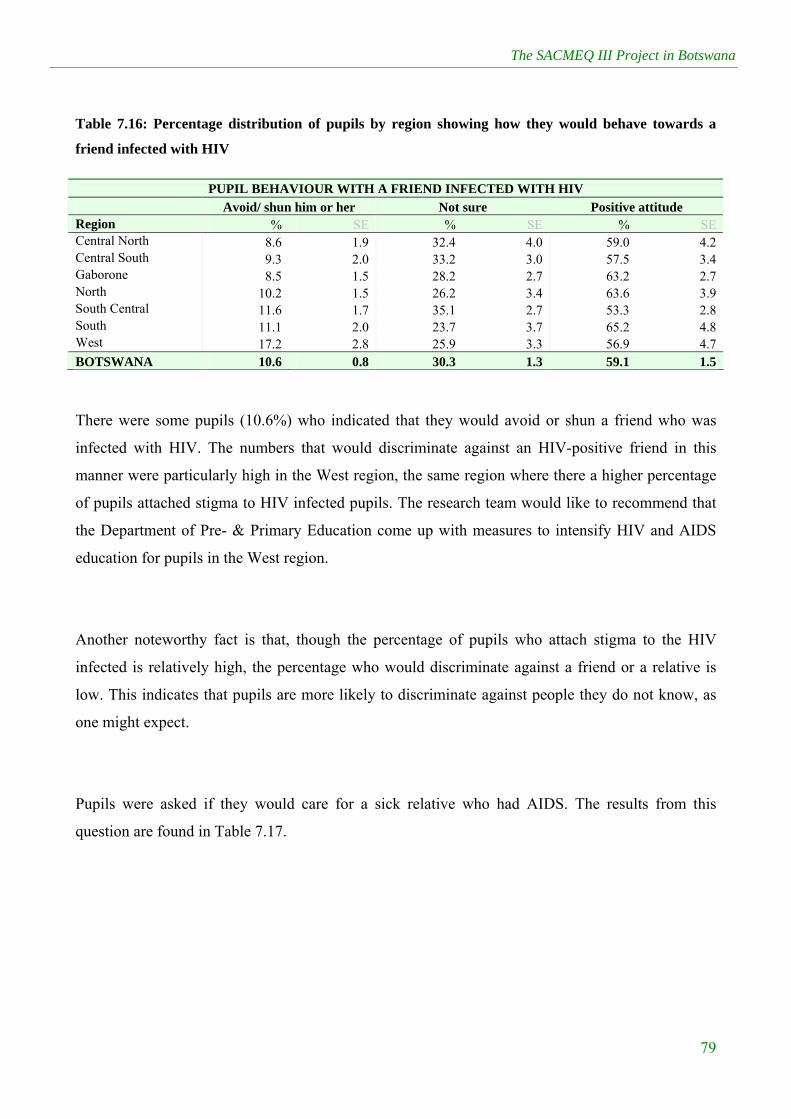
The SACMEQ III Project in Botswana
79
Table 7.16: Percentage distribution of pupils by region showing how they would behave towards a
friend infected with HIV
PUPIL BEHAVIOUR WITH A FRIEND INFECTED WITH HIV Avoid/ shun him or her Not sure Positive attitude Region % SE % SE % SE Central North 8.6 1.9 32.4 4.0 59.0 4.2 Central South 9.3 2.0 33.2 3.0 57.5 3.4 Gaborone 8.5 1.5 28.2 2.7 63.2 2.7 North 10.2 1.5 26.2 3.4 63.6 3.9 South Central 11.6 1.7 35.1 2.7 53.3 2.8 South 11.1 2.0 23.7 3.7 65.2 4.8 West 17.2 2.8 25.9 3.3 56.9 4.7 BOTSWANA 10.6 0.8 30.3 1.3 59.1 1.5
There were some pupils (10.6%) who indicated that they would avoid or shun a friend who was
infected with HIV. The numbers that would discriminate against an HIV-positive friend in this
manner were particularly high in the West region, the same region where there a higher percentage
of pupils attached stigma to HIV infected pupils. The research team would like to recommend that
the Department of Pre- & Primary Education come up with measures to intensify HIV and AIDS
education for pupils in the West region.
Another noteworthy fact is that, though the percentage of pupils who attach stigma to the HIV
infected is relatively high, the percentage who would discriminate against a friend or a relative is
low. This indicates that pupils are more likely to discriminate against people they do not know, as
one might expect.
Pupils were asked if they would care for a sick relative who had AIDS. The results from this
question are found in Table 7.17.
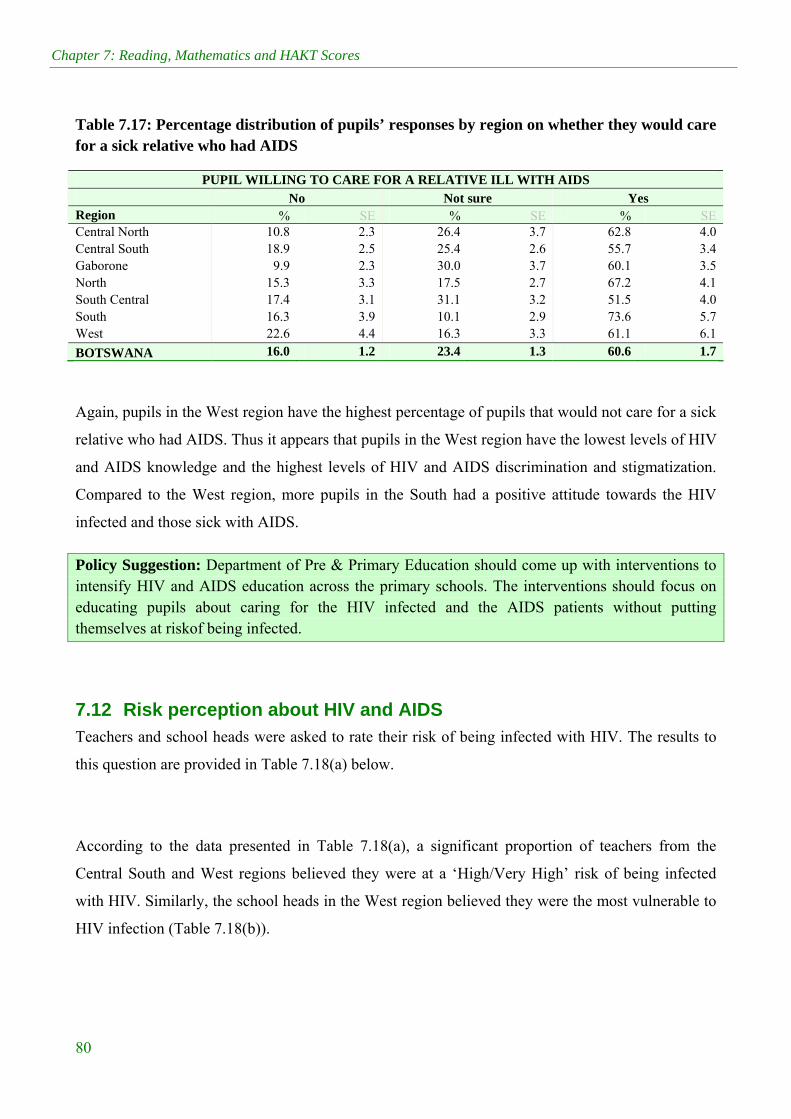
Chapter 7: Reading, Mathematics and HAKT Scores
80
Table 7.17: Percentage distribution of pupils’ responses by region on whether they would care for a sick relative who had AIDS
PUPIL WILLING TO CARE FOR A RELATIVE ILL WITH AIDS No Not sure Yes Region % SE % SE % SE Central North 10.8 2.3 26.4 3.7 62.8 4.0 Central South 18.9 2.5 25.4 2.6 55.7 3.4 Gaborone 9.9 2.3 30.0 3.7 60.1 3.5 North 15.3 3.3 17.5 2.7 67.2 4.1 South Central 17.4 3.1 31.1 3.2 51.5 4.0 South 16.3 3.9 10.1 2.9 73.6 5.7 West 22.6 4.4 16.3 3.3 61.1 6.1
BOTSWANA 16.0 1.2 23.4 1.3 60.6 1.7
Again, pupils in the West region have the highest percentage of pupils that would not care for a sick
relative who had AIDS. Thus it appears that pupils in the West region have the lowest levels of HIV
and AIDS knowledge and the highest levels of HIV and AIDS discrimination and stigmatization.
Compared to the West region, more pupils in the South had a positive attitude towards the HIV
infected and those sick with AIDS.
Policy Suggestion: Department of Pre & Primary Education should come up with interventions to intensify HIV and AIDS education across the primary schools. The interventions should focus on educating pupils about caring for the HIV infected and the AIDS patients without putting themselves at riskof being infected.
7.12 Risk perception about HIV and AIDS Teachers and school heads were asked to rate their risk of being infected with HIV. The results to
this question are provided in Table 7.18(a) below.
According to the data presented in Table 7.18(a), a significant proportion of teachers from the
Central South and West regions believed they were at a ‘High/Very High’ risk of being infected
with HIV. Similarly, the school heads in the West region believed they were the most vulnerable to
HIV infection (Table 7.18(b)).

The SACMEQ III Project in Botswana
81
Table 7.18(a): Teachers’ self-assessment of the risk of being infected by HIV by region
TEACHERS
No/ Low Risk Medium Risk High/Very High Risk
Region % SE % SE % SE Central North 52.3 9.3 25.7 7.7 22.0 6.3
Central South 49.4 7.6 11.0 4.6 39.6 6.9
Gaborone 63.0 8.9 16.2 6.5 20.7 6.6
North 59.2 8.2 8.1 3.3 32.8 8.5
South Central 56.3 6.9 21.7 5.3 22.1 6.4
South 65.0 8.6 15.3 7.3 19.7 6.8
West 33.1 10.2 20.5 6.9 46.4 9.2
BOTSWANA 54.4 3.2 17.4 2.4 28.2 2.7
Table 7.18(b): School heads’ self assessment of the risk of being infected by HIV by region
SCHOOL HEADS
No/ Low Risk Medium Risk High/Very High Risk
Region % SE % SE % SE Central North 63.5 10.1 8.6 6.0 27.9 9.3
Central South 45.4 9.6 14.5 6.8 40.1 9.5
Gaborone 74.1 10.2 11.0 7.5 14.9 8.2
North 60.4 11.2 10.3 7.1 29.2 10.4
South Central 53.1 9.7 7.2 5.0 39.7 9.5
South 49.7 11.5 15.1 8.3 35.2 11.0
West 25.0 10.0 32.5 11.1 42.5 11.3
BOTSWANA 52.9 4.0 13.1 2.7 34.1 3.9
Interventions for empowering pupils with HIV and AIDS knowledge and skills for reducing risks of
being infected would be relevant for the teachers and school heads as well. As indicated in Tables
7.17 and 7.18, there is disparity across regions on issues of stigma attached to the HIV infected,
discrimination of AIDS patients and vulnerability of teaching staff to HIV infection.
7.13 Conclusion Information presented in this chapter indicates that there has been an improvement in pupil reading
and to a somewhat lesser extent mathematics achievement between 2000 and 2007. However, not
all regions within the country performed equally. This disparity could be an indication of the
Chapter 7: Reading, Mathematics and HAKT Scores
82
peculiarities of the different regions that need to be considered when resources are distributed. A
trend of girls performing better than boy is still observed across the regions – this was also observed
in SACMEQ II (2000).
The national average reading score for the SACMEQ III study was 534.6 (2007). The score was
13.5 points higher than that of the SACMEQ II (2000) score of 521.1 and was considerably higher
than the SACMEQ III mean score for reading (509.7). There is still significant variation by region,
gender, socio-economic status and school location. On average, girls scored higher than boys,
pupils from low socio-economic background performed considerably worse than those from high
SES backgrounds, and rural pupils performed much lower than those who lived in cities. These
were also areas of concern in the 2000 SACMEQ II results. The data indicates that 75.8% of the
2007 standard 6 pupils in Botswana possess acceptable reading skills, i.e. they were reading at
levels that indicate they derive meaning from what they read. For both SACMEQ II and SACMEQ
III, virtually all standard 6 teachers had reached acceptable reading skills, when measutred by the
same standards as pupils.
Achievement in mathematics reflects an akmost similar pattern as that in reading. The pattern is that
pupils in cities perform better than those in rural areas, girls perform slightly better than boys and
pupils from high socio-economic background perform much better than those from low socio-
economic background. An increase of 7.6 points in the national mathematics mean score has been
observed between the 2000 and 2007 SACMEQ tests. Standard 6 pupils in Botswana scored a
somewhat higher national mathematics mean score (520.5) than the mean score for the SACMEQ
countries (509.7).
Pupils’ competency levels in mathematics were also measured. Those with poor competence are
able to perform only simple addition and subtraction, matching numbers to pictures, recognizing
shapes and counting in whole numbers. Though they still represent a high 56.5 % of Botswana’s
standard 6 pupils in the SACMEQ III study, this percentage has declined from 64.9% in the
SACMEQ II project, which is a positive development. The improvement in mathematics
performance is further reflected realized in the fact that the percentage of standard 6 pupils who
The SACMEQ III Project in Botswana
83
have acquired acceptable mathematics competency improved from 35.1% to 43.5% between 2000
and 2007, where acceptable competency in this standard is where a pupil is able to translate
mathematical problems into equation form in order to solve the problems.
While there has been an improvement in mathematics achievement, it is disconcerting that some
pupils are taught by teachers who have reached only relatively low levels of mathematics
competence levels, especially in the Central South, South Central and South regions. Therefore, the
research team would like to advise that Department of Pre- and Primary Education to ensure that
teachers in primary schools teach the subjects that they are competent in.
There is a similar pattern for HIV and AIDS knowledge as for reading and mathematics knowledge:
boys perform worse than girls, pupils from low socio-economic background perform worse than
those from high socio-economic backgrounds, and pupils in rural areas perform worse than those in
urban areas. About 30% of boys reached a minimum level of HIV and AIDS knowledge, while 34%
of girls reached these levels. Only 11% of pupils from low SES backgrounds reached the minimum
levels of knowledge, while 50% of those from high SES backgrounds reached these levels. Only
20.8% of pupils in rural areas reached these levels, while 42.2% of those in urban areas reached the
minimum levels of knowledge about HIV and AIDS. Practically 100% of all teachers have reached
the minimum level of HIV and AIDS knowledge.
Some elements of stigma and discrimination attached to the HIV infected had been observed among
the pupils but not amongst teachers and school heads. On average 50% of pupils indicated that
pupils infected with HIV should be allowed to continue attending school, while virtually all their
teachers and school heads indicated the same.
A higher risk of being infected by HIV is observed among the school heads than the teachers. At
least 34% of the school heads are at a high risk of being infected by HIV (self-assessed), while 28%
of the teachers believe they are at a high risk.