Embed Size (px)
Citation preview
m a k i n g i n n o v a t i o n h a p p e n , t o g e t h e r
The SAES® Group1Q 2019 Consolidated Results
m a k i n g i n n o v a t i o n h a p p e n , t o g e t h e r2
1Q 2019 HighlightsAll figures in M€, unless otherwise stated
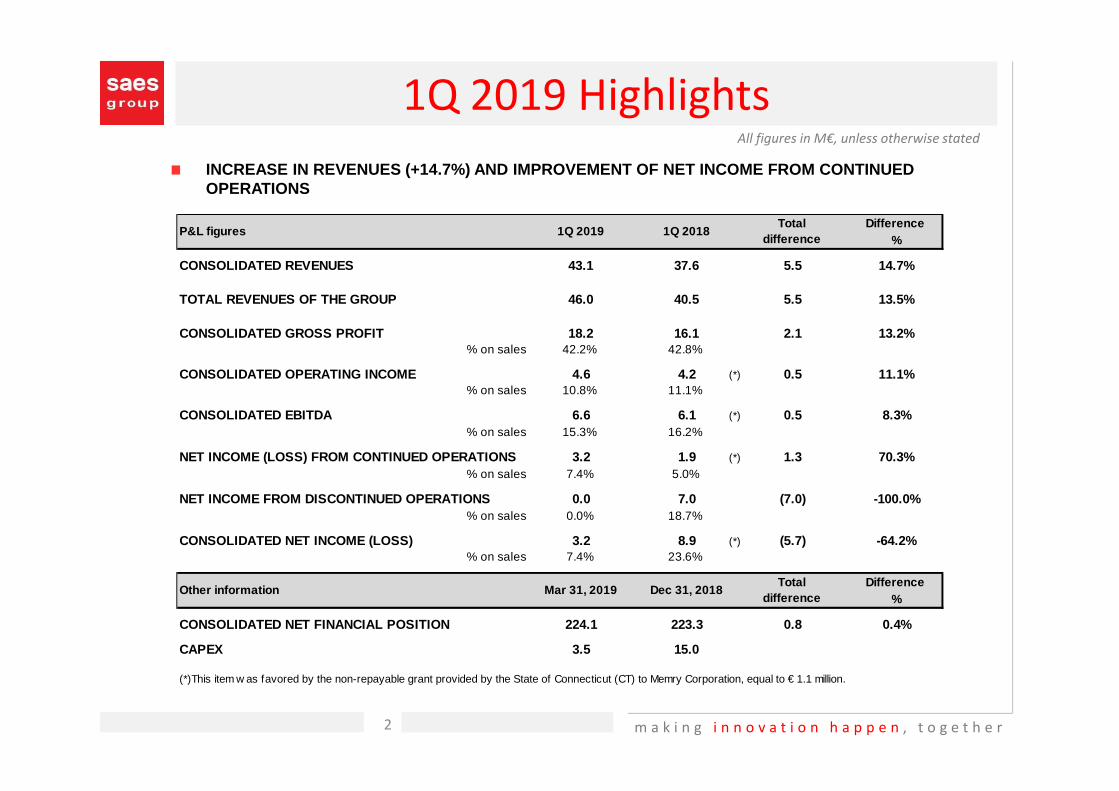
INCREASE IN REVENUES (+14.7%) AND IMPROVEMENT OF NET INCOME FROM CONTINUED OPERATIONS
Difference %
CONSOLIDATED REVENUES 43.1 37.6 5.5 14.7%
TOTAL REVENUES OF THE GROUP 46.0 40.5 5.5 13.5%
CONSOLIDATED GROSS PROFIT 18.2 16.1 2.1 13.2%% on sales 42.2% 42.8%
CONSOLIDATED OPERATING INCOME 4.6 4.2 (*) 0.5 11.1%% on sales 10.8% 11.1%
CONSOLIDATED EBITDA 6.6 6.1 (*) 0.5 8.3%% on sales 15.3% 16.2%
NET INCOME (LOSS) FROM CONTINUED OPERATIONS 3.2 1.9 (*) 1.3 70.3%% on sales 7.4% 5.0%
NET INCOME FROM DISCONTINUED OPERATIONS 0.0 7.0 (7.0) -100.0%% on sales 0.0% 18.7%
CONSOLIDATED NET INCOME (LOSS) 3.2 8.9 (*) (5.7) -64.2%% on sales 7.4% 23.6%
Difference %
CONSOLIDATED NET FINANCIAL POSITION 224.1 223.3 0.8 0.4%
CAPEX 3.5 15.0
(*)This item w as favored by the non-repayable grant provided by the State of Connecticut (CT) to Memry Corporation, equal to € 1.1 million.
P&L figures 1Q 2019 1Q 2018Total
difference
Other information Mar 31, 2019 Dec 31, 2018Total
difference
m a k i n g i n n o v a t i o n h a p p e n , t o g e t h e r
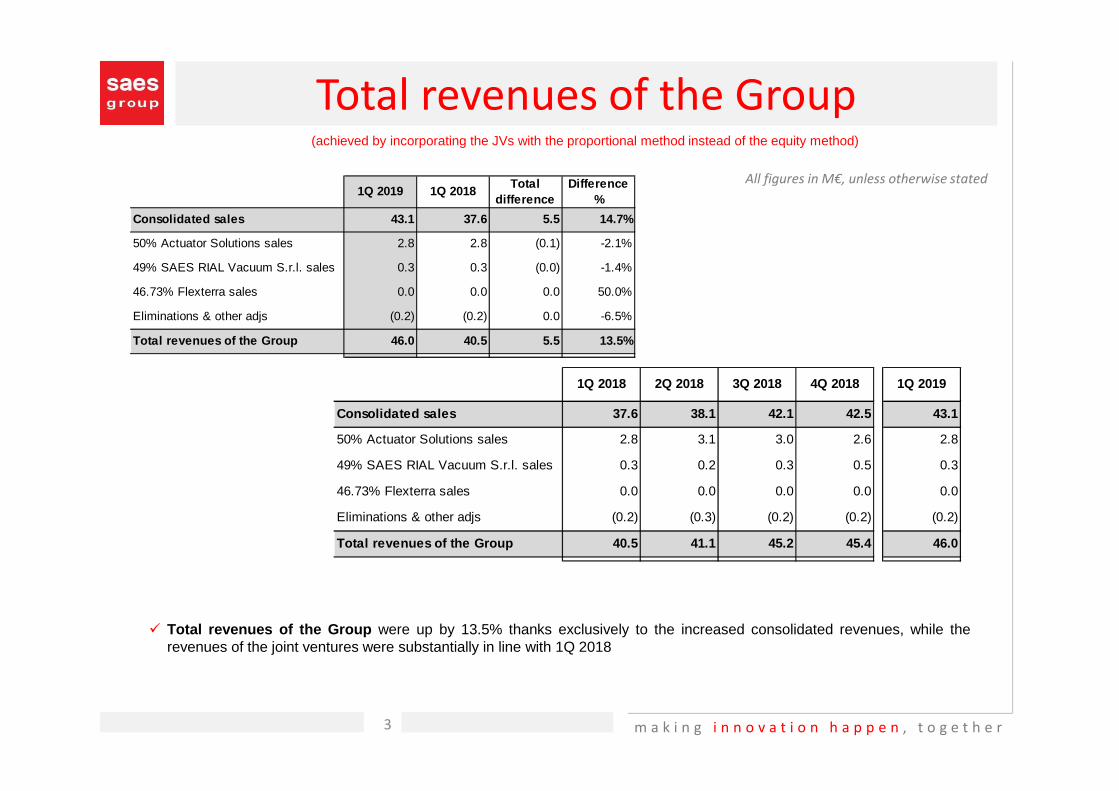
Total revenues of the Group(achieved by incorporating the JVs with the proportional method instead of the equity method)
All figures in M€, unless otherwise stated
� Total revenues of the Group were up by 13.5% thanks exclusively to the increased consolidated revenues, while therevenues of the joint ventures were substantially in line with 1Q 2018
3
1Q 2019 1Q 2018Total
difference Difference
%
Consolidated sales 43.1 37.6 5.5 14.7%
50% Actuator Solutions sales 2.8 2.8 (0.1) -2.1%
49% SAES RIAL Vacuum S.r.l. sales 0.3 0.3 (0.0) -1.4%
46.73% Flexterra sales 0.0 0.0 0.0 50.0%
Eliminations & other adjs (0.2) (0.2) 0.0 -6.5%
Total revenues of the Group 46.0 40.5 5.5 13.5%
1Q 2018 2Q 2018 3Q 2018 4Q 2018 1Q 2019
Consolidated sales 37.6 38.1 42.1 42.5 43.1
50% Actuator Solutions sales 2.8 3.1 3.0 2.6 2.8
49% SAES RIAL Vacuum S.r.l. sales 0.3 0.2 0.3 0.5 0.3
46.73% Flexterra sales 0.0 0.0 0.0 0.0 0.0
Eliminations & other adjs (0.2) (0.3) (0.2) (0.2) (0.2)
Total revenues of the Group 40.5 41.1 45.2 45.4 46.0
m a k i n g i n n o v a t i o n h a p p e n , t o g e t h e r
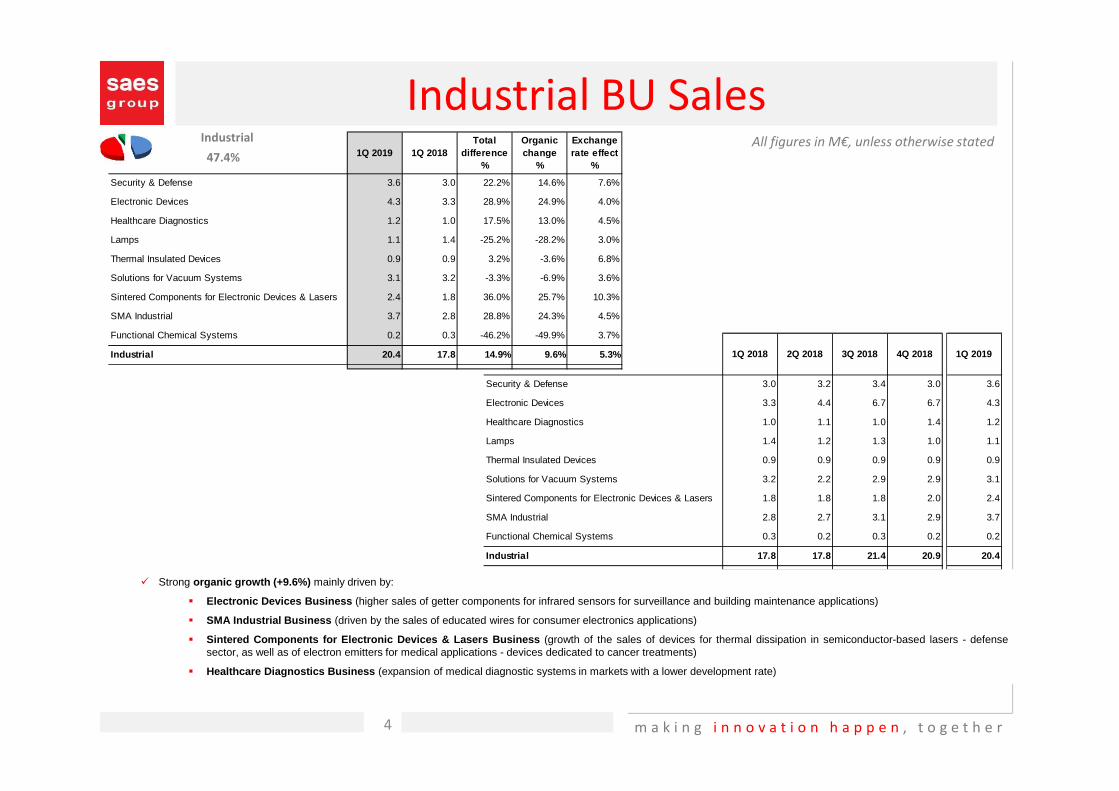
1Q 2018 2Q 2018 3Q 2018 4Q 2018 1Q 2019
Security & Defense 3.0 3.2 3.4 3.0 3.6
Electronic Devices 3.3 4.4 6.7 6.7 4.3
Healthcare Diagnostics 1.0 1.1 1.0 1.4 1.2
Lamps 1.4 1.2 1.3 1.0 1.1
Thermal Insulated Devices 0.9 0.9 0.9 0.9 0.9
Solutions for Vacuum Systems 3.2 2.2 2.9 2.9 3.1
Sintered Components for Electronic Devices & Lasers 1.8 1.8 1.8 2.0 2.4
SMA Industrial 2.8 2.7 3.1 2.9 3.7
Functional Chemical Systems 0.3 0.2 0.3 0.2 0.2
Industrial 17.8 17.8 21.4 20.9 20.4
1Q 2019 1Q 2018Total
difference %
Organic change
%
Exchange rate effect
%
Security & Defense 3.6 3.0 22.2% 14.6% 7.6%
Electronic Devices 4.3 3.3 28.9% 24.9% 4.0%
Healthcare Diagnostics 1.2 1.0 17.5% 13.0% 4.5%
Lamps 1.1 1.4 -25.2% -28.2% 3.0%
Thermal Insulated Devices 0.9 0.9 3.2% -3.6% 6.8%
Solutions for Vacuum Systems 3.1 3.2 -3.3% -6.9% 3.6%
Sintered Components for Electronic Devices & Lasers 2.4 1.8 36.0% 25.7% 10.3%
SMA Industrial 3.7 2.8 28.8% 24.3% 4.5%
Functional Chemical Systems 0.2 0.3 -46.2% -49.9% 3.7%
Industrial 20.4 17.8 14.9% 9.6% 5.3%
� Strong organic growth (+9.6%) mainly driven by:
� Electronic Devices Business (higher sales of getter components for infrared sensors for surveillance and building maintenance applications)
� SMA Industrial Business (driven by the sales of educated wires for consumer electronics applications)
� Sintered Components for Electronic Devices & Lasers Business (growth of the sales of devices for thermal dissipation in semiconductor-based lasers - defensesector, as well as of electron emitters for medical applications - devices dedicated to cancer treatments)
� Healthcare Diagnostics Business (expansion of medical diagnostic systems in markets with a lower development rate)
Industrial BU SalesIndustrial All figures in M€, unless otherwise stated47.4%
4

m a k i n g i n n o v a t i o n h a p p e n , t o g e t h e r5
Medical BU Sales
� Organic growth (+13.7%) in line with the average growth rates of the latestperiods and thanks to the increase in the sales volumes of the various product lines
All figures in M€, unless otherwise statedMedical
46.5%
1Q 2018 2Q 2018 3Q 2018 4Q 2018 1Q 2019
Nitinol for Medical Devices 16.3 17.9 17.7 19.1 20.1
Medical 16.3 17.9 17.7 19.1 20.1
1Q 2019 1Q 2018Total
difference %
Organic change
%
Exchange rate effect
%
Nitinol for Medical Devices 20.1 16.3 22.8% 13.7% 9.1%
Medical 20.1 16.3 22.8% 13.7% 9.1%
m a k i n g i n n o v a t i o n h a p p e n , t o g e t h e r6
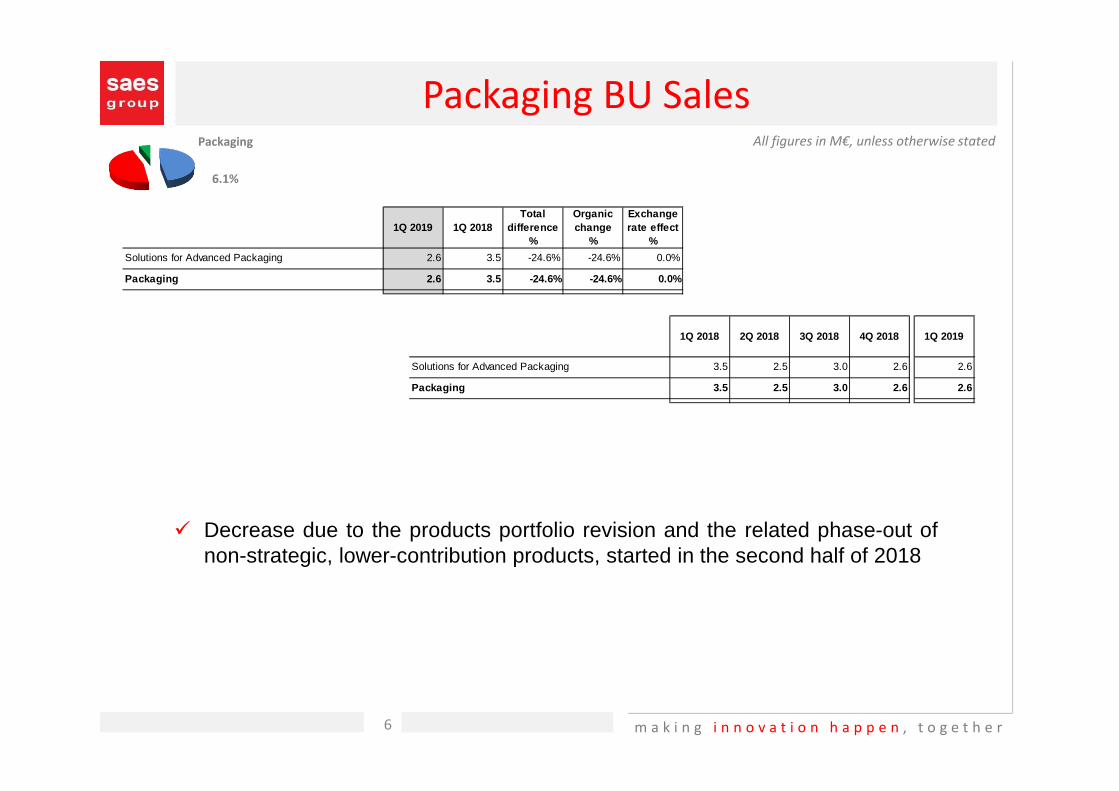
Packaging BU SalesAll figures in M€, unless otherwise stated
� Decrease due to the products portfolio revision and the related phase-out ofnon-strategic, lower-contribution products, started in the second half of 2018
Packaging
6.1%
1Q 2018 2Q 2018 3Q 2018 4Q 2018 1Q 2019
Solutions for Advanced Packaging 3.5 2.5 3.0 2.6 2.6
Packaging 3.5 2.5 3.0 2.6 2.6
1Q 2019 1Q 2018Total
difference %
Organic change
%
Exchange rate effect
%
Solutions for Advanced Packaging 2.6 3.5 -24.6% -24.6% 0.0%
Packaging 2.6 3.5 -24.6% -24.6% 0.0%
m a k i n g i n n o v a t i o n h a p p e n , t o g e t h e r
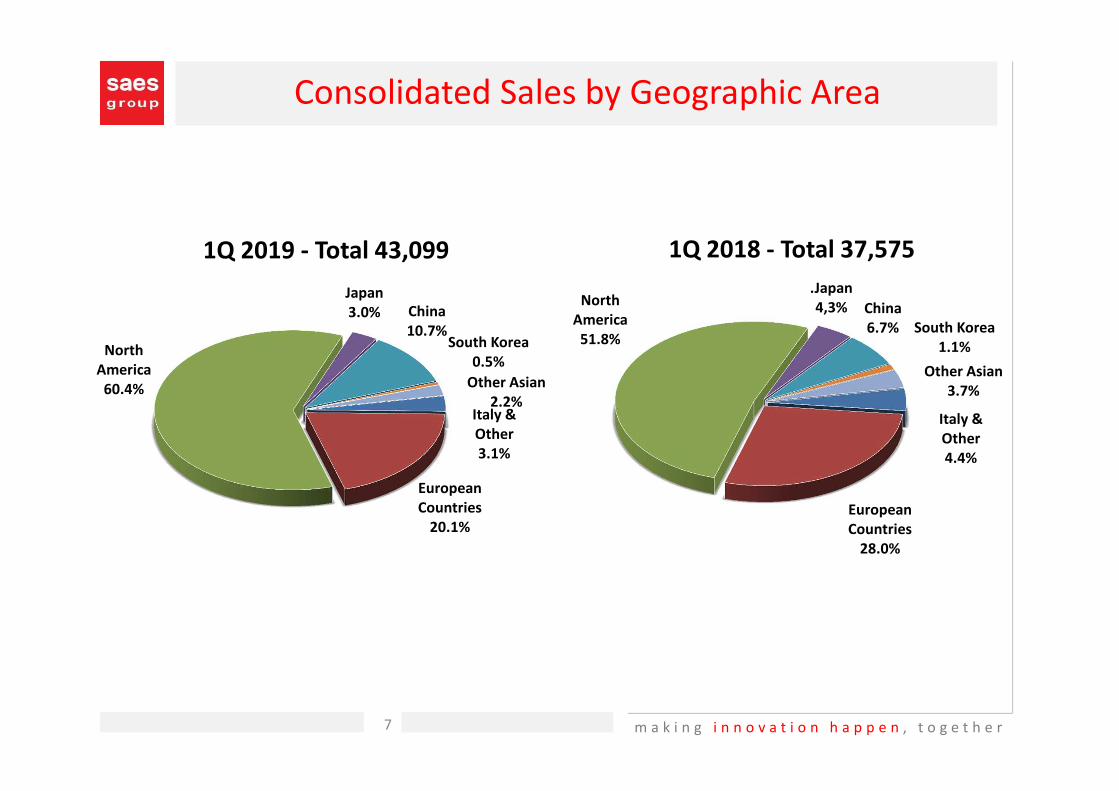
Consolidated Sales by Geographic Area
Italy &
Other
3.1%
European
Countries
20.1%
North
America
60.4%
Japan
3.0% China
10.7%South Korea
0.5%
Other Asian
2.2%
1Q 2019 - Total 43,099
Italy &
Other
4.4%
European
Countries
28.0%
North
America
51.8%
.Japan
4,3% China
6.7% South Korea
1.1%
Other Asian
3.7%
1Q 2018 - Total 37,575
7
m a k i n g i n n o v a t i o n h a p p e n , t o g e t h e r
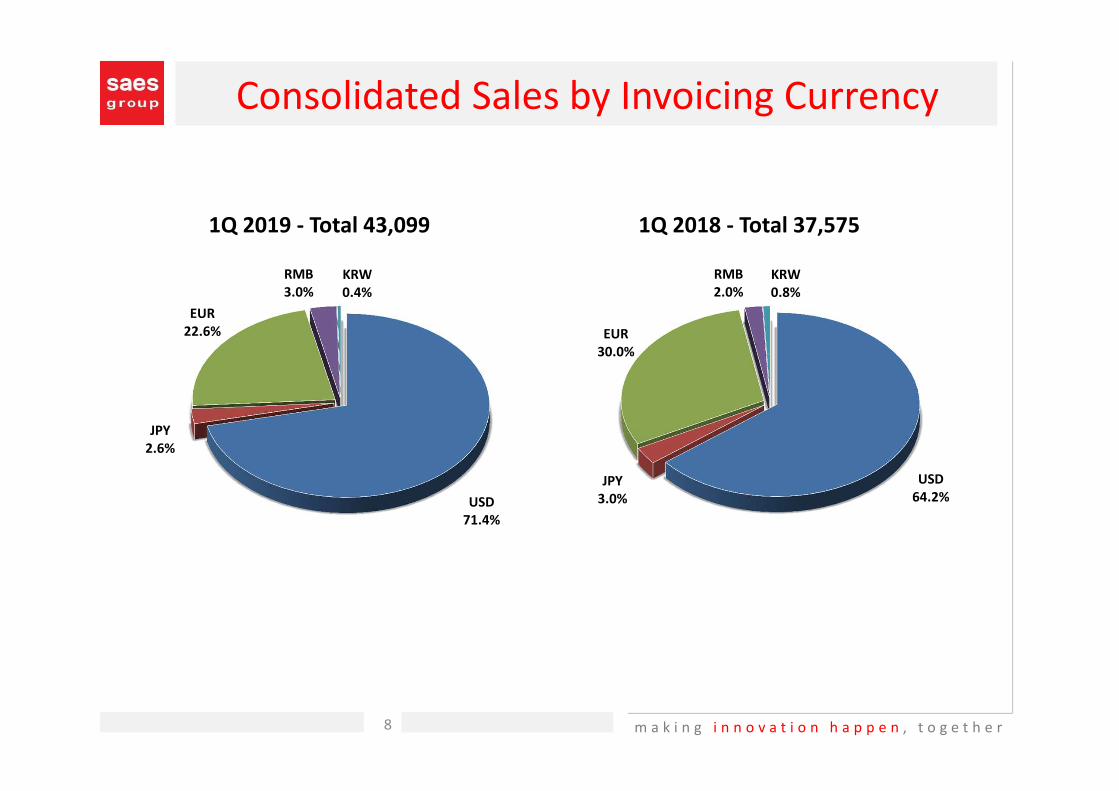
Consolidated Sales by Invoicing Currency
USD
64.2%
JPY
3.0%
EUR
30.0%
RMB
2.0%
KRW
0.8%
1Q 2018 - Total 37,575
USD
71.4%
JPY
2.6%
EUR
22.6%
RMB
3.0%
KRW
0.4%
1Q 2019 - Total 43,099
8
m a k i n g i n n o v a t i o n h a p p e n , t o g e t h e r
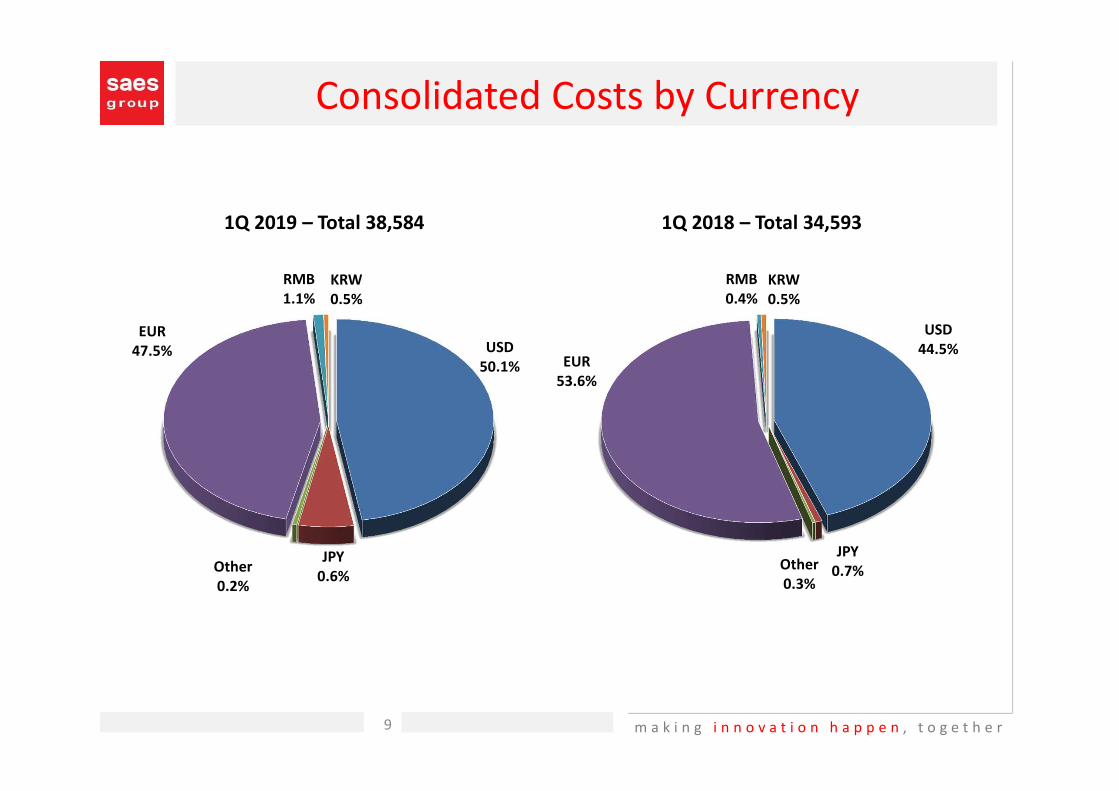
Consolidated Costs by Currency
9
EUR
53.6%
JPY
0.7%Other
0.3%
USD
44.5%
RMB
0.4%
KRW
0.5%
1Q 2018 – Total 34,593
USD
50.1%
JPY
0.6%Other
0.2%
EUR
47.5%
RMB
1.1%
KRW
0.5%
1Q 2019 – Total 38,584
m a k i n g i n n o v a t i o n h a p p e n , t o g e t h e r10
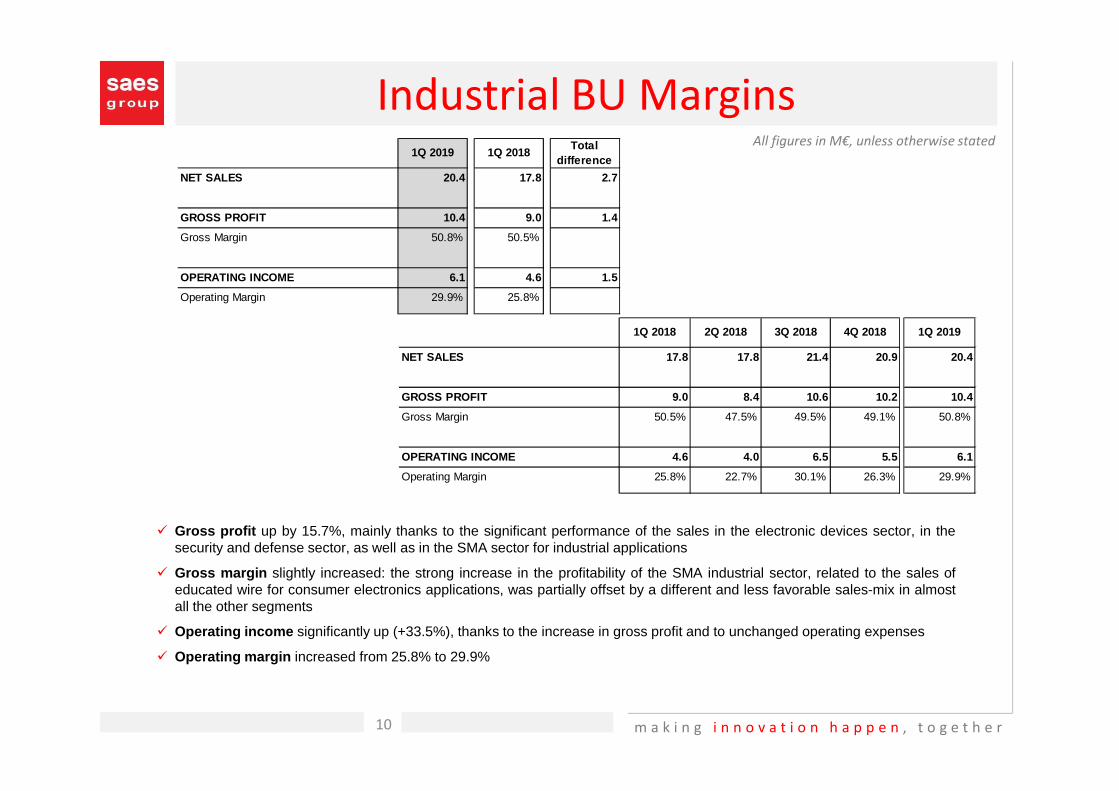
Industrial BU Margins
� Gross profit up by 15.7%, mainly thanks to the significant performance of the sales in the electronic devices sector, in thesecurity and defense sector, as well as in the SMA sector for industrial applications
� Gross margin slightly increased: the strong increase in the profitability of the SMA industrial sector, related to the sales ofeducated wire for consumer electronics applications, was partially offset by a different and less favorable sales-mix in almostall the other segments
� Operating income significantly up (+33.5%), thanks to the increase in gross profit and to unchanged operating expenses
� Operating margin increased from 25.8% to 29.9%
All figures in M€, unless otherwise stated1Q 2019 1Q 2018
Total difference
NET SALES 20.4 17.8 2.7
GROSS PROFIT 10.4 9.0 1.4
Gross Margin 50.8% 50.5%
OPERATING INCOME 6.1 4.6 1.5
Operating Margin 29.9% 25.8%
1Q 2018 2Q 2018 3Q 2018 4Q 2018 1Q 2019
NET SALES 17.8 17.8 21.4 20.9 20.4
GROSS PROFIT 9.0 8.4 10.6 10.2 10.4
Gross Margin 50.5% 47.5% 49.5% 49.1% 50.8%
OPERATING INCOME 4.6 4.0 6.5 5.5 6.1
Operating Margin 25.8% 22.7% 30.1% 26.3% 29.9%
m a k i n g i n n o v a t i o n h a p p e n , t o g e t h e r11
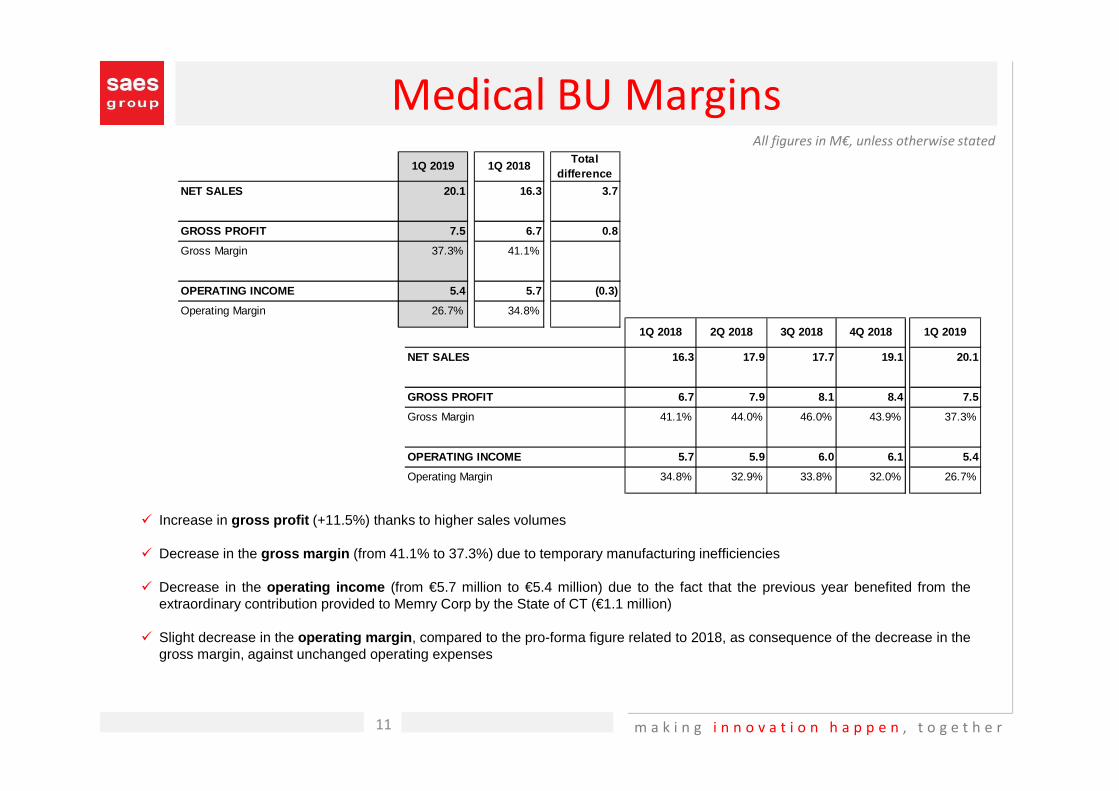
Medical BU Margins All figures in M€, unless otherwise stated
� Increase in gross profit (+11.5%) thanks to higher sales volumes
� Decrease in the gross margin (from 41.1% to 37.3%) due to temporary manufacturing inefficiencies
� Decrease in the operating income (from €5.7 million to €5.4 million) due to the fact that the previous year benefited from theextraordinary contribution provided to Memry Corp by the State of CT (€1.1 million)
� Slight decrease in the operating margin, compared to the pro-forma figure related to 2018, as consequence of the decrease in thegross margin, against unchanged operating expenses
1Q 2018 2Q 2018 3Q 2018 4Q 2018 1Q 2019
NET SALES 16.3 17.9 17.7 19.1 20.1
GROSS PROFIT 6.7 7.9 8.1 8.4 7.5
Gross Margin 41.1% 44.0% 46.0% 43.9% 37.3%
OPERATING INCOME 5.7 5.9 6.0 6.1 5.4
Operating Margin 34.8% 32.9% 33.8% 32.0% 26.7%
1Q 2019 1Q 2018Total
difference
NET SALES 20.1 16.3 3.7
GROSS PROFIT 7.5 6.7 0.8
Gross Margin 37.3% 41.1%
OPERATING INCOME 5.4 5.7 (0.3)
Operating Margin 26.7% 34.8%
m a k i n g i n n o v a t i o n h a p p e n , t o g e t h e r12
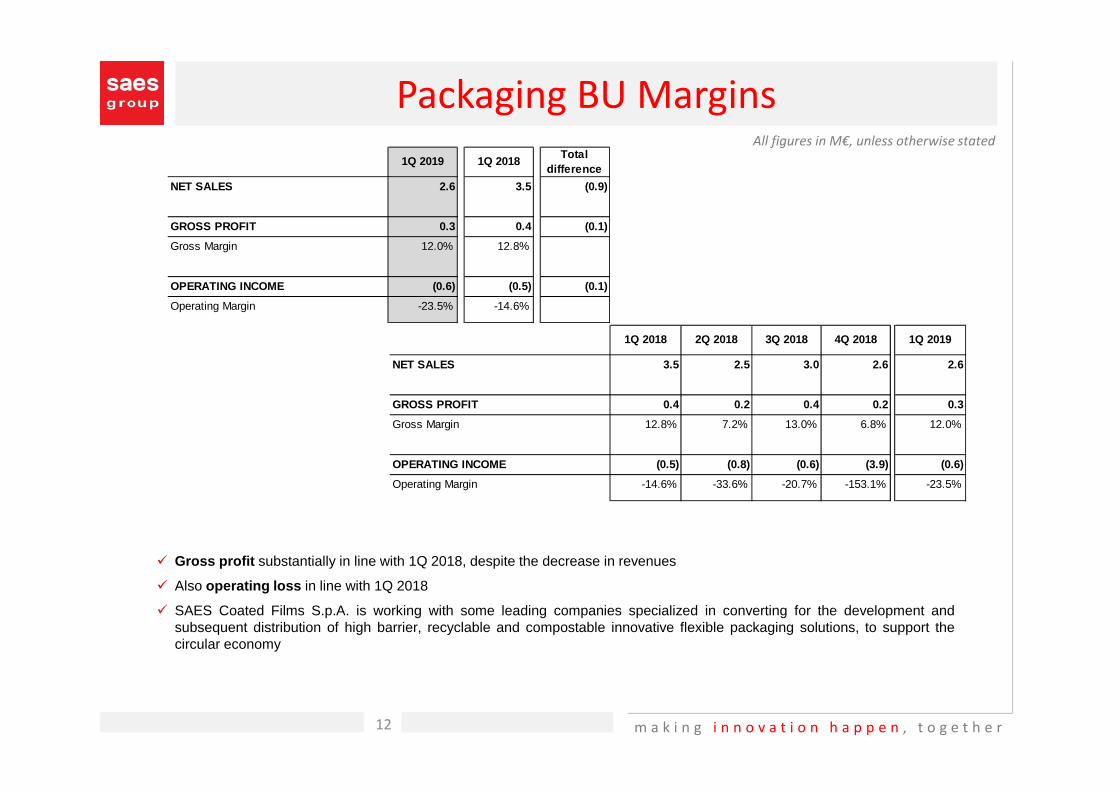
Packaging BU Margins All figures in M€, unless otherwise stated
� Gross profit substantially in line with 1Q 2018, despite the decrease in revenues
� Also operating loss in line with 1Q 2018
� SAES Coated Films S.p.A. is working with some leading companies specialized in converting for the development andsubsequent distribution of high barrier, recyclable and compostable innovative flexible packaging solutions, to support thecircular economy
1Q 2018 2Q 2018 3Q 2018 4Q 2018 1Q 2019
NET SALES 3.5 2.5 3.0 2.6 2.6
GROSS PROFIT 0.4 0.2 0.4 0.2 0.3
Gross Margin 12.8% 7.2% 13.0% 6.8% 12.0%
OPERATING INCOME (0.5) (0.8) (0.6) (3.9) (0.6)
Operating Margin -14.6% -33.6% -20.7% -153.1% -23.5%
1Q 2019 1Q 2018Total
difference
NET SALES 2.6 3.5 (0.9)
GROSS PROFIT 0.3 0.4 (0.1)
Gross Margin 12.0% 12.8%
OPERATING INCOME (0.6) (0.5) (0.1)
Operating Margin -23.5% -14.6%
m a k i n g i n n o v a t i o n h a p p e n , t o g e t h e r
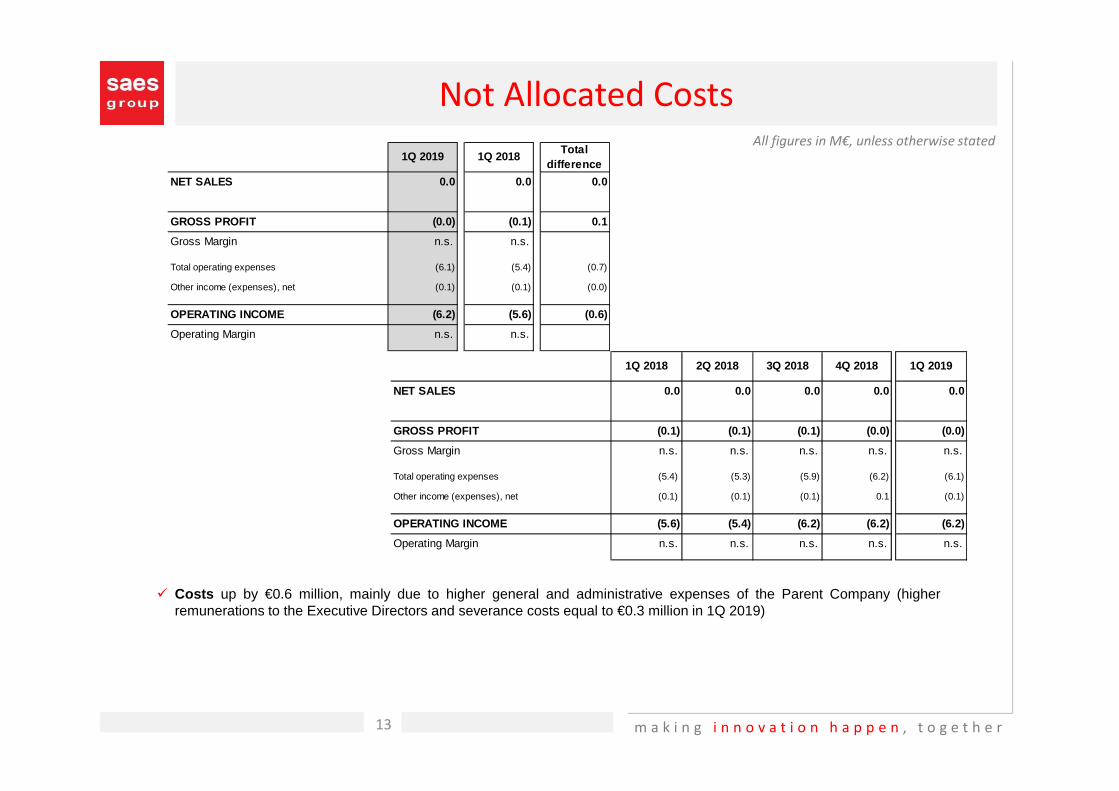
Not Allocated CostsAll figures in M€, unless otherwise stated
� Costs up by €0.6 million, mainly due to higher general and administrative expenses of the Parent Company (higherremunerations to the Executive Directors and severance costs equal to €0.3 million in 1Q 2019)
13
1Q 2019 1Q 2018Total
difference
NET SALES 0.0 0.0 0.0
GROSS PROFIT (0.0) (0.1) 0.1
Gross Margin n.s. n.s.
Total operating expenses (6.1) (5.4) (0.7)
Other income (expenses), net (0.1) (0.1) (0.0)
OPERATING INCOME (6.2) (5.6) (0.6)
Operating Margin n.s. n.s.
1Q 2018 2Q 2018 3Q 2018 4Q 2018 1Q 2019
NET SALES 0.0 0.0 0.0 0.0 0.0
GROSS PROFIT (0.1) (0.1) (0.1) (0.0) (0.0)
Gross Margin n.s. n.s. n.s. n.s. n.s.
Total operating expenses (5.4) (5.3) (5.9) (6.2) (6.1)
Other income (expenses), net (0.1) (0.1) (0.1) 0.1 (0.1)
OPERATING INCOME (5.6) (5.4) (6.2) (6.2) (6.2)
Operating Margin n.s. n.s. n.s. n.s. n.s.
m a k i n g i n n o v a t i o n h a p p e n , t o g e t h e r14
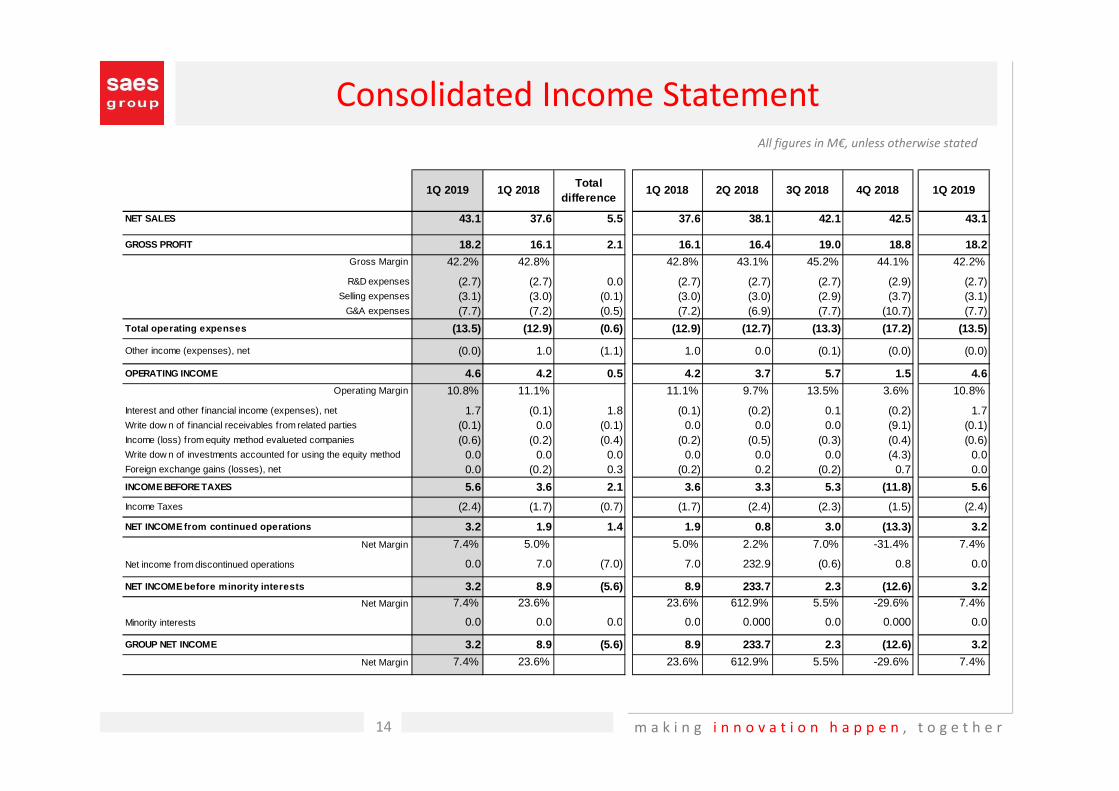
Consolidated Income Statement
All figures in M€, unless otherwise stated
1Q 2019 1Q 2018Total
difference
NET SALES 43.1 37.6 5.5
GROSS PROFIT 18.2 16.1 2.1Gross Margin 42.2% 42.8%
R&D expenses (2.7) (2.7) 0.0Selling expenses (3.1) (3.0) (0.1)
G&A expenses (7.7) (7.2) (0.5)
Total operating expenses (13.5) (12.9) (0.6)
Other income (expenses), net (0.0) 1.0 (1.1)
OPERATING INCOME 4.6 4.2 0.5Operating Margin 10.8% 11.1%
Interest and other f inancial income (expenses), net 1.7 (0.1) 1.8Write dow n of financial receivables from related parties (0.1) 0.0 (0.1)Income (loss) from equity method evalueted companies (0.6) (0.2) (0.4)Write dow n of investments accounted for using the equity method 0.0 0.0 0.0Foreign exchange gains (losses), net 0.0 (0.2) 0.3
INCOME BEFORE TAXES 5.6 3.6 2.1
Income Taxes (2.4) (1.7) (0.7)
NET INCOME from continued operations 3.2 1.9 1.4
Net Margin 7.4% 5.0%
Net income from discontinued operations 0.0 7.0 (7.0)
NET INCOME before minority interests 3.2 8.9 (5.6)Net Margin 7.4% 23.6%
Minority interests 0.0 0.0 0.0
GROUP NET INCOME 3.2 8.9 (5.6)
Net Margin 7.4% 23.6%
1Q 2018 2Q 2018 3Q 2018 4Q 2018 1Q 2019
37.6 38.1 42.1 42.5 43.1
16.1 16.4 19.0 18.8 18.2
42.8% 43.1% 45.2% 44.1% 42.2%
(2.7) (2.7) (2.7) (2.9) (2.7)(3.0) (3.0) (2.9) (3.7) (3.1)(7.2) (6.9) (7.7) (10.7) (7.7)
(12.9) (12.7) (13.3) (17.2) (13.5)
1.0 0.0 (0.1) (0.0) (0.0)
4.2 3.7 5.7 1.5 4.6
11.1% 9.7% 13.5% 3.6% 10.8%
(0.1) (0.2) 0.1 (0.2) 1.70.0 0.0 0.0 (9.1) (0.1)
(0.2) (0.5) (0.3) (0.4) (0.6)0.0 0.0 0.0 (4.3) 0.0
(0.2) 0.2 (0.2) 0.7 0.0
3.6 3.3 5.3 (11.8) 5.6
(1.7) (2.4) (2.3) (1.5) (2.4)
1.9 0.8 3.0 (13.3) 3.2
5.0% 2.2% 7.0% -31.4% 7.4%
7.0 232.9 (0.6) 0.8 0.0
8.9 233.7 2.3 (12.6) 3.223.6% 612.9% 5.5% -29.6% 7.4%
0.0 0.000 0.0 0.000 0.0
8.9 233.7 2.3 (12.6) 3.2
23.6% 612.9% 5.5% -29.6% 7.4%
m a k i n g i n n o v a t i o n h a p p e n , t o g e t h e r15
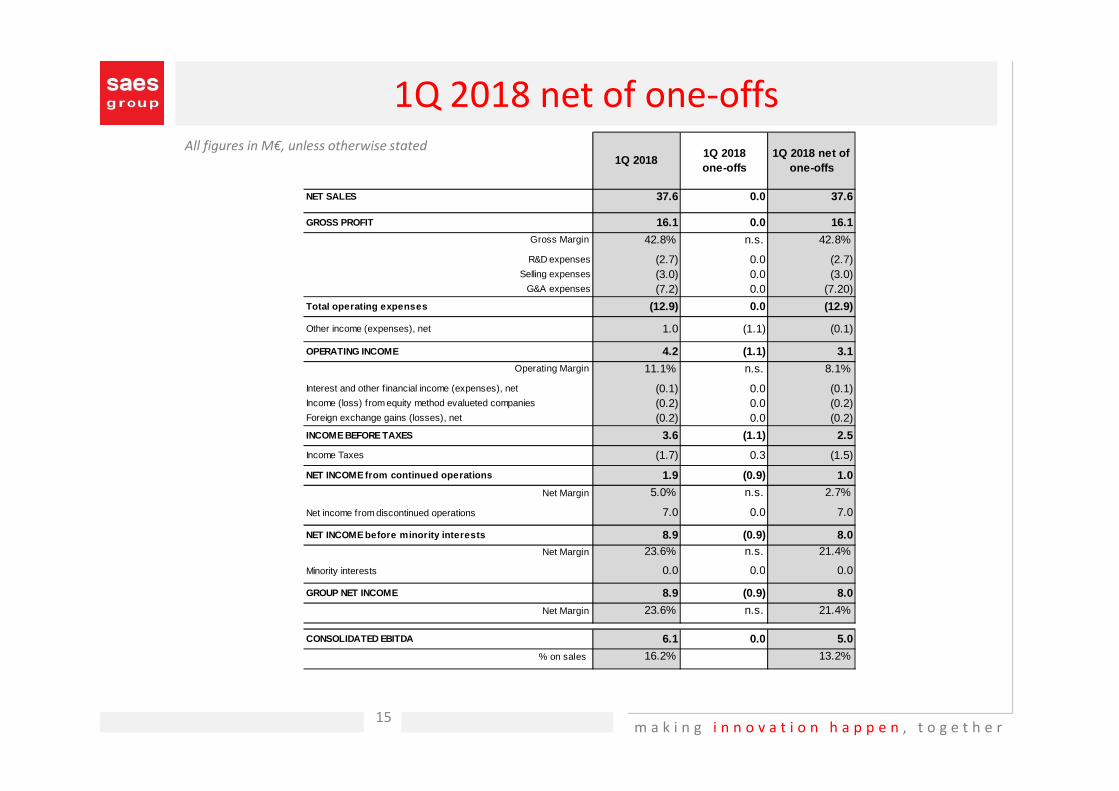
1Q 2018 net of one‐offs
1Q 20181Q 2018 one-offs
1Q 2018 net of one-offs
NET SALES 37.6 0.0 37.6
GROSS PROFIT 16.1 0.0 16.1Gross Margin 42.8% n.s. 42.8%
R&D expenses (2.7) 0.0 (2.7)Selling expenses (3.0) 0.0 (3.0)
G&A expenses (7.2) 0.0 (7.20)
Total operating expenses (12.9) 0.0 (12.9)
Other income (expenses), net 1.0 (1.1) (0.1)
OPERATING INCOME 4.2 (1.1) 3.1Operating Margin 11.1% n.s. 8.1%
Interest and other f inancial income (expenses), net (0.1) 0.0 (0.1)Income (loss) from equity method evalueted companies (0.2) 0.0 (0.2)Foreign exchange gains (losses), net (0.2) 0.0 (0.2)
INCOME BEFORE TAXES 3.6 (1.1) 2.5
Income Taxes (1.7) 0.3 (1.5)
NET INCOME from continued operations 1.9 (0.9) 1.0
Net Margin 5.0% n.s. 2.7%
Net income from discontinued operations 7.0 0.0 7.0
NET INCOME before minority interests 8.9 (0.9) 8.0Net Margin 23.6% n.s. 21.4%
Minority interests 0.0 0.0 0.0
GROUP NET INCOME 8.9 (0.9) 8.0
Net Margin 23.6% n.s. 21.4%
CONSOLIDATED EBITDA 6.1 0.0 5.0
% on sales 16.2% 13.2%
All figures in M€, unless otherwise stated
m a k i n g i n n o v a t i o n h a p p e n , t o g e t h e r16
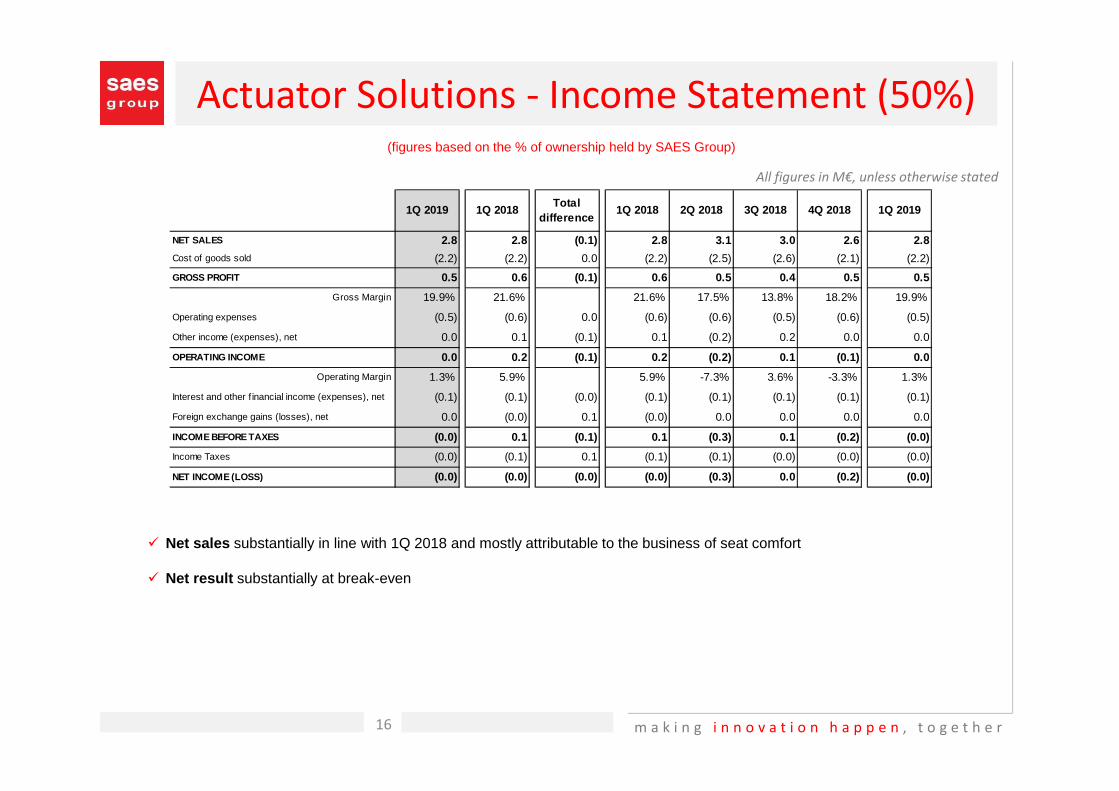
Actuator Solutions ‐ Income Statement (50%)
All figures in M€, unless otherwise stated
(figures based on the % of ownership held by SAES Group)
� Net sales substantially in line with 1Q 2018 and mostly attributable to the business of seat comfort
� Net result substantially at break-even
1Q 2019 1Q 2018Total
difference1Q 2018 2Q 2018 3Q 2018 4Q 2018 1Q 2019
NET SALES 2.8 2.8 (0.1) 2.8 3.1 3.0 2.6 2.8
Cost of goods sold (2.2) (2.2) 0.0 (2.2) (2.5) (2.6) (2.1) (2.2)
GROSS PROFIT 0.5 0.6 (0.1) 0.6 0.5 0.4 0.5 0.5
Gross Margin 19.9% 21.6% 21.6% 17.5% 13.8% 18.2% 19.9%
Operating expenses (0.5) (0.6) 0.0 (0.6) (0.6) (0.5) (0.6) (0.5)
Other income (expenses), net 0.0 0.1 (0.1) 0.1 (0.2) 0.2 0.0 0.0
OPERATING INCOME 0.0 0.2 (0.1) 0.2 (0.2) 0.1 (0.1) 0.0
Operating Margin 1.3% 5.9% 5.9% -7.3% 3.6% -3.3% 1.3%
Interest and other f inancial income (expenses), net (0.1) (0.1) (0.0) (0.1) (0.1) (0.1) (0.1) (0.1)
Foreign exchange gains (losses), net 0.0 (0.0) 0.1 (0.0) 0.0 0.0 0.0 0.0
INCOME BEFORE TAXES (0.0) 0.1 (0.1) 0.1 (0.3) 0.1 (0.2) (0.0)
Income Taxes (0.0) (0.1) 0.1 (0.1) (0.1) (0.0) (0.0) (0.0)
NET INCOME (LOSS) (0.0) (0.0) (0.0) (0.0) (0.3) 0.0 (0.2) (0.0)
m a k i n g i n n o v a t i o n h a p p e n , t o g e t h e r17
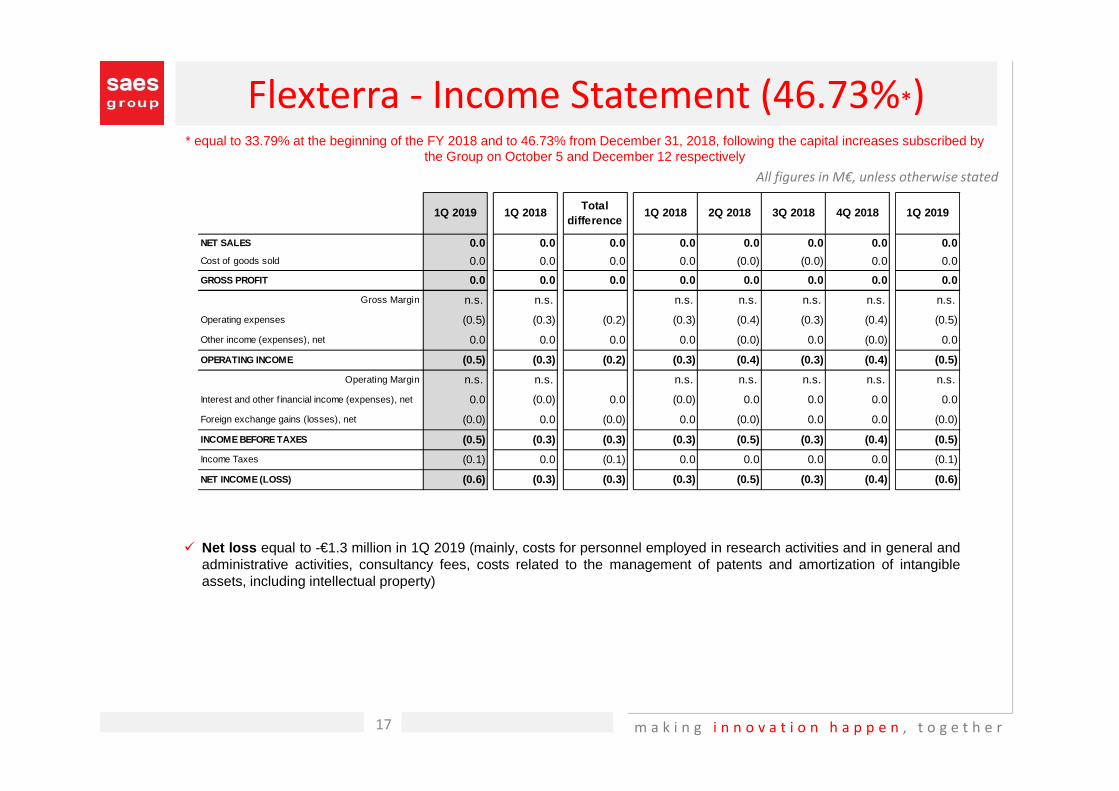
Flexterra ‐ Income Statement (46.73%*)
All figures in M€, unless otherwise stated
� Net loss equal to -€1.3 million in 1Q 2019 (mainly, costs for personnel employed in research activities and in general andadministrative activities, consultancy fees, costs related to the management of patents and amortization of intangibleassets, including intellectual property)
1Q 2019 1Q 2018Total
difference1Q 2018 2Q 2018 3Q 2018 4Q 2018 1Q 2019
NET SALES 0.0 0.0 0.0 0.0 0.0 0.0 0.0 0.0
Cost of goods sold 0.0 0.0 0.0 0.0 (0.0) (0.0) 0.0 0.0
GROSS PROFIT 0.0 0.0 0.0 0.0 0.0 0.0 0.0 0.0
Gross Margin n.s. n.s. n.s. n.s. n.s. n.s. n.s.
Operating expenses (0.5) (0.3) (0.2) (0.3) (0.4) (0.3) (0.4) (0.5)
Other income (expenses), net 0.0 0.0 0.0 0.0 (0.0) 0.0 (0.0) 0.0
OPERATING INCOME (0.5) (0.3) (0.2) (0.3) (0.4) (0.3) (0.4) (0.5)
Operating Margin n.s. n.s. n.s. n.s. n.s. n.s. n.s.
Interest and other f inancial income (expenses), net 0.0 (0.0) 0.0 (0.0) 0.0 0.0 0.0 0.0
Foreign exchange gains (losses), net (0.0) 0.0 (0.0) 0.0 (0.0) 0.0 0.0 (0.0)
INCOME BEFORE TAXES (0.5) (0.3) (0.3) (0.3) (0.5) (0.3) (0.4) (0.5)
Income Taxes (0.1) 0.0 (0.1) 0.0 0.0 0.0 0.0 (0.1)
NET INCOME (LOSS) (0.6) (0.3) (0.3) (0.3) (0.5) (0.3) (0.4) (0.6)
* equal to 33.79% at the beginning of the FY 2018 and to 46.73% from December 31, 2018, following the capital increases subscribed by the Group on October 5 and December 12 respectively
m a k i n g i n n o v a t i o n h a p p e n , t o g e t h e r
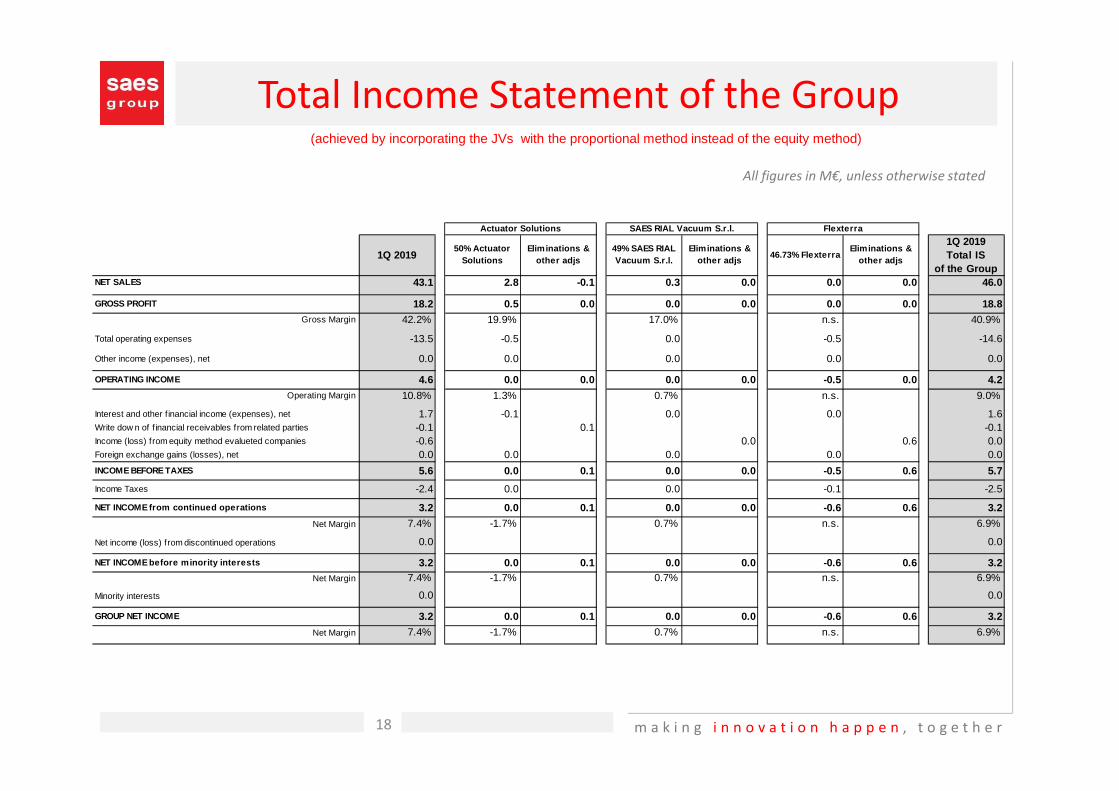
Total Income Statement of the Group
All figures in M€, unless otherwise stated
(achieved by incorporating the JVs with the proportional method instead of the equity method)
18
1Q 201950% Actuator
SolutionsEliminations &
other adjs49% SAES RIAL Vacuum S.r.l.
Eliminations & other adjs
46.73% FlexterraEliminations &
other adjs
1Q 2019Total IS
of the GroupNET SALES 43.1 2.8 -0.1 0.3 0.0 0.0 0.0 46.0
GROSS PROFIT 18.2 0.5 0.0 0.0 0.0 0.0 0.0 18.8Gross Margin 42.2% 19.9% 17.0% n.s. 40.9%
Total operating expenses -13.5 -0.5 0.0 -0.5 -14.6
Other income (expenses), net 0.0 0.0 0.0 0.0 0.0
OPERATING INCOME 4.6 0.0 0.0 0.0 0.0 -0.5 0.0 4.2Operating Margin 10.8% 1.3% 0.7% n.s. 9.0%
Interest and other f inancial income (expenses), net 1.7 -0.1 0.0 0.0 1.6Write dow n of f inancial receivables from related parties -0.1 0.1 -0.1Income (loss) from equity method evalueted companies -0.6 0.0 0.6 0.0Foreign exchange gains (losses), net 0.0 0.0 0.0 0.0 0.0
INCOME BEFORE TAXES 5.6 0.0 0.1 0.0 0.0 -0.5 0.6 5.7
Income Taxes -2.4 0.0 0.0 -0.1 -2.5
NET INCOME from continued operations 3.2 0.0 0.1 0.0 0.0 -0.6 0.6 3.2
Net Margin 7.4% -1.7% 0.7% n.s. 6.9%
Net income (loss) from discontinued operations 0.0 0.0
NET INCOME before minority interests 3.2 0.0 0.1 0.0 0.0 -0.6 0.6 3.2Net Margin 7.4% -1.7% 0.7% n.s. 6.9%
Minority interests 0.0 0.0
GROUP NET INCOME 3.2 0.0 0.1 0.0 0.0 -0.6 0.6 3.2
Net Margin 7.4% -1.7% 0.7% n.s. 6.9%
Actuator Solutions SAES RIAL Vacuum S.r.l. Flexterra
m a k i n g i n n o v a t i o n h a p p e n , t o g e t h e r19
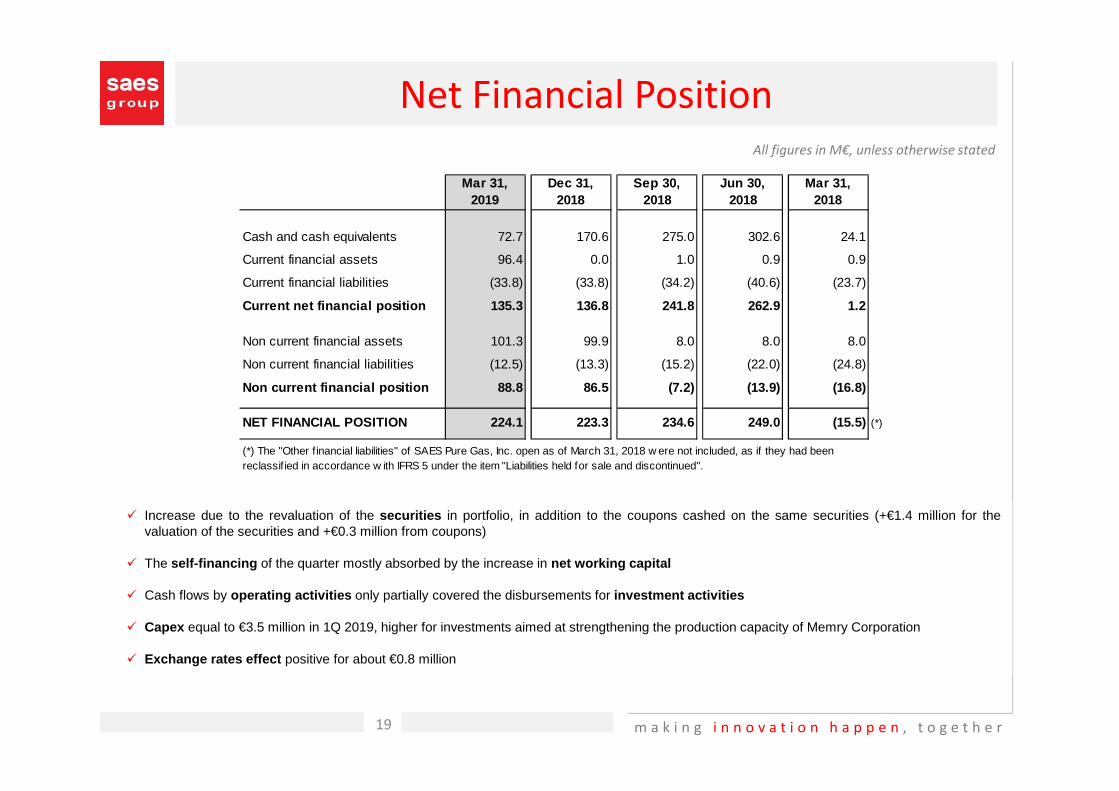
Net Financial Position
All figures in M€, unless otherwise stated
� Increase due to the revaluation of the securities in portfolio, in addition to the coupons cashed on the same securities (+€1.4 million for thevaluation of the securities and +€0.3 million from coupons)
� The self-financing of the quarter mostly absorbed by the increase in net working capital
� Cash flows by operating activities only partially covered the disbursements for investment activities
� Capex equal to €3.5 million in 1Q 2019, higher for investments aimed at strengthening the production capacity of Memry Corporation
� Exchange rates effect positive for about €0.8 million
Mar 31, 2019
Dec 31, 2018
Sep 30, 2018
Jun 30, 2018
Mar 31, 2018
Cash and cash equivalents 72.7 170.6 275.0 302.6 24.1
Current financial assets 96.4 0.0 1.0 0.9 0.9
Current financial liabilities (33.8) (33.8) (34.2) (40.6) (23.7)
Current net financial position 135.3 136.8 241.8 262.9 1.2
Non current financial assets 101.3 99.9 8.0 8.0 8.0
Non current financial liabilities (12.5) (13.3) (15.2) (22.0) (24.8)
Non current financial position 88.8 86.5 (7.2) (13.9) (16.8)
NET FINANCIAL POSITION 224.1 223.3 234.6 249.0 (15.5) (*)
(*) The "Other f inancial liabilities" of SAES Pure Gas, Inc. open as of March 31, 2018 w ere not included, as if they had been reclassif ied in accordance w ith IFRS 5 under the item "Liabilities held for sale and discontinued".
m a k i n g i n n o v a t i o n h a p p e n , t o g e t h e r20
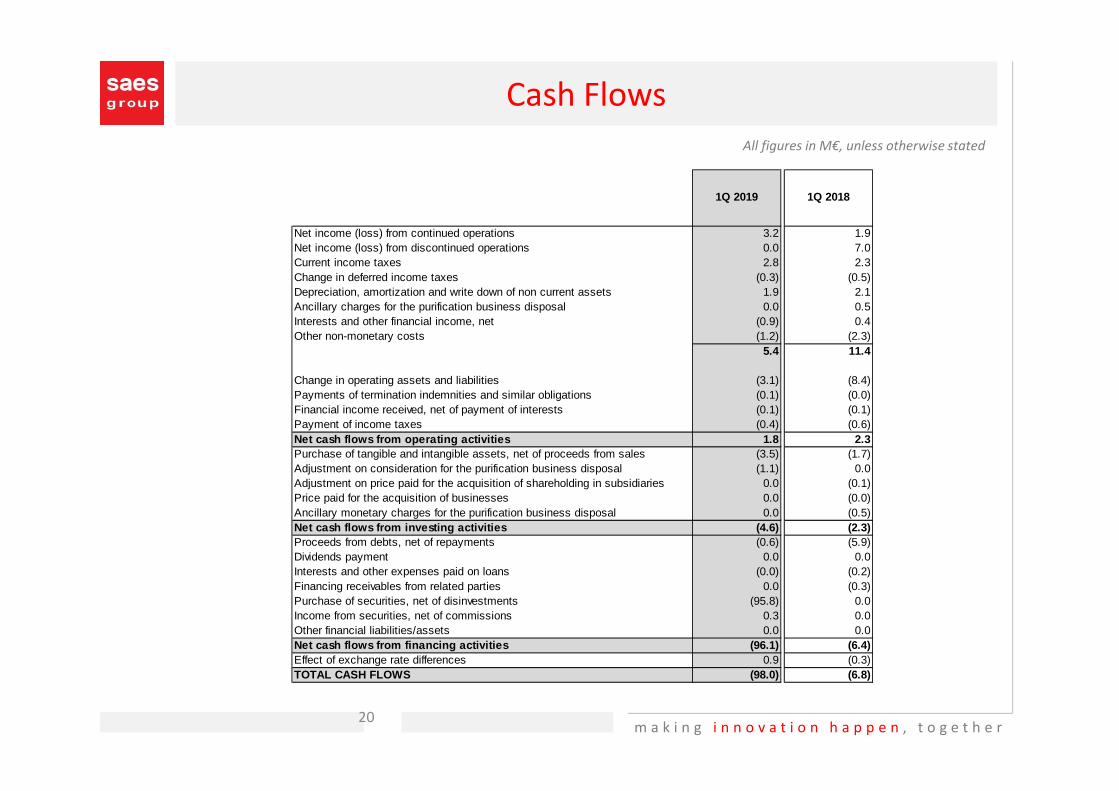
Cash Flows
All figures in M€, unless otherwise stated
Net income (loss) from continued operations 3.2 1.9Net income (loss) from discontinued operations 0.0 7.0Current income taxes 2.8 2.3Change in deferred income taxes (0.3) (0.5)Depreciation, amortization and write down of non current assets 1.9 2.1Ancillary charges for the purification business disposal 0.0 0.5Interests and other financial income, net (0.9) 0.4Other non-monetary costs (1.2) (2.3)
5.4 11.4
Change in operating assets and liabilities (3.1) (8.4)Payments of termination indemnities and similar obligations (0.1) (0.0)Financial income received, net of payment of interests (0.1) (0.1)Payment of income taxes (0.4) (0.6)Net cash flows from operating activities 1.8 2.3Purchase of tangible and intangible assets, net of proceeds from sales (3.5) (1.7)Adjustment on consideration for the purification business disposal (1.1) 0.0Adjustment on price paid for the acquisition of shareholding in subsidiaries 0.0 (0.1)Price paid for the acquisition of businesses 0.0 (0.0)Ancillary monetary charges for the purification business disposal 0.0 (0.5)Net cash flows from investing activities (4.6) (2.3)Proceeds from debts, net of repayments (0.6) (5.9)Dividends payment 0.0 0.0Interests and other expenses paid on loans (0.0) (0.2)Financing receivables from related parties 0.0 (0.3)Purchase of securities, net of disinvestments (95.8) 0.0Income from securities, net of commissions 0.3 0.0Other financial liabilities/assets 0.0 0.0Net cash flows from financing activities (96.1) (6.4)Effect of exchange rate differences 0.9 (0.3)TOTAL CASH FLOWS (98.0) (6.8)
1Q 2019 1Q 2018
m a k i n g i n n o v a t i o n h a p p e n , t o g e t h e r21
�Positive outlook for the year
�Constant attention to the recent increase inuncertainties and pressures at international level
Business Outlook
m a k i n g i n n o v a t i o n h a p p e n , t o g e t h e r22
Disclaimer and Attestation
This presentation contains forward‐looking statements which are based upon current expectations and involve a number of risks and
uncertainties. There are a number of important factors that could cause actual results to differ materially from those expressed in any forward‐
looking statements made by the Company. These factors include the Company’s ability to introduce new products at planned costs and on planned
schedules, the Company’s ability to maintain key client relationships and the environments of the various economies in the countries the Company
conducts business. The Company cautions that the foregoing list of important factors is not exclusive. The Company undertakes no obligation to
publicly release the result of any revision to these forward‐looking statements which may be made to reflect events or circumstances after the
date hereof or to reflect the occurrence of unanticipated events.
***
The Officer Responsible for the preparation of corporate financial reports of SAES Getters S.p.A. certifies that, in accordance with the second
subsection of article 154‐bis, part IV, title III, second paragraph, section V‐bis, of Legislative Decree February 24, 1998, no. 58, the financial
information included in the present document corresponds to book of account and book‐keeping entries.
The Officer Responsible for the preparation of corporate financial reports
Giulio Canale
SAES® is a registered trademark of SAES Getters S.p.A.

w w w. s a e s g e t t e r s . c o m
Thanks for your attention
E‐mail: investor_relations@saes‐group.com