Embed Size (px)
Citation preview
This poster is one of a series of three, designed by Stella Dudzic. The series includes: Hypothesis tests for one sample, Hypothesis tests for two samples, and Experimental Design and Hypothesis tests for several samples: ANOVA (Analysis of Variance)To view the other two posters and to place orders for these and for extra sets of all three posters, please visit the MEI website at www.mei.org.ukThe set of three posters is also available in a simplified format (on CD) to print in A4 size for student folders or for use on a whiteboard. Included on the CD are test statistics for one and two samples, and worked examples for analysis of variance (ANOVA).
Are the samples from populations with equal variance?
Use replication, i.e.get several values for each level of the factor
One-way analysis of variance (one between subjects factor)
Are the populations Normal (at least approximately)?
Testing whether all means are equal
Are there any “nuisance” factors?
How many factors of key interest are there?
Might the “nuisance” factors interact with each otherand/or the factor of interest?
NoHow many “nuisance” factors are there?
Use each level of the “nuisance” factor as a block
Is it possible to include each level of the factor of interest in each block?
Randomised block design. Possibly replication
Are the samples from populations with equal variance, which are at least approximately Normal?
Testing whether all means are equal, for each factor
Analysis of variance for randomised blocks
Beyond the scope of this poster, possibly Friedman's two-way analysis of variance by rank
Are the number of levels the same for all three factors?
Testing whether all means are equal, for each factor
Analysis of variance for Latin square
How many “nuisance” factors are there?
Are there any “nuisance” factors?
Are the samples from populations with equal variance and at least approximately Normal?
Have you used replication?
Might the factors interact with each other? Two-way analysis of
variance (two between subjects factors)
For each combination of factors, does the population have the same variance and is it at least approximately Normal?
Possibly balanced incomplete blocks or partially balanced incomplete blocks
Kruskal-Wallis one-way analysis of variance
One
Two
Yes
No
Yes
No
Yes
No
Yes
No
One
Two
Yes
No
Yes
No
Yes
No
Yes
No
One
Yes
No
Yes
No
YesYes
No
YesNo
No
More advanced techniques needed (e.g. transformations or General Linear Model). Beyond the scope of this poster
Analysis beyond the scope of this poster
Latin square design
Specialised design (possibly Graeco Latin square)
Specialised design beyond the scope of this poster
Analysis beyond the scope of this poster
No suitable common testMore than two
Use a two way factorial design with randomisation and, possibly, replication
Analysis similar to that for two factors of key interest
Possibly factorial design Analysis beyond the scope of this poster
Two or more
More than two
Beyond the scope of this poster
Use a two way factorial design with randomisation and, possibly, replication
Beyond the scope of this poster Beyond the scope of this poster
Are you prepared to assume that the factors do not interact?
Testing whether all means are equal, for each factor
Testing whether all means are equal, for each factor, and whether interactions between factors exist
No simple general procedure - beyond the scope of this poster
Two-way analysis of variance(no interaction)
Two-way analysis of variance, with interaction interpreted as residual
See
www.winterolympics.external.bbc.co.uk/event-results-schedules/index.htmlfor results from theWinter Olympics
This poster is also available as a download to print in A4 size for student folders or for use on a whiteboard. Please visit www.mei.org.uk for more information.This poster is one of a series of three, produced by Stella Dudzic for MEI.
This poster is one of a series of three, designed by Stella Dudzic. The series includes: Hypothesis tests for one sample, Hypothesis tests for two samples, and Experimental Design and Hypothesis tests for several samples: ANOVA (Analysis of Variance)To view the other two posters and to place orders for these and for extra sets of all three posters, please visit the MEI website at www.mei.org.ukThe set of three posters is also available in a simplified format (on CD) to print in A4 size for student folders or for use on a whiteboard. Included on the CD are test statistics for one and two samples, and worked examples for analysis of variance (ANOVA).
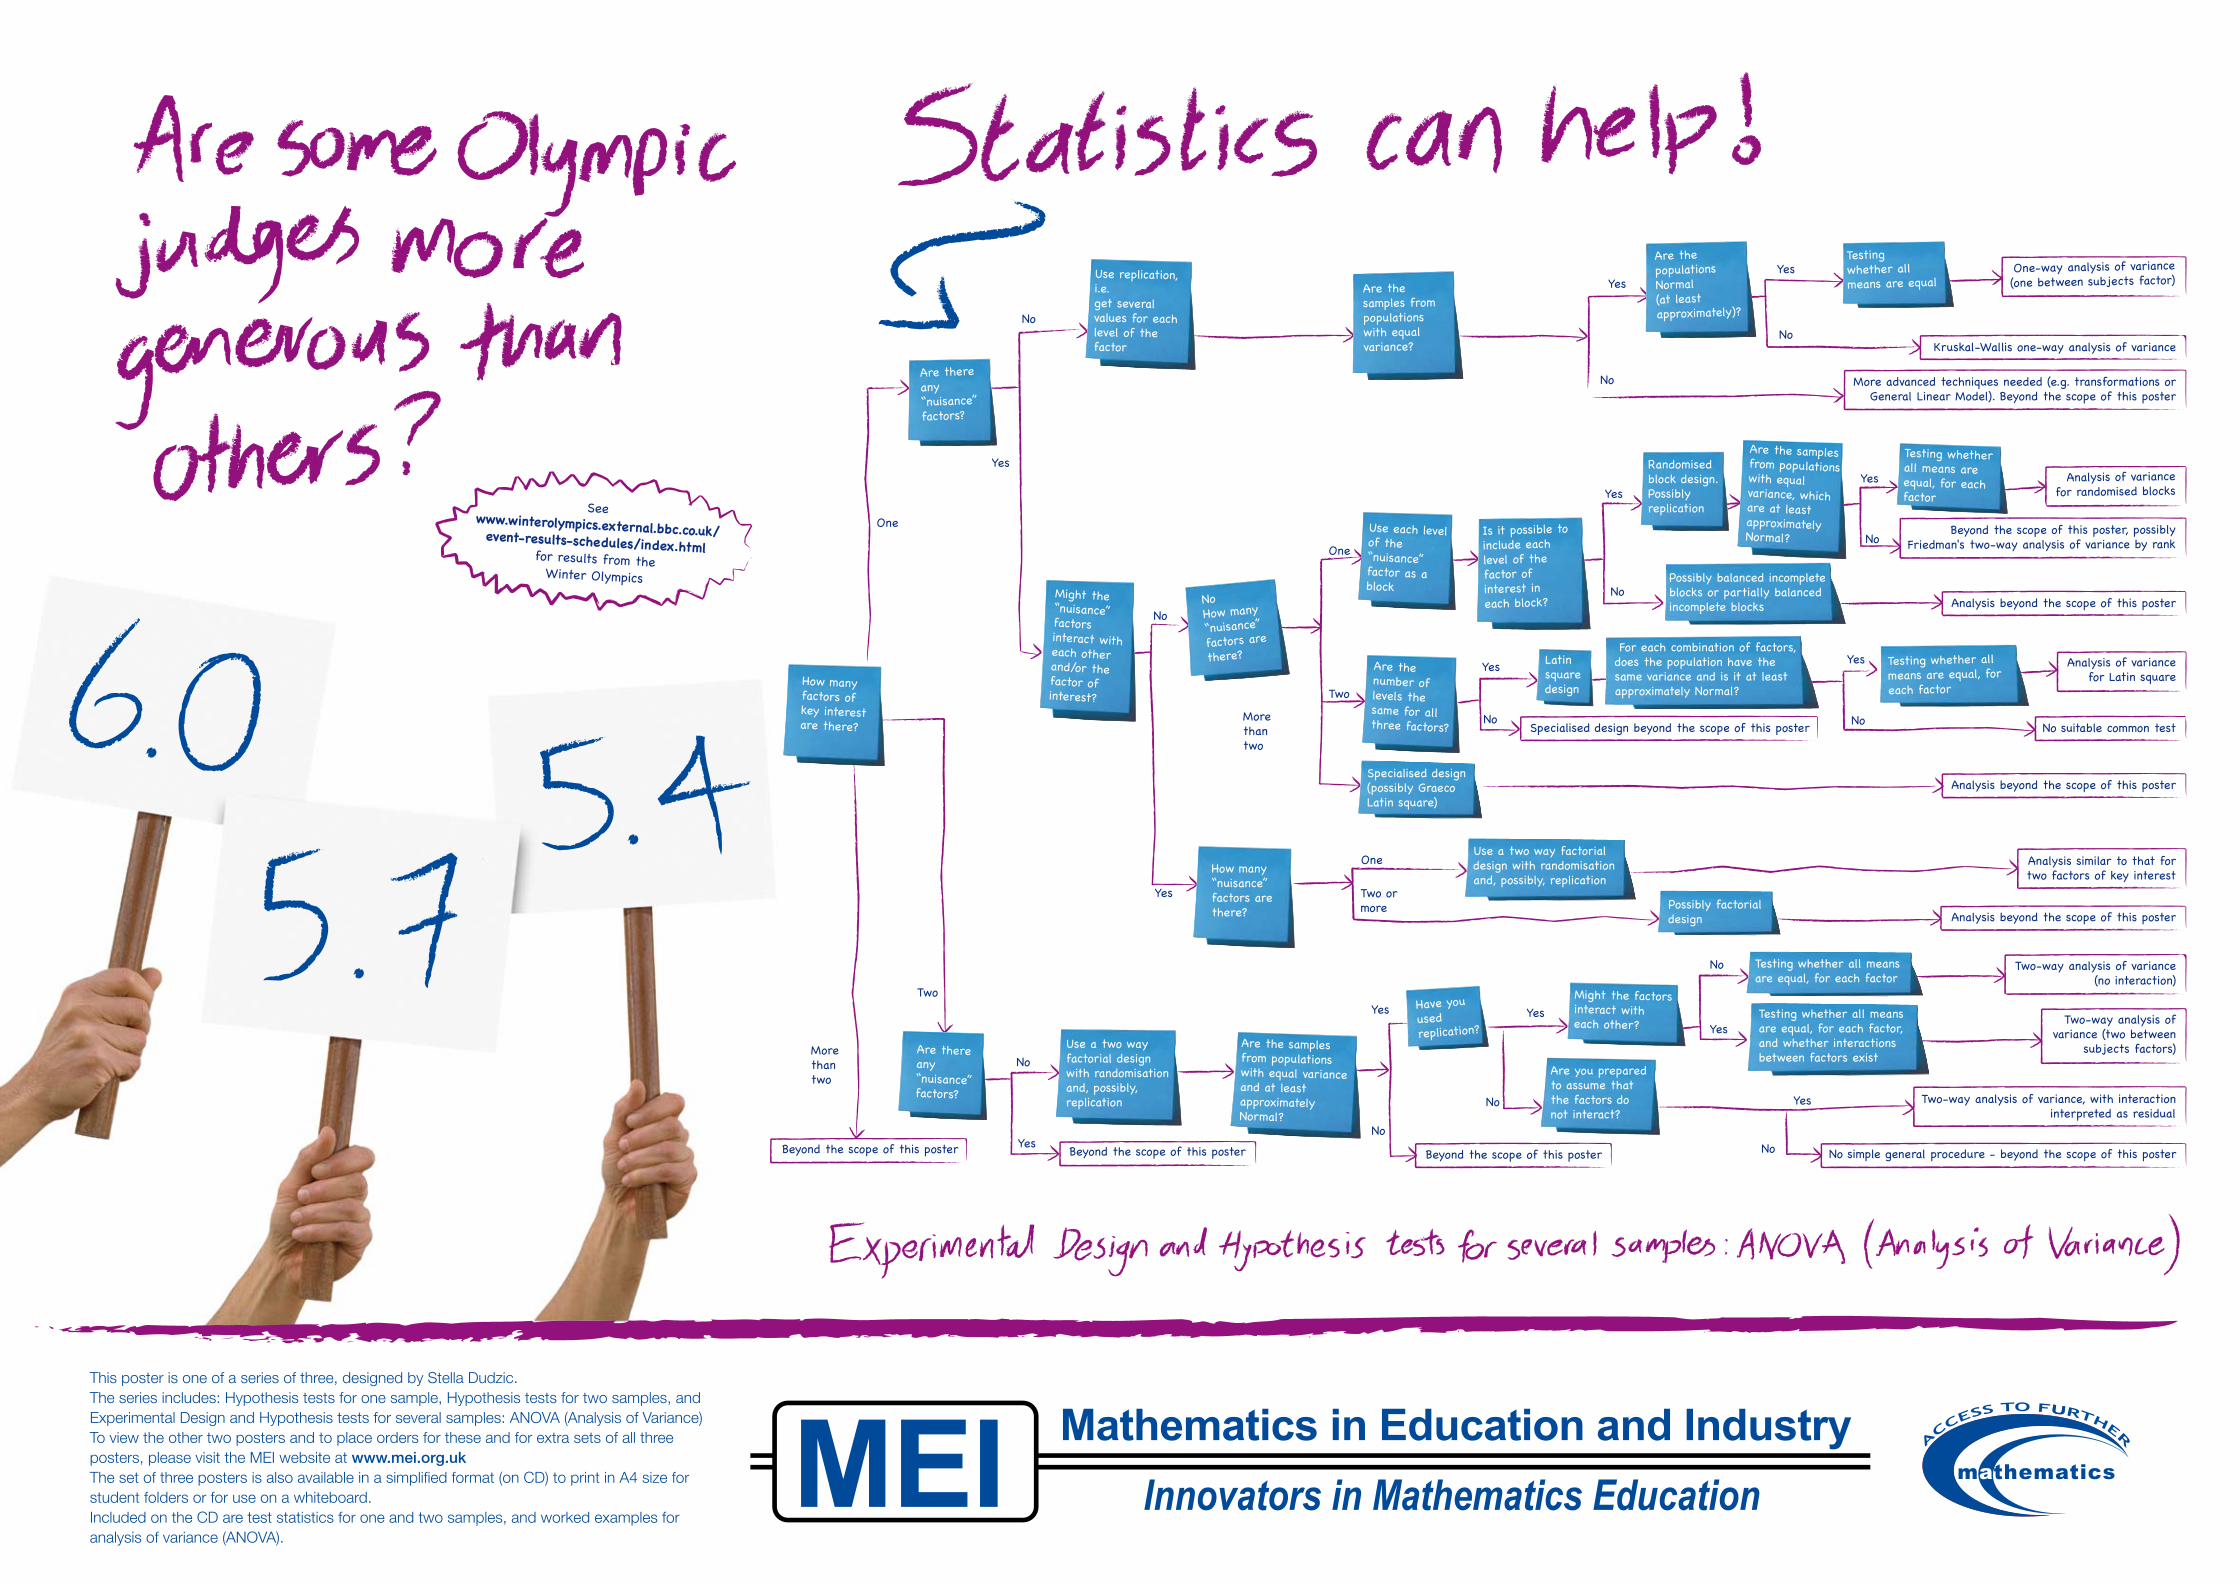
Are the data single variable or bivariate?
Single variable
Test on variance
Test of proportion Binomial test or Normal approximation
For Normal population 2 test for variance�
Are the data in a frequency table with expected frequency of at least 5 for each group?
Goodness of �t test
Yes test or Kolmogorov-Smirnov 2�
No Kolmogorov-Smirnov test
Categories in a contingency table
Bivariate data
Spearman’s rank correlation test or Kendall’s rank correlation test
No
Yes Pearson’s product moment correlation test
Are the variables categories or numbers? Number pairs Are the data from a bivariate
Normal distribution?
2 test�
Test on mean/median
Do you have a large sample?
Symmetrical distribution
Poisson
What distribution are the data from?
Yes Do you know the variance?
Yes Normal test
No 2Estimate variance as
and use Normal tests
No
No
Are the data from a Normal distribution?
Yes Yes
Do you know the variance?
Other Sign test
Wilcoxon single sample test
Poisson test
Normal test
2Estimate variance as and use test
st
Hypothesis tests for one sample
Contingency table male female
right handed 32 28
left handed 7 5
Test statistic for Kolmogorov-Smirnov test
N(0, 1) probability density
No
With a large set of data, the scatter diagram for a bivariate Normal distribution is approximately elliptical.
Test statistics for all these tests can be found at www.mei.org.uk/teachersupport There are some specialised tests which are not included on this poster. © MEI 2008
Use replication, i.e.get several values for each level of the factor.
No
Test on mean/median
Do you have a large sample?
Do you know the variance?
Normal test
Estimate variance as s²and use Normal test
Normal test
Estimate variance as s²and use t test
Are the data from a Normal distribution?
Do you know the variance?
What distribution are the data from?Are the
data single variable or bivariate? Test on
varianceFor Normal population
Test of proportion
Goodness of fit test
Poisson
Symmetrical Distribution
Other
Poisson test
Wilcoxon singlesample test
Sign test
Binomial test or Normal approximation
Pearson’s productmoment correlation test
Spearman’s rankcorrelation test or Kendall’srank correlation test
Test statistics for all these tests can be found at www.mei.org.uk/teachersupportThere are some specialised tests which are not included on this poster.
Are the datafrom a bivariate Normal distribution?(see fig 2)
Number pairs
Are thevariablescategories or numbers?
Bivariatedata
Singlevariable
Categories in a contingency table (see fig 1)
With a large set of data, the scatter diagram for a bivariate Normal distribution is approximately elliptical
Test statistic for Kolmogorov-Smirnov test
x0
0.25
0.5
0.75
1
cum
ulat
ive
pro
bab
ility
observed
EXPECTED
D
N(0,1) probability density
0
No
Yes
Yes
No
Yes
No
Yes
No
Yes
Contingency table
Male female
righthanded
lefthanded
32 28
7 5
fig 2 fig 3
fig 4.
fig 1
38 has come up 213 times to end March 2010 but 20 has only come up 148 times. See www.lottery.co.uk/statistics/ for data. You could use a goodness of fit test to check if there is evidence that the lottery is not fair.
38 has come up 213 times to end March 2010 but 20 has only come
up 148 times
See www.lottery.co.uk/statistics/
for data
You could use a goodness of fit test to check if there is evidence that the lottery is not fair
test for variance
test or Kolmogorov-Smirnov (see fig 3)
test
Are the data in a frequency table with expected frequency of at least 5 for each group? Kolmogorov-Smirnov testNo
Yes test or Kolmogorov-Smirnov (see fig 3.)
In the National lottery any one ticket has exactly the same odds of winning as any other ticket right?....
If the national lottery was fair, we wouldexpect each number to be chosenthe same number of times, right?
This poster is also available as a download to print in A4 size for student folders or for use on a whiteboard. Please visit www.mei.org.uk for more information.This poster is one of a series of three, produced by Stella Dudzic for MEI.
This poster is one of a series of three, designed by Stella Dudzic. The series includes: Hypothesis tests for one sample, Hypothesis tests for two samples, and Experimental Design and Hypothesis tests for several samples: ANOVA (Analysis of Variance)To view the other two posters and to place orders for these and for extra sets of all three posters, please visit the MEI website at www.mei.org.ukThe set of three posters is also available in a simplified format (on CD) to print in A4 size for student folders or for use on a whiteboard. Included on the CD are test statistics for one and two samples, and worked examples for analysis of variance (ANOVA).
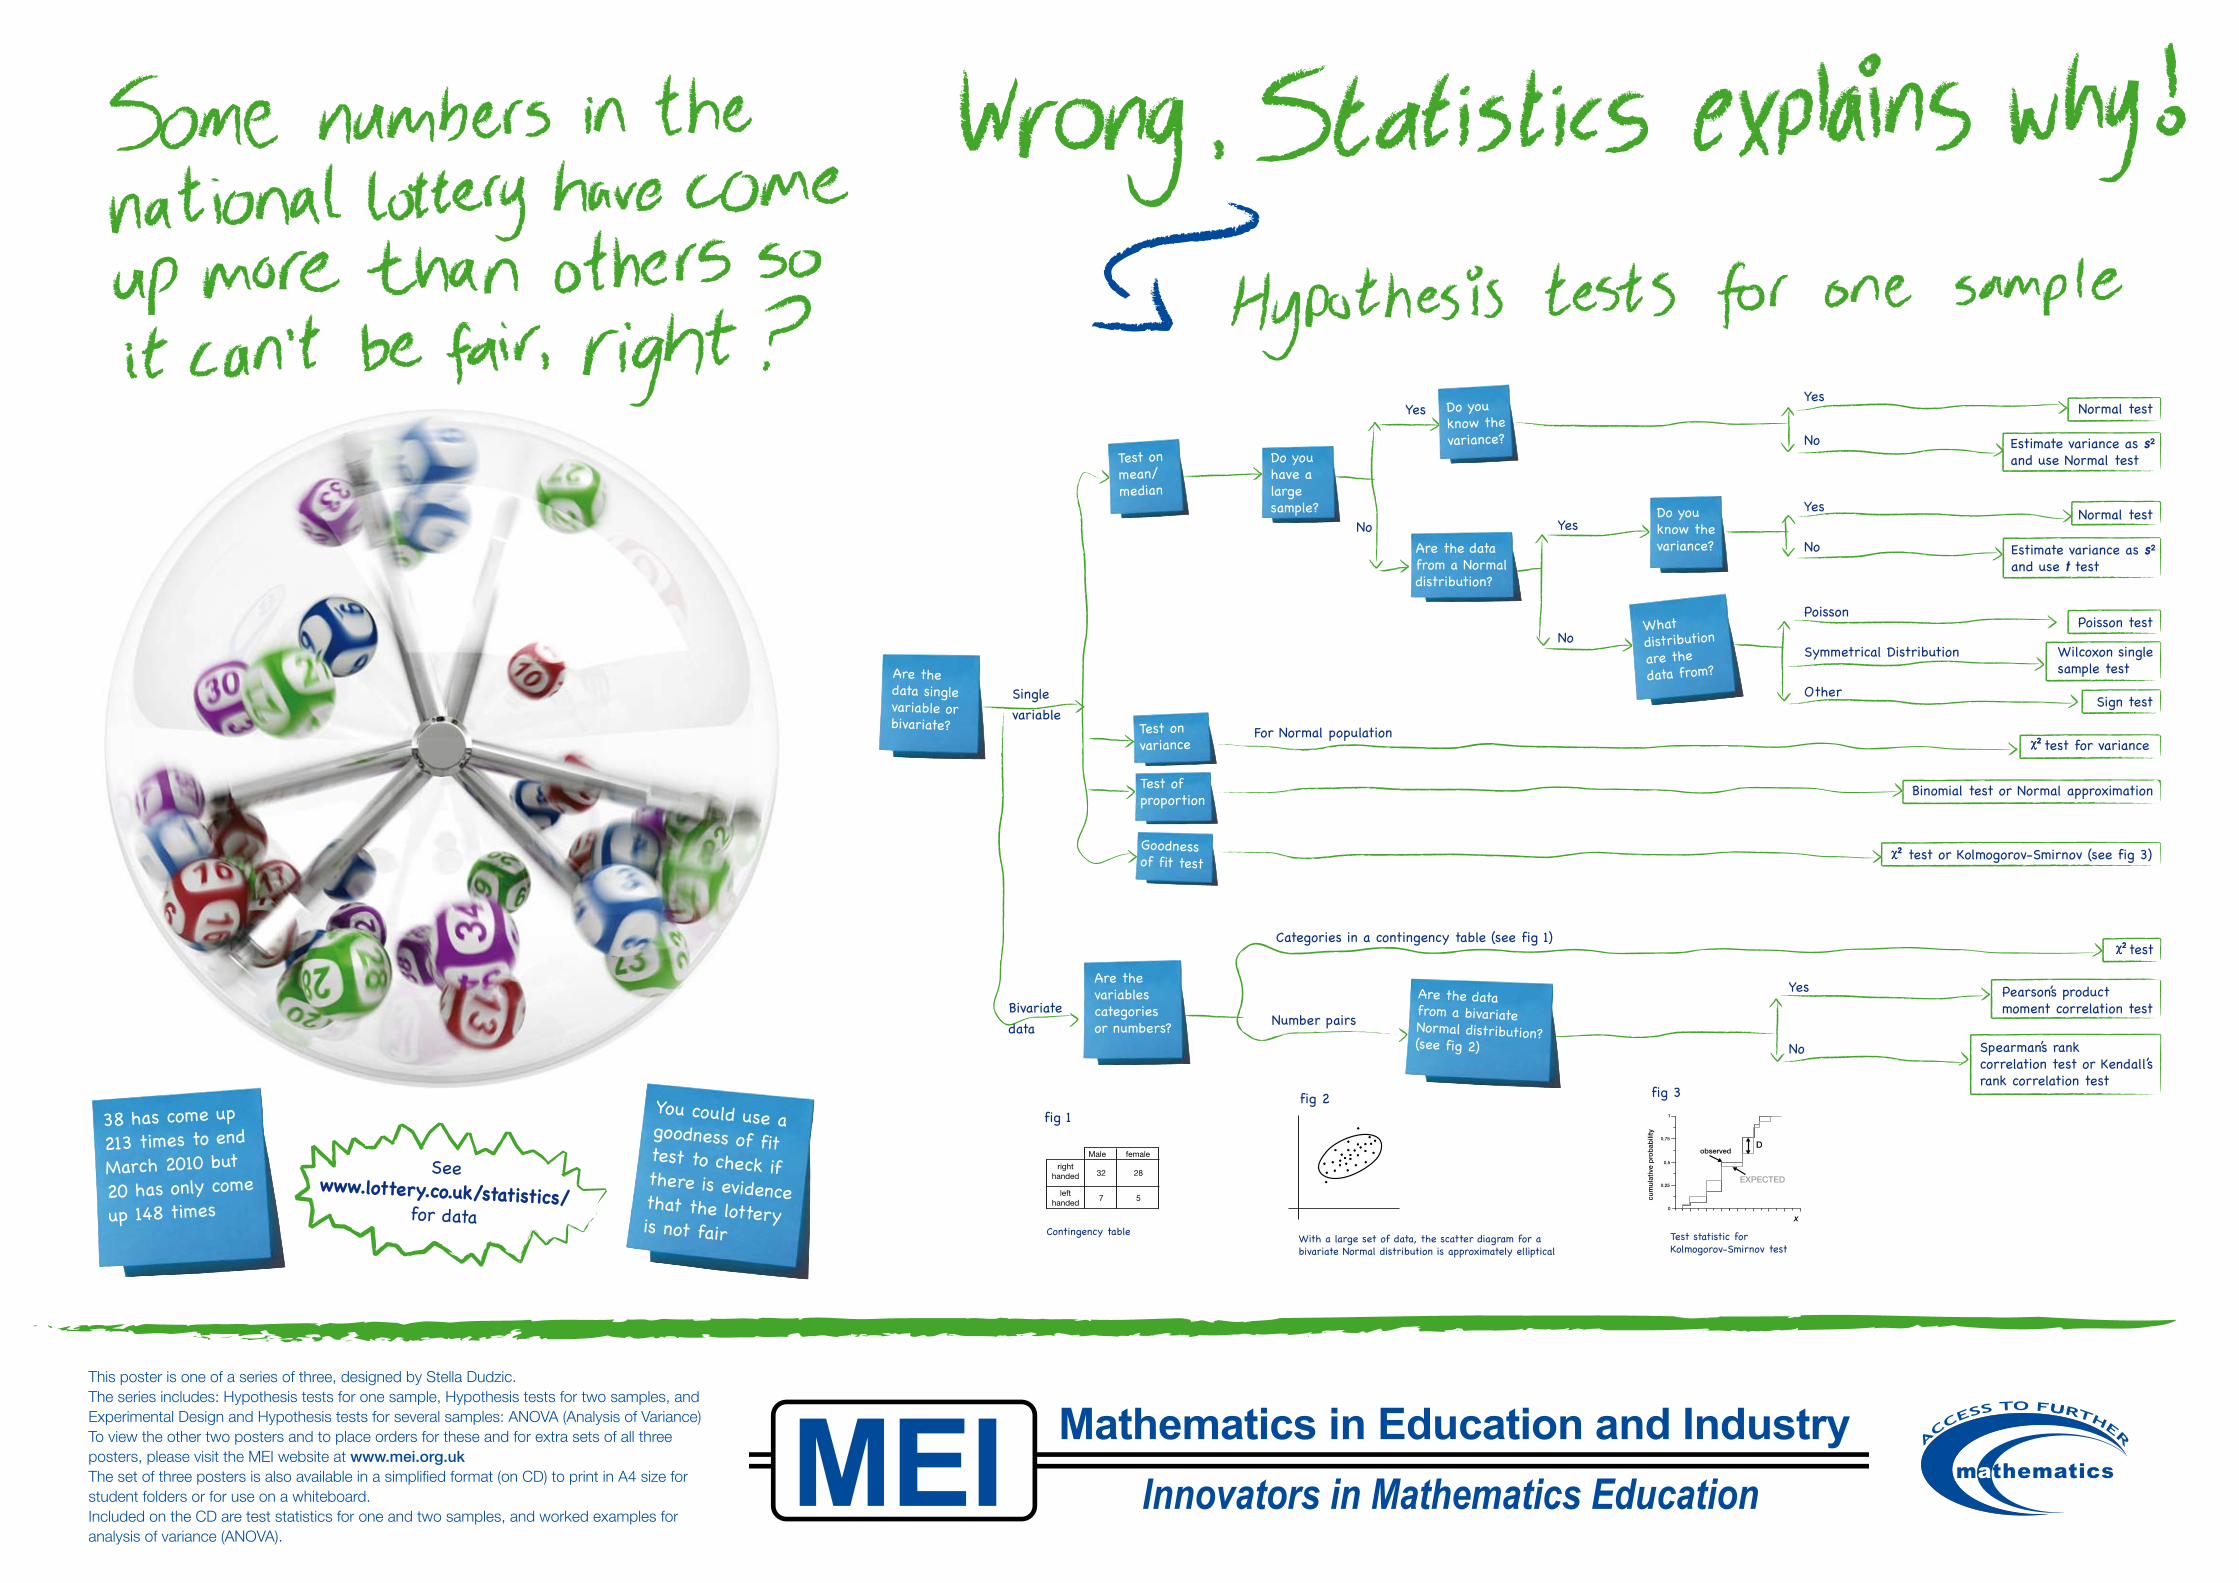
Are yoursamplesmatched?
Unpairedsamples
Matched (paired)samples
Test on difference ofmeans/medians
Do youhave largesamples?
To do a test on paired samples, first find the differences between paired data values and then proceed as for
a single sample test
Are thedifferencesNormallydistributed?
Do you knowthe variance of the differences?
Do you knowthe variance of the differences?
Are thedifferencessymmetricallydistributed?
Are thevariancesequal?
Are the data from distributions with the same shape?
Do you know thevariances?
Are the datafrom Normaldistributions?
Do youhave largesamples?
Test on difference of means/medians
Testing whether they are from the same distribution
Test ondifference of variances
Do you know thevariances?
No
Yes
No
Yes
No
Yes
No
Yes
No
Yes
No
Yes
No
Yes
No
YesNo
YesNo
Yes
N(0,1) probability density
0
Normal test
Normal test
Estimate variance of differencesusing s² and use Normal test
Estimate variance of differencesusing s² and use t test
Wilcoxon pairedsample test
Sign test
Kolmogorov-Smirnov 2-sample test
Normal test
Estimate variances usings²,s² and use Normal test
Normal test
t test with pooledestimate of variance
No suitable simple test
Wilcoxon rank sum testor Mann Whitney U test
No suitable simple test
F test
No
Yes
In the National lottery any one ticket has exactly the same odds of winning as any other ticket right?....
If the national lottery was fair, we wouldexpect each number to be chosenthe same number of times, right?
Explananation of how it works etc etc, Explananation of how it works etc etc, Explananation of how it works etc etcExplananation of how it works etc etcExplananation of how it works etc etc
A survey of TV watching habits is conducted with the following results
Number of hours of TV watched per week Sample size Sample mean Sample varianceWomen 50 11.2 135.2Men 60 9.6 66.9
Does this provide evidence thatthere is a difference in the mean number of hours of TVwatched by men and women?