Embed Size (px)
Citation preview

Index Education
Contributors
Reid Steadman
Managing Director
Global Head of ESG &
Innovation
Dan Perrone
Director
Head of ESG Index
Operations
Margaret Dorn
Senior Director
ESG Client Engagement
North America
Ryan Heslin
Analyst
ESG Indices
Mona Naqvi
Global Head of ESG Capital
Markets Strategy
S&P Global [email protected]
The S&P 500® ESG Index: Defining the Sustainable Core INTRODUCTION
The launch of the S&P 500 ESG Index in April 2019 signaled an evolution
in sustainable investing. Indices based on environmental, social, and
governance (ESG) data were no longer simply a means for companies to
declare their sustainability credentials or tools to manage tactical
investments playing a minor role in investors’ portfolios. The S&P 500 ESG
Index and other such indices were built to underlie strategic, long-term
mainstream investment products.
For decades, the prospect of inclusion in ESG indices like the Dow Jones
Sustainability Indices has encouraged companies to manage their
businesses with various stakeholders and objectives in mind. However,
these pioneering, best-in-class indices tended to be narrow, including only
a small selection of the top ESG performers. This presented challenges to
individual and institutional investors who were concerned about the risks
inherent in highly concentrated portfolios defined by these indices.
The S&P 500 ESG Index addressed the need for an index that incorporates
ESG values while offering benchmark-like performance. Intentionally
broad—including over 300 of the original S&P 500 companies—the
S&P 500 ESG Index reflects many of the attributes of the S&P 500 itself,
while providing an improved sustainability profile.
This paper outlines the characteristics of the S&P 500 ESG Index that have
appealed to investors, including:
• The easy-to-understand methodology behind the index;
• How “financial materiality” drives index construction;
• The similar risk/return profiles of the S&P 500 ESG Index and the S&P 500;
• How the ESG characteristics of the S&P 500 ESG Index are improved compared with those of the S&P 500; and
• Specific examples demonstrating how the S&P 500 ESG Index methodology sorts and selects companies.
Register to receive our latest research, education, and commentary at on.spdji.com/SignUp.
The S&P 500 ESG Index: Def ining the Sustainable Core July 2021
INDEX EDUCATION | ESG 2
For use with institutions only, not for use with retail investors
THE S&P DJI ESG SCORES: BUILDING BLOCKS FOR
INDICES
The key to understanding the S&P 500 ESG Index is the data that
determines its composition, in particular, the S&P DJI ESG Scores.
The S&P DJI ESG Scores are based on data gathered over two decades by
S&P Global ESG Research, which publishes ESG scores based on data
gathered through the Corporate Sustainability Assessment (CSA). The CSA
has become a leading standard in its own right as the definitive guidebook
and grading system for corporations, quantifying their progress on
sustainability topics and their ESG performance in relation to their peers.
In January 2020, S&P Global acquired SAM, the ESG data collection and
scoring unit of the Zurich-based active manager, RobecoSAM. This
acquisition further enhanced S&P Global’s capabilities in ESG and built
on its strong ties with companies already familiar with S&P Global through
its credit ratings, benchmarks, and market data businesses.
The granular, industry-specific data S&P Global gathers through the CSA
directly from companies and from publicly available sources differentiates the
S&P DJI ESG Scores from other ESG scores that rely only on data from
public sources. Because S&P Global directly interacts with companies, it is
able to collect 600-1,000 data points per company. These data points are
then transformed into four levels of scores, highlighted in Exhibit 1.
Exhibit 1: S&P DJI ESG Scores
Source: S&P Dow Jones Indices LLC. Chart is provided for illustrative purposes.
The scoring approach employed to derive the S&P DJI ESG Scores is rooted
in the principle of financial materiality: that companies should be assessed
according to the sustainability issues that are most likely to arise and to have
the greatest impact on companies in their industry.
The S&P DJI ESG Scores are based on data gathered over two decades by S&P Global ESG Research. The granular, industry-specific data S&P Global gathers through the CSA directly from companies differentiates the S&P DJI ESG Scores from other ESG scores, which rely on data only from public sources.

The S&P 500 ESG Index: Def ining the Sustainable Core July 2021
INDEX EDUCATION | ESG 3
For use with institutions only, not for use with retail investors
In the course of its long history and through investment experience1 using the
granular data it collected, S&P Global ESG Research was able to identify
financially material factors uniquely relevant to 61 different industries.
Collecting and scoring data according to these factors ensures that
companies included in the S&P 500 ESG Index have been measured based
on the sustainability issues that are most relevant to them. This is done by
weighting issues according to their relevance, industry by industry, as
determined by how likely issues are to arise and their level of impact if they
do. Exhibit 2 shows how weights assigned to issues in different industries
can vary greatly based on financial materiality.
Exhibit 2: Financially Material Issues in Select Industries
Source: S&P Global. Chart is provided for illustrative purposes.
Once initial weights are assigned, two important refinements are made to
ensure scores are suitable for use in an index.2 First, an adjustment is made
to the weights of the scores in order to address information gaps that may
exist for companies that do not participate directly in the CSA. If a company
does not report on a given issue, but a standard for transparency has not
been reached on this issue in its industry, the company is not penalized for
this missing data by receiving a zero.3 Instead, the weight of the question is
redistributed to other questions.
1 S&P Global ESG Research was originally SAM, part of RobecoSAM, an active investment manager, and gathered ESG data to inform
RobecoSAM’s portfolio managers’ investment decisions.
2 The S&P Global ESG Scores, which are used in the Dow Jones Sustainability Indices, are similar to the S&P DJI ESG Scores but do not include an adjustment for transparency or undergo normalization.
3 S&P DJI’s transparency standard and other information regarding the S&P DJI ESG Scores can be found in “Frequently Asked Questions: S&P DJI ESG Scores.”
S&P Global ESG Research was able to identify financially material factors uniquely relevant to 61 different industries. If a company does not report on a given issue, but a standard for transparency has not been reached on this issue, the weight of the question is redistributed to other questions.

The S&P 500 ESG Index: Def ining the Sustainable Core July 2021
INDEX EDUCATION | ESG 4
For use with institutions only, not for use with retail investors
Second, the S&P DJI ESG Scores are normalized at the industry level to
ensure that the scores of companies are comparable, as certain industries
can have scores that are tightly grouped or skewed relative to the scores of
companies in other industries measured against different criteria. This
normalization ensures companies’ relative positions are comparable for
screening, sorting, and selecting index constituents.
These adjustments, in addition to direct access to data through the CSA and
the identification of financially material factors, make the S&P DJI ESG
Scores the most innovative scores used in indices today.
Index Construction
The S&P 500 ESG Index leverages the S&P DJI ESG Scores and other
data to define its constituents. Using the rules set forth in this section, the
index is rebalanced on an annual basis, after the close of trading on the last
business day of April.4
The index methodology was developed with two objectives.
• To provide a similar risk/return profile to the S&P 500; and
• To avoid companies that are not managing their businesses in line
with ESG principles, according to the S&P DJI ESG Scores and
other relevant ESG data, while including companies that are doing
so.
These two objectives run somewhat counter to each other. Eliminating
companies from the S&P 500 necessarily changes its performance. But
with further methodological adjustments, the industry composition of the
S&P 500 ESG Index is brought back into general alignment with the
S&P 500, resulting in a benchmark-like risk/return profile.
METHODOLOGY SUMMARY
Exclusions
Companies are eliminated that:
• Have an S&P DJI ESG Score that is in the bottom 25% of scores
within their GICS® industry group in the S&P Global LargeMidCap
and S&P Global 1200.
• Extract or generate electricity from thermal coal accounting for
greater than 5% of their revenue.
4 Please see the S&P ESG Index Series Methodology for more information on the S&P 500 ESG Index.
The S&P DJI ESG Scores are normalized at the industry level to ensure that the scores of companies are comparable. The S&P 500 ESG Index leverages the S&P DJI ESG Scores and other data to define its constituents. With further methodological adjustments, the industry composition of the S&P 500 ESG Index is brought back into general alignment with the S&P 500.

The S&P 500 ESG Index: Def ining the Sustainable Core July 2021
INDEX EDUCATION | ESG 5
For use with institutions only, not for use with retail investors
• Produce tobacco, derive more than 10% of their revenue from
tobacco-related products and services, or hold more than a 25%
stake in a company involved in these activities.
• Are involved in controversial weapons, including cluster weapons,
landmines, biological or chemical weapons, depleted uranium
weapons, white phosphorus weapons, or nuclear weapons, or hold
more than a 25% stake in a company involved in these activities.
• Have a UN Global Compact (UNGC) score that is in the bottom 5%
of scores in the eligible universe.5,6
The thermal coal exclusion is the result of a formal consultation process to
determine whether investors using the S&P 500 ESG Index saw this
exclusion as desirable and consistent with the index’s objectives. In the
future, S&P DJI may conduct further consultations regarding exclusions
and other methodological points to ensure the S&P 500 ESG Index remains
relevant and useful to a broad array of investors.
Constituent Selection and Weighting
Once the exclusions are made, the index constituents are selected in the
following manner.
1. Companies are ranked by their S&P DJI ESG Score.
2. Within each GICS industry group, companies are selected from the
top down by S&P DJI ESG Score to target 75% of the float-adjusted
market capitalization of the original S&P 500 GICS industry group.
The index constituents are then weighted by their float-adjusted market
capitalization.
Controversies between Rebalances
When controversies unfold between annual rebalances of the S&P 500
ESG Index, S&P Global reviews these to consider whether a company’s
S&P DJI ESG Score should be reduced. The S&P DJI Index Committee
overseeing the index then determines whether the company should be
removed. Controversies monitored by S&P Global include those related to
economic crime and corruption, fraud, illegal commercial practices, human
rights issues, labor disputes, workplace safety, catastrophic accidents, and
environmental disasters. Once a company is removed from the index, it is
excluded for at least one full calendar year.
5 The UN Global Compact, which was established in 2000, commits it signatories—companies and nations from around the world—to abide
by principles related to human rights, labor, the environment, and anti-corruption. For more information, see www.unglobalcompact.org.
6 Calculated by Arabesque.
In the future, S&P DJI may conduct further consultations regarding exclusions and other methodological points to ensure the S&P 500 ESG Index remains relevant and useful to a broad array of investors. When controversies unfold between annual rebalances of the S&P 500 ESG Index, S&P Global reviews these to consider whether a company’s S&P DJI ESG Score should be reduced.

The S&P 500 ESG Index: Def ining the Sustainable Core July 2021
INDEX EDUCATION | ESG 6
For use with institutions only, not for use with retail investors
Exhibit 3: The S&P 500 ESG Index Methodology Summary
Source: S&P Dow Jones Indices LLC. Chart is provided for illustrative purposes.
Overall, 190 constituents of the S&P 500 were excluded from the S&P 500 ESG Index, totaling 24.56%
of the S&P 500 market capitalization as of April 30, 2021. Exhibit 4 ranks the reasons behind these
exclusions.
Exhibit 4: Reasons for Exclusion from the S&P 500 ESG Index
REASON FOR EXCLUSION NUMBER OF EXCLUSIONS WEIGHT IN S&P 500 (%)
Not Part of the Top 75% of Industry Group Market Cap 111 14.11
S&P DJI ESG Score in Bottom 25% of Industry Group Globally 45 4.70
Involved in Thermal Coal 16 1.38
Involved in Controversial Weapons 9 1.82
Company Not Covered 4 0.26
Not Eligible Due to Prior Media & Stakeholder Analysis Case 3 1.65
UNGC Score Too Low 2 0.77
Involved in Tobacco Production or Sales 2 0.67
Addition to S&P 500 Following Rebalance Reference Date 1 0.04
Source: S&P Dow Jones Indices LLC. Data as of April 30, 2021. Table is provided for illustrative purposes. Constituents may be flagged
according to multiple exclusion criteria; sums and weights may exceed totals.
Step 1:
Exclude companies involved in thermal coal,
tobacco, or controversial weapons, or with a
low UNGC score.
Step 2:
Exclude companies with S&P DJI ESG Scores
in the bottom 25% of their GICS industry group
globally.
Step 3:
Within the S&P 500, sort the remaining
companies by their S&P DJI ESG Scores
within each GICS industry group.
Step 4:
Starting from the company with the highest
S&P DJI ESG Score, select companies for
inclusion from the top down, targeting 75% of
the GICS industry group.
Step 5:
Weight companies by float-adjusted market
capitalization.
Objective: To target 75% of the market
capitalization within each GICS industry group
of the S&P 500, using the S&P DJI ESG Score.
Index Construction Example
0%
10%
20%
30%
40%
50%
60%
70%
80%
90%
100%
Industry group
Top 75%
Eligible Stock withLow ESG Score
Low ESG Score inGlobal Peer Group
Tobacco
Thermal Coal
ControversialWeapons
Low UNGC Score
So
rt b
y E
SG
sco
re
Target 75% by market cap
Ineligible
Eligible

The S&P 500 ESG Index: Def ining the Sustainable Core July 2021
INDEX EDUCATION | ESG 7
For use with institutions only, not for use with retail investors
Exhibit 5: S&P 500 Index Weight by S&P 500 ESG Index Composition
Source: S&P Dow Jones Indices LLC. Data as of April 30, 2021. Chart is provided for illustrative
purposes. Constituents may be flagged according to multiple exclusion criteria; sums and weights may
exceed totals.
RESULTS & PERFORMANCE
Absolute S&P DJI ESG Score Improvement
By design, the S&P 500 ESG Index maintains similar levels of risk and return
to the benchmark S&P 500, alongside numerous stainability enhancements.
At the index level, it achieved an 8.23% increase in its aggregate S&P DJI
ESG Score as of the last rebalance.
Realized ESG Potential
Another useful metric is the “realized ESG potential” of the index. This
depicts how much of an S&P DJI ESG Score improvement was achieved
by the ESG index, relative to the maximum possible improvement that
could have been attained by investing solely in the single highest-ranked
company in terms of S&P DJI ESG Score. While diversification
requirements would make this approach undesirable in practice, it is
nevertheless an interesting metric to contextualize the absolute S&P DJI
ESG Score improvement relative to the starting characteristics of the
benchmark universe. For example, in markets where companies are
generally sustainable to begin with, it is harder to obtain a substantial
increase in absolute S&P DJI ESG Score without incurring a loss of
diversification and higher levels of tracking error. According to this
measure, the S&P 500 ESG Index has realized more than 23% of the ESG
potential of the benchmark, representing a meaningful boost for an ESG
index that still provides benchmark-like returns.7
7 This realized ESG potential is calculated as the percentage difference between the aggregate S&P DJI ESG Scores of the S&P 500 ESG Index
and the S&P 500, relative to the strategy’s maximum potential ESG improvement based on investing only in the single highest-ranked ESG scoring company in the benchmark. The S&P 500 ESG Index represents 23% ((8.23)/(99.44-63.60)) of the possible ESG improvement that the index could achieve (99.44 is the highest score in the S&P 500).
Constituent Weight,
75.44%
Total Exclusion
Weight, 24.56%
The S&P 500 ESG Index
Overall, 190 constituents of the S&P 500 were excluded from the S&P 500 ESG Index, totaling 24.56% of the S&P 500 market capitalization as of April 30, 2021. The S&P 500 ESG Index attained an absolute ESG score increase of 8.23% relative to the benchmark overall, realizing more than 23% of the ESG potential of the benchmark universe. These key ESG performance indicators underpin the value of the S&P 500 ESG Index.
0.04%
0.26%
0.67%
0.77%
1.38%
1.65%
1.82%
4.70%
14.11%
0.00% 10.00% 20.00%
Rebalance Addition
Company Not Covered
Tobacco
UNGC Non-Compliant
Thermal Coal
MSA Case
Controversial Weapons
S&P DJI ESG Score
Eligible, but Not Selected
Exclusion Weight (%)
The S&P 500 ESG Index: Def ining the Sustainable Core July 2021
INDEX EDUCATION | ESG 8
For use with institutions only, not for use with retail investors
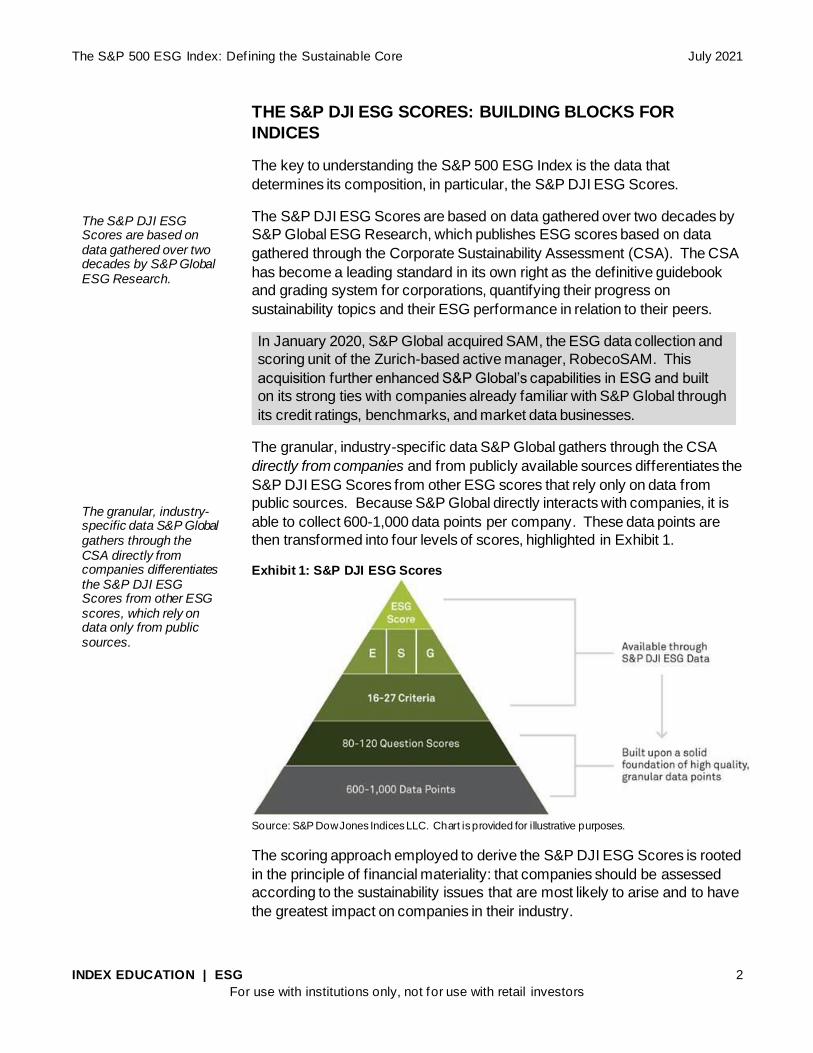
However, while these metrics provide a good snapshot of the overall
benefits, the industry-specific nature of S&P DJI ESG Scores—driven by a
materiality-weighted scoring framework—means such index-level measures
may miss the true benefits captured within each sector. Therefore, Exhibit 6
highlights the realized ESG potential across sectors and demonstrates how
several sectors achieved a much bigger boost in sustainability profile than
the S&P 500 ESG Index achieved overall. Further research is required to
understand what might be driving this dispersion in sector-level
improvements.
Exhibit 6: Realized ESG Potential of the S&P 500 ESG Index versus the
Benchmark
Source: S&P Dow Jones Indices LLC. Data as of April 30, 2021. Chart is provided for illustrative
purposes.
Real-World Benefits
Perhaps more interesting still are the real-world benefits represented by the
enhanced sustainability profile. Indeed, the S&P DJI ESG Scores account
for myriad underlying sustainability metrics, driven by up to 1,000 real-world
data points per company assessed. The sustainability benefits of the
S&P 500 ESG Index are thus simply too numerous to convey in a single
white paper. Nevertheless, a small sampling of these enhancements is
highlighted in Exhibit 7.
This small subset of the numerous, measurable, and positive ESG impacts of
the S&P 500 ESG Index relative to the S&P 500 underpin the true value of
this index. These benefits, coupled with benchmark-like returns, thereby
enable market participants to comfortably align their investments with their
values, without necessarily compromising their overall investment objectives.
7%
9%
15%
16%
19%
20%
23%
27%
27%
32%
44%
47%
0% 10% 20% 30% 40% 50%
Utilities
Consumer Discretionary
Energy
Consumer Staples
Industrials
Information Technology
S&P 500 ESG Index
Financials
Real Estate
Health Care
Materials
Communication Services
Realized ESG Potential (%)
The realized ESG potential measures the ESG score improvement achieved relative to the possible improvement that could have been attained by investing solely in the top ranked company by S&P DJI ESG Score. The S&P 500 ESG Index realized more than 23% of the ESG potential of the benchmark, but it underperformed some individual sectors.

The S&P 500 ESG Index: Def ining the Sustainable Core July 2021
INDEX EDUCATION | ESG 9
For use with institutions only, not for use with retail investors
Exhibit 7: Benefits of the S&P 500 ESG Index versus the S&P 500
Source: S&P Dow Jones Indices LLC. These are just a few examples of the numerous ways in which the S&P 500 ESG Index offers enhanced
ESG representation. Increased index exposure to each ESG theme in the metrics above are calculated using the question-level data in S&P Global’s Corporate Sustainability Assessments (2020 methodology year). These metrics are calculated using index data as of April 30, 2021, as the percentage difference between the performance of the S&P 500 ESG Index and its underlying index constituents across these metrics, on a
weighted average basis. Chart is provided for illustrative purposes.
Risk/Return Profiles
The objective of the S&P 500 ESG Index is to enhance allocation to companies with improved
sustainability characteristics while maintaining broad and diversified exposure, in an effort to provide
benchmark-like returns. As the risk/return metrics over a one-, three-, and five-year time horizon
demonstrate (see Exhibit 8), the index has indeed delivered on its objective—with realized tracking errors
between 1%-2%, almost identical volatility, and some welcome outperformance over the benchmark S&P
500.

The S&P 500 ESG Index: Def ining the Sustainable Core July 2021
INDEX EDUCATION | ESG 10
For use with institutions only, not for use with retail investors
Exhibit 8: Performance Characteristics of the S&P 500 ESG Index versus the S&P 500
CATEGORY S&P 500 S&P 500 ESG INDEX
Number of Constituents 505 315
Float-Adjusted Market Cap (USD Billions) 35,380 26,691
ANNUALIZED TOTAL RETURNS (%)
10-Year 14.17 14.54
5-Year 17.42 18.09
3-Year 18.67 20.07
1-Year 45.98 46.41
EXCESS RETURNS (%)
10-Year - 0.37
5-Year - 0.67
3-Year - 1.40
1-Year - 0.42
ANNUALIZED RISK (%)
10-Year 13.63 13.44
5-Year 14.99 14.83
3-Year 18.52 18.31
REALIZED TRACKING ERROR (%)
10-Year - 1.06
5-Year - 1.11
3-Year - 1.33
1-Year - 1.83
Source: S&P Dow Jones Indices LLC. Data as of April 30, 2021. Past performance is no guarantee of future results. Index performance based on total return in USD. Table is provided for illustrative purposes and reflects hypothetical historical performance. Please see the Performance Disclosure at
the end of this document for more information regarding the inherent limitations associated with back-
tested performance.
Exhibits 9 and 10 further illustrate the return profile of the S&P 500 ESG
Index relative to the S&P 500, over the 10-year and 1-year timeframes, while
the latter shows the live performance record, given that the index launched in
2019. Despite excluding more than 24% of the constituents according to
rules-based eligibility and selection criteria, the S&P 500 ESG Index
achieved a similar return profile to the S&P 500, along with a myriad of
sustainability enhancements.
The index has indeed delivered on its objective—with realized tracking errors between 1%-2%, almost identical volatility, and some welcome outperformance over the benchmark S&P 500. Despite excluding more than 24% of the constituents, the S&P 500 ESG Index achieved a similar return profile to the S&P 500, along with a myriad of sustainability enhancements.

The S&P 500 ESG Index: Def ining the Sustainable Core July 2021
INDEX EDUCATION | ESG 11
For use with institutions only, not for use with retail investors
Exhibit 9: 10-Year Historical Returns of the S&P 500 ESG Index versus the S&P 500
Source: S&P Dow Jones Indices LLC. Data from April 30, 2011, to April 30, 2021. Index performance based on daily total return in USD. Past performance is no guarantee of future results. Chart is provided for illustrative purposes and reflects hypothetical historical performance. Please see the Performance Disclosure at the end of this document for information regarding the inherent limitations associated with
back-tested performance.
Exhibit 10: One-Year (Live) Performance of the S&P 500 ESG Index versus
the S&P 500
Source: S&P Dow Jones Indices LLC. Data from April 30, 2020, to April 30, 2021. Index performance based on daily total return in USD. Past performance is no guarantee of future results. Chart is provided
for illustrative purposes.
The 10-year historical return profile demonstrates that the S&P 500 ESG
Index generally succeeded in targeting the performance of the benchmark
S&P 500. However, it is worth paying special attention to performance since
January 2019, when the index was live. For instance, over the one-year
timeframe from April 2020 to April 2021, the ESG index achieved an excess
return of 0.42%, while remaining close to the benchmark with a 1.83%
tracking error.
50
100
150
200
250
300
350
400
2011
2012
2013
2014
2015
2016
2017
2018
2019
2020
2021
Index L
evel
S&P 500 S&P 500 ESG Index
50
75
100
125
150
175
Apr.
2020
May.
2020
Jun. 2020
Jul. 2
020
Aug. 2020
Sep. 2020
Oct. 2
020
Nov.
2020
Dec.
2020
Jan. 2021
Feb
. 2021
Mar. 2
021
Apr.
2021
Index L
evel
S&P 500 S&P 500 ESG Index
The 10-year historical return profile demonstrates that the S&P 500 ESG Index generally succeeded in targeting the performance of the benchmark Over the past year when the index was live, notwithstanding turbulent markets, the strategy achieved an excess return of 0.42%, while remaining close to the benchmark with 1.83% tracking error.

The S&P 500 ESG Index: Def ining the Sustainable Core July 2021
INDEX EDUCATION | ESG 12
For use with institutions only, not for use with retail investors
Performance Attribution: A Story of Selection
Notwithstanding its objective to perform in line with the S&P 500, the
S&P 500 ESG Index has provided some welcome outperformance since its
launch in 2019. This stands out as a deviation from its historical norm,
making performance attribution over a one-year time frame a particularly
useful exercise. Interestingly, the outperformance was not necessarily due to
over exposure to the IT sector or under exposure to the Energy sector, as
many suppose. Instead, the stock selection effect, as determined by the
index methodology, was the primary driver of outperformance over the past
year. This is perhaps unsurprising, as the index construction lends itself to a
broadly sector-neutral outcome, resulting in a minimal allocation effect. To
recap, after applying various exclusions, the methodology targets 75% of the
market cap within each industry group in the S&P 500, selecting the best-
ranked ESG performers by S&P DJI ESG Score. Since constituents are then
weighted by market capitalization, the methodology essentially sifts through
the largest companies for the ESG index to perform in line with its objective.
Exhibit 11: One-Year Performance Attribution of the S&P 500 ESG Index
versus the S&P 500
Source: S&P Dow Jones Indices LLC, FactSet. Data as of April 30, 2021. Index performance based on
daily total return in USD. Past performance is no guarantee of future results. Chart is provided for
illustrative purposes.
Some companies that were significant drivers of the performance of the
S&P 500 over the past 12 months, such as Apple and Microsoft, for example,
survived the rules-based exclusion and selection criteria and qualified for the
S&P 500 ESG Index. Meanwhile, other names with less-than-stellar
performance, such as Boeing, did not. Thus, we can infer that a rules-based
approach, driven by sustainability principles and a materiality-weighted ESG
scoring framework, has increased the index allocation to several successful
names that drove the outperformance.
-0.4
-0.2
0.0
0.2
0.4
0.6
Attributio
n
Allocation Effect Selection Effect Interaction Effect
Since 2019, the S&P 500 ESG Index has provided some welcome outperformance. Stock selection effect was the primary driver of outperformance over the past year. A rules-based approach, driven by sustainability principles and a materiality-weighted ESG scoring framework, increased the index allocation to names that drove the outperformance.

The S&P 500 ESG Index: Def ining the Sustainable Core July 2021
INDEX EDUCATION | ESG 13
For use with institutions only, not for use with retail investors
Factor Exposure of the S&P 500 ESG Index
The question sometimes arises whether the S&P 500 ESG Index exhibits
any unintended factor exposures that might help to explain its recent
outperformance. As Exhibit 12 demonstrates, however, the factor tilts were
in fact quite similar to the S&P 500, consistent with the index’s objective to
provide a similar risk/return profile to its benchmark.
Exhibit 12: Factor Exposure of the S&P 500 ESG Index versus the S&P 500
Source: S&P Dow Jones Indices LLC. Data as of April 30, 2021. Chart is provided for illustrative
purposes.
Notwithstanding a similar picture overall, one area where the underlying
factor exposure of the index does diverge is in its exposure to large size.
This is unsurprising, due to the generally positive correlation between
sustainability performance and firm size,8 as visibility, access to resources,
and operating scale are typically associated with large firms. However, the
underlying factor exposure of the index confirms that the S&P 500 ESG
Index is poised to do precisely what it was intended to do. That is, to
improve the sustainability characteristics of the benchmark while maintaining
broadly similar levels of risk and return to the S&P 500. Whether or not the
recent outperformance may be attributed to size, sustainability, or perhaps
something in between, requires further study.
8 Drempetic, S., Klein, C., and Zwergel, B. “The Influence of Firm Size on the ESG Score: Corporate Sustainability Ratings Under Review,”
Journal of Business Ethics (2019).
Low Volatility
Momentum
Value
High BetaDividend
Quality
Small Size
The question sometimes arises whether the S&P 500 ESG Index exhibits any unintended factor exposures that might help to explain its recent outperformance. The factor tilts were in fact quite similar to the S&P 500, consistent with the index’s objective to provide a similar risk/return profile to its benchmark. One area where the underlying factor exposure of the index does diverge is in its exposure to large size.
The S&P 500 ESG Index: Def ining the Sustainable Core July 2021
INDEX EDUCATION | ESG 14
For use with institutions only, not for use with retail investors
REVIEWING THE RESULTS OF THE 2021 ANNUAL
REBALANCE
The S&P 500 ESG Index rebalances on an annual basis, as noted earlier.
Though “product involvement exclusions” related to tobacco and
controversial weapons remain relatively constant, a significant source of
turnover in the index is due to companies changing relative positions with
respect to their S&P DJI ESG Scores.
Relative position matters because in two instances in the methodology,
companies are sorted and selected—or screened out—according to their
S&P DJI ESG Score.
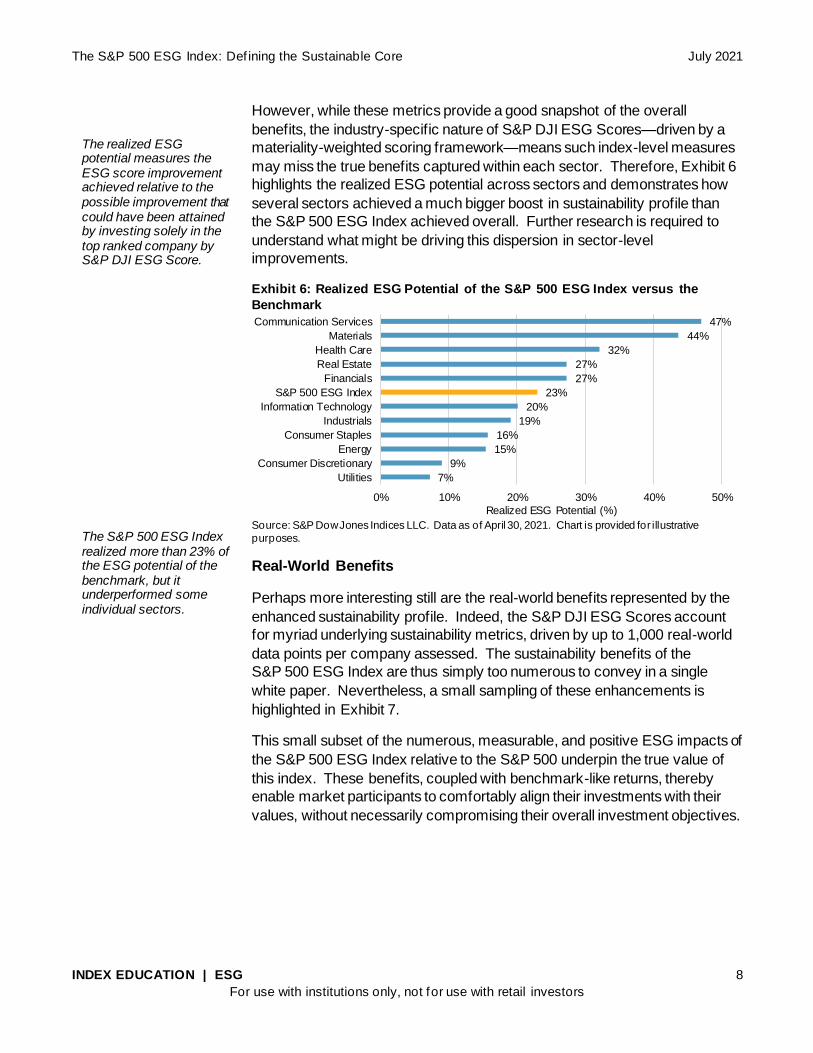
In the annual rebalance in April 2021, 21 companies left the S&P 500 ESG
Index and 45 companies were added. Exhibits 13 and 14 show the largest
adds and drops in terms of market cap.
Exhibit 13: Largest Additions to the S&P 500 ESG Index
COMPANY WEIGHT (%) REASON
Tesla, Inc. 2.04
Tesla was added to the S&P 500, with the lowest S&P DJI ESG Score (ranked 5/5) in the Automobiles & Components industry group, it accounted for 75% of the industry group weight and was therefore selected for inclusion.
Walt Disney Co. 1.27
Walt Disney had a large S&P DJI ESG Score increase, with
notable improvements in environmental reporting, occupational health & safety, and labor practice indicators. The company now ranks 10/22 in the Media & Entertainment industry group.
Walmart Inc. 0.73
Walmart had a slight increase in S&P DJI ESG Score, with improvements in genetically modified organisms, environmental
policy and management, human rights, and material ity criteria, outranking Costco to take its place in the index. Walmart now ranks at 4/5 in the Food & Staples Retailing industry group.
Oracle Corp. 0.53
Oracle experienced a large S&P DJI ESG Score increase, with notable improvements in environmental policy & management
and human capital development. Oracle now ranks as 7/34 in the Software & Services industry group.
Applied Materials Inc.
0.46
Applied Materials had a large S&P DJI ESG Score increase, with notable improvements in climate strategy and operational eco-efficiency. The company is now ranked 7/20 in the
Semiconductors & Semiconductor Equipment industry group.
Booking Holdings Inc.
0.38
Booking Holdings slightly improved their S&P DJI ESG Score, with notable improvements in policy influence and privacy protection. This brought the company to rank 9/18 in the Consumer Services industry group.
Charter
Communications Inc.
0.36
Charter experienced a large S&P DJI ESG Score increase, with
notable improvements in social reporting and corporate citizenship & philanthropy. This led to the company being ranked 14/22 in the Media & Entertainment industry group.
Progressive
Corp. 0.22
Progressive Corp experienced a large S&P DJI ESG Score increase, with notable improvements in corporate citizenship &
philanthropy and tax strategy. The company now ranks 15/22 in the Insurance industry group.
Analog Devices Inc.
0.21
Analog Devices experienced a large S&P DJI ESG Score increase, with improvements in labor practice indicators and social reporting. The company now ranks 8/20 in the
Semiconductors & Semiconductor Equipment industry group.
Dow Inc. 0.17
Dow was previously not covered by ESG data, so it was omitted
per index methodology. Now with coverage, Dow ranks 3/28 in the Materials industry group.
Source: S&P Dow Jones Indices LLC. Data as of April 30, 2021. Table is provided for illustrative
purposes.
The S&P 500 ESG Index rebalances on an annual basis. A significant source of turnover in the index is due to companies changing relative positions with respect to their S&P DJI ESG Scores.

The S&P 500 ESG Index: Def ining the Sustainable Core July 2021
INDEX EDUCATION | ESG 15
For use with institutions only, not for use with retail investors
Exhibit 14: Largest Exclusions from the S&P 500 ESG Index*
COMPANY WEIGHT (%) REASON
Facebook Inc.
2.91
Facebook experienced a large S&P DJI ESG Score decrease, notably driven by decreases in environmental reporting, operational
eco-efficiency, and policy influence. This decrease, coupled with S&P DJI ESG Score increases by other Media & Entertainment members such as Walt Disney and Charter, led Facebook to be
removed. Facebook is now ranked at 17/22 in the industry group.
Wells Fargo & Co.
0.66
Wells Fargo experienced an S&P DJI ESG Score increase, with
notable improvements in environmental reporting, human rights, and policy influence criteria. However, it still was ranked lower than peers and was not selected. The company ranks 9/18 in the Banks
industry group.
Costco Wholesale Corp.
0.64
Costco experienced a slight increase in its S&P DJI ESG Score, with
notable improvements in corporate governance and raw material sourcing, but it was not enough to outrank Walmart, who took its spot in the industry group. Costco now ranks 5/5 in the Food & Staples
Retailing industry group.
Aon PLC 0.21
Aon experienced an S&P DJI ESG Score increase, with score
improvements in human capital development and talent attraction & retention. However, peers in the Insurance industry group, including Progressive, improved their S&P DJI ESG Scores to higher numbers
and were selected above Aon, assigning the company an industry group rank of 18/22.
American Intl Group
Inc.
0.16
American International experienced an S&P DJI ESG Score increase. However, peers in the Insurance industry group, including Progressive, improved their S&P DJI ESG scores to higher numbers
and were selected above American International, assigning the company an industry group rank of 19/22.
Nucor Corp. 0.10
Nucor experienced a slight increase in S&P DJI ESG Score, with notable improvements in human rights criteria. It still remains ranked below other Materials members and was not selected for inclusion.
The company ranks at 27/28 in the industry group.
Vulcan Materials Co.
0.09
Vulcan Materials experienced a slight S&P DJI ESG Score increase,
with notable increases in climate strategy and labor practice indicators. However, it was outranked by other Materials members, including Dow. Vulcan is now ranked at 24/28 in the industry group.
Alexandria
Real Estate Eqty
0.09
Alexandria Real Estate experienced a large S&P DJI ESG Score decrease, with notable score decreases in climate strategy,
environmental reporting, stakeholder engagement, and codes of business conduct. The company now ranks 27/29 in the Real Estate industry group.
Expeditors
Intl of WA Inc.
0.07
Expeditors International experienced a slight increase in its S&P DJI ESG Score, with notable improvements in policy influence and
human capital development. It was not ranked high enough for index inclusion compared with peers, however, receiving a ranking of 9/15 in the Transportation industry group.
Baker
Hughes Company
0.06
Baker Hughes experienced an S&P DJI ESG Score decrease, with notable decreases in social reporting, corporate citizenship &
philanthropy scores, assigning the company an Energy industry group rank of 15/23.
Source: S&P Dow Jones Indices LLC. Data as of April 30, 2021. Table is provided for illustrative
purposes.
In some instances, the index methodology ensured that certain S&P 500 companies continued to be excluded, after being excluded in previous years. Exhibit 15 lists the largest companies that were not included in the index following the annual rebalance.
In the annual rebalance in April 2021, 21 companies left the S&P 500 ESG Index and 45 companies were added.

The S&P 500 ESG Index: Def ining the Sustainable Core July 2021
INDEX EDUCATION | ESG 16
For use with institutions only, not for use with retail investors
Exhibit 15: 10 Largest Companies to Remain Out of the S&P 500 ESG Index Since Launch
COMPANY REASON FOR NOT BEING SELECTED IN 2021
Berkshire Hathaway B Disqualifying S&P DJI ESG Score
Netflix Inc Disqualifying UNGC score and disqualifying S&P DJI ESG Score
Broadcom Inc Eligible, but not selected
Honeywell Int Inc Controversial weapons involvement
Philip Morris Intl Tobacco involvement
Boeing Co Controversial weapons involvement
Intuitive Surgical Inc Eligible, but not selected
Lockheed Martin Controversial weapons involvement
Altria Group Inc Tobacco involvement
Stryker Corp Eligible, but not selected
Source: S&P Dow Jones Indices LLC. Data as of April 30, 2021. Table is provided for illustrative
purposes.
Even as turnover is relatively high, certain companies have remained in the
index year after year. Exhibit 16 highlights the 10 largest companies that
have stayed in the S&P 500 ESG Index since its launch on Jan. 28, 2019. In
all, 91 companies have remained in the index since 2019.
Exhibit 16: 10 Largest Companies Who Have Always Been in the S&P 500 ESG Index
COMPANY FLOAT-ADJUSTED MARKET CAP (USD BILLION)
Apple Inc. 2,074.55
JP Morgan Chase & Co. 469.35
UnitedHealth Group Inc. 376.99
Procter & Gamble 328.54
Bank of America Corp. 307.91
Adobe Inc. 243.66
Exxon Mobil Corp. 242.32
Verizon Communications Inc. 239.14
Intel Corp. 233.74
AT&T Inc. 224.01
Source: S&P Dow Jones Indices LLC. Data as of April 30, 2021. Table is provided for illustrative
purposes.
In some instances, the index methodology ensured that certain S&P 500 companies continued to be excluded, after being excluded in previous years.
Even as turnover is relatively high, certain companies have remained in the index year after year.

The S&P 500 ESG Index: Def ining the Sustainable Core July 2021
INDEX EDUCATION | ESG 17
For use with institutions only, not for use with retail investors
Individual Case Studies
Focusing on the impact of the methodology on some specific companies
illustrates how different elements of the methodology work in practice.
INCLUSION DRIVEN BY S&P DJI ESG SCORE: FACEBOOK
After losing its standing in the S&P 500 ESG Index in 2019, Facebook was
added back into the index in the April 2020 annual rebalance. This was the
result of Facebook’s higher S&P DJI ESG Score (59 compared with 21 the
previous year), which was largely driven by improvement in its Governance
score, but also the result of other interesting index dynamics.
Facebook benefited from two factors. First, Facebook changed
classifications from IT Services & Internet Software & Services to Interactive
Media Services & Home Entertainment. In the former industry group,
Facebook was ranked last of 25 companies by S&P DJI ESG Score in the
2018 assessment year; in 2019, Facebook was ranked 8 of 22 in its new
industry group. Second, Facebook benefited from Twitter becoming
ineligible due to its low UNGC score, as detailed in the next section.
Because Twitter lost its eligibility, Facebook became the final selection within
its industry group to attain the desired 75% market cap threshold.
Facebook was later removed from the index with the annual rebalance in
2021 due to a significant S&P DJI ESG Score decrease, notably driven by
decreases in environmental reporting, operational eco-efficiency, and policy
influence. However, this particular example continues to hold as an
illustration of how a company’s S&P DJI ESG Score can affect its standing in
the index each year.
EXCLUSION DRIVEN BY LOW UNGC SCORE: TWITTER
In 2020, Twitter was excluded from the eligible universe of companies to be
selected due to its relatively low UNGC score, as determined by Arabesque
S-Ray GmbH. Between 2019 and 2020, Twitter saw a significant drop in its
Arabesque UNGC score mostly due to issues related to labor rights and
specifically regarding whether Twitter had resisted its workers’ right to
organize.
EXCLUSION DRIVEN BY MEDIA & STAKEHOLDER ANALYSIS:
JOHNSON & JOHNSON
In 2020, Johnson & Johnson was excluded from the index after a S&P
Global Media & Stakeholder Analysis (MSA) resulted in this company’s
removal in October 2019. This MSA case was triggered by several
controversies, including:
Facebook was added back into the index in the 2020 rebalance as a result of its higher ESG score. Twitter was excluded from the eligible universe of companies to be selected in 2020 due to its relatively low UNGC score.
Focusing on the impact of the methodology on some specific companies illustrates how different elements of the methodology work in practice.

The S&P 500 ESG Index: Def ining the Sustainable Core July 2021
INDEX EDUCATION | ESG 18
For use with institutions only, not for use with retail investors
• The announcement of the Department of Justice's criminal
investigation into whether company officials knew about the
carcinogens in their products;
• The announcement of a USD 120 million settlement over alleged
deceptive promotion of hip implants;
• Lawsuits filed by patients who incurred injuries after taking blood
thinner Xarelto; and
• The USD 572 million fine in Oklahoma to resolve allegations of
fraudulently downplaying the hazards and overemphasizing the
benefits of opioids.
An Ecosystem Is Evolving
Since the index was launched in January 2019, the number of investment
products tied to the index has grown, with several exchange-traded funds
(ETFs) spanning the U.S., Europe, Canada, and the U.K.—with assets under
management totaling approximately USD 4.5 billion to date.9 In addition,
futures listed on the CME have traded over USD 20 billion in notional value
since they launched in November 2019, providing additional liquidity to an
evolving ecosystem of market participants who use the S&P 500 ESG Index.
Interestingly, investments in these products have come from various client
segments and geographies as opposed to a select few, ESG-oriented
institutional investors, suggesting that the S&P 500 ESG Index is becoming
increasingly accepted as a starting point for ESG investments among market
participants around the world.
CONCLUSION
The launch of the S&P 500 ESG Index marked a watershed moment in the
landscape of sustainable investments. By offering a broad-based,
sustainable alternative to the S&P 500, the index is beginning to cement its
position as a common starting point for ESG investors around the world
focused on U.S. equities. While exhibiting desirable sustainability
characteristics—such as stronger commitments to reduce greenhouse gas
emissions, enhanced female participation in management positions, and
employee incentives for a more effective risk culture—the index has
delivered low levels of tracking error and benchmark-like returns. The index
thus allows market participants to align their values with their investments
and integrate sustainability considerations into the core of their strategies—
and not just at the periphery. As a sustainable substitute for the iconic
S&P 500, therefore, the S&P 500 ESG Index is helping to elevate ESG
investing from the margins to the mainstream.
9 Data as of April 30, 2021.
Since the index was launched in January 2019, the number of investment products tied to the index has grown. Investments in these products have come from various client segments and geographies as opposed to a select few, ESG-oriented institutional investors.
The S&P 500 ESG Index is beginning to cement its position as a common starting point for ESG investors around the world focused on U.S. equities.

The S&P 500 ESG Index: Def ining the Sustainable Core July 2021
INDEX EDUCATION | ESG 19
For use with institutions only, not for use with retail investors
APPENDIX: FROM LARGE CAP TO ALL CAP: INTRODUCING THE S&P MIDCAP 400®
ESG INDEX AND THE S&P SMALLCAP 600® ESG INDEX
On Jan. 18, 2021, S&P Dow Jones Indices expanded the S&P ESG Index Series to include ESG
versions of the small- and mid-cap U.S. equity benchmarks, the S&P SmallCap 600 and the S&P
MidCap 400.
Due to generally poor levels of ESG disclosure among small- and medium-sized companies, several
methodological adjustments were applied to ensure the indices may continue to satisfy the objective of
the S&P ESG Index Series. That is, to improve sustainability characteristics while providing similar
levels of risk and return relative to the benchmark.10 These adjustments include the following.
Amendments to the S&P ESG Index Series Methodology
In the standard S&P ESG Index Series Methodology (see Step 2 of Exhibit 3), companies that rank
among the bottom 25% of the S&P DJI ESG Score among an index’s GICS industry group globally are
excluded from the index.11 For the S&P MidCap 400 ESG Index and S&P SmallCap 600 ESG Index,
however, companies are only deemed ineligible based on their S&P DJI ESG Score if any of the
following criteria are satisfied.
1. The S&P DJI ESG Score falls within the worst 25% of scores from the company’s GICS industry
group in the underlying index.
2. The S&P DJI ESG Score falls within the worst 10% of scores in the company's underlying index.
3. If, after Steps 1 and 2, less than 75% of the weight of the underlying index remain eligible, the
above steps are relaxed as follows.
a. The S&P DJI ESG Score falls within the worst 20% of scores from the company’s GICS
industry group in the underlying index. If after this relaxation the 75% target is still not
met, then Step 1 is further relaxed as follows.
i. The S&P DJI ESG Score falls within the worst 15% of scores from the company’s
GICS industry group in the underlying index.
At this point, if the target is still not met, no further relaxation is performed, even if the 75% target is not
satisfied.
Other exclusionary screens pertaining to controversial weapons, thermal coal, tobacco, UNGC
violators, and company controversies are applied as per the standard S&P ESG Index Series
Methodology. In addition, the process for selecting constituents from the eligible universe—by targeting
the top 75% of market capitalization within index industry groups where companies are ranked by S&P
DJI ESG Score—remains the same.
10 As stated on page 4, the S&P 500 ESG Index methodology was developed with two objectives: (1) To provide a similar risk/return profile to
the S&P 500; and (2) To avoid companies that are not managing their businesses in line with ESG principles, according to the S&P DJI
ESG Scores and other relevant ESG data, while including companies that are doing so. For more information on the S&P ESG Index Series Methodology, please see https://www.spglobal.com/spdji/en/documents/methodologies/methodology-sp-esg-index-series.pdf.
11 Where the global universe for this categorization is defined as the combined constituents of the S&P Global LargeMidCap and S&P Global 1200 as of the rebalancing reference date.

The S&P 500 ESG Index: Def ining the Sustainable Core July 2021
INDEX EDUCATION | ESG 20
For use with institutions only, not for use with retail investors
The reasons for these adjustments are twofold. First, there is relatively less disclosure among medium-
and small-sized firms than larger companies with respect to ESG;12 second, larger companies tend to
perform better on ESG issues,13 the reasons for which are discussed on page 12. As such, we find a
positive correlation between S&P DJI ESG Scores and company size (see Exhibit A1). This means
that if the methodology were to apply the standard S&P DJI ESG Score exclusion criteria, it would
result in an eligible universe that is too narrow to maintain a broad and diversified index and, therefore,
would be unable to satisfy the objective of the S&P ESG Index Series.
Exhibit A1: S&P 600TM, S&P 400TM, and S&P 500 S&P DJI ESG Score Distributions
Source: S&P Dow Jones Indices LLC. Data as of April 30, 2021. Chart is provided for illustrative purposes.
Index Composition
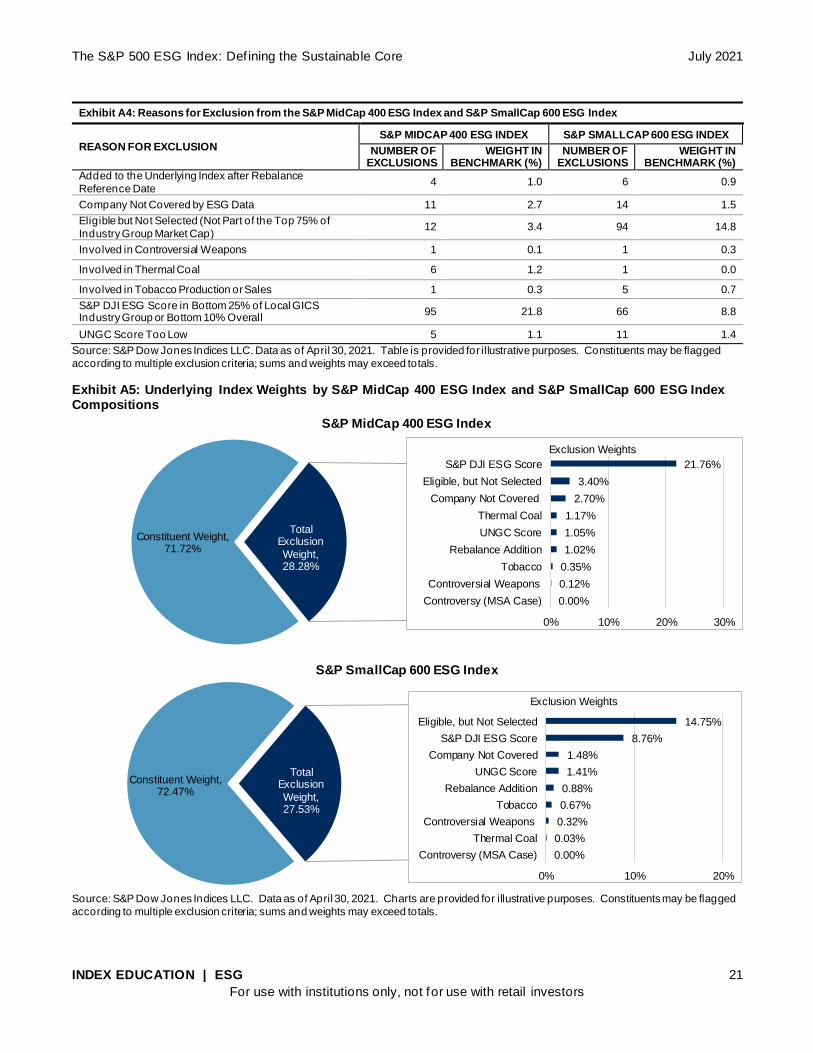
With these adjustments, 119 constituents of the S&P 400 and 191 of the S&P 600 were either excluded
from or not selected for inclusion in their ESG variants. As of the last rebalance, this amounted to
removing 28.28% and 27.53% of the market capitalization of the S&P MidCap 400 ESG Index and
S&P SmallCap 600 ESG Index, respectively. Exhibit A4 provides the reasons for these exclusions
while Exhibit A5 reviews the composition of the indices.
12 According to Sardon, M., “The Potentially High Cost of Not Disclosing ESG Data,” Wall Street Journal (2019), “Midsize and small
companies generally lag behind their larger peers in terms of disclosure because they are less likely to have resources such as ESG-
dedicated team or a sustainability department.”
13 A positive correlation between sustainability performance and firm size is generally observed due to the greater visibility, access to resources, and operating scale associated with large firms. For example, see Drempetic, S., Klein, C., and Zwergel, B. “The Influence of Firm Size on the ESG Score: Corporate Sustainability Ratings Under Review.” Journal of Business Ethics (2019) for more information.
The S&P 500 ESG Index: Def ining the Sustainable Core July 2021
INDEX EDUCATION | ESG 21
For use with institutions only, not for use with retail investors
Exhibit A4: Reasons for Exclusion from the S&P MidCap 400 ESG Index and S&P SmallCap 600 ESG Index
REASON FOR EXCLUSION S&P MIDCAP 400 ESG INDEX S&P SMALLCAP 600 ESG INDEX
NUMBER OF EXCLUSIONS
WEIGHT IN BENCHMARK (%)
NUMBER OF EXCLUSIONS
WEIGHT IN BENCHMARK (%)
Added to the Underlying Index after Rebalance
Reference Date 4 1.0 6 0.9
Company Not Covered by ESG Data 11 2.7 14 1.5
Eligible but Not Selected (Not Part of the Top 75% of
Industry Group Market Cap) 12 3.4 94 14.8
Involved in Controversial Weapons 1 0.1 1 0.3
Involved in Thermal Coal 6 1.2 1 0.0
Involved in Tobacco Production or Sales 1 0.3 5 0.7
S&P DJI ESG Score in Bottom 25% of Local GICS Industry Group or Bottom 10% Overall
95 21.8 66 8.8
UNGC Score Too Low 5 1.1 11 1.4
Source: S&P Dow Jones Indices LLC. Data as of April 30, 2021. Table is provided for illustrative purposes. Constituents may be flagged
according to multiple exclusion criteria; sums and weights may exceed totals.
Exhibit A5: Underlying Index Weights by S&P MidCap 400 ESG Index and S&P SmallCap 600 ESG Index Compositions
Source: S&P Dow Jones Indices LLC. Data as of April 30, 2021. Charts are provided for illustrative purposes. Constituents may be flagged
according to multiple exclusion criteria; sums and weights may exceed totals.
Constituent Weight, 71.72%
Total Exclusion
Weight, 28.28%
S&P MidCap 400 ESG Index
Constituent Weight, 72.47%
Non-Constituents, 27.53%
Total Exclusion
Weight, 27.53%
S&P SmallCap 600 ESG Index
0.00%
0.12%
0.35%
1.02%
1.05%
1.17%
2.70%
3.40%
21.76%
0% 10% 20% 30%
Controversy (MSA Case)
Controversial Weapons
Tobacco
Rebalance Addition
UNGC Score
Thermal Coal
Company Not Covered
Eligible, but Not Selected
S&P DJI ESG Score
Exclusion Weights
0.00%
0.03%
0.32%
0.67%
0.88%
1.41%
1.48%
8.76%
14.75%
0% 10% 20%
Controversy (MSA Case)
Thermal Coal
Controversial Weapons
Tobacco
Rebalance Addition
UNGC Score
Company Not Covered
S&P DJI ESG Score
Eligible, but Not Selected
Exclusion Weights

The S&P 500 ESG Index: Def ining the Sustainable Core July 2021
INDEX EDUCATION | ESG 22
For use with institutions only, not for use with retail investors
Results and Performance
ABSOLUTE S&P DJI ESG SCORE IMPROVEMENT
At the aggregate score level, the S&P MidCap 400 ESG Index and S&P SmallCap 600 ESG Index
achieved absolute S&P DJI ESG Score improvements of 6.89% and 3.99%, respectively, relative to
their benchmarks.14 These modest, albeit meaningful, improvements are representative of the
challenges associated with S&P DJI ESG Score transparency and performance among smaller
companies.
However, these indices also represent a new sustainable frontier in a space left largely untouched by
current sustainable indexing. For the first time, companies of this size are now being rewarded or
penalized on the basis of their sustainability credentials through a transparent and rules-based
selection process, which should serve to raise the bar on sustainable business practices as they seek
to improve their standing in the indices over time. This, coupled with S&P DJI’s unparalleled levels of
direct company engagement via the CSA that has historically served as a guide for companies to
progress along their sustainability journey, means these indices are uniquely positioned to reshape
corporate sustainability behaviors below a certain cap size.
Ultimately, whether or not such improvements will amount to a widening “sustainability premium” (in
terms of higher levels of absolute S&P DJI ESG Score improvements as certain companies improve
more than others) or, rather, improve sustainability standards across all companies within the starting
benchmark universe, remains to be seen. In either case, the potential enhancements in sustainability
efforts would be welcome.
REALIZED ESG POTENTIAL
As with the S&P 500 ESG Index, another metric we can assess is the realized ESG potential of both
indices. By this measure, the S&P MidCap 400 ESG Index and S&P SmallCap 600 ESG Index realized
more than 9.59% and 7.65% of their ESG improvement potential of their respective starting universes.15
In the case of the S&P 400 and S&P 600, a predominately negative skew (implied by a positive
correlation between the S&P DJI ESG Score and firm size) that includes a handful of highly ranked
outliers (see Exhibit A1), accounts for the relatively low levels of realized S&P DJI ESG Score potential.
In other words, the generally low levels of S&P DJI ESG Score performance among small- and
medium-sized companies makes it difficult to substantially enhance the sustainability profile while
maintaining suitable diversification. The sensitivity of this particular metric to outliers explains the
comparatively low levels of realized ESG potential. On the other hand, this also suggests that there is
meaningful room for improvement in the sustainability practices of small- and medium-sized firms.
Thus, the introduction of the S&P MidCap 400 ESG Index and S&P SmallCap 600 ESG Index
14 As of April 30, 2021, the composite S&P DJI ESG Score of the S&P MidCap 400 ESG Index was 32.67 and the S&P SmallCap 600 ESG
Index was 20.47, compared with the S&P 400 score of 25.79 and S&P 600 score of 16.48. S&P DJI ESG Scores are designed to be read as percentiles. A company score of 70 means that company has a higher score than 70% of its peers in that particular industry. Thus, a
score of 25.79 means that the S&P 400 had a collectively higher score than 25.79% and the S&P 600 had a collectively higher score of 16.48% of the companies in the broader universe.
15 As of April 30, 2021, a score increase of 6.89 associated with the S&P MidCap 400 ESG Index represents 9.59% ((6.89)/(97.58-25.79)) of the possible ESG improvement that the index could achieve (97.58 is the highest score in the S&P 400). Similarly, a score increase of 3.99
for the S&P SmallCap 600 ESG Index represents 7.65% ((3.99)/(68.65-16.48)) of the possible ESG improvement that the index could achieve (68.65 is the highest score in the S&P 600). Realized ESG potential is calculated as the percentage difference between the aggregate S&P DJI ESG Scores of the S&P MidCap 400 ESG Index and the S&P 400, relative to the strategy’s maximum potential ESG improvement based on investing only in the single highest-ranked ESG scoring company in the benchmark.

The S&P 500 ESG Index: Def ining the Sustainable Core July 2021
INDEX EDUCATION | ESG 23
For use with institutions only, not for use with retail investors
successfully helps to raise sustainability standards and might underpin the strongest value proposition
for the markets overall.
As with their large-cap counterpart, certain sectors fared better in terms of their realized ESG potential,
and again in some cases, even more so than the index overall (see Exhibit A6).
Exhibit A6: Realized ESG Potential of the S&P MidCap 400 ESG Index and S&P SmallCap 600 ESG Index versus the Underlying Indices
Source: S&P Dow Jones Indices LLC. Data as of April 30, 2021. Realized ESG potential calculated as the percentage difference between the performance of the S&P MidCap 400 ESG Index and S&P 400 constituents and between the S&P SmallCap 600 ESG Index and S&P 600 across
these metrics on a weighted average basis. Charts are provided for illustrative purposes.
REAL-WORLD BENEFITS
The S&P MidCap 400 ESG Index and S&P SmallCap 600 ESG Index also achieve numerous real-
world ESG impacts, which provide a deeper view on the sustainability benefits. A small sample of
these sustainability enhancements are highlighted in Exhibit A7. It is worth noting that the majority of
these relate to the transparency of ESG issues, rather than actual performance. Again, this represents
the generally low levels of ESG disclosure and sustainable business practices among small- and
medium-sized firms. However, transparency and reporting are often the first steps as companies
embark on their sustainability journeys, as the dictum “we first have to measure, before we can
manage” suggests.
0% 20% 40% 60%
Financials
S&P MidCap 400 ESG Index
Real Estate
Information Technology
Consumer Discretionary
Materials
Health Care
Industrials
Communication Services
Consumer Staples
Energy
Utilities
Realized ESG Potential (%)
S&P MidCap 400 ESG Index
0% 20% 40% 60%
Financials
Communication Services
S&P SmallCap 600 ESG Index
Real Estate
Information Technology
Health Care
Materials
Consumer Discretionary
Energy
Consumer Staples
Industrials
Utilities
Realized ESG Potential (%)
S&P SmallCap 600 ESG Index

The S&P 500 ESG Index: Def ining the Sustainable Core July 2021
INDEX EDUCATION | ESG 24
For use with institutions only, not for use with retail investors
Exhibit A7: Benefits of the S&P MidCap 400 ESG Index and S&P SmallCap 600 ESG Index versus the Underlying Indices
Source: S&P Dow Jones Indices LLC. Data as of April 30, 2021. These are just a few examples of the numerous ways in which the S&P MidCap 400 ESG Index and S&P SmallCap ESG Index offer enhanced ESG representation. Increased index exposure to each ESG theme in the metrics are calculated using the question-level data in S&P Global’s CSA (2020 methodology year). These metrics are calculated as the percentage difference between the performance of the S&P MidCap 400 ESG Index and S&P 400 constituents and between the performance of the S&P
SmallCap 600 ESG Index and S&P 600 across these metrics on a weighted average basis. Charts are provided for illustrative purposes.
The S&P 500 ESG Index: Def ining the Sustainable Core July 2021
INDEX EDUCATION | ESG 25
For use with institutions only, not for use with retail investors
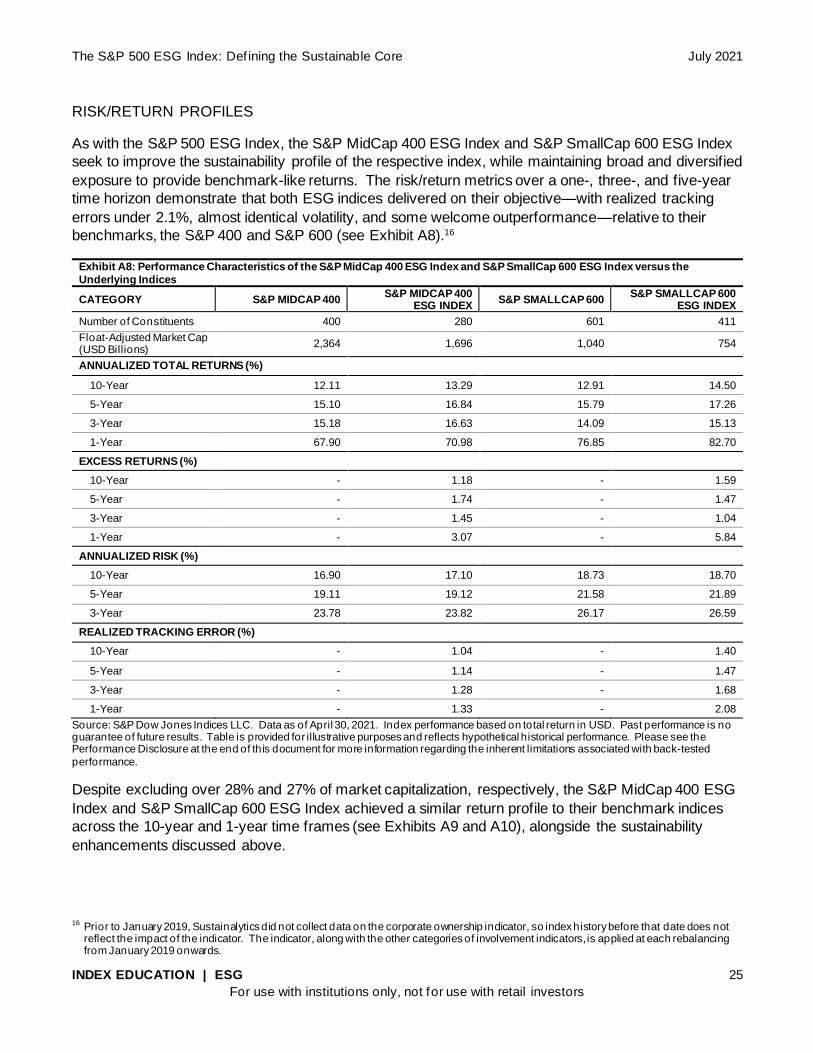
RISK/RETURN PROFILES
As with the S&P 500 ESG Index, the S&P MidCap 400 ESG Index and S&P SmallCap 600 ESG Index
seek to improve the sustainability profile of the respective index, while maintaining broad and diversified
exposure to provide benchmark-like returns. The risk/return metrics over a one-, three-, and five-year
time horizon demonstrate that both ESG indices delivered on their objective—with realized tracking
errors under 2.1%, almost identical volatility, and some welcome outperformance—relative to their
benchmarks, the S&P 400 and S&P 600 (see Exhibit A8).16
Exhibit A8: Performance Characteristics of the S&P MidCap 400 ESG Index and S&P SmallCap 600 ESG Index versus the
Underlying Indices
CATEGORY S&P MIDCAP 400 S&P MIDCAP 400
ESG INDEX S&P SMALLCAP 600
S&P SMALLCAP 600 ESG INDEX
Number of Constituents 400 280 601 411
Float-Adjusted Market Cap (USD Billions)
2,364 1,696 1,040 754
ANNUALIZED TOTAL RETURNS (%)
10-Year 12.11 13.29 12.91 14.50
5-Year 15.10 16.84 15.79 17.26
3-Year 15.18 16.63 14.09 15.13
1-Year 67.90 70.98 76.85 82.70
EXCESS RETURNS (%)
10-Year - 1.18 - 1.59
5-Year - 1.74 - 1.47
3-Year - 1.45 - 1.04
1-Year - 3.07 - 5.84
ANNUALIZED RISK (%)
10-Year 16.90 17.10 18.73 18.70
5-Year 19.11 19.12 21.58 21.89
3-Year 23.78 23.82 26.17 26.59
REALIZED TRACKING ERROR (%)
10-Year - 1.04 - 1.40
5-Year - 1.14 - 1.47
3-Year - 1.28 - 1.68
1-Year - 1.33 - 2.08
Source: S&P Dow Jones Indices LLC. Data as of April 30, 2021. Index performance based on total return in USD. Past performance is no guarantee of future results. Table is provided for illustrative purposes and reflects hypothetical historical performance. Please see the Performance Disclosure at the end of this document for more information regarding the inherent limitations associated with back-tested
performance.
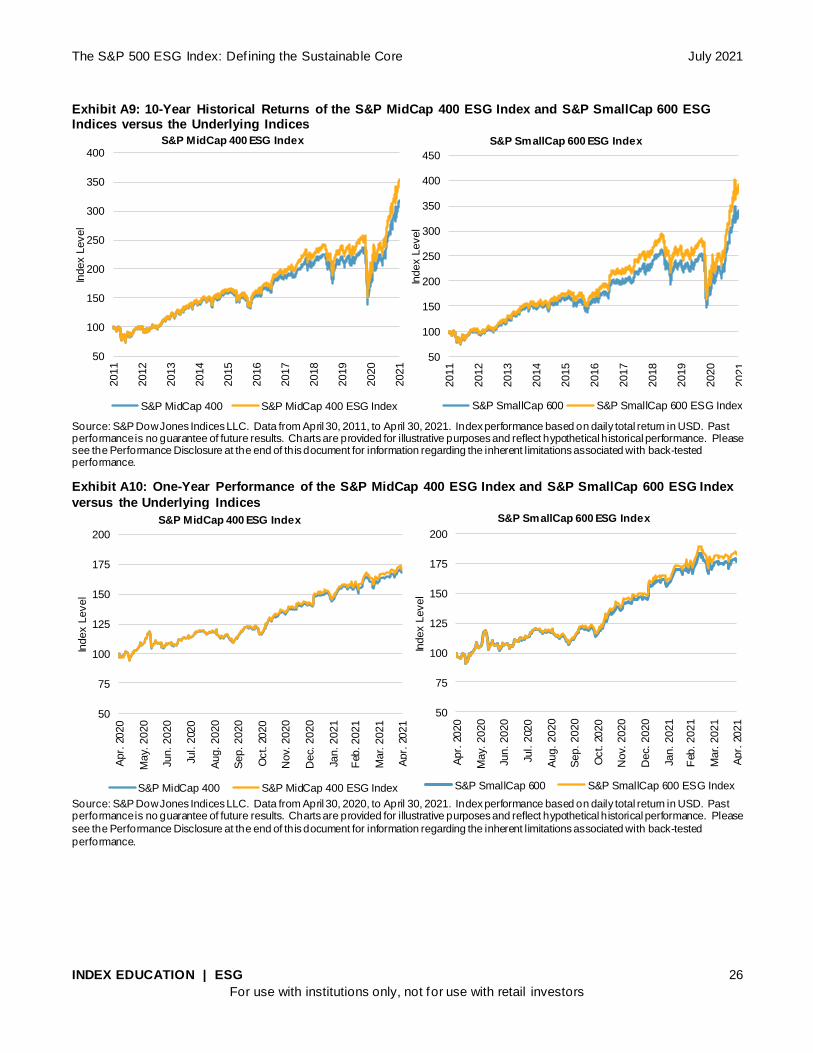
Despite excluding over 28% and 27% of market capitalization, respectively, the S&P MidCap 400 ESG
Index and S&P SmallCap 600 ESG Index achieved a similar return profile to their benchmark indices
across the 10-year and 1-year time frames (see Exhibits A9 and A10), alongside the sustainability
enhancements discussed above.
16 Prior to January 2019, Sustainalytics did not collect data on the corporate ownership indicator, so index history before that date does not
reflect the impact of the indicator. The indicator, along with the other categories of involvement indicators, is applied at each rebalancing from January 2019 onwards.
The S&P 500 ESG Index: Def ining the Sustainable Core July 2021
INDEX EDUCATION | ESG 26
For use with institutions only, not for use with retail investors
Exhibit A9: 10-Year Historical Returns of the S&P MidCap 400 ESG Index and S&P SmallCap 600 ESG Indices versus the Underlying Indices
Source: S&P Dow Jones Indices LLC. Data from April 30, 2011, to April 30, 2021. Index performance based on daily total return in USD. Past performance is no guarantee of future results. Charts are provided for illustrative purposes and reflect hypothetical historical performance. Please see the Performance Disclosure at the end of this document for information regarding the inherent limitations associated with back-tested performance.
Exhibit A10: One-Year Performance of the S&P MidCap 400 ESG Index and S&P SmallCap 600 ESG Index
versus the Underlying Indices
Source: S&P Dow Jones Indices LLC. Data from April 30, 2020, to April 30, 2021. Index performance based on daily total return in USD. Past performance is no guarantee of future results. Charts are provided for illustrative purposes and reflect hypothetical historical performance. Please
see the Performance Disclosure at the end of this document for information regarding the inherent limitations associated with back-tested
performance.
50
100
150
200
250
300
350
400
2011
2012
2013
2014
2015
2016
2017
2018
2019
2020
2021
Index L
evel
S&P MidCap 400 ESG Index
S&P MidCap 400 S&P MidCap 400 ESG Index
50
100
150
200
250
300
350
400
450
2011
2012
2013
2014
2015
2016
2017
2018
2019
2020
2021
Index L
evel
S&P SmallCap 600 ESG Index
S&P SmallCap 600 S&P SmallCap 600 ESG Index
50
75
100
125
150
175
200
Apr.
2020
May.
2020
Jun. 2020
Jul. 2
020
Aug. 2020
Sep. 2020
Oct. 2
020
Nov.
2020
Dec.
2020
Jan. 2021
Feb
. 2021
Mar. 2
021
Apr.
2021
Index L
evel
S&P MidCap 400 ESG Index
S&P MidCap 400 S&P MidCap 400 ESG Index
50
75
100
125
150
175
200
Apr.
2020
May.
2020
Jun. 2020
Jul. 2
020
Aug. 2020
Sep. 2020
Oct. 2
020
Nov.
2020
Dec.
2020
Jan. 2021
Feb
. 2021
Mar. 2
021
Apr.
2021
Index L
evel
S&P SmallCap 600 ESG Index
S&P SmallCap 600 S&P SmallCap 600 ESG Index
The S&P 500 ESG Index: Def ining the Sustainable Core July 2021
INDEX EDUCATION | ESG 27
For use with institutions only, not for use with retail investors
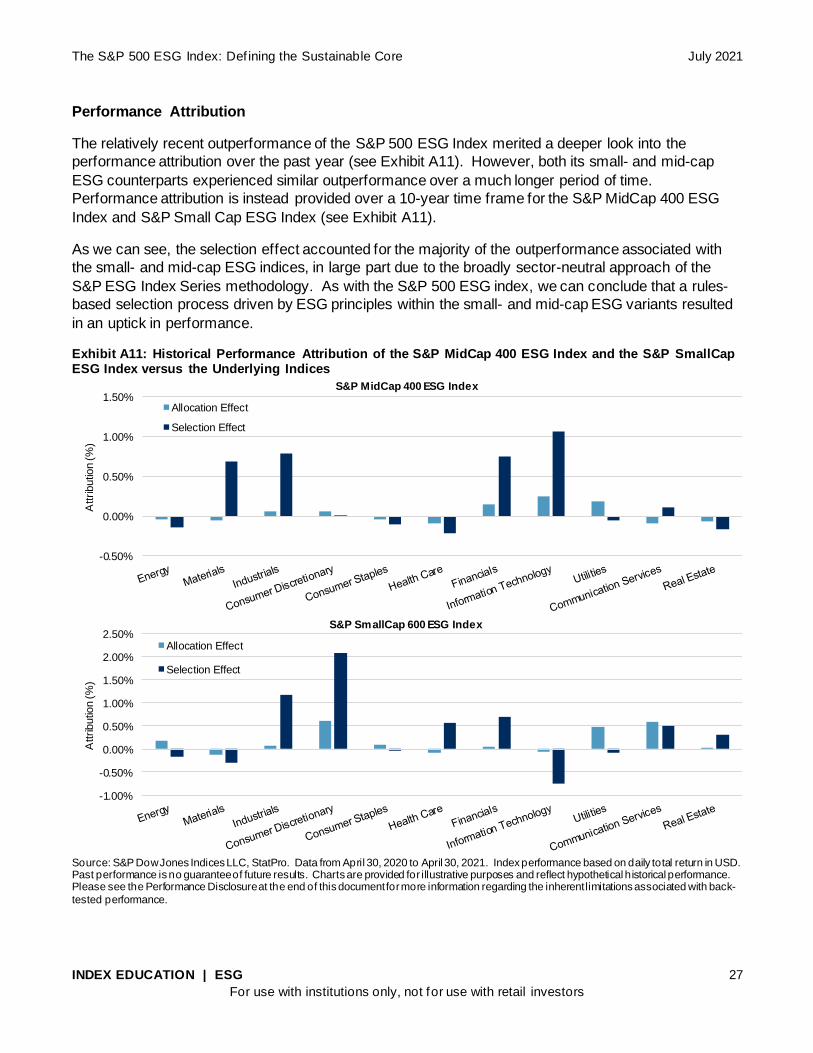
Performance Attribution
The relatively recent outperformance of the S&P 500 ESG Index merited a deeper look into the
performance attribution over the past year (see Exhibit A11). However, both its small- and mid-cap
ESG counterparts experienced similar outperformance over a much longer period of time.
Performance attribution is instead provided over a 10-year time frame for the S&P MidCap 400 ESG
Index and S&P Small Cap ESG Index (see Exhibit A11).
As we can see, the selection effect accounted for the majority of the outperformance associated with
the small- and mid-cap ESG indices, in large part due to the broadly sector-neutral approach of the
S&P ESG Index Series methodology. As with the S&P 500 ESG index, we can conclude that a rules-
based selection process driven by ESG principles within the small- and mid-cap ESG variants resulted
in an uptick in performance.
Exhibit A11: Historical Performance Attribution of the S&P MidCap 400 ESG Index and the S&P SmallCap ESG Index versus the Underlying Indices
Source: S&P Dow Jones Indices LLC, StatPro. Data from April 30, 2020 to April 30, 2021. Index performance based on daily total return in USD. Past performance is no guarantee of future results. Charts are provided for illustrative purposes and reflect hypothetical historical performance. Please see the Performance Disclosure at the end of this document for more information regarding the inherent limitations associated with back-
tested performance.
-0.50%
0.00%
0.50%
1.00%
1.50%
Attributio
n (%
)
S&P MidCap 400 ESG Index
Allocation Effect
Selection Effect
-1.00%
-0.50%
0.00%
0.50%
1.00%
1.50%
2.00%
2.50%
Attributio
n (%
)
S&P SmallCap 600 ESG Index
Allocation Effect
Selection Effect

The S&P 500 ESG Index: Def ining the Sustainable Core July 2021
INDEX EDUCATION | ESG 28
For use with institutions only, not for use with retail investors
Factor Exposure
Interestingly, though the S&P 500 ESG Index has exhibited a slight large-cap bias (see Exhibit A12),
the S&P 400 MidCap ESG Index and S&P SmallCap 600 ESG Index had almost identical factor
exposures to their respective benchmark indices (see Exhibit A12). As such, the historical
outperformance cannot be explained away by any unintended factor exposure. This seems to suggest
that ESG might just be a factor below a certain cap size, although further research is needed to
confirm.
Moreover, as the sustainability credentials of such companies improve, it is also entirely possible that
the largest among the small- and medium-sized firms comprising the S&P 400 and S&P 600 universe
are better positioned to do so, such that we might possibly observe a similar increase in the underlying
size bias associated with these indices over time. Nevertheless, the similarities in the overall factor
exposure of both indices at present at least confirms that—just as their large-cap counterpart—the
S&P MidCap 400 ESG Index and S&P SmallCap 600 ESG Index have been well positioned to do
precisely what they are intended to do.
Exhibit A12: Factor Exposure of the S&P MidCap 400 ESG Index and S&P SmallCap 600 ESG Index versus the Underlying Indices
Source: S&P Dow Jones Indices LLC. Data as of April 30, 2021. Charts are provided for illustrative purposes.
Rebalance and Exclusions
As with all the indices within the S&P ESG Index Series, the small- and mid-cap ESG indices rebalance
annually in April. At the time of the most recent rebalance, the S&P Midcap 400 ESG Index excluded
119 companies, and the S&P SmallCap ESG 600 Index excluded 191 companies.17 The largest
exclusions by market capitalization and the reason for their exclusion can be found in Exhibit A14.
17 In September 2020, S&P DJI conducted an extraordinary rebalance on the S&P ESG Index Series in response to a public consultat ion that
resulted in the exclusion of thermal coal companies. Many of the exhibits in the addendum reference the September extraordinary rebalance date. For more information on the public consultation and the extraordinary rebalance, please visit www.spglobal/spdji.
Low Volatility
Momentum
Value
High BetaDividend
Quality
Small Size
S&P MidCap 400 ESG Index
Low Volatility
Momentum
Value
High BetaDividend
Quality
Small Size
S&P SmallCap 600 ESG Index
Benchmark Benchmark

The S&P 500 ESG Index: Def ining the Sustainable Core July 2021
INDEX EDUCATION | ESG 29
For use with institutions only, not for use with retail investors
Exhibit A14: Largest Exclusions from the S&P Midcap 400 ESG Index and S&P SmallCap 600 ESG Index
S&P MIDCAP 400 ESG INDEX COMPANY WEIGHT (%) REASON
Trex Co 0.53 S&P DJI ESG Score in the bottom 25% of local GICS industry group or bottom 10% overall
Lennox International Inc 0.49 S&P DJI ESG Score in the bottom 25% of local GICS industry group or
bottom 10% overall
Five Below Inc. 0.48 S&P DJI ESG Score in the bottom 25% of local GICS industry group or
bottom 10% overall
Repligen Corp 0.46 S&P DJI ESG Score in the bottom 25% of local GICS industry group or bottom 10% overall
Pra Health Sciences Inc 0.46 Eligible but not selected
Essential Utilities Inc 0.45 S&P DJI ESG Score in the bottom 25% of local GICS industry group or bottom 10% overall
Reliance Steel & Aluminum 0.43 S&P DJI ESG Score in the bottom 25% of local GICS industry group or bottom 10% overall
Builders FirstSource 0.42 S&P DJI ESG Score in the bottom 25% of local GICS industry group or bottom 10% overall
MKS Instruments Inc 0.42 S&P DJI ESG Score in the bottom 25% of local GICS industry group or
bottom 10% overall
Watsco Inc 0.41 S&P DJI ESG Score in the bottom 25% of local GICS industry group or bottom 10% overall
S&P SMALLCAP 600 ESG INDEX COMPANY WEIGHT (%) REASON
CROCS 0.63 Eligible but not selected
NeoGenomics Inc. 0.55 Eligible but not selected
UFP Industries, Inc 0.49 S&P DJI ESG Score in the bottom 25% of local GICS industry group or
bottom 10% overall
Innovative Industrial Properties 0.42 Eligible but not selected
Resideo Technologies Inc 0.41 Eligible but not selected
Alarm.com Holdings, Inc. 0.39 S&P DJI ESG Score in the bottom 25% of local GICS industry group or
bottom 10% overall
Stamps.com Inc 0.36 Eligible but not selected
Korn Ferry 0.35 Eligible but not selected
LGI Homes Inc 0.35 Eligible but not selected
PDC Energy Inc 0.35 S&P DJI ESG Score in the bottom 25% of local GICS industry group or bottom 10% overall
Source: S&P Dow Jones Indices LLC. Data as of April 30, 2021. Table is provided for illustrative purposes.
Conclusion
The expansion of the S&P DJI ESG Index Series into the mid- and small-cap universes represents a watershed
moment in the landscape for sustainable investing. As the f irst of their kind, the S&P MidCap 400 ESG Index and
S&P SmallCap 600 ESG Index enable market participants to enhance the sustainability characteristics of the core
of their portfolios, and across all cap sizes, while maintaining similar levels of risk/return to their respective
benchmarks. Most importantly, however, they are uniquely positioned to drive greater reporting and sustainability
standards among small- and medium-sized f irms, as companies compete to join the ranks of the ESG indices for
the f irst time ever.

The S&P 500 ESG Index: Def ining the Sustainable Core July 2021
INDEX EDUCATION | ESG 30
For use with institutions only, not for use with retail investors
PERFORMANCE DISCLOSURE/BACK-TESTED DATA
The S&P 500 ESG Index was launched January 28, 2019. The S&P SmallCap 600 ESG Index and S&P MidCap 400 ESG Index were
launched January 11, 2021. All information presented prior to an index’s Launch Date is hypothetical (back-tested), not actual performance. The back-test calculations are based on the same methodology that was in effect on the index Launch Date. However, when creating back-tested history for periods of market anomalies or other periods that do not reflect the general current market environment, i ndex methodology rules may be relaxed to capture a large enough universe of securities to simulate the target market the index is designed to measure or
strategy the index is designed to capture. For example, market capitalization and liquidity thresholds may be reduced. Complete index methodology details are available at www.spglobal.com/spdji. Past performance of the Index is not an indication of future results. Back-tested performance reflects application of an index methodology and selection of index constituents with the benefit of hindsight and knowledge of factors that may have positively affected its performance, cannot account for all financial risk that may affect results and may be considered to
reflect survivor/look ahead bias. Actual returns may differ significantly from, and be lower than, back-tested returns. Past performance is not an indication or guarantee of future results. Please refer to the methodology for the Index for more details about the index, including the manner in which it is rebalanced, the timing of such rebalancing, criteria for additions and deletions, as well as all index calculations. Back-
tested performance is for use with institutions only; not for use with retai l investors.
S&P Dow Jones Indices defines various dates to assist our clients in providing transparency. The First Value Date is the first day for which there is a calculated value (either live or back-tested) for a given index. The Base Date is the date at which the index is set to a fixed value for calculation purposes. The Launch Date designates the date when the values of an index are first considered live: index values provided for
any date or time period prior to the index’s Launch Date are considered back-tested. S&P Dow Jones Indices defines the Launch Date as the date by which the values of an index are known to have been released to the public, for example via the company’s public webs ite or its data feed to external parties. For Dow Jones-branded indices introduced prior to May 31, 2013, the Launch Date (which prior to May 31, 2013, was termed “Date of introduction”) is set at a date upon which no further changes were permitted to be made to the index methodol ogy, but that
may have been prior to the Index’s public release date.
Typically, when S&P DJI creates back-tested index data, S&P DJI uses actual historical constituent-level data (e.g., historical price, market capitalization, and corporate action data) in its calculations. As ESG investing is still in early stages of development, certain datapoints used to calculate S&P DJI’s ESG indices may not be available for the entire desired period of back -tested history. The same data availability issue
could be true for other indices as well. In cases when actual data is not available for all relevant historical periods, S&P DJI may employ a process of using “Backward Data Assumption” (or pulling back) of ESG data for the calculation of back -tested historical performance. “Backward Data Assumption” is a process that applies the earliest actual live data point available for an index constituent company to all prior
historical instances in the index performance. For example, Backward Data Assumption inherently assumes that companies currently not involved in a specific business activity (also known as “product involvement”) were never involved historically and similarly also ass umes that companies currently involved in a specific business activity were involved historically too. The Backward Data Assumption allows the hypothetical back-test to be extended over more historical years than would be feasible using only actual data. For more information on
“Backward Data Assumption” please refer to the FAQ. The methodology and factsheets of any index that employs backward assumption in the back-tested history will explicitly state so. The methodology will include an Appendix with a table setting forth the specific data points and relevant time period for which backward projected data was used.
Index returns shown do not represent the results of actual trading of investable assets/securities. S&P Dow Jones Indices mai ntains the index
and calculates the index levels and performance shown or discussed but does n ot manage actual assets. Index returns do not reflect payment of any sales charges or fees an investor may pay to purchase the securities underlying the Index or investment funds that are intended to track the performance of the Index. The imposition of these fees and charges would cause actual and back-tested performance of the securities/fund to be lower than the Index performance shown. As a simple example, if an index returned 10% on a US $100,000 investment
for a 12-month period (or US $10,000) and an actual asset-based fee of 1.5% was imposed at the end of the period on the investment plus accrued interest (or US $1,650), the net return would be 8.35% (or US $8,350) for the year. Over a three-year period, an annual 1.5% fee taken at year end with an assumed 10% return per year would result in a cumulative gross return of 33.10%, a total fee of US $5,375, and a
cumulative net return of 27.2% (or US $27,200).

The S&P 500 ESG Index: Def ining the Sustainable Core July 2021
INDEX EDUCATION | ESG 31
For use with institutions only, not for use with retail investors
GENERAL DISCLAIMER
© 2021 S&P Dow Jones Indices. All rights reserved. S&P, S&P 500, S&P 500 LOW VOLATILITY INDEX, S&P 100, S&P COMPOSITE 1500, S&P 400, S&P MIDCAP 400, S&P 600, S&P SMALLCAP 600, S&P GIVI, GLOBAL TITANS, DIVIDEND ARISTOCRATS, S&P TARGET DATE INDICES, S&P PRISM, S&P STRIDE, GICS, SPIVA, SPDR and INDEXOLOGY are registered trademarks of S&P Global, Inc. (“S&P Global”) or its affiliates. DOW JONES, DJ, DJIA, THE DOW and DOW JONES INDUSTRIAL AVERAGE are registered trademarks of Dow
Jones Trademark Holdings LLC (“Dow Jones”). These trademarks together with others have been licensed to S&P Dow Jones Indices LLC. Redistribution or reproduction in whole or in part are prohibited without written permission of S&P Dow Jones Indices LLC. This document does not constitute an offer of services in jurisdictions where S&P Dow Jones Indices LLC, S&P Global, Dow Jones or their respective
affiliates (collectively “S&P Dow Jones Indices”) do not have the necessary licenses. Except for certain custom index calculation services, all information provided by S&P Dow Jones Indices is impersonal and not tailored to the needs of any person, entity or group of persons. S&P Dow Jones Indices receives compensation in connection with licensing its indices to third parties and providing custom calculation services. Past performance of an index is not an indication or guarantee of future results.
It is not possible to invest directly in an index. Exposure to an asset class represented by an index may be available through investable instruments based on that index. S&P Dow Jones Indices does not sponsor, endorse, sell, promote or manage any investment fund or other investment vehicle that is offered by third parties and that seeks to provide an investment return based on the performance o f any index. S&P Dow Jones Indices makes no assurance that investment products based on the index will accurately track index performance or p rovide
positive investment returns. S&P Dow Jones Indices LLC is not an investment advisor, and S&P Dow Jones Indices makes no representation regarding the advisability of investing in any such investment fund or other investment vehicle. A decision to invest in any such investment fund or other investment vehicle should not be made in reliance on any of the statements set forth in this document. Prospective investors are advised to make an investment in any such fund or other vehicle only after carefully considering the risks associated with in vesting in such
funds, as detailed in an offering memorandum or similar document that is prepared by or on behalf of the issuer of the investment fund or other investment product or vehicle. S&P Dow Jones Indices LLC is not a tax advisor. A tax advisor should be consulted to evaluate the impact of any tax-exempt securities on portfolios and the tax consequences of making any particular investment decision. Inclusion of a
security within an index is not a recommendation by S&P Dow Jones Indices to buy, sell, or hold such security, nor is it considered to be investment advice. Closing prices for S&P Dow Jones Indices’ US benchmark indices are calculated by S&P Dow Jones Indices based on the closing price of the individual constituents of the index as set by their primary exchange. Closing prices are received by S&P Dow Jones Indices from one of its third party vendors and verified by comparing them with prices from an alternative vendor. The vendors receive the
closing price from the primary exchanges. Real-time intraday prices are calculated similarly without a second verification.
These materials have been prepared solely for informational purposes based upon information generally available to the public and f rom sources believed to be reliable. No content contained in these materials (including index data, ratings, credit-related analyses and data, research, valuations, model, software or other application or output therefrom) or any part thereof (“Content”) may be modified, reverse-
engineered, reproduced or distributed in any form or by any means, or stored in a database or retrieval system, without the prior written permission of S&P Dow Jones Indices. The Content shall not be used for any unlawful or unauthorized purposes. S&P Dow Jones Indices and its third-party data providers and licensors (collectively “S&P Dow Jones Indices Parties”) do not guarantee the accuracy, completeness, timeliness or availability of the Content. S&P Dow Jones Indices Parties are not responsible for any errors or omissions, regardless of the
cause, for the results obtained from the use of the Content. THE CONTENT IS PROVIDED ON AN “AS IS” BASIS. S&P DOW JONES INDICES PARTIES DISCLAIM ANY AND ALL EXPRESS OR IMPLIED WARRANTIES, INCLUDING, BUT NOT LIMITED TO, ANY WARRANTIES OF MERCHANTABILITY OR FITNESS FOR A PARTICULAR PURPOSE OR USE, FREEDOM FROM BUGS, SOFTWARE
ERRORS OR DEFECTS, THAT THE CONTENT’S FUNCTIONING WILL BE UNINTERRUPTED OR THAT THE CONTENT WILL OPERATE WITH ANY SOFTWARE OR HARDWARE CONFIGURATION. In no event shall S&P Dow Jones Indices Parties be liable to any party for any direct, indirect, incidental, exemplary, compensatory, punitive, special or consequential damages, costs, expenses, legal fees, or losses (including, without limitation, lost income or lost profits and opportunity costs) in connection with any use of the Content even if advised of the
possibility of such damages.
S&P Global keeps certain activities of its various divisions and business units separate from each other in order to preserve the independence and objectivity of their respective activities. As a result, certain divisions and business units of S&P Global may have information that is not available to other business units. S&P Global has established policies and procedures to maintain the confidentiality of certain non-public
information received in connection with each analytical process.
In addition, S&P Dow Jones Indices provides a wide range of services to, or relating to, many organizations, including issuers of securities, investment advisers, broker-dealers, investment banks, other financial institutions and financial intermediaries, and accordingly may receive fees or other economic benefits from those organizations, including organizations whose securities or services they may recommend, rate,
include in model portfolios, evaluate or otherwise address.
The Global Industry Classification Standard (GICS®) was developed by and is the exclusive property and a trademark of S&P and MSCI. Neither MSCI, S&P nor any other party involved in making or compiling any GICS classifications makes any express or implied warranties or
representations with respect to such standard or classification (or the results to be obtained by the use thereof), and all suc h parties hereby expressly disclaim all warranties of originality, accuracy, completeness, merchantability or fitness for a particular purpose with respect to any of such standard or classification. Without limiting any of the foregoing, in no event shall MSCI, S&P, any of their affiliates or any third party involved in making or compiling any GICS classifications have any liability for any direct, indirect, special, punitive, consequential or any other
damages (including lost profits) even if notified of the possibility of such damages.
S&P Global provides the data that powers the globally recognized Dow Jones Sustainability Indices, S&P 500 ESG Index, and others in the S&P ESG Index Series. Each year, S&P Global conducts the Corporate Sustainability Assessment, an ESG analysis of over 7,300 companies. The CSA has produced one of the world’s most comprehensive databases of financially material sustainability information, and
serves as the basis for the scores that govern S&P DJI ESG indices.