Embed Size (px)
Citation preview

The Scaling Habits of ASP.NET Applications
Richard Campbell
Background After thirty years, done every job in the computer industry you’ve
ever heard of Currently
Co-Founder and Product Evangelist for Strangeloop Networks Co-Host of .NET Rocks! Host of RunAs Radio
Richard Campbell
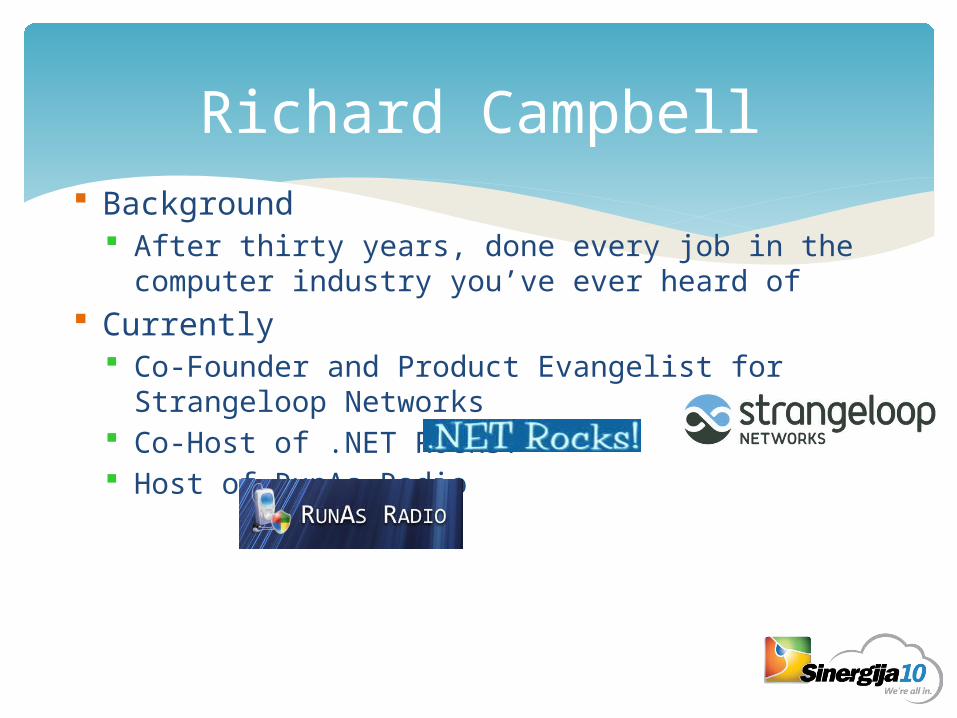
50 000 foot view
Time
Pag
e V
iew
s
Version 1 Version 2 Version 3 Version N
Make it Work
Make it WorkRight
BusinessTraction
Business Success

Capacity Total number of known users Number of active users (aka active sessions) Number of concurrent users (aka concurrent requests)
Throughput Page Views per Month Requests per Second Transactions per Second
Performance Load time in milliseconds Time to first byte (TTFB), Time to last byte (TTLB)
What are we measuring?

The Anatomy of a Web Request

Performance Equation
Legend:
R: Response time
RTT: Round Trip Time
App Turns: Http Requests
Concurrent Requests: # server sockets open by browser
Cs: Server Side Compute time
Cc: Client Compute time
Source: Field Guide to Application Delivery Systems, by Peter Sevcik and Rebecca Wetzel, NetForecast

Where do the numbers come from?
Ping statistics for 209.162.190.188: Packets: Sent = 4, Received = 4, Lost = 0 (0% loss),Approximate round trip times in milli-seconds: Minimum = 80ms, Maximum = 92ms, Average = 85ms
4.5 sec
http://www.websiteoptimization.com/services/analyze/
http://www.speedtest.net/
Server Code Timing: 0.8 secs
Client Code Timing: 1.2 secs

Factor 1 Factor 2 Factor 3 TimeP1 = Payload/Bandwidth 208 KB Payload 717 KB/Sec Bandwidth 0.29 secondsP2 = AppTurns * Roundtrip Time 51 Appturns 85 ms Roundtrip 2 Concurrent Requests 2.168 secondsP3 = Compute Time at Server 0.8 Seconds 0.8 secondsP4 = Compute Time at Client 1.2 Seconds 1.2 seconds
4.458 seconds
Performance Spreadsheet

Get Version 1 out the door Define the initial hardware platform Meet the launch date
Version 1: Make it work
The only one who likes your app is you

10 to 50 requests/second 5 to 15 users 15 active sessions at peak Problems with performance on areas of the site
Multi-User Issues Complex input screens Reports
Scaling Habits

Fix logical scaling problems Multi-user data access
Get user feedback Humiliating but useful Fix the actual user pains Watch your app in use
Solutions for Version 1

Focus on features What is missing
Bug Fixing Rethink the App or UI
Some new directions Larger and more diverse users base
Version 2: Make it work right
Now your boss likes your app too

50 to 100 requests/second 15 to 50 users (5-10 are remote!) 30 active sessions at peak Problems
Fights with IT over remote access Reach the single server limit
What does this look like?
Scaling Habits


Memory consumption above 80% Processor consumption at 100% all the time Request queues start to grow out of hand Page timeouts (server not available) Sessions get lost People can’t finish their work!
What does it really look like?

More Hardware Dedicated web server Separate database server (probably shared)
Find the low hanging fruit Fix querying Get your page size under control
Solutions for Version 2

Version 3: Business Traction
Weighing business priorities Formal IT transition point There is budget
Scaling versus Reliability Which one is more important
99% verses 100% up time Cost of Reliability
People you don’t know like your app

300 to 1000 requests/second 100 to 500 users 300 active sessions at peak Problems
Performance is now front and center Consequences of downtime are now significant
Scaling Habits

Network IQ Test Explain each of the
Web.config file Explain the load-balancing
scheme required by the app
Explain the bottlenecks of the production system
Network vs. Development IQ
Development IQ Test Explain the network
diagram of your application
Explain how to access the production log files
Explain the redundancy model of the production system

Move to multiple web servers: You need a load balancer More bandwidth: Move to a hosting facility Get methodical, use profiling
Red Gate Ants, SQL Profiler, Web Site Optimizer Get the facts on the problem areas
Work methodically and for the business on addressing slowest lines of code
Focus on understanding what the right architecture is rather than ad-hoc architecting
Let the caching begin!
Solutions for Version 3

IT costs now out weigh the software development Getting new features to production takes months
Or Cowboy it! (which always happens) IT and Dev process is a focus – Tech Politics
Version N: Business Success
It’s no longer your app

500+ requests/second 5000+ users 3000 active sessions at peak Problems
Running out of memory with inproc sessions Worker process recycling Cache Coherency Session Management
Scaling Habits

A Word About Load-balancing
Load BalancerVirtual IP
Web Server 1 Web Server 2 Web Server 3 Web Server 4
Persistent DataSession?
Sticky vs. Round Robin vs. WMI

Now the problem is that scale and performance are intertwined A new class of ‘timing’ problem shows up under load (and
are almost impossible to reproduce outside of production) Caches are flushed more than expected
And performance plummets
Performance and Scale

Your architecture is now hardware and software Use third party accelerators Create a performance team and focus on best practices Use content routing
Separate and pre-generate all static resources
Cache, cache, and more cache Output Cache – All static pages are cached Response.Cache – Look for database gets with few updates
Solutions for Version N

Focus on actual user performance problems What is reality?
Start with low hanging fruit Use methodical, empirical performance improvement At large scale, the network is the computer
Summary