Embed Size (px)
Citation preview

Asian Journal of Management Sciences & Education Vol. 6(4) October 2017 __________________________________________________________________________________________________________________________________________________________________________________________________________________________________________________________________________________________________________________________________________________________________________________________________________________________________________________________________
Copyright © 2017 Leena and Luna International, Chikusei, Japan.
1 | P a g e (株) リナアンドルナインターナショナル, 筑西市,日本
ISSN: 2186-845X ISSN: 2186-8441 Print
www.ajmse. leena-luna.co.jp
THE SCAVENGERS’ INCOME OF THE DISTRICT OF NORTH
PADANG SIDIMPUAN, INDONESIA
Sulhana Lely Lubis
Universitas Graha Nusantara, Padang Sidimpuan,
INDONESIA.
ABSTRACT
The poor group income such as the scavengers’ one showed the economic condition
of one city. This paper focuses on the several factors which influence the economic
level of poor group such the amount of household waste, level of education, and cost
of living. This study analyzed the household waste variable (X1), level of education
(X2), cost of living (X3) which gave the significant influence on scavengers' income in
the district of North Padang Sidimpuan, Padang Sidimpuan city, Indonesia. The data
contained the distribution items of each variable; with linear regression and partial
regression analysis, thus they showed the simultaneous household waste variables
(X1), level of education (X2), cost of living (X3) on scavengers’ income (Y)
organized by value of r- Square is 0,921. It concluded that the household waste (X1),
level of education (X2), cost of living (X3) had a significant and positively partially
effect to the scavengers’ income in the district North of Padang Sidimpuan, Padang
Sidimpuan city.
Keywords: scavengers’ income, household waste, level of education and cost
of living.
INTRODUCTION
Income of poor group in a country shows the people productivity. National income
According to Junaiddin Zakaria (2008: 9) is the amount of income received by all family
households (Indonesia=RTKs) in a country from the delivery of factors of production in one
period, usually for one year. The concept of national income was first initiated by Sir William
Petty of England who sought to estimate the national income of his country (England) in
1665. In his calculations, he used the assumption that national income was the sum of the cost
of living (consumption) for a year. However, that opinion is not agreed upon by modern
economists, because in the view of modern economics, consumption is not the only element
in the calculation of national income. According to them, the main tool as a measure of
economic activity is the Gross National Product (Gross National Product), ie the total amount
of goods and services produced each year by the country concerned is measured by market
price in a country. Thus, income, according to the Indonesian Institute of Accountants in
(http://sisyfasyfa4.blogspot.com/2012/04/pendapatan.html): "Revenue is income arising from
ordinary corporate activities and known as different names such as sales". This means that
income is one of the goals of the establishment of a business which becomes something very
important in every company. Without income there is no income or earnings will be earned.
This paper explores the garbage that used as the way of making life of scavengers; it is as the
result of natural processes often causes problems especially in urban areas. Scavengers are
seen as the lowest strata of the caste in our society. Perhaps it is because of their work that is
directly related to the waste. That is, it is only a few people of our society who realize how
great the role of waste pickers in waste management. The more developed a city due to the
increase of population and the increase of its life activity caused the problems caused by
increasingly large and complex garbage. Another thing is related to the increasingly difficult
Asian Journal of Management Sciences & Education Vol. 6(4) October 2017 __________________________________________________________________________________________________________________________________________________________________________________________________________________________________________________________________________________________________________________________________________________________________________________________________________________________________________________________________
ISSN: 2186-845X ISSN: 2186-8441 Print
www.ajmse. leena-luna.co.jp
Leena and Luna International, Chikusei, Japan. Copyright © 2017
(株) リナアンドルナインターナショナル, 筑西市,日本 P a g e | 2
and expensive to get the location of Final Disposal Site (Indonesai=TPA) waste, also its
location which has further extend the transportation and increase the cost of transportation.
Looking at the garbage problem, the scavengers actually have a role in managing the waste in
North Padangsidimpuan District, because the presence of the waste picker is very helpful in
reducing the amount of waste in North Padangsidimpuan Subdistrict so that people do not
need to dispose waste that can produce money, such as plastic, aqua bottles, Cardboard, iron,
metal and other items that can be sold. It is therefore important to examine how much income
and scavenger contributions in optimizing household wastes that can generate money in the
District of North Padangsidimpuan, Padangsidimpuan City.
Therefore, the environmental costs are costs incurred by the company related to
environmental damage caused and protection issued (Susenohaji in Rossje, 2006: 5). Internal
costs include both internal costs (related to reductions in production processes to reduce
environmental impacts) and external (related to repair of damage caused by waste).
According Ikhsan (2009: 135) that "Waste is a material that has been purchased and paid to
be directed into a product contained in the market". Waste therefore indicates production
inefficiency. Thus, the cost of waste materials, capital and labor must be added to arrive at
the amount of environmental costs and a basis for further calculations and decisions.
Environmental pollution according to the Law of the Republic of Indonesia Number 32 Year
2009 Article 1 point 2 on Environmental Protection and Management is a systematic and
integrated effort undertaken to preserve environmental functions and prevent the occurrence
of pollution and / or environmental damage which includes planning, utilization, Control,
maintenance, supervision, and law enforcement.
Recycling can prevent environmental pollution. The advantage is that the environmental load
is reduced. We know that pollution can not be eliminated. All we can do is prevent the
negative impact or control it. In addition to repetition and recycling, there are more efforts to
prevent contamination, ie reducing materials / savings (reduce), and perform maintenance
(repair). In developed countries, the slogans reuse, reduce, and repair, widely circulated to the
public. Based on the discussion above, the formulation of the research problem:” How does
the household waste affect the scavengers’ income the District of North Padang Sidimpuan,
North Sumatra Province of Indonesia ?
Household Waste
Liquid household waste is a source of water pollution. From liquid household waste can be
found various organic materials (eg vegetable residue, fish, rice, oil, fat, and human
wastewater) carried by water drains / ditches, and then join the river flow. There are also
inorganic materials such as plastics, aluminum, and bottles drifting in the water currents.
Trash is piled up, clogging waterways, and causing flooding. Other pollutants from
household waste are biological pollutants such as disease, bacteria, and fungi. Organic
material dissolved water will be decomposition and decaying. As a result oxygen levels in the
water dropped so that the biota of water will die. If the contamination of organic matter
increases, we can see the reddish Tubifex worms clustered. This worm is a biological
directive (bioindicator) of severe pollution by organic matter from residential waste. In cities,
the water got blackish and smelled stinging. In the soil water there is no living organism
except bacteria and fungi. Compared with industrial waste, household waste in urban areas in
Indonesia reaches 60% of all waste. According to Slamet Prawirohartono and Sri Hidayati
(2007: 266), Ecosystem is a functional unity between living creatures and their environment.
The interaction between organism and environment is not life. Ecosystem is a central concept
in ecology, which is an ecological system formed by reciprocal relationship between

Asian Journal of Management Sciences & Education Vol. 6(4) October 2017 __________________________________________________________________________________________________________________________________________________________________________________________________________________________________________________________________________________________________________________________________________________________________________________________________________________________________________________________________
Copyright © 2017 Leena and Luna International, Chikusei, Japan.
3 | P a g e (株) リナアンドルナインターナショナル, 筑西市,日本
ISSN: 2186-845X ISSN: 2186-8441 Print
www.ajmse. leena-luna.co.jp
creatures living with the environment. The sustainability of human life depends on predicted
ecological processes. If the process is uncertain, then humans will not know, such as when to
plant and when to harvest. Thus man will not be able to learn anything from nature, and can
not put forward hypotheses, and can not bring forth the laws of nature.
Garbage
Definition of waste according to Government Regulation No. 81 of 2012 on Management of
Household Waste and Garbage Similar Household Waste in Chapter 1, article 1 in points 1
and 2; 1).Household waste is garbage that comes from daily activities in households that do
not include stools and specific waste;2).Household waste comprises households from
commercial areas, industrial estates, special areas, social facilities, public facilities and other
facilities.
Garbage is an unwanted waste material after the end of a process. Garbage is defined by
humans according to degrees of exposure, in natural processes there is no concept of waste,
only the products produced after and during the natural process take place. Garbage (waste)
has many meanings within the limits of science. However, in principle, the definition of
waste is a material that is wasted or removed from sources of human and natural activities
that have no economic value. Human waste is a term commonly used for human digestion,
such as feces and urine. Human waste can be a serious health hazard because it can be used
as a vector (developmental tool) of virus and bacterial diseases. One of the major
developments in human dialectics is the reduction of disease transmission through human
waste through hygienic and sanitary lifestyles. This includes the development of plumbing
theory. Human waste can be reduced and reused for example through a waterless urinal
system.
Life of Scavengers
Scavengers are seen as the lowest strata of the caste in our society. Perhaps it is because of
their work that is directly related to the waste. That is, it is only a few people of our society
who realize how great the role of waste pickers in waste management. They choose the job
because scavenging is an informal job that does not require academic requirements. Social
interaction for scavengers, facilitating the circulation of collection and sale of used goods.
The strategy developed by scavengers to survive is by maintaining social networks both
vertically and horizontally.What it does is one of the tangible forms of environmental
management, since the garbage collected by scavengers is on average an organic waste such
as bottles / plastic glasses of mineral water, used cardboard, scrap iron, glass and so on. And
it turns out all of it still has the selling value. What is left by the scavengers is the organic
garbage that the management part is the task of the Local Government in this case is the duty
of the Office of Sanitation and Garden City. The scavenger can be divided into two, namely,
sedentary scavengers and scavengers who do not settle.
1. Permanent scavengers are scavengers residing in cardboard, plywood, tarpaulins or
other huts around the garbage dump.
2. While scavengers are not settled are scavengers who are looking for garbage from
alleys to alleys, streets, residents' garbage cans, river banks and others.
Not all of those who work as scavengers from scavenging results, some also just make
scavenging as a side job or to make extra money.
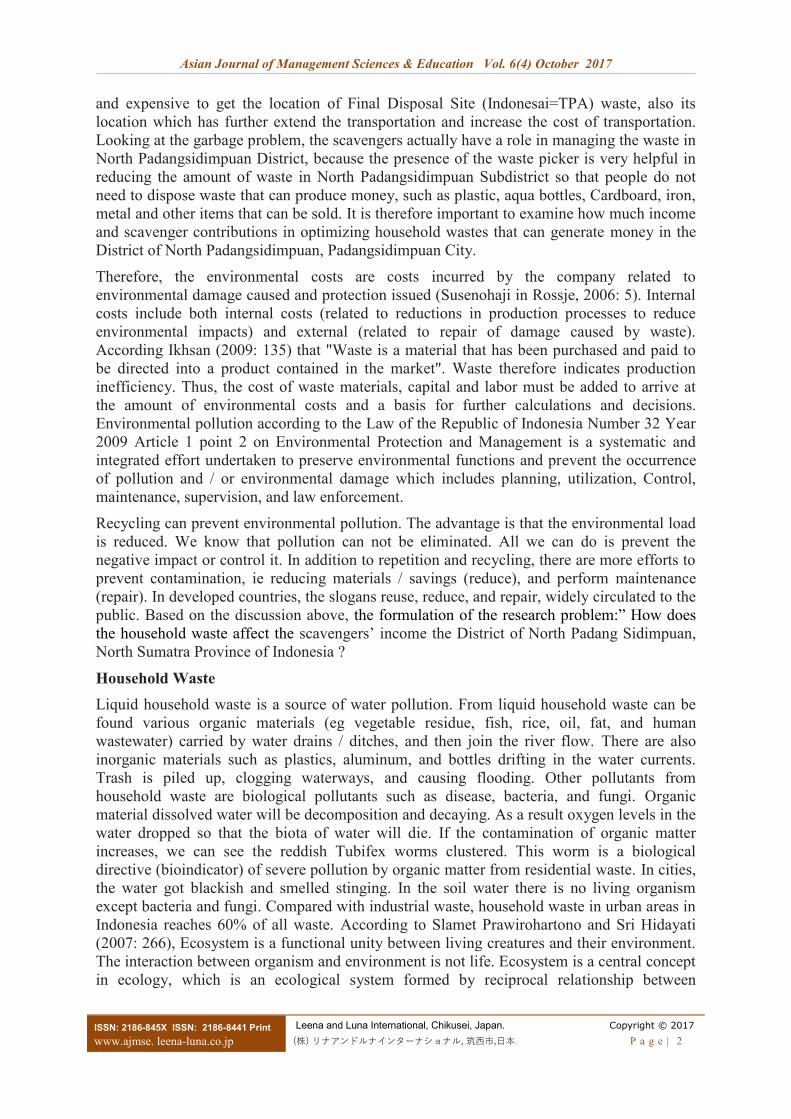
Framework of Thinking
The framework of thinking is a conceptual model of how theory relates to various factors that
have been identified as important issues. Based on the understanding in this study also seen

Asian Journal of Management Sciences & Education Vol. 6(4) October 2017 __________________________________________________________________________________________________________________________________________________________________________________________________________________________________________________________________________________________________________________________________________________________________________________________________________________________________________________________________
ISSN: 2186-845X ISSN: 2186-8441 Print
www.ajmse. leena-luna.co.jp
Leena and Luna International, Chikusei, Japan. Copyright © 2017
(株) リナアンドルナインターナショナル, 筑西市,日本 P a g e | 4
the influence of dependent and independent variables, then to see the development of waste
that becomes the object of research is needed analysis on the income aspect of the scavenger.
Therefore, in every preparation of research paradigm should be based on the framework of
thinking (Sugiyono, 2010). In summary the flow of the framework of thought in this study
can be seen in the following figure: Drinks, and bottles of shampoo.
Figure 1: Research thinking framework
RESEARCH METHOD
This research applied a quantitative design which connected the causal relationship between
independent variable that is Household Waste to dependent variable that is scavengers’
income in North Padang Sidimpuan Subdistrict, Padang Sidimpuan City. According to
(Sugiyono, 2006), "Population is a generalization region consisting of objects / subjects that
have certain qualities and characteristics set by the researchers to be studied and then drawn
conclusions. There were 20 scavengers as sample.
Technique of Data Analysis
A simple regression analysis is a regression equation that describes and explains the effect of
one independent variable on the dependent variable, in which the relationship of both can be
described as a straight line. (Puspowarsito, 2008) Data analysis tool used is inference
statistics that aims to test the hypothesis by using Multiple Linear Regression with the
following formula:
Y = a + b1x1 + b2x2 + b3x3
Where: Y = Revenue Scavenger
a = Constants
b = regression coefficient for X
X1 = household waste
X2 = Education Level
X3 = costs of living
The reason for choosing a logarithm model (Imam Ghozali, 2005: 25) is as follows:
1. Avoid the presence of heteroscedasticity
2. Knowing the coefficient showing elasticity
3. Close the data scale
In relation to the above, the research model using logarithm is as follows:
LnY = LnX1 + LnX2 + LnX3 + e
Note: Ln Y = Scavenger Income
Lnx1 = Household waste
Household Waste (X1)
Income
( (Y) Level of education (X2)
Costs of living (X3)

Asian Journal of Management Sciences & Education Vol. 6(4) October 2017 __________________________________________________________________________________________________________________________________________________________________________________________________________________________________________________________________________________________________________________________________________________________________________________________________________________________________________________________________
Copyright © 2017 Leena and Luna International, Chikusei, Japan.
5 | P a g e (株) リナアンドルナインターナショナル, 筑西市,日本
ISSN: 2186-845X ISSN: 2186-8441 Print
www.ajmse. leena-luna.co.jp
Lnx2 = Education Level
Lnx3 = costs of living
e = annoying error (Standard Error)
The formula coefficient of determination can be shown as follows:
KP = r² x 100%
Note: KP = coefficient determinant or coefficient of determination
R² = Correlation Coefficient.
The effect of household wastes on scavenger’ income can be expain. With acceptance criteria
as follows:
Ha = accepted if t count> t table
Ho = rejected if t count <t table
The coefficient value for Waste Sales variable (X1) is 1.031 where Sales of waste have a
positive and significant effect to revenue of Scavengers north Padangsidimpuan district. This
is indicated by tcount = 8,513 and value ttable significance level on degrees of freedom (df) = n-
k (20-4) = 16 is 1,745, so tcount> ttable 8,513 > 1,745). If there is an increase in Waste Sales
(X1) of 1 percent, it will affect the increase in revenue of Scavenger (Y) of 8,513 (cateris
paribus).
Based on the results of regression, waste sales have a significant effect on the revenue of
scavengers, which means that according to the initial hypothesis that the variable sale of
waste is positive and significant to revenue scavengers. This is because the sales of waste is
very influential on the level of income, the greater the Sales the greater the chance to earn
income, where Sales waste here is calculated based on the price per kilogram that each waste
has its own price. This positive relationship is consistent with what is stated in the level of
sales, that when the number of sales increases will increase the increase in income and vice
versa with the decrease in the amount of waste and income due to the small amount of waste
picked up by scavengers.
Education Level (X2)
The result score for the Education Level (X2) variable is 0.247 where the education level is
significant and positive for the income of the Scavenger in North Padangsidimpuan District.
It is tcount = 1,981 and ttable value with 5% significance level on degrees of freedom (df) =
n-k (20-4) = 16 is 1.745, so tcount> ttable (1,981> 1,745). If there is an increase in Education
Level (X2) by 1 percent, there will be a scavenger increase (Y) of 1,981 (cateris paribus,
other conditions remain the same).
Costs of living (X3)
The value of things for the dependent variable is 0.161. The number of dependents has a
positive and significant effect on the income of scavengers in north Padangsidimpuan district.
The number of dependents is 2.050 where the ttable level with the 5% significance level on
degrees of freedom (df) = n-k (20-4) = 16 is 1.745, so tcount> ttable (2.050> 1,745) for cost of
living variable and positive to scavengers’ income in North Padangsidimpuan District. A
positive and significant relationship indicates the number of dependents can affect many
scavengers in North Padangsidimpuan District. If more numbly of scavenger cost (X3), for
example 1 child increases, it will affect the scavenger level (Y) of 2.050 (cateris paribus). The
higher cost of scavengers, the scavenger level is also to determine the number of scavengers
that is the number of dependents or capital dependents

Asian Journal of Management Sciences & Education Vol. 6(4) October 2017 __________________________________________________________________________________________________________________________________________________________________________________________________________________________________________________________________________________________________________________________________________________________________________________________________________________________________________________________________
ISSN: 2186-845X ISSN: 2186-8441 Print
www.ajmse. leena-luna.co.jp
Leena and Luna International, Chikusei, Japan. Copyright © 2017
(株) リナアンドルナインターナショナル, 筑西市,日本 P a g e | 6
Coefficient of Determination (R2)
The coefficient of determination refers to the ability of the independent variable (X) in
explaining the dependent variable (Y). The influence of the variable of household waste (X1),
education level (X2) and the costs of living (X3) to the income of scavenger (Y), the value of
R2 equal to 0.921 indicating that 92 percent of variation of income change (Y) can be
explained simultaneously By variables Sales of household waste (X1), Education Level (X2),
and Number of Dependents (X3), While the rest that is equal to 8 percent is explained by
other variables that have not been included in the model so that R2 of 0.92 stated that Valid
model,
There is no definite size of how much R2 to say that a choice of variable is correct. If R
2 gets
bigger or closer to 1, then the model is more appropriate. For survey data that means cross
section, data obtained from many respondents at the same time. The bigger n (sample size)
then the R2 value tends to be smaller. Conversely in time series data where researchers
observed the relationship of several variables in one unit of analysis (company or State) in a
few years then R2
tends to be large. This is due to the smaller data variation in time series
data consisting of only one analysis unit (Yusilisman).
Simultaneous Significant Testing (Test-f)
Tabel 2. ANOVAb
Model Sum of Squares Df Mean Square F Sig.
1
Regression 1.503 3 .501 62.426 .000a
Residual .128 16 .008
Total 1.632 19
a. Predictors: (Constant), cost of living families (X3), last
education (X2), household waste (X1)
b. DependentVariable: scavengers’
income (Y)
Tests on the influence of all independent variables in the model can be done by simultaneous
test (f-test). This test aims to determine the effect of all independent variables contained in
the model together to the dependent variable. From result of regression of influence of sales
variable of household waste (X1), education level (X2), number of dependent (X3), to
scavenger income (Y), hence obtained ftable equal to 3,01 (0: 5% and df: 20-4 = 16) while
fstatistic / fcount 62.42 Thus, fstatistic> ftable (62,42> 3,01). This shows that the independent
variables together have a significant effect on the dependent variable.
Analysis of variable Total sales
Hypothesis Formulation:
Ho: β1 = 0, There is no positive and significant influence between the total of sales of
household waste (X1) partially to the Scavenger Income (Y)
Ha: β1 <0, There is a positive and significant influence between the amount of sales of
household wastes (X1) partially to the Scavenger Income (Y)
The results of statistical calculations obtained for variables the total of sales of household
waste (X1), obtained t value = 8,513 with significance t of 0.00. Using significance and α
0,05, t table value with df = n-k = 20 - 4 = 16 obtained t table equal to 1,745. Then obtained

Asian Journal of Management Sciences & Education Vol. 6(4) October 2017 __________________________________________________________________________________________________________________________________________________________________________________________________________________________________________________________________________________________________________________________________________________________________________________________________________________________________________________________________
Copyright © 2017 Leena and Luna International, Chikusei, Japan.
7 | P a g e (株) リナアンドルナインターナショナル, 筑西市,日本
ISSN: 2186-845X ISSN: 2186-8441 Print
www.ajmse. leena-luna.co.jp
tcount (8,513) <ttabel (1,745). This indicates that there is a positive and significant influence
between the total of sales of household waste (X1) to scavengers income (Y). The
significance test result of 0.005 indicates that the value less than 0.05 represent a significant
influence between the total of sales of household waste (X1) to the income of the scavenger
(Y).
Thus Ho is rejected and Ha accepted, so the hypothesis that there is a positive and significant
influence between the total of sales Household Wastes (X1) partially to the Income
Scavenger (Y) is acceptable. Image testing hypothesis can be described as follows:
Figure 2: Test T for Variable total Sales
Analysis of Education Level Variables
Hypothesis Formulation
Ho: β1 = 0, There is no positive and significant influence between the Education Level (X2)
partially to the Scavenger Revenue (Y)
Ha: β1 <0, There is a positive and significant influence between the Education Level (X2)
partially to the Scavenger Revenue (Y)
The result of statistical calculation is obtained for education level variable (X2), obtained by
tcount = 1,981 with significance t equal to 0,065. Using significance and α 0.05, the value of
ttable with df = n-k = 20-4 = 16 obtained t table of 1.745, then obtained tcount (1,981) ttabel
(1,745). This shows there is a positive influence between Education Level (X2) to Scavenger
Income (Y). The test significance result of 0.005 indicates that the value less than 0.05
represent a significant influence between the Education Level (X2) on the Scavenger
Revenue (Y). Thus Ho is rejected and Ha accepted, so the hypothesis which states there is a
negative and significant influence between the Education Level (X2) partially to the Income
Scavenger (Y)
Figure 3: T Test for Educational Level Variables
Reception Area Ha
1,745
Rejection Area Ho
8,513
Reception area Ha
Rejection area Ho
1,981 1,745

Asian Journal of Management Sciences & Education Vol. 6(4) October 2017 __________________________________________________________________________________________________________________________________________________________________________________________________________________________________________________________________________________________________________________________________________________________________________________________________________________________________________________________________
ISSN: 2186-845X ISSN: 2186-8441 Print
www.ajmse. leena-luna.co.jp
Leena and Luna International, Chikusei, Japan. Copyright © 2017
(株) リナアンドルナインターナショナル, 筑西市,日本 P a g e | 8
Analysis of the Dependent Variable Variable
Hypothesis Formulation
Ho: β1 = 0, There is no positive and significant influence between the Number of Dependents
(X3) partially to the Scavenger of Thought (Y)
Ha: β1 <0, There is a positive and significant influence between the number of dependents
(X3) partially to the Scavenger (Y). Statistical calculation result for variables, cost of living
(X3), obtained tcount = 2.050 with significance t, 0.057. Using significance and α 0, 05, ttable
value with df = n-k = 20 - 4 = 16 obtained ttable equal to 1,745. Then obtained t count (2.050)
<ttable (1,745). This shows there is a positive influence between the costs of living (X3) to the
Scavenger (Y). The result of significance testing of 0.005 indicates this is less than 0.05
significant meaning between the costs of living (X3) on particular scavenger (Y).
Thus, Ho is rejected and Ha accepted, so the hypothesis which states there is a negative and
significant influence between the Number of Dependents (X3) partially to the Scavengers
Users can be accepted. The hypothesis test images can add the following:
Figure 4: Test for Variable Sales Volume
Classic Assumption Test
Autocorrelation Test
Autocorrelation test aims to test whether in the regression model there is a correlation
between errors in a period of disturbance. To perform the autocorrelation test, this study uses
Durbin Watson scale.
Table 3. Test Autocorrelation Model Summaryb
Model R R Square Adjusted R
Square
Std. Error of
the Estimate Durbin-Watson
1 .960a .921 .907 .090 2.224
a. Predictors: (Constant),cost of living families (X3), last education (X2),
household waste (X1),
b. Dependent Variable: scavengers’ income (Y)
Autocorrelation test results can be seen from Durbin_Watson value of 2.224. For n = 20, and
k = 4 we get the value of DW table = 0.894 Dl (Lower limit) and Du (upper limit) 1.828. The
DW value counts 2.224> from the upper limit (du) is 1.828 and less than 4 - du, so it can be
concluded there is no positive or negative autocorrelation on the model. If the data spreads far
Rejection area Ho
Reception area Ha
2,050
1,745

Asian Journal of Management Sciences & Education Vol. 6(4) October 2017 __________________________________________________________________________________________________________________________________________________________________________________________________________________________________________________________________________________________________________________________________________________________________________________________________________________________________________________________________
Copyright © 2017 Leena and Luna International, Chikusei, Japan.
9 | P a g e (株) リナアンドルナインターナショナル, 筑西市,日本
ISSN: 2186-845X ISSN: 2186-8441 Print
www.ajmse. leena-luna.co.jp
from the diagonal line and / or does not follow the diagonal line, then the regression model
does not meet the assumption of normality.
Figure 5. Normal Data Test With Normal P-Plot
Taking note of these findings, the residual normality test was performed by Kolmogorov-
Smirnov statistical test technique.
Table 4. Kolmogorov Test – Smirnov Test One-Sample Kolmogorov-Smirnov Test
Income (Y) Household
waste (X1)
Last education
(X2)
Cost of
living (X3)
N 20 20 20 20
Normal Parametersa Mean 13.75 10.33 .96 1.24
Std. Deviation .293 .217 .198 .300
Most Extreme
Differences
Absolute .161 .275 .413 .236
Positive .161 .275 .258 .132
Negative -.146 -.128 -.413 -.236
Kolmogorov-Smirnov Z .720 1.231 1.846 1.056
Asymp. Sig. (2-tailed) .678 .097 .002 .214
Ho: The population is normally distributed
Ha: The population is not normally distributed
The basis for decision-making is based on probability
If the probability value is> 0.05 then Ho is recepted
If the probability value <= 0.05 then Ho is rejected
* Decisions
a. Sales of Wastes, Seen in the significant column (Asymp Sig (2-tailed)) is 0.097 or
probability more than 0.05 then Ho is recepted which means the population is
normally distributed.
Asian Journal of Management Sciences & Education Vol. 6(4) October 2017 __________________________________________________________________________________________________________________________________________________________________________________________________________________________________________________________________________________________________________________________________________________________________________________________________________________________________________________________________
ISSN: 2186-845X ISSN: 2186-8441 Print
www.ajmse. leena-luna.co.jp
Leena and Luna International, Chikusei, Japan. Copyright © 2017
(株) リナアンドルナインターナショナル, 筑西市,日本 P a g e | 10
b. Education Level, Seen in the significant column (Asymp Sig (2-tailed)) is 0.02 or
whose probability is less than 0.05 then Ho is rejected which means the population is
not normally distributed.
c. Costs of living, Seen in the significant column (Asymp Sig (2-tailed)) is 0.214 or
probability less than 0.05 then Ho is rejected which means the population is normally
distributed.
CONCLUSIONS
Some conclusions from the factors influencing garbage income in North Padang Sidimpuan
can be stated as follows:
There is a very significant relationship between household wastes on waste income of 1,031.
This is indicated by tcount = 8,513 and ttable value with 5% significance level on degrees of
freedom (df) = n-k (20-4) = 16 is 1.745, so tcount> ttable 8,513> 1,745). If there is an increase in
Waste Sales (X1) of 1 percent, it will affect the increase in revenue of Scavenger (Y) of 8,513
(cateris paribus). There is a positive and significant correlation between education level and
scavenger income. If there is an increase in Education Level (X2) of 1 percent, it will affect
the increase in income scavenger (Y) of 1,981 (cateris paribus, other conditions remain the
same). There is a positive and significant relationship between the number of dependents and
scavenger income of 0.161. If more total of scavengers (X3), for example 1 child increases, it
will affect the income level of scavenger (Y) for 2.050 (cateris paribus).
REFERENCES
[1] Arikunto, S. (2012). Manajemen penelitian. Jakarta: Rineka Cipta.
[2] Ghozali, I. (2005). Aplikasi analisis multivariate dengan program SPSS: Edisi ketiga.
Semarang: BP UNDIP.
[3] Ikhsan, A. (2009). Akuntansi manajemen lingkungan. Yogyakarta: Graha Ilmu.
[4] Puspowarsito. (2008). Metode penelitian organisasi dengan aplikasi program SPSS.
Bandung: Humaniora
[5] Rossje. (2006). Akuntansi lingkungan, suatu perspektif. Retrieved from
http://www.rossje.com.
[6] Salamah, A. M.A., & Nengsih, J. (2007). Makanan materi ekologi, CV. Bogor: Duta
Grafika.
[7] Slamet, P. H., & Sri, H. (2007). Sains Biologi 1 SMA/MA Kelas X. Jakarta: Bumi
Aksara
[8] Sugiyono. (2006). Statistik untuk penelitian. Bandung: Alfabeta.
[9] Sunyoto, D. (2007). Analisis regresi dan korelasi bivariat. Yogyakarta: Amara
Books.
[10] Suprapto. (2010). Hubungan antara jenjang pendidikan dan pendapatan dengan
sikap kepala keluarga terhadap pengelolaan sampah rumah tangga di desa candisari
kabupaten grobogan. Surakarta: Universitas Sebelas Maret.
[11] Zakaria, J. (2009). Pengantar teori ekonomi makro. Jakarta: Gaung Persada: GP
Press.