Embed Size (px)
Citation preview

The School Snapshot Survey: Summer 2018 Research report
September 2018
IFF Research
2
Contents List of figures 4
Executive Summary 7
Curriculum 7
Teacher workload, recruitment and retention 9
Support for students 11
Careers Strategy 13
Budgets 14
School Snapshot Survey: Summer 2018 findings infographics 14
Background 17
Methodology 17
1. Curriculum 19
1.1 Removal of levels 19
1.2 English Baccalaureate (EBacc) 22
Entry into EBacc 22
Achieving the EBacc ambition 27
Recruiting and retaining teachers for EBacc subjects 28
1.3 GCSE Reform 30
Computer Science GCSE 30
Language GCSEs 31
1.4 Curriculum planning 33
1.5 Teaching time in primary schools 37
1.6 Systematic Synthetic Phonics 40
1.7 Transition to Key Stage 1 41
2. Teacher workload, recruitment and retention 42
2.1 Teacher workload 42
2.2 Hiring supply teachers 47
2.3 Aspiration to headship 49
2.4 Continuing Professional Development (CPD) 52
3. Support for Students 53

3
3.1 Pupil behaviour 54
3.2 Diversity Support 58
Gender identity 58
Sexual orientation 59
3.3 Provision of Sanitary Products 60
3.4 Access to Nutritious Food 65
3.5 Special Education Needs and Disabilities (SEND) 69
3.6 Mental health needs 72
4. Careers Strategy 74
4.1 Careers Education 74
4.2 School statistics 77
5. Budgets 78
5.1 Budgetary matters 78
6. Appendix 80
Scope 80
Mode of interview 80
Response rate 80
Weighting 82

4
List of figures Figure 1: Development level of current assessment system 20
Figure 2: Leaders views of teachers’ confidence with new assessment systems 21
Figure 3: Impact on the removal of levels on workload associated with assessments 21
Figure 4: Proportion of KS4 pupils that schools plan to enter into full range of EBacc subjects in the next academic year 23
Figure 5: Estimated % of KS4 pupils likely to be entered into EBacc in 2019 by academy status (2018 Summer Survey) 25
Figure 6: Estimated % of KS4 pupils likely to be entered into EBacc in 2019 by FSM quintile (2018 Summer Survey) 26
Figure 7: Change envisaged in the proportion of pupils entered for the EBacc in 2020 compared to 2019 27
Figure 8: Proportion of schools that believe they have the teaching capacity to achieve the EBacc ambition by FSM quintile 28
Figure 9: The proportion of schools that have difficulty recruiting or retaining teachers in EBacc subjects 29
Figure 10: Leaders views of teacher confidence in teaching the new Computer Science GCSE 30
Figure 11: The proportion of those starting KS4 that will be studying a language GCSE eligible for the EBacc in September 2018 32
Figure 12: Importance of factors for curriculum planning in secondary schools 33
Figure 13: Importance of factors for curriculum planning in primary schools2 35
Figure 14: Time spent teaching English, maths and science in primary schools 37
Figure 15: Time spent teaching science in Key Stage 2 in the past 5 years 38
Figure 16: Main reasons for the decrease in time spent teaching science (selected from a list unless stated otherwise) 39
Figure 17: Use of SSP for teaching children to read in reception 40
Figure 18: Preparedness of children for the transition to year 1 / the KS1 curriculum 41

5
Figure 19: Proportion of actions taken by schools to evaluate and reduce unnecessary workload as reported by leaders 43
Figure 20: Proportion of actions taken by schools to evaluate and reduce unnecessary workload as reported by teachers 44
Figure 21: Proportion of actions taken by schools to evaluate and reduce unnecessary workload as reported by leaders and teachers 45
Figure 22: Extent to which workload has changed following action 46
Figure 23: Barriers experienced by leaders when hiring supply teachers into permanent roles 47
Figure 24: Main barriers to hiring supply teachers into permanent teacher roles (prompted codes unless stated) 48
Figure 25: Main reason for not aspiring to become a headteacher 50
Figure 26: Main barriers to accessing effective CPD 53
Figure 27: Pupil behaviour and confidence in the schools' ability to deal with challenging behaviour effectively 54
Figure 28: Support from school leaders when dealing with challenging behaviour 56
Figure 29: Time lost within each teaching hour for each episode of challenging behaviour 57
Figure 30: Whether would feel confident in providing support to a student regarding gender identity 59
Figure 31: Whether would feel confident in providing support to a student regarding their sexual orientation 60
Figure 32: Provision of free sanitary products to pupils at their school 61
Figure 33: Reasons leaders gave for providing free sanitary products at their school 62
Figure 34: Sanitary products provided because students cannot afford them by FSM quintile 63
Figure 35: How provision of sanitary products is funded 63
Figure 36: Teacher views on provision of free sanitary products to pupils at their school 64

6
Figure 37: Reasons teachers gave for providing free sanitary products at their school 65
Figure 38: Reduced access to nutritious food in the school holidays 67
Figure 39: Reduced access to nutritious food in the school holidays by entitlement to FSM 68
Figure 40: Teachers’ views on SEND 70
Figure 41: Usefulness of activities/tools used to improve support given to pupils with SEND 71
Figure 42: Agreement with statements about children and young people's mental health at school 73
Figure 43: Format of careers education provided in schools 75
Figure 44: Ways in which primary schools deliver careers education to pupils 76
Figure 45: Publishing student destination data on school websites 77
Figure 46: Useful actions for getting the most out of the school budget 79
7
Executive Summary This report covers the Summer 2018 findings of the second wave of the School Snapshot Survey. A total of 758 interviews were conducted with school leaders and 1,040 interviews with classroom teachers. The survey covers a range of educational topics.
Curriculum
Removal of levels
In September 2014 a new national curriculum saw the removal of ‘levels’ used to report children’s attainment and progress. In Summer 2018, nearly all school leaders (97%) said that their school had partially or fully developed their new assessment system following the removal of levels, and close to three fifths (58%) said it was fully developed.
As a result of the removal of levels, 43% of leaders and teachers thought that their assessment-related workload had stayed broadly the same and just over half (51%) felt that it had increased (3% felt it had decreased and 3% were unsure).
The English Baccalaureate (EBacc):
The EBacc entry measure is the proportion of Key Stage 4 (KS4) pupils entering GCSEs in a set of EBacc eligible subjects which are English language and literature, mathematics, history or geography, the sciences (including computer science) and a language. Estimates from the 2018 Summer Survey indicate that, across the 3,400 secondary schools in England, around 238,900 pupils will be entered into the EBacc combination of subjects in 2019. Overall, leaders anticipated 494,000 pupils would complete their KS4 in 2019 which equates to 48% of all eligible pupils.1
Half of secondary school leaders (50%) thought that the same proportion would enter EBacc combination of subjects in 2020 as in 2019. Just under a third (31%) thought the proportion would increase and only 14% thought it would decrease.
Announced in July 2017, the EBacc ambition is that by 2022, three-quarters of pupils in year 10 will be studying EBacc eligible GCSE subjects and that by 2025, this will rise to 90% of the year group. Just over half of all secondary school leaders (52%) reported that their schools currently have the teaching capacity to achieve the EBacc ambition. Forty-three percent reported that they do not have the capacity and 5% did not know if they did.
1 The schools census, ‘Schools, Pupils and their Characteristics: January 2017’ gives a figure of 522,629 pupils aged 14 in state-funded secondary schools: https://www.gov.uk/government/statistics/schools-pupils-and-their-characteristics-january-2017
8
The vast majority (92%) of secondary leaders stated that they have difficulty recruiting teachers for at least one of the five EBacc subject areas. Difficulties were most commonly reported for science and maths, with around three-quarters of leaders stating they have difficulty hiring for these subjects. Just over half, flagged difficulties with recruiting modern foreign languages teachers (56%) and English teachers (52%). The least problematic area, though still an issue for 44% of leaders, was recruiting for teaching jobs in humanities.
GCSE reform
Since September 2015, the Government has been reforming GCSEs and introducing the new GCSE exams in a series of waves. The second wave launched in September 2016 and saw the introduction of computer science, along with a range of 16 other subjects. 87% of secondary leaders reported that they offer the new computer science GCSE. Of those who offered the GCSE, 72% reported that their teachers are confident at teaching it, while 17% said they were not.
As part of the GCSE reform programme, new language GCSEs (both ancient and modern foreign languages (MFL)) have been introduced each year since September 2016, with more being added in the September 2018 academic year. In the 2018 Summer Survey, secondary leaders who stated that they have pupils entering Key Stage 4 in September 2018 were asked to estimate the percentage that will be studying a GCSE language which is eligible for the EBacc. The mean (55%) and median (50%) responses suggest that around half of the pupils will be studying a GCSE language subject.
Curriculum planning
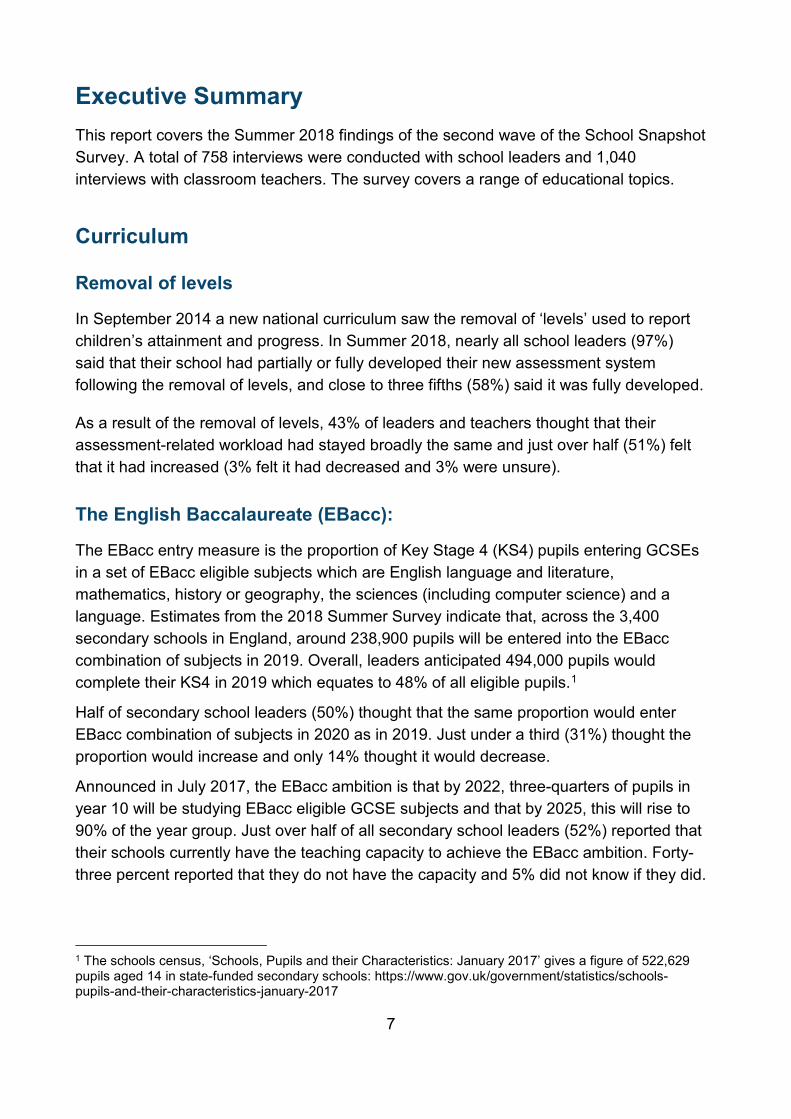
Secondary school teachers were asked to state the importance of a range of factors in making decisions about their curriculum planning. The three factors that received the highest average importance ratings were the specific learning needs of each cohort or year level (mean score 8.5/10), funding (mean score 8.4/10) and the availability or expertise or teaching staff (mean score 8.3/10).
Primary school teachers were asked about a slightly different set of factors. Similar to secondary school leaders, the highest average importance rating was given for the specific learning needs of each cohort or year level (mean score 9.1/10), and funding was also considered one of the top three most important factors (mean score 8.6/10). However, primary school leaders gave progress measures significantly higher average importance ratings than availability or expertise of teaching staff (mean scores of 8.8 and 8.5 respectively).
9
Teaching time
Primary school teachers were asked to estimate how many minutes of teaching time they spent on English, maths and science in a typical week. On average, primary school teachers reported spending approximately five hours (318 minutes) teaching English, four hours (257 minutes) teaching maths and just under one and half hours (80 minutes) teaching science per week.
Systematic synthetic phonics
Systematic synthetic phonics (SSP) is the method of teaching pupils how to read by breaking down words into the smallest of units of sounds and then blending them into words. The vast majority of primary school leaders (93%) reported that their schools use SSP to teach children to read in reception.
Transition to Key Stage 1
Key Stage 1 primary school teachers were asked how well prepared they felt children entering Key Stage 1 were for the transition to year 1 and the Key Stage 1 curriculum. Teachers reported that children were most prepared for KS1 language and maths subjects: more than two thirds reported that children were very or well prepared for both subjects (70% and 67% respectively). More than half of the KS1 teachers reported preparedness for literacy (65%) and for readiness to learn (55%). However, 27% of teachers reported that they felt their students were generally unprepared (either ‘unprepared’ or ‘very unprepared’) with regards to their readiness to learn and access the Key Stage 1 curriculum.
Teacher workload, recruitment and retention
Workload
Removing unnecessary workload is high on the education agenda. The DfE published the 2016 Teacher Workload Survey report2, a commitment from the 2014 Workload Challenge3, and an action plan setting out the steps to be taken4. Following this, the Workload Reduction Toolkit5 was developed for schools and published in July 2018. The
2 https://www.gov.uk/government/publications/teacher-workload-survey-2016 3 https://www.gov.uk/government/publications/workload-challenge-for-schools-government-response 4 https://www.gov.uk/government/publications/reducing-teachers-workload 5 https://www.gov.uk/guidance/reducing-workload-in-your-school

10
workload advisory group was set up to look at data burdens: their report and the government’s response6 have been published alongside a joint letter to school leaders.
Leaders and teachers were asked what their schools had done to reduce unnecessary workload. The most commonly reported actions by leaders were consulting with staff in ways other than a survey (96%), reducing or changing marking (93%) and reviewing or updating school policies (92%). Teachers cited the same three top reasons, but in a different order. 73% reported that their school reviewed or updated school policies, 72% consulted with staff in other ways and 64% of teachers said their school had reduced or changed marking. Combined teacher and leader responses on actions taken are reported in the main body of the report.
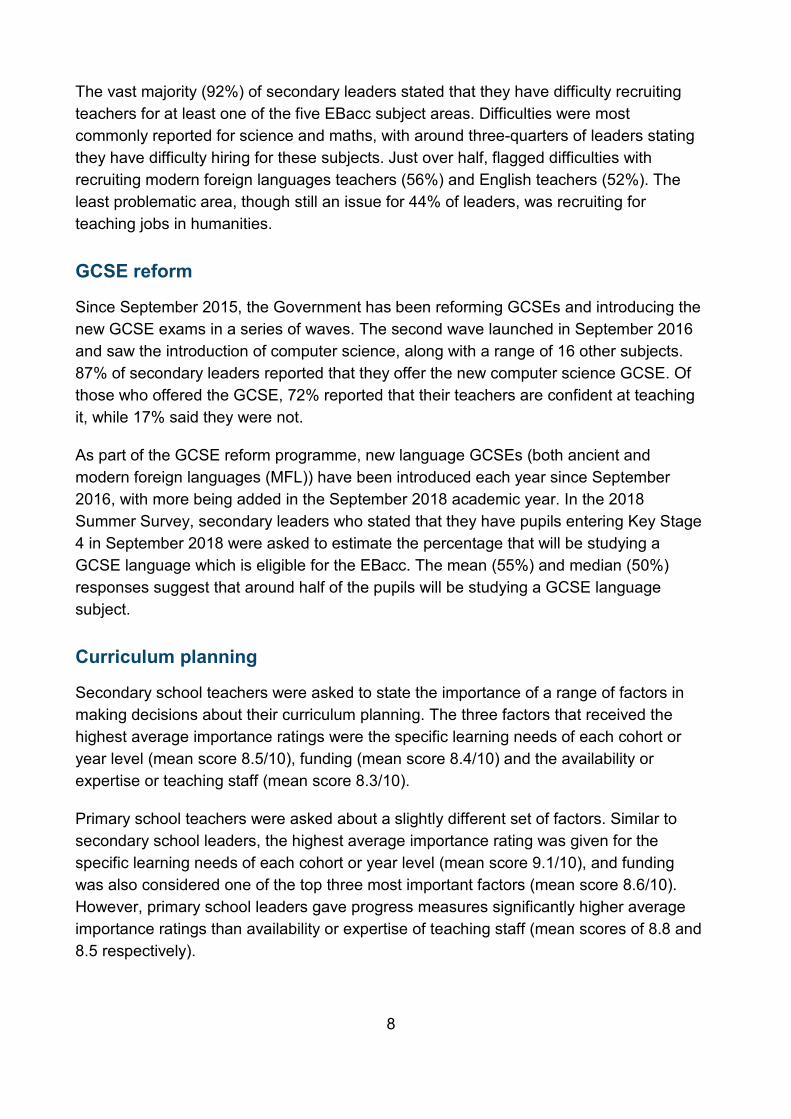
Leaders and teachers were asked whether the actions that their school had taken had made their workload more manageable. They were evenly split between half who said there had been a positive impact (40% stated that their workload had become a bit more manageable and 7% a lot more manageable) and half who said it had not (50%).
Hiring supply teachers
School leaders were asked whether they had experienced barriers when hiring supply teachers into permanent teaching roles. Twelve percent of leaders reported that they had not experienced any barriers when hiring supply teachers into permanent roles. Nearly two in five (38%) leaders reported they had experienced barriers when hiring supply teachers into permanent roles. The remaining half (50%) reported that they had not needed or wanted to hire supply teachers into permanent teaching roles. Among those who had experienced barriers, the most commonly cited issues were the cost of agency temp-to-permanent fees (mentioned by 81% of those experiencing barriers) and the quality of supply teacher applicants applying to permanent roles (56%).
Aspiration to headship
One in four teachers (23%) stated that they aspire to be a headteacher, but the majority (69%) said they did not want to become a head. Seven percent did not know at the time of the survey. The most common reasons given for not wanting to become a head were a desire to stay in the classroom and concerns about the work-life balance of heads. Leaders were not asked this question.
6 https://www.gov.uk/government/publications/teacher-workload-advisory-group-report-and-government-response

11
CPD
In recent years, school leadership teams have been encouraged to prioritise the provision of Continuing Professional Development (CPD) opportunities for teaching staff. Despite this focus on CPD from Government, nine in ten (91%) teachers reported that there were barriers to accessing effective CPD. Cost was the most commonly mentioned barrier by both primary and secondary school teachers (70%). Over half (51%) of those who felt there were barriers said that having insufficient time to take up CPD opportunities was another key barrier.
Support for students
Pupil behaviour
Over three-quarters of all leaders and teachers thought pupil behaviour in their school was good (76%) and they were confident in their school’s ability to deal with challenging behaviour (79%). Teachers were then asked, “when challenging behaviour occurs, do you feel you are supported by school leaders to deal with it effectively?” Close to four in five teachers (79%) said that they usually (‘always’ or ‘mostly’) felt supported by school leaders to deal with challenging behaviour effectively but 7% said they only occasionally or never felt supported.
Leaders and teachers were asked to consider how much learning time is lost, on average, when a single episode of challenging behaviour occurs. Close to three-quarters (72%) of all leaders and teachers thought that ten minutes or fewer of teaching time was lost within each hour that a single episode of challenging behaviour occurs. More than half (55%) thought less than one to five minutes was lost.
Diversity support
Close to two-thirds (62%) of all teachers reported feeling confident in supporting students who approach them regarding their gender identity. However close to one in five (18%) were not confident.
Teachers were significantly more likely to feel confident about supporting students who approach them regarding their sexual orientation rather than their gender identity. Close to three-quarters of all teachers (74%) said they felt confident about supporting students who approach them regarding their sexual orientation.

12
Sanitary products
The majority of secondary school leaders (83%) said that free sanitary products were available to pupils at their school. It was more common for the products to be available on a case by case basis (65%) as opposed to freely available for all pupils (18%).
The primary motivation for the 83% of leaders who said their school provides free sanitary products was that students might need them on an emergency basis. Nearly all (96%) of the secondary school leaders in schools providing free products mentioned this; by comparison close to two in five leaders (38%) supplied the products because students had stated they could not afford them.
The provision of free sanitary products was typically funded from the school budget. Almost four-fifths (78%) of secondary school leaders in schools providing free products said sanitary products were funded in this way.
Access to nutritious food
Providing children with access to nutritious, high quality food during the course of the school day has long been a key policy area for the DfE. School leaders and teachers were asked to what extent they agreed with the following statement: “pupils having reduced access to nutritious food in the school holidays is a common issue in this school”. Over half (54%) of leaders and teachers agreed with the statement and only one in five (20%) disagreed. Despite most leaders (56%) agreeing that reduced access to nutritious food over the holidays was a common issue in their school, only 5% of these leaders, and 3% of all leaders said their schools offers free food provision over the school holidays. None of the schools who did not think that access to nutritious food was a problem provided free food during the school holidays.
SEND
Just over nine in ten teachers stated that they felt equipped to identify pupils with SEND (93%) and know when to engage the SENCO or access other forms of support for pupils with SEND (92%).7
In terms of supporting pupils with SEN, the majority (71%) of teachers thought sharing practices between teachers or schools was useful. Between 60% and 65% thought the following activities were useful: case meetings with input from SENCO or a specialist,
7 This compares favourably to the May 2017 Teacher Voice Omnibus, where only 84% of teachers said they felt equipped to identify pupils who are making less than expected progress and who may have SEND. Base: All teachers, 1,094. Question: How much do you agree or disagree with the following statements…’. Due to differences in sampling methodology, comparisons between the School Snapshot Survey and the Teacher Voice Omnibus should be interpreted with caution.

13
school led training or CPD, progress discussions with pupil’s parents and observing other teacher lessons.
Mental health
In recent years, the Government has prioritised the improvement of mental health support for children and young people. The majority (74%) of teachers thought they were equipped to identify behaviour that may be linked to a mental health issue and most thought they were able to provide access to within-school support; with 69% saying they knew how to help pupils access support within their school and 63% reporting they were equipped to teach pupils with mental health needs in their class.
Accessing external, specialist support seems to have remained more difficult for teachers. In this wave, close to one third (30%) of teachers did not feel well supported when it came to accessing specialist support for advice on pupil’s mental health, and another third (30%) did not know how to help pupils with mental health issues access specialist support outside of their school or college.
Careers Strategy
Careers Education
The vast majority of secondary school leaders said that their school has an identified Careers Leader with responsibility for overseeing the school’s careers programme (94%). Leaders delivered careers education in a variety of ways. Nine in ten (90%) secondary school leaders said that all 14 year old pupils at their school used career paths information to inform their study options. Only slightly fewer (86%) said that 16 years old pupils at their school have had meaningful encounters with a full range of learning providers, such as colleges, universities and apprenticeship providers.
Primary school leaders described how they delivered careers education to pupils before the end of Year 6. The most common approach to careers education was delivery through Personal, Social and Health Education (PSHE) lessons (87%) and topic work (84%). Only 4% said that they did not provide any careers education to their pupils.
School statistics
Secondary school leaders were asked what student destination information their school publishes on their website. Three-quarters of schools (74%) said that they published a link to the Government’s school performance tables. More than half (58%) said that they published the percentage of students in sustained education, employment and training the year after finishing school.

14
Budgets The survey asked all school leaders about the actions that they found useful for getting the most out of their school budget. School leaders were presented with ten possible actions and asked, if relevant, how useful each had been. The two actions leaders considered to be the most useful in getting the most out of their budget were reviewing how they buy goods and services and reviewing staff structures. Nine in ten leaders said each of these actions was useful (91% and 90% respectively).
School Snapshot Survey: Summer 2018 findings infographics
1. Curriculum
Just over half (52%) of schools felt they currently had the teaching capacity to achieve the EBacc ambition
92% of secondary leaders have difficulty recruiting teachers for at least one of the five EBacc subjects areas:
Following the removal of ‘levels’ in 2014, 97% of leaders said their school had partially or fully developed a replacement assessment system
58% of leaders said the new assessment system was fully developed
87% of leaders offered the new computer science GCSE and of these, 72% reported that teachers are confident teaching it.
MathsScienceModern Foreign
LanguagesEnglish
79% 56%75% 52%
Humanities
44%
15
1. Curriculum (continued) On a scale of 1-10, secondary school leaders felt that:
On average, primary school teachers spend nearly four times longer each week teaching English than science:
318 minutes teaching English257 minutes teaching maths80 minutes teaching science
Over 9 in 10 (93%) of primary schools use systematic synthetics phonics to teach children to read in reception
8.5 -Specific learning needs of each cohort
8.4 –Funding
8.3 –Availability and expertise of teaching staff
Primary school teachers considered the following factors to be most important:
9.1 -Specific learning needs of each cohort
8.8 –Progress measures
8.6 –Funding
1
e
Nine in 10 (91%) classroom teachers reported barriers to accessing effective Continuing Professional Development…
2. Teachers and Teaching
Of the teachers and leaders in schools that have taken action(s) to evaluate and reduce unnecessary workload…
47% stated that their workload had become more manageable (40% stated it had become a bit more manageable and 7% a lot more manageable)
Over four in five (81%) felt the cost of agency temp-to-permanent fees was a key barrier
Roughly two in five (38%) of leaders experienced barriers when looking to convert supply teachers to permanent positions, and of these…
Less than one in four (23%) classroom teachers aspired to be a headteacher
70% attributed this problem to cost
51% attributed this problem to time
29% attributed this problem to lack of good quality local CPD
16
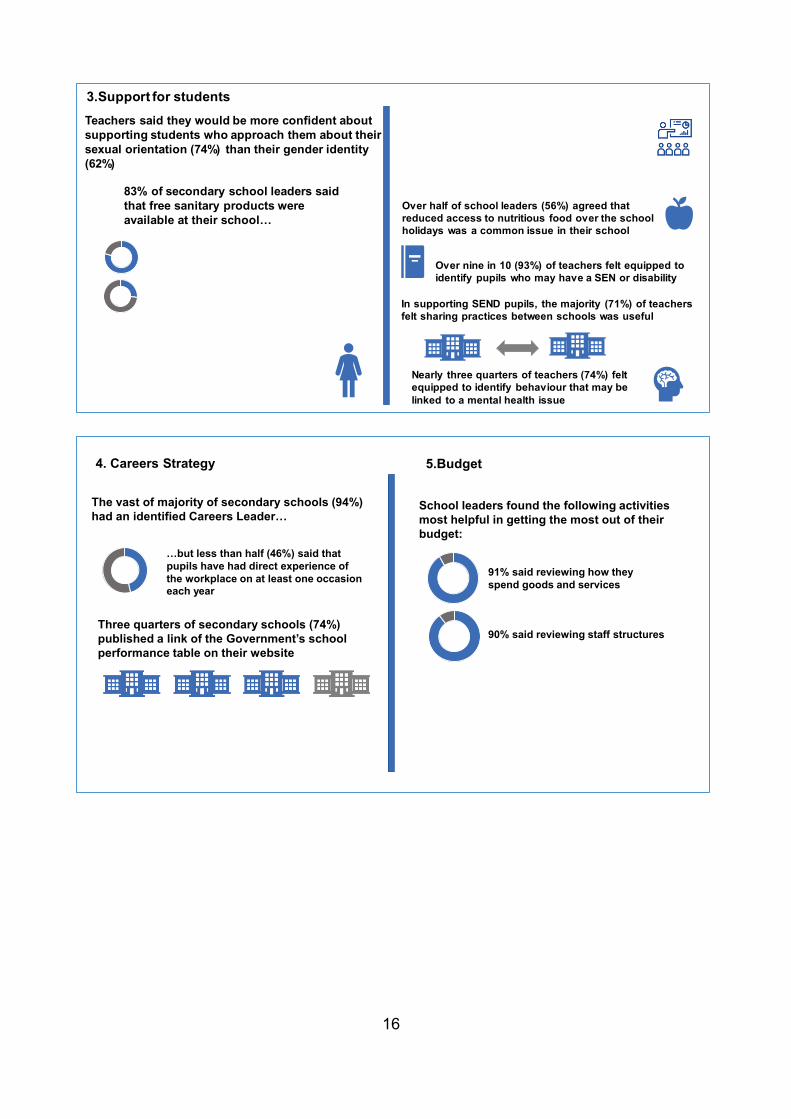
Over half of school leaders (56%) agreed that reduced access to nutritious food over the school holidays was a common issue in their school
Nearly three quarters of teachers (74%) felt equipped to identify behaviour that may be linked to a mental health issue
3.Support for students
In supporting SEND pupils, the majority (71%) of teachers felt sharing practices between schools was useful
Over nine in 10 (93%) of teachers felt equipped to identify pupils who may have a SEN or disability
Teachers said they would be more confident about supporting students who approach them about their sexual orientation (74%) than their gender identity (62%)
83% of secondary school leaders said that free sanitary products were available at their school…
Three quarters of secondary schools (74%) published a link of the Government’s school performance table on their website
School leaders found the following activities most helpful in getting the most out of their budget:
91% said reviewing how they spend goods and services
90% said reviewing staff structures
5.Budget
The vast of majority of secondary schools (94%) had an identified Careers Leader…
4. Careers Strategy
…but less than half (46%) said that pupils have had direct experience of the workplace on at least one occasion each year

17
Background This report covers the Summer 2018 findings of the second wave of the School Snapshot Survey. The survey will be conducted bi-annually to better understand the opinions of leaders and teachers in primary and secondary schools on a range of educational topics.
Methodology A sample of 1,683 schools was drawn from the Department’s database of schools, ‘Get Information about Schools’ and invited to take part in both the leader and teacher components of the School Snapshot Survey. A further 300 schools were selected just to take part in the teacher component.
One leader was interviewed (predominantly via a telephone methodology) from each school and up to three classroom teachers (using a combination of online and telephone interviewing). A total of 758 interviews were conducted with school leaders and 1,040 interviews with classroom teachers. This was split by primary and secondary schools as shown in Table 1.
Table 1: Completed interviews by teacher level and school type
Teachers Leaders
Primary Secondary Primary Secondary
Completed interviews
600 440 396 362
Fieldwork took place between 9 May – 20 July 2018.
Data presented in this report are from a sample of teachers and senior leaders rather than the total populations of teachers and leaders. Although the leader sample and the teacher sample have been weighted to be nationally representative (by school and by teacher demographics), the data is still subject to sampling error. Differences between sub-groups are only commented on in the text if they are statistically significant at the 95 per cent confidence level. This means there is no more than a 5 per cent chance that any reported differences are a consequence of sampling error. With regards to Free School Meal (FSM) entitlement, schools are split into five quintiles (or groups), ranked according to the proportion of students that they have who are entitled to FSM. Quintile 1 (the bottom quintile) represents the fifth of schools with the lowest proportion of students entitled to FSM. The proportion of students entitled to FSM increases progressively as the quintiles increase (i.e. quintiles 2, 3 and 4). Schools in the top quintile (quintile 5) represent the fifth of schools with the highest proportion of students entitled to FSM.
18
Due to rounding to the nearest whole number, percentages may not total to exactly 100% or precisely reflect statistics provided in the data tables. For further information on the overall study methodology and weighting approach, please see the appendix of this report.
Some of the questions included in the School Snapshot Survey repeat those previously included in the Teacher Voice Omnibus where the Department is looking to track changes in leaders and teachers’ opinions of various topics over time. 8 Participants for the Teacher Voice Omnibus were contacted from the NFER Teacher Voice Panel of practising leaders and teachers, whereas the School Snapshot Survey utilises a random sampling approach to selecting schools. This difference in sampling methodology means that caution should be taken when comparing results from questions which appear across the two surveys.
8 https://www.gov.uk/government/publications/teacher-voice-omnibus-march-2018-survey

19
1. Curriculum This chapter will explore schools’ and teaching professionals’ perspectives on a range of policy areas relating to curriculum, including the removal of levels, English Baccalaureate (EBacc), the reformed GCSEs, curriculum planning, teaching time in primary schools, the use of systematic synthetic phonics and transition to KS1.
1.1 Removal of levels In September 2014 a new national curriculum saw the removal of ‘levels’ used to report children’s attainment and progress.9 The 2015, Minister of State for Schools, Nick Gibb, stated that the levels assessment system had become “focused not on ensuring access and attainment for all”, but rather a tick box exercise which focused “on getting a small annual increase in the numbers gaining level 4 at 11”. The revised curriculum was expected to reinstate the distinction between the national curriculum - the content of the core academic curriculum; and the school curriculum - the broader curriculum and activities of a school which should be left to the discretion of teachers. It intended to encourage a deeper knowledge in fewer subjects and allow schools to develop and implement their own assessment systems according to the needs of their pupils and staff.10
In Summer 2018, nearly all school leaders (97%) said that their school had partially or fully developed their assessment system following the removal of levels, and close to three fifths (58%) said it was fully developed.
9https://assets.publishing.service.gov.uk/government/uploads/system/uploads/attachment_data/file/358070/NC_assessment_quals_factsheet_Sept_update.pdf 10 https://www.gov.uk/government/speeches/assessment-after-levels

20
Figure 1: Development level of current assessment system
Primary schools were significantly more likely to have established assessment systems than secondary schools; while close to two-thirds (62%) of primary school leaders said their current assessment system was full developed, significantly fewer – only two in five (43%) – secondary school leaders did. There was no difference in the extent to which assessment systems were developed by region or academy status of the school.
School leaders who had developed a new assessment system since the removal of levels were asked how confident they thought teachers were with the new assessment system. While the vast majority (94%) of leaders thought teachers at their school were confident, just one third (35%) thought their teachers were very confident.
43%
62%
58%
51%
36%
39%
2%
1%
2%
3%
1%
1%
Fully developed Partially developed In early stages of development Not developed
Primary
Secondary
All
Question: C1. Development of current assessment systemBase: All leaders (n =758); Primary (n = 396); Secondary (n = 362)

21
Figure 2: Leaders views of teachers’ confidence with new assessment systems
Reflecting the findings about how developed new assessment systems were, primary school leaders were significantly more likely to report that their teachers were confident with their new system than secondary school leaders; 95% of primary leaders thought their teachers were confident compared to 87% of secondary school leaders. There was no significant variation in levels of confidence by region.
All school leaders and teachers who taught Key Stages 1, 2 or 3 were asked to consider how much of an impact the removal of levels has had on workload associated with assessments. Whilst 43% felt assessment-related workload had stayed broadly the same, a greater proportion, just over half (51%), thought it had increased. The remainder either felt workload-related assessment had decreased (3%), or they were unsure of the difference the removal of levels had made (3%).
Figure 3: Impact on the removal of levels on workload associated with assessments
35% 58% 4%2%
Very confident Fairly confident Neither nor Not confident
Primary
Secondary
Question: C2. Confidence in current assessment systemBase: All leaders in schools that had developed a new assessment system (n = 718); Primary (n = 389); Secondary (n =329)
95%*
87%
94% GOOD
% Good
51% 43% 3%3%
Increased Stayed the same Decreased Don't know
Question: C3/C4. Impact of the removal of levels on workload associated with assessmentBase: Teachers who teach at KS1-3 and all leaders (n=1,673)

22
Compared to secondary leaders and teachers, leaders and teachers from primary schools were significantly more likely to report that assessment related workload had increased (48% and 55% respectively). Secondary school teachers and leaders were significantly more likely to say they were unsure (6% compared with no primary school teachers). Over half (54%) of teachers and leaders from non-academy schools also reported an increase, whereas just less than half (47%) of those from academy schools did (this is significant at the 95% level).
1.2 English Baccalaureate (EBacc)
Entry into EBacc The EBacc entry measure is the proportion of pupils entering GCSEs in a set of EBacc eligible subjects in a state-funded school. Eligible subjects include GCSEs in English language and literature, mathematics, history or geography, the sciences (including computer science) and a modern or ancient language at key stage 4 (KS4).
In the Winter 2017 School Snapshot Survey, leaders of secondary schools were asked how many of their pupils will be completing KS4 in the 2018 and 2019 academic years. They were also asked what proportion of these pupils they expect will enter the full range of subjects required for the EBacc for the 2018 and 2019 academic years. The same questions were asked of leaders in the Summer 2018 School Snapshot Survey for the 2019 academic year and the 2020 academic year.
Figure 4 shows the proportion of KS4 pupils that leaders estimated would be entered into the full range of subjects for 2018 and 2019 in the 2017 Winter and 2018 Summer surveys respectively.

23
Figure 4: Proportion of KS4 pupils that schools plan to enter into full range of EBacc subjects in the next academic year
2018
Estimates from the 2017 Winter Survey indicated that, across the 3,428 secondary schools in England, secondary school leaders predicted that around 239,400 pupils would be entered into the EBacc. Considering that, overall, leaders anticipated 525,600 pupils would complete their KS4 in 2018, this equated to 46% of pupils who were eligible. 11,12
11 The schools census, ‘Schools, Pupils and their Characteristics: January 2017’ gives a figure of 519,246 pupils aged 15 in state-funded secondary schools: https://www.gov.uk/government/statistics/schools-pupils-and-their-characteristics-january-2017 12 The total number of pupils being entered into EBacc (so the sum of the numbers given by each school) was divided by the total number of pupils completing their key stage 4 in the relevant academic year (the sum of the numbers given by each school). Figures were then grossed up to the schools population. Schools were excluded from the calculation if they did not know how many pupils were completing KS4 or were being entered to the EBacc subjects; this meant 9 schools were excluded. 19 out of 309 schools (in the unweighted data) were unable to give an exact percentage of pupils being entered into EBacc, but were able to select a range instead e.g. 10% or less, 11-20%, 21-30%, etc. The mid-point of the range was then
2% 3%9% 2%
18%19%
27%26%
14%20%
14% 19%
15% 12%
2017Winter SSS
2018Summer SSS
81% or more
61-80%
41-60%
21-40%
1-20%
None
Don't know
Question: wave 1: A1/ A3, wave 2: G1/G2: Of those completing Key Stage 4 in 2018/2019, what percentage do you plan to enter into the full range of subjects required for the EBacc?
Base: All secondary leaders (wave 1: n=309, wave 2:n =336)
24
2019
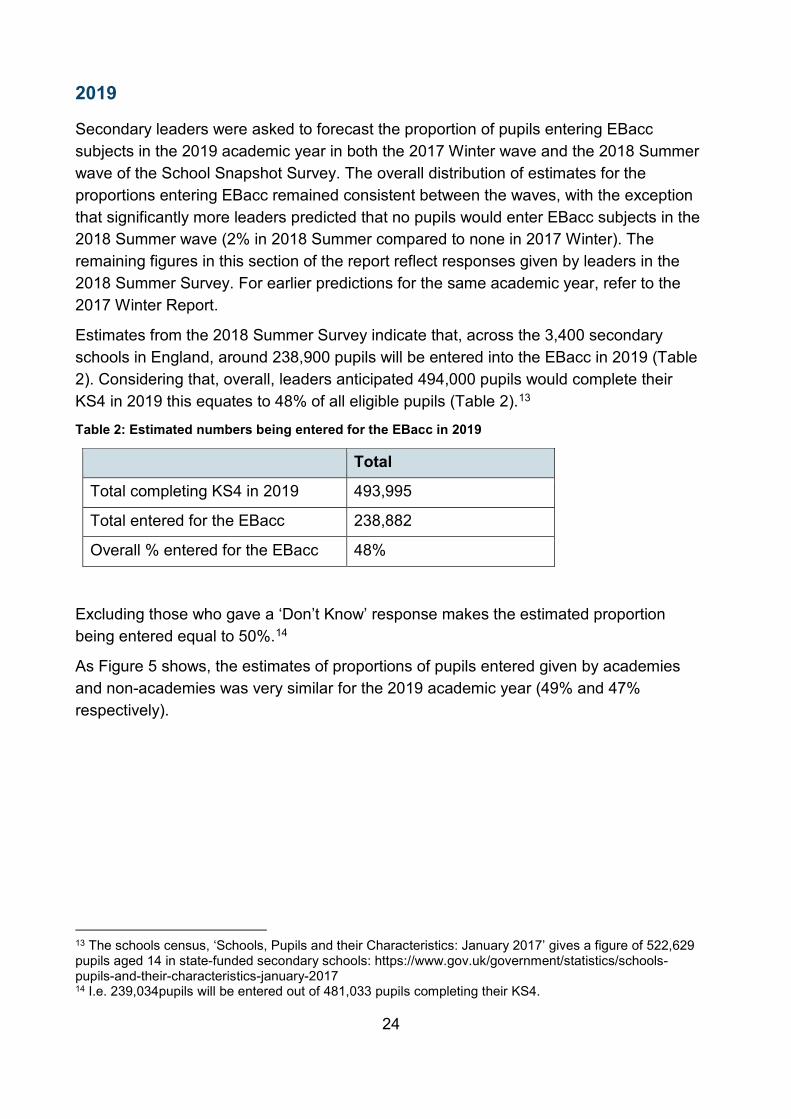
Secondary leaders were asked to forecast the proportion of pupils entering EBacc subjects in the 2019 academic year in both the 2017 Winter wave and the 2018 Summer wave of the School Snapshot Survey. The overall distribution of estimates for the proportions entering EBacc remained consistent between the waves, with the exception that significantly more leaders predicted that no pupils would enter EBacc subjects in the 2018 Summer wave (2% in 2018 Summer compared to none in 2017 Winter). The remaining figures in this section of the report reflect responses given by leaders in the 2018 Summer Survey. For earlier predictions for the same academic year, refer to the 2017 Winter Report.
Estimates from the 2018 Summer Survey indicate that, across the 3,400 secondary schools in England, around 238,900 pupils will be entered into the EBacc in 2019 (Table 2). Considering that, overall, leaders anticipated 494,000 pupils would complete their KS4 in 2019 this equates to 48% of all eligible pupils (Table 2).13
Table 2: Estimated numbers being entered for the EBacc in 2019
Total
Total completing KS4 in 2019 493,995
Total entered for the EBacc 238,882
Overall % entered for the EBacc 48%
Excluding those who gave a ‘Don’t Know’ response makes the estimated proportion being entered equal to 50%.14
As Figure 5 shows, the estimates of proportions of pupils entered given by academies and non-academies was very similar for the 2019 academic year (49% and 47% respectively).
13 The schools census, ‘Schools, Pupils and their Characteristics: January 2017’ gives a figure of 522,629 pupils aged 14 in state-funded secondary schools: https://www.gov.uk/government/statistics/schools-pupils-and-their-characteristics-january-2017 14 I.e. 239,034pupils will be entered out of 481,033 pupils completing their KS4.
25
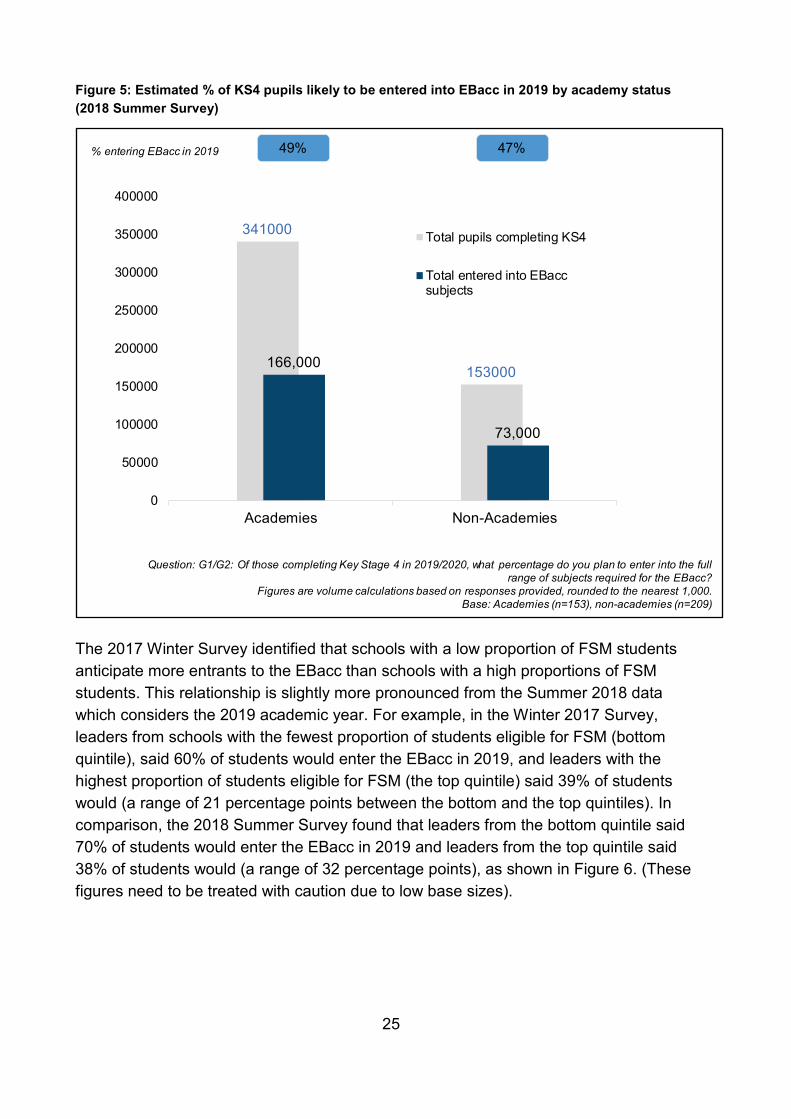
Figure 5: Estimated % of KS4 pupils likely to be entered into EBacc in 2019 by academy status (2018 Summer Survey)
The 2017 Winter Survey identified that schools with a low proportion of FSM students anticipate more entrants to the EBacc than schools with a high proportions of FSM students. This relationship is slightly more pronounced from the Summer 2018 data which considers the 2019 academic year. For example, in the Winter 2017 Survey, leaders from schools with the fewest proportion of students eligible for FSM (bottom quintile), said 60% of students would enter the EBacc in 2019, and leaders with the highest proportion of students eligible for FSM (the top quintile) said 39% of students would (a range of 21 percentage points between the bottom and the top quintiles). In comparison, the 2018 Summer Survey found that leaders from the bottom quintile said 70% of students would enter the EBacc in 2019 and leaders from the top quintile said 38% of students would (a range of 32 percentage points), as shown in Figure 6. (These figures need to be treated with caution due to low base sizes).
341000
153000166,000
73,000
0
50000
100000
150000
200000
250000
300000
350000
400000
Academies Non-Academies
Total pupils completing KS4
Total entered into EBaccsubjects
49%% entering EBacc in 2019 47%
Question: G1/G2: Of those completing Key Stage 4 in 2019/2020, what percentage do you plan to enter into the full range of subjects required for the EBacc?
Figures are volume calculations based on responses provided, rounded to the nearest 1,000. Base: Academies (n=153), non-academies (n=209)

26
Figure 6: Estimated % of KS4 pupils likely to be entered into EBacc in 2019 by FSM quintile (2018 Summer Survey)
2020
During both the 2017 Winter and 2018 Summer surveys, secondary school leaders were asked whether they anticipated a change in the proportion of pupils studying the full range of subjects required for the EBacc among those completing KS4 in the 2020 academic year compared to 2019 academic year. The responses remained consistent between both surveys (there were no significant differences).
As shown in Figure 7, half of the secondary school leaders (50%) thought that the same proportion would enter the EBacc in 2020 as in 2019. Just under a third (31%) thought the proportion would increase and only 14% thought it would decrease.
Those who envisaged a decrease in the proportion of pupils they enter for EBacc in the 2020 academic year tended to have higher entry rates at the 2019 academic year compared to those who planned to increase the proportion of pupils in 2020 (mean scores of 52% and 40% respectively).
48000
122000
138000
98000
74000
34,000
58,00068,000
43,000
28,000
0
20000
40000
60000
80000
100000
120000
140000
160000
Quintile 1(Bottom)
Quintile 2 Quintile 3 Quintile 4 Quintile 5(Top)
Total pupils completing KS4
Total entered into EBaccsubjects
70%% entering EBacc in 2019
48% 50% 44% 38%
Question: G1/G2: Of those completing Key Stage 4 in 2019/2020, what percentage do you plan to enter into the full range of subjects required for the EBacc?
Figures are volume calculations based on responses provided, rounded to the nearest 1,000. Base: 0-20% (n=30), 21-40% (n=80), 41-60% (n=96), 61-80% (n=80), 81-100% (n=63).

27
Figure 7: Change envisaged in the proportion of pupils entered for the EBacc in 2020 compared to 2019
Achieving the EBacc ambition Announced in July 2017, the EBacc ambition states that by 2022, three-quarters of pupils in year 10 will be studying EBacc eligible GCSE subjects and that by 2025, this will rise to 90% of the year group.
Just over half of all secondary school leaders (52%) reported that their schools currently have the teaching capacity to achieve the EBacc ambition. Forty-three percent reported that they do not have the capacity and 5% did not know if they did.
Those in the bottom quintile for free school meals (i.e. those with lowest proportions of pupils eligible for free school meals) were significantly more likely to believe they have the teaching capacity required to achieve the EBacc ambition (75%) compared to schools in all other quintiles, as illustrated in Figure 8. Though due to a low base size for the bottom quintile, this should be treated with caution.
31%
36%
50%
53%
14%
9%
5%
2%
Increased Stayed the same Decreased Don't know
Question: wave 1: A6, wave 2: G3: Compared to 2019, for pupils in your school completing Key Stage 4 in 2020 (i.e. those currently in year 9) do you anticipate that the proportion of pupils studying the full range of subjects required for
the EBacc will…?Base: All secondary leaders (wave 1: n=309, wave 2: n=362)
Summer 2018 SSS
Winter 2017 SSS

28
Figure 8: Proportion of schools that believe they have the teaching capacity to achieve the EBacc ambition by FSM quintile
Recruiting and retaining teachers for EBacc subjects The vast majority (92%) of secondary leaders stated that they have difficulty recruiting teachers for at least one of the five EBacc subject areas. Difficulties were most commonly reported for science and maths, with around three-quarters of leaders stating they have difficulty hiring for these subjects. Just over half, flagged difficulties with recruiting modern foreign languages teachers (56%) and English teachers (52%). The least problematic area, though still an issue for 44% of leaders, was recruiting for teaching jobs in humanities.
As seen in Figure 9, a broadly similar pattern was seen across the subjects when leaders were asked a similar question regarding retaining teachers: again, science and maths were the most problematic, English ranked next rather than modern foreign languages.
Across all subjects, recruiting teachers tended to be more problematic for leaders than retaining teachers. Overall, 68% of leaders reported having an issue retaining teachers in at least one of these subjects, 24 percentage points fewer than the proportion who experienced difficulties with hiring teachers for any of these subjects.
75%
51% 49% 48% 47%
Quintile 1(Bottom)
Quintile 2 Quintile 3 Quintile 4 Quintile 5(Top)
Question: G4. Do you believe that your school currently has the teaching capacity to achieve the EBacc ambition?Base: All secondary leaders by FSM: 0-20% (n=30), 21-40% (n=80), 41-60% (n=96), 61-80% (n=80), 81-100% (n=63).

29
Figure 9: The proportion of schools that have difficulty recruiting or retaining teachers in EBacc subjects
Schools in England were ranked according to the proportion of pupils attending the school who receive free school meals. Schools in the bottom quintile represent those with the fewest pupils on free school meals and, conversely, those in the top quintile have the highest proportion of pupils accessing free school meals. Leaders from schools with a high proportion FSM students (the top quintile) were significantly more likely to report difficulties with recruiting (96%) and retaining (66%) teachers in EBacc subjects. In comparison, leaders from schools with a low proportion of FSM students (from the bottom quintile) reported these difficulties were less pronounced; reported at 82% and 39% respectively. The difference was particularly marked when looking at retention of science teachers. Only 25% of those in the bottom quintile had an issue with this, a significantly smaller proportion than reported by all other quintiles (56% for those in the second quintile, 56% for those in the 3rd quintile, 53% for those in the 4th quintile and 56% for those in the top quintile). Though due to a low base size for the bottom quintile (n = 30), these findings should be treated with caution.
Leaders from schools in the South East were significantly more likely to report difficulties with recruiting science teachers compared to the national average (94% and 79% respectively). However, they were in line with the other regions when asked about retaining teachers. Those from the East of England, were significantly more likely than average to express difficulty retaining teachers in EBacc subjects (85% and 68% respectively). This was particularly driven by issues retaining science teachers (74% compared to 51% on average), English teachers (55% compared to 32% on average)
1%
31%
20%
32%
24%
47%
51%
1%
7%
44%
52%
56%
75%
79%
Don't know
No difficulty
Humanities
English
MFL
Maths
Science
RecruitingRetaining
Question: G5/G6: Do you have difficulty recruiting / retaining teachers for the following EBacc subjects?Base: All secondary school leaders (n=362)

30
and humanities teachers (40% compared to 20% on average). Again, due to a low base size for the East of England (n = 36), these figures should be treated with caution.
1.3 GCSE Reform
Computer Science GCSE Since September 2015, the Government has been reforming GCSEs and introducing the new GCSE exams in a series of waves. The second wave launched in September 2016 and saw the introduction of computer science, along with a range of 16 other subjects. Computer science is a particularly valued subject as equipping students with technological skills will be essential to maintaining the UK as a leading global digital economy in the future. As the digital sectors continue to grow and contribute billions of pounds to the UK economy, an estimated additional 1.2 million people with specialist digital skills will be required by 2022.15
87% of secondary leaders reported that they offer the new computer science GCSE. Of those who offered the GCSE, 72% reported that their teachers are confident at teaching it, while 17% said they were not. Figure 10 provides the full breakdown of responses among those who offer the new GCSE.
Figure 10: Leaders views of teacher confidence in teaching the new Computer Science GCSE
15 https://www.gov.uk/government/news/schools-minister-announces-boost-to-computer-science-teaching
29% 43% 11% 14% 3%
Very Fairly Neither / nor Not very Not at all
Question: F1: How confident are your teachers to teach the new computer science GCSE, introduced in September 2016?
Base: All secondary leaders who offer a Computer Science GCSE (excluding ‘don’t know’ responses) (n=308)
17% NOT CONFIDENT
72% CONFIDENT

31
Leaders from schools in the quintile with the highest proportion of children on free school meals were significantly more likely to report that they were not confident with the new GCSE compared to those from all other quintiles (40% compared with 12% on average).
Language GCSEs As part of the GCSE reform programme, new language GCSEs (both ancient and modern foreign languages) have been introduced each year since September 2016, with more being added in the September 2018 academic year.
In the 2018 Summer Survey, secondary leaders who stated that they have pupils entering Key Stage 4 in September 2018 were asked to estimate the percentage that will be studying a GCSE language which is eligible for the EBacc. The mean (55%) and median (50%) responses suggest that around half of the pupils will be studying a GCSE language subject, though Figure 11 shows that the distribution of the proportions is quite wide.
The most common response was in the 91-100% band, where 15% of leaders thought that between 91 and 100% of pupils starting KS4 would study a language GCSE eligible for the EBacc in the 2018 academic year. Following this, it was common for leaders to expect somewhere between 11% and 50% of pupils to study a GCSE language. A smaller proportion quoted between 51-90% of pupils and only 2% of leaders stated up to 10% of pupils will be studying a GCSE language.

32
Figure 11: The proportion of those starting KS4 that will be studying a language GCSE eligible for the EBacc in September 2018
At an overall level, leaders in schools with the highest proportion of pupils eligible for FSM (in quintiles 4 and 5) reported a significantly lower proportion of pupils studying a language GCSE than average (42% and 43% compared with an average of 55%). Leaders from non-academy schools were also more likely to expect fewer students to study a GCSE language than the average leader (mean scores: 51% compared to 55% of the total population, this is significant).
Question: H2: Of those starting Key Stage 4 in September 2018, what percentage will be studying a language GCSE that is eligible for the Ebacc?
Base: Secondary leaders that have at least one pupil starting Key Stage 4 in September 2018 (n=337)
5%
15%
6%7%7%
8%
14%13%
10%11%
2%

33
1.4 Curriculum planning Secondary school leaders were presented with a series of factors that might be taken into account in curriculum planning and asked to state how important each was when making decisions about their curriculum planning (Figure 12). They were asked to rate each factor on a scale from one to ten, where one was not at all important and ten was very important. The three factors that received the highest average importance ratings were the specific learning needs of each cohort or year level (mean score 8.5/10), funding (mean score 8.4/10) and the availability or expertise or teaching staff (mean score 8.3/10).
Figure 12: Importance of factors for curriculum planning in secondary schools16
Progress 8 and Attainment 8 are school performance measures set by government. While 86% of leaders thought Progress 8 was an important consideration when making decisions about their curriculum planning, it was not one of the three factors receiving the highest average importance ratings. Lower consideration was given to EBacc when making curriculum decisions; only two in five (41%) leaders reported it as an important factor and it received a mean score of 5.8 which is significantly lower than all other factors except for Ofsted (where only 47% said it was important). There were no clear
16 Interpretation note: Mean scores should not be compared between the prompted statements and the spontaneously given responses. Participants who provide a spontaneous factor, have this factor as front of mind and are likely to rate it as higher than those who do not have it as front of mind. Further, due to the nature of the question, the base sizes are much smaller for the spontaneously given factors.
8.5
8.4
8.3
8.1
7.7
6.3
5.7
Specific learning needs of each cohort / year level
Funding
Availability or expertise of teaching staff
Progress 8
Attainment 8
Ofsted
EBacc
Question D1. How important are the following factors when mak ing decisions about curriculum planning at your secondary school?Base: All secondary leaders (n=362)
Mean score (1-10)

34
regional trends when looking at the importance ratings given to Progress 8 and EBacc, but there is some indication that the East of the England was less likely to rate Progress 8 as important compared to the average mean score across the regions of (with mean scores of 7.2 and 8.1 respectively).
Three-quarters (75%) of secondary school leaders said they considered factors not in the prompted list to be important and they were asked to specify these. As shown in Table 3, the most common ‘other’ factor mentioned by leaders was pupil progression routes / destinations, with over one quarter of leaders stating that this was taken into account in curriculum decisions (26%). The next most common factor was ensuring that the curriculum was broad and balanced (18%).
Table 3: Other factors secondary school leaders considered when making curriculum decisions17
Additional factors % Mean score
Pupils progression routes / destinations 26% 8.7
Ensuring the curriculum is broad and balanced
18% 9
Meeting the changing needs of society / local labour markets
16% 8.2
Availability of in-school resources (not incl. teaching staff)
16% 8.5
General quality of courses / ensuring they meet government expectations
14% 8.4
Primary school leaders were also presented with a series of factors that might influence their curriculum planning and asked how important each was in their curriculum decisions (Figure 13). Again, they were asked to rate each factor in terms of their influence on curriculum planning at their school from one to ten, where one was not at all important and ten was very important.
Similar to secondary school leaders, primary school leaders rated the specific learning needs of each cohort or year level as the most important (mean score 9.1/10), and funding was also considered one of the top three most important factors (mean score 8.6/10). However, primary school leaders gave progress measures significantly higher average importance ratings than availability or expertise of teaching staff (mean scores of
17 Means scores in Table 3 cannot be directly compared with mean scores in Figure 12. In Table 3, only leaders who spontaneously mentioned another factor were asked to rate how important it is. It is likely that this subset of the sample will have given a higher mean score than if it was asked of all leaders.

35
8.8 and 8.5 respectively). Attainment measures were also considered to be relatively important (8.4/10). As statutory assessments feed into the progress measures, it was interesting that the average ratings that leaders gave to statutory assessments was significantly (albeit slightly) lower than the progress measures themselves (8.3 and 8.8 respectively).
Figure 13: Importance of factors for curriculum planning in primary schools16
There is some indication, that leaders from East Midlands attach slight but significantly less importance to progress measures and statutory assessments than leaders from other regions (with a mean score of 8.3 compared with 8.8 for progress measures, and 7.6 compared with 8.3 for statutory measures).
The majority (85%) of primary school leaders said that they considered factors other than those in the prompted list when making decisions about curriculum planning at the school (Table 4). Of those who did consider other factors, one third (32%) spontaneously mentioned that they consider children’s interests and over one quarter (27%) said that they consider the changing needs of society or the local labour market.
These other factors were generally considered to be important by the leaders who mentioned them, but the level of importance varied considerably across these additional factors. The other factor that generated the highest average score on the importance rating was ‘ensuring the curriculum is broad and balanced’ (mean score of 9.5) and the factor with the lowest score was ‘parental expectations and feedback’ (7.9).
9.1
8.8
8.6
8.5
8.4
8.3
Specifc learning needs of each cohort / year level
Progress measures
Funding
Availability or expertise of teaching staff
Attainment measures
Statutory assessments
Question D3. How important are the following factors when mak ing decisions about curriculum planning at your primary school? Base: All primary leaders (n=396)
Mean score (1-10)

36
Table 4: Other factors primary school leaders considered when making curriculum decisions18
Additional factors % Mean score
Children's interests 32% 9.3
Meeting the changing needs of society / local labour markets
27% 8.5
Ensuring the curriculum is broad and balanced
21% 9.5
Availability of in-school resources (not incl. teaching staff)
15% 8.5
General quality of courses / ensuring they meet government expectations
14% 9.2
18 Means scores in Table 4 cannot be directly compared with mean scores in Figure 13 due to different bases. In Table 4, only leaders who spontaneously mentioned another factor were asked to rate how important it is.

37
1.5 Teaching time in primary schools Primary school teachers were asked to estimate how many minutes of teaching time they spent on English, maths and science in a typical week. On average, primary school teachers reported spending approximately five hours (318 minutes) teaching English, four hours (257 minutes) teaching maths and just under one and half hours (80 minutes) teaching science per week. Figure 14 displays both the mean and median times spent in minutes.
Figure 14: Time spent teaching English, maths and science in primary schools
The results indicate that teachers in the South West might spend less time teaching English and maths than the national average. On average teachers in the South West reported spending forty-five minutes less time per week teaching English, (272 minutes compared to 318 minutes) and forty minutes less on maths (217 minutes compared to 257 minutes). There were no significant differences between the South West and other regions when it came to time spent teaching science.
There is also some indication that teachers from the North East might spend about one hour more on maths per week (with an average of 318 minutes compared to the national average of 257 minutes). Teachers from the Yorkshire and Humber also reported spending close to twenty minutes more per week teaching science than the national average (97 minutes compared to 80 minutes). These regional differences are significant at the 95% level but should be interpreted with caution.
There is no difference by academy school status and time spent teaching English, maths or science.
Primary school leaders were asked whether the time spent teaching science in Key Stage 2 had changed over the last five years (Figure 15). Although the majority (57%)
318
257
80
English
Maths
Science
Question E1. Approximately how many minutes of teaching time do you spend on the following curriculum subjects in an average week?Base: All primary teachers (n=600)
Mean number of minutes Median
325
300
60

38
thought that the time spent had remained broadly the same, one in five leaders (19%) thought it had increased and one in six leaders (16%) thought that it had decreased. Leaders from schools in the North West (32%) were significantly more likely to say that they spent more time teaching science (average was 19%).
Figure 15: Time spent teaching science in Key Stage 2 in the past 5 years
The 16% of leaders who thought that teaching time for science had decreased were provided with a series of statements about why this decrease might have occurred, and were asked to indicate how much they agree with these statements. Figure 16 outlines the responses.
Nearly all leaders (93%) who had experienced decreases in science teaching time said it was because English and maths had been prioritised. The next most common reason given by two in five leaders (44%) was that schools had moved to project-based working. These leaders were also provided an opportunity to mention any other reasons why they thought science teaching time had decreased. Close to one quarter (22%) of these leaders spontaneously mentioned that it was because science was not tested on the curriculum (due to removal of SATs). This reason is linked to the high proportion stating that the reason for a decrease in science teaching time was a result of prioritising of English and maths, as these subjects are still tested.
19% 57% 16% 7%
Increased Stayed the same Decreased Don't know
Question: E2. In the past 5 years, at your schools, has the time spent teaching science in Key Stage …?Base: All primary school leaders (n = 396)

39
Figure 16: Main reasons for the decrease in time spent teaching science (selected from a list unless stated otherwise)
93%
44%
26%
25%
25%
22%
22%
8%
English and Maths have been prioritised
Moved to project based working
Time pressures / constraints relating to thecurriculum (spontaneous)
Teachers have insufficient knowledge to teachKS2 science
Teachers are not confident to teach KS2 science
Funding not available
Not tested on the curriculum / the removal of SATs(spontaneous)
Other
Question: E3. Main reasons for decrease in time spent teaching science Base: All primary school leaders who said time teaching science has decreased (n = 62)

40
1.6 Systematic Synthetic Phonics Systematic synthetic phonics (SSP) is the method of teaching pupils how to read by breaking down words into the smallest of units of sounds and then blending them into words.
The vast majority of primary school leaders (93%) reported that their schools use SSP to teach children to read in reception. As shown in Figure 17, four in five leaders (81%) said their school used it as their primary method of teaching while one in ten used it as their secondary method (12%). These results align with the 2017 Winter Survey, which found the 94% of primary teachers used SSP, and 82% reported that they were either very or fairly confident in doing so.
Figure 17: Use of SSP for teaching children to read in reception
In the 2018 Summer survey, across all primary schools, non-academy schools were significantly more likely than academy schools to use SSP in some capacity (97% and 86% respectively). When analysing by region, schools in the North West all reported they used SSP, which was significantly higher than average (100% and 93%). Those in the East of England more frequently stated that they did not use SSP at all (12% compared with 5% on average).
81% 12% 5% 1%
Yes, primary method Yes, but not primary method No Don’t know
Question:J1. Does your school use systematic synthetic phonics (SSP) for teaching children to read in reception? Base: All primary leaders (n=396)
93% USE SSP IN SOME CAPACITY

41
1.7 Transition to Key Stage 1 Key Stage 1 primary school teachers were asked how well prepared they felt children entering Key Stage 1 were for the transition to year 1 and the Key Stage 1 curriculum. They were first asked specifically about three subject areas and then more generally about their readiness to learn and access the KS1 curriculum. Figure 18 shows the breakdown of responses.
Teachers reported that children were most prepared for KS1 language and maths subjects: more than two thirds reported that children were very or well prepared for both subjects (70% and 67% respectively). More than half of the KS1 teachers reported preparedness for literacy (65%) and for readiness to learn (55%). However, just over one quarter of teachers reported that they felt their students were generally unprepared (either ‘unprepared’ or ‘very unprepared’) with regards to their readiness to learn and access the Key Stage 1 curriculum.
Figure 18: Preparedness of children for the transition to year 1 / the KS1 curriculum
13%
12%
12%
15%
57%
55%
53%
40%
13%
13%
15%
18%
14%
18%
18%
24%
1%
1%
3%
2%
1%
1%
For language
For maths
For literacy
Readiness to learn /access the
KS1 curriculum
Very well prepared Well prepared Neither / nor Unprepared Very unprepared Don't know
Question: I1. How well prepared are children for the transition to year1/KS1 curriculum?Base: All primary teachers who teach Key Stage 1 (n=317)
70%
67%
65%
55%
Prepared (very / well)
15%
18%
19%
27%
Unprepared(unprepared /
very)

42
2. Teacher workload, recruitment and retention This chapter considers how teacher workload has changed in recent years, school leader’s experiences with hiring supply teachers into permanent roles, teacher’s aspirations to headship and their experiences of continuing professional development.
2.1 Teacher workload The DfE has been working to reduce the time teachers spend on unnecessary or unproductive tasks which add little value to their pupils or schools. This work aims to improve retention rates in schools and enable teachers and school leaders to focus on teaching and their own development.
Since the Workload Challenge in 201419, the DfE has taken a number of steps to further evaluate and address reducing workload. Such actions include: the report of the workload advisory group and a government response to this report (published in November 2018), with recommendations to remove unnecessary data and evidence collections in schools20; the publication of a new workload reduction toolkit for schools in July 201821; producing the 2016 Teacher Workload Survey report22, delivering an action plan for reducing teacher workload23 and setting up three independent teacher workload review groups which published reports on increasing efficiencies in marking, planning and data management in 2016.
To provide a more comprehensive review, we have reported the teachers and leaders’ views on actions taken to reduce workloads as separate groups and together.
Leader results
When considering the responses from leaders, all but two leaders (unweighted) reported that their schools had undertaken at least one action to evaluate and reduce unnecessary workload. Figure 19 shows the responses from leaders to the 2017 Winter and 2018 Summer surveys. The 2018 Summer Survey saw an increase in six of the seven actions listed in both the surveys. The most cited action taken was to consult with staff in ways other than conducting a workload survey (96%), followed by reducing or changing marking (93%), and reviewing or updating school policies (92%).
19 https://www.gov.uk/government/publications/workload-challenge-for-schools-government-response 20 https://www.gov.uk/government/publications/teacher-workload-advisory-group-report-and-government-response 21 https://www.gov.uk/guidance/reducing-workload-in-your-school 22 https://www.gov.uk/government/publications/teacher-workload-survey-2016 23 https://www.gov.uk/government/publications/reducing-teachers-workload

43
Figure 19: Proportion of actions taken by schools to evaluate and reduce unnecessary workload as reported by leaders
Primary leaders in the 2018 Summer survey were more likely to state that their school had reduced or changed planning compared to secondary leaders (82% and 58% respectively) as well as used advice from Ofsted (76% and 63%). Secondary leaders were more likely to have carried out a workload survey of staff (60% compared to 48% of primary leaders).
Over one quarter (26%) of leaders who had taken action, said that these actions had made their own workload in an average week a bit more manageable and 5% said it had made their workload a lot more manageable. More than two thirds (68%) said that these actions had not made their average weekly workload more manageable.
Teacher results
Figure 20 shows the teacher responses to the 2017 Winter and 2018 Summer surveys. More teachers were aware of the actions taken by the school in the Summer 2018 than in Winter 2017 survey, while the proportion of teachers who report not knowing about actions taken in their school is still relatively high compared to leaders. This increase in
39%
64%
68%
71%
93%
88%
95%
50%*
69%*
73%
74%*
78%*
92%
93%*
96%
Carried out a workload survey ofstaff
Used the 3 independent reports
Used advice from Ofsted
Actively addressed any of therecommendations in the 3
independent reports
Reduced or changed planning
Reviewed or updated schoolpolicies
Reduced or changed marking
Consulted with staff in waysother than a survey
2018 Summer2017 Winter
Question: wave 1: L1, wave 2: K1: Which of the following has your school done to evaluate and reduce unnecessary workload? Base: All leaders, wave 1 (n=800), wave 2 (n = 758) ‘Used advice from Ofsted’ was only asked in the Summer survey.
* Indicates a statistically significant difference between the 2017 Winter and 2018 Summer waves

44
awareness between the two waves might have led to the significantly higher proportion of teachers stating that their school has ‘actively addressed any recommendations in the 3 independent reports’ (from 33% to 43%) and ‘used the independent reports’ (35% to 44%) in the Summer 2018 survey. Between the two waves, the proportion of ‘don’t know’ answers for these two actions also significantly reduced from 44% to 37%, and 40% to 34% respectively.
Figure 20: Proportion of actions taken by schools to evaluate and reduce unnecessary workload as reported by teachers
Of the teachers who said their school had taken action, two in five (42%) said these actions had made their own workload in an average week a bit more manageable and 7% said it had made their workload a lot more manageable. Forty-seven percent stated that these actions had not made their average weekly workload more manageable.
Leader and teacher combined results
Figure 21 shows the combined teacher and leader responses to the 2017 Winter and 2018 Summer surveys. The 2018 Summer survey saw an increase in six of the seven actions listed in both surveys. In the Summer 2018 Survey, the top three actions cited
29%
35%
33%
46%
70%
64%
72%
28%
44%*
54%
43%*
46%
73%
64%
69%
Carried out a workload survey ofstaff
Used the 3 independent reports
Used advice from Ofsted
Actively addressed any of therecommendations in the 3
independent reports
Reduced or changed planning
Reviewed or updated schoolpolicies
Reduced or changed marking
Consulted with staff in waysother than a survey
2018 Summer2017 Winter
Question: wave 1: L1, wave 2: K1: Which of the following has your school done to evaluate and reduce unnecessary workload? Base: All teacher, wave 1 (n=909), wave 2 (n = 1040) ‘Used advice from Ofsted’ was only asked in the Summer survey.
* Indicates a statistically significant difference between the 2017 Winter and 2018 Summer waves

45
were ‘reviewed or updated school policies’, ‘consulted with staff in ways other than a survey’, and ‘reduced or changed marking’. These are the same top three actions that were reported in the Winter 2017 Survey, but in a slightly different order.
Figure 21: Proportion of actions taken by schools to evaluate and reduce unnecessary workload as reported by leaders and teachers
In the 2017 Winter survey, leaders and teachers were asked to estimate how many hours their workload had reduced as a result of the school taking action. In the Summer 2018 survey, the question was amended to ask whether the actions had made their workload more manageable. The responses to both questions can be seen in Figure 22.
In both surveys, just under half of the leaders and teachers who reported that their school had taken action also reported that their workload had become more manageable (47% in the Winter survey and the Summer survey, excluding ‘don’t know’ responses). In the Summer survey, two-fifths (40%) said that it had become a ‘bit more manageable’ and 7% ‘a lot more manageable’.
30%
39%
38%
49%
73%
67%
75%
31%
48%*
56%
48%*
50%
76%*
68%
73%
Carried out a workload survey ofstaff
Used the 3 independent reports
Used advice from Ofsted
Actively addressed any of therecommendations in the 3
independent reports
Reduced or changed planning
Reviewed or updated schoolpolicies
Reduced or changed marking
Consulted with staff in ways otherthan a survey
2018 Summer2017 Winter
Question: wave 1: L1, wave 2: K1: Which of the following has your school done to evaluate and reduce unnecessary workload? Base: All leaders and teachers, wave 1 (n=1709), wave 2 (n = 1798) ‘Used advice from Ofsted’ was only asked in the Summer survey.
* Indicates a statistically significant difference between the 2017 Winter and 2018 Summer waves

46
Figure 22: Extent to which workload has changed following action
Of those that have taken action, primary schools were more likely to say that their workload had become more manageable than secondary schools (53% and 40% respectively), and teachers were more likely to say so than leaders (49% and 30% respectively). Teachers were significantly more likely to say that the actions taken at their school had made their workload a bit more manageable (42% versus 26%) and leaders were significantly more likely than teachers to say that the actions taken at their school had not made their workload more manageable (68% and 47% respectively).
53%
35%
11%2%
Not at all Up to 2 hoursa week
2-5 hours aweek
More than 5hours a week
Winter 2017
50%40%
7%
No Yes, a bit moremanageable
Yes, a lot moremanageable
Have these actions made your workload more manageable?
To what extent has your workload reduced as a result of these actions?
Question: (Wave 1) L2. / (Wave 2) K3. Have these actions made your own work load in an 'average' week more manageable? Base: All that have taken action (excluding DK); Wave 1 (n=1,606), Wave 2 (n=1,669 – exc. DK)
Summer 2018

47
2.2 Hiring supply teachers School leaders were asked whether they had experienced barriers when hiring supply teachers into permanent teaching roles. As shown in Figure 23, nearly two in five (38%) leaders reported they had experienced barriers when hiring supply teachers into permanent roles.
Figure 23: Barriers experienced by leaders when hiring supply teachers into permanent roles
Of the leaders who said they had experienced barriers recruiting supply teachers to permanent roles, leaders from certain school types were significantly more likely to report experiencing barriers:
• Secondary schools over primary schools (62% and 33% respectively);
• Schools in London (62%) over those in all other regions (44% for East Midlands, 41% for East of England and West Midlands, 37% for South East, 34% for South West, 28% for North West and 26% for Yorkshire and Humber);24
• Schools with the highest proportion of pupils eligible for free school meals (46% of schools in the top quintile) over those in the bottom two quintiles (32% and 33% of schools).
Those who had experienced barriers were asked to choose from a list up to three specific barriers. The most commonly cited issue was the cost of agency temp-to-permanent fees (mentioned by 81% of those experiencing barriers), followed by the quality of supply teacher applicants applying to permanent roles (56%). The proportion that mentioned any other reasons was relatively low compared to these top two (22% or lower).
24There is one exception: the schools in London and the North East are not significantly different, though this is due to the low base size (n=29) as the widest gap is between these two regions (62% London vs 24% North East).
Have not needed or wanted to hire supply teachers into permanent teaching roles
Have experienced barriersNo barriers experienced
50%38%12%
Question: L0. Have you experienced barriers when hiring supply teachers into permanent teaching roles?Base: All leaders (n=758)

48
Figure 24: Main barriers to hiring supply teachers into permanent teacher roles (prompted codes unless stated)
Looking at the five most commonly reported barriers, there were some themes in those commonly cited together. The greatest overlap was between the cost of agency temp-to-permanent fees with the other four barriers. This was mentioned as an issue by:
• 78% of the leaders who stated that the quality of applicants was a barrier
• 69% of leaders who stated that supply teachers were not seeking permanent roles was a barrier
• 64% of leaders who mentioned availability of suitable applicants as a barrier, and
• 59% of leaders who said that supply teachers lacking up-to-date CPD was a barrier.
There was also notable overlap between the proportion of leaders who said that the quality of applications was a barrier and those who thought there was a lack of applicants that are suitable for the school (72%) and those who said that supply teachers lacked up-to-date CPD (60%).
There were some significant subgroup differences in the barriers mentioned. Leaders in primary schools were more likely to find supply teachers not seeking permanent employment to be a barrier than secondary school leaders (26% and 12% respectively),
81%
56%
22%
16%
10%
7%
4%
4%
4%
4%
4%
The cost of agency temp to permanent fees
The quality of applicants
Supply teachers not seeking permanent employment
Supply teachers lacking up-to-date CPD
Availability of applicants that are suitable for the school(spontaneous)
Applicants' expectations of job differ from the reality(spontaneous)
Supply teachers aren't attracted to the school (e.g.rural) (spontaneous)
The time and paperwork involved in recruitment e.g.contracts, background checks (spontaneous)The cost of training supply teachers is prohibitive
(spontaneous)Recruitment information from agencies and references
is inaccurate (spontaneous)
Lack of flexible working options
Question: L1. What do you see as the three main barriers when hiring supply teachers into permanent teaching roles?Base: All leaders who had experienced barriers when hiring supply teachers into permanent roles (n=351); only responses over 3% have been displayed

49
as were those with the highest proportion of pupils eligible free school meals (33% compared to 22% average). Further, leaders in academies were more likely to state the cost of agency temp-to-permanent fees than non-academies (89% and 77% respectively).
2.3 Aspiration to headship Looking at the theme of leadership in schools, teachers were asked whether they aspire to be a headteacher. One in four teachers (23%) responded that they do, but the majority (69%) said they did not want to be a headteacher in the future. Seven percent did not know at the time of the survey. Leaders were not asked this question.
This theme was also explored in the May 2017 Teacher Voice Omnibus Survey.25 Although results must be interpreted with caution due to differences in sampling methodology between the two surveys, there is some indication that aspirations for headship have increased amongst teachers in the last year.
Results from this wave show that men were significantly more likely to aspire to be a headteacher than women (33% and 20% respectively). As might be expected, younger teachers (both men and women) were also significantly more likely to aspire to headship than older teachers: 30% of 18 to 34 year olds stated that they wanted to become a headteacher, as did 24% of 35 to 44 years olds, compared with 13% of 45 to 54 year olds and 2% of 55 to 64 year olds.
Closely linked with age is the length of time teaching: 29% of those teaching for 10 years or less aspired to become a headteacher compared to only 18% of those in teaching for a longer time. Similarly, Newly Qualified Teachers (39%) were more likely to aspire to headship than those who are QTS/QTLS in the main pay range (24%) or upper pay range (18%). (These findings are significant at the 95% level of confidence).
The type of school the teachers worked at had less of an impact than the personal attributes described above. There was little variation in teachers’ likelihood to aspire to headship by their school’s academy status, phase (primary or secondary) or proportion of students entitled to free school meals.
Teachers who want to become a headteacher in the future were asked about the timescale they hoped to achieve this in. 18% of teachers said they aspired to become a
25 In the May 2017 Teacher Voice Omnibus, a smaller proportion (9%) of teachers aspired to be a headteacher, and over nine in 10 (91%) did not. Question: Do you aspire to be a headteacher? Base: Assistant and deputy headteachers and teachers, n=1,492, assistant and deputy leaders (549), teachers (943). Due to differences in sampling methodology, comparisons between the School Snapshot Survey and the Teacher Voice Omnibus should be interpreted with caution.

50
headteacher within the next 3 years, 57% said in the next 4 to 10 years and 24% said in more than 10 years. Only 1% did not know.
As might be expected, older teachers hoped to see themselves in a headteacher position sooner than younger teachers. Only 4% of 18 to 34 year olds reported an aspiration to be a head within the next 3 years compared to 28% of 35 to 44 year olds and 48% of teachers aged 45 or more. Those in a QTS/QTLS job role in the main pay range were less likely to envisage it within the next 3 years (3%) compared to those in the upper pay range (17%). (These findings are significant at the 95% level of confidence). There was no clear pattern by gender in terms of when male and female teachers expected to become a headteacher.
While the type of school did not have an impact on whether teachers aspire to become a headteacher, it did show different responses when looking at timescales. Primary teachers who aspired to headship were significantly more likely to report that they hoped to be a head within the next 3 years (25%) than secondary teachers (8%). Secondary teachers were more likely to state in more than 10 years (35% and 15% primary).
The 69% of teachers who said they did not aspire to become a headteacher were asked to select their main reason for stating this from a pre-coded list (Figure 25). Three in ten (29%) teachers said that they wanted to stay in the classroom and two in ten (21%) said it was because of the work-life balance.
Figure 25: Main reason for not aspiring to become a headteacher
29%
21%
11%
9%
9%
8%
5%
4%
1%
2%
1%
I want to stay in the classroom
Work-life balance
Pressure and pace of the role
The responsibilities at that level
Headteacher workload
I am happy to stay at my current level
I plan to leave the profession
The accountability framework
I'm planning to apply for a different position in the school e.g.SLT, SENCO etc.
Another reason
None of these
M3. Why don’t you aspire to be a headteacher? Base: teacher that do not aspire to be a headteacher (n=721)

51
There were few notable differences among the various subgroups. Teachers who had been teaching for a shorter period of time were significantly more likely to state that their main reason for not wanting to be a head was that they wanted to stay in the classroom (40% of those teaching for less than 5 years compared to 27% of those teaching for 6 or more years). Secondary school teachers were significantly more likely to select work-life balance as the main reason for not wanting to be a head than primary school teachers (25% and 17% respectively). Teachers with a qualified teaching status (QTS/QTLS) in the upper pay range were significantly more likely to cite being happy at their current level (10%) and give the accountability framework as a reason (5%) compared to those in the main pay range (4% and 1%).

52
2.4 Continuing Professional Development (CPD) In recent years, school leadership teams have been encouraged to prioritise the provision of Continuing Professional Development (CPD) opportunities for teaching staff. In July 2016, the Department published a ‘Standard for teachers’ professional development’.26
The standard states that effective teacher professional development is a partnership between:
• Headteachers and other members of the leadership team; • Teachers; and • Providers of professional development expertise, training or consultancy.
In order for this partnership to be successful:
• Professional development should have a focus on improving and evaluating pupil outcomes.
• Professional development should be underpinned by robust evidence and expertise.
• Professional development should include collaboration and expert challenge.
• Professional development programmes should be sustained over time. And all this is underpinned by, and requires that:
• Professional development must be prioritised by school leadership.
Despite this focus on CPD from Government, nine in ten (91%) teachers reported that there were barriers to accessing effective CPD. Teachers were asked whether they had encountered eight possible barriers. As Figure 26 shows, cost was the most commonly mentioned barrier by both primary and secondary school teachers. Over half (51%) of those who experienced barriers said that having insufficient time to take up CPD was at least one of the barriers they encountered. Opportunities was another key barrier. Teachers also had an option to specify if there were any other barriers they encountered. Four percent of all teachers ‘spontaneously’ mentioned that lack of cover for lessons was a barrier to accessing CPD. The British Council has also published findings corroborating these findings. They too have reported that lack of time and classroom cover constitute key challenges for teachers accessing CPD.27
26 https://www.gov.uk/government/uploads/system/uploads/attachment_data/file/537030/160712_-_PD_standard.pdf 27 http://englishagenda.britishcouncil.org/continuing-professional-development/cpd-managers/what-are-some-challenges-continuing-professional-development

53
Barriers were not experienced evenly by primary and secondary school teachers. Primary school teachers were significantly more likely to say there were no barriers to CPD. In contrast, secondary school teachers were significantly more inclined to view each possible barrier presented to them as an existing barrier- apart from the barriers of ‘cost’ and ‘no relevant opportunities’.
Figure 26: Main barriers to accessing effective CPD
Barriers to CPD were experienced differently depending on a teacher’s gender, age and whether they taught at an academy school or not. Compared to female teachers, male teachers were less likely to say that cost was a main barrier (65% vs 72%), but were more likely to report they had not found CPD worthwhile in the past (15% vs 9%). Older teachers (aged 55-64 years old) were more likely to have reported a lack of support from senior managers as a barrier to CPD than any other age group. Teachers at academy schools were more likely than non-academy schools to say they have not found CPD worthwhile in the past (15% and 9% respectively).
3. Support for Students Chapter four reviews the support that student receive across a range of issues. It examines teachers’ perceptions of pupil behaviour, teachers’ confidence in supporting students regarding gender identity and sexual orientation, provision of sanitary products,
70%
51%
32%
29%
14%
11%
10%
9%
4%
1%
9%
Cost
Insufficient time to take up CPD opps
Do not have time to look for CPD opps
Lack of good quality CPD (locally)
Lack of good quality CPD (in school)
Have not found CPD worthwhile in thepast
Lack of support from senior managers
No relevant opportunities
Lack of cover for lessons
Other
No barriers
Question: N1. Turning to the issue of Continuing Professional Development, what do you believe are the main barriers to accessing effective Continuing Professional Development (CPD)? Base: All teachers (1,040); Primary teachers (n=600), Secondary teachers (n=440)
* Denotes a significant difference between primary leaders and teachers and their secondary counterparts
Primary Secondary
71%
28%
26%
8%
8%
4%
11%
47%
10%
10%
2%
69%
35%*
32%*
13%*
12%*
4%
7%
56%*
18%*
9%
1%
Prompted
Spontaneous

54
views and actions taken to address pupil’s inability to access nutritious food in the holidays, teacher views on SEND provision and resources as well as support given to pupils with mental health needs.
3.1 Pupil behaviour Over three-quarters of all leaders and teachers thought pupil behaviour at their school was good (76%) and were confident in their school’s ability to deal with challenging behaviour (79%).This compares with 7% thinking behaviour at their school poor, and 14% not being confident in their schools’ ability to deal with challenging behaviour. A similar proportion thought pupil behaviour was good in the May 2016 and May 2017 Teachers Voice Omnibus surveys.28
Figure 27: Pupil behaviour and confidence in the schools' ability to deal with challenging behaviour effectively
28 75% and 73% of leaders and teachers agreed with the statement in the May 2016 and May 2017 waves. Question: How would you rate pupil behaviour in your school? May 2016 Base: All leaders and teachers, n=1,874, May 2017 Base: All leaders and teachers n=1,959. However, due to differences in sampling methodology, comparisons between the School Snapshot Survey and the Teacher Voice Omnibus should be interpreted with caution. https://www.gov.uk/government/publications/teacher-voice-omnibus-may-to-july-2016-survey-dfe-questions
34% 45% 7% 11% 3%
Very confident Fairly Neither / nor Not very Not at all
Question: Z1. How would you rate pupil behaviour in your school?Z2. How confident do you feel in your school's ability to deal with pupils that present with the most challenging behaviours?
Base: All leaders and teachers (n=1798); Leaders (758), Teachers (1040)
31% 45% 17% 7%
Very good Good Acceptable Poor Very poor
Rating of pupil behaviour in schools
Confidence in school’s ability to deal with challenging behaviour
95%*
Leaders
72%
1% 8%*
Teachers
91%*
Leaders
78%
4% 15%*
Teachers
76% GOOD 7% POOR
79% CONFIDENT 14% NOT CONFIDENT
Goo
dPo
orNo
tCo
nf.
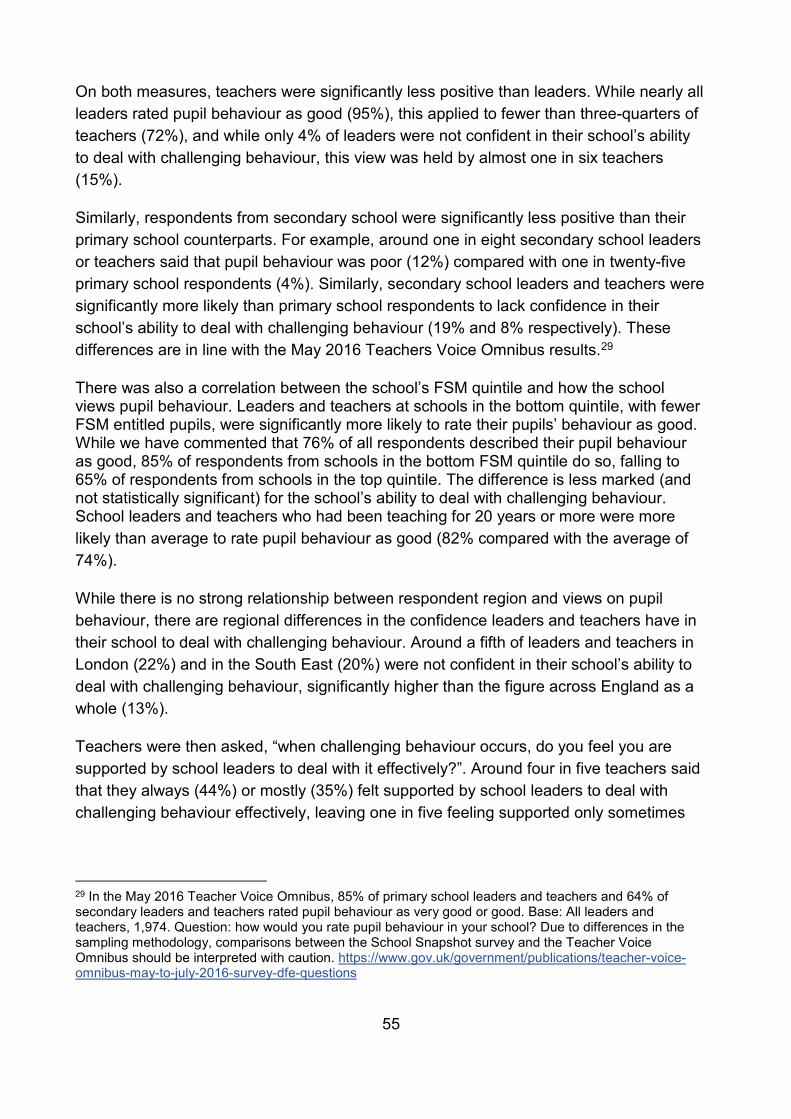
55
On both measures, teachers were significantly less positive than leaders. While nearly all leaders rated pupil behaviour as good (95%), this applied to fewer than three-quarters of teachers (72%), and while only 4% of leaders were not confident in their school’s ability to deal with challenging behaviour, this view was held by almost one in six teachers (15%).
Similarly, respondents from secondary school were significantly less positive than their primary school counterparts. For example, around one in eight secondary school leaders or teachers said that pupil behaviour was poor (12%) compared with one in twenty-five primary school respondents (4%). Similarly, secondary school leaders and teachers were significantly more likely than primary school respondents to lack confidence in their school’s ability to deal with challenging behaviour (19% and 8% respectively). These differences are in line with the May 2016 Teachers Voice Omnibus results.29
There was also a correlation between the school’s FSM quintile and how the school views pupil behaviour. Leaders and teachers at schools in the bottom quintile, with fewer FSM entitled pupils, were significantly more likely to rate their pupils’ behaviour as good. While we have commented that 76% of all respondents described their pupil behaviour as good, 85% of respondents from schools in the bottom FSM quintile do so, falling to 65% of respondents from schools in the top quintile. The difference is less marked (and not statistically significant) for the school’s ability to deal with challenging behaviour. School leaders and teachers who had been teaching for 20 years or more were more likely than average to rate pupil behaviour as good (82% compared with the average of 74%).
While there is no strong relationship between respondent region and views on pupil behaviour, there are regional differences in the confidence leaders and teachers have in their school to deal with challenging behaviour. Around a fifth of leaders and teachers in London (22%) and in the South East (20%) were not confident in their school’s ability to deal with challenging behaviour, significantly higher than the figure across England as a whole (13%).
Teachers were then asked, “when challenging behaviour occurs, do you feel you are supported by school leaders to deal with it effectively?”. Around four in five teachers said that they always (44%) or mostly (35%) felt supported by school leaders to deal with challenging behaviour effectively, leaving one in five feeling supported only sometimes
29 In the May 2016 Teacher Voice Omnibus, 85% of primary school leaders and teachers and 64% of secondary leaders and teachers rated pupil behaviour as very good or good. Base: All leaders and teachers, 1,974. Question: how would you rate pupil behaviour in your school? Due to differences in the sampling methodology, comparisons between the School Snapshot survey and the Teacher Voice Omnibus should be interpreted with caution. https://www.gov.uk/government/publications/teacher-voice-omnibus-may-to-july-2016-survey-dfe-questions

56
(14%), occasionally (6%) or never (1%). This finding aligns with the May 2016 Teachers Voice survey.30
Figure 28: Support from school leaders when dealing with challenging behaviour
There were significant differences in perceived levels of support between primary and secondary school teachers, by gender and by region. Primary school teachers were more likely to feel supported, particularly in always feeling supported in this way (52% compared with 35% among secondary school teachers). Male teachers were also more likely to feel supported (83% compared 77% among female teachers), as were those based in the East of England (86%, significantly higher than found in London (67%), the North West (76%) and the South East (74%). There were no significant differences between teachers by academy status, age or years spent teaching.
Leaders and teachers were asked to consider how much learning time is lost, on average when a single episode of challenging behaviour occurs. Twenty percent reported that it varies too much to say and 55% typically felt that five minutes or less was lost. Seventeen percent reported that 6-10 minutes were lost for each episode, and 8% felt more than 10 minutes of teaching time was lost per incidence of challenging behaviour.
30 In May 2016 Teachers Voice Omnibus, 23% of teachers said that more support from senior leaders would help them tackle low level disruption in the classroom. Question: Which two things would most help you tackle low level disruption in the classroom. Base: All teachers, n=1,054. Due to differences in sampling methodology, comparisons between the School Snapshot Survey and the Teacher Voice Omnibus should be interpreted with caution. https://www.gov.uk/government/publications/teacher-voice-omnibus-may-to-july-2016-survey-dfe-questions
35%
52%*
44%
38%*
32%
35%
17%
11%
14%
9%
4%
6%
1%
1%
1%
Always Mostly Sometimes Occasionally Never
All
Primary
Secondary
Question: Z3 : When challenging behaviour occurs, do you feel you are supported by school leaders to deal with it effectively?Base: All teachers (n=1040); Primary teachers (600), Secondary teachers (440)
7% NOT SUPPORTED79% SUPPORTED
5% NOT SUPPORTED84% SUPPORTED
10% NOT SUPPORTED73% SUPPORTED

57
Leaders tended to feel challenging behaviour caused less disruption to teaching time than teachers themselves. While almost two-thirds of leaders (63%) said that each challenging episode meant they lost less than five minutes of teaching time, this view was shared by only around half of teachers (53%).
Male leaders and teachers tended to cite less time being lost. Excluding those saying the time spent varies too much to be able to answer, three-quarters of male teachers (76%) compared with two-thirds of female teachers (66%) indicated five minutes or less teaching time was lost per episode of challenging behaviour. Teachers and leaders in schools with the highest proportion of students entitled to FSM (in the top FSM quintile) were more likely to report losing greater amounts of teaching time: they were significantly more likely to lose more than 10 minutes of teaching time (11% compared with the 8% average) and much less likely to report losing an average of 5 minutes (46% compared with the 57% average). Non-academy school leaders and teachers were slightly, but significantly, more likely than academy leaders and teachers to think they lost more than ten minutes per episode of challenging behaviour (9% and 6% respectively). There were no clear trends by region.
Figure 29: Time lost within each teaching hour for each episode of challenging behaviour
53%
63%
55%
19%
7%
17%
9%
5%
8%
19%
24%
20%
1-5 minutes 6-10 mins More than 10 mins Varies too much to say
Question: Z4. On average, how much learning time is lost within each hour of teaching time when a single episode of challenging behaviour occurs?
Base: All respondents (n=1,798); Leaders (758), Teachers (1,040)
All
Leaders
Teachers
69%
Primary
75%*
Secondary
70%
Females
78%*
Males72% UNDER 10 MINS
71% UNDER 10 MINS
72% UNDER 10 MINS
Under 10 mins
Under 10 mins

58
3.2 Diversity Support All schools should be inclusive places for children and young people irrespective of their developing sexual orientation and gender identity. Teachers play an important part in supporting students at this time. The National LGBT Survey31 found that openness regarding their sexual orientation and or gender identity with teaching staff was generally low amongst all sexual orientations, with 43% of gay and lesbian respondents stating that they had not been open with any teaching staff. Similarly, 41% of trans respondents stated that they had not been open about their gender identity with any of their teaching staff.
This survey asked teachers how confident they felt in providing support to students regarding their gender identity and sexual orientation if they were faced with a pupil asking them questions or needing additional support.
Gender identity Close to two-thirds (62%) of all teachers said they would feel confident in supporting students who approach them regarding their gender identity. This feeling of confidence was significantly higher among secondary than primary school teachers (68% and 57% respectively).
In contrast almost one in five teachers (18%) said they would not feel confident in supporting students who approach them regarding their gender identity; this was significantly higher among primary (20%) than secondary school teachers (15%).
Male teachers were significantly more likely to say they would feel confident compared to female teachers (67% and 60% respectively). There was no clear pattern in teachers’ level of confidence by their age, their school’s academy status, region or FSM quintile. Those that had been teaching for more than 20 years were less confident than average (53%).
31 https://www.gov.uk/government/publications/national-lgbt-survey-summary-report. The National LGBT Survey (2018).

59
Figure 30: Whether would feel confident in providing support to a student regarding gender identity
Sexual orientation Almost three-quarters (74%) of teachers reported they would feel confident about supporting students who approach them regarding their sexual orientation. This indicates that teachers would feel more confident in supporting pupils regarding sexual orientation than gender identity.
As with gender identity, significantly more secondary school teachers reported they would feel confident supporting students on issues of sexual orienation than primary school teachers (80% vs 69% respectively), indeed three in ten (30%) secondary school teachers felt very confident.
Also matching the pattern found with gender identity, male teachers were singifcantly more likely to feel confident on the issue of sexual orientation than their female counter parts (80% and 72% respecitvely). While those who had been teaching for more than 20 years were less likely to feel confident than average (57%). There was no clear pattern in levels of how confident teachers would feel by age, academy status, region or FSM quintile.
22%
12%
17%
46%
45%
46%
18%
23%
20%
12%
18%
15%
3%
2%
3%
Very confident Confident Neither nor Not very confident Not at all confident
Question O1. How confident would you feel in providing support to a student if they approached you regarding their gender identity?
Base: All (1,040); Primary teachers (n=600), Secondary teachers (n=440)
All
Primary
Secondary
18% NOT CONFIDENT62% CONFIDENT
20% NOT CONFIDENT57% CONFIDENT
15% NOT CONFIDENT68% CONFIDENT

60
Figure 31: Whether would feel confident in providing support to a student regarding their sexual orientation
3.3 Provision of Sanitary Products Currently, schools in England have discretion over how they use their funding, including their pupil premium, and can make sanitary products available to pupils should they identify this as a barrier to attendance or learning.
To provide a comprehensive review, we have analysed the views of secondary school leaders and teachers towards the free provision of sanitary products separately. Leaders were more likely than teachers to be sure about whether sanitary products were provided at their school. Thirty-eight percent of teachers, but only 4% of leaders, were unaware of whether free sanitary products were available at their school. Consequently, the findings from the leaders are likely to better reflect the actions implemented at a school, whereas results from teachers should be interpreted with caution.
Leader results
When considering the leaders’ responses, 83% of secondary school leaders reported that their schools provided free sanitary products to pupils as shown in Figure 32. Close
30%
16%
22%
50%
53%
51%
14%
19%
16%
6%
11%
9%
2%
1%
Very confident Confident Neither nor Not very confident Not at all confident
All
Primary
Secondary
Question O2. How confident would you feel in providing support to a student if they approached you regarding their sexual orientation?
Base: All (1,040); Primary teachers (n=600), Secondary teachers (n=440)
10% NOT CONFIDENT74% CONFIDENT
13% NOT CONFIDENT69% CONFIDENT

61
to two thirds (65%) provided these products on a case by case basis whereas 18% provided them to all pupils. Relatively few school leaders were certain that these products were not available at their school (13%).
Figure 32: Provision of free sanitary products to pupils at their school
Results show a significantly higher incidence of provision of free sanitary products on a case by case basis in the West Midlands (24% compared to the 13% average) and to all students in the East Midlands (34% compared to the 18% average).
The secondary leaders who said that their school provided free sanitary products were asked whether they provided them for any of the following reasons: students have stated that they cannot afford products, respondents believing that students have been missing school because they cannot afford sanitary products, and/or because students may need them on an emergency basis. Respondents could give more than one reason and could also give other spontaneous reasons.
As shown in Figure 33, the most common reason for providing free sanitary products, mentioned by almost all secondary school leaders (96%), was because students needed them on an emergency basis. In comparison close to two in five (38%) said it was because pupils had stated that they cannot afford them and just over one quarter (27%) said it was because they believed that pupils were missing school because they cannot afford them. Overall, 41% of leaders mentioned one of these two responses relating to student’s inability to afford sanitary products as at least part of the reason why their school provided the products free of charge. In terms of the spontaneously given
18%
65%
13%
4%
Yes - available to all Yes - case by case No Don't know
Question: R2. Are free sanitary products available to pupils in your school?Base: Secondary leaders (362)

62
answers, 3% of secondary school leaders said their school provided products because it was the right thing to do and 4% gave another reason.
Figure 33: Reasons leaders gave for providing free sanitary products at their school
Compared to leaders from non-academy schools, leaders from academy schools were significantly more likely to say they provided free sanitary products because students have stated they cannot afford them (42% academy compared with 31% non-academy) and because they believe students are missing school because they cannot afford them (31% vs 19%).
As shown in Figure 34 there is a strong correlation between schools that provide sanitary products due to affordability concerns and FSM quintile. More than half of the leaders in schools in the top quintile, with the highest proportion of students entitled to FSM, said they provided sanitary products because students stated they cannot afford them (57%) or because the leaders believed pupils were missing school because they could not afford them (51%). These proportions are significantly higher than those given by leaders at schools in quintile 4, quintile 3 and quintile 2 which have fewer students entitled to FSM.
4%3%
27%
38%
96%
Any other reason(spontaneous)
It's the right thing todo (spontaneous)
Believe studentshave been missing
school because theycannot afford them
Students have statedthey cannot afford
them
Students need themon emergency basis
Question: R3. Do you supply these sanitary products because…?Base: Secondary leaders at schools that provide free sanitary products (n= 306)

63
Figure 34: Sanitary products provided because students cannot afford them by FSM quintile
The provision of free sanitary products was typically funded from the school budget, with more than three-quarters (78%) of secondary school leaders offering free sanitary products citing this as a funding mechanism. One in four (26%) leaders said that the products were funded through charitable donations and about one in six (17%) said that teachers funded these sanitary products themselves.
Figure 35: How provision of sanitary products is funded
33% 34% 35% 35%
57%
16%
21%
26%22%
51%
Quintile 1(Bottom)
Quintile 2 Quintile 3 Quintile 4 Quintile 5(Top)
Students have stated they cannot afford them
Believe students have been missing schoolbecause they cannot afford them
Question: R3: Why is it that you supply these sanitary products?Base: Secondary leaders who provide sanitary products (n=306)
0-20% (n=22), 21-40% (n=69), 41-60% (n=82), 61-80% (n=72), 81-100% (n=49).
Question: R4. How does your school fund the provision of sanitary products to pupils at the school? Base: Secondary leaders (306)
use money from its budget through charitable donations
teachers fund sanitary products themselves
78% 26% 17% 5%
other funding methods

64
Teacher results
When considering secondary school teachers responses, over half (55%) said that their school provided free sanitary products, 43% said they were provided on a case-by-case basis and 6% said their school did not provide them, these results are all significantly lower than the leaders results (83%, 65% and 13% respectively). Just 15% of teachers said their school provided them on a case-by-case basis, which is similar to the leaders (18%). As mentioned above, close to two in five teachers (38%) were unsure of whether sanitary products were provided at their school and this is significantly higher than the leaders who were unsure (4%).
Figure 36: Teacher views on provision of free sanitary products to pupils at their school
As with the leaders, secondary teachers who said that their school provided free sanitary products were also asked why their school provided these products. The most common reason for providing free sanitary products, mentioned by more than 9 in 10 teachers (92%), was because students needed them on an emergency basis. In comparison close to one five (18%) said it was because pupils had stated that they cannot afford them and just over one in ten (12%) said it was because they believed that pupils were missing school because they cannot afford them. Two in ten (20%) teachers mentioned one of these two responses relating to student’s inability to afford sanitary products as at least part of the reason why their school provided the products free of charge. In terms of the spontaneously given answers, 1% of secondary school teachers said their school provided products because it was the right thing to do or that there was another reason. Teachers were significantly less likely to agree with all of the reasons for providing free
15%
40%
6%
38%
Yes - available to all Yes - case by case No Don't know
Question: R2. Are free sanitary products available to pupils in your school?Base: Secondary teachers (440)

65
sanitary products than leaders, apart from ‘it being the right thing to do’ where the difference between leader and teachers was not statistically significant.
Figure 37: Reasons teachers gave for providing free sanitary products at their school
There were no significant differences in the reasons given by gender of the teacher, region or by FSM quintile of the school.
3.4 Access to Nutritious Food Providing children access with access to nutritious, high quality food during the course of the school day has long been a key policy area for the Department for Education. The Department’s July 2016 advisory paper brought into effect revised standards for the planning and provision of food in schools.32 The paper operated as an instruction manual for school governors. It detailed a set of actions each school must implement to support pupils’ nutritional development.
While the paper addresses nutritional development during the school term, an issue of increasing importance is the inability of some pupils to access nutritious food during the
32 School food in England: Departmental advice for governing boards (July, 2016) https://assets.publishing.service.gov.uk/government/uploads/system/uploads/attachment_data/file/551813/School_food_in_England.pdf
1%1%
12%18%
92%
Any other reason(spontaneous)
It's the right thing todo (spontaneous)
Believe studentshave been missing
school because theycannot afford them
Students have statedthey cannot afford
them
Students need themon emergency basis
Question: R3. Do you supply these sanitary products because…?Base: Teachers at secondary schools that provide free sanitary products (n= 243)

66
school holidays. In 2015, food bank charities reported that they had been experiencing large increases in demand during the summer holidays for some time. Charity workers advised that for families who are reliant on the provision of free school meals during term time, it could take as little as one week without free school meals to fall into a state of ‘acute food poverty’.33 Families who use free school meals as a budgeting mechanism lose this vital means of financial support during the school holidays; a time at which there are more people to feed on a more frequent basis.34
This wave of the School Snapshot Survey examined how pervasive the lack of access to nutritional food in the school holiday is for pupils attending schools in England. School leaders and teachers were asked to what extent they agreed with the statement: “pupils having reduced access to nutritious food in the school holidays is a common issue in this school”. As illustrated in Figure 38, just over half (54%) of leaders and teachers agreed that it is a common issue in their school, compared with only one in five (20%) disagreeing.
Although the proportion of leaders and teachers feeling that pupils having reduced access to nutritious food in the school holidays is a common issue was similar, leaders were significantly more likely than teachers to agree strongly that this was the case (26% and 18% respectively).
Respondents from non-academy status schools were significantly more likely to believe reduced access to nutritious food in the school holidays is a common issue in their school than those from academy schools (57% and 50% respectively).
The results suggest that there may be regional disparity for pupils accessing nutritious food during the school holidays. In most regions the proportion agreeing it was a common issue was in the 50%-59% range. However, the figure was significantly higher in the North East (77%) and significantly lower in the East of England (41%).
33 Food bank Britain: why it only takes one week of school holidays to tip families into food poverty (March, 2015) https://www.independent.co.uk/news/uk/home-news/missing-out-on-free-school-meals-for-just-one-week-at-half-term-is-enough-to-tip-some-families-into-10096119.html 34 Food poverty in the school holidays (Gill and Sharma, 2004) http://www.barnardos.org.uk/foodpovertyreportv3.qxd.pdf

67
Figure 38: Reduced access to nutritious food in the school holidays
Predictably there was also a correlation between FSM quintile and the belief that reduced access to nutritious food was a common issue at the school (see Figure 39). As the proportion of students entitled to FSM increases (from bottom to top quintile) so does the extent to which leaders and teachers at that school agree that reduced access to nutritious food in the holiday was a common issue at their school. The differences are significant between each quintile.
18%
26%*
19%
36%*
30%
35%
26%
24%
26%
17%
16%
17%
3%
4%
3%
Strongly agree Agree Neither agree nor disagree Disagree Strongly disagreeQuestion: R5. How much do you agree or disagree with the following statement: I believe that pupils having reduced access to
nutritious food in the school holidays is a common issue in this school? Base: All leaders and teachers (n=1798); Leaders (758), Teachers (1040)
All
Leaders
Teachers
20% DISAGREE54% AGREE
20% DISAGREE56% AGREE
20% DISAGREE54% AGREE
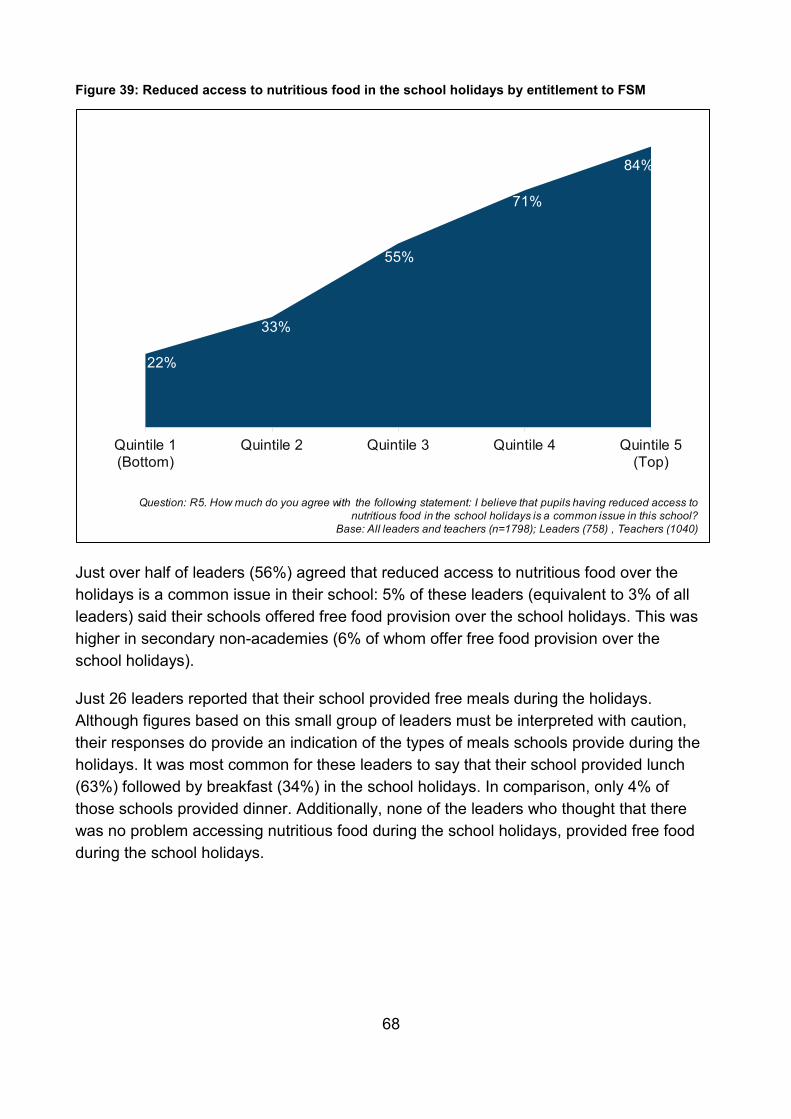
68
Figure 39: Reduced access to nutritious food in the school holidays by entitlement to FSM
Just over half of leaders (56%) agreed that reduced access to nutritious food over the holidays is a common issue in their school: 5% of these leaders (equivalent to 3% of all leaders) said their schools offered free food provision over the school holidays. This was higher in secondary non-academies (6% of whom offer free food provision over the school holidays).
Just 26 leaders reported that their school provided free meals during the holidays. Although figures based on this small group of leaders must be interpreted with caution, their responses do provide an indication of the types of meals schools provide during the holidays. It was most common for these leaders to say that their school provided lunch (63%) followed by breakfast (34%) in the school holidays. In comparison, only 4% of those schools provided dinner. Additionally, none of the leaders who thought that there was no problem accessing nutritious food during the school holidays, provided free food during the school holidays.
Question: R5. How much do you agree with the following statement: I believe that pupils having reduced access to nutritious food in the school holidays is a common issue in this school?
Base: All leaders and teachers (n=1798); Leaders (758) , Teachers (1040)
22%
33%
55%
71%
84%
Quintile 1(Bottom)
Quintile 2 Quintile 3 Quintile 4 Quintile 5(Top)

69
3.5 Special Education Needs and Disabilities (SEND) Section 20 of the Children and Families Act 2014 sets out that: ‘a child or young person has Special Educational Needs or Disability (SEND) if they have a learning difficulty or disability which calls for special educational provision to be made for him or her’.35
A child of compulsory school age or a young person has a learning difficulty or disability if he or she:
• Has a significantly greater difficulty in learning than the majority of others of the same age, or
• Has a disability which prevents or hinders him or her from making use of facilities of a kind generally provided for others of the same age in mainstream schools or mainstream post-16 institutions.
Schools have duties under the Equality Act 2010 and the Children and Families Act 2014 towards children and young people with SEND. In addition, the SEND Code of Practice provides statutory guidance in relation to SEND. Within this Code of Practice framework, schools are expected to monitor the performance and needs of pupils with SEND and to publish these as part of the schools’ performance management arrangements.
In this wave of the School Snapshot Survey, teachers responded to a series of statements about the Special Educational Needs support for pupils who have Special Educational Needs and Disabilities (SEND) identical to those asked in the May 2017 Teacher Voice Omnibus. In this wave, over nine in ten teachers who responded felt equipped to identify pupils who are making less than expected progress and who may have a SEN or a disability (93%).36 A similar proportion of teachers (92%) reported knowing when to engage the SENCO or access other forms of support for SEN pupils.
Although direct comparisons cannot be made between the two surveys due to sampling differences, it does appear that the proportion of teachers who feel confident that support put in place for SEN pupils is evidence based, that they can meet the needs of the pupils on SEN support and that there is appropriate SEN training in place for teachers may have increased since May 2017. That said, still a quarter of teachers (25%) who
35http://www.legislation.gov.uk/ukpga/2014/6/pdfs/ukpga_20140006_en.pdf 36 This compares to just 84% of teachers who responded to the equivalent statement in the May 2017 Teacher Voice Omnibus (while 4% disagreed). Also in the May 2017 Teachers Voice Omnibus; teachers responded: 87% agreed and 3% disagreed that they know when to engage the SENCO/access other support; 67% agreed and 9% disagreed that they were confident support for SEN was evidence based; 67% agreed and 10% disagreed that they can meet the needs of the pupils on SEN support; and 48% agreed and 21% disagreed that there is appropriate SEN training in place for teachers. Base: All teachers, n=1,054. Question: ‘How much do you agree or disagree with the following statements…’ https://www.gov.uk/government/publications/teacher-voice-omnibus-march-2018-survey Due to differences in sampling methodology, comparisons between the School Snapshot Survey and the Teacher Voice Omnibus should be interpreted with caution.

70
responded do not think there is appropriate training in place for all teachers in supporting SEN support pupils. This view was more commonly held by female than male teachers (27% vs. 19% respectively).
For all bar one of the statements shown in Figure 40, primary schools teachers were significantly more likely than secondary school teachers to strongly agree with each statement. Primary school teachers were not more likely to strongly agree with the statement referring to there being appropriate training in place to support pupils on SEN support. Although the figure was high among both groups, primary school teachers were significantly more likely to feel equipped to identify pupils with SEND than secondary school teachers (94% vs 91% respectively).
Figure 40: Teachers’ views on SEND
Figure 41 shows the perceived usefulness among teachers of a range of activities for improving the support given to pupils with SEND. Figures are based on all responding teachers. Clearly not all activities occur at all schools, but the balance between bars on the left of the centre line and on the right shows views on their usefulness where they are employed.
The vast majority (71%) of teachers who responded thought sharing practices between teachers or schools was useful. Between 60% and 65% thought the following activities were useful: case meetings with input from SENCO or a specialist, school led training or CPD, progress discussions with pupils’ parents and observing other lessons. In each
Question: T1. How much do you agree or disagree with the following statements…?Base: All teachers (n=1,040)
47%
48%
32%
25%
17%
46%
44%
47%
51%
42%
3%
3%
8%
11%
21%
2%
2%
3%
3%
4%
I feel equipped to identify pupils who may have a SENor a disability
I know when to engage the SENCO or access otherforms of support for SEN pupils
I am confident that support put in place for SENsupport pupils is evidence-based and enables them to
progress
I feel able to meet the needs of pupils on SEN Support
There is appropriate training in place for all teachers insupporting SEN support pupils
Strongly agree Agree Disagree Strongly disagree
DisagreeAgree

71
case relatively few teachers (usually fewer than one in ten) described each as not having been useful. However, teachers from London were signficantly more likely than teachers from other regions to think that school led training or CPD had not been useful (20% in London versus 11% average across all other regions).
Teachers were divided in how useful they perceived a teaching degree / teaching qualification to be: 42% thought it had been useful but a third (34%) thought the opposite. Similarly, for online resources and conferences (both less common activities/tools than the others listed, particularly in the case conferences) while more teachers were positive than negative, the balance of opinion was less favourable than six of the other activities (sharing practice between teachers or schools, case meetings with SENCOs or specialists, school led training or CPD, progress discussions with pupils’ parents, observing other teachers’ lessons, specific teacher training or CPD).
Figure 41: Usefulness of activities/tools used to improve support given to pupils with SEND
Apart from observing other teachers’ lessons, primary school teachers rated each of the activities as signficantly more useful than secondary school teachers.
Question: T2. How useful have the following activities been in improving the support you provide to pupils with Special Educational Needs (SEN)?
All teachers (n=1,040)
39%
35%
29%
30%
29%
23%
23%
13%
7%
32%
29%
34%
33%
32%
21%
18%
23%
12%
4%
7%
10%
8%
6%
10%
18%
12%
8%
1%
1%
2%
1%
2%
3%
16%
4%
5%
Sharing practice between teachersor schools
Case meetings with SENCOs orspecialist
School led training or CPD
Progress discussions with pupil'sparents
Observing other teachers' lessons
Specific teacher training or CPD
Teaching degree/qualification
Online resources
Conferences
Very useful Useful Not useful Not at all useful
Useful Not useful3%
Don’t know
7%
1%
6%
5%
10%
2%
9%
25%
6%
Not used in this school
4%
2%
3%
9%
13%
1%
11%
27%

72
3.6 Mental health needs In recent years, the Government has prioritised the improvement of mental health support for children and young people. The December 2017 green paper ‘Transforming children and young people’s mental health provision’37 outlined ambitious proposals to improve the support that children and young people receive including setting up mental health support teams in schools and incentivising every school and college to identify a ‘Designated Senior Lead for Mental Health’.
Results from the Winter 2017 survey found that seven in ten all state funded schools did have a designated health lead.38 In this survey wave, teachers were asked to how much they agreed with a series of statements about how their ability to support students with a mental health need. These statements were also asked in the May 2017 Teacher Voice Omnibus. Due to different sampling methodology the survey results cannot be directly compared, however it is interesting to note that the order of how much teachers agreed with each statement has not changed since May 2017.39
The majority (74%) of teachers believe they are equipped to identify behaviour that may be linked to a mental health issue and most thought they were able to provide access to within-school supports, with 69% saying they knew how to help pupils access support within their school and 63% reporting they were equipped to teach pupils with mental health needs in their class.
Accessing external, specialist support seems to have remained more difficult for teachers. In this wave, three in ten (30%) teachers did not feel they had to access specialist support if they needed for advice on pupils’ mental health, and the same proportion did not know how to help pupils with mental health issues access specialist support outside of their school or college.
Older teachers were significantly more likely than average to disagree that they feel equipped to teach children in their class who have mental health needs. About a quarter of teachers aged 55-64 (27%) and 45-54 (23%) disagreed compared to only 15% of 35-
37 https://www.gov.uk/government/consultations/transforming-children-and-young-peoples-mental-health-provision-a-green-paper 38 This is of all state schools that were eligible for the study; pupil referral units and special schools were not included in the eligible sample. For more information, see the methodology in the appendix of the Winter 2017 School Snapshot Survey. 39 In the May 2017 Teacher Voice Omnibus teachers responded: Equipped to identify behaviour (58% agree, 19% disagree); access support offered at school/college (56% agree, 23% disagree); equipped to teach children in my class (41% agree, 29% disagree); access to mental health professionals (35% agree, 41% disagree); and access specialist support outside of school/college (34% agree, 39% disagree). Base: All teachers, 943. Question: How much do you agree or disagree with the following statements…’. Due to differences in sampling methodology, comparisons between the School Snapshot Survey and the Teacher Voice Omnibus should be interpreted with caution. https://www.gov.uk/government/publications/teacher-voice-omnibus-march-2018-survey

73
44 year olds and 12% of 18-34 year olds. Consistent with this, teachers who have been teaching for more than twenty years were also significantly more likely to disagree that they feel equipped to teach children in their class who have mental health needs (23% compared to the average of 16%).
In terms of knowing how to help pupils access specialist support outside of the school or college (45% of teachers feel they know this), there is some indication that teachers at schools in the top FSM quintile (52%) and those teaching in the North East (61%) or Yorkshire and Humber (54%) are significantly more likely to agree that they know how to help pupils access external support, while those in the South East were the most likely not to know this (39% vs. the 30% average).
Figure 42: Agreement with statements about children and young people's mental health at school
Question: U1: To what extent do you agree/disagree with the following statements about children and young people's mental health at your school…?
Base: All teachers (n=1,040)
14%
17%
12%
11%
8%
59%
52%
50%
36%
37%
10%
12%
14%
22%
26%
1%
1%
2%
8%
4%
I feel equipped to identify behaviour thatmay be linked to a mental health issue
I know how to help pupils with mental healthissues access support offered by my
school/college
I feel equipped to teach children in my classwho have mental health needs
I have access to mental health professionalsif I need specialist advice on pupils' mental
health
I know how to help pupils with mental healthissues access specialist support outside of
my school/college
Strongly agree Agree Disagree Strongly disagree
Agree Disagree

74
4. Careers Strategy
4.1 Careers Education This section will explore schools’ provision of careers education to their pupils.
Every school in England is required to provide impartial careers advice to their students. As stated in the January 2018 statutory guidance for governing bodies, school leaders and school staff, every school must:40
• Ensure that there is an opportunity for a range of education and training providers to access all pupils in year 8 to year 13 for the purpose of informing them about approved technical education qualifications or apprenticeships.
• Publish a policy statement setting out their arrangements for provider access and ensure that it is followed.41
In addition, under the December 2017 Careers Strategy, every school must also implement the following between 2018 to 2020:42
• Begin using the Gatsby Benchmarks to improve careers provision now, and meet them by the end of 2020.43
• Begin to offer every young person seven encounters with employers – at least one each year from year 7 to year 13 – and meet this in full by the end of 2020.
• Appoint a named person to the role of Careers Leader to lead the careers programme at their school from September 2018.
• Publish details of their careers programme for young people and their parents from September 2018.
In the last two waves of the School Snapshot Survey, secondary school leaders were presented with a series of statements shown in Figure 43 and asked which applied to careers education at their school. There have been no significant changes in leaders’ responses between the two waves.
40 https://www.gov.uk/government/publications/careers-guidance-provision-for-young-people-in-schools 41 http://researchbriefings.files.parliament.uk/documents/CBP-7236/CBP-7236.pdf 42 https://www.gov.uk/government/publications/careers-strategy-making-the-most-of-everyones-skills-and-talents 43 See page 18 of the Careers Strategy for more detail on the Gatsby Benchmarks, https://www.gov.uk/government/publications/careers-strategy-making-the-most-of-everyones-skills-and-talents
75
The vast majority of leaders said that their school has an identified Careers Leader with responsibility for overseeing the school’s careers programme (94% in both waves). Leaders delivered careers education in a variety of ways. Nine in ten (90%) secondary school leaders said that all 14 year old pupils at their school used career paths information to inform their study options. Only slightly fewer (86%) said that all 16 year old pupils at their school have had meaningful encounters with a full range of learning providers, such as colleges, universities and apprenticeship providers.
Figure 43: Format of careers education provided in schools
For the first time, primary school leaders were asked if their school delivered careers education to pupils before the end of Year 6. Primary school leaders responded to a series of statements about careers education and then they had the opportunity to describe any other ways that they delivered careers education. Only 4% of primary school leaders said that they did not provide any careers education to their pupils. The most common approach to careers education was delivery through Personal Social Health and Economic Education (PSHE) lessons (87%) and topic work (84%). Three percent of primary school leaders spontaneously mentioned that they had university or college visits and provided career workshops.
94%
90%
86%
83%
82%
50%
46%
1%
School has a Careers Leader
All 14 year old pupils have used career pathsinformation to inform study options
All 16 year old pupils have experienced arange of learning providers
School provides individual guidance with acareers professional
School has written-down, well-resourcedcareers programme
Students considering university have visited atleast two universities
All pupils leaving school have experienced theworkplace at least once a year
None of these
Question: P1. Do the following statements apply to careers education in your school?Base: Secondary leaders n=362
Wave 1. Question F2 Base: Secondary leaders n=309
Winter 2017
94%
88%
82%
84%
76%
46%
39%
2%

76
Figure 44: Ways in which primary schools deliver careers education to pupils
87%
84%
77%
61%
13%
12%
3%
3%
2%
2%
6%
4%
As part of PSHE
Through topic work
Through enterprise activities or competitors
Through talks from employers/employees
Through careers/skills fairs
Through use of careers websites
University/college visits
Through career workshops
Through talks from parents
Through visits to workplaces
By some other means
School does not provide careers education
Question: P2. Does your school deliver careers education to pupils before the end of Year 6 in any of the following ways?Base: Primary leaders n=396
Prompted
Spontaneous

77
4.2 School statistics The careers strategy states that "we will encourage schools and colleges to publish more of their destinations information on their website, including information on those students who have progressed onto an apprenticeship”.
Secondary school leaders were asked what student destination information their school publishes on their website by responding to a list of statements shown in Figure 45. Three-quarters of leaders said that they published a link to the Government’s school performance tables. More than half (58%) said that they published the percentage of students in sustained education, employment and training the year after finishing school.
Figure 45: Publishing student destination data on school websites
London secondary school leaders were significantly less likely to say they published this information. Just over half (55%) of London based leaders said they published a link to the government tables and only two in five (39%) said they published the percentage of students in sustained education, employment or training. School leaders at schools with the lowest proportion of students eligible for free school meals were significantly more likely to publish the pupil specific destination information (56% of those in the bottom quintile compared with an average of 26% for all schools) as well as the percentage of students continuing onto apprenticeships or non-academic routes (61% vs all leader average of 44%).
74%
58%
44%
26%
5%
9%
6%
A link to the government's school performancetables website
Percentage of students in sustainededucation, employment & training the year
after finishing
Percentage of students continuing ontoappreticeships / non-academic route
More detailed / pupil specific destinationsinformation
Other information on students' destinations
Do not publish any information on students'destination
Don't know
Question: Q1. What information on students' destinations does your schools publish on its website?
Base: Secondary leaders (n=362)

78
5. Budgets
5.1 Budgetary matters Schools strive to get the best value from resources to achieve the best outcomes for all of their students. The Department for Education publishes online information, tools, training and guidance to help school leaders with their financial planning and resource management.44 The online guidance includes:
• Step by step guides for school procurement.
• Resource management checklists to help with planning of school finances and resources.
• Tools to review and benchmark school finances against schools who share similar characteristics. The tools enable leaders to assess their financial position and review their budget to identify risks.
• Guidance for reviewing staffing structures and tools to evaluate whether a specific school has the right staff to teach the planned curriculum.
• Access to external financial advice, links to school financial management training, access to peer support avenues and case study examples of effective school budgets.
The survey asked all school leaders about the actions that they found useful for getting the most out of their school budget. School leaders were presented with ten possible actions and asked, if relevant, how useful each had been. They were also given the opportunity to mention any other useful actions that they had taken.
As can be seen in Figure 46, the two actions leaders considered to be the most useful in getting the most out of their budget were reviewing how they buy goods and services and reviewing staff structures. In this wave, about nine in ten leaders said each of these actions was useful (91% and 90% respectively). These two actions were also considered to be the most useful in the May 2017 Teacher Voice Omnibus.45
44 https://www.gov.uk/government/collections/schools-financial-health-and-efficiency 45 In the May 2017 Teachers Voice Omnibus; leaders responded: 66% reviewed how they brought goods and services, 77% reviewed staff structures; 23% used DfE bench marking data; 33% brought goods/services with other schools; 43% shared resources with other schools; 15% accessed other external financial health information; 14% listed other benchmarking data; 6% accessed other DfE information on financial planning and 3% used the DfE efficiency metric. Base: All leaders, n=1017. Question: ‘Which of the following actions, if any, have you found useful in getting the most out of your budget?’ In the May 2017, leaders were not asked how useful it was to use a tool to model the costs of different curriculums. Due to differences in sampling methodology, comparisons between the School Snapshot

79
Secondary school leaders were significantly more likely to find the following actions useful than primary school leaders:
• Accessing external information and advice on financial health (55% vs 46%),
• Using other benchmarking data (62% vs 43%)
• Using tools to model different curriculums plans (77% vs 39%)
• Accessing other DfE information on financial planning (49% vs 29%)
• Using the DfE efficiency metric (32% vs 16%).
Primary school leaders were significantly more likely to find buying goods and services with other schools more useful (71% vs 55%). Furthermore, over three-quarters of leaders at academy schools (76%) said they found it useful to buy goods and services with other schools (compared with 64% of leaders from non-academy schools, which is significant at the 95% level).
Figure 46: Useful actions for getting the most out of the school budget
Survey and the Teacher Voice Omnibus should be interpreted with caution. https://www.gov.uk/government/publications/teacher-voice-omnibus-march-2018-survey
91%90%
68%66%
61%48%
46%45%
33%18%
3%2%2%4%
1%2%
Reviewing how you buy goods and services
Reviewing staff structures
Using DFE benchmarking data
Buying goods/services with other schools
Sharing resources with other schools
Accessing other external information financial health
Using other benchmarking data
Using a tool to model the costs of different curriculums
Accessing other DFE information on financial planning
Using the DFE Efficiency Metric
Engaging in income generation practices
Working with other members of a trust
Using the local authority advice(spontaneous)
Other
None of the above
Don't know
Question: R1. Which of the following actions, if any, have you found useful in getting the most out of your budget? Base: All leaders n=758; Primary (396), Secondary (362)
Prompted
Spontaneous

80
6. Appendix
Scope Special schools were excluded from the scope of the survey.
Mode of interview Mainstage fieldwork for Wave 2 of the School Snapshot Survey launched on Wednesday 9th May 2018. Following a briefing in the morning, interviewers called schools to complete the leader survey and to collect contact details for classroom teachers. If leaders were unavailable or unwilling to complete the survey over the phone, they were able to complete the survey online as an alternative.
Email invitations, inviting teachers to complete the survey online, were sent to teachers on an ongoing basis as their details were collected from school leaders. Those who did not respond to the e-mail invitation were then called and offered a telephone interview instead.
Completed interviews by mode
Teachers Leaders
Online Telephone Online Telephone
Completes 685 355 10 748
Response rate
Completed leader interviews
A sample of 1683 schools was drawn from Get Information about Schools. 758 school leader interviews were completed from this. Adjusted from Wave 1, secondary schools were oversampled because fewer interviews with leaders and teachers were obtained with secondary schools.
Completed teacher interviews
Contact details for 1,659 teachers were collected from leaders. 1,040 classroom teacher interviews were completed.

81
Completed interviews by type of leader
Job role
Frequency Proportion
Headteacher 516 68%
Assistant Headteacher 37 5%
Deputy Headteacher 170 22%
Leading Practitioner 2 <1%
Other 33 4%
Total 758 100%
Response rate by key group
Teachers Leaders
Primary Secondary Primary Secondary
Sample size 885 (collected from leaders)
774 (collected from leaders)
656 (drawn from GIAS)
1027 (drawn from GIAS)
Completes 600 440 396 362
Response rate 68% 57% 60% 35%
Response rate by academy status
Teachers Leaders
Academy Non-academy
Academy Non-academy
Sample size 545 1114 573 1110
Completes 326 714 231 527
Response rate 60% 64% 40% 47%

82
Weighting During analysis, the school-level data have been grossed up using the total number of in-scope schools to give a nationally representative figure. The findings can therefore be said to be representative of all (in scope) state-funded schools.
School type in population
Number of schools Primary (inc. middle deemed primary)
Secondary (inc. all through and middle deemed secondary)
Grand Total
Academy converter 3495 1540 5035
Academy sponsor led 1351 702 2053
Community school 6497 418 6915
Foundation school 616 227 843
Free schools 152 150 302
Studio schools 0 32 32
University technical college 0 49 49
Voluntary aided school 2848 248 3096
Voluntary controlled school 1852 34 1886
Grand Total 16811 3400 20211
The teacher-level data in the Summer 2018 sample has been weighted to make it representative of the total population of teachers and leaders in primary and secondary schools, according to the Teacher Workforce Census data. The weights applied to the Summer 2018 sample are in the table below.
Weighting of teachers in population
Number of teachers Number of leaders
Primary 1.333 0.415
Secondary 1.697 0.241

83
© IFF Research 2018
Reference: DFE-RR890
ISBN: 978-1-78105-980-7
The views expressed in this report are the authors’ and do not necessarily reflect those of the Department for Education.
Any enquiries regarding this publication should be sent to us at: [email protected] or www.education.gov.uk/contactus
This document is available for download at www.gov.uk/government/publications