Embed Size (px)
Citation preview
The science potential of atmospheric Cherenkov arrays used as intensity interferometers
Willem-Jan de [email protected]
Michael Daniel for

H.E.S.S.
VERITAS
Atmospheric Cherenkov Telescope Arrays● Multiple telescopes image the source of optical Cherenkov light created by charged secondary particles (“the shower”) from an incoming gamma-ray.● The faint Cherenkov light requires large light collectors.● The brief (~nanosecond) Cherenkov flash requires fast photon detectors.● Shower image reconstruction gives spectral and angular information on the incoming gamma-ray, hence many telescopes covering long baselines.
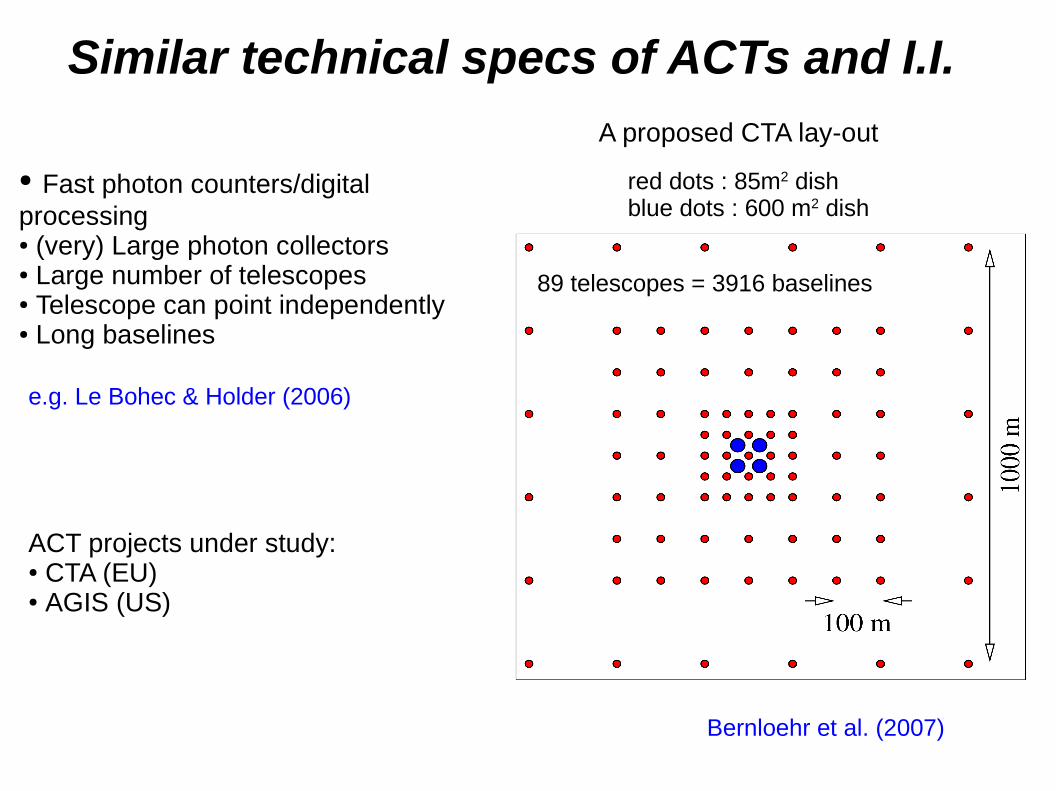
Similar technical specs of ACTs and I.I.
● Fast photon counters/digital processing● (very) Large photon collectors● Large number of telescopes ● Telescope can point independently● Long baselines
e.g. Le Bohec & Holder (2006)
Bernloehr et al. (2007)
red dots : 85m2 dishblue dots : 600 m2 dish
A proposed CTA lay-out
ACT projects under study:● CTA (EU)● AGIS (US)
89 telescopes = 3916 baselines

What do stellar astronomers want?
(apart from some fun)
The accurate determination of the physical properties of stars,
i.e. mass, radius, luminosity and elemental abundances ... and everything that either is ex- or accreted from/onto the
star.
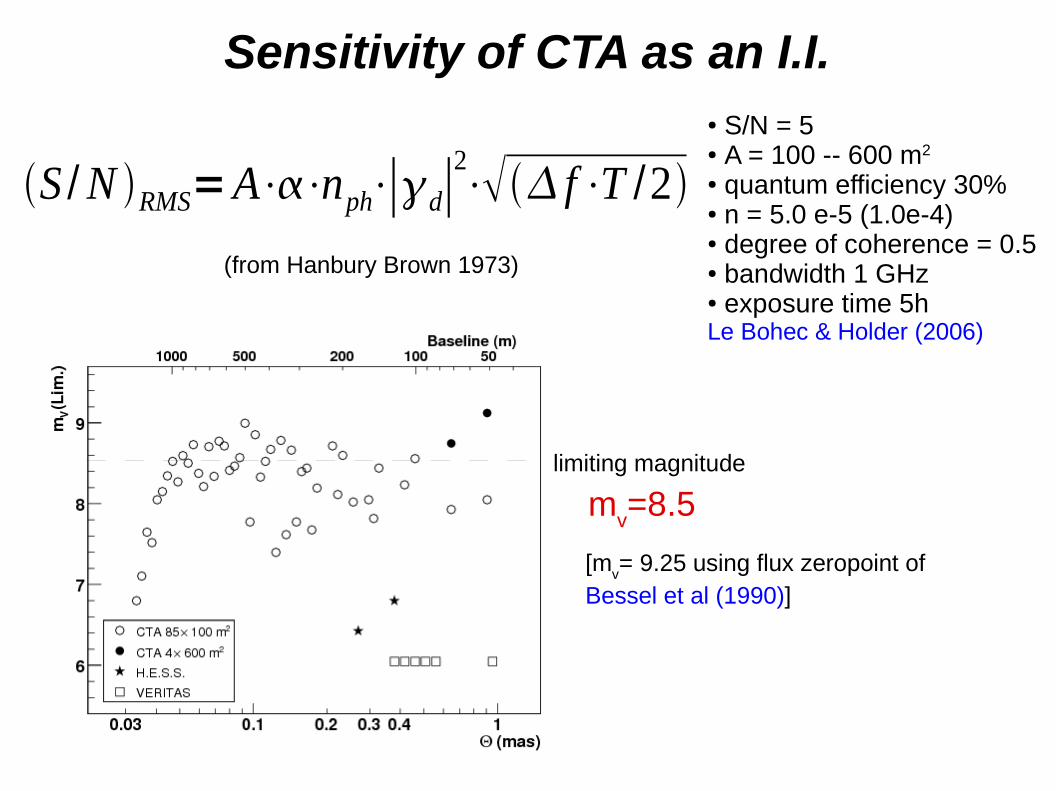
limiting magnitude
Sensitivity of CTA as an I.I.
(from Hanbury Brown 1973)
mv=8.5
S /N RMS=A⋅⋅nph⋅∣d∣2⋅ f⋅T /2
● S/N = 5● A = 100 -- 600 m2
● quantum efficiency 30%● n = 5.0 e-5 (1.0e-4)● degree of coherence = 0.5● bandwidth 1 GHz● exposure time 5hLe Bohec & Holder (2006)
[mv= 9.25 using flux zeropoint of
Bessel et al (1990)]
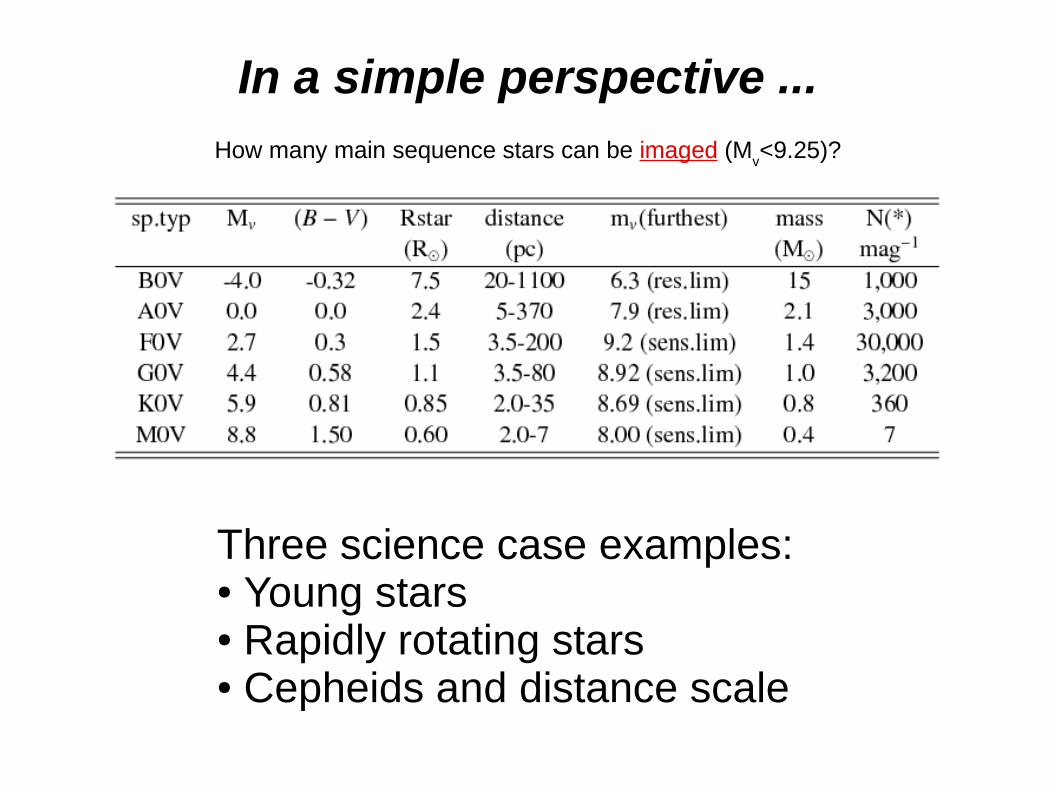
In a simple perspective ...How many main sequence stars can be imaged (M
v<9.25)?
Three science case examples: ● Young stars● Rapidly rotating stars● Cepheids and distance scale
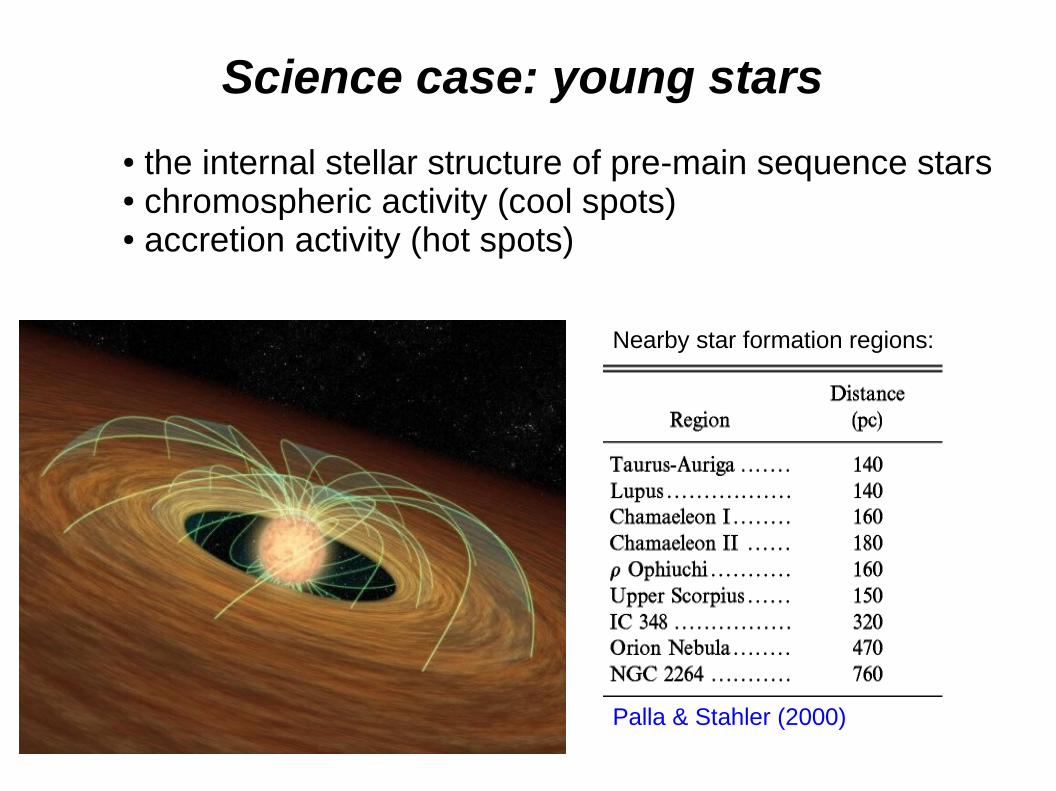
Science case: young stars
● the internal stellar structure of pre-main sequence stars● chromospheric activity (cool spots)● accretion activity (hot spots)
Palla & Stahler (2000)
Nearby star formation regions:
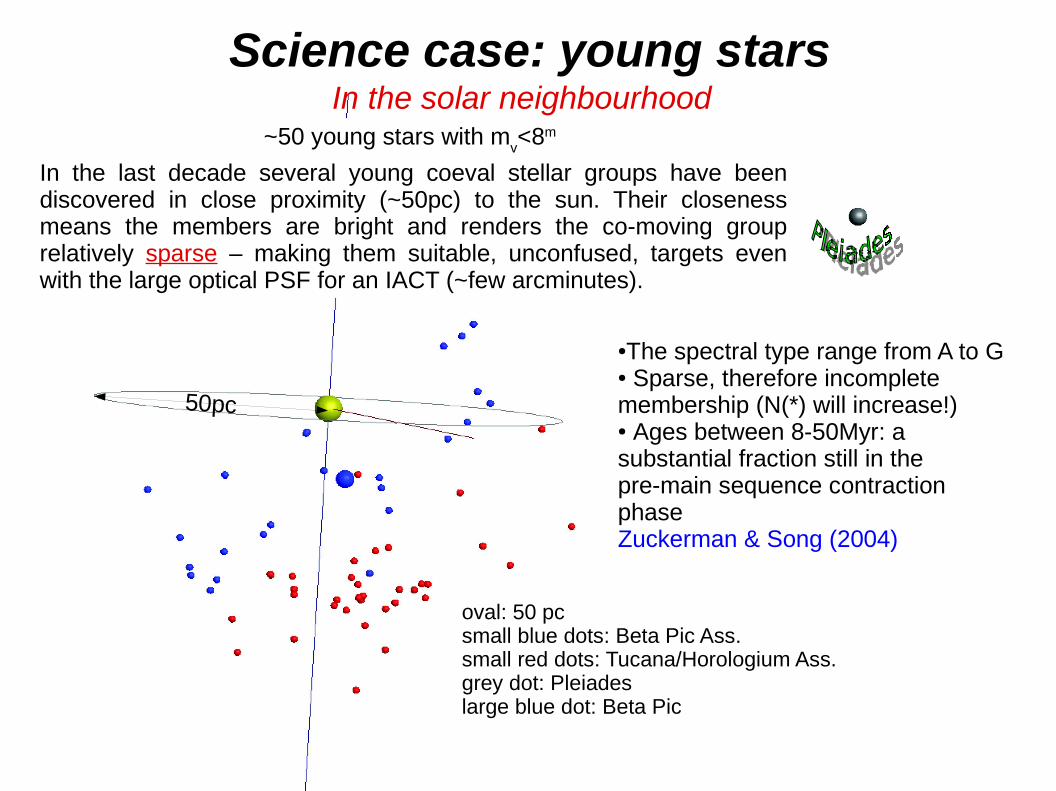
oval: 50 pcsmall blue dots: Beta Pic Ass.small red dots: Tucana/Horologium Ass.grey dot: Pleiadeslarge blue dot: Beta Pic
50pc
~50 young stars with mv<8m
In the last decade several young coeval stellar groups have been discovered in close proximity (~50pc) to the sun. Their closeness means the members are bright and renders the co-moving group relatively sparse – making them suitable, unconfused, targets even with the large optical PSF for an IACT (~few arcminutes).
●The spectral type range from A to G● Sparse, therefore incompletemembership (N(*) will increase!)● Ages between 8-50Myr: a substantial fraction still in thepre-main sequence contraction phase Zuckerman & Song (2004)
Science case: young starsIn the solar neighbourhood
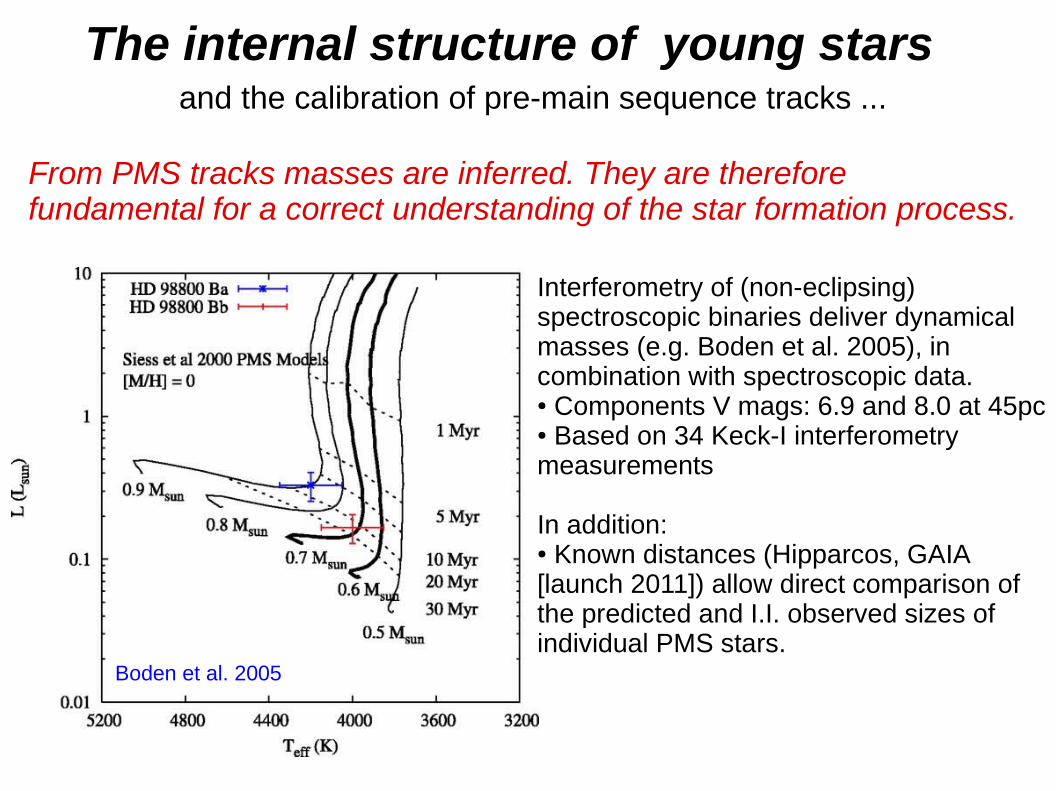
Boden et al. 2005
The internal structure of young starsand the calibration of pre-main sequence tracks ...
Interferometry of (non-eclipsing) spectroscopic binaries deliver dynamical masses (e.g. Boden et al. 2005), in combination with spectroscopic data. ● Components V mags: 6.9 and 8.0 at 45pc● Based on 34 Keck-I interferometry measurements
In addition:● Known distances (Hipparcos, GAIA [launch 2011]) allow direct comparison of the predicted and I.I. observed sizes of individual PMS stars.
From PMS tracks masses are inferred. They are therefore fundamental for a correct understanding of the star formation process.
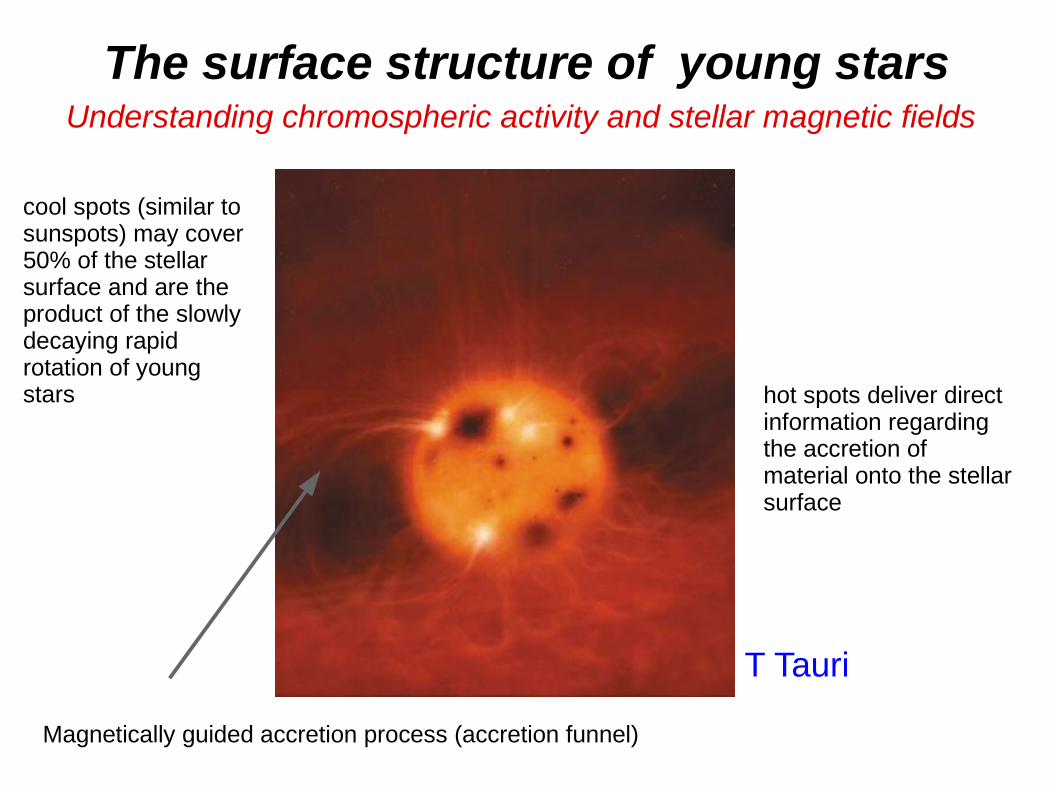
hot spots deliver direct information regarding the accretion of material onto the stellar surface
cool spots (similar to sunspots) may cover 50% of the stellar surface and are the product of the slowly decaying rapid rotation of young stars
The surface structure of young stars
Magnetically guided accretion process (accretion funnel)
T Tauri
Understanding chromospheric activity and stellar magnetic fields

The surface structure of young stars
Doppler images of PW And
Strassmeier & Rice (2006)
● 20Myr, K2V T Tauri star @ 40pc● Magnitude in V-Band 8.7● Cool spots are 1200K cooler thanstellar photosphere ● Cool spots may cover ~50% of surface● > 65 stars have been doppler imaged (Strassmeier 2002)
Understanding chromospheric activity and stellar magnetic fields
Inferred brightness distribution from Doppler imaging
The surface structure of young stars
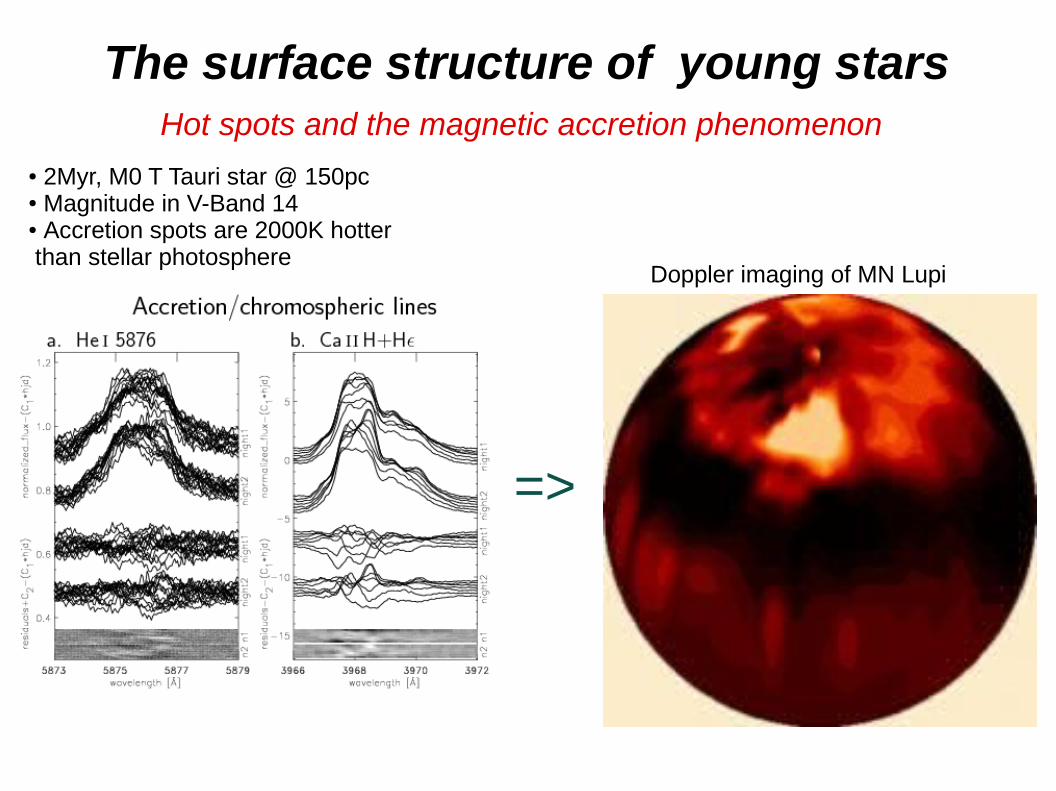
● 2Myr, M0 T Tauri star @ 150pc● Magnitude in V-Band 14● Accretion spots are 2000K hotter than stellar photosphere
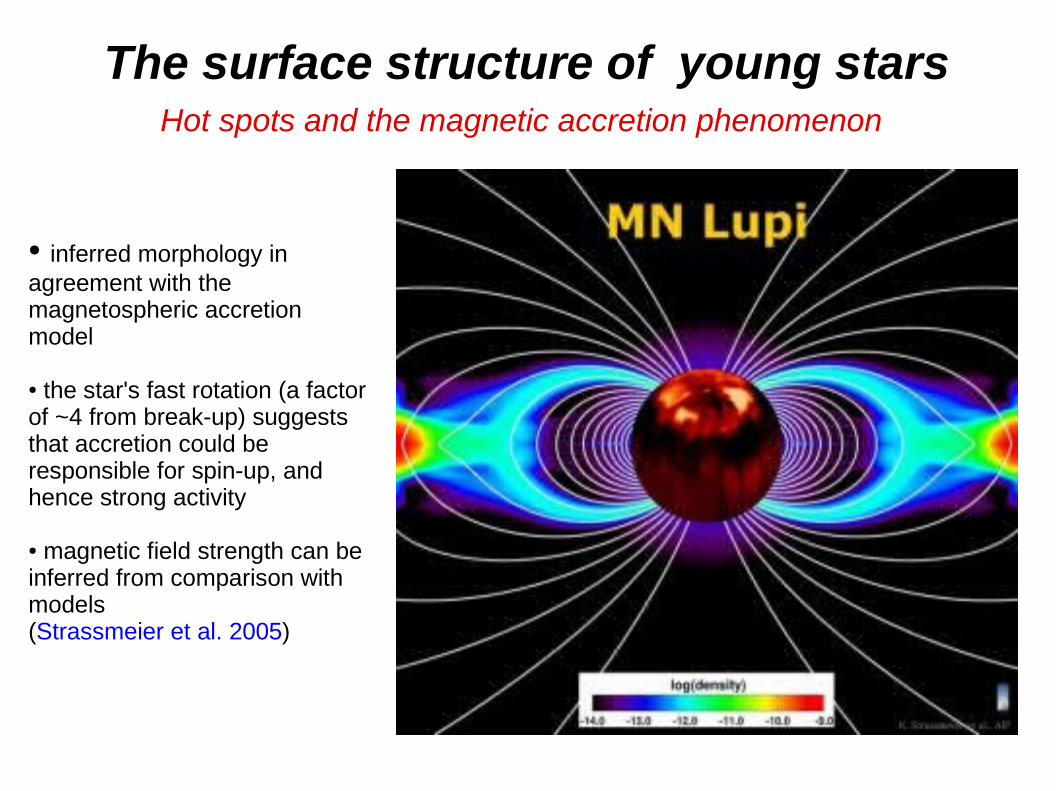
Hot spots and the magnetic accretion phenomenon
Doppler imaging of MN Lupi
=>
The surface structure of young stars
● inferred morphology in agreement with the magnetospheric accretion model
● the star's fast rotation (a factor of ~4 from break-up) suggests that accretion could be responsible for spin-up, andhence strong activity
● magnetic field strength can be inferred from comparison with models(Strassmeier et al. 2005)
Hot spots and the magnetic accretion phenomenon

Angular size estimate from I.I. and the Cepheid radius estimate from Baade-Wesselink method
R1
R2
T1
T2
The radius of the cepheid can be determined from
the observed radial velocities.
dRdT
=v t
high resolution spectroscopy
Science case: distance scaleThe zero-point of the Cepheid period-Luminosity relation
Baade-Wesselink method:
1. ∑(vspectro
*∆t) = R2-R
1
2. L1/L
2 = R
1/R
2

D θ
Angular size measurement (θ) from intensity interferometry
Comparison of angular size and Baade-Wesselink determined sizegives the distance to the Cepheid
Science case: distance scaleThe sizes of Cepheids
Davis et al. 2008 using Sydney University Stellar interferometer (1 Cepheid)Lane et al. 2000/2002 with the Palomar testbed interferometer (2 Cepheids)Kervella et al. 2004 with the Very Large Telescope Interferometer (7 Cepheids)
~60 cepheid variables with mv<8m
+

Classical Be stars are well-known for the presence of a circumstellar gaseous disk (the “e” in Be-type stars). The disk is formed in a mass-loss process from the star, and comes and goes (timescale of months to decades). It is bright in the NIR (Brehmsstrahlung).
Science case: rapidly rotating starsExtremely distorted stars near (at?) break-up velocity
ζ Tauri in Hα at MkIII optical interferometer (2 telescopes)
Quirrenbach et al. (1994)
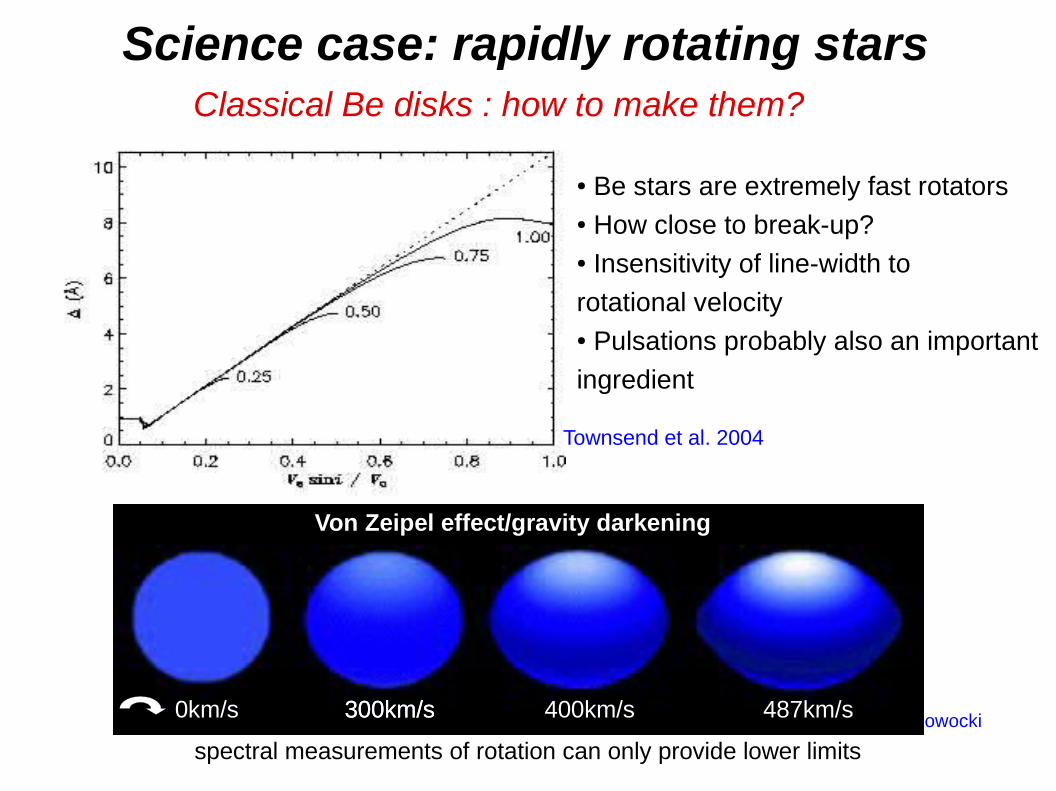
Townsend et al. 2004
● Be stars are extremely fast rotators ● How close to break-up?● Insensitivity of line-width to
rotational velocity● Pulsations probably also an important
ingredient
Classical Be disks : how to make them?
Science case: rapidly rotating stars
Von Zeipel effect/gravity darkening
0km/s 300km/s 400km/s300km/s 487km/s owocki
spectral measurements of rotation can only provide lower limits
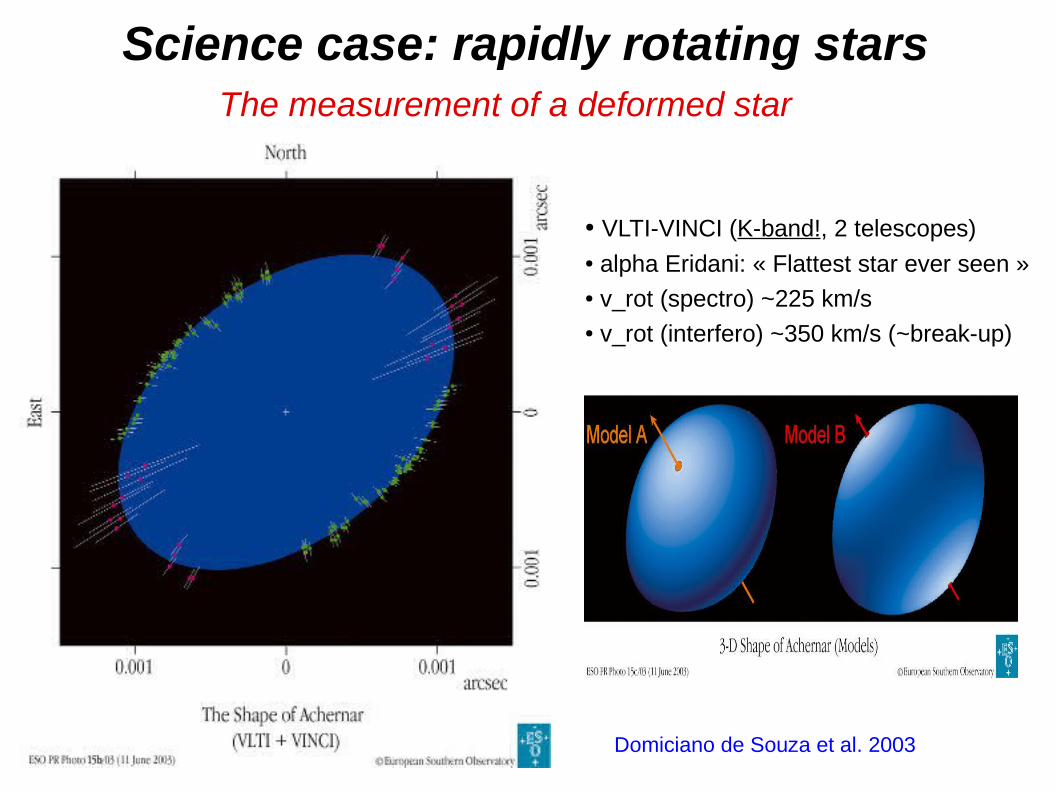
Domiciano de Souza et al. 2003
Science case: rapidly rotating stars
● VLTI-VINCI (K-band!, 2 telescopes)● alpha Eridani: « Flattest star ever seen » ● v_rot (spectro) ~225 km/s● v_rot (interfero) ~350 km/s (~break-up)
The measurement of a deformed star
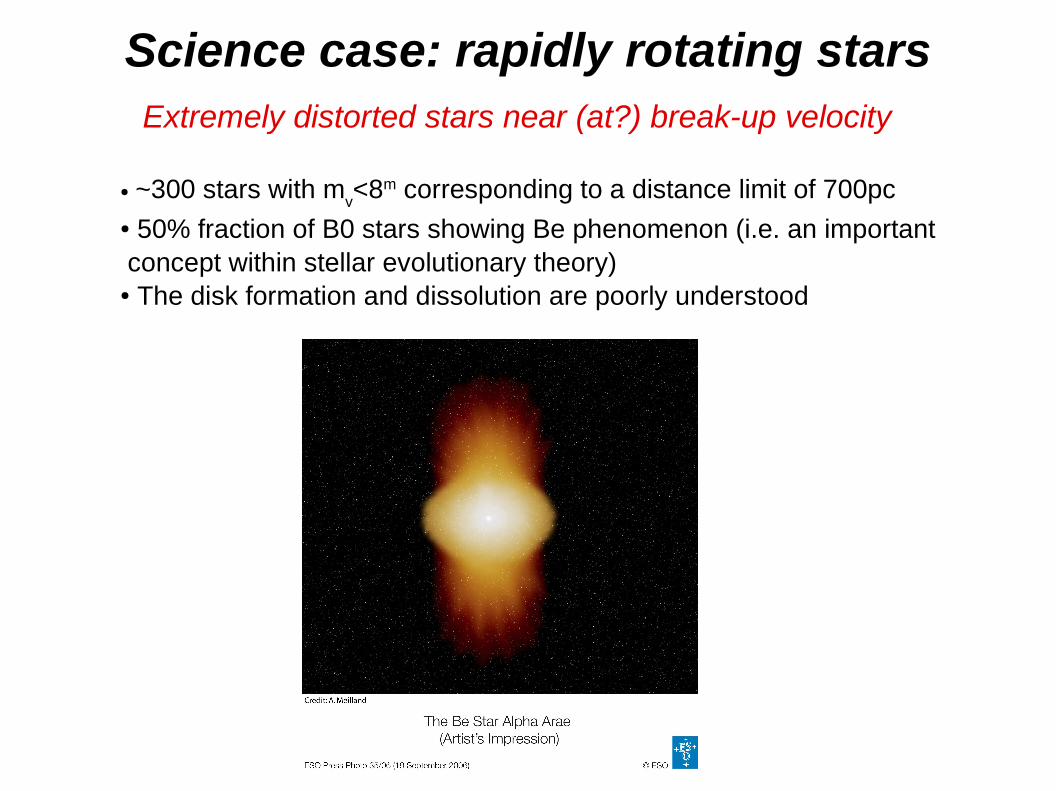
● ~300 stars with mv<8m corresponding to a distance limit of 700pc
● 50% fraction of B0 stars showing Be phenomenon (i.e. an important concept within stellar evolutionary theory)● The disk formation and dissolution are poorly understood
Science case: rapidly rotating starsExtremely distorted stars near (at?) break-up velocity
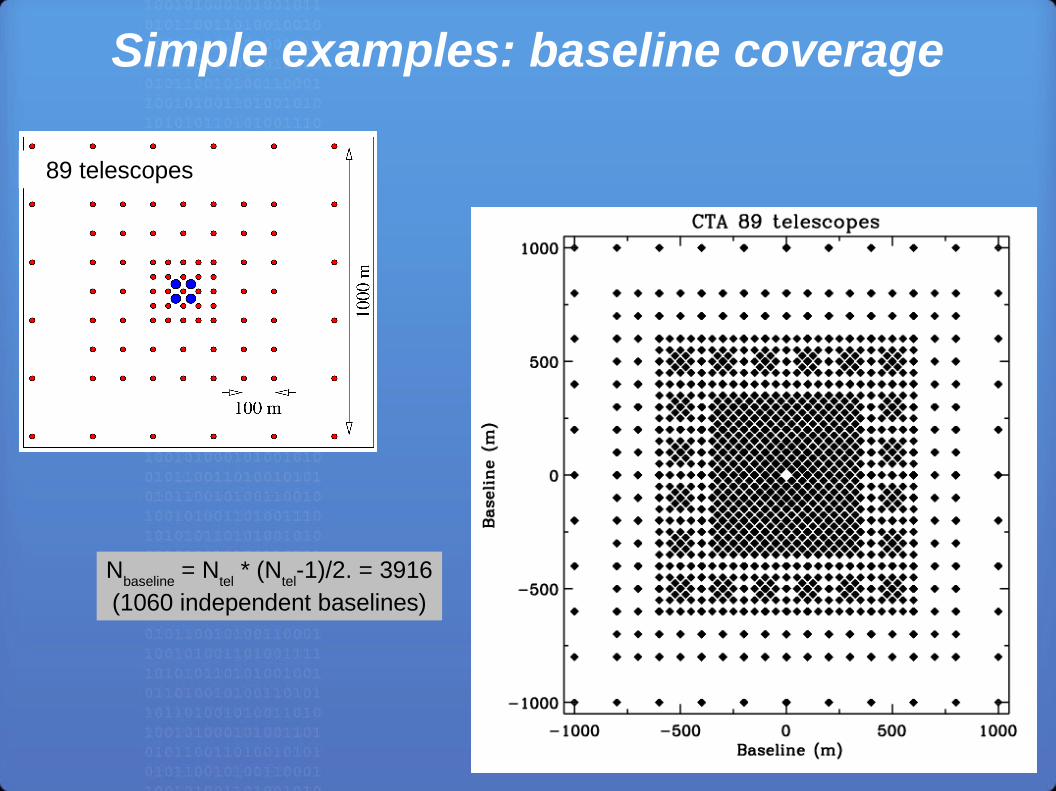
Simple examples: baseline coverage
Nbaseline
= Ntel
* (Ntel
-1)/2. = 3916(1060 independent baselines)
89 telescopes
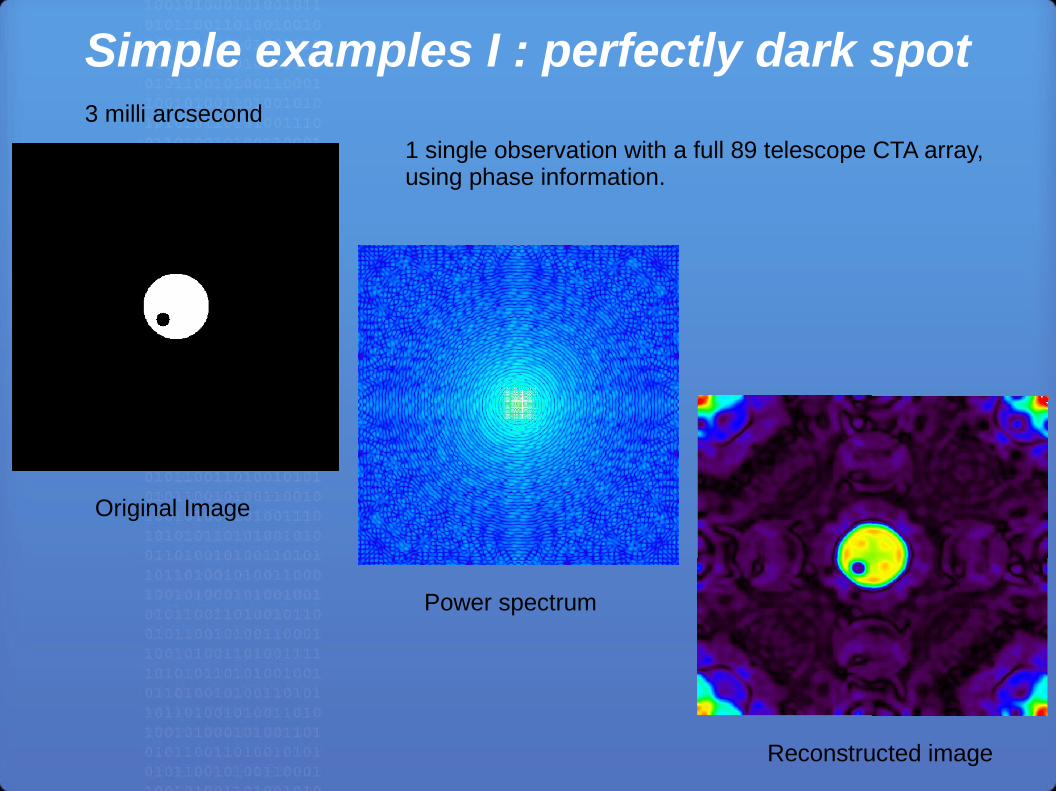
Simple examples I : perfectly dark spot
Original Image
Power spectrum
Reconstructed image
3 milli arcsecond
1 single observation with a full 89 telescope CTA array,using phase information.
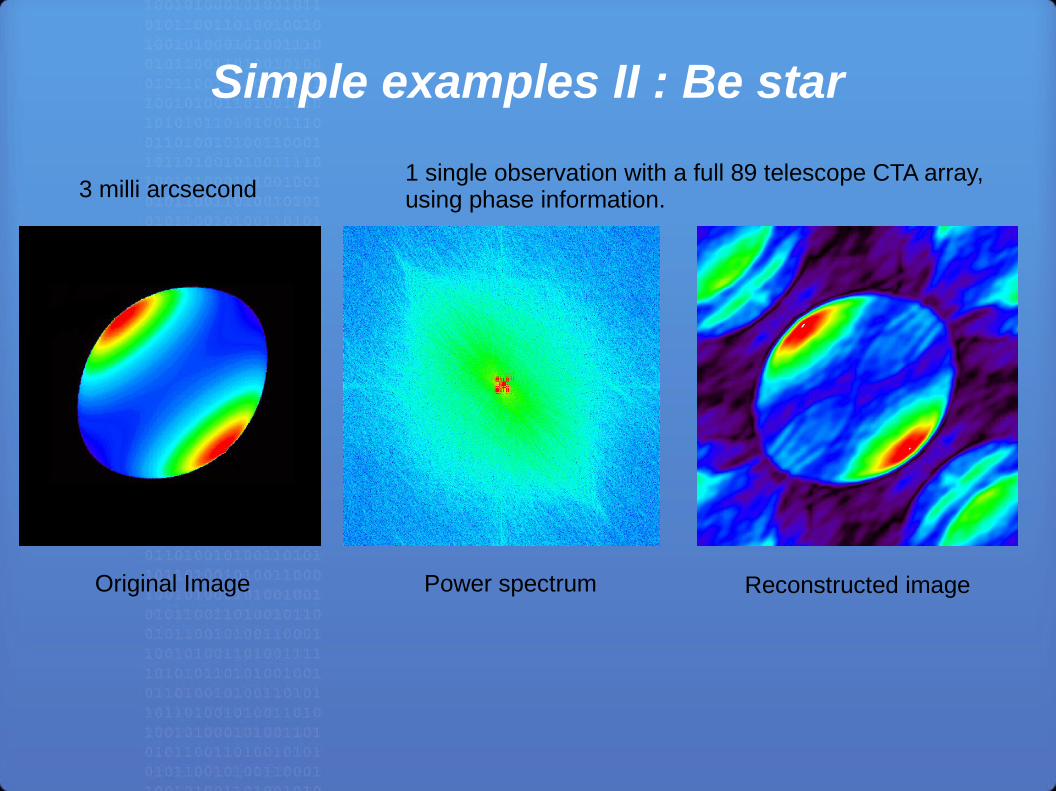
Original Image Power spectrum Reconstructed image
3 milli arcsecond
Simple examples II : Be star
1 single observation with a full 89 telescope CTA array,using phase information.

Simple examples III : T Tauri
Original Image Power spectrum Reconstructed image
3 milli arcsecond1 single observation with a full 89 telescope CTA array,using phase information.
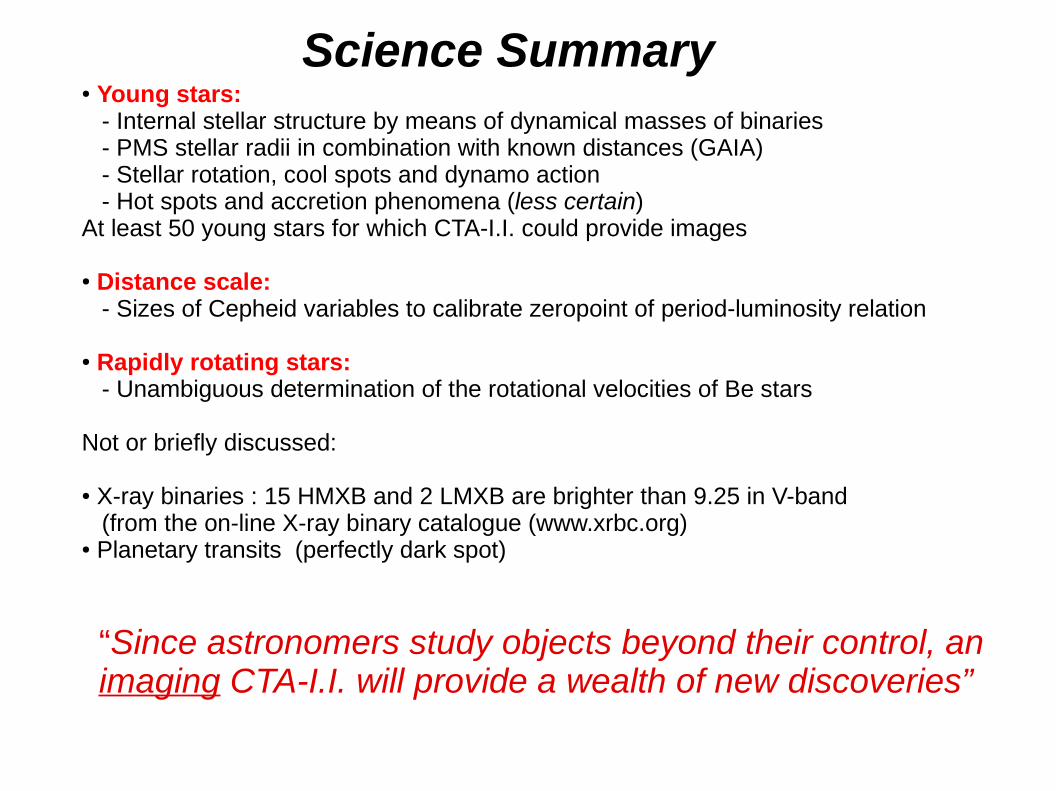
Science Summary● Young stars: - Internal stellar structure by means of dynamical masses of binaries - PMS stellar radii in combination with known distances (GAIA) - Stellar rotation, cool spots and dynamo action - Hot spots and accretion phenomena (less certain)At least 50 young stars for which CTA-I.I. could provide images
● Distance scale: - Sizes of Cepheid variables to calibrate zeropoint of period-luminosity relation
● Rapidly rotating stars: - Unambiguous determination of the rotational velocities of Be stars
Not or briefly discussed:
● X-ray binaries : 15 HMXB and 2 LMXB are brighter than 9.25 in V-band (from the on-line X-ray binary catalogue (www.xrbc.org)● Planetary transits (perfectly dark spot)
“Since astronomers study objects beyond their control, animaging CTA-I.I. will provide a wealth of new discoveries”
Further reading
The potential for intensity interferometry with γ-ray telescope arraysde Wit et al. arXiv:0710.0190
Towards μ-arcsecond spatial resolution with Air Cherenkov Telescope arrays as optical intensity interferometers
de Wit et al. arXiv:0811.2377

fin?