Embed Size (px)
Citation preview
The Scientific Basis for Protecting Wetland Buffers
Robert Buchsbaum Massachusetts
Audubon Society
Scott JacksonUniversity of Massachusetts
Wetland Functions Affected by Buffers
• Pollution prevention– Surface– Groundwater
• Storm damage prevention
• Fish and shellfish habitat
• Wildlife habitat
• Aesthetic and scenic values
Selected Definitions of Vegetated Buffers
• Transitional area between two different land uses where one mitigates the impact from the other.
• Zones of undeveloped vegetated land along a water body that trap pollutants.
• Riparian zone: The interface between terrestrial and aquatic ecosystems. Encompasses sharp gradients
From Desbonnet et al. 1994 and Gregory et al. 1991
Buffers are particularly important for protecting Critical Areas
• Drinking water supplies
• ACEC’s
• Wildlife refuges
• Rare plant/ animal habitats
• Regionally significant ecological communities
• Shellfish beds
Pollution Prevention
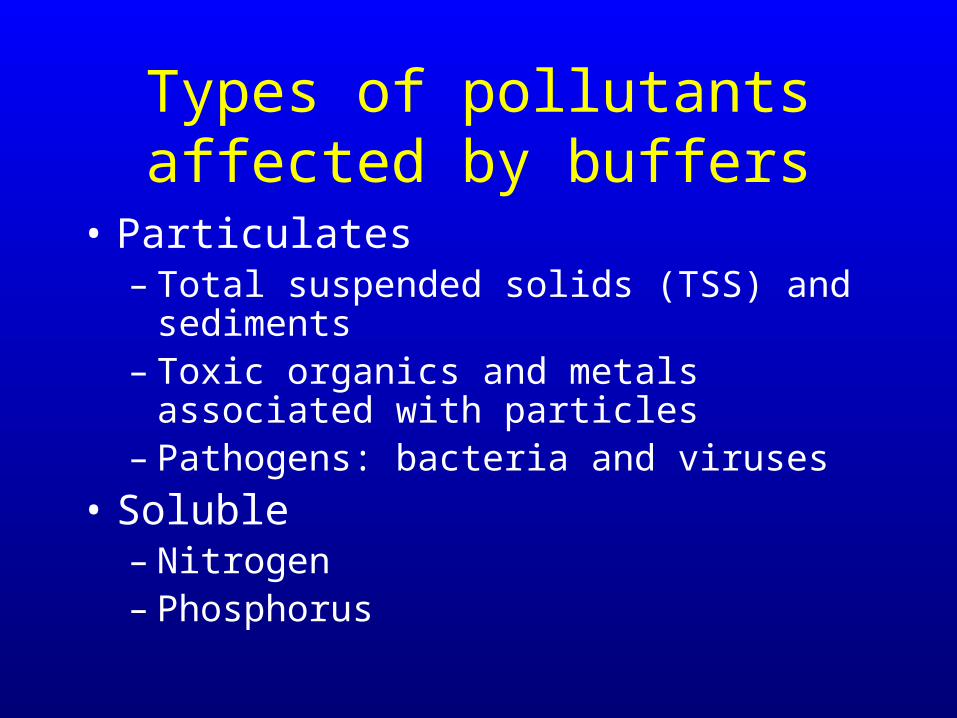
Types of pollutants affected by buffers
• Particulates– Total suspended solids (TSS) and sediments– Toxic organics and metals associated with
particles– Pathogens: bacteria and viruses
• Soluble– Nitrogen– Phosphorus
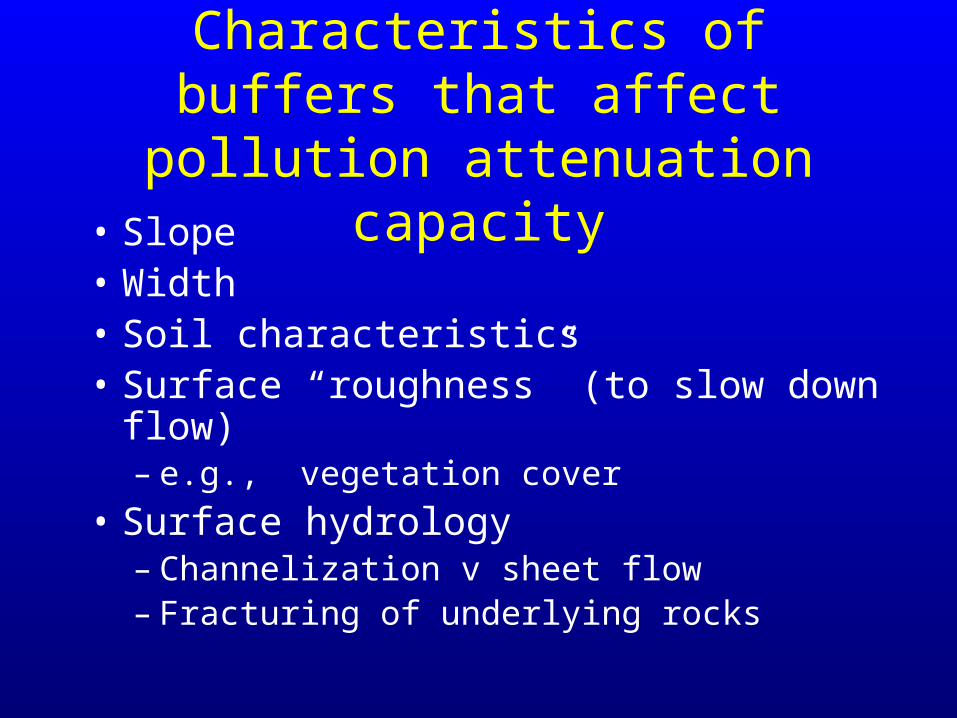
Characteristics of buffers that affect pollution attenuation capacity
• Slope• Width• Soil characteristics• Surface “roughness” (to slow down flow)
– e.g., vegetation cover
• Surface hydrology– Channelization v sheet flow– Fracturing of underlying rocks
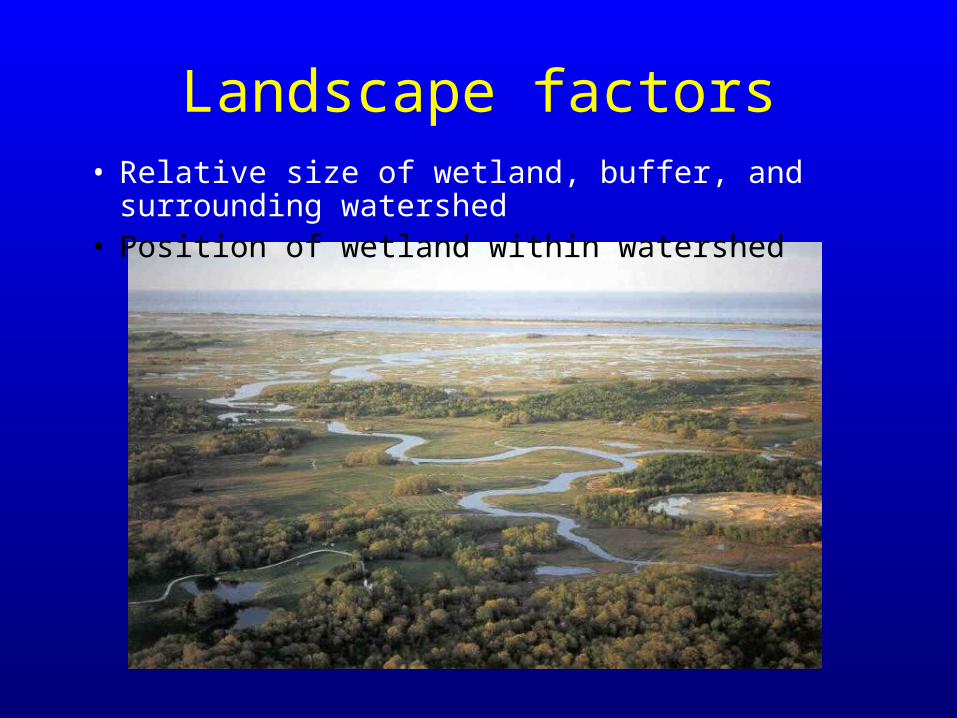
Landscape factors• Relative size of wetland, buffer, and surrounding
watershed• Position of wetland within watershed
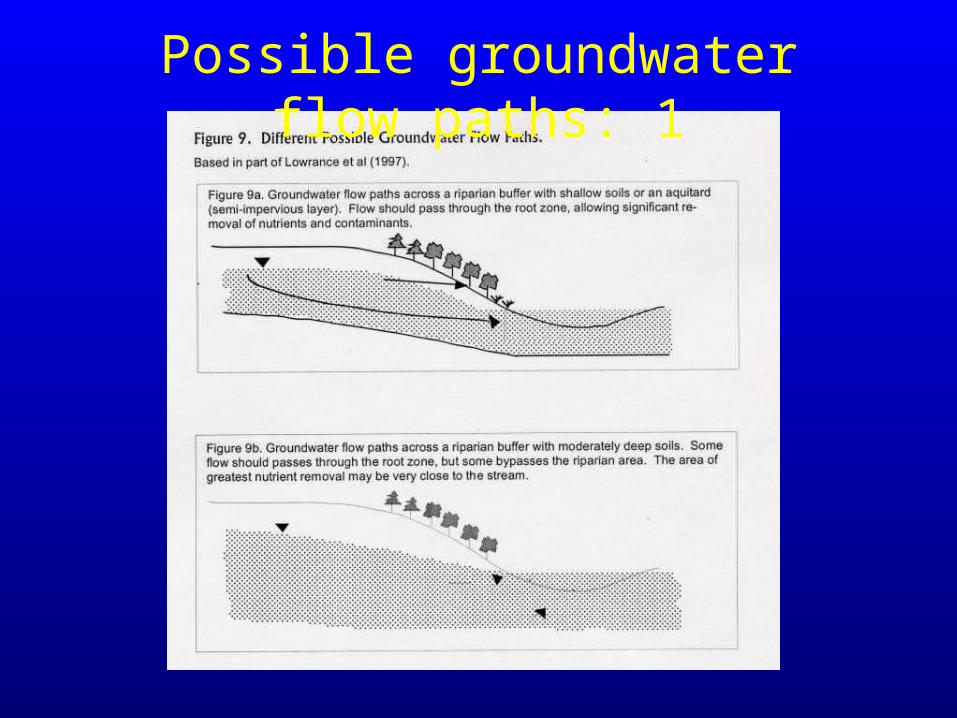
Possible groundwater flow paths: 1
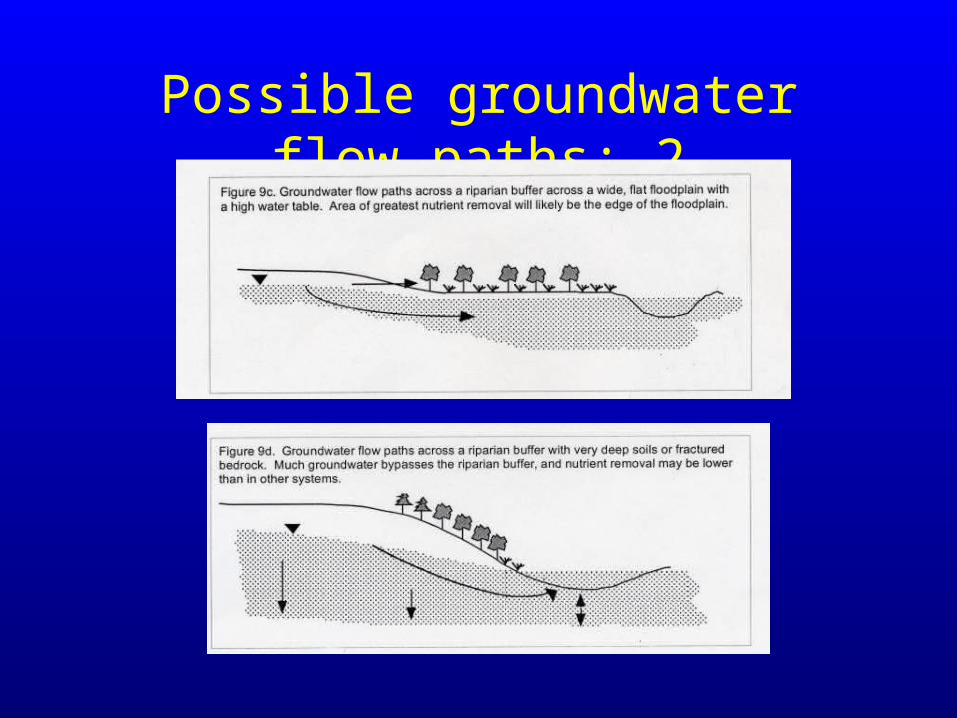
Possible groundwater flow paths: 2
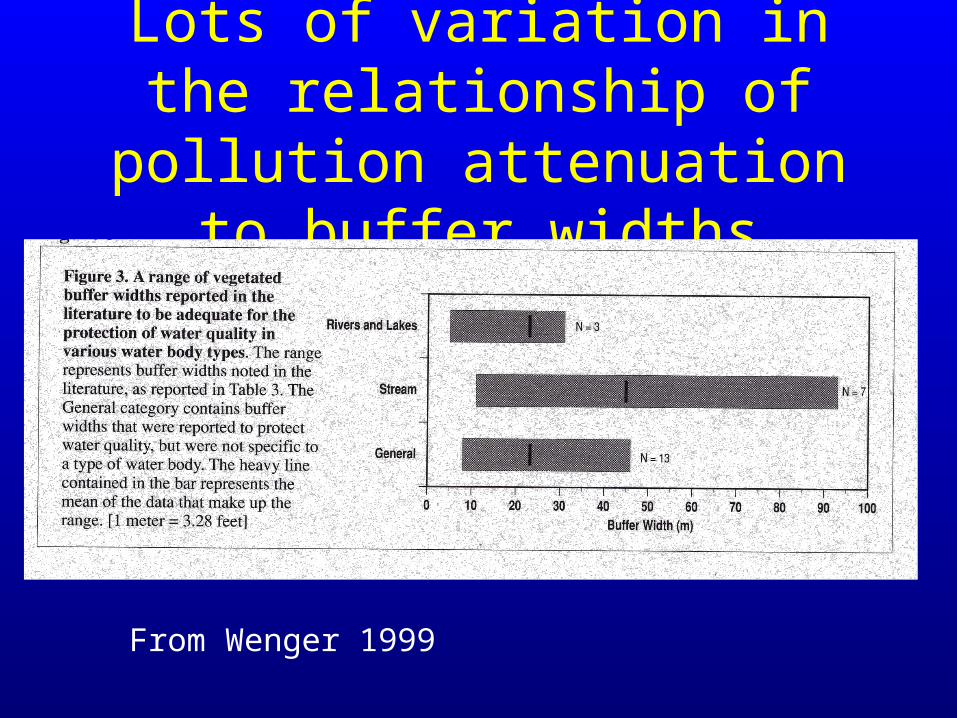
Lots of variation in the relationship of pollution
attenuation to buffer widths
From Wenger 1999
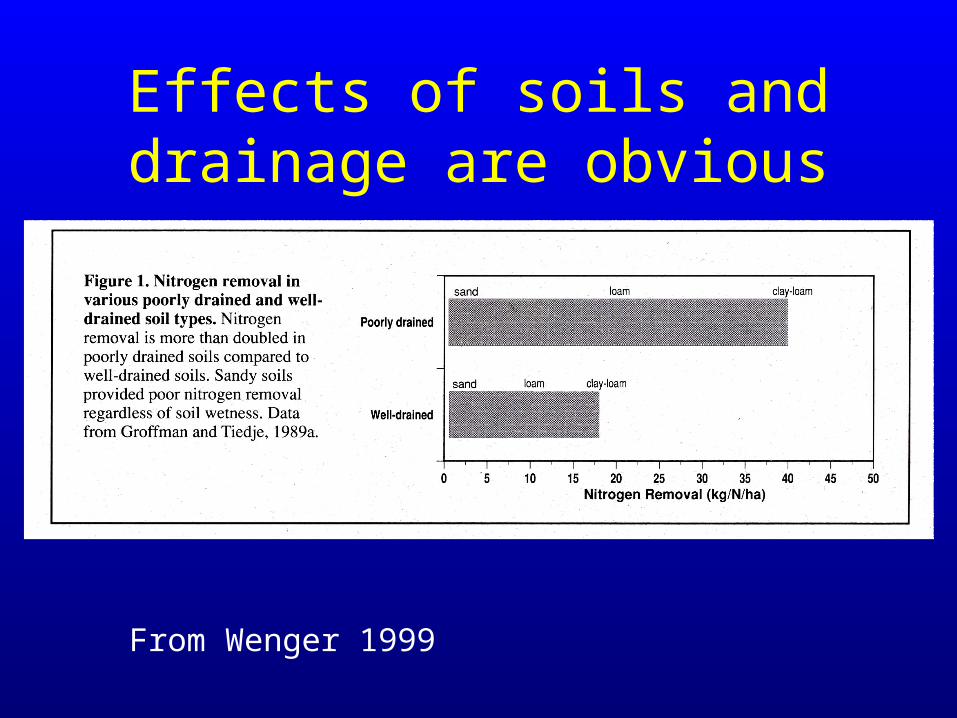
Effects of soils and drainage are obvious
From Wenger 1999
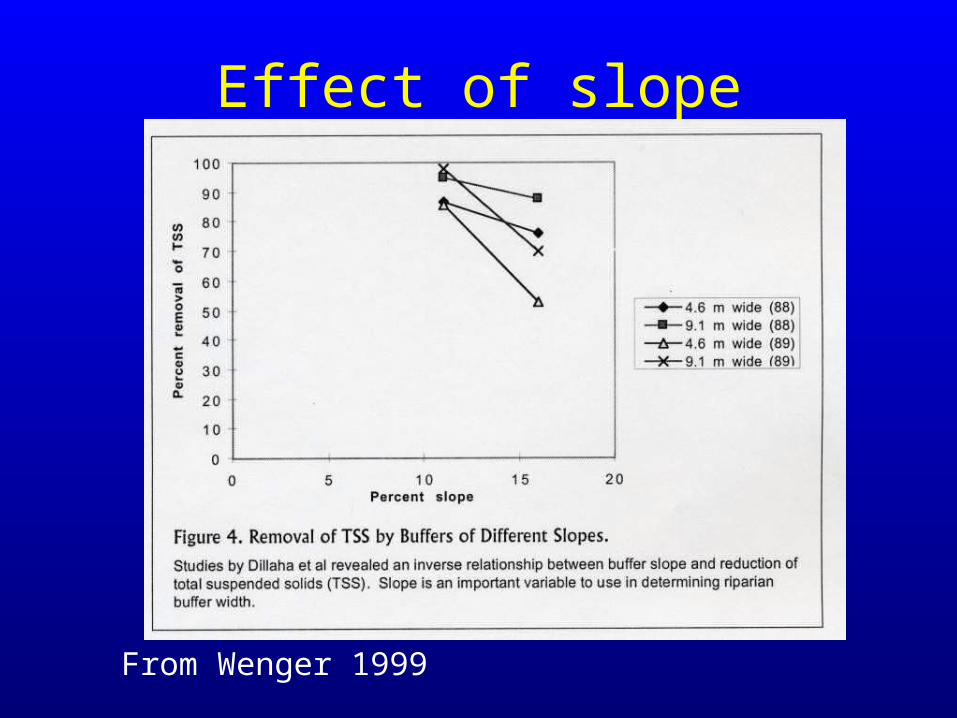
Effect of slope
From Wenger 1999
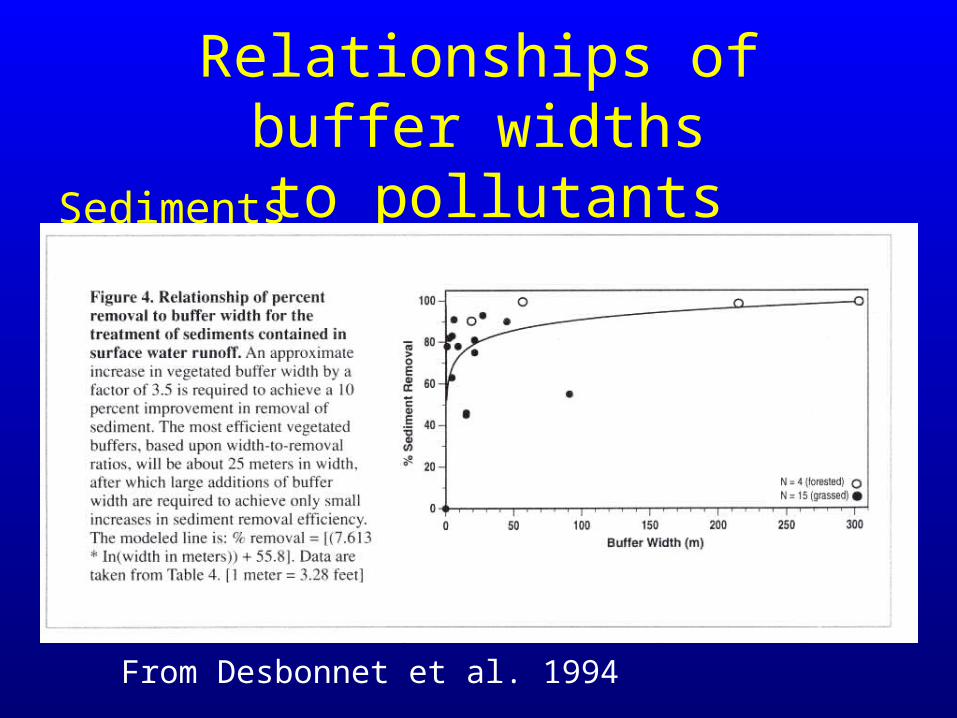
Relationships of buffer widths to pollutants
Sediments
From Desbonnet et al. 1994
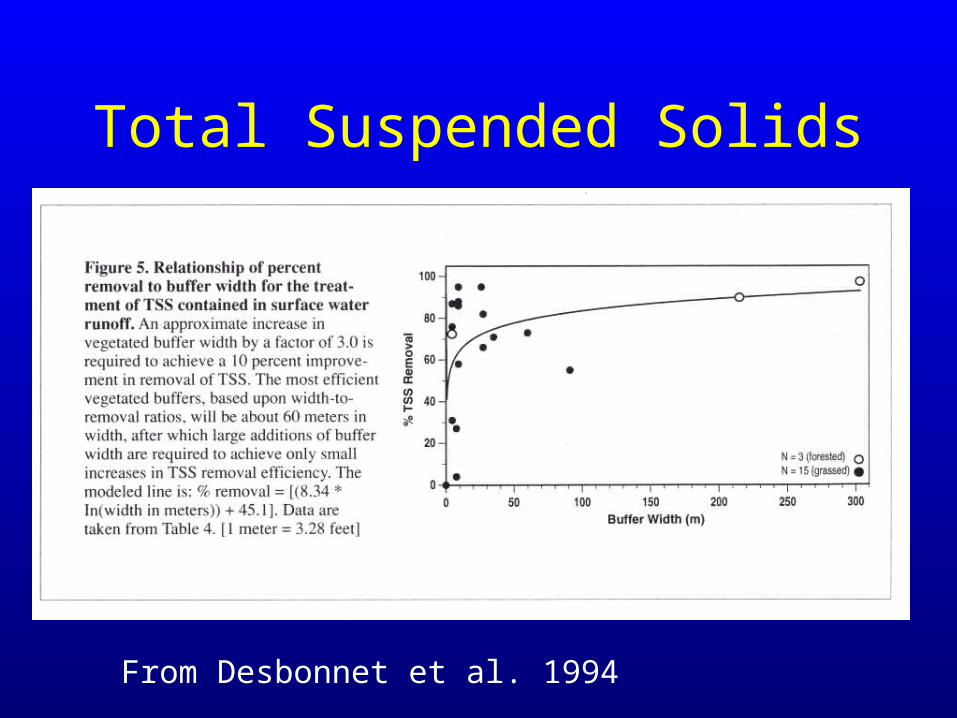
Total Suspended Solids
From Desbonnet et al. 1994
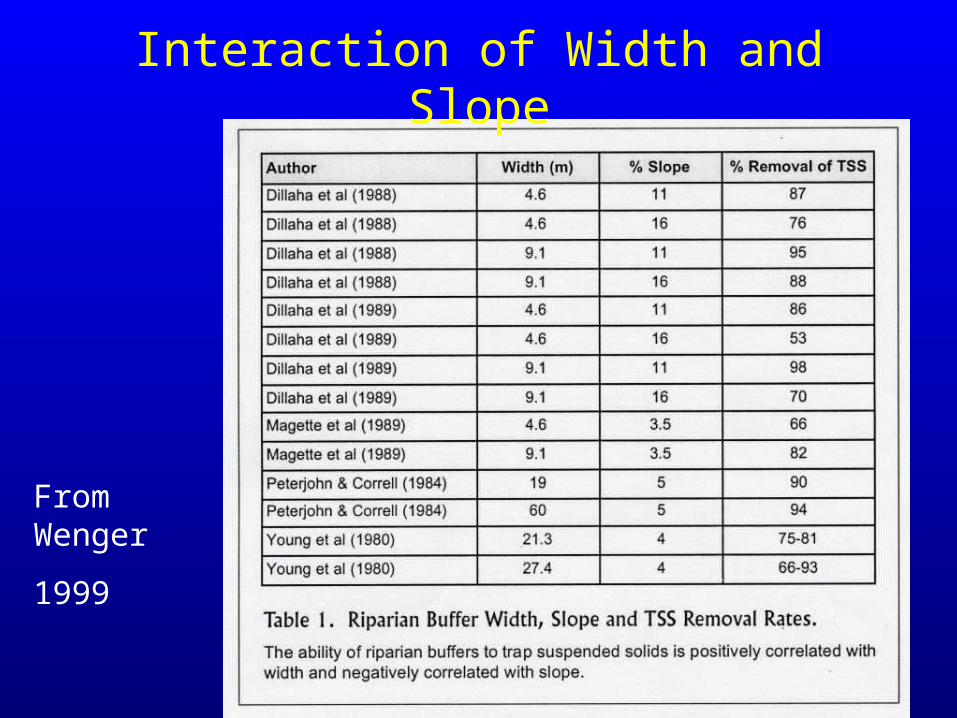
From Wenger
1999
Interaction of Width and Slope
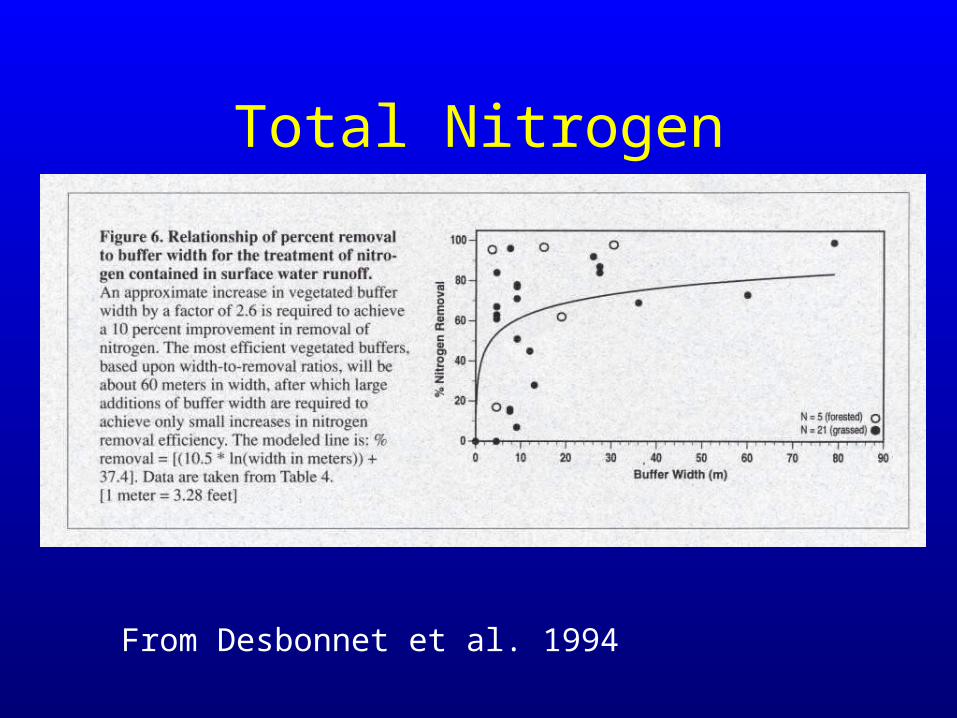
Total Nitrogen
From Desbonnet et al. 1994
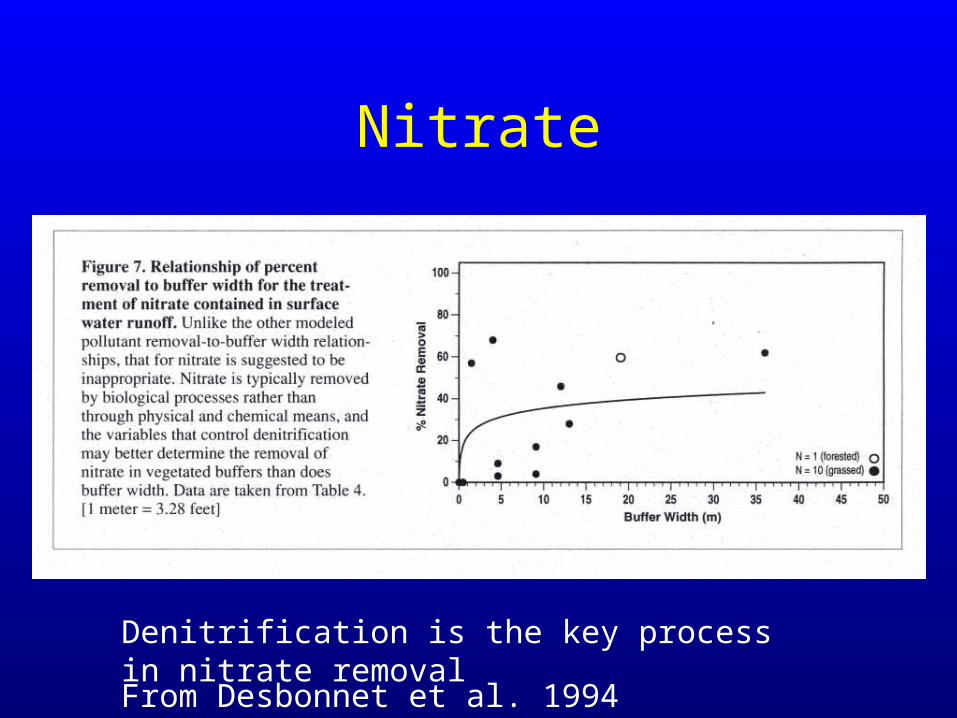
Nitrate
Denitrification is the key process in nitrate removal
From Desbonnet et al. 1994
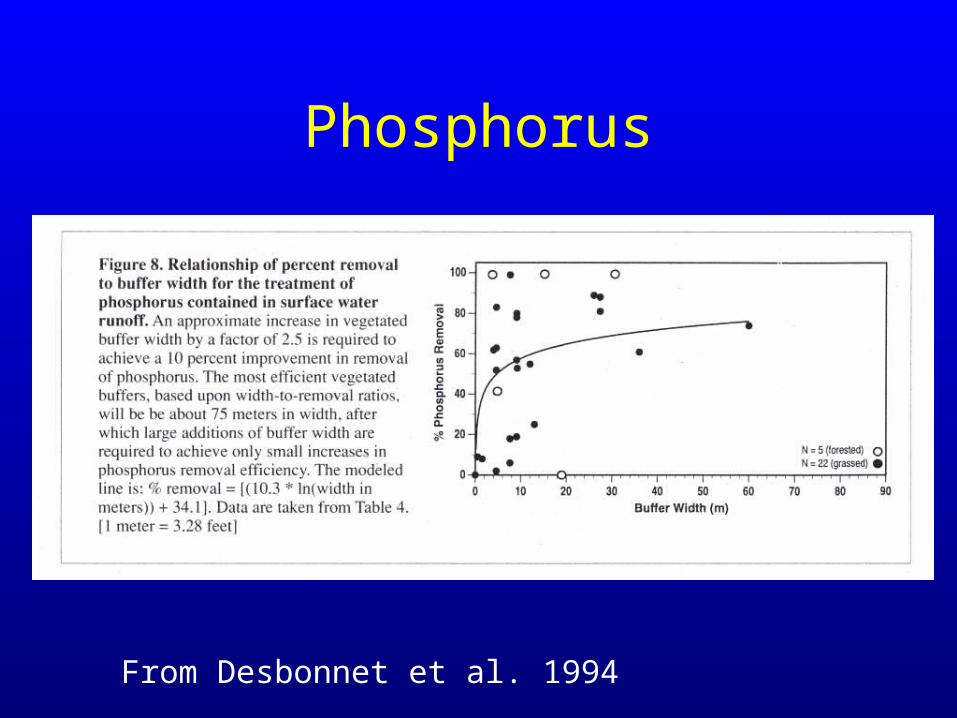
Phosphorus
From Desbonnet et al. 1994
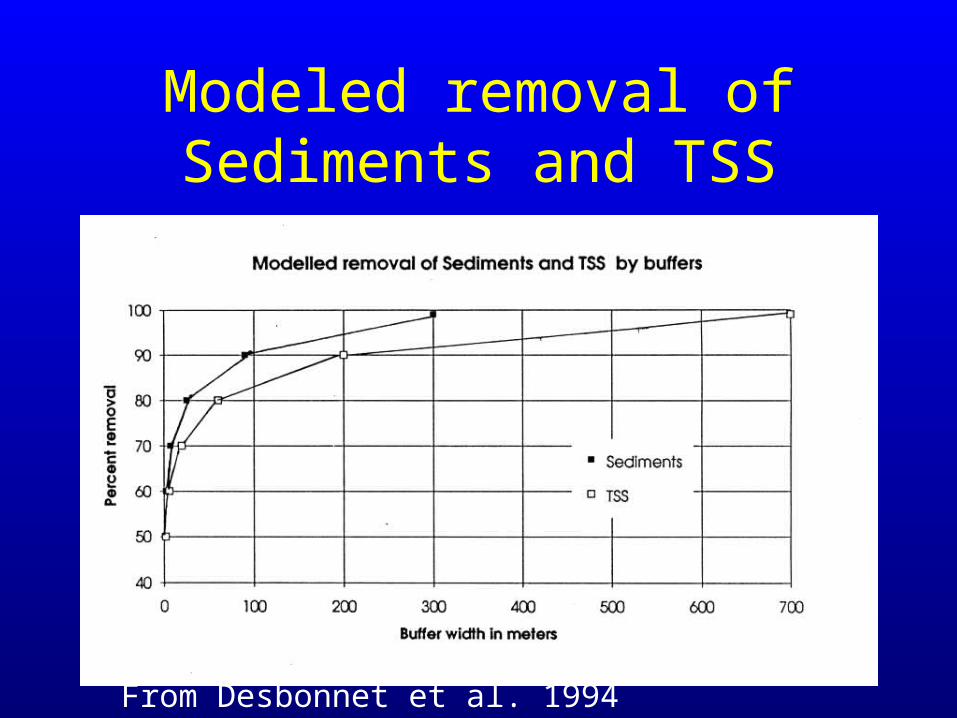
Modeled removal of Sediments and TSS
From Desbonnet et al. 1994
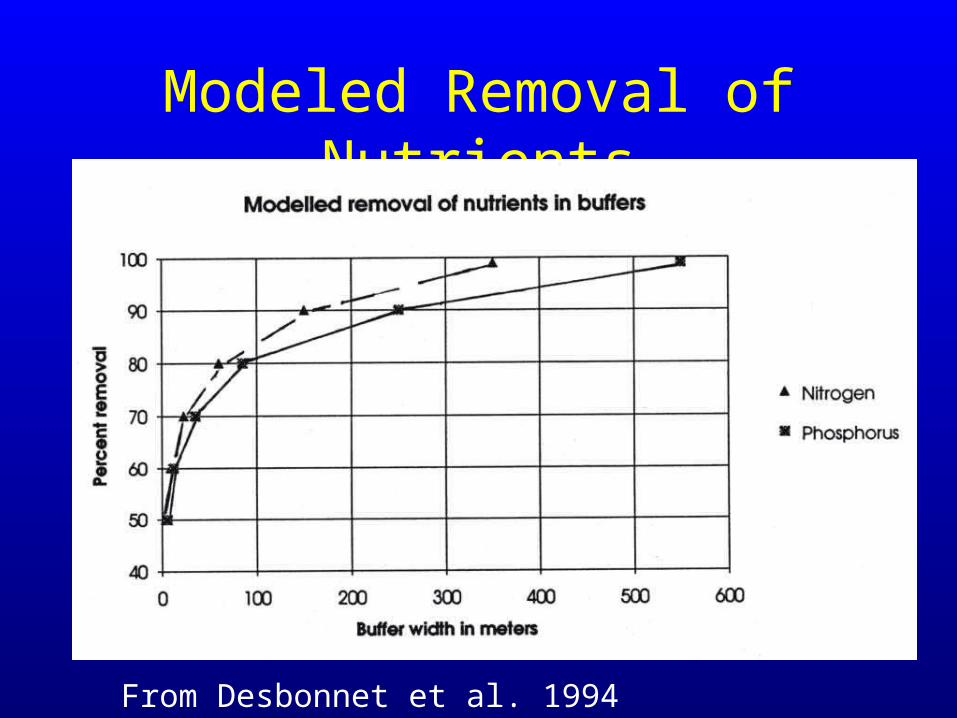
Modeled Removal of Nutrients
From Desbonnet et al. 1994
Fecal Coliforms
• Bacteria behave somewhat like particles with a limited lifespan outside a warm-blooded intestine
• Buffers “buy time”, allowing bacteria to die off naturally before reaching a sensitive area.
Die-off rates of fecal coliforms
• Typically 90% die off at ca. 48 hrs in freshwater• Typically 90% die off at ca. 1 day or less in salt
water• But lots of variation depending on type of
bacteria and characteristics of the sediment• Survival times of over a month and travel
distances greater than 2000 feet have been recorded.
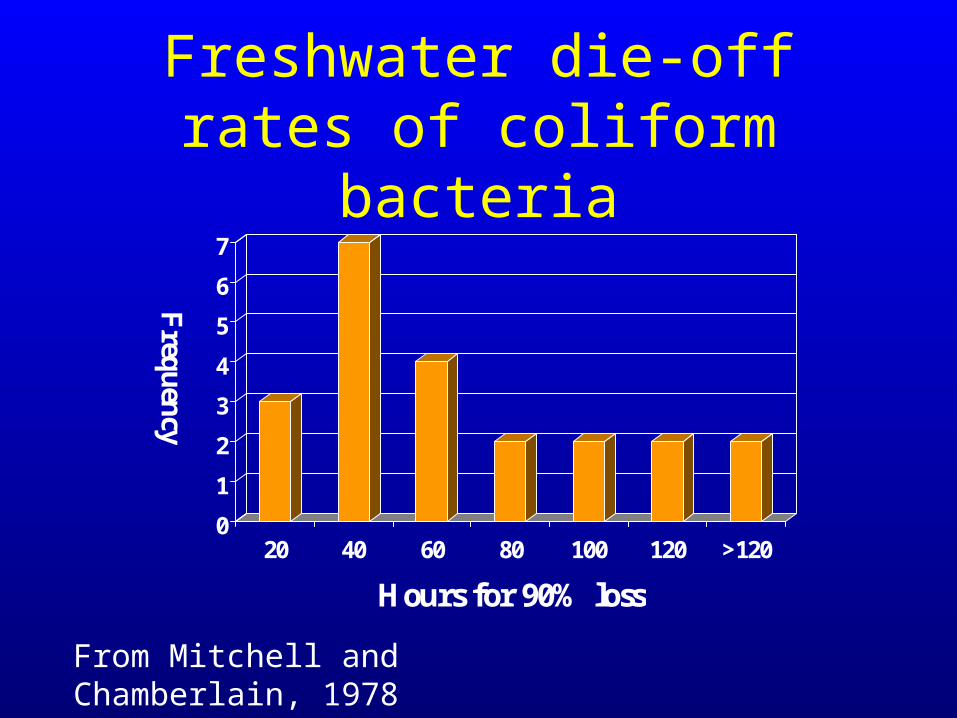
Freshwater die-off rates of coliform bacteria
0
1
2
3
4
5
6
7
Frequency
20 40 60 80 100 120 >120
Hours for 90% loss
From Mitchell and Chamberlain, 1978
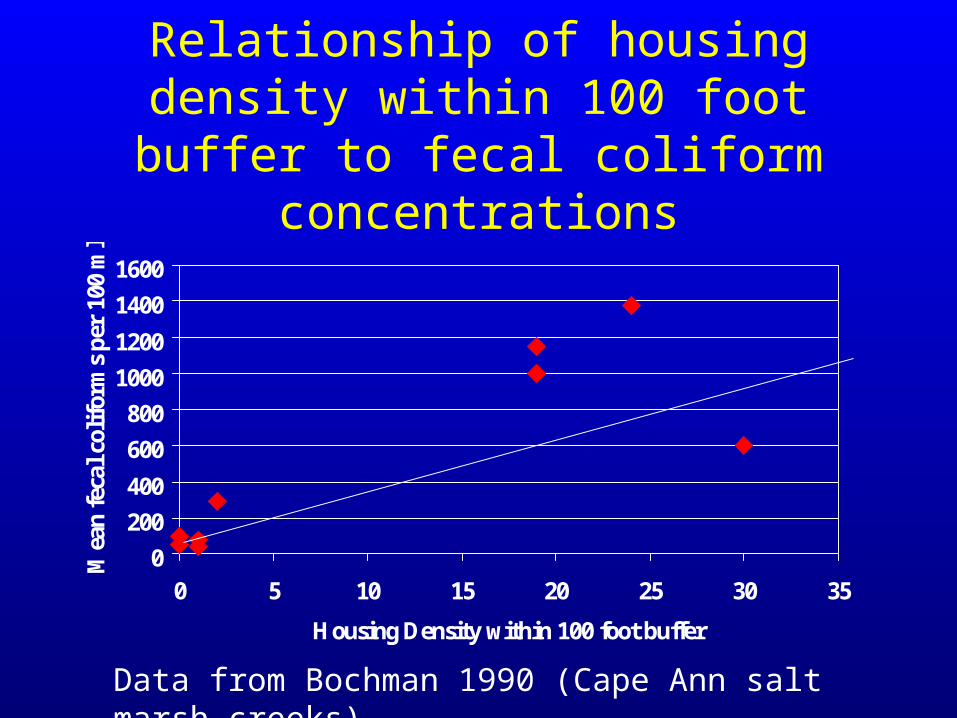
Relationship of housing density within 100 foot buffer to fecal coliform
concentrations
0
200
400
600
800
1000
1200
1400
1600
0 5 10 15 20 25 30 35
Housing Density within 100 foot buffer
Mea
n fe
cal c
olif
orm
s pe
r 10
0 m
l
Data from Bochman 1990 (Cape Ann salt marsh creeks)
General Conclusions: Buffers and Water Quality
• On average, a 100 foot buffer will remove in the neighborhood of 70% of the pollutants
• A small buffer (e.g., 25 feet) is still very worthwhile – removes over 50% of pollutants
• Going from 300 to 600 feet gives you only an additional 10% of pollutant removal
• Scientifically, nothing is better than site-specific information.
Wildlife Habitat Function of Buffers
• Ecological link to both wetlands and upland
• Nesting sites for wetland animals
• Hibernation sites for wetland animals
• Refuge during times of very high water
• Migration corridor
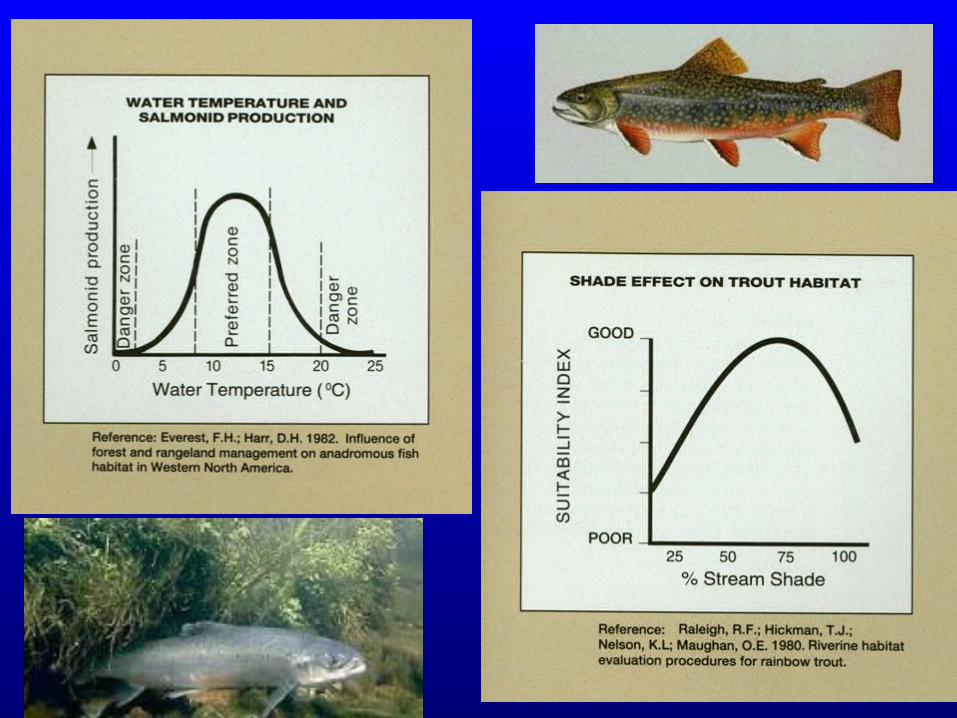
• Shade for cold water fish
Wildlife Habitat Functions (2)
• Ameliorates the effects of disturbance• Improves water quality• Provides a buffer from invasive and generalist
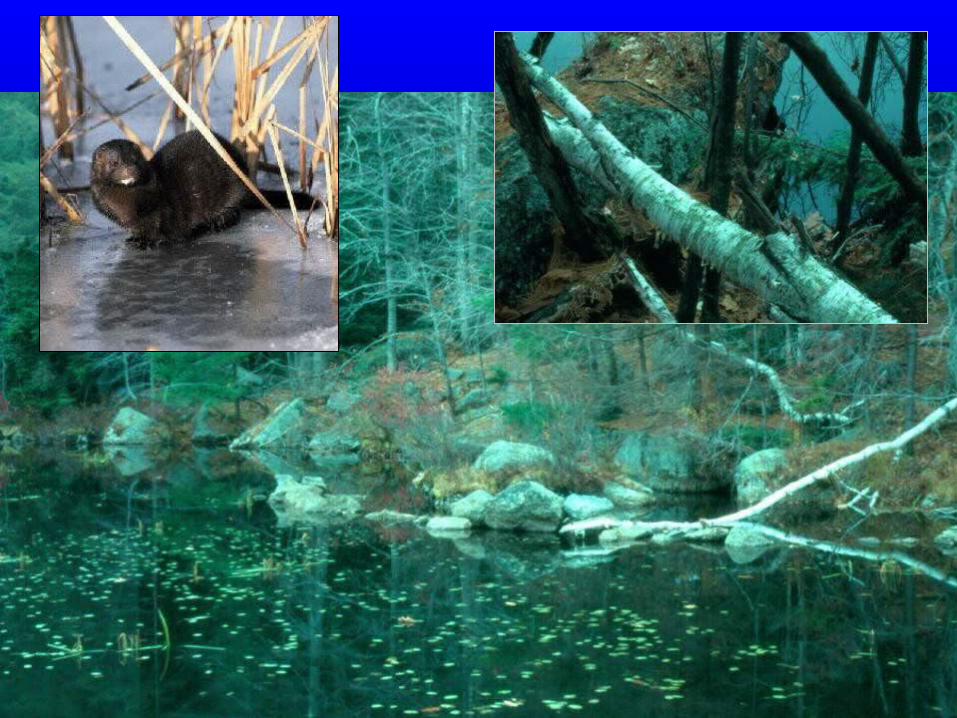
animals• Woody debris from buffer provides a habitat for
wetlands invertebrates• Provides an energy source to invertebrates in the
form of detritus• A habitat for “buffer specialists”
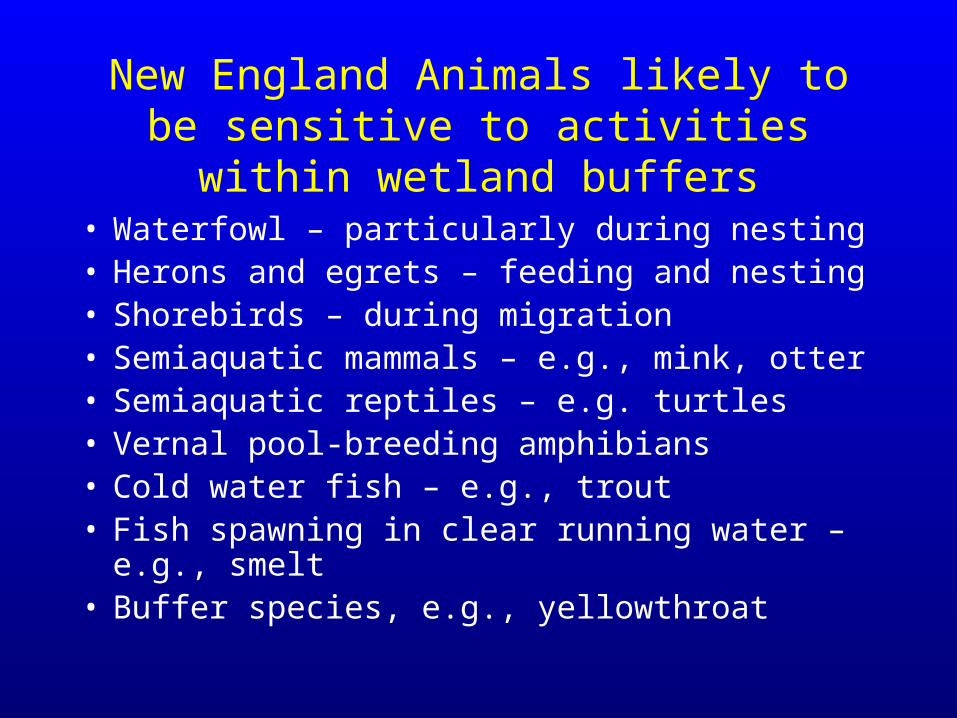
New England Animals likely to be sensitive to activities within wetland buffers
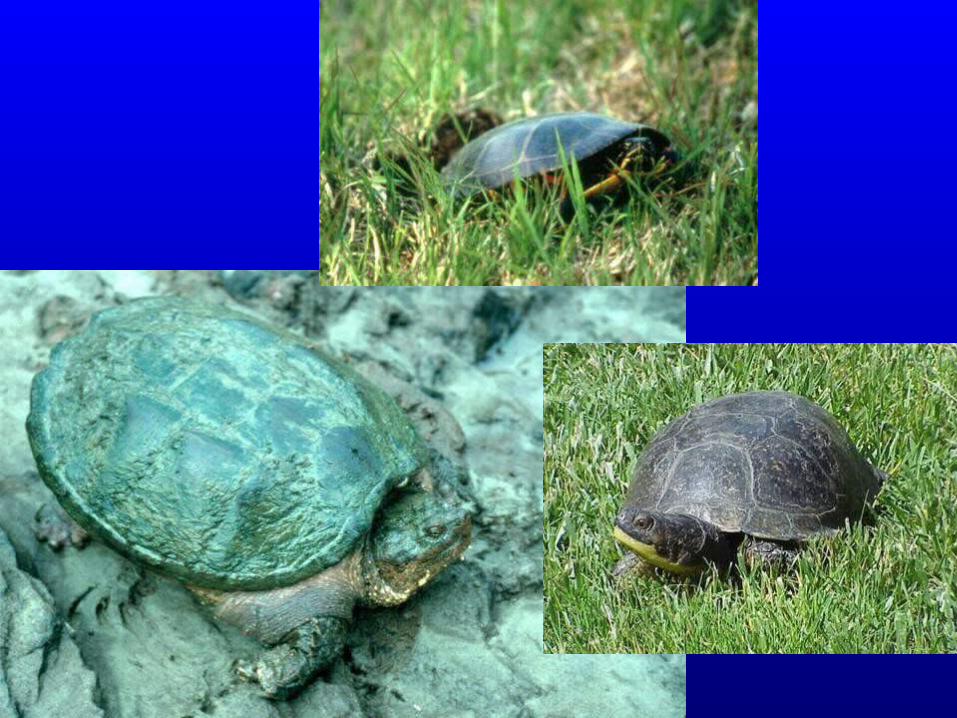
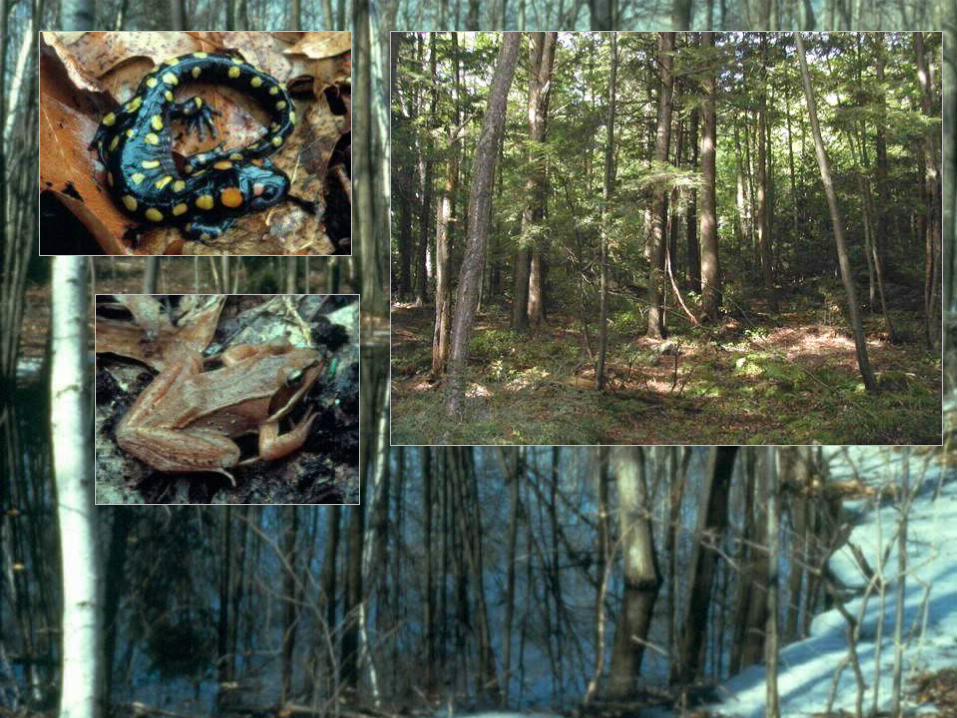
• Waterfowl – particularly during nesting• Herons and egrets – feeding and nesting• Shorebirds – during migration• Semiaquatic mammals – e.g., mink, otter• Semiaquatic reptiles – e.g. turtles• Vernal pool-breeding amphibians• Cold water fish – e.g., trout• Fish spawning in clear running water – e.g., smelt• Buffer species, e.g., yellowthroat
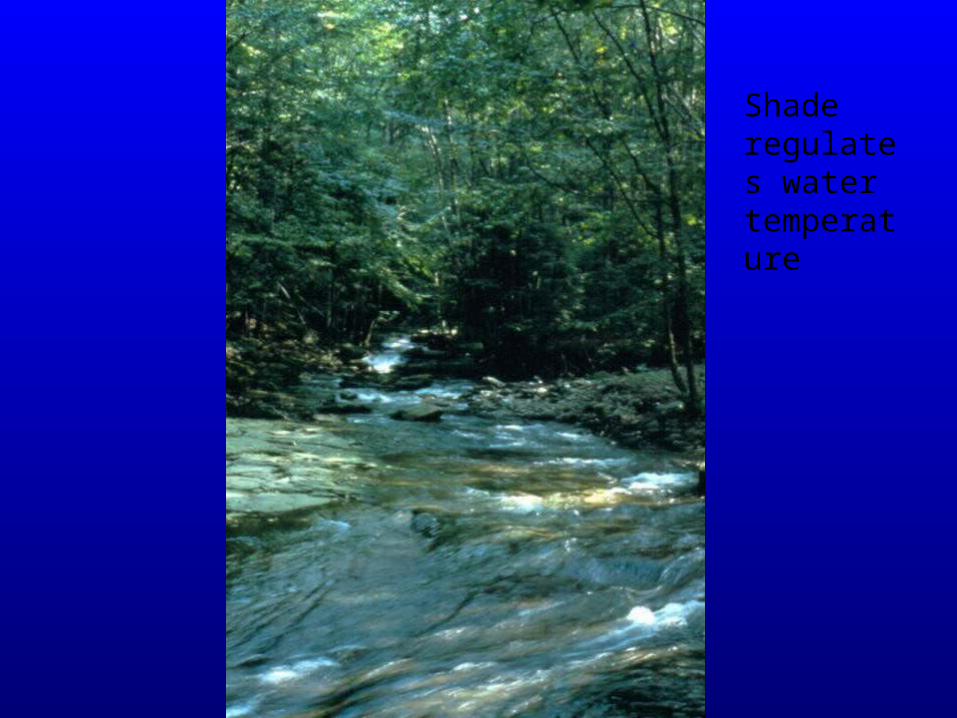
Shade regulates water temperature
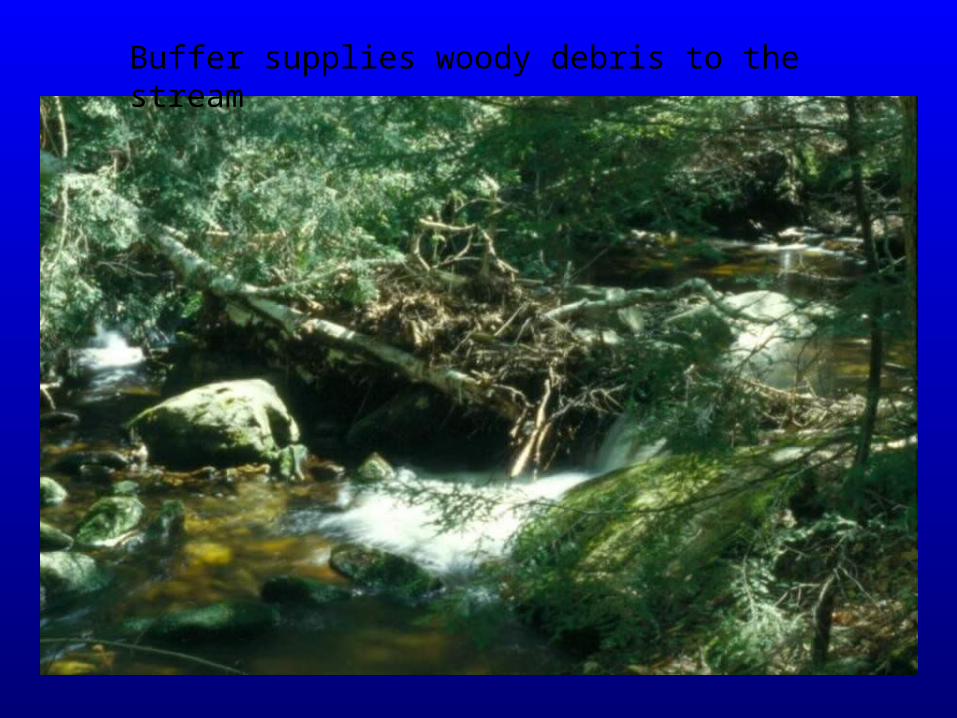
Buffer supplies woody debris to the stream
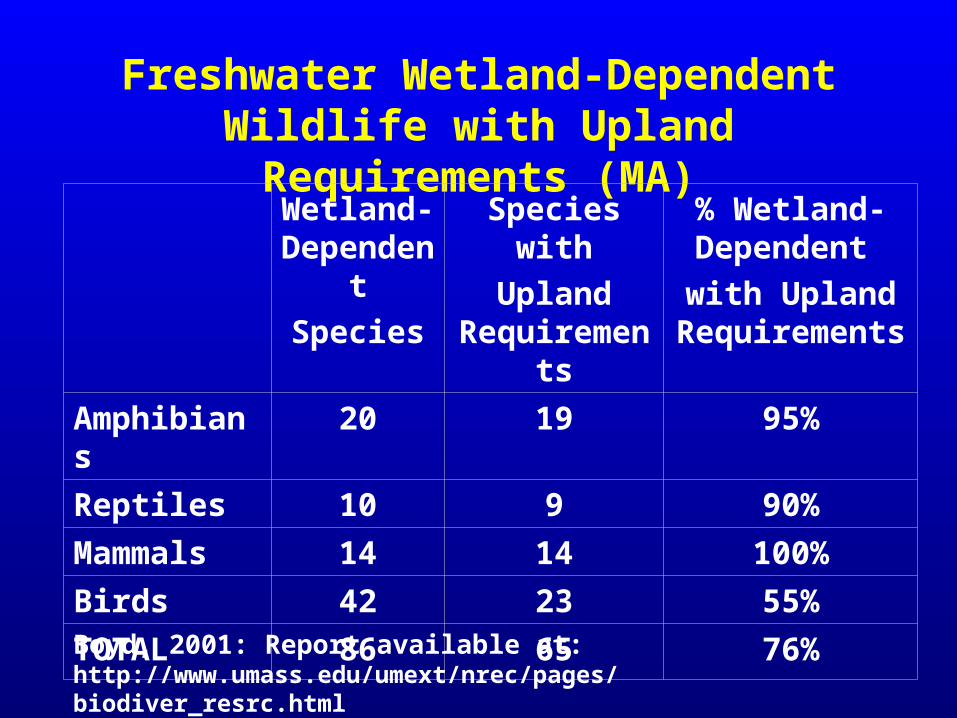
Freshwater Wetland-Dependent Wildlife with Upland Requirements (MA)
Wetland-Dependent
Species
Species with
Upland Requirements
% Wetland-Dependent
with Upland Requirements
Amphibians 20 19 95%
Reptiles 10 9 90%
Mammals 14 14 100%
Birds 42 23 55%
TOTAL 86 65 76%
Boyd, 2001: Report available at: http://www.umass.edu/umext/nrec/pages/biodiver_resrc.html
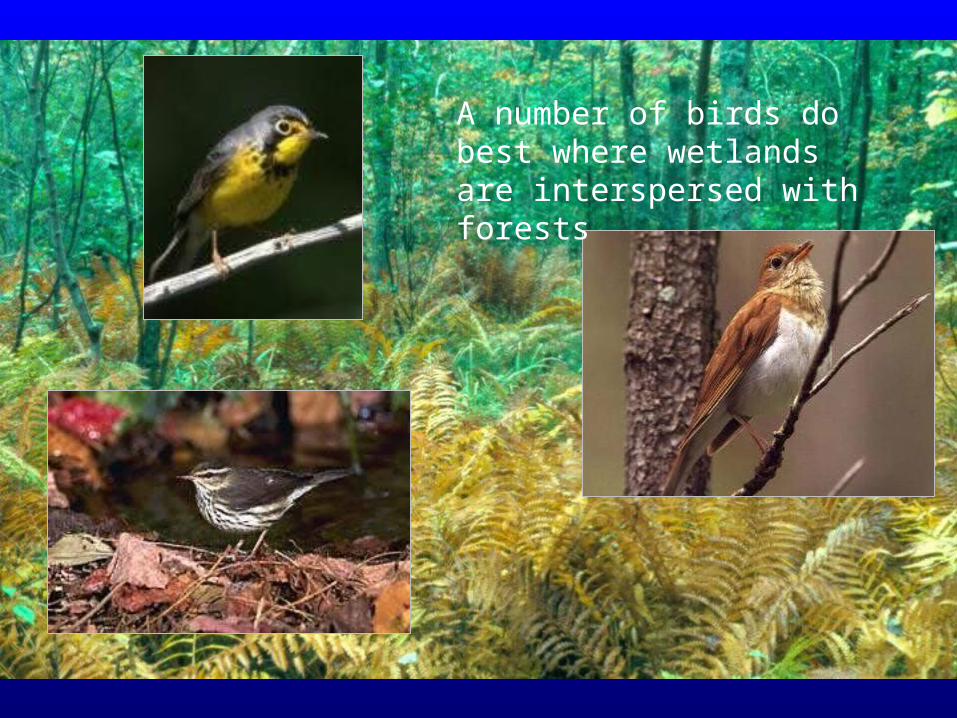
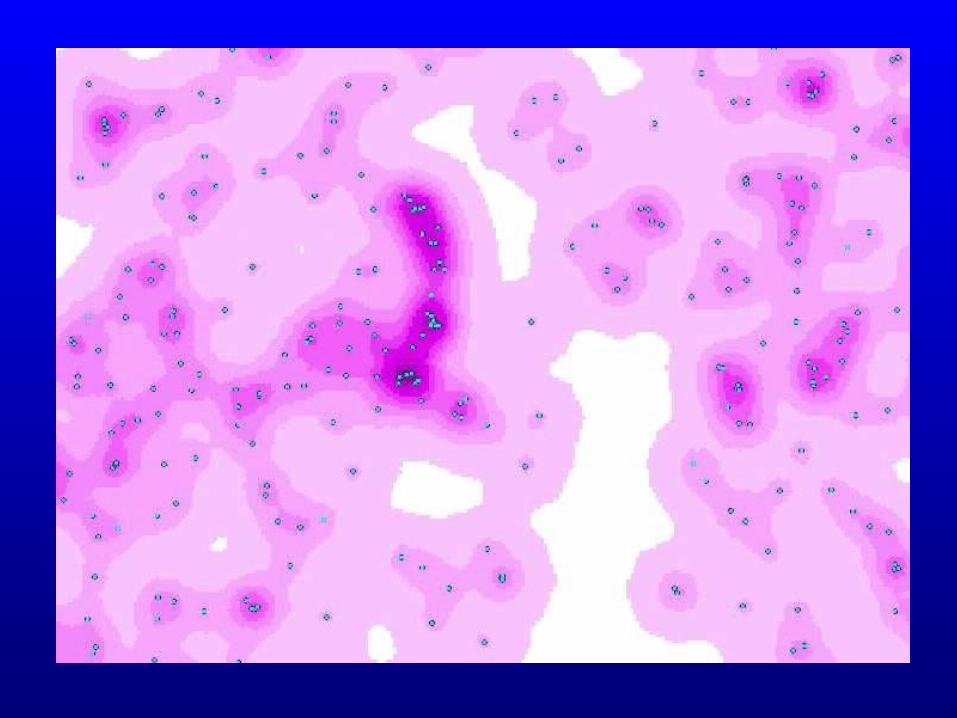
A number of birds do best where wetlands are interspersed with forests
(X(X(X(X(X(X(X(X (X(X(X(X(X(X(X(X(X(X(X(X(X(X(X(X
(X(X(X(X
(X
(X(X
(X(X(X
(X
(X
(X(X
(X
(X
(X(X(X(X(X(X (X
(X(X(X(X
(X
(X
(X(X
(X
(X
(X
(X(X
(X(X(X(X
(X
(X(X
(X
(X
(X
(X
(X(X
(X(X (X(X
(X
(X
(X
(X(X(X
(X
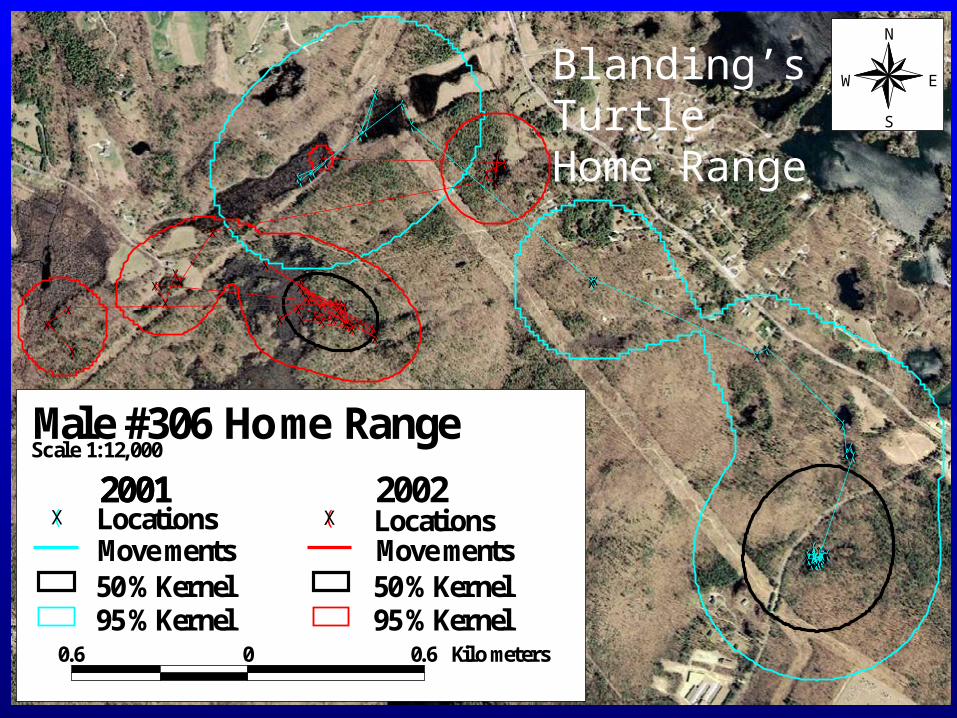
Scale 1:12,000
20012001 2002
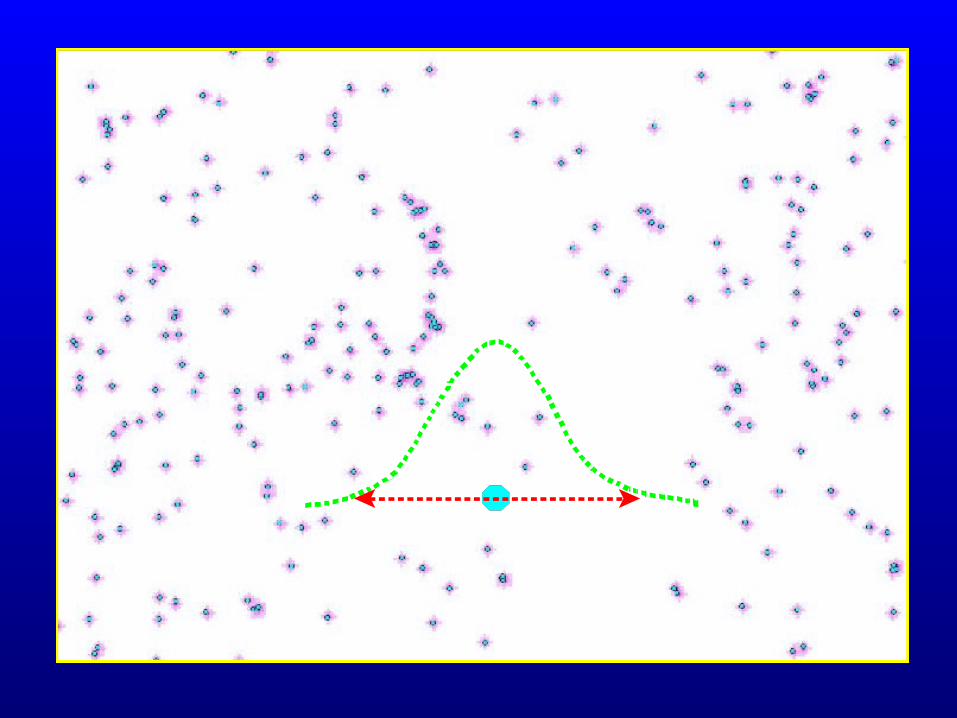
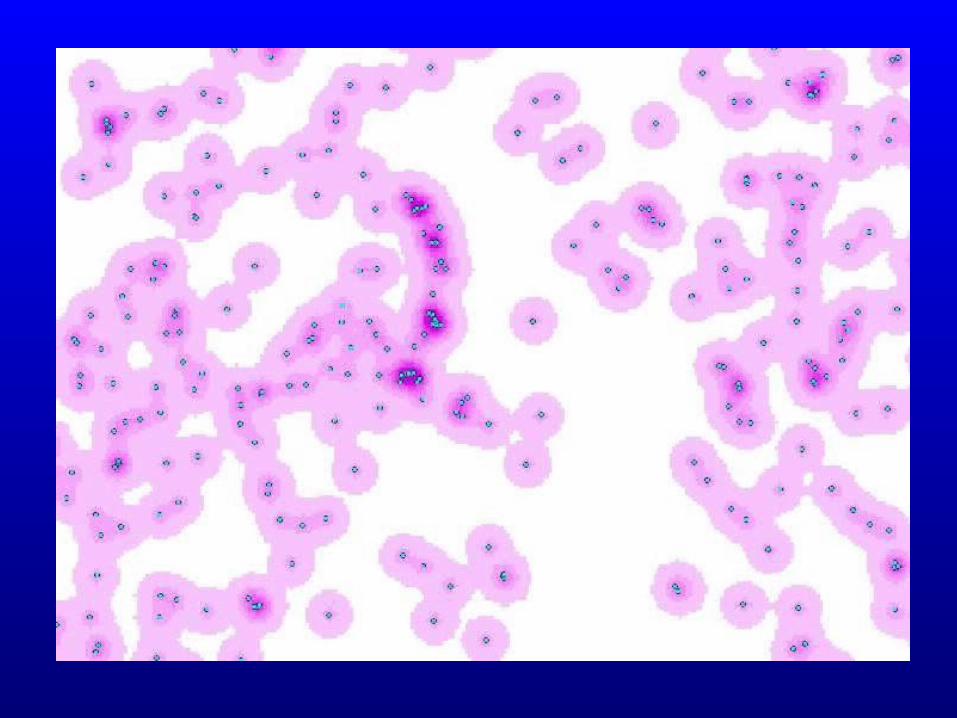
Movements
95% Kernel50% Kernel
95% Kernel 50% Kernel
(X Locations(X LocationsMovements
Male #306 Home Range
. il m te60. 0 0 6 K o e rs
N
EW
S
Blanding’s Turtle Home Range
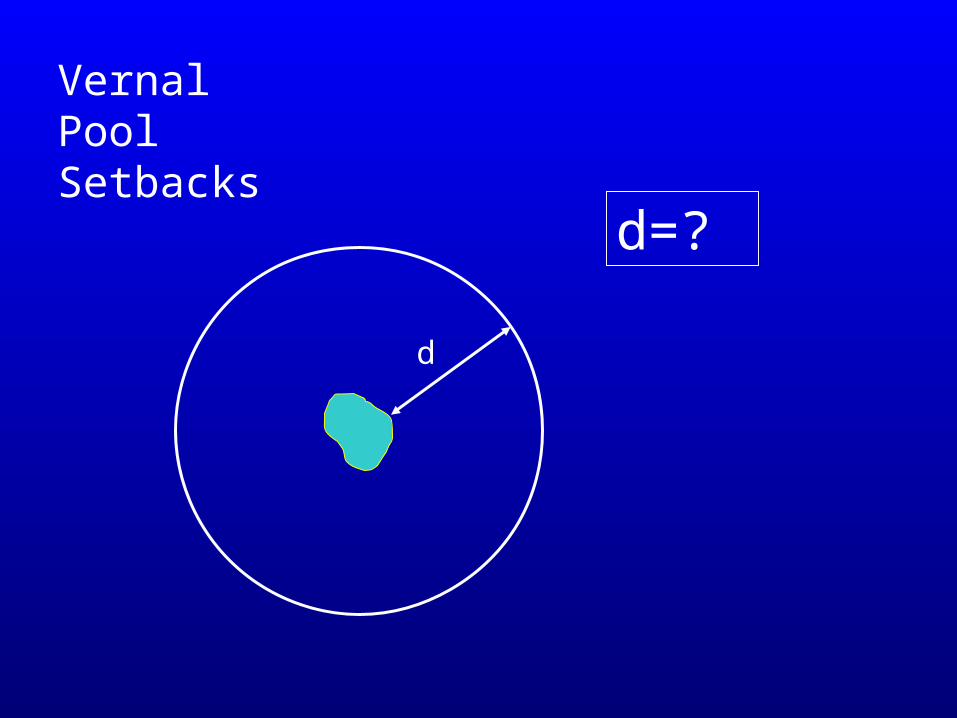
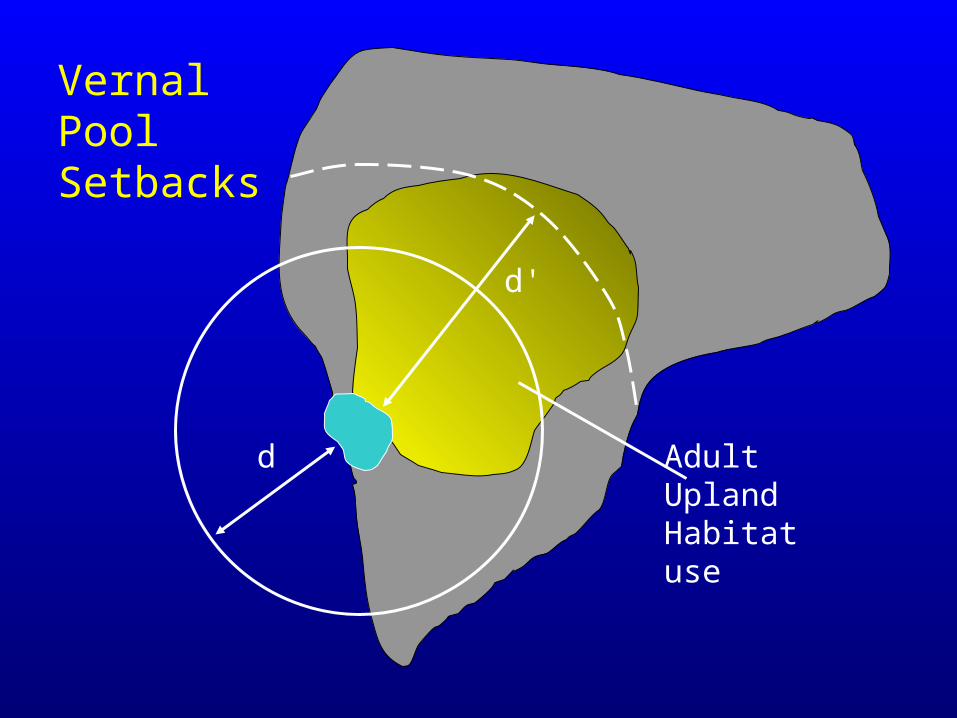
Vernal Pool Setbacks
d
d=?
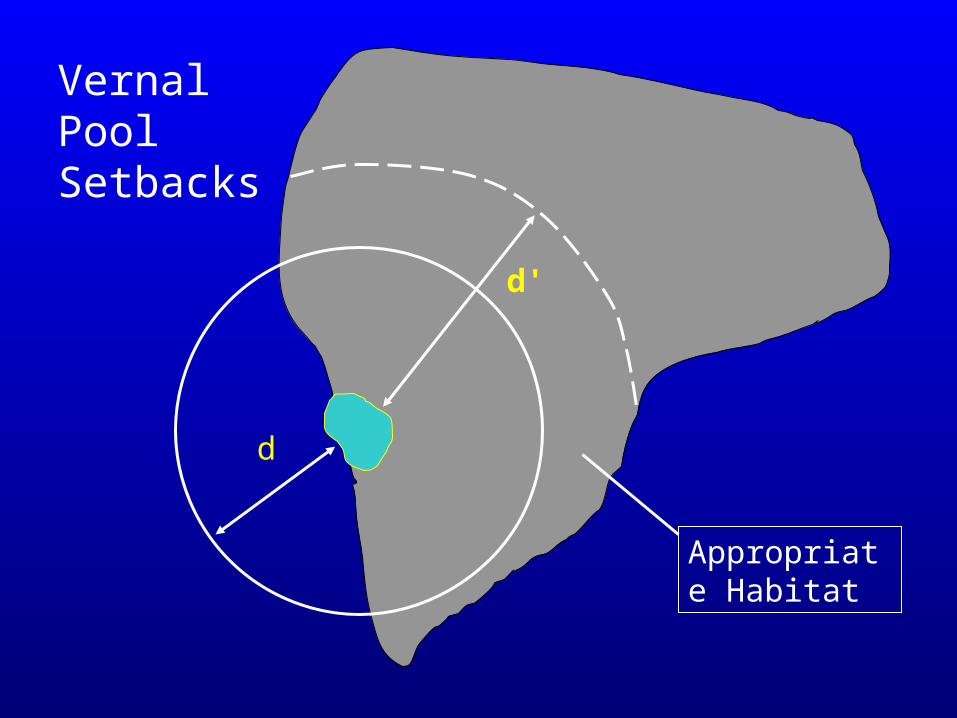
d'
d
Vernal Pool Setbacks
Appropriate Habitat
d'
Vernal Pool Setbacks
d Adult Upland Habitat use
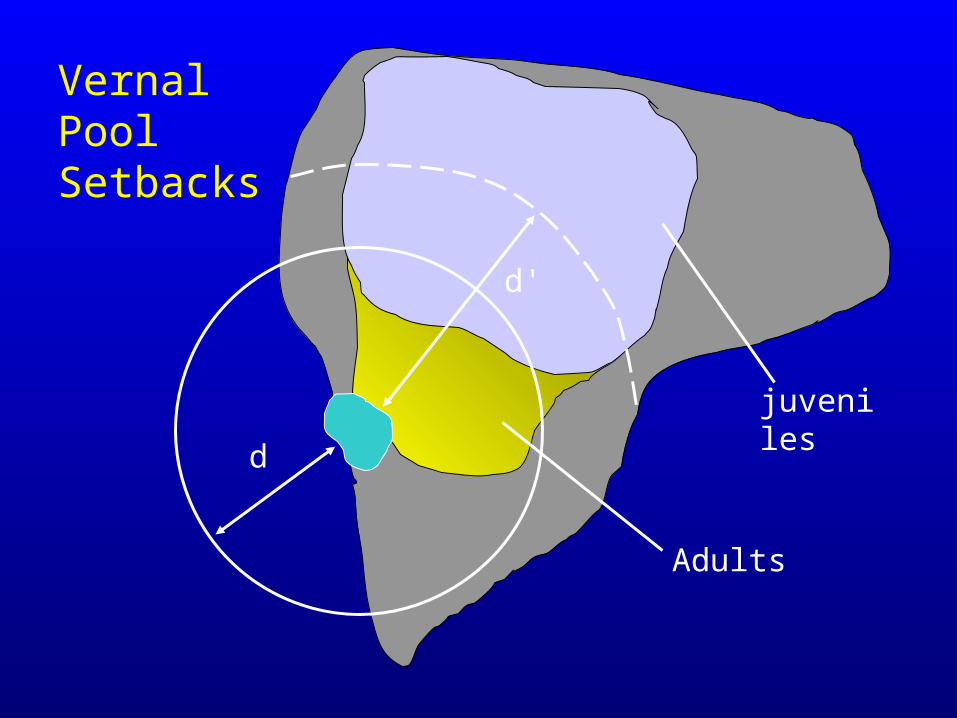
d'
d
Vernal Pool Setbacks
Adults
juveniles
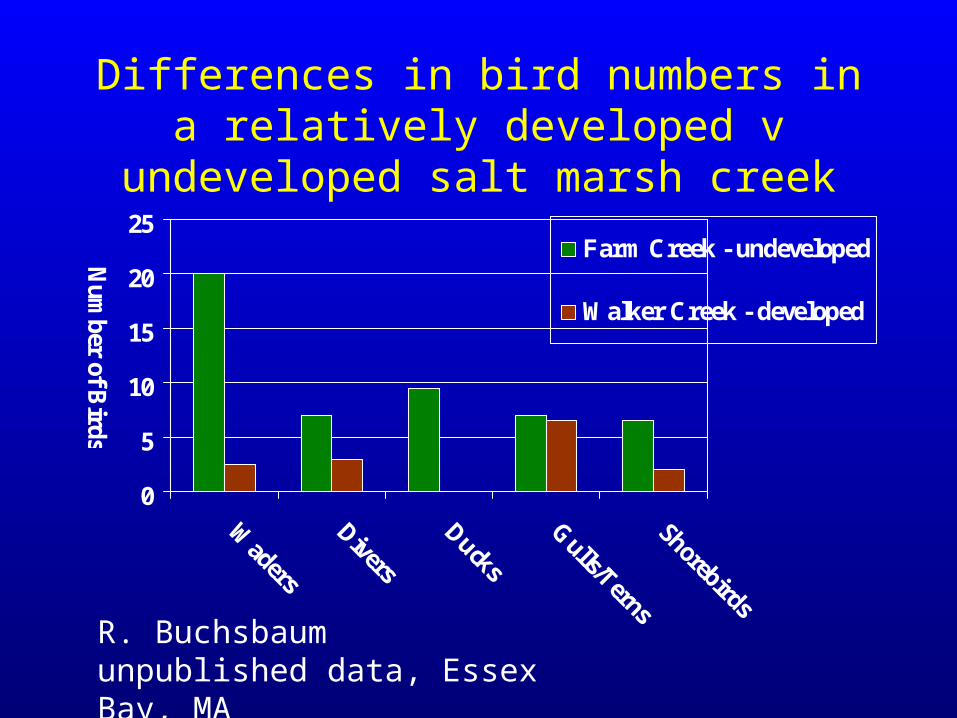
Differences in bird numbers in a relatively developed v undeveloped salt marsh creek
0
5
10
15
20
25
Waders
Divers
Ducks
Gulls/Terns
Shorebirds
Num
ber of Birds
Farm Creek - undeveloped
Walker Creek - developed
R. Buchsbaum unpublished data, Essex Bay, MA
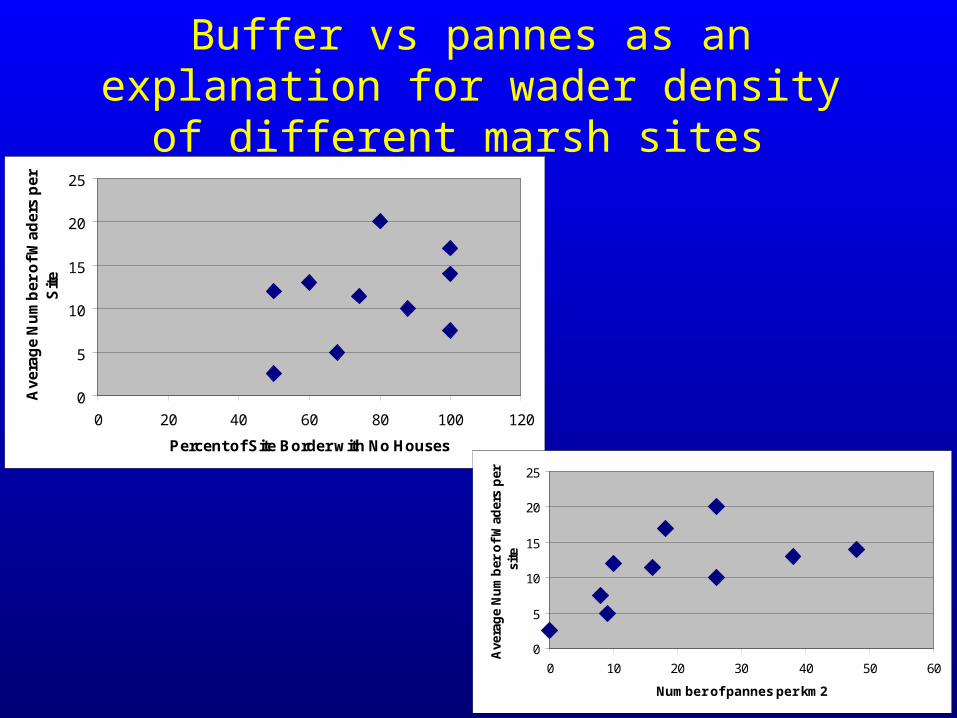
Buffer vs pannes as an explanation for wader density of different marsh sites
0
5
10
15
20
25
0 20 40 60 80 100 120
Percent of Site Border with No Houses
Av
era
ge
Nu
mb
er
of
Wa
de
rs p
er
Sit
e
0
5
10
15
20
25
0 10 20 30 40 50 60
Number of pannes per km2
Ave
rag
e N
um
ber
of
Wad
ers
per
si
te
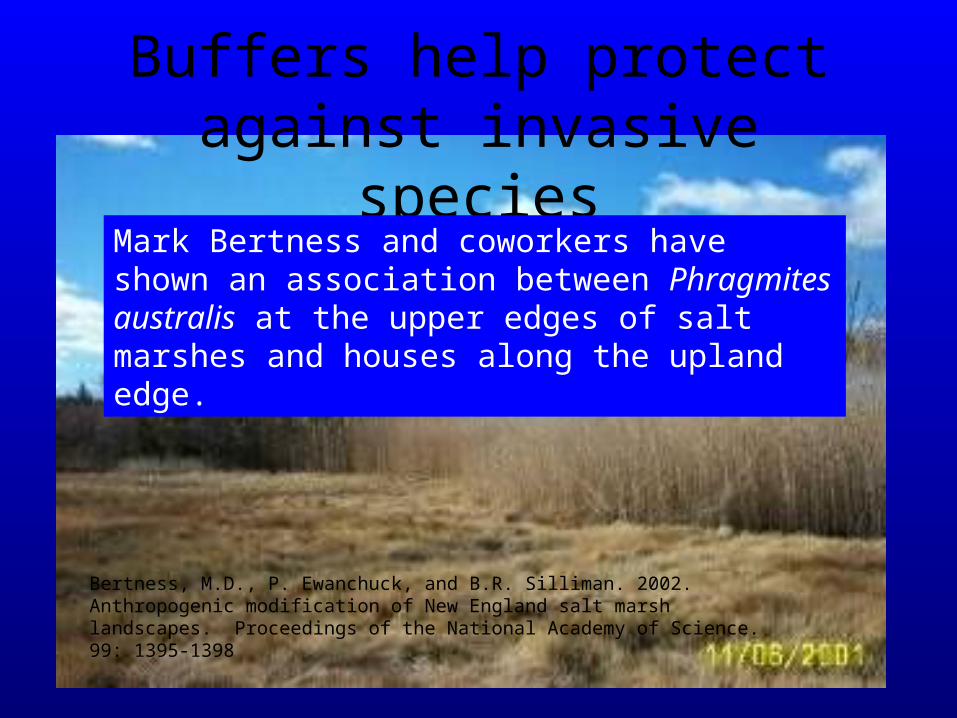
Buffers help protect against invasive species
Mark Bertness and coworkers have shown an association between Phragmites australis at the upper edges of salt marshes and houses along the upland edge.
Bertness, M.D., P. Ewanchuck, and B.R. Silliman. 2002. Anthropogenic modification of New England salt marsh landscapes. Proceedings of the National Academy of Science. 99: 1395-1398
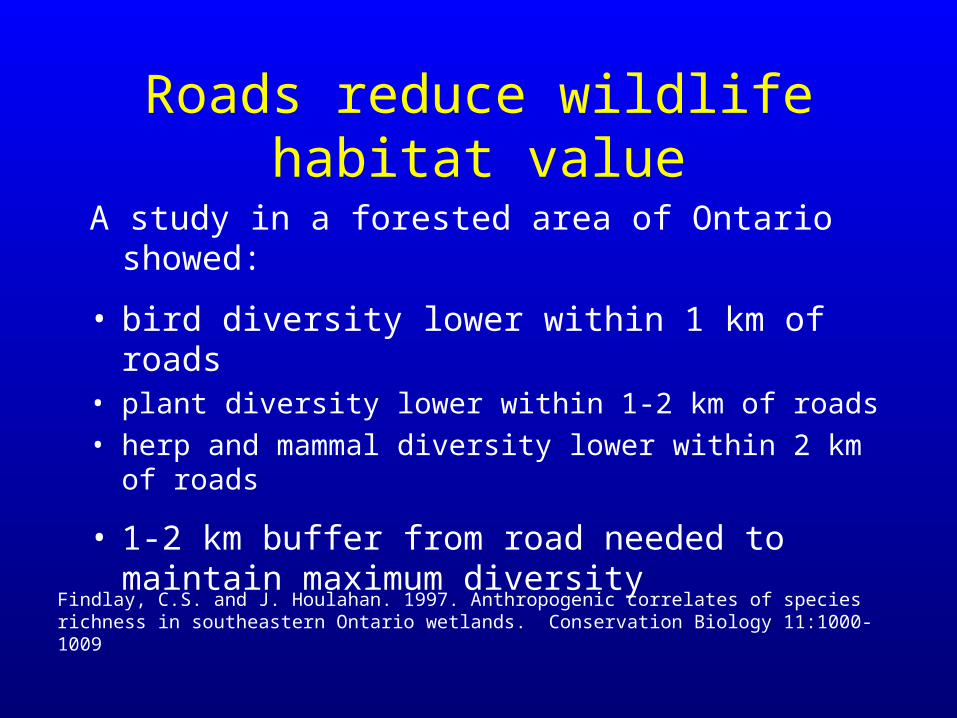
Roads reduce wildlife habitat value
A study in a forested area of Ontario showed:
• bird diversity lower within 1 km of roads• plant diversity lower within 1-2 km of roads
• herp and mammal diversity lower within 2 km of roads
• 1-2 km buffer from road needed to maintain maximum diversity
Findlay, C.S. and J. Houlahan. 1997. Anthropogenic correlates of species richness in southeastern Ontario wetlands. Conservation Biology 11:1000-1009
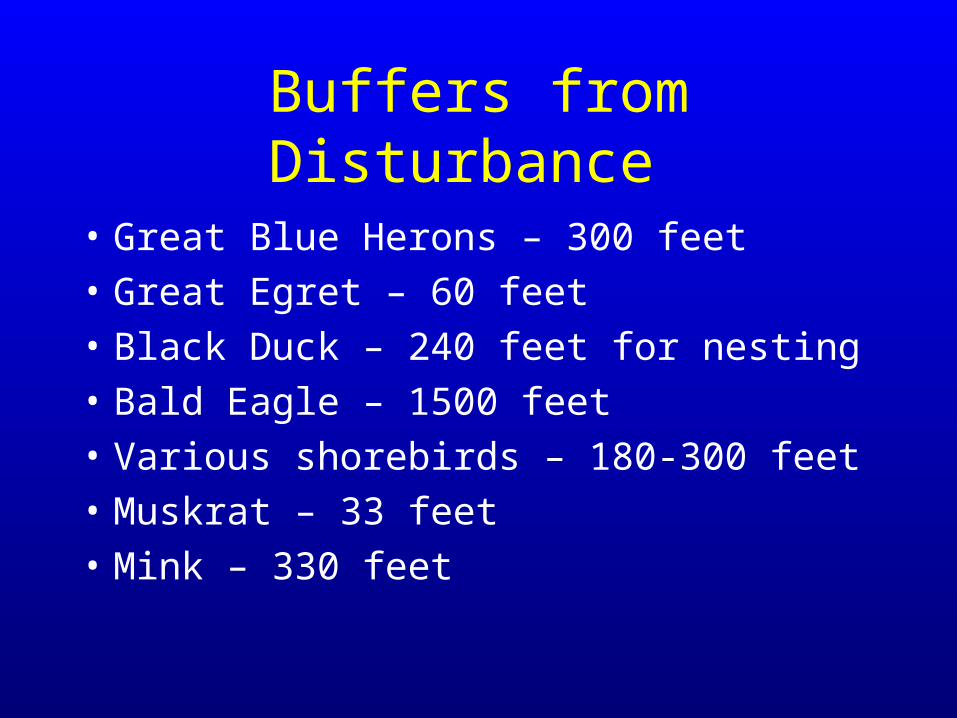
Buffers from Disturbance
• Great Blue Herons – 300 feet
• Great Egret – 60 feet
• Black Duck – 240 feet for nesting
• Bald Eagle – 1500 feet
• Various shorebirds – 180-300 feet
• Muskrat – 33 feet
• Mink – 330 feet
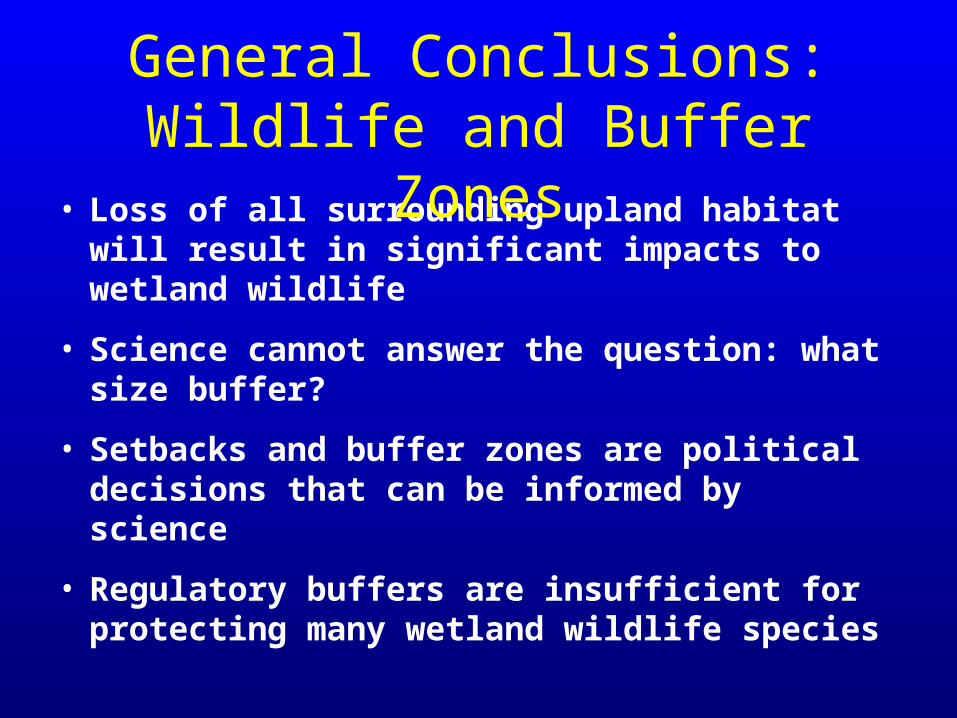
• Loss of all surrounding upland habitat will result in significant impacts to wetland wildlife
• Science cannot answer the question: what size buffer?
• Setbacks and buffer zones are political decisions that can be informed by science
• Regulatory buffers are insufficient for protecting many wetland wildlife species
General Conclusions:Wildlife and Buffer Zones
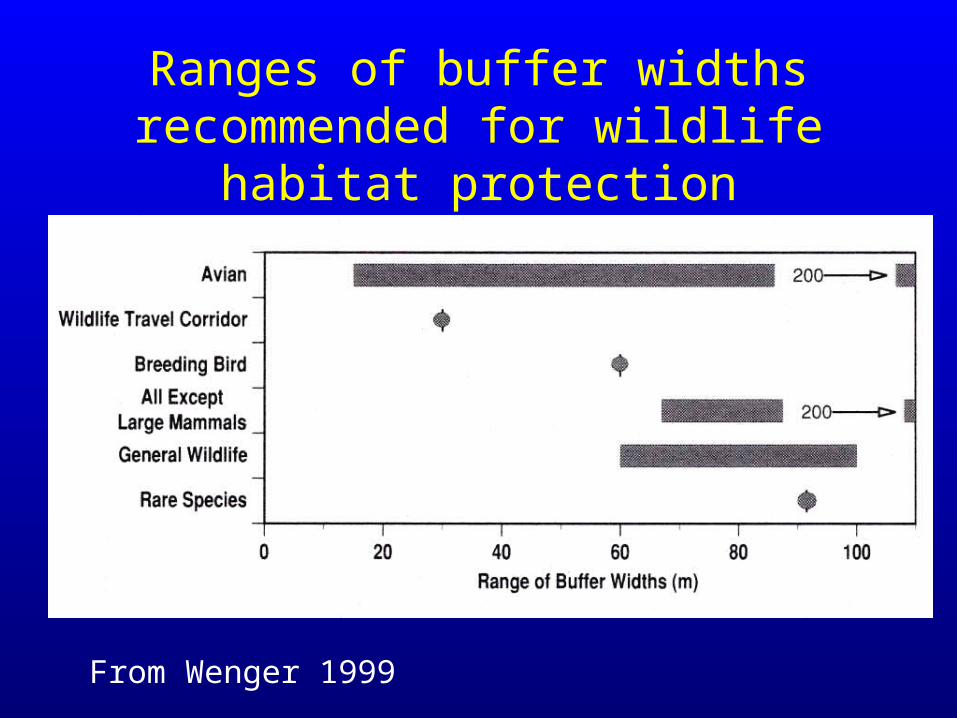
Ranges of buffer widths recommended for wildlife habitat protection
From Wenger 1999
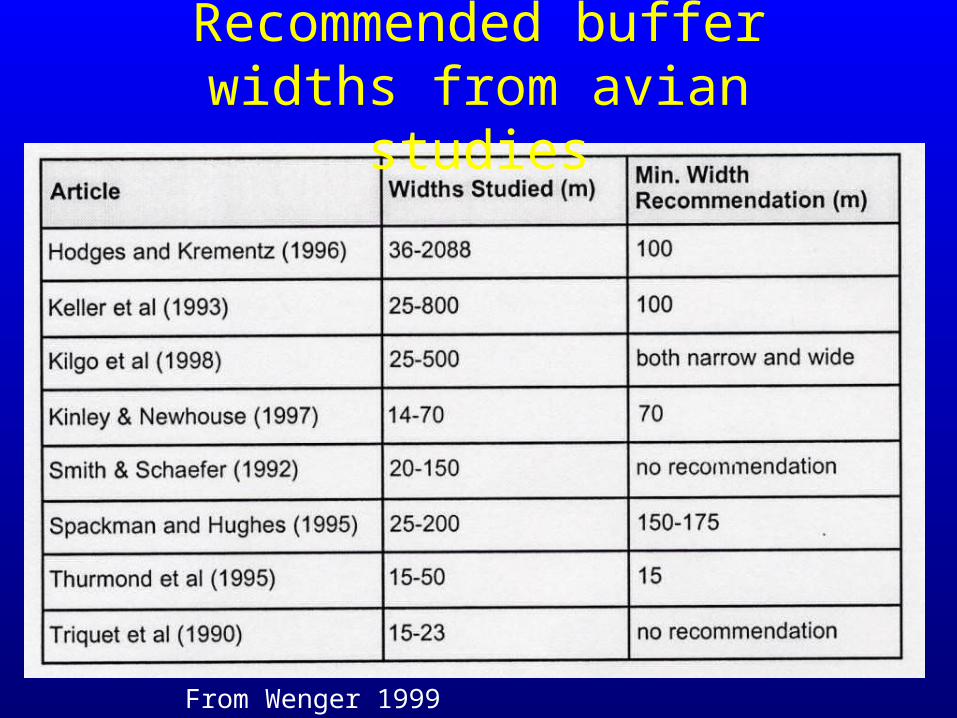
Recommended buffer widths from avian studies
From Wenger 1999
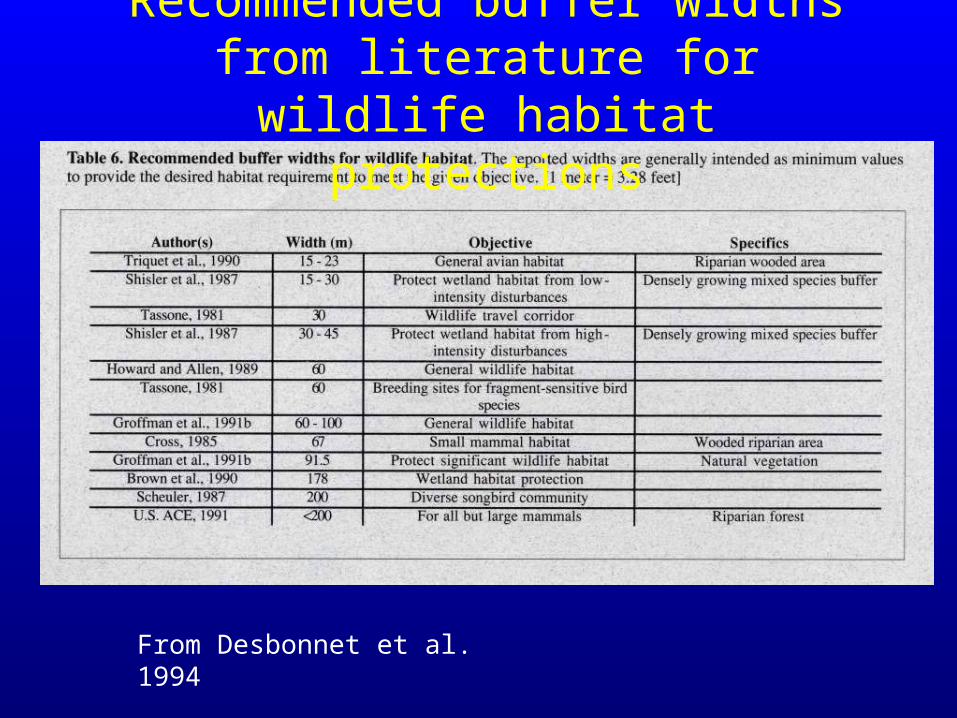
From Desbonnet et al. 1994
Recommended buffer widths from literature for wildlife habitat protections
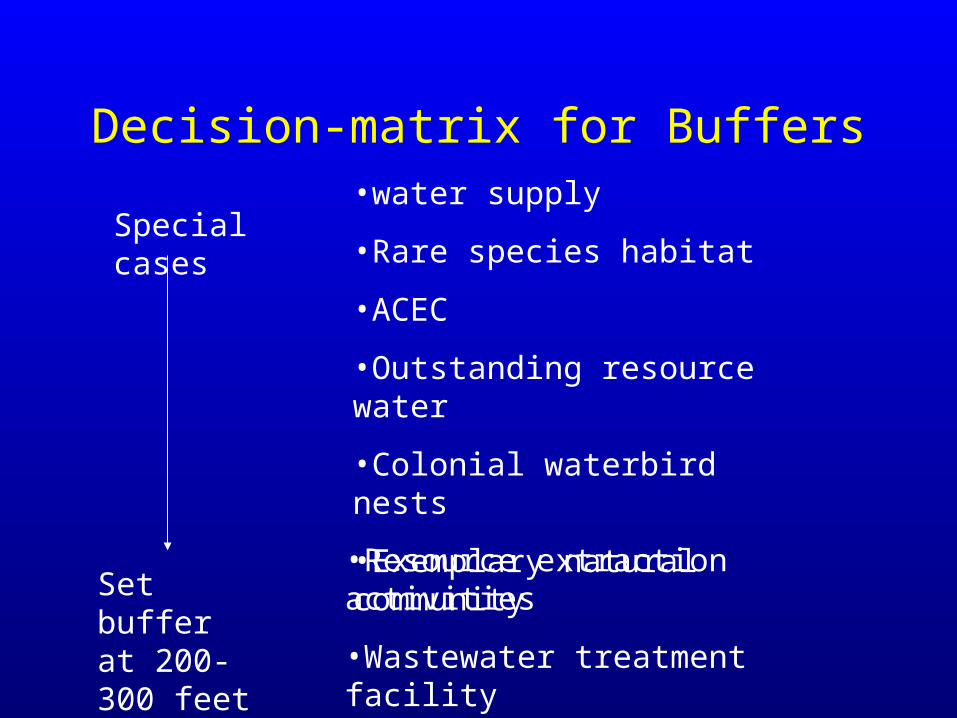
Decision-matrix for Buffers
Special cases
Set buffer at 200-300 feet
•water supply
•Rare species habitat
•ACEC
•Outstanding resource water
•Colonial waterbird nests
•Exemplary natural community
•Resource extraction activities
•Wastewater treatment facility

Decision-matrix for Buffers
Not a special case?
Evaluate and score wetland functions
Evaluate and score potential for impacts including cumulative impacts
e.g., evaluate soils, slope, etc.
Calculate combined scoreSet buffer distance
50-300 feet
+
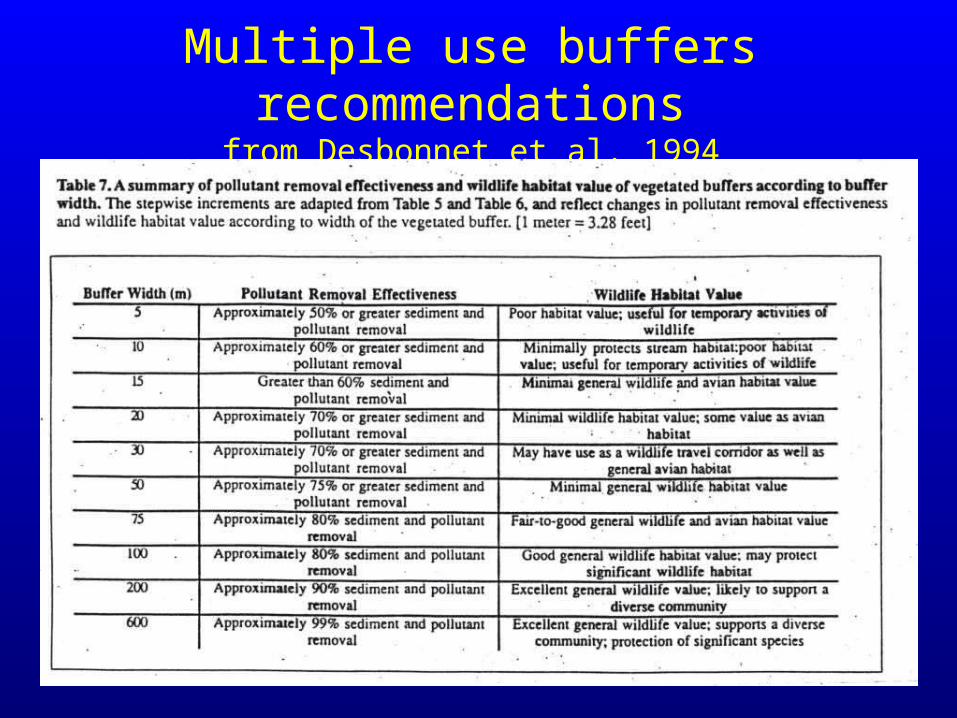
Multiple use buffers recommendationsfrom Desbonnet et al. 1994

General Conclusions: Buffers, Water Quality, and Wildlife
• Our current regulatory buffers (100-200 feet) is more effective in protecting a wetland from pollutants than from loss of wildlife habitat function.
• Other approaches, such as creative land use planning, is needed to maintain wildlife habitat functions


![[Pgday.Seoul 2017] 3. PostgreSQL WAL Buffers, Clog Buffers Deep Dive - 이근오](https://img.pdfslide.net/doc/110x75/5a65da547f8b9aaf638b5143/pgdayseoul-2017-3-postgresql-wal-buffers-clog-buffers-deep-dive-.jpg)