Embed Size (px)
Citation preview

The Second Great Contraction 1
The United States’ Second Great Contraction:
A Comparison to Japan’s “Lost Decade” and the Great Depression
By Kristin Halterman
Practicum Advisor: Roger Staiger
A thesis submitted to Johns Hopkins University in conformity with the requirements for the degree of Master of Real Estate
Washington, DC April 28, 2011

The Second Great Contraction 2
Table of Contents
Introduction 3
The Great Depression 5 Macroeconomic Overview 5
Causes 7 Government Response 13 Outcome 16 Japan’s “Lost Decade” 17 Macroeconomic Overview 17 Causes 19 Government Response 25
Initial Onset – 1990-1997 25 Renewed Turmoil 1997-2000 27
Sustained Recovery – 2001-2003 28 Outcome 29 The Second Great Contraction 31 Macroeconomic Overview 31 Causes 33 Government Response 43 Outcome 49 Comparison 50 Causes 50 Duration/Severity 53
Government Response 57 Lessons Learned 59 Conclusion 63 References 67 Appendix A 72

The Second Great Contraction 3
Introduction
The crisis currently gripping the United States, termed the “Second Great Contraction”
by Reinhart and Rogoff (2009), has been compared to many that have come before. It has also
been said that today’s crisis is like nothing before it. So which is it? And what lesson can be
taken from the world’s previous economic crises and compared to the current?
Real estate has played a significant role in the three major crises of the last century. The
“Second Great Contraction” has most frequently been compared to the Great Depression and
Japan’s “Lost Decade,” both of which were preceded by real estate bubbles and busts. Other
parallels are found between the three events, both in macroeconomic circumstances and causal
factors. Extensive research has been conducted on the causes, responses, and outcomes of the
previous two episodes. Several common factors have been identified as pre-cursors to these two
episodes, and these factors can also be seen in the Second Great Contraction.
Particularly evident in all three episodes is the effect of real estate cycles, which tend to
have an outsized impact on the economy, not only because of the size of the market but because
of the degree of exposure that banks and financial institutions have to real estate. Shocks to the
real estate market tend to negatively affect macroeconomic performance in the short term. A
significant drop in the real estate market negatively affects GDP. It has an impact on the banking
and financial sectors, the construction industry, and also decreases household wealth
significantly. This has the added effect of temporarily decreasing consumer spending, which
currently accounts for 70.1% of US GDP. Because real estate is so integral to the greater
economy, it is important to examine the strategic role it plays in order to prevent massive shocks
from occurring in the industry.
The Second Great Contraction 4
While the US may escape the lingering severity of this current crisis, it is clear that the
financial system must be restructured to reduce the chance that economic crises of this
magnitude will continue to occur. With the 1999 repeal of the Glass-Steagall Act (G-S), the
provision that prohibited banks from owning their own financial companies, an important risk
safeguard was eliminated, effectively allowing banks to take on more risks by adopting practices
resembling those of investment banks. Commercial banks were thus allowed to issue and trade
CDO’s, RMBS, and CMBS securities on their own accounts. The repeal of G-S also prompted
the invention of Structured Investment Vehicles (SIV), which purchased these structured
securities. A SIV is essentially a net bank, i.e a financial vehicle, which invests in long-term
illiquid assets (structured assets) and borrows in the short-term markets (commercial paper) but
has no hard deposits (customer accounts) similar to a bank. At its peak in 2007, this market was
nearing $400 billion (Neat, 2009). This growth played a large role in the explosion in real estate
pricing as banks provided more exotic mortgages and financing vehicles and the SIVs purchased
these exotic instruments providing $400 billion in liquidity. In the end, the SIVs were a casualty
of the financial implosion of 2008. When the short-term credit market seized and SIVs were
unable to roll their debt, the structured and illiquid assets were then sold at substantial losses
bringing the once $400 billion industry to zero.
With the implementation of the Dodd-Frank legislation, the US continued the path to
regulate risk at institutions after a long period of deregulation and laize fair finance. The focus of
the new legislation are institutions which are systemically important to the economy and thus
reducing the risk of the types of bubbles fueled by cheap credit, such as the highly detrimental
real estate bubbles of the previous three major crises discussed here. Despite the severity of the
current crisis, the US is unlikely to experience an episode as long-lasting as either the Great
The Second Great Contraction 5
Depression or Japan’s “Lost Decade.” Lessons learned from the past and an ever-evolving
central banking system should allow the US to avoid the prolonged nature of the previous two
crises.
The Great Depression
In the US, the Great Depression is the most recognizable and severe economic crisis of
the past century. Its impact was felt for decades and had far reaching ramifications for both
macroeconomic policy and monetary policy. It also spawned inventive new government
programs, agencies, and policies that have shaped the way the US has developed over the last 80
years and have even possibly contributed to the current financial crisis. Considerable research on
the cause of the crisis exists, with two schools of thought dominating the discussion.
1. Demand-driven - The demand-driven school of thought theorizes that a massive loss of
confidence following the real estate decline and stock collapse caused a drop in both
consumption and investment spending (“Causes of the Great Depression,” n.d.). The lack
of confidence in the system prompted people to hold money out of the markets, causing a
further drop in demand (“Causes of the Great Depression,” n.d.).
2. The monetarists – Perceive the Depression started as an ordinary business cycle recession
but was exacerbated by poor monetary policy, which led to a deepening recession that
eventually became the depression (“Causes of the Great Depression,” n.d.).
It is most likely a combination of these two factors that was at fault.
Macroeconomic Overview
The macroeconomic environment prior to the Great Depression was tumultuous. The
world was in flux after the events of WWI. John Maynard Keynes, a leading economist, was at
odds with the treatment of Germany at the conclusion of the war, and Europe was rebuilding.

The Second Great Contraction 6
Most countries had returned to the gold standard, which affected the money supply worldwide by
fixing exchange rates. In the United States, the Federal Reserve raised interest rates in 1928 and
1929, primarily to restrict speculation on the stock market; however, this restriction had the
effect of tightening the money supply (Bernanke, 2004). Note, the rules of the exchanges were
also different. Many equities were purchased on margin, exacerbating the downturn when it
finally occurred. At the same time, production and demand were beginning to fall. In the United
States, it is estimated that output fell 30% between 1929 and 1933 (Bernanke, 2004).
Additionally, after the crash of the stock market in 1929, unemployment began its rise,
eventually topping out at 25% (Bernanke, 2004). Deflation took hold and prices fell 10%
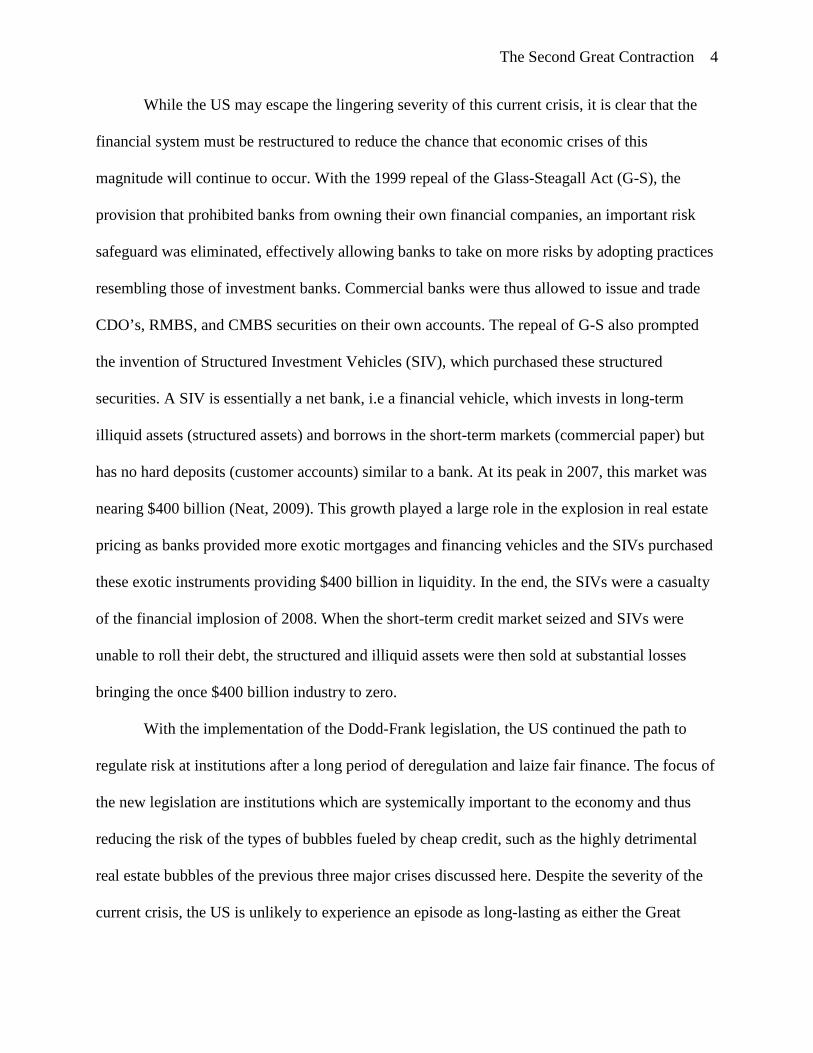
annually in the first part of the 1930s (Bernanke, 2004). As was the case with the current crisis,
housing prices began declining ahead of the equity crisis, noted in Figure 1 below. The decline
began in 1925, with housing prices falling close to 10% by 1929 (Shiller, 2011).
64
66
68
70
72
74
76
78
80
1925 1926 1927 1928 1929 1930 1931 1932
Shiller Housing Price Index 1925-1932
Figure 1: Shiller Housing Price Index 1925-1932. Note. data adapted from Shiller Historical Home Price Index, 2011. Retrieved
March, 25, 2011 from http://www.econ.yale.edu/~shiller/data.htm.
The housing decline was particularly devastating at this time because typical mortgages were at
50% loan to value and based on short-term 5-year loans. Thus the 30% drop in housing prices
wiped out many families’ entire life savings. With this massive deterioration of household wealth
The Second Great Contraction 7
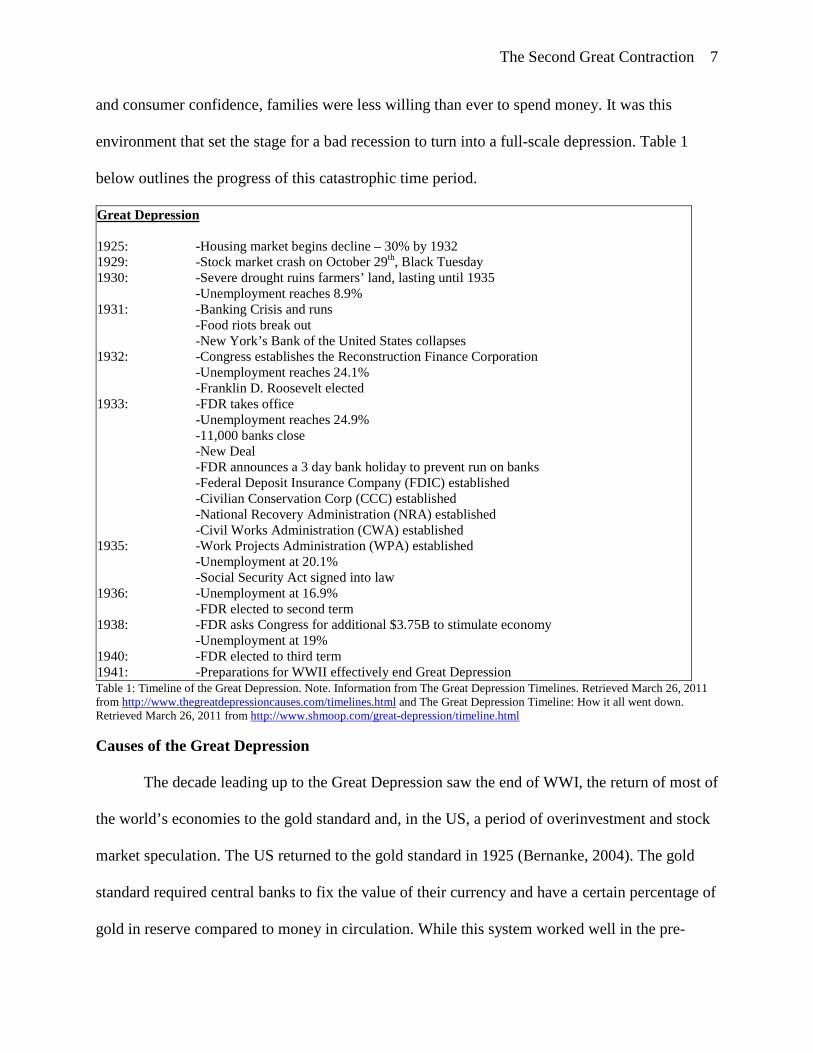
and consumer confidence, families were less willing than ever to spend money. It was this
environment that set the stage for a bad recession to turn into a full-scale depression. Table 1
below outlines the progress of this catastrophic time period.
Great Depression 1925: -Housing market begins decline – 30% by 1932 1929: -Stock market crash on October 29th, Black Tuesday 1930: -Severe drought ruins farmers’ land, lasting until 1935 -Unemployment reaches 8.9% 1931: -Banking Crisis and runs
-Food riots break out -New York’s Bank of the United States collapses 1932: -Congress establishes the Reconstruction Finance Corporation -Unemployment reaches 24.1% -Franklin D. Roosevelt elected 1933: -FDR takes office -Unemployment reaches 24.9% -11,000 banks close -New Deal -FDR announces a 3 day bank holiday to prevent run on banks -Federal Deposit Insurance Company (FDIC) established -Civilian Conservation Corp (CCC) established -National Recovery Administration (NRA) established -Civil Works Administration (CWA) established 1935: -Work Projects Administration (WPA) established -Unemployment at 20.1% -Social Security Act signed into law 1936: -Unemployment at 16.9% -FDR elected to second term 1938: -FDR asks Congress for additional $3.75B to stimulate economy -Unemployment at 19% 1940: -FDR elected to third term 1941: -Preparations for WWII effectively end Great Depression Table 1: Timeline of the Great Depression. Note. Information from The Great Depression Timelines. Retrieved March 26, 2011 from http://www.thegreatdepressioncauses.com/timelines.html and The Great Depression Timeline: How it all went down. Retrieved March 26, 2011 from http://www.shmoop.com/great-depression/timeline.html
Causes of the Great Depression
The decade leading up to the Great Depression saw the end of WWI, the return of most of
the world’s economies to the gold standard and, in the US, a period of overinvestment and stock
market speculation. The US returned to the gold standard in 1925 (Bernanke, 2004). The gold
standard required central banks to fix the value of their currency and have a certain percentage of
gold in reserve compared to money in circulation. While this system worked well in the pre-

The Second Great Contraction 8
WWI period, the world was a very different place after the war. The war caused total economic
destruction in many countries and the banking systems in these countries were highly unstable
(Bernanke, 2004). Additionally, most countries suffered from large government debts caused by
massive spending on the war (Bernanke, 2004). Thus the gold standard in the inter-war period
had a destabilizing effect both in the US and internationally. It forced central banks throughout
the world to use similar monetary policies: if countries did not, gold reserves would flow out of
them into other countries, limiting their ability to lend. Thus, when the US raised its interest rates
in 1928 to fight stock market speculation, many other countries were forced to adopt similar
policies, which weakened the international economy and in turn further weakened the US
economy (Bernanke, 2004). The tightened monetary policy had a particularly detrimental effect
on the already falling real estate industry. Raising interest rates made it more expensive to
borrow money, discouraging would-be homebuyers and making refinancing difficult. With real
estate prices already declining, this aggravated the problem. In this way, monetary policy played
a crucial role in causing the Great Depression.
During the Great Depression, the pricing decrease in the real estate market was a leading
indicator to the crisis. Prices began declining in 1926 and continued to fall by 30% through 1932
(Shiller, 2009). At the time, typical mortgages were short-term liabilities. Typically the term of
the loan was five years, at which point homeowners expected to be able to roll over the mortgage
shortly before it became due (Shiller, 2009). As the monetary policy was tightened in the late
1920s, borrowers were unable to obtain new financing for their mortgages and were forced into
foreclosure or selling their homes (Shiller, 2009). This further exacerbated the downward slump
in housing prices and wiped out many homeowners’ life savings.

The Second Great Contraction 9
The Federal Reserve (the Fed) began to tighten monetary policy in 1928. This was done
largely to slow speculation in the stock, despite the fact that broader economic conditions did not
seem to warrant a slowdown (Bernanke, 2004). At the time, the economy was emerging from a
recession and commodity prices were already beginning to decline. The Fed continued
increasing rates through 1929 and the US monetary base decreased by approximately 6% from
June 1928 to June 1930, despite the fact that gold reserves grew by 10% in this same time
(“Causes of the Great Depression,” n.d.). The Fed’s actions to deflate the speculative bubble
were in direct contrast to the way Allen Greenspan and the Fed reacted during the building real
estate bubble in the early 2000s. By mid-1929, a slow down in economic activity, which began
with the decline in the real estate industry, increase in interest rates, and decrease in money
supply led to the onset of a recession and the eventual stock market collapse, depicted in Figure
2, in October 1929 (Dow Jones Historical Data).
0
50
100
150
200
250
300
350
400
US Dow Jones Industrial 1928-1940
Figure 2: US Dow Jones Industrial 1928-1940. Note. Data adapted from Dow Jones Historical Data. Retrieved March 26, 2011
from http://finance.yahoo.com/q/hp?s=%5EDJI+Historical+Prices.

The Second Great Contraction 10
The crash, along with the already declining real estate market, severely weakened confidence in
the economy and decreased personal wealth, which in turn led to reduced consumption, business
investment, demand, and output, all of which deepened the recession.
In 1931, Great Britain spurred an international panic by abandoning the gold standard. As
the US was facing increased unemployment, decreased demand, and decreased consumer
confidence, central banks and private investors began to convert dollars to gold, depleting gold
reserves and creating a panic in the US banking system (Bernanke, 2004). The US was
experiencing both a literal and figurative run on its banks. During this period nearly half the
banks in the US failed (Bernanke, 2004). At the time, the FDIC and FSLIC were not yet formed:
there was no government insurance for deposits at commercial banks or savings and loans
institutions. Customers had no assurances that the money they had deposited would be available
to them, thus creating a wave of bank runs. Despite the full-scale panic and bank runs, the Fed
did not act to rescue the banks or even make available more credit to the banks, which could
have prevented the severity of the panic. Instead, the Fed focused solely on stabilizing the dollar
by raising interest rates to make the dollar more attractive to investors (Bernanke, 2004). This
action caused a further tightening of the money supply when all other indicators pointed to a
need to provide liquidity to the declining economy and struggling banking sector.
The monetarists, who include Milton Friedman, point to the Federal Reserve’s actions
during this time period as a major cause of the depression and its prolonged nature (“Great
Depression,” n.d.). When the banking panic began, the Federal Reserve should have taken swift
action to inject capital into the banks thus restoring investor confidence and preventing further
bank runs and the continued downward cycle (Bernanke, 2004). However, there was no vehicle
to allow them to do this at the time. It would have been an unprecedented act. The New York

The Second Great Contraction 11
Bank of the United States, a large public bank, was allowed to fail. Had the Fed acted to rescue
some of the high profile institutions, widespread panic may have been avoided and other banks
could have been saved from failure. Instead, by not acting, the Fed saw the money supply
decrease by nearly one-third from 1929-1932 (“Great Depression,” n.d.). This banking crisis and
shrinking money supply resulted in a large-scale credit crunch, which in turn further contributed
to the real estate bust as homeowners were not able to refinance homes and began losing their
largest investment. It is possible that the detrimental results of not acting during the Great
Depression prompted the Fed’s rescue of large institutions during the current crisis. As
mentioned above, this depletion of household wealth had a severe effect on spending habits, thus
further decreasing demand and worsening the downturn.
With the failure of the stock market, massive bank failures, bursting real estate bubble,
and a contracting money supply, the economy faced a severe credit crunch. With less money in
the system, individuals and business could not obtain credit for planned investment and in many
cases could not even renew standing loans. The refinance or creation of new mortgages falls into
this category. With no capacity for lending, the real estate market continued to fall and people
continued to lose their homes. This trend led to an even steeper decline in demand. The US
reliance on the gold standard hindered the Fed’s ability to act against this decline. At the time,
the Fed required a gold reserve of 40% for all notes issued (“Great Depression,” n.d.). During the
period leading up to the Great Depression, that limit was nearly reached. As the banking crisis
unfolded, many people were redeeming their notes, further depleting the gold supply and forcing
a tightening in credit (“Great Depression,” n.d.). The United States eventually abandoned the
gold standard in 1933 primarily for this reason before eventually returning to it in 1946.

The Second Great Contraction 12
Due to many of the reasons mentioned above, effective demand in the economy
collapsed. As seen in Figure 3, Unemployment went from 5% to 25% during the period from
1929 to 1933 (US Historical Unemployment Rate).
0
5
10
15
20
25
30
1929 1930 1931 1932 1933
US Unemployment Rate 1929-1933
Figure 3: US Unemployment Rate 1929-1933. Note. data adapted from US Historical Unemployment Rate, 2011. Retrieved March 25, 2011 fromhttp://data.bls.gov/pdq/SurveyOutputServlet
Many of those who had jobs were only employed part-time. Consumer demand collapsed and
prices collapsed, further deepening the cycle. Falling prices led to more leverage on corporate
balance sheets, meaning companies had less capital available and consequently spent less money.
A severe drought took hold, causing famine and a decline in output. The US experienced dust
bowl conditions from 1930-1936 leading to higher food and commodity prices, and many
farmers losing their property (“Great Depression Causes,” n.d.). Due to the credit crunch,
farmers were unable to obtain loans and began to default on loans they already had. In addition
to defaulting farm loans, the residential real estate market began its decline prior to the 1929
stock market crash. There is still debate today about whether demand-related problems or flawed
monetary policy caused the depression. The most widely accepted theories today cite the
bursting of the stock market and real estate bubbles and demand factors, as the causes of the
recession, which poor monetary policy turned into the Great Depression.

The Second Great Contraction 13
Government Response
The Great Depression has been studied extensively throughout history as economists and
governments try to gain insight on how to react to subsequent crises. Many lessons learned from
the Great Depression are those of what not to do. The first lesson revolves around the Federal
Reserve, monetary policy and the speed with which the monetary side of the equation was
addressed. As discussed above, the tightening of the money supply in 1928-1929 had a severe
impact on the economy. The Federal Reserve’s actions once the crisis had set in are widely
criticized: they not only failed to quickly ease monetary policy but also continued to tighten it by
defending the gold standard (Bernanke, 2004). This is in direct contrast to the Fed’s actions
leading up to today’s crisis in which rates were low for a prolonged period of time, resulting in
cheap credit and excess liquidity. With credit so easy to obtain, institutions and individual
borrowed excessive amounts without thoroughly evaluating risk. Another critical mistake was
the Fed’s failure to make additional credit available to the banks during the onset of the banking
crisis, which further tightened the money supply (Bernanke, 2004). Additionally, after Congress
urged them to adopt a looser monetary environment, the Fed first complied by decreasing the
discount rate, but then backtracked and refused to follow through. Given the deflationary
environment in spite of a decreasing interest rate, the real interest rate remained high and
outstanding debt was effectively increased as the value of the dollar decreased (Bernanke, 2004).
At the same time the government was taking measures that were also counterproductive to a
recovery.
Herbert Hoover, US President 1929-1933, was adamant about balancing the budget
during this time period. In a period where the government should have taken swift measures to
stimulate the economy, promote job creation, and increase demand, Hoover was promoting fiscal

The Second Great Contraction 14
austerity measures, in direct contrast to Keynesian doctrine, which only deepened the problem. It
was not until Franklin Roosevelt, a devoted Keynesian, was elected that progress began to be
made. Roosevelt instituted many reforms based on the Keynesian doctrine that demand created
output (“Keynesian Economics,” n.d.). Keynes held that during a recession the government
should play a central role by creating jobs and increase the money supply, thus increasing
demand (“Keynesian Economics,” n.d.). Additionally, spending should be encouraged and
saving should be discouraged to promote output and get the economy functioning again
(“Keynesian Economics,” n.d.).
Roosevelt instituted a 3-day bank holiday in order to help stem the pain in the banking
system. His New Deal created public works programs, infrastructure investment, and fiscal
stimulus plans (Staiger Memo, 2010a). The New Deal established the following major agencies
(“Great Depression Causes,” n.d.):
• Federal Deposit Insurance Company (FDIC)
o Independent agency of the US federal government that preserves public
confidence in the banking system by insuring deposits.
• Civilian Conservation Corp (CCC)
o Public work relief program for unmarried men from ages 18 to 25 between 1933
and 1942. Provided unskilled labor jobs related to the conservation and
development of natural resources owned by federal, state and local governments.
The program was designed to provide employment for families who had
difficulty finding jobs during the Great Depression. In its nine years it had 2.5
million participants.

The Second Great Contraction 15
• National Recovery Administration
o Established to eliminate cut-throat competition by bringing industry, labor and
government together to create codes of fair practices and set prices. The codes
were intended to reduce destructive competition and to help workers by setting
minimum wages and maximum weekly hours, as well as minimum prices at
which products could be sold. It was ruled unconstitutional in 1935 but it is
credited with the eventual growth and strength of labor unions.
• Civil Works Administration (CWA)
o Created under the Federal Emergency Relief Administration (FERA) to provide
manual labor jobs for the millions of unemployed. Mainly created construction
jobs, improving or constructing buildings and bridges. It ended in 1934 after
spending $200 million a month and providing jobs to approximately four million
people.
• Work Projects Administration (WPA)
o The largest agency, it created millions of jobs to implement public works
projects, including the construction of public buildings and roads, and operated
large arts, drama, media, and literacy projects. Additionally, it fed children and
redistributed food, clothing, and housing. Expenditures for the agency from 1936
to 1939 totaled nearly $7 billion.
All of these initiatives were designed to restore confidence in the economy and the government.
The government also created institutions such as Fannie Mae, the SEC, FHA, and Home Owners
Loan Corporation (HOLC). These institutions significantly improved the way the financial
system and home lending markets functioned. The HOLC changed lending standards from what

The Second Great Contraction 16
had typically been 5-year loans to a new standard of 15-year, fixed-rate, self-amortizing loans.
Additionally, out of this time period came innovative new private sector reforms (Shiller, 2009).
The National Association of Real Estate Boards and the American Institute of Real Estate
Appraisers were formed, changing standards in their respective industries (Shiller, 2009). While
none of these actions was enough to truly pull the US out of the Great Depression, they together
paved the way for a much more stable foundation, which did not experience another crisis nearly
as severe in magnitude until 2007.
Outcome
The impact of the Great Depression was severe and long-lasting. The US did not truly
begin to recover until preparation for WWII began. The decline of the real estate market, which
preceded the crisis, wiped out the savings of a huge portion of the population. The housing
market began to recover in 1934, but no substantial increases were seen until the end of the
decade (Shiller, 2011). Unemployment reached an all-time high in 1933 at 25% and was still at
nearly 19%, non-seasonally adjusted, in 1940 (“Causes of the Great Depression,” n.d.). Nearly
half of all banking institutions failed during this time period. The stock market did not return to
pre-crash levels until the end of 1954, experiencing a decrease of nearly 89% from 1929-1932,
seen in Figure 4 below (Dow Jones Historical Data).

The Second Great Contraction 17
0
50
100
150
200
250
300
350
400
1/1/1929 7/1/1929 1/1/1930 7/1/1930 1/1/1931 7/1/1931 1/1/1932 7/1/1932
Dow Jones Average 1929-1932
Figure 4: Dow Jones Average 1929-1932. Note. data adapted from Dow Jones Historical Data, 2011. Retrieved
March 25, 2011 from http://finance.yahoo.com/q/hp?s=%5EDJI+Historical+Prices.
The innovations of the New Deal, which many argued turned the US into a socialist nation,
started the nation’s recovery process. The lessons central bankers, economists, and the financial
world have learned from this crisis have been utilized to build a more sound financial system and
respond to subsequent crises. New lending practices and real estate standards helped reform and
structure an industry that has a profound effect on the greater economy. The US did not see
another housing downturn equal in magnitude to the Great Depression until the current crisis.
However, as discussed in the remainder of the paper, these lessons were not enough to stop other
severe crises that had similar underlying causes.
Japan’s “Lost Decade”
Macroeconomic Overview
Japan in the 1980s was admired worldwide for its economic prosperity and average
annual GDP growth rate of 3.9% (Saxonhouse & Stern, 2004). The world seemed to be in awe of
the Japanese economic machine. The unemployment rate for Japan was at 2.2%-2.6% for the
entire decade of the 1980s (Japan Historical Unemployment Rate).

The Second Great Contraction 18
1
1.25
1.5
1.75
2
2.25
2.5
2.75
3
Japan Unemployment Rate 1980-1989
Figure 5: Japan Unemployment Rate 1980-1989. Note. data adapted from Japan Historical Unemployment Rate,
2011. Retrieved March 25, 2011 from http://www.bls.gov/fls/flscomparelf/unemployment.htm#table1_1.
In the lead-up to the crisis, equity prices increased six times and land prices increased by four
times (Saxonhouse & Stern, 2004). As inflation expectation increased, with 1989-1991
containing the highest increase of the previous decade, land prices soared as a hedge against
inflation. Economists worldwide argued that the valuations were justified by Japan’s distinct
economic management and high national savings rates (Saxonhouse & Stern, 2004). However,
Japan’s economy was displaying some dangerous warning signals. Japan lowered its discount
rate from 9% in 1980 to 2.5% in 1987, thus making credit cheap and readily available (Japan
Historical Discount Rate). The money supply increased rapidly as easy money became available
and capital flowed into the country from foreign investment. Additionally, with the explosion of
the real estate market and the financial system’s massive exposure to it, any downturn in pricing
was ensured to have a disastrous impact on the overall economy. These factors paved the way for
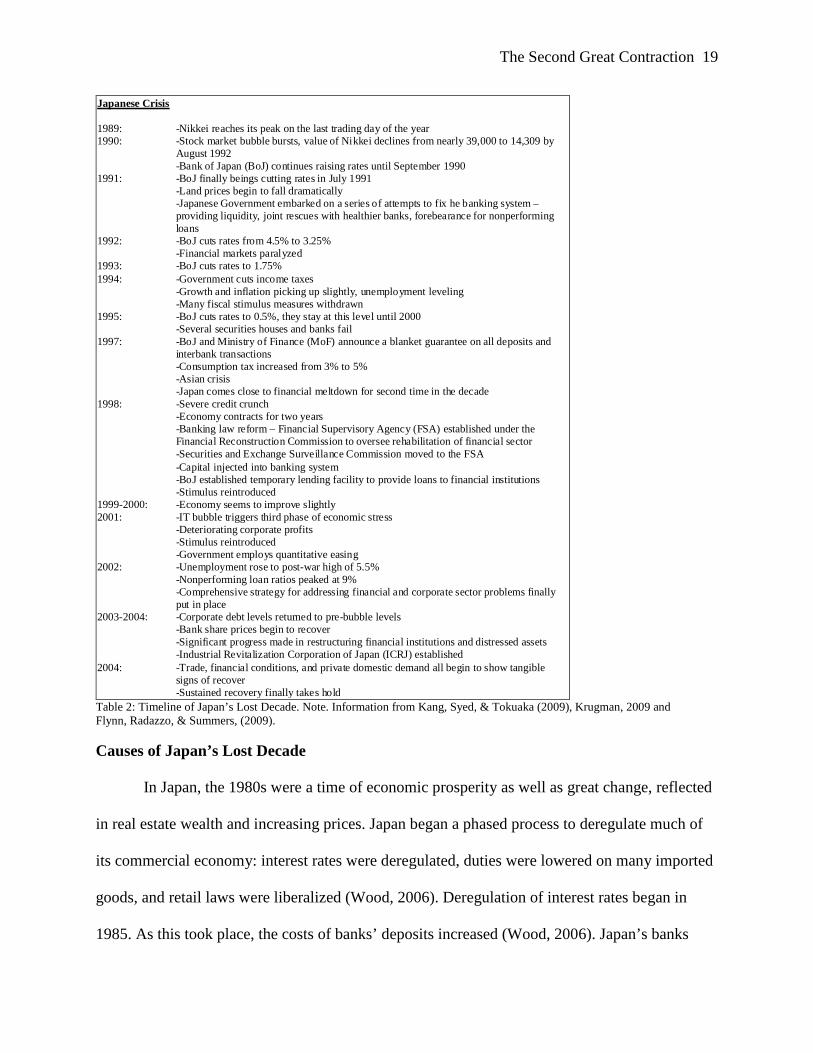
what is now known as Japan’s “Lost Decade.” Table 2 below outlines the timeline of the crisis.
The Second Great Contraction 19
Japanese Crisis 1989: -Nikkei reaches its peak on the last trading day of the year 1990: -Stock market bubble bursts, value of Nikkei declines from nearly 39,000 to 14,309 by
August 1992 -Bank of Japan (BoJ) continues raising rates until September 1990 1991: -BoJ finally beings cutting rates in July 1991 -Land prices begin to fall dramatically -Japanese Government embarked on a series of attempts to fix he banking system –
providing liquidity, joint rescues with healthier banks, forebearance for nonperforming loans
1992: -BoJ cuts rates from 4.5% to 3.25% -Financial markets paralyzed 1993: -BoJ cuts rates to 1.75% 1994: -Government cuts income taxes -Growth and inflation picking up slightly, unemployment leveling -Many fiscal stimulus measures withdrawn 1995: -BoJ cuts rates to 0.5%, they stay at this level until 2000 -Several securities houses and banks fail 1997: -BoJ and Ministry of Finance (MoF) announce a blanket guarantee on all deposits and
interbank transactions -Consumption tax increased from 3% to 5% -Asian crisis -Japan comes close to financial meltdown for second time in the decade 1998: -Severe credit crunch -Economy contracts for two years -Banking law reform – Financial Supervisory Agency (FSA) established under the
Financial Reconstruction Commission to oversee rehabilitation of financial sector -Securities and Exchange Surveillance Commission moved to the FSA -Capital injected into banking system -BoJ established temporary lending facility to provide loans to financial institutions -Stimulus reintroduced 1999-2000: -Economy seems to improve slightly 2001: -IT bubble triggers third phase of economic stress -Deteriorating corporate profits -Stimulus reintroduced -Government employs quantitative easing 2002: -Unemployment rose to post-war high of 5.5% -Nonperforming loan ratios peaked at 9% -Comprehensive strategy for addressing financial and corporate sector problems finally
put in place 2003-2004: -Corporate debt levels returned to pre-bubble levels -Bank share prices begin to recover
-Significant progress made in restructuring financial institutions and distressed assets -Industrial Revitalization Corporation of Japan (ICRJ) established
2004: -Trade, financial conditions, and private domestic demand all begin to show tangible signs of recover -Sustained recovery finally takes hold
Table 2: Timeline of Japan’s Lost Decade. Note. Information from Kang, Syed, & Tokuaka (2009), Krugman, 2009 and Flynn, Radazzo, & Summers, (2009).
Causes of Japan’s Lost Decade
In Japan, the 1980s were a time of economic prosperity as well as great change, reflected
in real estate wealth and increasing prices. Japan began a phased process to deregulate much of
its commercial economy: interest rates were deregulated, duties were lowered on many imported
goods, and retail laws were liberalized (Wood, 2006). Deregulation of interest rates began in
1985. As this took place, the costs of banks’ deposits increased (Wood, 2006). Japan’s banks

The Second Great Contraction 20
faced competition from the international capital markets, which many large corporations began
utilizing more heavily (Wood, 2006). As this trend continued, the banks’ traditional customer
base changed from large corporations to smaller and middle market companies. These companies
traditionally used property as collateral, which set the stage for disaster as the land market
collapsed in the early 1990s. In addition to competing with the capital markets, Japan had a
network of government sponsored institutions which accounted for 25% of the loan market, 33%
of the deposit market, and 40% of the life insurance market (Saxonhouse & Stern, 2004). These
institutions were subsidized by the government and thus could offer loan terms that traditional
banks could not, similar to Fannie Mae and Freddie Mac in the US today. These factors created a
distortion in the banking system. Banks could not compensate for the increasing cost of capital
by charging corresponding higher rates on loans. As a result, they made very little profit and had
no cushion for absorbing losses as loans began to default in the early 1990s.
Japan’s unique business culture played a large factor in its crisis. In Japan, business
relationships are cemented by companies holding large portions of one another’s stocks (Wood,
2006). The corporations very rarely sell these shares because to do so would destroy important
relationships. In this way, large corporations in Japan are insulated from the short-term
fluctuations in the stock market (Wood, 2006). Banks held these shares long-term and the gains
from the shares comprised a large portion of their profits, i.e. gains from investment activities
and not from operating excellence. For example, in 1989, securities gains made up 42% of profit
from Japan’s city banks (Wood, 2006). Banks were allowed to count 45% of their unrealized
gains on securities as capital to meet the reserve requirements of the Basel 1 accord.1 While this
1 The first Basel Accord was established in 1988 to address capital adequacy risk in banks, which operated internationally, based on riskiness of assets held. Assets are categorized into five categories and banks are required to have a maximum of 8% risk weighting. Basel II was established based on today’s crisis and will be implemented by 2015. It builds on Basel I addressing minimum capital requirements, supervisory review, and market risk.

The Second Great Contraction 21
was a blessing for the Japanese banks, which relied heavily on those profits, it also made them
dependent on the Tokyo stock market (Wood, 2006). This dependency works well when the
stock market continues to go up, but when the bubble bursts, as it did in 1990, the banks are
unable to meet the reserve requirements. This outcome forces the banks to both rein in lending as
well as potentially sell assets into an already distressed market, further driving down pricing.
It was a common misconception in the 1980s that the Japanese stock market could never
go down and the price of land could never decline. These beliefs were used to justify the rapid
increase in both of these markets during the decade. The Japanese are particularly vulnerable to
the herd mentality of bubble thinking because of their collectivist culture and discouragement of
individualistic thinking (Wood, 2006). On the last trading day of 1989, the Nikkei reached its
peak at 38,916 (Nikkei Index Historical Data). As Figure 6 below demonstrates, from 1984-
1989, just six years, the value of the Nikkei increased by nearly 300%.
5,000
8,000
11,000
14,000
17,000
20,000
23,000
26,000
29,000
32,000
35,000
38,000
41,000
Nikkei Index 1984-1989
Figure 6: Nikkei Index 1984-1989. Note. data adapted from Nikkei Index Historical Data, 2011. Retrieved March 25, 2011 from from http://finance.yahoo.com/q/hp?s=%5EN225&a=00&b=1&c=1950&d=02&e=24&f=2011&g=m.
This period averaged a 21% annual increase. During this time period, the discount rate decreased
from 5% to 2.5%. The most dramatic increase in the Nikkei in a single year (45%) occurred
during 1986, which also saw the most dramatic decrease in the discount rate from 5% to 3% by

The Second Great Contraction 22
year-end. At its peak, the Nikkei accounted for 42% of the world stock markets versus just 15%
in 1980, and was worth 151% of the country’s GDP versus 29% in 1980 (Wood, 2006). As a
comparison, Japan accounted for only 9.2% or world GDP in 1980 and 9.7% in 1989 (Japan
share of GDP). Despite the fact that nothing in the broader economy would suggest the increase
was supported, the financial world argued that Japan’s unique financial system and expanding
economy justified the prices.
During the same time period, a similar phenomenon was occurring in the land market. By
1990, the height of the land market, land in Japan was valued at $2,000 trillion Yen, which was
five times Japan’s GDP. Given the historical exchange rate, this equated to $13.7 trillion in US
dollars, nearly four times the value of all the United States’ land stock at the time (Wood, 2006).
It was argued that the increase in land prices was justified by four factors;
1)Land is most families’ main asset in Japan,
2)Tokyo dominated the economy and the tight zoning controls meant there would always
be demand for land,
3)Japan was an immobile society, and
4)Tax incentives favored land and discouraged short-term trades (Wood, 2006)
The peculiar inheritance tax in Japan is thought to have contributed to the bubble as well. In
Japan, mortgages are fully deductible from the assessed property value and property is generally
assessed at a steep discount (Saxonhouse & Stern, 2004). Many people would purchase highly
leveraged real estate to create a negative asset value for tax purposes. The effect of this tax
anomaly was similar to what occurred in the US after the 1981 tax law was passed. Before the
subsequent 1986 Tax Relief Act was passed, investors were allowed to offset gains by losses
made on passive investment (i.e. real estate assets). This created a distorted market where real

The Second Great Contraction 23
estate was bought as an income tax hedge rather than for its true value, which inflated prices.
After the 1986 law was passed, losses from passive investments could no longer be used to offset
active income and restored the economic and tax life of an asset. Once passed, the law
significantly reduced the value of a real estate asset bought for this purpose, leading investors to
unload these assets. This wholesale liquidation was a significant contributing factor to the
savings and loan crisis that put an end to the real estate boom of the mid-1980s. As in the US
during the 1980s, the tax in Japan created a distortion and artificial value in the real estate market
that certainly contributed to the rapid increase in land prices.
The main perpetrator of both the stock market and land bubbles, however, was Japan’s
monetary policy in the 1980s. In the 1980s, particularly in the second half of the decade, loose
monetary policy made credit virtually free. In 1980, the discount rate in Japan stood at 9%. The
Bank of Japan (BoJ) continuously cut rates during the decade, reaching 5% by 1985 and 2.5% by
1987, where rates stayed through 1989 (Japan Historical Discount Rate). A similar pattern can be
observed in the United States’ and Bank of England’s discount rates from 2001-2004, leading up
to today’s crisis, as demonstrated in the Figure 7 below.
0.0
1.0
2.0
3.0
4.0
5.0
6.0
7.0
Japan, US, and Bank of England Discount Rates
Japan Discount Rate 1985-1988 US Discount Rate 2001-2004 Bank of England Rate 2001-2004
Figure 7: Japan, US, and Bank of England Discount Rates. Note. data adapted from Japan Historical Discount Rate, 2011. Retrieved March 25, 2011 from http://www.stat-search.boj.or.jp/ssi/cgi-bin/famecgi2?cgi=$ap181g3f_en; US Historical Discount Rate, 2011. Retrieved March 25, 2011 from http://www.federalreserve.gov/releases/h15/data/Monthly/H15_FF_O.txt; Bank of England Historical Discount Rate, 2011. Retrieved April 6, 2011 from http://www.bankofengland.co.uk/mfsd/iadb/index.asp.

The Second Great Contraction 24
The availability of cheap credit fueled the asset price bubble by creating unsustainable credit
expansion (Flynn, Radazzo, & Summers, 2009). Cheap credit, in combination with the belief that
both the stock market and land values could never fall, led to risky lending practices and
skyrocketing levels of debt, most of which were backed by property as collateral. In 1990,
shortly after the stock market began its descent, BoJ finally began raising interest rates in an
effort to deflate the bubble. By this point, the bubbles had already become too large, and in 1991,
land prices began to decline significantly (Krugman, 2009). As the stock market and land
bubbles burst, the effects were disastrous for the Japanese financial system. Most institutions
attempted to hide problems and were slow to acknowledge the massive nonperforming loan
problem created by the bursting of the bubbles. Because the financial system was so exposed to
significantly overvalued and highly leveraged real estate loans, the bursting real estate bubble
was particularly devastating. Mounting losses on failed real estate loans and falling prices
severely damaged the balance sheets of most financial institutions and eventually led to both a
wave of bank and financial firm failures and a large-scale credit crunch (Kang, Syed, &Tokuaka,
2009). The depletion of wealth limited access to credit, and a fall in consumer confidence led to
decreased demand, deflation, and a stagnant economy. Deflation was detrimental to companies’
already damaged balance sheets because it increased the burden of their debt as the value of the
yen fell. Additionally, it is hard for companies to cut wages to correspond with falling prices,
decreasing profit margins. These factors caused Japan to fall into a decade-long recession.
Despite the fact that interest rates were low, a condition that usually encourages people to spend
because they are not earning a meaningful rate on their savings, Japan has a high household
savings rate. The Japanese public did not respond to interest rates and continued to keep their
money out of the markets.

The Second Great Contraction 25
Government Response
Japan’s road to recovery can be characterized by three separate periods as depicted in
Figure 8 below: (Kang et al., 2009).
1991 1992 1993 1994 1995 1996 1997 1998 1999 2000 2001 2002 2003
Initial onset of crisis, government intervention, partial recovery, Asian Crisis sends economy back into crisis
Near financial meltdown, another round of government intervention
Further economic deterioration, conditional government intervention, sustained recovery
Figure 8: Three Stages of Japan’s “Lost Decade.”
initial onset – 1990-1997.
During the first period, 1990-1997, the initial onset of the crisis, the government response
was somewhat erratic. After raising interest rates five times between 1989 and1990 to 6%, the
BoJ cut rates to 4.5% in 1991, to 3.25% in 1992, to 1.75% in 1993-1994, and finally to 0.5% in
1995, where it stayed until 2000 (Flynn et al., 2009). This action had little effect on the economy.
To stimulate demand, the consumption tax was reduced to 3%, but later increased again to 5%
(Kang et al., 2009). The inconsistent policies of the government contributed to preventing a
sustained recovery from taking place, thus prolonging the crisis. As an interesting parallel, Ben
Bernanke was an advisor to Japan during this time period, perhaps learning lessons about what
not to do during the current crisis.
In Japan, the initial onset of the crisis was relatively muted. Japan, which had enjoyed
GDP growth near 4% for the previous two decades, saw its growth fall to 1.5% and its
unemployment rate rise (Kang, et al., 2009). Because of the business and political culture of the
country, the government was slow to acknowledge the problem, especially with regards to
nonperforming loans. The government’s initial tendency towards forbearance was costly and
The Second Great Contraction 26
reflected not only the business climate but also a lack of understanding of the extent of the
nonperforming loan problem (Kang et al., 2009). Additionally, given the public’s support of
bank bailouts, it was nearly impossible politically for much of the early ‘90s for the government
to intervene. As land prices continued to fall, the bad loan problem increased, further weakening
the balance sheets of financial institutions. The government’s penchant for forbearance resulted
in the banks not being incentivized to address the problem and begin the much-needed
restructuring process.
In the early stages of the crisis, Japan used a number of fiscal stimulus packages. These
packages focused on public works, credit help for small and medium sized entities, tax cuts and
employment support (Kang et al., 2009). The fiscal stimulus packages were not used effectively
and did little to stimulate private sector spending, thus limiting their effect on the economy. Due
to the weak balance sheets of most lending institutions, private companies were not able to
obtain funds to carry out investment plans. Additionally, most corporations were also heavily in
debt and needed to deleverage rather than increase spending (Kang et al., 2009). As a result, the
fiscal stimulus only succeeded in increasing government debt.
Despite this turn of events, in the early part of the decade, most people still expected the
economy to recover relatively quickly. In 1994, growth and inflation saw a small uptick and the
stock market experienced a small rally (Kang et al., 2009). In response the government pulled
back on fiscal stimulus, as well as increasing the consumption tax from 3% to 5% in 1997. The
pullback in government support of the economy, in combination with the Asian Crisis, which
struck in 1997, sent the economy back into a tailspin (Kang et al., 2009). Had Japan not pulled
back its fiscal measures, it may have prevented the prolonged nature of its crisis.
The Second Great Contraction 27
It seems the US has learned from this mistake. Even as the US economy showed signs of
a timid recovery in 2010, the government did not back off monetary stimulus. Instead, they
instituted a second round of quantitative easing (QE2) where the Fed pledged to purchase large
amounts of long-term Treasury bonds. The goal of this purchase was to push the yields on
Treasuries and bonds down, thus prompting investors to put their money elsewhere and increase
the risk appetite, stimulating demand, and making it easier for homeowners to refinance
mortgages at lower rates (Reddy, 2010).
renewed turmoil 1997-2000.
The second period of crisis, 1997-2000, pushed Japan’s economy to the brink of a full-
scale financial meltdown (Kang et al., 2009). The already weakened banking system, burdened
with an increasing bad loan problem, could not withstand the external shock from the Asia
Crisis, and a massive wave of bank failures ensued. At this point, the BoJ was forced to act and
provide liquidity to the financial markets. The BoJ responded by loaning large amounts of
money to businesses and financial institutions but with no requirements to address the underlying
problems (Flynn et al., 2009). As a result, money went to poorly managed firms and problems
continued to plague the system. Japan experienced a severe liquidity trap and its economy
contracted in 1998-1999, the first time this had happened since the 1970s (Kang et al., 2009). A
liquidity trap happens when the short-term nominal interest rate is at or near zero, and it is
argued that at this point monetary policy has little effect on the economy. In response to the
contracting economy, fiscal stimulus was reintroduced and more money was injected into the
banking system. By 2000, it again looked like the economy was beginning to show signs of
recovery (Kang et al., 2009). When the IT bubble burst in March 2000, however, Japan was sent
into renewed turmoil.

The Second Great Contraction 28
sustained recovery – 2001-2003.
From 2001-2003, Japan experienced the third phase of economic deterioration, which
was eventually followed by a more sustained recovery (Kang et al., 2009). The bursting of the IT
bubble caused corporate profits to deteriorate and placed added stress on the weak financial
sector, which was still suffering from the real estate crash. Again, stimulus was reintroduced, but
this time public funds came with conditions. Banks were required to write down equity and
produce a plan to dispose of problem assets and loans. Conditioning access to funds provided the
proper incentives to institutions to finally restructure, clean up balance sheets, and increase
capital ratios (Kang et al., 2009). As banks restructured, the private sector was prompted to
similarly deleverage. New bankruptcy laws and improved accounting framework helped private
sector firms restructure. The United States has far superior framework, which should help the
recovery process during the current crisis. In 2003, the Industrial Revitalization Corporation of
Japan (IRCJ) and the Resolution and Collection Corporation (RCC) were established. These
institutions performed a similar function as the Resolution Trust Corporation in the US during
the late-1980s formed as a response to the Savings and Loan crisis. The IRCJ purchased
distressed loans from banks and worked with creditors to restructure. The RCC was a similar
institution and was in charge of restructuring and disposing of nonperforming loans. Through
these institutions, the government was able to take these assets off the balance sheets of banks
(Kang et al., 2009). Getting the toxic assets off the balance sheets of financial institutions helped
banks focus on restructuring their business and underwriting new loans, while the IRCJ focused
on efficiently disposing of the problems. With the injection of nearly $47 trillion yen, equivalent
to $409.6 billion US dollars, used to restructure and dispose of bad loans, bank share prices
began to stabilize in 2003 (Kang et al., 2009).
The Second Great Contraction 29
During this time period, Japan also instituted quantitative easing measures. The BoJ
began increasing its purchase of long-term government bonds and eventually began purchasing
commercial paper, corporate bonds, equities, and asset-back securities as a means of injecting
liquidity into the economy (Kang et al., 2009). In combination with the restructuring of the
banking system and the renewed health of corporations, private sector demand finally began to
increase, which allowed Japan to finally achieve a sustained recovery. From 2003 to 2007, Japan
enjoyed an average annual growth of 2%, a rate that, while nowhere near the growth rate of the
1980s, was healthy and sustainable (Kang et al., 2009).
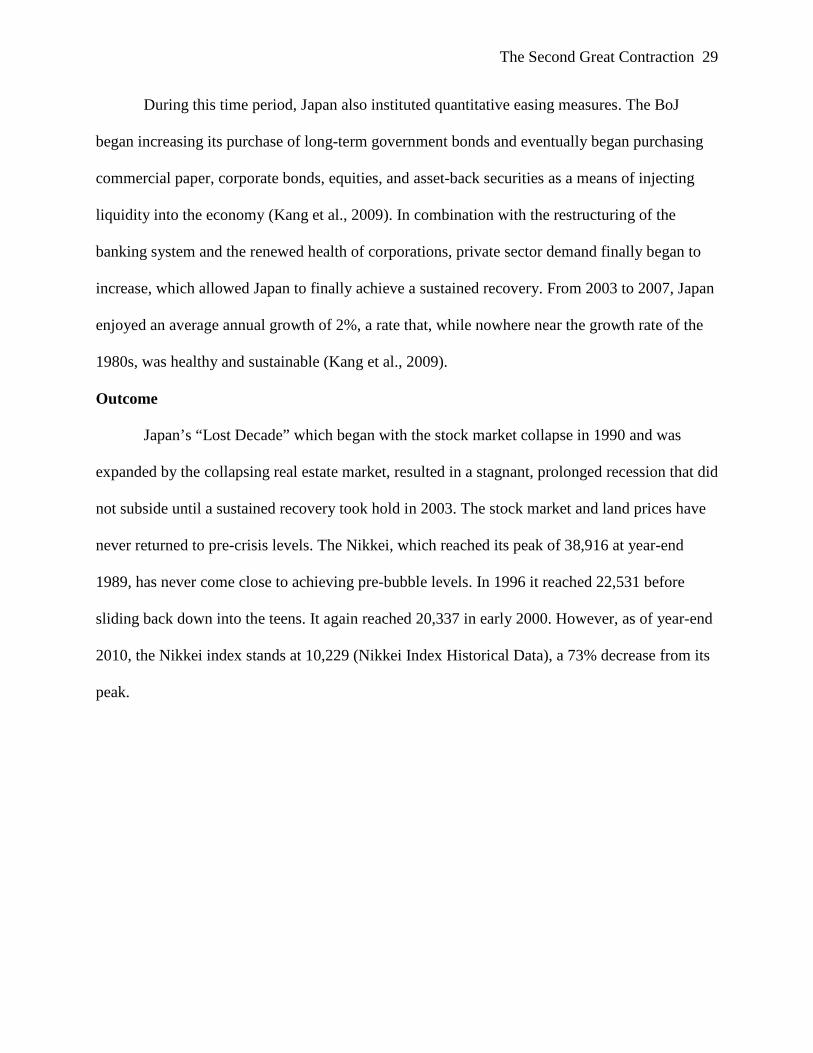
Outcome
Japan’s “Lost Decade” which began with the stock market collapse in 1990 and was
expanded by the collapsing real estate market, resulted in a stagnant, prolonged recession that did
not subside until a sustained recovery took hold in 2003. The stock market and land prices have
never returned to pre-crisis levels. The Nikkei, which reached its peak of 38,916 at year-end
1989, has never come close to achieving pre-bubble levels. In 1996 it reached 22,531 before
sliding back down into the teens. It again reached 20,337 in early 2000. However, as of year-end
2010, the Nikkei index stands at 10,229 (Nikkei Index Historical Data), a 73% decrease from its
peak.

The Second Great Contraction 30
5,000
7,000
9,000
11,000
13,000
15,000
17,000
19,000
21,000
23,000
25,000
Nikkei Index 1991-2010
Figure 9: Nikkei Index 1991-2010. Note. data adapted from Nikkei Index Historical Data. Retrieved March 25, 2011 from http://finance.yahoo.com/q/hp?s=%5EN225&a=00&b=1&c=1950&d=02&e=24&f=2011&g=m.
This decrease speaks to the volume of irrational pricing during the bubble years. Land prices
have never since reached the exorbitant levels they did during the bubble. It was particularly hard
to observe the actual decline in pricing in the real estate market in Japan: as prices began to
decline, very few transactions took place. As a result, the assessor’s office simply stated there
was no change in pricing. In addition, those transactions that did take place were generally inside
deals where a price that was “acceptable” to the politics of the time was announced. In other
words, the official announcement did not reflect a serious decrease in value, so the actual decline
in the real estate market did not have to be acknowledged (Wood, 2006). A report released at the
end of 1991 indicated that genuine bids for office buildings in Tokyo and Osaka were already
down 30-50% (Wood, 2006). Additionally, reports indicated that residential prices in Tokyo
were down 37% and land for residential development was down 41% (Wood, 2006). With 1991
being the beginning of the decline in the real estate market, overall price declines were likely
much more substantial. It can be argued that prices may never reach peak values again absent
another episode of aggressive, risky lending practices.
The Second Great Contraction 31
The duration of Japan’s crisis can largely be blamed on a failure to recognize and address
the problem, as well as a series of policy mistakes. It was not until Japan began to address the
problems causing the weakness in the financial system by instituting regulatory reforms that a
sustained recovery was able to take place. Growth rates in Japan have never come close to the
pre-bubble average of nearly 4% per annum. Growth rates following the 2003 recovery average
approximately 2% per year (Makin, 2008). Unfortunately, as of 2008, Japan, like the rest of the
world, is experiencing the pain of the global economic crisis. With Japan’s discount rate
remaining at 0.5% after the recovery, if today’s recession proves to be a deep one, Japan has very
few monetary tools left to use and could end up back where it started (Krugman, 2009).
The Second Great Contraction
Macroeconomic Overview
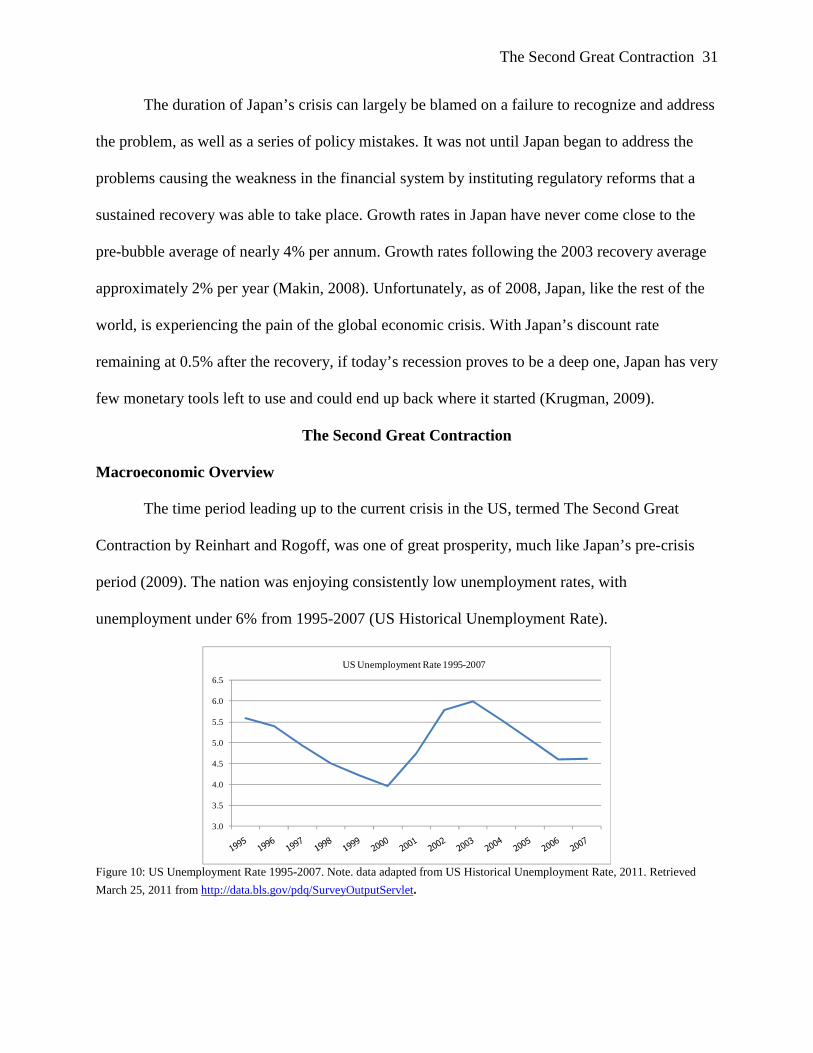
The time period leading up to the current crisis in the US, termed The Second Great
Contraction by Reinhart and Rogoff, was one of great prosperity, much like Japan’s pre-crisis
period (2009). The nation was enjoying consistently low unemployment rates, with
unemployment under 6% from 1995-2007 (US Historical Unemployment Rate).
3.0
3.5
4.0
4.5
5.0
5.5
6.0
6.5
US Unemployment Rate 1995-2007
Figure 10: US Unemployment Rate 1995-2007. Note. data adapted from US Historical Unemployment Rate, 2011. Retrieved
March 25, 2011 from http://data.bls.gov/pdq/SurveyOutputServlet.

The Second Great Contraction 32
Capital was readily available and the Federal Reserve kept the discount rate low, dropping it to
1.25% at year-end 2001. The events of September 11th, and the economic turmoil in the
aftermath, were a major contributing factor for the Fed’s rate cuts. The rates were kept below 2%
through the beginning of 2005 when it was raised to 2.25% (US Historical Discount Rate). The
money supply in the US increased by 26% from 2000-2007 (US Historical Money Supply). With
the availability of cheap credit and the government’s focus on increasing homeownership levels,
the housing market took off. Fueled by exotic mortgages, which facilitated lower initial
payments, individuals purchased larger houses with larger associated mortgages. Additionally,
many countries, particularly China, had huge trade surpluses and thus money to invest. Much of
that capital flowed into the US, further fueling real estate and stock market pricing. During the
period 2000-2007, housing prices increased by 61%, based on the Case/Shiller Housing Price
Index, which tracks pricing in 20 major MSAs for the United States. These factors created the
environment that facilitated the real estate bubble and eventually led to the crisis the United
States, as well as the global economy, is now facing. Table 3 below shows the progression of the
crisis.

The Second Great Contraction 33
Current US Crisis
2005-2006: -Housing prices begin to decline 2007: -Housing downturn accelerates -April ’07 – New Century (largest subprime lender) files for bankruptcy -July ’07 – Bear Stearns announces 2 of its funds are filing for bankruptcy
-August ’07 – Subprime problems become global – France’s BNP Paribas announces it cannot value assets in 3 of its funds and restricts withdrawals from those funds -August ’07 – Central banks around the world coordinate to inject liquidity into the credit markets -September ’07 – Northern Rock, a British Bank, requests emergency funds and a run on its deposits begins -September ’07 – US Federal Reserve slashes rates from 5.25% to 4.75%, by Nov. 2008, rates are down to 1% and by Dec. 2008 they are at 0.25% where they remain -October ’07 – Dow Jones peaks at 14,164, by Feb. 2009 it falls to 6,500
2008: -January ’08 – Real estate fears mount – data shows 2007 experienced the largest one year decrease in over 25 years
-March ’08 – Bear Stearns bailout -September ’08 – US government announces it will take control of Fannie Mae and
Freddie Mac September ’08 – Lehman Brothers collapses, Bank of America buys Merrill Lynch, AIG
is downgraded and Federal Reserve loans them $85B -September ’08 – TARP is announce -September ’08 – Goldman Sachs and Morgan Stanley convert to bank status -September ’08 – More bank failures and Wells Fargo buys Wachovia -October ’08 – Federal Reserves makes $900B available to banks for short-term lending
and $1.3T available to non-financial institutions -November ’08 – Unemployment surges, up to 8.5% by Feb. 2009 2009: -January ’09 – Obama takes office -February ’09 – Obama signs $787B stimulus into law -June ’09 – Financial regulation plan developed -includes higher capital and liquidity requirements for banks -new reporting requirements for issuers of asset-backed securities -October ’09 – Greece reveals sovereign debt problems -November ’09 – Dubai reveals sovereign debt problems 2010: -May ’10 – IMF and EU agree to $955B rescue plan for fiscally risky eurozone countries -July ’10 – US financial overhaul -new powers to regulate Wall Street -FDIC gains power to seize and dismantle troubled firms -proprietary trading is banned
-limits placed on scope of banks’ investments in hedge funds and private equity funds
-requires most derivatives to be traded through public clearing houses Table 3: Timeline of the Second Great Contraction. Note. information from Timeline: Global Economy in Crisis, n.d. Retrieved March 26, 2011 from http://www.cfr.org/economics/timeline-global-economy-crisis/p18709.
Causes of the Second Great Contraction
In the period leading up to the current crisis, the US was enjoying an environment of low
interest rates and record levels of capital inflow from abroad. Interest rates were kept low after
The Second Great Contraction 34
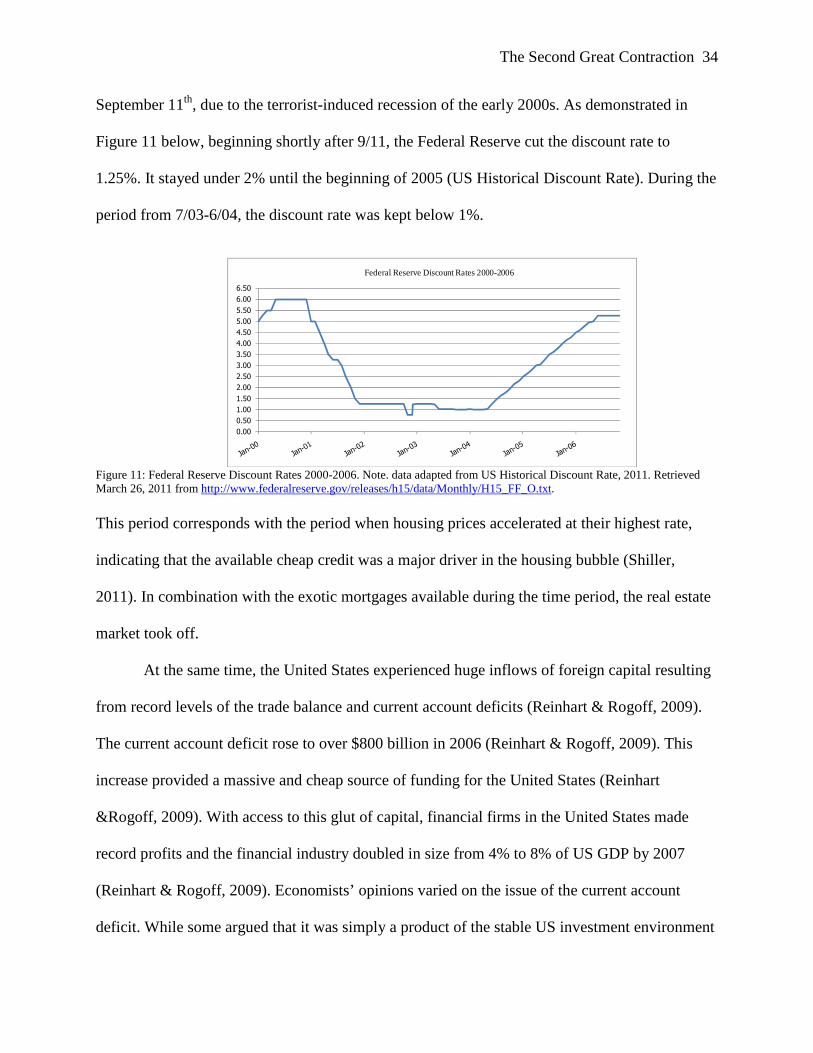
September 11th, due to the terrorist-induced recession of the early 2000s. As demonstrated in
Figure 11 below, beginning shortly after 9/11, the Federal Reserve cut the discount rate to
1.25%. It stayed under 2% until the beginning of 2005 (US Historical Discount Rate). During the
period from 7/03-6/04, the discount rate was kept below 1%.
0.00
0.50
1.00
1.50
2.00
2.50
3.00
3.50
4.00
4.50
5.00
5.50
6.00
6.50
Federal Reserve Discount Rates 2000-2006
Figure 11: Federal Reserve Discount Rates 2000-2006. Note. data adapted from US Historical Discount Rate, 2011. Retrieved March 26, 2011 from http://www.federalreserve.gov/releases/h15/data/Monthly/H15_FF_O.txt.
This period corresponds with the period when housing prices accelerated at their highest rate,
indicating that the available cheap credit was a major driver in the housing bubble (Shiller,
2011). In combination with the exotic mortgages available during the time period, the real estate
market took off.
At the same time, the United States experienced huge inflows of foreign capital resulting
from record levels of the trade balance and current account deficits (Reinhart & Rogoff, 2009).
The current account deficit rose to over $800 billion in 2006 (Reinhart & Rogoff, 2009). This
increase provided a massive and cheap source of funding for the United States (Reinhart
&Rogoff, 2009). With access to this glut of capital, financial firms in the United States made
record profits and the financial industry doubled in size from 4% to 8% of US GDP by 2007
(Reinhart & Rogoff, 2009). Economists’ opinions varied on the issue of the current account
deficit. While some argued that it was simply a product of the stable US investment environment

The Second Great Contraction 35
and innovations in the financial environment, others saw the US’s excessive borrowing as
unsustainable. As it turned out, the latter perspective was correct.
Thanks to the massive amount of cheap capital, the US saw rapid increases in both the
stock market and the real estate market. Fueled by access to this capital, the US stock market
increased 50% between 1999 and its peak at 13,930 in October 2007 (Dow Jones Historical
Data).
6,000
7,000
8,000
9,000
10,000
11,000
12,000
13,000
14,000
15,000
Dow Jones 1999-2007
Figure 12: Dow Jones 1999-2007. Note. data adapted from Dow Jones Historical Data, 2001. Retrieved March 25, 2011 from http://finance.yahoo.com/q/hp?s=%5EDJI+Historical+Prices . The biggest increases took place in 2003 and 2006 at 32% and 15%, respectively. By 2008, the
crisis had fully set in and the stock market saw a decrease of 28% in 2008 alone. As in Japan,
there was nothing in the underlying economic fundamentals that justified the rapid increase in
stock market values or the corresponding increase in the housing market. This lack of
explanation should have been a glaring warning sign as it signaled a disconnect in the economy
and closely resembled events leading to the Great Depression and Japan’s “Lost Decade.”
During this time, the housing market saw an even more drastic increase in values than the
stock market. From 2000 through the first quarter of 2006, when the housing market reached its
peak, housing prices increased by 61%.

The Second Great Contraction 36
100
125
150
175
200
225
Shiller Housing Price Index 2000-2006
Figure 13: Shiller Housing Price Index 2000-2006. data adapted from Shiller Historical Home Price Index, 2011. Retrieved
March, 25, 2011 from http://www.econ.yale.edu/~shiller/data.htm.
Housing prices increased by an average of 6% per year from 2000 to 2005, with the largest
increases in 2003 and 2004 at 7% and 8%, respectively (Shiller, 2011). This was unprecedented
growth as the real estate market only increased by 16% total from 1950-2000 (Shiller, 2011).
The real estate market began declining after the first quarter of 2006, slowly at first, only
decreasing by approximately 3% in 2006. However, prices declined by an additional 25% during
2007 and 2008. While 2009 saw a slight uptick with prices increasing by 2%, prices began
declining again in 2010 (Shiller, 2011). How large the peak-to-trough decline will be remains to
be seen. The extreme nature of both the bubbles meant that when they burst, the repercussions
were severe.
The bubbles, in particular the real estate bubble, were fueled not only by easy money but
also by a change in the financial and regulatory environment. During the late 1990s and into the
2000s, a new push to make homeownership more widely achievable began to change lending
standards and public attitude towards housing. Household debt skyrocketed as families financed
their lifestyles with cheap credit. Between January 2001 and January 2007, consumer credit
increased by 55% (US Consumer Credit).

The Second Great Contraction 37
1,250,000
1,500,000
1,750,000
2,000,000
2,250,000
2,500,000
US Consumer Credit 2000-2007 ($billions)
Figure 14: US Consumer Credit 2000-2007. Note. data adapted from US Consumer Credit, 2011. Retrieved April 9, 2011 from http://www.federalreserve.gov/releases/g19/current/g19.htm.
As real estate prices increased, many people refinanced their homes by taking out cash and
increasing debt. In addition to refinancing, many people took out Home Equity Lines of Credit
(HELOC), which allowed them to draw down money up to a certain limit using their house as
collateral. As of July 2010, Equifax estimated there were 13.2 million HELOCs outstanding,
witch equated to $649 billion in debt. This is after banks reduced available credit under HELOCs
by $122 billion between 2008 and 2010. As debt levels increased, any drop in pricing meant
people would have very little equity left and a reduced incentive to keep paying their mortgage.
The ratio of household debt to GDP, which has historically averaged around 80%, increased to
130% by 2006 (Reinhart & Rogoff, 2009).
The increase in focus on homeownership led to a significant increase in subprime
lending. There are several different types of loan classifications. A prime loan is a high-quality
mortgage that is eligible for securitization in the secondary market with a Borrower who
typically has good credit scores and a monthly income three to four times their mortgage
expense. An Alt-A classification falls between a prime mortgage and subprime mortgage. These
mortgages are generally with Borrowers who have a clean credit history but may have a higher
risk profile due to an increased loan to value or debt to income ration. The most risky mortgage,

The Second Great Contraction 38
Subprime, is generally a loan made to someone who would not normally qualify for a mortgage
due to a low credit score, lack of assets, or bad credit history. Many subprime loans were
originated as adjustable rate mortgages with initial teaser periods, which offered very low rates.
The push to increase homeownership and the extremely low rates available prompted many
people who would traditionally not be able to afford a home to jump at the opportunity.
Unfortunately, a significant portion of those who entered into these loans were less sophisticated
buyers who, after the initial rates expired, found themselves unable to pay their mortgages.
Additionally, many of these loans required very little money down, meaning even very slight
decreases in the real estate market would put the buyer under water. This trend was further
embedded at the height of the market with the passing of the Expanding American
Homeownership Act passed in 2006. This eliminated the 3% minimum down payment
requirement, increased the loan limit, and increased the term from 35 to 40 years for loans
insured by the Federal Housing Administration (FHA). The goal was to further increase
homeownership levels and allow access to limited down payment mortgages to more individuals.
This new market, in combination with the expanding securitization market, drastically changed
the lending environment.
Traditionally, only prime mortgages were securitized. Securitization converts a portfolio
of raw assets or financial obligations into liquid, tradable units. The portfolio is divided into
tranches paying different rates and the cash flows are rearranged to allow for different risk
profiles for each tranche of the securitization. Figure 15 is a depiction of a simple securitization
structure.

The Second Great Contraction 39
Figure 15: Securitization Diagram. Note. adapted from Staiger, 2011.
With the creation of the Collateral Debt Obligations (CDOs), Alt- A and Subprime mortgages
could now be securitized as well. By creating different tranches in the securitization vehicle, the
top tranches could be rated AAA even though they included these riskier types of collateral.
Investors were drawn to these assets because they offered higher rates of return at a seemingly
low level of risk. At the peak, asset-backed securities were valued at $1.2 trillion (Krugman,
2009). The complex nature of these financial instruments, along with others invented during the
most recent boom, created an environment where it was difficult for even the financial
institutions who issued these assets to assess the associated risk. Additionally, if there were
problems, it was nearly impossible to work out any of the loans that were part of these
securitized vehicles.
Securitization was not limited to the residential real estate market. With the creation of
Commercial Mortgage Backed Securities (CMBS), issued by the shadow banking system, the
commercial real estate world experienced a similar real estate boom fueled by similar
characteristics of cheap debt and changing lending standards. The shadow banking system,
primarily non-commercial banks, played a lead role in the rise of securitization, increase of
complex financial instruments, and higher risk lending practices. At its peak in early 2007, the

The Second Great Contraction 40
assets of the five major investment banks totaled approximately $4 trillion, while the assets of
the five major commercial banks totaled $6 trillion (Krugman, 2009). The shadow banking
sector was not a minor player. By nature, these institutions have more risk as they take on higher
leverage, are much less regulated than conventional banks, and take on long-term illiquid assets
that they finance with short-term liabilities. These institutions do not enjoy the protections of
deposit insurance that commercial banks have to reduce risk (Krugman, 2009). These institutions
were the pioneers in securitization. As the securitization market exploded, lending standards
were significantly relaxed. Issuers had very little incentive to ensure prudent underwriting
standards because they would immediately sell the mortgage rather than hold it on their balance
sheet. Issuers shouldered very little risk and were incentivized by volume. Fannie Mae and
Freddie Mac played a large role as well as they were large issuers of mortgage-backed securities.
They both sold mortgage-backed securities to investors and held a large portfolio of mortgage
securities. In 2006, Freddie and Fannie accounted for more than 40% of MBS originated.
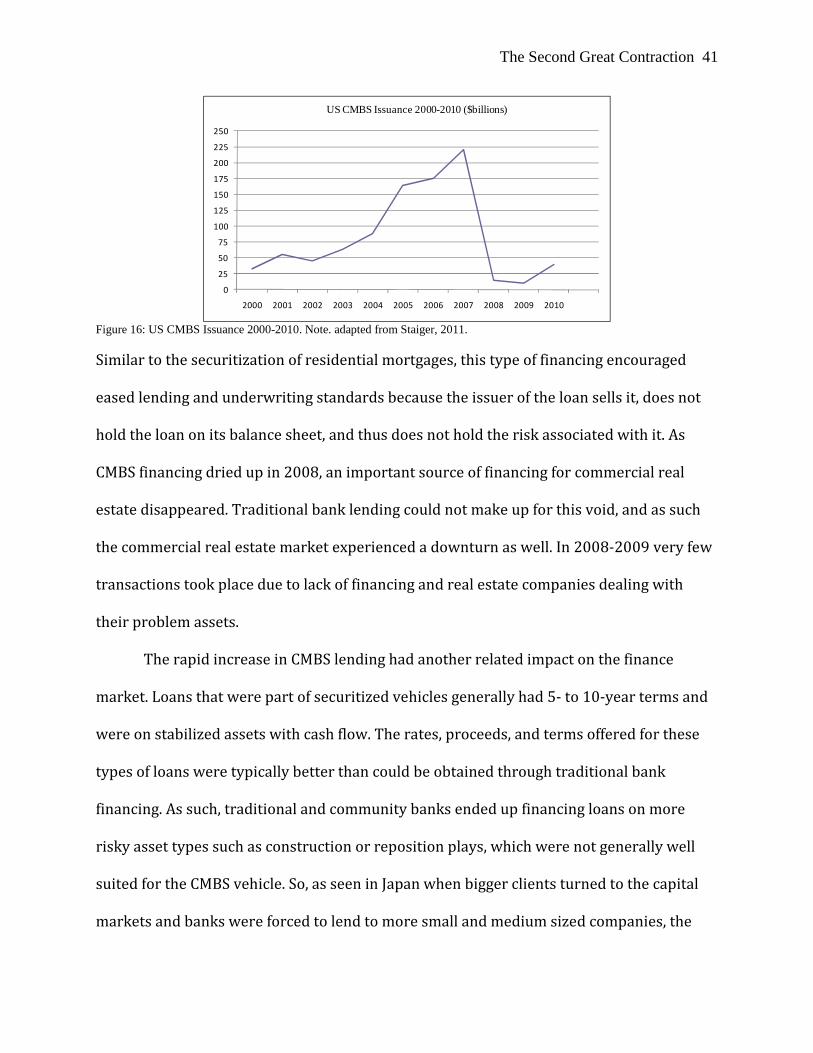
The CMBS market played a significant role in the increasing prices in the commercial
real estate market. At its peak in 2007, $2.2 billion of CMBS were issued (Staiger, 2011). Figure
16 below shows how the market for this type of financing exploded during the boom years and
has now virtually disappeared.
The Second Great Contraction 41
0
25
50
75
100
125
150
175
200
225
250
2000 2001 2002 2003 2004 2005 2006 2007 2008 2009 2010
US CMBS Issuance 2000-2010 ($billions)
Figure 16: US CMBS Issuance 2000-2010. Note. adapted from Staiger, 2011.
Similar to the securitization of residential mortgages, this type of financing encouraged
eased lending and underwriting standards because the issuer of the loan sells it, does not
hold the loan on its balance sheet, and thus does not hold the risk associated with it. As
CMBS financing dried up in 2008, an important source of financing for commercial real
estate disappeared. Traditional bank lending could not make up for this void, and as such
the commercial real estate market experienced a downturn as well. In 2008-2009 very few
transactions took place due to lack of financing and real estate companies dealing with
their problem assets.
The rapid increase in CMBS lending had another related impact on the finance
market. Loans that were part of securitized vehicles generally had 5- to 10-year terms and
were on stabilized assets with cash flow. The rates, proceeds, and terms offered for these
types of loans were typically better than could be obtained through traditional bank
financing. As such, traditional and community banks ended up financing loans on more
risky asset types such as construction or reposition plays, which were not generally well
suited for the CMBS vehicle. So, as seen in Japan when bigger clients turned to the capital
markets and banks were forced to lend to more small and medium sized companies, the

The Second Great Contraction 42
community banks in the US were more highly exposed to a riskier product when the
downturn inevitably came.
The new mortgage types and relaxed lending standards were a recipe for disaster. When
the real estate market began to decline in 2006, default rates on subprime mortgages began
increasing and payments on asset-backed securities and CDO’s that these mortgages were part of
were not able to make payments on all levels of debt. As these assets were highly leveraged,
even a small decline in pricing could cause massive defaults. In 2007, a hedge Fund in France,
BNP Paribas, suspended withdrawals from three of its funds (Krugman, 2009). This suspension
essentially signaled the beginning of the financial crisis. As housing prices continued to fall,
default rates increased and losses were taken on many securities. In addition, due to the
complexity of these instruments, it was particularly difficult to restructure loans that were in
trouble. In early 2007, as junior shares of CDOs began to default, subprime lending stalled, as
there were no buyers for junior shares (Krugman, 2009). As this source of financing disappeared,
an important part of real estate demand disappeared as well, reinforcing the slump in real estate
pricing (Krugman, 2009).
With important sources of financing disappearing, a void was left in the credit market.
Asset-backed securities all but vanished, a $1.2 trillion market, and bank lending did not make
up the difference (Krugman, 2009). By October 2008, financing for consumers was contracting
as well, with limits on credit cards being decreased and applicants being turned down (Krugman,
2009). As defaults continued mounting in the financial system, the shadow banking world, with
its extremely high leverage ratios, saw its balance sheets deteriorate significantly. When
investors lost confidence and threatened to pull money out of certain market segments, firms
were forced to liquidate assets, which further decreased asset values across a variety of asset
The Second Great Contraction 43
classes and became a self-fulfilling cycle. Additionally, the $400 billion SIV market became
illiquid. A large portion of these vehicles’ assets were mortgage-backed securities. As the real
estate market began to drop, and the assets within the vehicles were at risk of default, most
investors quit buying these securities and SIVs were unable to cover the short-term commercial
paper previously sold. Unlike standard asset-backed securities, SIVs do not keep liquidity to
cover 100% of their outstanding paper, and thus when investments go bad they have to sell assets
to raise money. Selling assets in a downturn further reinforces the cycle. This phenomenon is
similar to a bank run, but in the shadow banking realm (Krugman, 2009). With weakened
balance sheets, availability of credit across all sectors of the economy became hard to get or
exorbitantly expensive to obtain. The US had entered a full-scale credit crunch. With little capital
available, consumer confidence eroded and dropped significantly, which, combined with a
massive decrease in household wealth, spending, and demand across the economy, pushed the
US into an official recession.
Government Response
Drawing on research from past financial crises, both the Federal Reserve and US
Government were swift to take action to stem the fallout of the financial crisis. Ben Bernanke
was appointed in February 2006 as the Chairmen of the Federal Reserve Board. His extensive
experience with Japan’s crisis and writings on the Great Depression made him uniquely qualified
to deal with the current crisis. Following Bernanke’s appointment, the target Federal Funds rate
was cute immediately from 5.25% to 4.75% (“Financial Turmoil Timeline,” n.d.).

The Second Great Contraction 44
0.00
1.00
2.00
3.00
4.00
5.00
6.00
Federal Reserve Discount Rates 2007-2010
Figure 17: Federal Reserve Discount Rates 2007-2010. Note. data adapted from US Historical Discount Rate, 2011. Retrieved March 26, 2011 from http://www.federalreserve.gov/releases/h15/data/Monthly/H15_FF_O.txt.
Over the next seven months the rate was cut further, reaching 2% in April 2008. By the end of
2008, the rate was lowered to a target between 0.0-0.25%, where it still remains today. This is
just one set of measures undertaken by the Federal Reserve to ease the credit situation during the
crisis.
The Federal Reserve also used additional measures such as establishing the Term Auction
Facility (TAF). TAF auctioned credit to depository institutions for a period of up to 3 months.
The Fed also established the Term Securities Lending Facility (TSLF), which allowed primary
dealers to borrow Treasury securities against less liquid forms of collateral. The types of
collateral that the Fed accepted for loans, eventually including AAA rated asset-backed
securities, was expanded (Nanto, 2009). Direct lines of credit were also provided, not just to
commercial banks but to other institutions as well (Nanto, 2009). In addition to establishing
facilities to provide more lending capacity, the Federal Reserve established several programs to
purchase assets. They introduced facilities to purchase highly rated commercial paper.
Eventually the Federal Reserve adopted a plan to purchase longer-term securities, pledging to
purchase up to $200 billion of government sponsored entity (GSE) debt, up to $1.25 trillion of
GSE mortgage-backed securities, and $300 billion of long-term Treasury securities (Bernanke,

The Second Great Contraction 45
2009). As the crisis wore on, the Federal Reserve began injecting capital directly into struggling
financial institutions in exchange for ownership percentages. Nearly $150 billion was injected
into AIG and another $45 billion in Citigroup. Both of these institutions were deemed too
entangled in the larger financial system to be allowed to fail.
In September 2008, the government took control of both Fannie Mae and Freddie Mac
(GSEs). Together these two institutions owned or guaranteed more than half the residential
mortgages in the United States (“Understand the Fannie/Freddie Takeover,” 2008). As loans
began to default and their stock prices dropped, Fannie and Freddie saw their capital ratios
depleted. Additionally, as financing dried up, Fannie and Freddie became one of the only sources
for mortgage-related financing. Keeping these institutions functioning was essential to keeping
the mortgage market from drying up and further damaging the real estate industry. Because
GSEs were vital to a functioning mortgage market in the US, the government could not let them
fail. Initially the government planned to recapitalize the entities; however, it became clear that
this measure would not solve the problem. In exchange for purchasing $1 billion of preferred
equity shares in each company and agreeing to provide up to $200 billion to recapitalize the
companies and keep them functioning, the Treasury Department took control of the GSEs
(“Black Rock,” 2008).
In addition to taking these Federal Reserve and Treasury actions, the government began
instituting large-scale fiscal stimulus plans. Initially following the crisis, in February 2008, $100
billion was distributed to the American public through the Economic Stimulus Act. When this
failed to increase demand and had very little impact on the economy, much larger measures were
taken. The two largest were the Troubled Asset Relief Program (TARP) and the American
Recovery and Reinvestment Act (ARRA). Initially, TARP was to provide $700 billion to

The Second Great Contraction 46
purchase toxic assets and loans from the balance sheets of financial institutions, similar to the
Resolution Trust Corporation (RTC) in the late 1980s. However, the plan was not initiated as
conceived. The initial implementation involved spending $250 billion to recapitalize financial
institutions and eventually the remaining money was spent to purchase assets. The goal of TARP
was to stabilize the balance sheets through recapitalization and get the credit markets moving
again (Information about TARP, n.d.). Today most of the institutions who participated in this
program have repaid the money and the cost to the American public is expected to be less than
$50 billion (Information about TARP, n.d.).
The ARRA was passed into law in February 2009 with the goal of creating new jobs,
saving existing ones, and to spur economic activity (Information about ARRA, n.d.). The fiscal
stimulus package of $787 billion included government spending programs of approximately
$575 billion and tax cuts of $212 billion. The spending programs included infrastructure,
technology, education, energy, nutrition, and unemployment benefits (Information about ARRA,
n.d). The plan was widely criticized. The tax rebates did little to increase consumer demand and
spending programs, much like those in Japan, have been considered inefficient.
A plan targeted at helping homeowners refinance and avoid foreclosure was implemented
in early 2009. The plan pledged up to $275 billion, $75 billion of which was direct spending to
keep homeowners in their homes (Andrews & Stolber, 2009). The remaining $200 billion was
pledged to provide further support for Freddie and Fannie (Andrews & Stolber, 2009). The plan
targeted both homeowners who were currently paying their mortgage but in danger of default
due to high rates and homeowners currently in default. The plan required cooperation from
mortgage lenders to work with homeowners to reduce payments and keep current through
reducing the interest rate, extending the repayment period or reducing the outstanding principle
The Second Great Contraction 47
on the loan. One major problem the plan failed to deal with was second mortgages. Many people
took out a second mortgage to avoid any down payment. This complicates the restructure
dramatically as the second mortgage is often taken out with a different institution than the first.
Because of the burden placed on banks to take concessions on the loans, and the complicated
structure of many loans, this plan never gained much traction.
In addition to the two main stimulus measures and help for the housing industry, the
Treasury and government took many other measures to prevent the collapse of the financial and
economic system. The Treasury was active in facilitating buyouts of failing financial firms.
When it became clear that Fannie Mae and Freddie Mac, both of which had large exposure to the
residential real estate market, were in trouble, the government first eased the institutions’ capital
reserve requirements, and eventually took both entities into government conservatorship
(“Financial Turmoil Timeline,” n.d.). The FDIC increased its deposit insurance from $100,000 to
$250,000 on a temporary basis, later making it permanent (“Financial Turmoil Timeline,” n.d.).
The Treasury department established a money market guaranty program. The SEC banned short
selling on nearly 800 financial stocks (“Financial Turmoil Timeline,” n.d.). These just are just a
few of the many measures taken to protect the financial system and instill confidence in the
market. All of the above are short-term fixes to a larger problem. Broad reform is needed to
protect the economy from similar events in the future. As a result of this crisis, a plethora of
reforms and new regulations are being considered.
The most comprehensive financial reform is the Dodd-Frank legislation, which was
passed in late 2010 (“Financial Turmoil Timeline,” n.d.). The goal of Dodd-Frank is to reform
the financial system in a way that protects consumers by providing better oversight, more
transparency, and better risk management in the financial system. However, as experienced with

The Second Great Contraction 48
both the Volcker Rule and the Glass-Steagall Act, passing and keeping in place important risk
management regulation is a difficult task. Both the Volcker Rule and Glass-Steagall were put in
place to control speculation, which creates asset bubbles. The Glass-Steagall Act, which was
passed in 1933, maintained a separation between commercial banks and investment banks
(“What Was the Glass-Steagall Act,” n.d.). Commercial banks were much more regulated, took
on less risk, and had deposit insurance from the government. Investment banks did not take in
deposits, were much less regulated, and enjoyed no government protections. With the repeal of
this act, the separation between Wall Street and commercial banks was effectively eliminated.
This ushered in an era of exotic lending practices and securitized products on a much grander
scale. The Volcker Rule, which was introduced into the House in 2010, prohibited commercial
banks from proprietary trading and owning or investing in hedge funds and private equity funds
(Neat, 2009). However, by the time the rule was passed, it was watered down and did not
prohibit investing in hedge funds or private equity funds. Additionally, proprietary trading of
Treasuries, bonds backed by government entities such as Freddie and Fannie, and municipal
bonds were exempt from the ban (Onaran, 2010). While the bill has not been implemented, most
in the financial industry don’t think it will make much of an impact. The current crisis makes it
clear that extensive legislation is needed to regulate risk of large institutions in the financial
system. However, lawmakers seem to be unwilling to take the necessary steps to implement
these regulations.
The Dodd-Frank legislation has many of the same goals as the Volcker Rule and Glass-
Steagall: limit risk and prevent practices that lead to large-scale financial system meltdowns. The
law establishes a new consumer protection agency, the Consumer Financial Protection Bureau
(CFPM) under the Federal Reserve board. Banking oversight will be shifted to the Federal
The Second Great Contraction 49
Reserve Board, new minimum leverage and risk-based capital requirements will be established,
and orderly liquidation rights will be given to Secretary of Treasury. New rules for asset-backed
securities will be put in place, which require issuers to retain some of the risk and provide more
disclosure. Dodd-Frank gives the SEC significantly more authority to regulate rating
organizations. A new authority will be established to regulate over the counter (OTC) market
derivatives. Additionally, it will be required that most derivate transactions, with the exemption
of end-users hedging business risk, be traded through a central clearing and exchange system.
This comprehensive reform, if implemented properly, will drastically change the US financial
system. Whether it instills proper incentives and broad enough reform remains to be seen
(Staiger, 2010b).
Outcome
The long-term outcome of the Second Great Contraction has yet to play out. As it stands
today, both the stock market and housing prices still remain well below their peak pricing. The
stock market, while it has recovered substantially from post-crisis lows, is still 9% below its
2007 levels (Dow Jones Historical Data). As of year-end 2010, the residential market, which
experienced a more extreme bubble, is still 37% below its first quarter 2006 peak. Additionally,
after experiencing a stabilizing year in 2009, according to the Shiller index, it began falling again
in 2010. Projections call for a further decrease as there is still a glut of foreclosures in the market.
Despite these weaknesses, there is some positive news. After peaking at 10.4%, unemployment
has begun to fall, reaching 8.8% in March 2011 (US Unemployment Rate). The credit markets
have also begun to make a recovery with strengthened balance sheets. However, there remains
considerable uncertainty about the sustainability of the positive indicators as government

The Second Great Contraction 50
stimulus begins to be withdrawn. The duration of this crisis is yet unknown and will continue to
unfold.
Comparison
Causes
In comparing the three episodes discussed above, many similarities become apparent.
Perhaps the most striking is the effect monetary policy has in creating asset bubbles. In all three
crises, an easy money environment played a significant role in fueling a boom of domestic
investment and consumption (Flynn et al., 2009). Consequently, the disastrous real estate bubble
soared. When it burst, in all three cases, a severe economic shock followed. As demonstrated in
Figure 18 below, both Japan and the US significantly decreased the discount rate in years prior to
the crisis, leading to expansion in the money supply and incredibly cheap credit.
1.0
1.5
2.0
2.5
3.0
3.5
4.0
4.5
5.0
5.5
Bank of Japan Discount Rates 1985-1988
0.0
0.5
1.0
1.5
2.0
2.5
3.0
3.5
4.0
4.5
5.0
5.5
6.0
6.5
Federal Reserve Discount Rates 2000-2006
Figure 18: Bank of Japan Discount Rates 1985-1988. Note. data adapted from Japan Historical Discount Rate, 2011. Retrieved March 25, 2011 from http://www.stat-search.boj.or.jp/ssi/cgi-bin/famecgi2?cgi=$ap181g3f_en. Federal Reserve Discount Rates 2000-2006. Note. data adapted from US Historical Discount Rate, 2011. Retrieved March 25, 2011 from http://www.federalreserve.gov/releases/h15/data/Monthly/H15_FF_O.txt.
The availability of inexpensive capital led to rapidly increasing debt levels and artificially
inflated asset prices. Additionally, the loose monetary policy led to overly aggressive behavior
by financial institutions and poor risk management (Flynn et al., 2009). These policies helped
create the massive asset bubbles that when burst sent each country into crisis.

The Second Great Contraction 51
The presence of asset price bubbles is another similarity easily identified. In the Great
Depression both stock market and housing price bubbles existed. The stock market bubble was
the more inflated bubble during this time period. The stock market increased 51% from October
1928 to August 1929, when it hit its peak. In the period that followed, stocks plunged and, at
their low in mid-1932, were 88% below peak levels (Dow Jones Historical Data). They remained
low for an extended period of time, only climbing back to pre-crisis levels in 1952. The housing
price bubble during the Great Depression was more muted but particularly influential because of
the effect it had on wealth and spending behaviors. Housing prices increased 20% from 1920 to
1925. A downward slide began in 1925, eventually falling 30% by 1932. As is seen in Figure 19
below of the Great Depression and today’s crisis, the housing price decline precipitates the major
economic collapse.
60
65
70
75
80
Shiller Housing Price Index 1920-1932
100
120
140
160
180
200
220
Shiller Housing Price Index 2002-2009
Figure 19: Shiller Housing Price Index 1920-1932 and Shiller Housing Price Index 2002-2009. Note. data adapted from Shiller
Historical Home Price Index, 2011. Retrieved March, 25, 2011 from http://www.econ.yale.edu/~shiller/data.htm.
The fall in housing prices eroded a main source of household wealth and contributed to the pull
back in demand. Because of its more muted nature, housing prices began recovering much more
quickly than the stock market and had reach pre-crisis levels by the end of the decade (Shiller,
2011).
Japan’s episode was predictably severe given the extreme nature of both its stock market
and land bubbles. Japan’s stock market, the Nikkei, increased nearly 220% from 1985-1989. Just

The Second Great Contraction 52
as it experienced a staggering increase, the fall has been significant and prolonged (Nikkei Index
Historical Data). The Nikkei fell 55% from 1990-1992 (Nikkei Index Historical Data). For the
entire 1990s the Nikkei fluctuated at values of less than half of its pre-crisis levels. The Nikkei
reached its low in April 2003 at 80% of its peak level (Nikkei Index Historical Data). Its possible
prices may never recover to pre-crisis levels. As of March 2011, the Nikkei sat at 9,449, a 75%
decrease from its peak (Nikkei Index Historical Data). The Japanese land bubble was nearly as
extreme, and had an even more far-reaching impact because land was used as collateral for so
many loans during this time period. The decline of land value not only affected those who owned
it, in a decrease of personal wealth, but nearly destroyed the financial sector. At its height in
1990, the value of land in Japan was nearly $2 trillion yen, or five times the worth of all the land
in the United States at the time.
The Second Great Contraction had both extreme real estate and stock market bubbles as
well. During the second time around for the United States, the real estate bubble was more
exaggerated than the stock market bubble. The stock market reached its peak in October 2007
after increasing more than 50% since 1999 (Dow Jones Historical Data). By the end of 2008, it
had fallen by 28%, eventually falling by 47% in early 2009 at 7,063, levels not seen since 1998
and the run up to the crisis (Dow Jones Historical Data). Essentially, the fall wiped out a decade
of stock market gains. However, in mid-2009, the Dow began a steady increase and, as of March
2011, sits just 9% from its peak (Dow Jones Historical Data).
As was previously mentioned, the housing market bubble was more severe. Between
2000 and the first quarter of 2006, housing prices increased by 61% (Shiller, 2011). In 2006,
prices fell slightly, but by the end of 2008, they had fallen by 28% (Shiller, 2011). The fall in
housing prices, while not as drastic as the stock market drop, had more dire effects for two
The Second Great Contraction 53
reasons. First, because real estate is the main asset for most Americans, a decrease in the value of
housing decreases personal wealth drastically and causes a decrease in spending. Secondly, due
to the overly aggressive lending environment in the lead up to the crisis, most people had very
little equity in their homes, so a decrease in the value meant their mortgage was more than the
actual value of the home. As of year-end 2010, housing prices were down 37% from their peak
and have begun falling again (Shiller, 2011). It remains to be seen how far they will fall and how
long the duration of the slump will be.
In comparing the three episodes, it becomes clear that the asset bubbles played a
significant role in their respective economic crises. This is particularly true in the real estate
industry due to its interconnectedness with the financial system. Fueled by access to easy money,
stock and real estate prices accelerated to unsustainable levels. Both during the Great Depression
and Japan’s “Lost Decade”, the fallout from the bursting of these bubbles was severe and
prolonged. Given the comparable magnitude of today’s bubbles, the United States could
experience a similar outcome. However, in each point of comparison, the United States today is
different in a meaningful way. During the Great Depression, the central banking system was
new, inexperienced, and lacked the flexibility and tools that today’s Federal Reserve is able to
use. Although Japan had a sophisticated economy, its unique business and political culture
initially made it difficult to address the issues and made sound economic tools hard to
implement. Only time will tell whether policy measures taken in the United States will cause it to
follow historical precedent or set a new one.
Duration/Severity The Great Depression and Japan’s “Lost Decade” are arguably two of the most severe
economic downturns experienced in the last century. Today’s crisis is shaping up to be of a
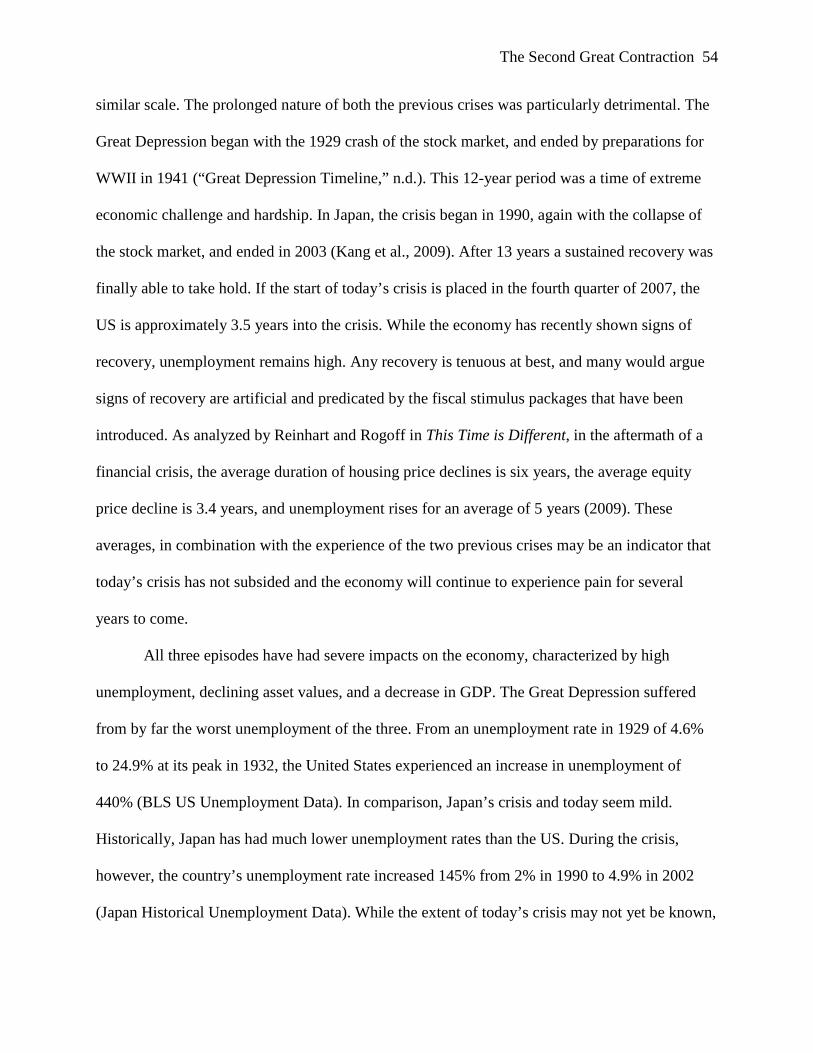
The Second Great Contraction 54
similar scale. The prolonged nature of both the previous crises was particularly detrimental. The
Great Depression began with the 1929 crash of the stock market, and ended by preparations for
WWII in 1941 (“Great Depression Timeline,” n.d.). This 12-year period was a time of extreme
economic challenge and hardship. In Japan, the crisis began in 1990, again with the collapse of
the stock market, and ended in 2003 (Kang et al., 2009). After 13 years a sustained recovery was
finally able to take hold. If the start of today’s crisis is placed in the fourth quarter of 2007, the
US is approximately 3.5 years into the crisis. While the economy has recently shown signs of
recovery, unemployment remains high. Any recovery is tenuous at best, and many would argue
signs of recovery are artificial and predicated by the fiscal stimulus packages that have been
introduced. As analyzed by Reinhart and Rogoff in This Time is Different, in the aftermath of a
financial crisis, the average duration of housing price declines is six years, the average equity
price decline is 3.4 years, and unemployment rises for an average of 5 years (2009). These
averages, in combination with the experience of the two previous crises may be an indicator that
today’s crisis has not subsided and the economy will continue to experience pain for several
years to come.
All three episodes have had severe impacts on the economy, characterized by high
unemployment, declining asset values, and a decrease in GDP. The Great Depression suffered
from by far the worst unemployment of the three. From an unemployment rate in 1929 of 4.6%
to 24.9% at its peak in 1932, the United States experienced an increase in unemployment of
440% (BLS US Unemployment Data). In comparison, Japan’s crisis and today seem mild.
Historically, Japan has had much lower unemployment rates than the US. During the crisis,
however, the country’s unemployment rate increased 145% from 2% in 1990 to 4.9% in 2002
(Japan Historical Unemployment Data). While the extent of today’s crisis may not yet be known,

The Second Great Contraction 55
the US has seen a 126% increase from 4.6% in 2007 to 10.4% at year-end 2010 (US
Unemployment Data). However, through the first three months of 2011, the unemployment rate
has begun to come down again, perhaps indicating that this episode may not be as prolonged as
the previous two.
As discussed above, the common denominator between all three episodes was pre-crisis
run-up of both the real estate and stock markets. In the wake of the crises these prices collapsed
to varying degrees, causing economic stress. The Great Depression had a relatively muted real
estate bubble, experiencing only a 30% decrease and only lasting a short period (Shiller, 2011).
In contrast, Japan’s real estate sector fell astronomically and may never recover to pre-crisis
prices. Today’s crisis has also seen significant price deterioration in housing prices at 37% to
date, with prices expected to continue decreasing in the short-term (Shiller, 2011). What is
particularly interesting about the real estate downturns in each instance is the severe effect they
had on the financial system and the subsequent effect the financial crises had on the economy as
a whole. Absent the real estate crises, these episodes may have been ordinary recessions and not
the disastrous events they turned into.
The stock market in today’s crisis, while experiencing a steep decline initially, appears to
be short lived. While falling 47% peak to trough, as of March 2011, prices sit just 9% below the
2007 peak (Dow Jones Historical Data). Compared to the previous two episodes, these decreases
seem relatively benign. During the Great Depression the stock market fell 88% and didn’t reach
pre-crisis levels until 1952 (Dow Jones Historical Data). Japan experienced a decline of 80% and
today, 21 years after it reached its peak, the Nikkei is still 75% below that level (Nikkei Index
Historical Data).

The Second Great Contraction 56
The United States during the Great Depression experienced the largest decline in GDP.
From 1929 to 1930, the GDP fell 12%. The average decline between 1929 and 1933 was 13.8%
(US Historical GDP Data). However, the GDP began growing again in 1934 and increased every
year, with the exception of 1937-1938, through the end of the decade (US Historical GDP Data).
40
50
60
70
80
90
100
110
US GDP 1929-1940 ($ billions)
Figure 20: US GDP 1929-1940. Note. data adapted from US Historical GDP Data, 2011. Retrieved April 5, 2011 frp,
http://www.bea.gov/national/index.htm#gdp.
Japan went from experiencing a 4% average annual growth rate from 1981 to 1990, to an
average rate of 1.2% from 1991-2003, actually having a negative growth during 3 years, which
was unheard of in Japan (Japan Historical GDP). In the 2000-2006 period leading up to today’s
crisis, the US enjoyed an average growth rate of 5.3% (US Historical GDP). In the subsequent
years, 2007-2010, the average rate was been 2.3%, with 2009 showing an actual decrease of
1.7% (US Historical GDP). While the Great Depression suffered the most severe decline, the
duration was relatively short, with strong growth beginning again in 1935. Japan’s prolonged
period of very low growth has arguably done more damage to the economy in the long run. In
the United States, growth of 3.7% was recorded from 2009-2010 (US Historical GDP). With any
luck, the current US crisis will play out as the Great Depression did, with several years of low
growth and then a steady increase in GDP in the future.

The Second Great Contraction 57
Government Response
As discussed in detail in the sections above, the government response to each crisis
played an important role in how the crisis played out. Predictably, many different approaches
were tried with varying degrees of success.
During the Great Depression, central banking was still in its infancy, and the central bank
lacked the experience and many of the policy tools that are available today. In the wake of the
stock market crash, the Federal Reserve continued to tighten monetary policy by defending the
gold standard and not easing rates. Even as the banking crisis set in the Fed failed to act and
make additional liquidity available to stem the panic. In addition, the Hoover administration was
so concerned with rising debt levels that they attempted to balance the budget in the midst of an
economic panic. The combination of these two factors turned a serious recession into a
depression. Not until FDR took office and began implementing fiscal stimulus measures and the
Federal Reserve finally began easing monetary policy did any recovery begin to take hold. Even
after these measures, it was not until WWII and the industrialization of the US that the recovery
was complete. The failure to take swift action to loosen monetary policy and provide stimulus to
the economy was extremely detrimental.
While policy response at the time may have been flawed, the 1930s was a decade of great
change and innovation. Many of the institutions that have become integral to the financial system
were created during this time period, including the FDIC, SEC, FHA, and HUD (Staiger, 2010a).
The banking sector was transformed with tighter regulations and protections, including the
Glass-Steagall Act and deposit insurance. The real estate industry also underwent massive
transformation with the creation of new institutions and lending standards such as longer, fixed-
rate, self-amortizing loans.

The Second Great Contraction 58
It can be argued that Japan’s policies were also responsible for prolonging its own crisis.
The government failed to recognize the mounting problems and instead opted to ignore and in
some cases urge firms to hide their problems (Kang et al., 2009). In terms of monetary policy,
the BoJ was slow to drop the discount rate, instead raising it during the first year of the crisis. As
the extent of the crisis began to set in, the BoJ then began swiftly dropping the rate to near zero,
where it still stands today. Additionally, Japan implemented 10 fiscal stimulus packages aimed at
stimulating the economy and providing money to recapitalize financial institutions (Kang et al.,
2009). However, the money was spent on inefficient projects that did little to stimulate the
private sector spending needed to get the economy back on its feet (Kang et al., 2009). The
money used to recapitalize the financial sector was initially given to poorly managed firms and
came with no conditions to restructure and dispose of bad assets (Flynn et al., 2009). While the
intent behind the actions was economically sound, the implementation was flawed.
Given the previous two crises’ similarities in cause and scale to the current crisis, policy
makers should be able to draw lessons from them. As the current crisis set in during late 2007,
the Federal Reserve acted quickly to cut the discount rate and provide liquidity to the system.
The government implemented multiple fiscal stimulus packages to stimulate demand in the
economy. With the passing of the Dodd-Frank legislation, new reforms are being instituted to
provide more safeguards in the financial system. While the initial monetary policy acted to stave
off a total financial meltdown, the long-term effect is still unknown. Additionally, as in Japan,
much of the capital provided to banks and other financial institutions came with few conditions
in order to restructure and clean up balance sheets. There is still a glut of nonperforming loans on
banks’ balance sheets, particularly in the residential housing sector. The effect of the stimulus

The Second Great Contraction 59
packages is still up for debate, and many argue that the only thing they accomplished was
massively increasing the deficit and artificially creating short-term demand.
Lessons Learned Evaluating the three crises described above, some clear lessons stand out. All three crises
were arguably facilitated by easy monetary policy, which created an overly aggressive lending
environment. These policies created an unsustainable credit expansion. Fueled by cheap credit
and mounting debt, artificially inflated prices created real estate and stock market bubbles. These
bubbles were highly susceptible to any economic slowdown or external shock. When the bubbles
burst, the economy was sent into a recession. In each case, the extreme nature of the bubbles,
combined with high leverage, caused a banking crisis and financial system weakness. With the
banking system in distress, credit became unavailable, which decreased investment and
spending, further deepening the economic slump. The banking crisis then turned the recession
into a protracted and severe economic downturn.
In all three crises, the bursting of the real estate bubble was particularly damaging. There
are two primary reasons real estate bubbles are so detrimental:
1. The financial system tends to be highly exposed to the industry. Particularly during
today’s crisis and Japan’s crisis, the financial system, including traditional banks,
investment banks, and insurance companies, was overexposed to the real estate sector. In
addition to having massive amounts of debt secured by real estate, because of loosened
lending standards and the explosion of the securitization market, many of these assets
were highly leveraged, risky, complex, and had very little equity as cushion to withstand
a downturn in pricing. As pricing began to fall, the real estate sector was hit very hard,
but perhaps the more damaging impact is the effect this sector had on the financial sector.
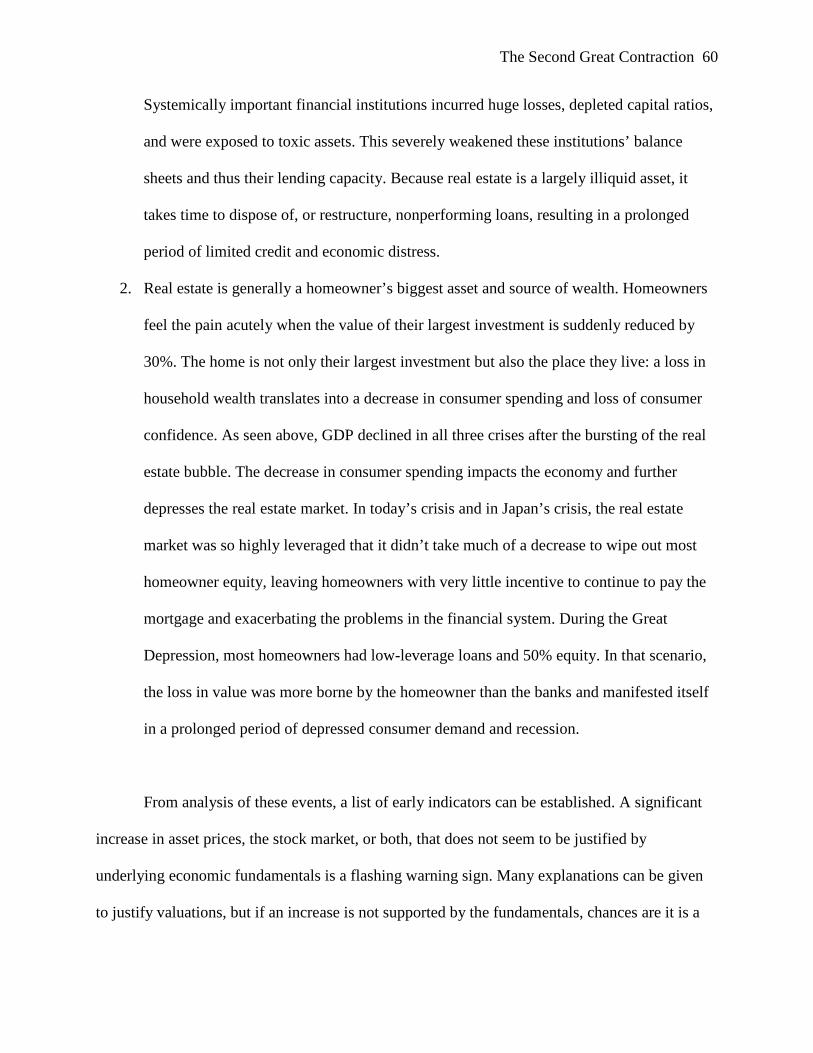
The Second Great Contraction 60
Systemically important financial institutions incurred huge losses, depleted capital ratios,
and were exposed to toxic assets. This severely weakened these institutions’ balance
sheets and thus their lending capacity. Because real estate is a largely illiquid asset, it
takes time to dispose of, or restructure, nonperforming loans, resulting in a prolonged
period of limited credit and economic distress.
2. Real estate is generally a homeowner’s biggest asset and source of wealth. Homeowners
feel the pain acutely when the value of their largest investment is suddenly reduced by
30%. The home is not only their largest investment but also the place they live: a loss in
household wealth translates into a decrease in consumer spending and loss of consumer
confidence. As seen above, GDP declined in all three crises after the bursting of the real
estate bubble. The decrease in consumer spending impacts the economy and further
depresses the real estate market. In today’s crisis and in Japan’s crisis, the real estate
market was so highly leveraged that it didn’t take much of a decrease to wipe out most
homeowner equity, leaving homeowners with very little incentive to continue to pay the
mortgage and exacerbating the problems in the financial system. During the Great
Depression, most homeowners had low-leverage loans and 50% equity. In that scenario,
the loss in value was more borne by the homeowner than the banks and manifested itself
in a prolonged period of depressed consumer demand and recession.
From analysis of these events, a list of early indicators can be established. A significant
increase in asset prices, the stock market, or both, that does not seem to be justified by
underlying economic fundamentals is a flashing warning sign. Many explanations can be given
to justify valuations, but if an increase is not supported by the fundamentals, chances are it is a

The Second Great Contraction 61
bubble in the making. This is especially dangerous if the bubble is in an asset that the banking
system is highly exposed to, such as real estate. Secondly, a significant increase in private debt is
an indicator. High leverage ratios cause vulnerability to any decrease in asset prices.
Additionally, cheap credit often artificially inflates asset prices, further fueling the bubble.
Thirdly, a prolonged period of easy monetary policy accompanying these factors is a strong
indicator that the economy could be heading for a severe correction.
While no one has yet to get the response to such a crisis just right, actions taken in the
past can provide a road map for how to proceed. Recognizing and addressing problems early is
the first step. Japan could have done itself a world of good had it immediately acknowledged the
extent of the bad loan problem and moved to address it. When it was ignored, the problem
festered, grew, and eventually brought the financial system to near collapse. Secondly, the use of
monetary policy and fiscal stimulus is important to stem the immediate crisis. Reducing the
discount rate swiftly and providing liquidity to the financial sector can help prevent the credit
markets from completely locking up. As noted above, any recapitalization or liquidity should
come with conditions that require the institutions to acknowledge problems and act to clean up
their balance sheets. Providing capital without these requirements does not prompt the banks to
deal with the problems and instead incentivizes them to wait for assistance from the government.
Fiscal stimulus packages can be helpful to promote economic activity and stem job loss.
However, stimulus tends to be a short-term fix and is difficult to implement effectively, as was
evidenced in Japan, whose stimulus plans were largely ineffective. Unfortunately, there is no
scientific equation for fixing a financial crisis. The response to today’s crisis will be studied in
years to come and will likely inform responses to problems in the future.
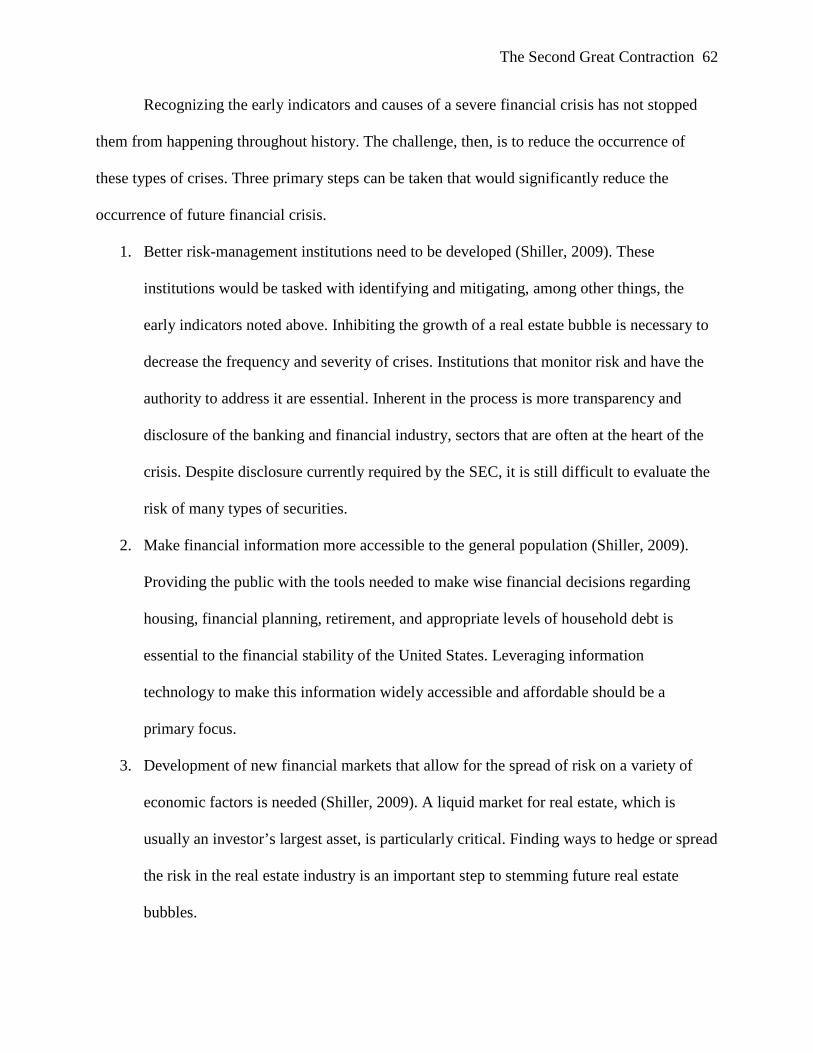
The Second Great Contraction 62
Recognizing the early indicators and causes of a severe financial crisis has not stopped
them from happening throughout history. The challenge, then, is to reduce the occurrence of
these types of crises. Three primary steps can be taken that would significantly reduce the
occurrence of future financial crisis.
1. Better risk-management institutions need to be developed (Shiller, 2009). These
institutions would be tasked with identifying and mitigating, among other things, the
early indicators noted above. Inhibiting the growth of a real estate bubble is necessary to
decrease the frequency and severity of crises. Institutions that monitor risk and have the
authority to address it are essential. Inherent in the process is more transparency and
disclosure of the banking and financial industry, sectors that are often at the heart of the
crisis. Despite disclosure currently required by the SEC, it is still difficult to evaluate the
risk of many types of securities.
2. Make financial information more accessible to the general population (Shiller, 2009).
Providing the public with the tools needed to make wise financial decisions regarding
housing, financial planning, retirement, and appropriate levels of household debt is
essential to the financial stability of the United States. Leveraging information
technology to make this information widely accessible and affordable should be a
primary focus.
3. Development of new financial markets that allow for the spread of risk on a variety of
economic factors is needed (Shiller, 2009). A liquid market for real estate, which is
usually an investor’s largest asset, is particularly critical. Finding ways to hedge or spread
the risk in the real estate industry is an important step to stemming future real estate
bubbles.
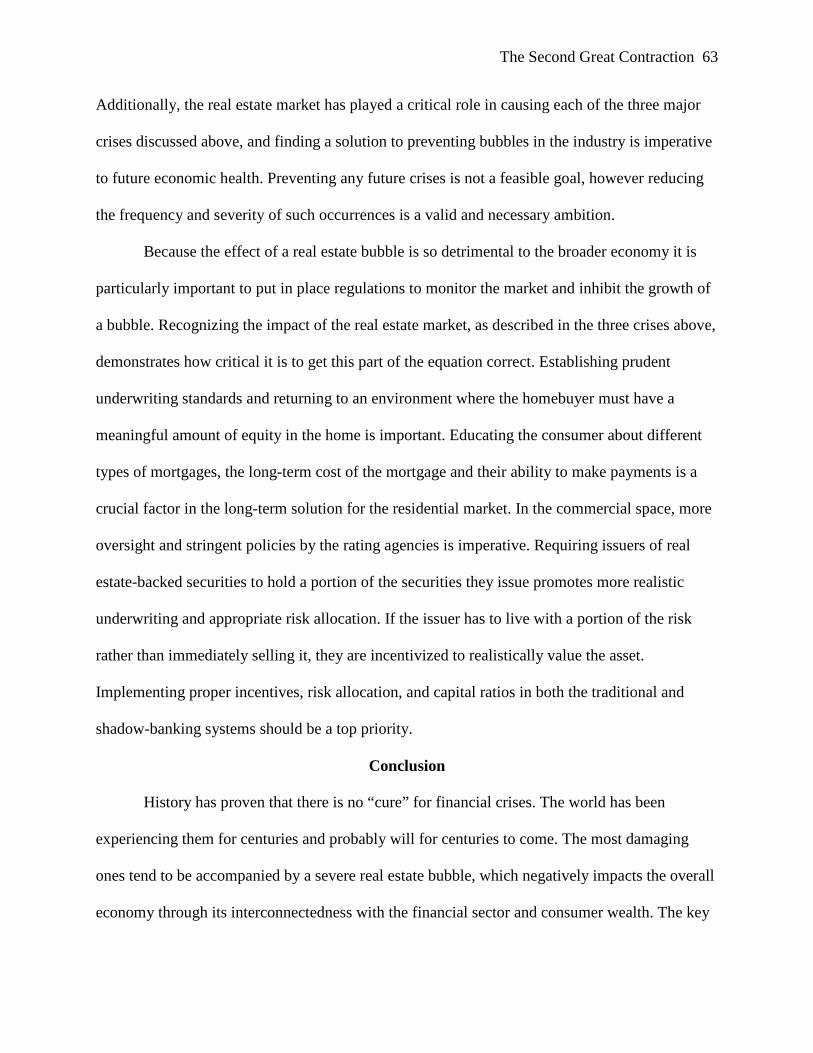
The Second Great Contraction 63
Additionally, the real estate market has played a critical role in causing each of the three major
crises discussed above, and finding a solution to preventing bubbles in the industry is imperative
to future economic health. Preventing any future crises is not a feasible goal, however reducing
the frequency and severity of such occurrences is a valid and necessary ambition.
Because the effect of a real estate bubble is so detrimental to the broader economy it is
particularly important to put in place regulations to monitor the market and inhibit the growth of
a bubble. Recognizing the impact of the real estate market, as described in the three crises above,
demonstrates how critical it is to get this part of the equation correct. Establishing prudent
underwriting standards and returning to an environment where the homebuyer must have a
meaningful amount of equity in the home is important. Educating the consumer about different
types of mortgages, the long-term cost of the mortgage and their ability to make payments is a
crucial factor in the long-term solution for the residential market. In the commercial space, more
oversight and stringent policies by the rating agencies is imperative. Requiring issuers of real
estate-backed securities to hold a portion of the securities they issue promotes more realistic
underwriting and appropriate risk allocation. If the issuer has to live with a portion of the risk
rather than immediately selling it, they are incentivized to realistically value the asset.
Implementing proper incentives, risk allocation, and capital ratios in both the traditional and
shadow-banking systems should be a top priority.
Conclusion
History has proven that there is no “cure” for financial crises. The world has been
experiencing them for centuries and probably will for centuries to come. The most damaging
ones tend to be accompanied by a severe real estate bubble, which negatively impacts the overall
economy through its interconnectedness with the financial sector and consumer wealth. The key

The Second Great Contraction 64
is learning from the past to reduce the occurrence and severity, and knowing how to react in
order to minimize the damage when they do occur. Given the discussions above regarding the
three most severe crises of the past century, the United States is not out of danger. However,
there are several factors that indicate that this crisis will not be as prolonged as the Great
Depression and Japan’s “Lost Decade.”
First, unlike during the Great Depression, the United States now has a much more
experienced and flexible central banking system with a global expert at the helm. With more
tools to use, the Federal Reserve acted swiftly during this crisis to ease monetary policy and
provide liquidity to the banking system. This didn’t stop the US from entering a credit crunch.
However, it did help alleviate the severity and duration of the crunch, and, as of this writing,
credit has already begun to ease. Additionally, regulations and protections put in place as a result
of the Great Depression, such as deposit insurance, have insulated the system from bank runs.
Secondly, while both the crisis in Japan and the Second Great Contraction share many
causal factors, the two financial and political systems are drastically different. The
interconnectedness of Japan’s banking and business world, along with the region’s distinct
political culture, made it extremely difficult to implement many of the regulations and policies
that could have helped stem the duration of the crisis. Japan was slow to acknowledge the issues,
recognize problems, and take action. Allowing and in some cases encouraging failing firms to
continue to operate led the problems to continue to fester, further weakening the balance sheets
and economy. This should be a major lesson for the United States: addressing problems early and
acting to dispose of problem assets, while painful, will prevent a prolonged crisis. The US has
done a much better job at requiring banks to clean up their balance sheets and increase capital
ratios. Time will tell whether the US has been proactive enough.

The Second Great Contraction 65
Lastly, quantitative indicators are more positive for the US at this point in the crisis than
they were during the previous two. Unemployment during the Great Depression increased
astronomically and stayed at extremely high levels through 1941. In Japan, four years after the
crisis started, unemployment rates had increased by 45% (Japan Historical Unemployment Rate).
Similarly, at year-end 2010, the US unemployment rate had increased by 48% (US Historical
Unemployment Rate). However, the first three months of 2011 have seen the unemployment rate
decreasing. In Japan, the unemployment rate continued rising for the next 7 years (Japan
Historical Unemployment Rate).
In terms of growth rates, the GDP during the Great Depression actually contracted from
1930 to 1935, after which it began a steady increase (US Historical GDP). While the GDP in
Japan didn’t actually contract until the late 1990s, the early part of the decade saw GDP decrease
from a consistent annual rate of 4% to around 1% (Japan Historical GDP). During the Second
Great Contraction, the growth rate of the GDP slowed from an average of 5.3% before the crisis
to 2.3% after (US Historical GDP). 2009 was the only year that saw an actual contraction in the
GDP and 2010 rebounded nicely with a 3.8% growth rate (US Historical GDP).
The stock market in the United States has also recovered much more quickly than either
of the previous two periods. While today’s stock market is 9% below its peak, during the Great
Depression it took almost 20 years to recover and in Japan, nearly 21 years later, the Nikkei is
still 75% below its peak (Nikkei Index Historical Data). During the Great Depression, the real
estate bubble was not as severe and the sector recovered relatively quickly. Conversely, the land
crisis in Japan was arguably the most severe of the three and prices are still worth only a fraction
of what they once were. The real estate bubble during the current crisis has yet to play out with
prices down 37% as of March 2011 (Shiller, 2011). After having a stronger year in 2009, prices
The Second Great Contraction 66
decreased again in 2010. The stock of foreclosures and decreased availability of financing
continue to negatively impact the market. As real estate bubbles tend to have a particularly
detrimental effect on the economy, special attention should be dedicated to monitoring the real
estate market and implementing changes in policy that will protect the system from future
bubbles in the real estate industry.
Based on the above discussion, there is reason to believe that while severe, today’s crisis
will not be as long-lasting and thus detrimental as either the Great Depression or Japan’s “Lost
Decade.” Despite that, the crisis has had a huge impact on the United States’ economy and the
repercussions will continue to be felt in the near future. The US should see this latest crisis as an
opportunity to reform the financial system and institute safeguards against future asset bubbles,
with particular attention paid to the real estate industry, and stronger consumer protections. In the
future, the US, as well as the world, should realize that while it may appear that “This Time is
Different,” it likely is not.
The Second Great Contraction 67
Reference List
American Reconstruction and Reinvestment Act. (2011). Information about ARRA. Retrieved
from http://www.recovery.gov/About/Pages/The_Act.aspx
Andrews, E.L. & Stolber, S. (February 19, 2009). $275 billion plan seeks to address housing
crisis. New York Times. Retrieved from
http://www.nytimes.com/2009/02/19/business/19housing.html
Bank of Japan. (2011). Japan historical discount rate [data file]. Retrieved from
http://www.stat-search.boj.or.jp/ssi/cgi-bin/famecgi2?cgi=$ap181g3f_en
Bank of Japan. (2011). Japan historical GDP [data file]. Retrieved from
http://www.stat.go.jp/english/data/chouki/03.htm
Bureau of Economic Analysis. (2011). US historical GDP [data file]. Retrieved from
http://www.bea.gov/national/index.htm#gdp
Bernanke, B.S. (2000). Essays on the Great Depression. Princeton New Jersey: Princeton
University Press.
Bernanke, B.S. (2004). Money, gold, and the Great Depression [speech]. Retrieved from
http://www.federalreserve.gov/newsevents/speech/bernanke20090113a.htm
Bernanke, B.S. (2009). The Federal Reserve’s balance sheet [speech]. Retrieved from
http://www.federalreserve.gov/newsevents/speech/bernanke20090403a.htm
Black Rock. (2008). Government takeover of Fannie Mae and Freddie Mac. Retrieved from
https://www2.blackrock.com/webcore/litService/search/getDocument.seam?venue=PUB
_INS&ServiceName=PublicServiceView&ContentID=49687

The Second Great Contraction 68
Bureau of Labor Statistics. (2011). US historical unemployment rate [data file]. Retrieved from
http://data.bls.gov/pdq/SurveyOutputServlet
Bureau of Labor Statistics. (2011). Japan historical unemployment rate [data file]. Retrieved
from http://www.bls.gov/fls/flscomparelf/unemployment.htm#table1_1
Causes of the Great Depression. (n.d.). Retrieved from
http://www.thegreatdepressioncauses.com/causes
EconStats. (2011). Japan share of GDP [data file]. Retrieved from
http://www.econstats.com/weo/V012.htm
Federal Reserve. (2011). US historical money supply [data file]. Retrieved from
http://www.federalreserve.gov/releases/h6/hist/h6hist1.txt
Federal Reserve. (2011). US historical discount rate [data file]. Retrieved from
http://www.federalreserve.gov/releases/h15/data/Monthly/H15_FF_O.txt
Federal Reserve. (2011). US consumer credit [data file]. Retrieved from
http://www.federalreserve.gov/releases/g19/current/g19.htm
Flynn, M., Radazzo, A., and Summers, A.B., (2009). Avoiding an American “Lost Decade”:
Lessons from Japan’s bubble and recession. Retrieved from
http://reason.org/files/091666ffae057adac5acof65caa.pdf
Great Depression. (n.d.). In Wikipedia. Retrieved April 6, 2011 from
http://en.wikipedia.org/wiki/Great_Depression
The Great Depression Timelines. (n.d.) Retrieved from
http://www.thegreatdepressioncauses.com/timelines.html
The Great Depression Timeline: How it all went down. (n.d.) Retrieved from
http://www.shmoop.com/great-depression/timeline.html

The Second Great Contraction 69
Kang, K., Syed, M., and Tokuaka, K. (2009). “Lost Decade” in Translation: What Japan’s crisis
could portend about recovery from the Great Recession. Retrieved from
www.imf.org/external/pubs/ft/wp/2009/wp09282.pdf.
Keynesian Economics. (n.d.). Retrieved from http://www.maynardkeynes.org/maynard-keynes-
economics.html
Krugman, P. (2009). The return of depression economics. New York, NY: W.W. Norton &
Company, Inc.
Makin, J.H., (2008). Japan’s Lost Deacde: Lessons for the United States in 2008. Retrieved from
www.aei.org/outlook/27568.
Nanto, D.K. (2009). The Global financial crisis: Analysis and policy implications. Retrieved
from http://www.fas.org/sgp/crs/misc/RL34742.pdf
Neat, R. (July 7, 2009). $400 billion SIV market sold off in two years. Retrieved from
www.telegraph.co.uk/finance/newsbysector/banksandfinance/5769361/400bn-SIV-
market-sold-off-in-two-years.html
New York Federal Reserve. (n.d.).Financial Turmoil Timeline. Retrieved from
http://www.newyorkfed.org/research/global_economy/Crisis_Timeline.pdf
National Public Radio. (2008). Understanding the Fannie/Freddie takeover [Interview].
Retrieved from http://www.npr.org/templates/story/story.php?storyId=94420613
Onaran, Y. (June 30, 2010). Volcker said to be unhappy with new version of rule. Retrieved
from www.businessweek.com/news/2010-06-30/volcker-said-to-be-unhappy-with-new-
version-of-rule.html
Reinghart, C.M., and Rogoff, K.S. (2009). This time is different. Princeton, New Jersey:
Princeton University Press.

The Second Great Contraction 70
Saxonhouse, G.R. and Stern, R.M. (Eds.). (2004). Japan’s lost decade: Origins, consequences
and prospects for recovery. Malden, MA: Blackwell Publishing Ltd.
Shiller, R.J. (2008). The subprime solution. Princeton, New Jersey: Princeton University Press.
Schiller, R.J. (2011). Historical home price index [data file]. Retrieved March 25, 2011 from
http://www.econ.yale.edu/~shiller/data.htm
Staiger, R. (2010a). The New Deal –The Great Depression [Memo]. Retrieved from Roger
Staiger on March 30, 2011.
Staiger R. (2010b). Dodd-Frank summary [Memo]. Retrieved from Roger Staiger on March 30,
2011.
Staiger, R. (2011). Securitization [powerpoint slides]. Retrieved from Roger Staiger on April 17,
2011.
Reddy, S. (2010). Q&A on QE2: What a Fed move would mean. Wall Street Journal. Retrieved
from http://blogs.wsj.com/economics/2010/11/03/qa-on-qe2-what-a-fed-move-would-
mean/
Timeline: Global Economy in Crisis. (n.d.) Retrieved from
http://www.cfr.org/economics/timeline-global-economy-crisis/p18709.
Treasury Department. (2011). Information about TARP. Retrieved from
http://www.treasury.gov/initiatives/financial-stability/about/pages/plan.aspx
What Was the Glass-Steagall Act. (n.d). Retrieved from
http://www.investopedia.com/articles/03/071603.asp
Wood, C. (2006). The bubble economy. London, United Kingdom: Charles E. Tuttle Company,
Inc.

The Second Great Contraction 71
Yahoo Finance. (2011). Nikkei index historical data [data file]. Retrieved from
http://finance.yahoo.com/q/hp?s=%5EN225&a=00&b=1&c=1950&d=02&e=24&f=2011
&g=m
Yahoo Finance. (2011). Dow Jones historical data [data file]. Retrieved from
http://finance.yahoo.com/q/hp?s=%5EDJI+Historical+Prices

The Second Great Contraction 72
Appendix A
Selected Research Summaries
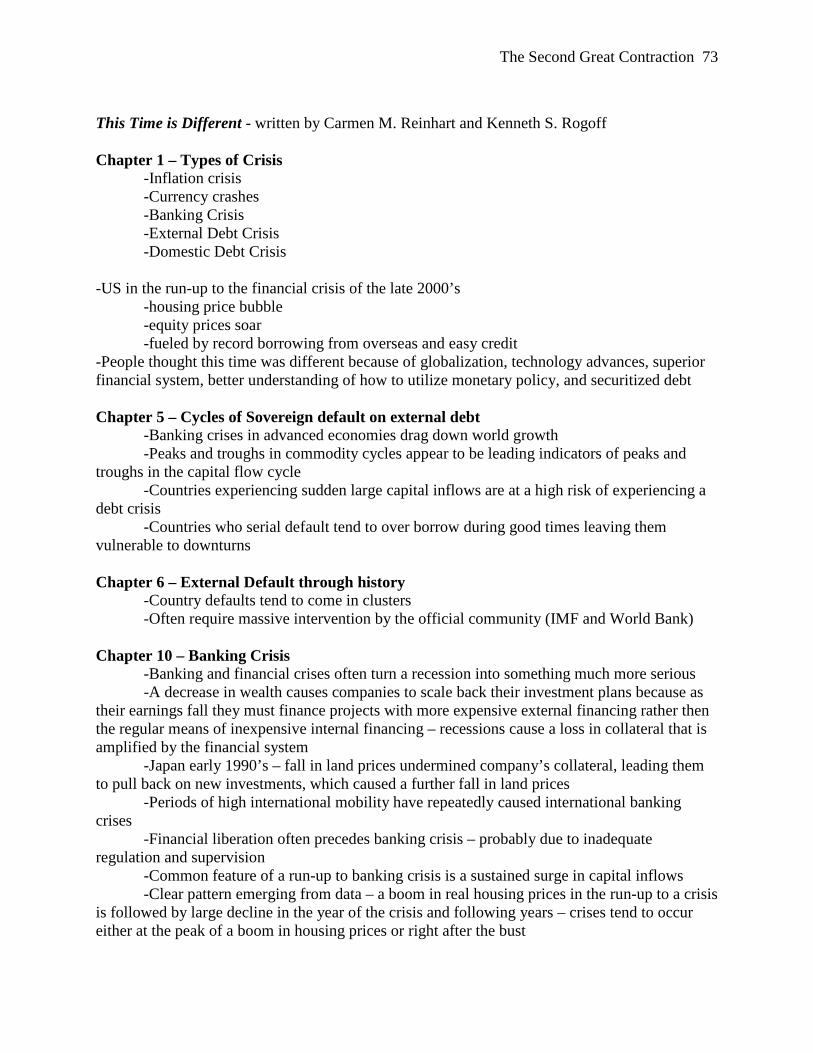
The Second Great Contraction 73
This Time is Different - written by Carmen M. Reinhart and Kenneth S. Rogoff Chapter 1 – Types of Crisis -Inflation crisis -Currency crashes -Banking Crisis -External Debt Crisis -Domestic Debt Crisis -US in the run-up to the financial crisis of the late 2000’s -housing price bubble -equity prices soar -fueled by record borrowing from overseas and easy credit -People thought this time was different because of globalization, technology advances, superior financial system, better understanding of how to utilize monetary policy, and securitized debt Chapter 5 – Cycles of Sovereign default on external debt -Banking crises in advanced economies drag down world growth -Peaks and troughs in commodity cycles appear to be leading indicators of peaks and troughs in the capital flow cycle -Countries experiencing sudden large capital inflows are at a high risk of experiencing a debt crisis -Countries who serial default tend to over borrow during good times leaving them vulnerable to downturns Chapter 6 – External Default through history -Country defaults tend to come in clusters -Often require massive intervention by the official community (IMF and World Bank) Chapter 10 – Banking Crisis -Banking and financial crises often turn a recession into something much more serious -A decrease in wealth causes companies to scale back their investment plans because as their earnings fall they must finance projects with more expensive external financing rather then the regular means of inexpensive internal financing – recessions cause a loss in collateral that is amplified by the financial system -Japan early 1990’s – fall in land prices undermined company’s collateral, leading them to pull back on new investments, which caused a further fall in land prices -Periods of high international mobility have repeatedly caused international banking crises -Financial liberation often precedes banking crisis – probably due to inadequate regulation and supervision -Common feature of a run-up to banking crisis is a sustained surge in capital inflows -Clear pattern emerging from data – a boom in real housing prices in the run-up to a crisis is followed by large decline in the year of the crisis and following years – crises tend to occur either at the peak of a boom in housing prices or right after the bust
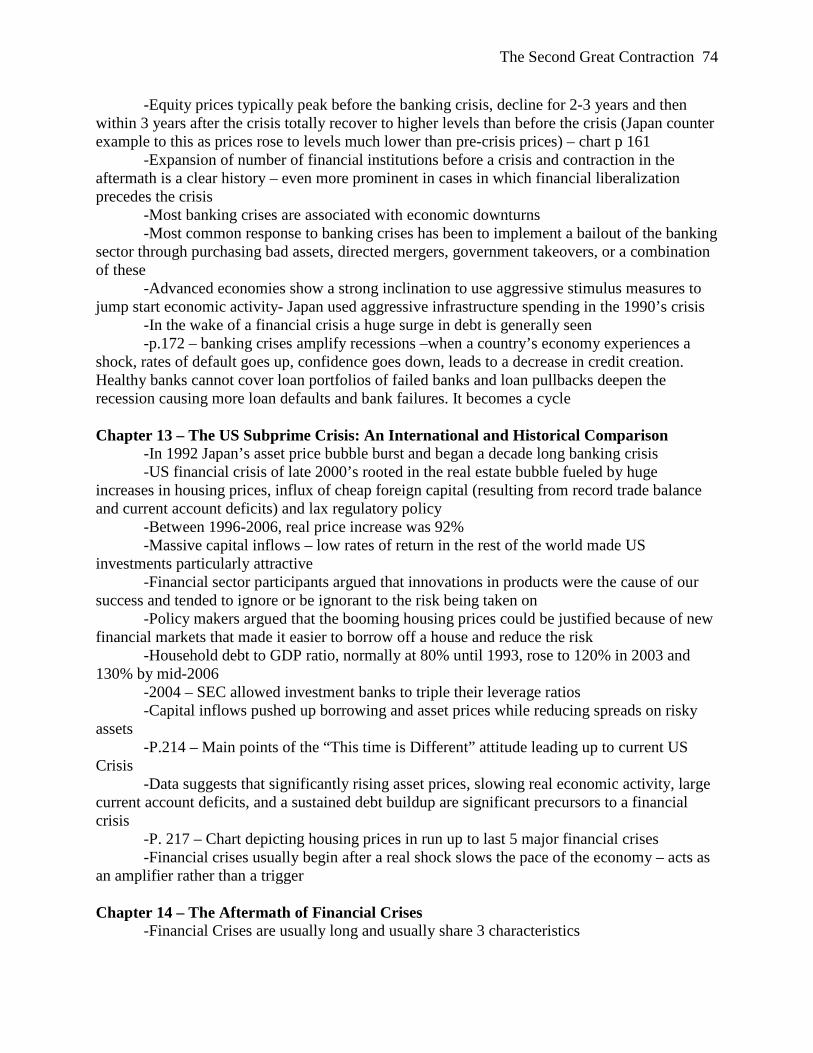
The Second Great Contraction 74
-Equity prices typically peak before the banking crisis, decline for 2-3 years and then within 3 years after the crisis totally recover to higher levels than before the crisis (Japan counter example to this as prices rose to levels much lower than pre-crisis prices) – chart p 161 -Expansion of number of financial institutions before a crisis and contraction in the aftermath is a clear history – even more prominent in cases in which financial liberalization precedes the crisis -Most banking crises are associated with economic downturns -Most common response to banking crises has been to implement a bailout of the banking sector through purchasing bad assets, directed mergers, government takeovers, or a combination of these -Advanced economies show a strong inclination to use aggressive stimulus measures to jump start economic activity- Japan used aggressive infrastructure spending in the 1990’s crisis -In the wake of a financial crisis a huge surge in debt is generally seen -p.172 – banking crises amplify recessions –when a country’s economy experiences a shock, rates of default goes up, confidence goes down, leads to a decrease in credit creation. Healthy banks cannot cover loan portfolios of failed banks and loan pullbacks deepen the recession causing more loan defaults and bank failures. It becomes a cycle Chapter 13 – The US Subprime Crisis: An International and Historical Comparison -In 1992 Japan’s asset price bubble burst and began a decade long banking crisis -US financial crisis of late 2000’s rooted in the real estate bubble fueled by huge increases in housing prices, influx of cheap foreign capital (resulting from record trade balance and current account deficits) and lax regulatory policy -Between 1996-2006, real price increase was 92% -Massive capital inflows – low rates of return in the rest of the world made US investments particularly attractive -Financial sector participants argued that innovations in products were the cause of our success and tended to ignore or be ignorant to the risk being taken on -Policy makers argued that the booming housing prices could be justified because of new financial markets that made it easier to borrow off a house and reduce the risk -Household debt to GDP ratio, normally at 80% until 1993, rose to 120% in 2003 and 130% by mid-2006 -2004 – SEC allowed investment banks to triple their leverage ratios -Capital inflows pushed up borrowing and asset prices while reducing spreads on risky assets -P.214 – Main points of the “This time is Different” attitude leading up to current US Crisis -Data suggests that significantly rising asset prices, slowing real economic activity, large current account deficits, and a sustained debt buildup are significant precursors to a financial crisis -P. 217 – Chart depicting housing prices in run up to last 5 major financial crises -Financial crises usually begin after a real shock slows the pace of the economy – acts as an amplifier rather than a trigger Chapter 14 – The Aftermath of Financial Crises -Financial Crises are usually long and usually share 3 characteristics
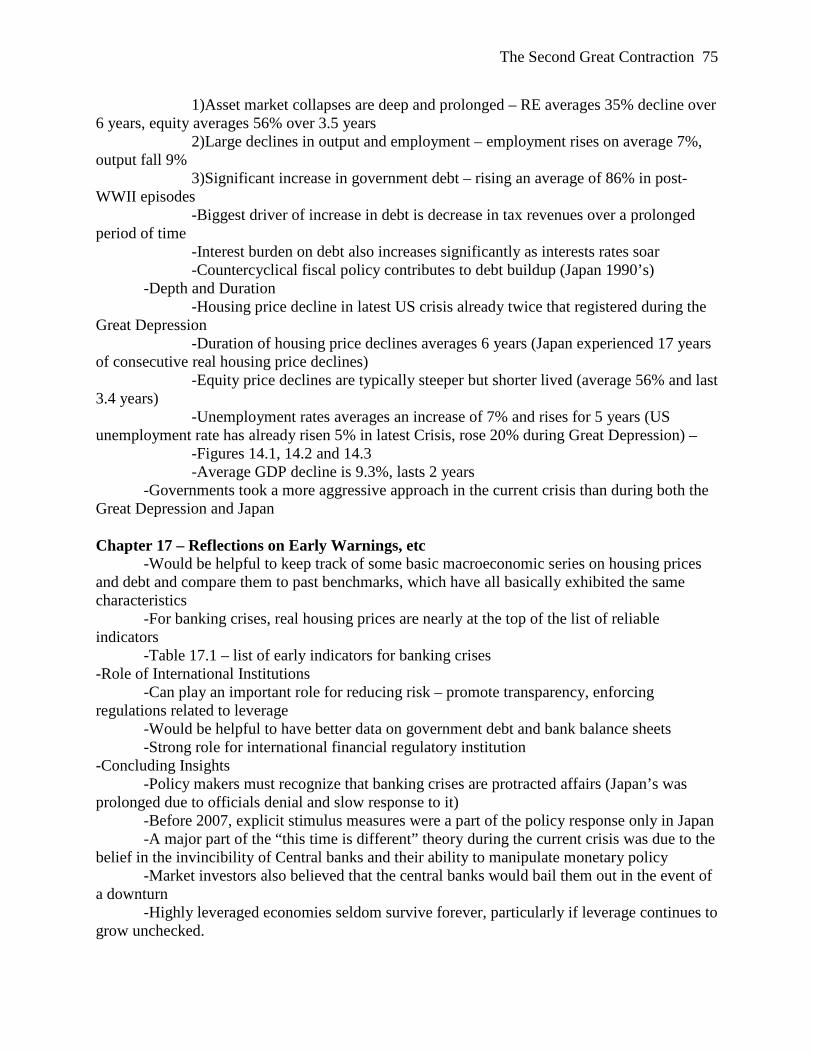
The Second Great Contraction 75
1)Asset market collapses are deep and prolonged – RE averages 35% decline over 6 years, equity averages 56% over 3.5 years 2)Large declines in output and employment – employment rises on average 7%, output fall 9% 3)Significant increase in government debt – rising an average of 86% in post-WWII episodes -Biggest driver of increase in debt is decrease in tax revenues over a prolonged period of time -Interest burden on debt also increases significantly as interests rates soar -Countercyclical fiscal policy contributes to debt buildup (Japan 1990’s) -Depth and Duration -Housing price decline in latest US crisis already twice that registered during the Great Depression -Duration of housing price declines averages 6 years (Japan experienced 17 years of consecutive real housing price declines) -Equity price declines are typically steeper but shorter lived (average 56% and last 3.4 years) -Unemployment rates averages an increase of 7% and rises for 5 years (US unemployment rate has already risen 5% in latest Crisis, rose 20% during Great Depression) – -Figures 14.1, 14.2 and 14.3 -Average GDP decline is 9.3%, lasts 2 years -Governments took a more aggressive approach in the current crisis than during both the Great Depression and Japan Chapter 17 – Reflections on Early Warnings, etc -Would be helpful to keep track of some basic macroeconomic series on housing prices and debt and compare them to past benchmarks, which have all basically exhibited the same characteristics -For banking crises, real housing prices are nearly at the top of the list of reliable indicators -Table 17.1 – list of early indicators for banking crises -Role of International Institutions -Can play an important role for reducing risk – promote transparency, enforcing regulations related to leverage -Would be helpful to have better data on government debt and bank balance sheets -Strong role for international financial regulatory institution -Concluding Insights -Policy makers must recognize that banking crises are protracted affairs (Japan’s was prolonged due to officials denial and slow response to it) -Before 2007, explicit stimulus measures were a part of the policy response only in Japan -A major part of the “this time is different” theory during the current crisis was due to the belief in the invincibility of Central banks and their ability to manipulate monetary policy -Market investors also believed that the central banks would bail them out in the event of a downturn -Highly leveraged economies seldom survive forever, particularly if leverage continues to grow unchecked.

The Second Great Contraction 76
IMF Working Paper: “Lost Decade” in Translation: What Japan’s Crisis could Portend about Recovery from the Great Recession– written by Murtaza Syed, Kenneth Kang and Kiichi Tokuoka Introduction -What can be learned from history? -Both crises started with the bursting of asset bubbles fueled by weak financial regulations and irrational market optimism, in combination with an extreme escalation of leverage Section II -Similar to today, Japan’s crisis sparked by collapse of stock and real estate markets -Also similar, private debt escalated, although more concentrated in borrowing by firms rather than households -Different – fallout for Japan was relatively muted during the early part of the crisis, economy stagnated, growth fell from 4% to 1.5%, unemployment ticket up moderately, but credit growth remained resilient and “reported” nonperforming loans remained low -Bank of Japan cut rates to near 0 in 1995, stimulus packages were introduces and economy was expected to emerge relatively quickly – positive signs began taking hold in late 1994 -Stimulus was withdrawn and a consolidation effort was launched in April 1997 -In combination with the Asian crisis of 1997, the withdraw of economic support sent the economy back into a tale-spin as mistrust and confidence in Japan’s financial institutions became more prevalent -Mounting losses on failed real estate and falling prices led to a wave of large failures in the financial sector -The impact was severe and a large-scale credit crunch ensued -In aftermath of this, capital was injected into the banking system -Third approach to crisis involved a comprehensive strategy for addressing underlying problems in financial sector – dealing with problem loans and capital shortages helped to restore confidence in the banking system -This third approach helped to enable a durable expansion to finally take hold -Delays in recognizing problem loans and the severity of the crisis postponed a sustained recovery – immediate action to restructure banks, push them to recognize problem loans, and raise new capital should be undertaken -Early efforts to inject capital into banks was not coupled with strong steps to clean up balance sheets -Government injected public funds of nearly 47 trillion yen – by 2003, banks share prices began to recover, nonperforming loan began to trend down and capital ratios were stabilized -Credit easing -BOJ cut interest rate to near zero -Following bursting of IT bubble, quantitative easing measures were used to inject liquidity -In 2001, BOJ began buying long-term government bonds and over time began purchasing commercial paper, corporate bonds, equities, and asset back securities
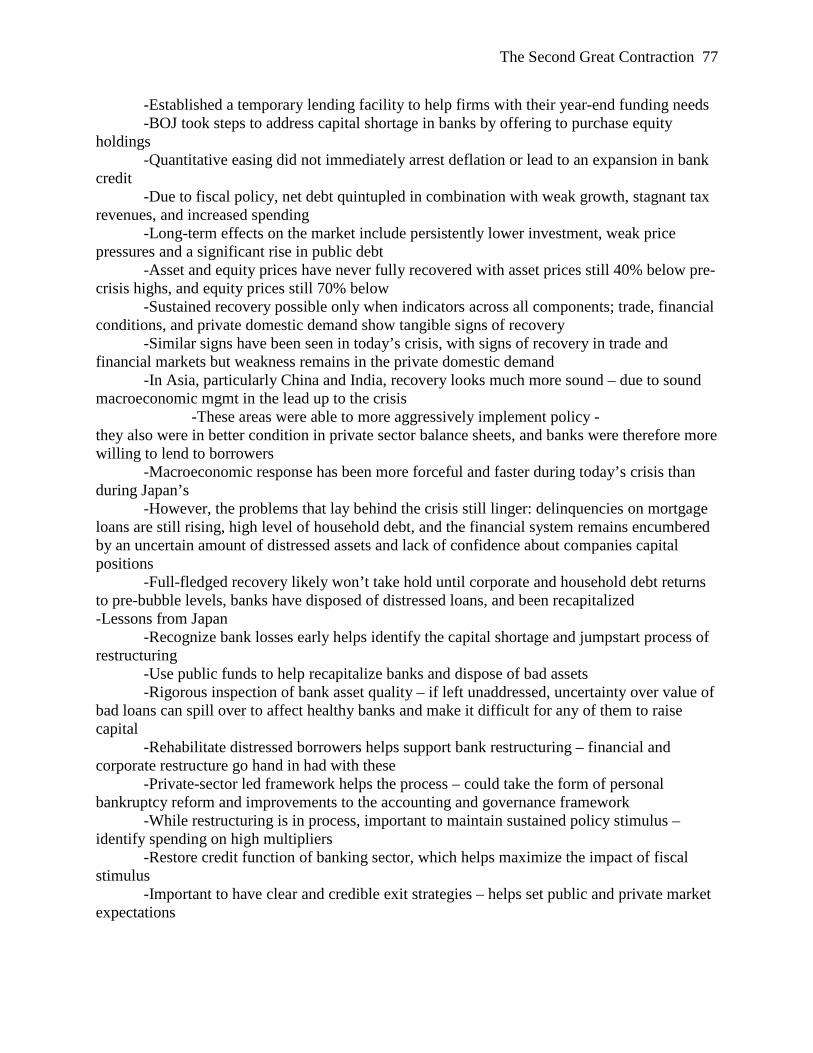
The Second Great Contraction 77
-Established a temporary lending facility to help firms with their year-end funding needs -BOJ took steps to address capital shortage in banks by offering to purchase equity holdings -Quantitative easing did not immediately arrest deflation or lead to an expansion in bank credit -Due to fiscal policy, net debt quintupled in combination with weak growth, stagnant tax revenues, and increased spending -Long-term effects on the market include persistently lower investment, weak price pressures and a significant rise in public debt -Asset and equity prices have never fully recovered with asset prices still 40% below pre-crisis highs, and equity prices still 70% below -Sustained recovery possible only when indicators across all components; trade, financial conditions, and private domestic demand show tangible signs of recovery -Similar signs have been seen in today’s crisis, with signs of recovery in trade and financial markets but weakness remains in the private domestic demand -In Asia, particularly China and India, recovery looks much more sound – due to sound macroeconomic mgmt in the lead up to the crisis -These areas were able to more aggressively implement policy - they also were in better condition in private sector balance sheets, and banks were therefore more willing to lend to borrowers -Macroeconomic response has been more forceful and faster during today’s crisis than during Japan’s -However, the problems that lay behind the crisis still linger: delinquencies on mortgage loans are still rising, high level of household debt, and the financial system remains encumbered by an uncertain amount of distressed assets and lack of confidence about companies capital positions -Full-fledged recovery likely won’t take hold until corporate and household debt returns to pre-bubble levels, banks have disposed of distressed loans, and been recapitalized -Lessons from Japan -Recognize bank losses early helps identify the capital shortage and jumpstart process of restructuring -Use public funds to help recapitalize banks and dispose of bad assets -Rigorous inspection of bank asset quality – if left unaddressed, uncertainty over value of bad loans can spill over to affect healthy banks and make it difficult for any of them to raise capital -Rehabilitate distressed borrowers helps support bank restructuring – financial and corporate restructure go hand in had with these -Private-sector led framework helps the process – could take the form of personal bankruptcy reform and improvements to the accounting and governance framework -While restructuring is in process, important to maintain sustained policy stimulus – identify spending on high multipliers -Restore credit function of banking sector, which helps maximize the impact of fiscal stimulus -Important to have clear and credible exit strategies – helps set public and private market expectations

The Second Great Contraction 78
Japan’s Lost Decade – Lesson’s for the US in 2008 – written by John H. Makin -Different response to initial onset of credit crunch in US versus Japan – prompt, aggressive easing by the Fed -Primary lesson from Japan – acknowledge and confront problems created for banks and other financial institutions by ongoing drop in real estate markets -Japan’s lost decade can be divided into 3 phases: 1) 1991-1993 recessions 2)1994-1996 temporary recovery and 3) 1997-1999 deep recession -Post 1989-BOJ increased discount rate from 4.75% to 7% from 8/90-6/91 -As equity prices continued to collapse and land prices began to fall, BOJ then cut discount rate rapidly by 275 bps and then additional 150 bps -Implemented 3 major fiscal stimulus packages -These extreme measures had little effect on the economy -BOJ was too late in implementing its easing – simultaneously falling equity and land prices were erasing household wealth and limiting credit because of bank’s exposure to the commercial land bubble -Deflation began to emerge -Japan’s biggest policy mistake was to raise consumption tax in 1997 -In 2001, Japan switched to policy of quantitative easing, targeting growth of the money supply and recapitalization of banks (major problem was large stock of nonperforming loans) -Lack of transparency and passive approach of Japanese gov to restructure balance sheets of banks substantially contributed to prolonged recession -Economic cycle driven by collapse in asset prices that the banks are heavily exposed to is very dangerous -Prompt measures such as interest rate reductions and fiscal relief are necessary but not sufficient -Banking system must move promptly to reveal its exposure – Real estate in US -Public funds may need to be used to capitalize banks in order to avoid a further collapse in asset prices -Do not allow deflation to take hold -Avoid temptation to raise taxes in midst of economic slowdown The Bubble Economy – written by Christopher Wood Chapter 1 – Bubbles do Matter -Japan is not nearly as transparent as US – while it had a first rate economy, its financial system was second rate -1980’s – Japan began to deregulate much of its commercial life – interest rates, lowering taxes on imported goods, liberalizing retail laws -Gross consumer debt soared to American levels in the 1980’s -In 1980’s people believed that Japanese stock prices could never fall, land prices could never fall, and the level of growth was sustainable -Japan particularly vulnerable to herd mentality given the cultural discouragement of individualistic thinking -At its high, Japanese stock market represented 42% of world stock markets,

The Second Great Contraction 79
-Compared to 15% in 1980 -It was worth 151% of Japan’s GDP, compared to 29% in 1980 -In 1990, land valued at $2,000 trillion yen, five times the size of Japan’s GDP and 4 times the value of America’s land stock -Reason for Japan’s sky-high stock prices: prolonged period of low interest rates – between 1/86 and 2/87, discount rate was lowered from 5% to 2.5% -Money became virtually free in Japan, which sparked a liquidity boom -Japan suffered credit crunch causing 1)dramatic surge in cost of capital 2)stock market collapse and shrinking effect on bank lending 3)banking crisis caused by huge amounts of bad debt, most of which was property related -Japan susceptible to moral hazard – most people involved in Japanese finance or commerce believe that Japanese government will never let financial institutions go bust Chapter 2 – Banks -Two long-term trends 1)no longer can count on traditional customers (large cash-rich corporations) who now raise money more cheaply by selling securities in the international capital markets 2)deregulation of interest rates which dramatically increased their funding costs -In year ending 3/89, 42% of bank’s profits came from securities gains –excluding gains on long-term shareholdings and short-term stock market deals, Japan’s banks made very little profit -Japan’s keiretsu system obligated banks in cross-shareholdings where financial institutions and industrial groups owned one another’s shares as a way of consolidating long-term business relationships -New capital adequacy standards caused problems for banks that provide a far greater proportion of total credit extended in Japan than in America -Unrealized share gains account for 45% of gains on stock holdings – Japanese banks were allowed to count 45% of these toward their capital -Made banks’ capital dependent on stock market – capital of world’s biggest banks, and therefore their ability to lend, went up and down with the short-term whims of the Tokyo stock market -Bank stocks account for ¼ of the stock market and tend to be over valued because they are held by companies to cement business relationships and they are wary to sell them because banks may take offense and not provide credit -Effectively the overvaluation of the bank stock keeps banks stability afloat and keeping banks in compliance with the capital ratio regulations -Period of extremely easy money from 1985-1989 that fueled speculation -By the end of 1991, contraction of Japanese credit became obvious, banks began selling their overseas assets -In 1990, overseas assets accounted for nearly ½ of the major banks total assets but they only earned a net spread less than 1/10 of those achieved on assets at home -Japanese foreign lending peaked at the same time as American property prices -American branches of Japanese banks were barely earning 2% on equity, way below their cost of capital -More than 75% of city banks’ loans go to small businesses, many of these loans are backed by property

The Second Great Contraction 80
-Many other loans backed by property went through the conduit of Japan’s nonbanks – leasing companies, consumer finance companies, and mortgage companies -The condition of these 30,000 nonbanks were virtually unknown because they are private companies who don’t publish accounts – In 1990 finance ministry ordered a study to be carried out -At the end of 1990, 36% of outstanding nonbank loans were to property companies and another 5% to construction companies, and another 14% to other nonbanks who in turn lent the funds to property companies – In total approximately 60% of nonbank loans were exposed to property companies -Despite all this, as of the end of 1990, no banks had any significant provisions against bad debts – in compliance with compliant regulators, banks significantly overstated their earnings and hoped that the land prices would turn around -In contrast to US banks, Japanese banks were not required to disclose nonperforming loans at all, or provide reserves against them Chapter 3 – Land -At the end of 1989, Japanese land was valued at over 2.000 trillion yen, or 4 times the estimated value of American property -Japanese banks have a long history of lending against the value of an asset where Western banks generally lend against the rental income that can be earned from a property -In 4/1990, policy to curtail boom was that any increase in banks outstanding property loans must grow more slowly than their total loans – this had a big impact because at this point bank lending was barely growing -Officials complacency in acknowledging the downturn in land prices was very detrimental -Land is most families’ main asset in Japan -Even with mounting evidence predictions still were an orderly 20% decline -Most people cited the Japanese land market as having several unique factors that would make it impossible for it to implode 1)Tokyo so dominated the economy that there would always be demand for space and tight zoning meant there would always be a shortage 2)tax system favors land and discourages short term trading of property 3)Japan is an immobile society where people hardly ever move 4)there is no real market – if an individual has to sell he sells it to a relative which means the supply of land never hits the market -This was an accurate description until property markets began announcing they had to sell to pay down their debts Chapter 4 – Life Insurance Companies
-Life insurance companies had total assets of 130 trillion yen in the 1980s -Hugely important and conservative institutions in Japan -Set up special tokkin accounts where money is wagered for short-term gains in the stock market -Allowed financial institutions and corporate investors to profitably separate for tax purposes short-term gains from their long-term cross-share holdings’ – allowed life insurance companies to convert short-term gains into income free of tax and thus pay policy holders out of proceeds

The Second Great Contraction 81
-Life companies invested heavily in higher yielding overseas assets, a world in which hey had little knowledge and no experience Chapter 5 – Securities Companies -Had fixed brokerage commissions -Did not go on a hiring spree during boom and do not get paid extravagant salaries such as those in London and America -Due to fixed commissions, Japanese brokers acted primarily as agents and not principals -Japan has a low awareness of proper pricing for credit and exhibited a reluctance to mark assets to market -The absence of a liquid bond market also means Japan lacks any equivalent to America’s spreads, which reflect credit risk -Japan had a non-existent securitization market – a securitization market demands for more transparency than borrowers and lenders are used to or comfortable with -Warrants – favorite financial instrument in 1980s Chapter 6 – Brokering Scandals -The practice of compensating important investors for their losses was prevalent -The eigyo tokkin was a special kind of tokkin account in which the security firms themselves managed the investments and offered guarantied returns to their investors -Guarantying investment returns is standard practice in virtually all parts of the investment industry in Japan Chapter 7 - Banking Scandals -Forged certificates of deposit and billions of dollars of phony credit came as a profound shock to many -Forging certificates of deposit was almost common practice -Scandals rocked the major banking institutions as underhanded practices came to light during the initial stages of the asset and stock market collapse Chapter 8 - Bureaucrats and Politician -The real political rivalry is not between opposing parties but between LDP members competing against one another for the same constituency -Relationships between the ministry of finance and the LDP are extremely close -Finance ministry has argued that a fully independent American-styled regulatory commission is unsuited for Japan Chapter 9 – The Economy -The myth that has been prevalent since 1945, that the central bank can cure all evils by cutting the interest rate, has been disproven – it has encouraged extreme complacency by those who continue to dig themselves deeper and deeper into debt -Japan and the current crisis have proven this false, as monetary policy has been largely unsuccessful -Total growth contraction or even a drastic slowdown in the growth of debt is deflationary

The Second Great Contraction 82
-Two principle reasons as to why money supply was not growing 1)undercapitalized banks were reluctant to lend 2)companies did not want to borrow (corporate profits fell and cost of capital rose dramatically) -“Debt deflations” –1)too high levels of aggregate debt depress economy because of all the money spent servicing the debt 2)leads to depression when there is an overall fall in pricing Avoiding an American “Lost Decade”: Lessons from Japan’s Bubble and Recession – written by Anthony Randazzo, Michael Flynnm and Adam B. Summers Introduction -Japanese government’s response was a wide-ranging mix of fiscal policy, monetary policy, and denial – erratic -Recessionary period came to be known as “Lost Decade” and was characterized by average growth rate of less than 1% Bubble Causes -Eased monetary policy fueled boom of domestic investment and increased consumption -Causes of Japan asset bubble and American housing bubble similar 1)Overly aggressive behavior of financial institutions and poor risk management -asset bubble – Japan housing prices increased 51% from 1985-1991 -US increased 90% from 2000-2006 -stock market – Japan went from 13,000 in 1986 to 38,975 at end of 1989 -US went from 7,489 in 2002 to 14,155 in Oct. 2007 2)Monetary policy errors -both central banks helped set off boom in asset prices by creating unsustainable credit expansion which drove interest rates artificially low -between 1986-1987, BoJ cuts rates from 5% to 2.5% -US cut rates in wake of dot-com bubble down to 2%, 3)Other government policies -Basel I Accord – set new capital requirements but focused on loan amount and not risk -Mark to market requirements in US – caused some mortgage assets to go from millions to zero overnight -Housing policy – Japan had taxation and regulatory policies that encouraged expansion -US encouraged big expansion in mortgage lending and subprime lending to expand homeownership for low-income families Recession Responses -Government lending to poorly managed firms – Japan lent large amounts of money to businesses in attempts to recapitalize failing firms – did not address underlying problems -US followed similar practices at onset of crisis – ex. Citigroup, AIG -Any injection of capital needs to come with clear rules and plans for firm to reorganize and address underlying problems -Government developing conflicting interests – with all the loans, Japanese government found itself too integrated to have adequate incentives for sound policy

The Second Great Contraction 83
-US in similar situation when they forced major banks to take bailout funds from TARP in exchange for equity stakes -Japanese government showed little effort to clean up banking system and at first refused to acknowledge the depth of the problems, enabled banks to hide toxic loans -Japanese politicians fearful of upsetting political and cultural norms -US runs the chance of falling into this trap with massive bailouts and quantitative easing providing no incentive for banks to address their toxic asset problem -Japan embarked on massive multi-billion yen infrastructure spending programs to jump-start economy – passed 10 fiscal stimulus plans - failed to promote private market investment which would have created proper free market activity -US trying same thing with $500B in infrastructure projects and a possible $500B in public works Japan’s Lost Decade: Origins, Consequences and Prospects for Recover – edited by Gary R. Saxonhouse and Robert M. Stern Chapter 1 -Lead-up to crisis – equity prices rose six fold -Land prices rose 4 times in decade ending 1989 -Average annual GDP growth of 3.9% -Many economists prepared to argue that new valuations were justified by economic fundamentals -Distinctive system of economic management by Japan -Unusually high national savings rate -Land and equity prices rose rapidly despite prices of goods and services remaining relatively stable -After crisis – average annual growth rate of no more than 1.2% -Equity prices had fallen 75% -Land prices had fallen 80% -Bubble may have been prevented by 1)introducing regulation on LTV in real estate lending 2)regulations regarding limits on lending to real estate sector -Policy -Neither government spending or tax cuts did much to stimulate economy -Insufficient use of fiscal measures -Concerns about size of public debt -Slow to acknowledge/write-off bad loans -Use of public money to bail out banks was politically impossible for most of the decade -Small spread between loan rates and deposit rates due to deregulation and competition made it hard for banks to cover any losses on loans -Interest rates of near zero, deflation and produced a liquidity trap -Competition from government sponsored institutions which account for 25% of loan market, 33% of deposit market, and 40% of life insurance market – these companies received subsidies from government and didn’t have to offer loan terms that make them profitable -Ways to resolve problem
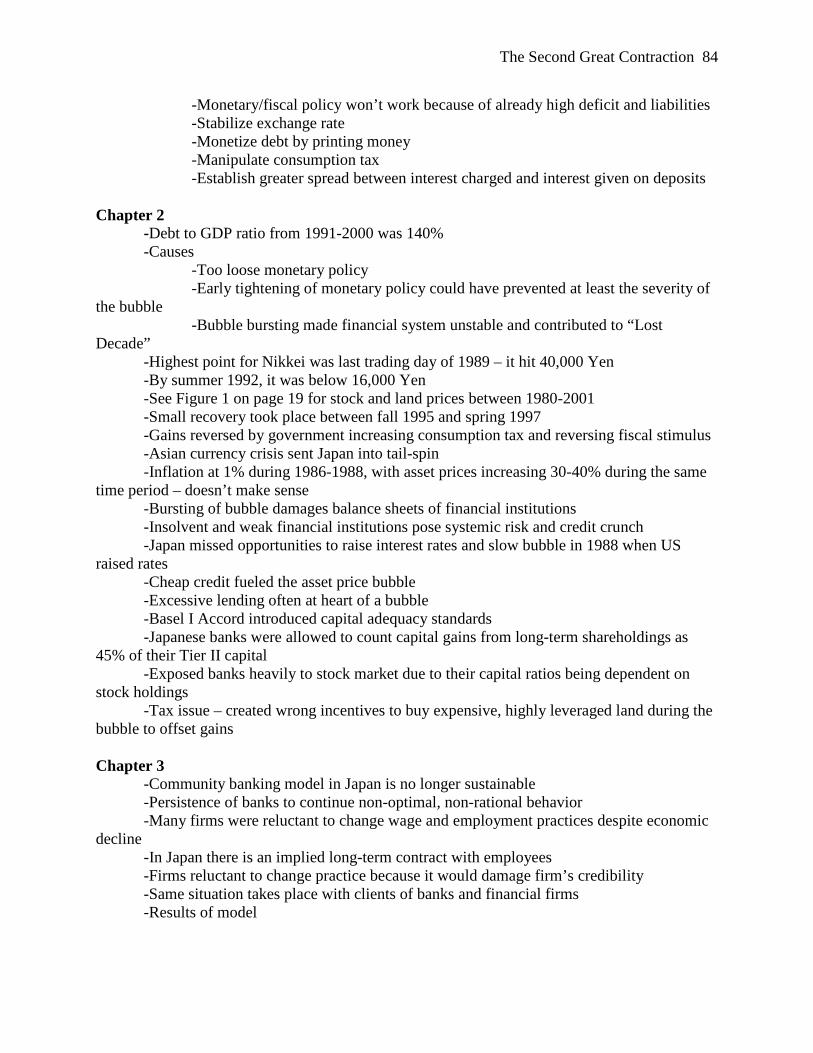
The Second Great Contraction 84
-Monetary/fiscal policy won’t work because of already high deficit and liabilities -Stabilize exchange rate -Monetize debt by printing money -Manipulate consumption tax -Establish greater spread between interest charged and interest given on deposits Chapter 2 -Debt to GDP ratio from 1991-2000 was 140% -Causes -Too loose monetary policy -Early tightening of monetary policy could have prevented at least the severity of the bubble -Bubble bursting made financial system unstable and contributed to “Lost Decade” -Highest point for Nikkei was last trading day of 1989 – it hit 40,000 Yen -By summer 1992, it was below 16,000 Yen -See Figure 1 on page 19 for stock and land prices between 1980-2001 -Small recovery took place between fall 1995 and spring 1997 -Gains reversed by government increasing consumption tax and reversing fiscal stimulus -Asian currency crisis sent Japan into tail-spin -Inflation at 1% during 1986-1988, with asset prices increasing 30-40% during the same time period – doesn’t make sense -Bursting of bubble damages balance sheets of financial institutions -Insolvent and weak financial institutions pose systemic risk and credit crunch -Japan missed opportunities to raise interest rates and slow bubble in 1988 when US raised rates -Cheap credit fueled the asset price bubble -Excessive lending often at heart of a bubble -Basel I Accord introduced capital adequacy standards -Japanese banks were allowed to count capital gains from long-term shareholdings as 45% of their Tier II capital -Exposed banks heavily to stock market due to their capital ratios being dependent on stock holdings -Tax issue – created wrong incentives to buy expensive, highly leveraged land during the bubble to offset gains Chapter 3 -Community banking model in Japan is no longer sustainable -Persistence of banks to continue non-optimal, non-rational behavior -Many firms were reluctant to change wage and employment practices despite economic decline -In Japan there is an implied long-term contract with employees -Firms reluctant to change practice because it would damage firm’s credibility -Same situation takes place with clients of banks and financial firms -Results of model
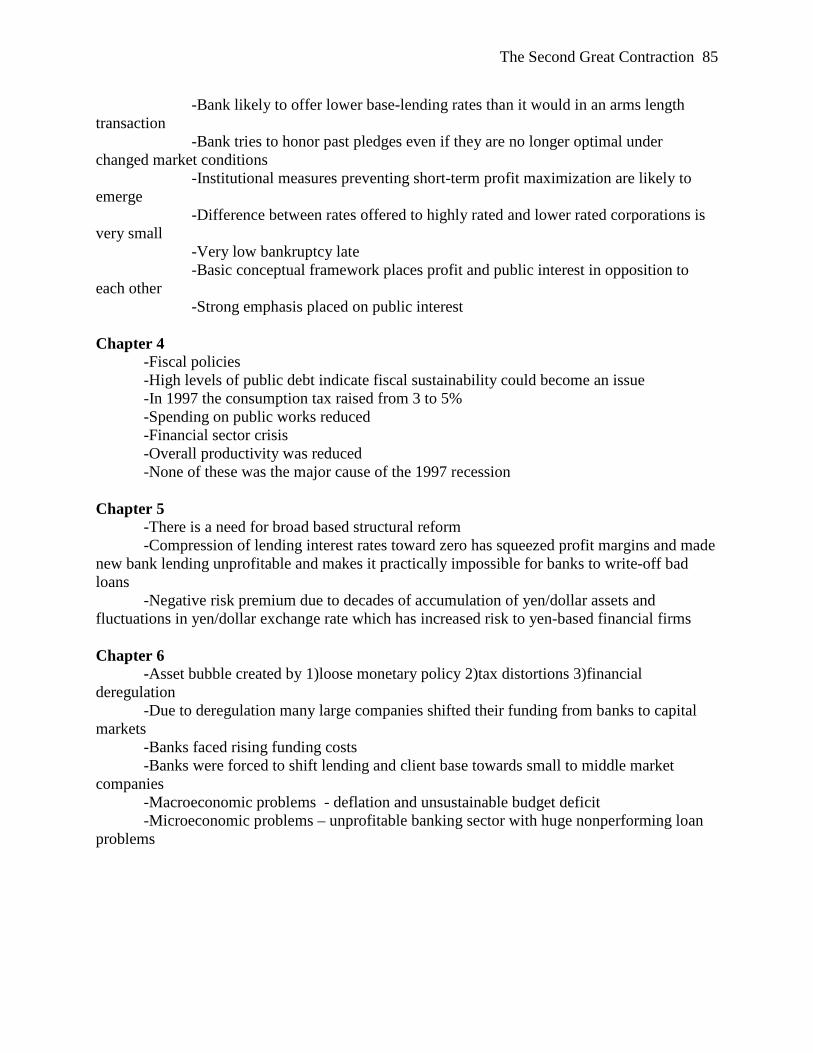
The Second Great Contraction 85
-Bank likely to offer lower base-lending rates than it would in an arms length transaction -Bank tries to honor past pledges even if they are no longer optimal under changed market conditions -Institutional measures preventing short-term profit maximization are likely to emerge -Difference between rates offered to highly rated and lower rated corporations is very small -Very low bankruptcy late -Basic conceptual framework places profit and public interest in opposition to each other -Strong emphasis placed on public interest Chapter 4 -Fiscal policies -High levels of public debt indicate fiscal sustainability could become an issue -In 1997 the consumption tax raised from 3 to 5% -Spending on public works reduced -Financial sector crisis -Overall productivity was reduced -None of these was the major cause of the 1997 recession Chapter 5 -There is a need for broad based structural reform -Compression of lending interest rates toward zero has squeezed profit margins and made new bank lending unprofitable and makes it practically impossible for banks to write-off bad loans -Negative risk premium due to decades of accumulation of yen/dollar assets and fluctuations in yen/dollar exchange rate which has increased risk to yen-based financial firms Chapter 6 -Asset bubble created by 1)loose monetary policy 2)tax distortions 3)financial deregulation -Due to deregulation many large companies shifted their funding from banks to capital markets -Banks faced rising funding costs -Banks were forced to shift lending and client base towards small to middle market companies -Macroeconomic problems - deflation and unsustainable budget deficit -Microeconomic problems – unprofitable banking sector with huge nonperforming loan problems

The Second Great Contraction 86
The Return of Depression Economics – written by Paul Krugman Introduction -Great Depression caused by 1)Hoover trying to balance budget in the face of an economic slump 2)Federal Reserve defended the gold standard at the expense of the domestic economy 3)Officials didn’t rush cash to threatened banks and calm the bank panic in 1930 -Stock market crash of 1929 could have been just a recession if handled properly -Great Depression brought on by collapse of effective demand and should have been fought with the Fed injecting large amounts of capital into the economy Chapter 3 -Japan was the worlds’ largest exporter of steel and autos -Japan’s economy is a somewhat directed economy with the Ministry of Finance in control -Major companies were insulated from short-term financial pressures due to practice of groups of allied firms owning substantial amounts of each other’s shares -1980’s was a time of prosperity but nothing justified tripling of both land and stock prices -Common feature of speculative fever - mainly financed by bank loans -Loose lending standards -Deregulation -Growth recession -Japan became embroiled in a liquidity trap -Government was slow to cut interest rates after initial decline of both equity and land prices -Private sector wasn’t spending enough to jump-start the economy -During the 1990’s government produced a series of stimulus packages – they did not get enough bang for their buck out of the packages -1998 – Government introduced $500B bank rescue plan and expected inflation to get economy out of liquidity trap -Great Depression persisted for so long because the banking crisis of 1930-31 inflicted long-term damage on credit markets Chapter 4 -Asian financial crisis of 1997 also fueled by real estate bubble -Massive inflow of foreign investment flooded the region -Implied government guarantees led to risky lending -Currency crisis ensued Chapter 5 -International community imposed fiscal austerity measures on Asian countries in response to Asian financial crisis -Required them to increase interest rates, cut spending, and increase taxes – counter intuitive to what is usually done in times of capital crisis -Done as an attempt to increase investor confidence in the counties economies and offering high interest rates may persuade investors to keep their money in place
The Second Great Contraction 87
-Policies largely dictated by IMF and US Treasury Chapter 7 -Greenspan’s legacy -Low interest rates created environment that led to housing price bubble -Change in lending practices due to securitization – lenders didn’t worry about quality of loans because they didn’t hold them on their books -Securitization began for subprime mortgages – historically only prime mortgages securitized -Creation of CDO’s made securitization of subprime mortgages possible -Changing of financial system magnified affects of the bursting housing bubble Chapter 8 -Great Depression – trusts began speculating in real estate and stock markets -Trusts were able to pay higher returns on deposits because of less regulation and types of investments -Trusts enjoyed the perception that they were just as safe as banks, but made much riskier loans than banks did -Creation of the Federal Reserve in 1913 -Goal of Federal Reserve was to compel all institutions who took deposits to keep adequate reserves and open accounts to inspection by regulators -As economy slumped in the 1930’s, highly indebted farmers defaulted on loans – followed by bank runs -Bank crisis is what turned a serious recession into a depression -Glass-Steagall Act separated commercial banks from investment banks -Commercial banks were sharply restricted in risks they could take but in turn had access to credit from the Fed and deposits were insured -Investment banks were less regulated which was considered acceptable because they didn’t take deposits and so weren’t subject to bank runs -Auction rate securities – Lend money to institutions on a long-term basis – at intervals the institution holds auctions which allows new investors to bid for right to replace investors who would like to get out -Not protected by banking safety net -Collapsed in 2008 after auctions failed because there were too few new investors to replace those who wanted out -People who thought they had easy access to their cash suddenly discovered they couldn’t get it out -Similar outcome as a bank run -In early 2007, asset-back securities, commercial paper, and auction-rate securities were valued at roughly $2.2T -In 1999, Glass-Steagall Act repealed and commercial banks were allowed to get into investment banking business and take on significantly more risk -Current crisis primarily caused by non-regulated institutions (Investment banks)

The Second Great Contraction 88
Chapter 9 -In August 2007, France’s BNP Paribas suspended withdrawals from 3 of its funds – essentially signaling the beginning of the crisis -Similarities to both the Great Depression and Japan’s crisis – 1)Real estate bubble (Japan) 2)Sudo bank runs on investment banks (GP) 3)Liquidity trap/credit crunch (Japan) 4)Disruptions of international capital flows (both) -Housing bubble began to deflate in fall 2005 -By spring 2006, housing prices began to fall slowly -By 2007 prices were only down 3%, but over the next year fell nearly 15% -Financial engineering so complex made it nearly impossible to workout defaulted subprime mortgages -In early 2007, as defaults began to rise, lower tranches of CDO’s began to not be paid out and prices for those shares plummeted -This essentially put an end to subprime lending because nobody would buy the junior shares -Financing disappeared, removing important sources of housing demand, reinforcing the slump -Nationally, houses were probably over-valued by 50% -Collapse of such a severe bubble cost any lender who bought MBS to lose massive amounts of money -Triggered collapse of the shadow banking system -Declining asset values damaged balance sheets which forced further sales, further deteriorating prices – same principle as Asian crisis of the late 1990’s -Auction-rate securities ($330B), asset-backed securities ($1.2T) all but disappeared -Bank lending nowhere near made up for the loss of these sources of financing -By October ’08, consumer credit was decreasing as well, with limits decreased and applicants being turned down -Led to Japan style liquidity trap -Fed aggressively cut rates and increased lending to banks -Much like in Japan, monetary policy was largely ineffective -Fed introduced special lending and began buying commercial paper -Due to globalized financial system, crisis spread worldwide Chapter 10 -Need regulations on shadow banking system -Need better transparency and understanding of financial institutions -Government intervention should prevent today’s crisis from being as sever as the Great Depression The Subprime Solution – written by Robert J. Shiller Chapter 1 -Last major housing crisis between 1925-1933 -Home prices decreased 30% and unemployment rose to 25% -Great Depression created major innovations in real estate and financial industry -Refer to p. 18 for measures taken by US in current crisis

The Second Great Contraction 89
-In the long-run, need to develop risk-management to inhibit the growth of bubbles Chapter 2 -Housing bubble a major cause, if not the cause, of the current crisis -Real estate home prices increased 85% from 1997-2006 -Misalignment of home prices with economic fundamentals is strongly suggestive of economic instability – similar to Japan Chapter 3 -Social contagion of boom thinking -Major causes of current crisis 1)Fed rate at 1% mid 2003-mid 2004 2)Failure to reign in aggressive lending 3)Weakening of credit standards Chapter 5 -First time since 1930’s that Fed extended bailouts to banks not under Fed supervision -Fed took securities including subprime paper as collateral for loans -2008 stimulus act included tax rebates to those with lower income, will eventually have to be paid for in higher taxes, predominantly those with higher incomes -Unfortunate short-term remedy is bailouts -Immediate fix is similar to what should have been done in Great Depression -Need new organization similar to the HOLC (created in 1933) to make more credit available to home borrowers -Need to establish new mortgage-writing conventions -Need to pay attention to capital adequacy of banks and broker dealers -Need to devote sufficient resources to making sure the bailouts are carried out efficiently and have the greatest impact Chapter 6 -Long-term solutions -Financial democratization – extending the application of sound financial principals to a larger segment of society – reduces long run occurrence of speculative bubbles -Information technology – expands risk management capabilities -Agency theory – explains how to keep moral hazard under control -Develop better understanding of behavioral economics -Policy for long-term solutions -Comprehensive financial advice available to more people -New financial watchdog to protect financial consumer, provide resources for information safety on products and impose regulations to ensure safety of those products -Improved financial disclosure for banks and other financial institutions -Improved financial databases -New markets for real estate – ex. single-family home price futures market -Truly liquid market has potential to tame speculative bubbles, not yet truly liquid -Other markets could include options, swaps, and forwards

The Second Great Contraction 90