Embed Size (px)
Citation preview

THE SEJONG OPEN CLUSTER SURVEY (SOS). IV. THE YOUNG OPEN CLUSTERS NGC 1624 AND NGC 1931
Beomdu Lim1,5, Hwankyung Sung
2, Michael S. Bessell
3, Jinyoung S. Kim
4, Hyeonoh Hur
2, and Byeong-Gon Park
1
1 Korea Astronomy and Space Science Institute, 776 Daedeokdae-ro, Yuseong-gu, Daejeon 305-348, Korea; [email protected] Department of Astronomy and Space Science, Sejong University, 209 Neungdong-ro, Gwangjin-gu, Seoul 143-747, Korea
3 Research School of Astronomy and Astrophysics, Australian National University, MSO, Cotter Road, Weston, ACT 2611, Australia4 Steward Observatory, University of Arizona, 933 N. Cherry Ave. Tucson, AZ 85721-0065, USA
Received 2014 September 16; accepted 2015 January 30; published 2015 March 12
ABSTRACT
Young open clusters located in the outer Galaxy provide us with an opportunity to study star formation activity in adifferent environment from the solar neighborhood. We present a UBVI and Hα photometric study of the youngopen clusters NGC 1624 and NGC 1931 that are situated toward the Galactic anticenter. Various photometricdiagrams are used to select the members of the clusters and to determine the fundamental parameters. NGC 1624and NGC 1931 are, on average, reddened by á - ñE B V( ) = 0.92 ± 0.05 and 0.74± 0.17 mag, respectively. Theproperties of the reddening toward NGC 1931 indicate an abnormal reddening law (RV ,cl = 5.2 ± 0.3). Using thezero-age main sequence fitting method we confirm that NGC 1624 is 6.0± 0.6 kpc away from the Sun, whereasNGC 1931 is at a distance of 2.3± 0.2 kpc. The results from isochrone fitting in the Hertzsprung–Russell diagramindicate the ages of NGC 1624 and NGC 1931 to be less than 4 and 1.5–2.0 Myr, respectively. We derived theinitial mass function (IMF) of the clusters. The slope of the IMF (GNGC 1624 = −2.0 ± 0.2 and GNGC 1931 = −2.0 ±0.1) appears to be steeper than that of the Salpeter/Kroupa IMF. We discuss the implication of the derived IMFbased on simple Monte-Carlo simulations and conclude that the property of star formation in the clusters does notseem to be significantly different from that in the solar neighborhood.
Key words: dust, extinction – open clusters and associations: individual (NGC 1624, NGC 1931) – stars:luminosity function, mass function
1. INTRODUCTION
Young open clusters are useful objects to study the starformation process because about 80% of the stars in star-formingregions (SFRs) are found in clusters with at least 100 members(Lada & Lada 2003; Porras et al. 2003). The relationshipbetween star formation activity and environmental conditions isone of the most interesting issues in star formation studies(Caramazza et al. 2008, 2012). A basic diagnostic tool forunderstanding star formation processes is the stellar initial massfunction (IMF). The concept was first introduced by Salpeter(1955). If the stellar IMF has a universal shape in all SFRs, theremust be a fundamental factor controlling the star formationprocess. A number of efforts have been devoted to confirming theuniversality (see review of Bastian et al. 2010); however, there isas yet no firm conclusion concerning the universality or diversityof the shape. In this context, the IMF of young open clustersformed in various star-forming environments may provide a clueto the dependence of star formation processes on environmentalconditions. As part of an attempt to study this issue, weinvestigated the young open clusters NGC 1624 and NGC 1931in the outer Galaxy, which is probably a low-metallicityenvironment, according to the gradient of metal abundance inthe Galactic disk (Yong et al. 2012).
The young open cluster NGC 1624 is surrounded by the H II
region Sh2-212 with a shell like structure. The cluster comprisesseveral high-mass main sequence (MS) stars, as well as a largenumber of pre-main sequence (PMS) stars (Jose et al. 2011). Themost luminous star is NGC 1624-2 (O7f?p—Walbornet al. 2010; Sota et al. 2011) located near the cluster center.This star, which has strong X-ray emission, is known to be
slowly rotating with a very strong magnetic field (Wadeet al. 2012). Out of all the probable PMS members, one-fifthhave circumstellar disks (Jose et al. 2011). From their radioobservations, Deharveng et al. (2008) found an ultra-compactH II (UCHII) region at the border of Sh2-212. A high-mass PMSstar (No. 228 of Deharveng et al. 2008) seems to be associatedwith the UCHII. A few photometric studies of NGC 1624provided the fundamental parameters (Moffat et al. 1979; Chini&Wink 1984; Sujatha & Babu 2006; Deharveng et al. 2008; Joseet al. 2011). The reddening of the cluster is about
- =E B V( ) 0.7–0.9mag. The previously determined distanceto the cluster was in the range 6.0–6.5 kpc (Moffat et al. 1979;Sujatha & Babu 2006; Deharveng et al. 2008; Jose et al. 2011),but Chini & Wink (1984) obtained a far different value of10.3 kpc. The IMF of the cluster was investigated by Sujatha &Babu (2006) and Jose et al. (2011), and its slope was reasonablyconsistent with the Salpeter/Kroupa IMF (Salpeter 1955;Kroupa 2001, 2002). It implies that although NGC 1624 islocated in the outer Galaxy, the nature of the star formationactivity is similar to that found in the solar neighborhood.The nearer and younger open cluster NGC 1931 is
associated with the glowing nebula Sh2-237. A few brightMS stars and many PMS stars constitute the cluster (Pandeyet al. 2013a). The main ionizing source of the bright nebula isthought to be the B0.5 star (Glushkov et al. 1975) or two B2stars (Pandey et al. 2013a). A number of PMS star candidateswere identified by Pandey et al. (2013a) from the TwoMicron All Sky Survey (2MASS; Skrutskie et al. 2006)catalog and Spitzer InfraRed Array Camera (IRAC) photo-metry. The spatial distribution of members seems to bedivided into two stellar groups, a northern and a southerngroup (Bonatto & Bica 2009; Pandey et al. 2013a). Thefundamental parameters of the cluster were obtained fromphotometric studies (Moffat et al. 1979; Pandey &
The Astronomical Journal, 149:127 (25pp), 2015 April doi:10.1088/0004-6256/149/4/127© 2015. The American Astronomical Society. All rights reserved.
5 Corresponding author, Korea Research Council of Fundamental Science andTechnology Research Fellow.
1
Mahra 1986; Bhatt et al. 1994; Bonatto & Bica 2009; Pandeyet al. 2013a). According to these studies, the reddening anddistance of the cluster are - =E B V( ) 0.5–1.0 mag andd = 1.8–2.4 kpc, respectively. A recent study (Pandeyet al. 2013a) investigated the properties of dust toward thecluster using polarimetric and photometric data. The red-dening law toward the cluster estimated from the Serkowskilaw (Serkowski et al. 1975) and color excess ratios indicatedthat the size distribution of dust grains may be different fromthat of the general diffuse interstellar medium (ISM). Theyalso derived the IMF of the northern, southern, and entirecluster regions, respectively. The slope of the IMF appears tobe shallower than the Salpeter/Kroupa IMF.
The present work on NGC 1624 and NGC 1931 is the fifthpaper of the Sejong Open cluster Survey (SOS) project whichwas initiated to provide homogeneous photometric data formany open clusters. The overview of the SOS project can befound in Sung et al. (2013a) (hereafter Paper 0). Comprehen-sive studies of several open clusters NGC 2353, IC 1848, andNGC 1893 were published as part of the project (Limet al. 2011, 2014a, 2014b). In this work, we revisit thereddening law as well as the fundamental parameters of theseclusters in a homogeneous manner. The IMF of the clusters isalso studied in order to investigate the property of starformation activity in the outer Galaxy. The observation andreliability of our photometry are described in Section 2. InSection 3, we present several fundamental parameters of theclusters obtained from photometric diagrams. The reddeninglaw toward two clusters is also discussed in this section. Weconstruct the Hertzsprung–Russell diagram (HRD) in Section 4and derive the IMF of the clusters in Section 5. Severaldiscussions on the age spread of PMS stars are made inSection 6. Finally, the comprehensive results from this studyare summarized in Section 7.
2. OBSERVATION
2.1. AZT-22 1.5 m Telescope of MaidanakAstronomical Observatory (MAO)
The observations of NGC 1624 were made on 2006November 24, using the AZT-22 1.5 m telescope (f/7.74) atMAO in Uzbekistan. All imaging data were acquired usingFairchild 486 CCD camera (SNUCam; Im et al. 2010) with thestandard Bessell UBVI filters (Bessell 1990). The field of view(FOV) is about ¢ ´ ¢18.1 18.1. The characteristics of the CCDchip have been described by Lim et al. (2008) in detail. Theobservations comprised 8 frames that were taken in two sets ofexposure times for each band: 3 and 60 s in I, 3 and 180 s in V,5 and 300 s in B, and 15 and 600 s in U. To transforminstrumental magnitudes to standard magnitudes and colors, wemade observations of several equatorial standard stars(Menzies et al. 1991) over a wide air mass range of X ∼1.2–2.0 on the same night. The observations are summarized inTable 1, and the left-hand panel in Figure 1 displays the finderchart (dashed line) for the observed stars brighter thanV = 18 mag.
All pre-processing to remove instrumental artifacts wascarried out using the IRAF6/CCDRED packages as described in
Lim et al. (2008). Simple aperture photometry was performedfor the standard stars with an aperture size of 14.0 arcsec(26.3 pixels). Atmospheric extinction coefficients were deter-mined from the photometric data of the standard stars with aweighted least-square method. The coefficients are presentedwith photometric zero points in Table 2. Using IRAF/DAOPHOT we conducted point-spread function (PSF) photo-metry on stars in the target images using a small fitting radiusof 1 FWHM (⩽1.0 arcsec), and then aperture correction wasdone using the aperture photometry of bright, isolated starswith a photometric error smaller than 0.01 mag in individualtarget images. The instrumental magnitude was transformed tothe standard magnitude and colors using the transformationequations below (Paper 0):
h a z= - - + + +l l l l l l l( )M m k k C X C UT· · · ˆ (1)1 2
where Mλ, mλ, k1λ, k2λ, ηλ, C, X, αλ, UT̂ , and ζλ are thestandard magnitude, instrumental magnitude, the primaryextinction coefficient, the secondary extinction coefficient,transformation coefficient, relevant color, air mass, time-variation coefficient, time difference relative to midnight, andphotometric zero point, respectively. We adopted the SNUCamtransformation coefficients (ηλ), which were recently refinedfrom those in Lim et al. (2009).
2.2. Kuiper 61" Telescope of Steward Observatory (SO)
The observations of NGC 1624 and NGC 1931 were madeon 2011 October 29, using the Kuiper 61" telescope (f/13.5) ofSO on Mt. Bigelow in Arizona, USA. We obtained images withthe Mont4k CCD camera and 5 filters (Bessell U, Harris BV,Arizona I, and Hα). The FOV is about ¢ ´ ¢9.7 9.7. Later,additional images of NGC 1931 were taken on 2013 February5, without the Hα filter. Since typical seeing was 1. 0– 2. 0
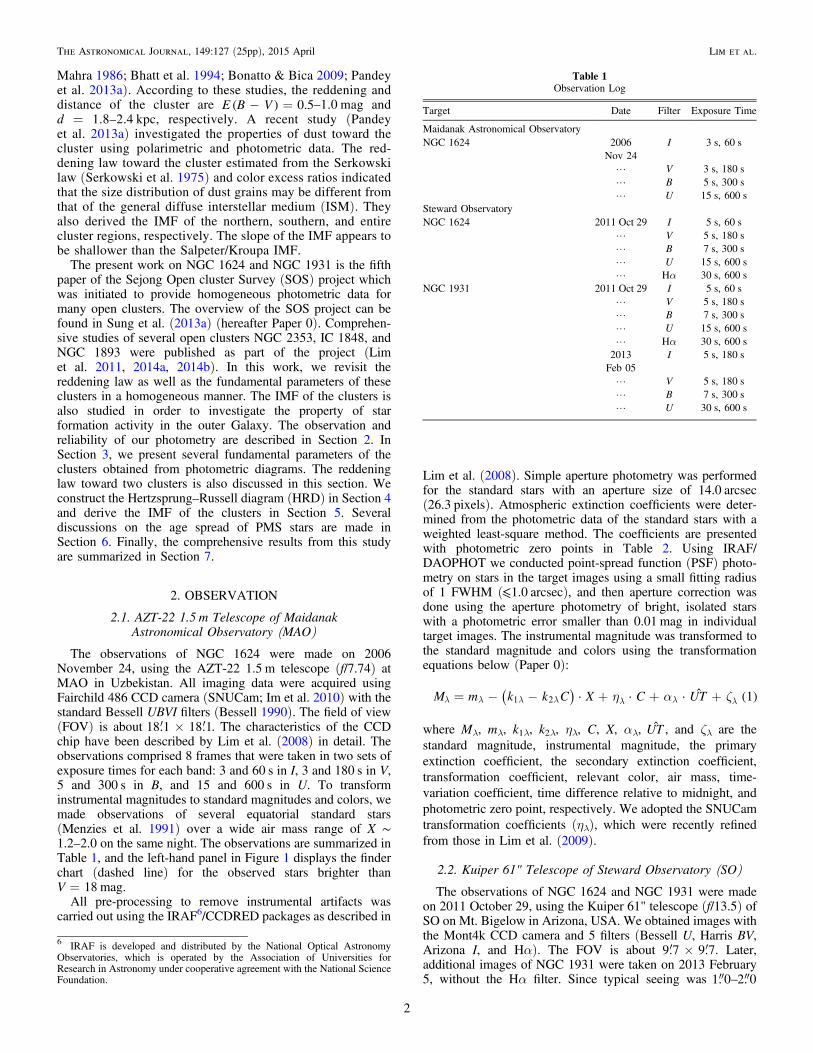
Table 1Observation Log
Target Date Filter Exposure Time
Maidanak Astronomical ObservatoryNGC 1624 2006
Nov 24I 3 s, 60 s
L V 3 s, 180 sL B 5 s, 300 sL U 15 s, 600 s
Steward ObservatoryNGC 1624 2011 Oct 29 I 5 s, 60 s
L V 5 s, 180 sL B 7 s, 300 sL U 15 s, 600 sL Hα 30 s, 600 s
NGC 1931 2011 Oct 29 I 5 s, 60 sL V 5 s, 180 sL B 7 s, 300 sL U 15 s, 600 sL Hα 30 s, 600 s
2013Feb 05
I 5 s, 180 s
L V 5 s, 180 sL B 7 s, 300 sL U 30 s, 600 s
6 IRAF is developed and distributed by the National Optical AstronomyObservatories, which is operated by the Association of Universities forResearch in Astronomy under cooperative agreement with the National ScienceFoundation.
2
The Astronomical Journal, 149:127 (25pp), 2015 April Lim et al.
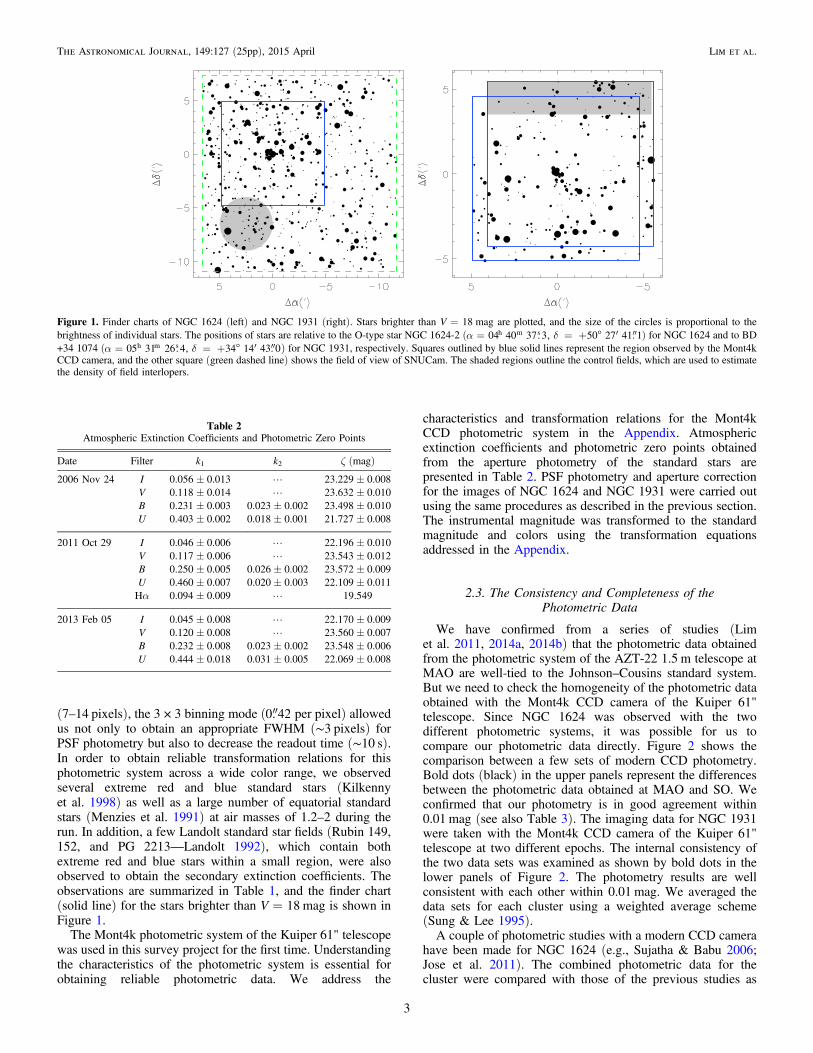
(7–14 pixels), the 3 × 3 binning mode ( 0. 42 per pixel) allowedus not only to obtain an appropriate FWHM (∼3 pixels) forPSF photometry but also to decrease the readout time (∼10 s).In order to obtain reliable transformation relations for thisphotometric system across a wide color range, we observedseveral extreme red and blue standard stars (Kilkennyet al. 1998) as well as a large number of equatorial standardstars (Menzies et al. 1991) at air masses of 1.2–2 during therun. In addition, a few Landolt standard star fields (Rubin 149,152, and PG 2213—Landolt 1992), which contain bothextreme red and blue stars within a small region, were alsoobserved to obtain the secondary extinction coefficients. Theobservations are summarized in Table 1, and the finder chart(solid line) for the stars brighter than V = 18 mag is shown inFigure 1.
The Mont4k photometric system of the Kuiper 61" telescopewas used in this survey project for the first time. Understandingthe characteristics of the photometric system is essential forobtaining reliable photometric data. We address the
characteristics and transformation relations for the Mont4kCCD photometric system in the Appendix. Atmosphericextinction coefficients and photometric zero points obtainedfrom the aperture photometry of the standard stars arepresented in Table 2. PSF photometry and aperture correctionfor the images of NGC 1624 and NGC 1931 were carried outusing the same procedures as described in the previous section.The instrumental magnitude was transformed to the standardmagnitude and colors using the transformation equationsaddressed in the Appendix.
2.3. The Consistency and Completeness of thePhotometric Data
We have confirmed from a series of studies (Limet al. 2011, 2014a, 2014b) that the photometric data obtainedfrom the photometric system of the AZT-22 1.5 m telescope atMAO are well-tied to the Johnson–Cousins standard system.But we need to check the homogeneity of the photometric dataobtained with the Mont4k CCD camera of the Kuiper 61"telescope. Since NGC 1624 was observed with the twodifferent photometric systems, it was possible for us tocompare our photometric data directly. Figure 2 shows thecomparison between a few sets of modern CCD photometry.Bold dots (black) in the upper panels represent the differencesbetween the photometric data obtained at MAO and SO. Weconfirmed that our photometry is in good agreement within0.01 mag (see also Table 3). The imaging data for NGC 1931were taken with the Mont4k CCD camera of the Kuiper 61"telescope at two different epochs. The internal consistency ofthe two data sets was examined as shown by bold dots in thelower panels of Figure 2. The photometry results are wellconsistent with each other within 0.01 mag. We averaged thedata sets for each cluster using a weighted average scheme(Sung & Lee 1995).A couple of photometric studies with a modern CCD camera
have been made for NGC 1624 (e.g., Sujatha & Babu 2006;Jose et al. 2011). The combined photometric data for thecluster were compared with those of the previous studies as
Figure 1. Finder charts of NGC 1624 (left) and NGC 1931 (right). Stars brighter than V = 18 mag are plotted, and the size of the circles is proportional to thebrightness of individual stars. The positions of stars are relative to the O-type star NGC 1624-2 (a d= = + ¢ 04 40 37. 3, 50 27 41. 1h m s ) for NGC 1624 and to BD+34 1074 (a d= = + ¢ 05 31 26. 4, 34 14 43. 0h m s ) for NGC 1931, respectively. Squares outlined by blue solid lines represent the region observed by the Mont4kCCD camera, and the other square (green dashed line) shows the field of view of SNUCam. The shaded regions outline the control fields, which are used to estimatethe density of field interlopers.
Table 2Atmospheric Extinction Coefficients and Photometric Zero Points
Date Filter k1 k2 ζ (mag)
2006 Nov 24 I 0.056 ± 0.013 L 23.229 ± 0.008V 0.118 ± 0.014 L 23.632 ± 0.010B 0.231 ± 0.003 0.023 ± 0.002 23.498 ± 0.010U 0.403 ± 0.002 0.018 ± 0.001 21.727 ± 0.008
2011 Oct 29 I 0.046 ± 0.006 L 22.196 ± 0.010V 0.117 ± 0.006 L 23.543 ± 0.012B 0.250 ± 0.005 0.026 ± 0.002 23.572 ± 0.009U 0.460 ± 0.007 0.020 ± 0.003 22.109 ± 0.011Hα 0.094 ± 0.009 L 19.549
2013 Feb 05 I 0.045 ± 0.008 L 22.170 ± 0.009V 0.120 ± 0.008 L 23.560 ± 0.007B 0.232 ± 0.008 0.023 ± 0.002 23.548 ± 0.006U 0.444 ± 0.018 0.031 ± 0.005 22.069 ± 0.008
3
The Astronomical Journal, 149:127 (25pp), 2015 April Lim et al.
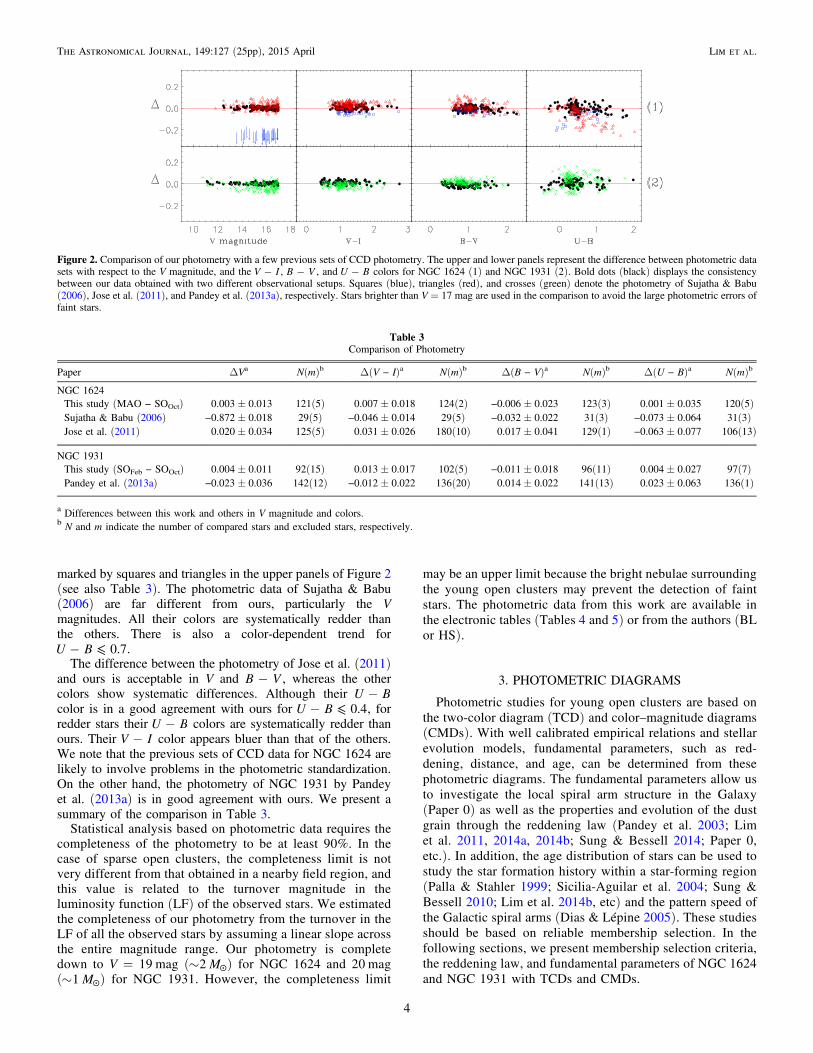
marked by squares and triangles in the upper panels of Figure 2(see also Table 3). The photometric data of Sujatha & Babu(2006) are far different from ours, particularly the Vmagnitudes. All their colors are systematically redder thanthe others. There is also a color-dependent trend for
- ⩽U B 0.7.The difference between the photometry of Jose et al. (2011)
and ours is acceptable in V and -B V , whereas the othercolors show systematic differences. Although their -U Bcolor is in a good agreement with ours for - ⩽U B 0.4, forredder stars their -U B colors are systematically redder thanours. Their -V I color appears bluer than that of the others.We note that the previous sets of CCD data for NGC 1624 arelikely to involve problems in the photometric standardization.On the other hand, the photometry of NGC 1931 by Pandeyet al. (2013a) is in good agreement with ours. We present asummary of the comparison in Table 3.
Statistical analysis based on photometric data requires thecompleteness of the photometry to be at least 90%. In thecase of sparse open clusters, the completeness limit is notvery different from that obtained in a nearby field region, andthis value is related to the turnover magnitude in theluminosity function (LF) of the observed stars. We estimatedthe completeness of our photometry from the turnover in theLF of all the observed stars by assuming a linear slope acrossthe entire magnitude range. Our photometry is completedown to V = 19 mag (~ ☉M2 ) for NGC 1624 and 20 mag(~ ☉M1 ) for NGC 1931. However, the completeness limit
may be an upper limit because the bright nebulae surroundingthe young open clusters may prevent the detection of faintstars. The photometric data from this work are available inthe electronic tables (Tables 4 and 5) or from the authors (BLor HS).
3. PHOTOMETRIC DIAGRAMS
Photometric studies for young open clusters are based onthe two-color diagram (TCD) and color–magnitude diagrams(CMDs). With well calibrated empirical relations and stellarevolution models, fundamental parameters, such as red-dening, distance, and age, can be determined from thesephotometric diagrams. The fundamental parameters allow usto investigate the local spiral arm structure in the Galaxy(Paper 0) as well as the properties and evolution of the dustgrain through the reddening law (Pandey et al. 2003; Limet al. 2011, 2014a, 2014b; Sung & Bessell 2014; Paper 0,etc.). In addition, the age distribution of stars can be used tostudy the star formation history within a star-forming region(Palla & Stahler 1999; Sicilia-Aguilar et al. 2004; Sung &Bessell 2010; Lim et al. 2014b, etc) and the pattern speed ofthe Galactic spiral arms (Dias & Lépine 2005). These studiesshould be based on reliable membership selection. In thefollowing sections, we present membership selection criteria,the reddening law, and fundamental parameters of NGC 1624and NGC 1931 with TCDs and CMDs.
Figure 2. Comparison of our photometry with a few previous sets of CCD photometry. The upper and lower panels represent the difference between photometric datasets with respect to the V magnitude, and the -V I , -B V , and -U B colors for NGC 1624 (1) and NGC 1931 (2). Bold dots (black) displays the consistencybetween our data obtained with two different observational setups. Squares (blue), triangles (red), and crosses (green) denote the photometry of Sujatha & Babu(2006), Jose et al. (2011), and Pandey et al. (2013a), respectively. Stars brighter than V = 17 mag are used in the comparison to avoid the large photometric errors offaint stars.
Table 3Comparison of Photometry
Paper ΔVa N(m)b Δ(V − I)a N(m)b Δ(B − V)a N(m)b Δ(U − B)a N(m)b
NGC 1624This study (MAO − SOOct) 0.003 ± 0.013 121(5) 0.007 ± 0.018 124(2) −0.006 ± 0.023 123(3) 0.001 ± 0.035 120(5)Sujatha & Babu (2006) −0.872 ± 0.018 29(5) −0.046 ± 0.014 29(5) −0.032 ± 0.022 31(3) −0.073 ± 0.064 31(3)Jose et al. (2011) 0.020 ± 0.034 125(5) 0.031 ± 0.026 180(10) 0.017 ± 0.041 129(1) −0.063 ± 0.077 106(13)
NGC 1931This study (SOFeb − SOOct) 0.004 ± 0.011 92(15) 0.013 ± 0.017 102(5) −0.011 ± 0.018 96(11) 0.004 ± 0.027 97(7)Pandey et al. (2013a) −0.023 ± 0.036 142(12) −0.012 ± 0.022 136(20) 0.014 ± 0.022 141(13) 0.023 ± 0.063 136(1)
a Differences between this work and others in V magnitude and colors.b N and m indicate the number of compared stars and excluded stars, respectively.
4
The Astronomical Journal, 149:127 (25pp), 2015 April Lim et al.

Table 4Photometric Data for NGC 1624
ID aJ2000 dJ2000 V I -V I -B V -U B -H Ca V I -V I -B V -U B -H C Nobs 2MASSID Hαb
2325 04 40 39.03 +50 34 39.2 21.479 19.533 1.931 1.367 L L 0.091 0.086 0.125 0.194 L L 1 1 1 1 0 0 L L2326 04 40 39.05 +50 28 24.4 18.969 17.068 1.883 1.625 1.419 −0.353 0.010 0.002 0.023 0.056 0.176 0.057 3 5 3 2 1 2 04403905+5028245 h2327 04 40 39.07 +50 27 15.1 L 18.484 L L L L L 0.030 L L L L 0 2 0 0 0 0 L L2328 04 40 39.08 +50 27 13.4 L 19.119 L L L L L 0.226 L L L L 0 2 0 0 0 0 L L2329 04 40 39.08 +50 30 41.7 21.374 19.444 1.858 1.138 L L 0.085 0.004 0.060 0.113 L L 2 3 2 1 0 0 L L2330 04 40 39.10 +50 25 35.9 19.491 17.965 1.518 1.261 0.658 −0.145 0.001 0.001 0.005 0.018 0.054 0.061 2 3 2 2 2 1 04403910+5025356 L2331 04 40 39.12 +50 27 27.6 20.972 18.660 2.256 1.732 L L 0.006 0.001 0.040 0.162 L L 2 3 2 2 0 0 04403915+5027275 L2332 04 40 39.19 +50 27 05.9 L 19.340 L L L L L 0.042 L L L L 0 2 0 0 0 0 L L2333 04 40 39.20 +50 27 07.9 21.751 18.229 3.523 L L L 0.186 0.012 0.186 L L L 1 2 1 0 0 0 04403919+5027075 L2334 04 40 39.22 +50 27 40.2 16.956 15.828 1.138 0.844 0.251 −0.327 0.003 0.012 0.016 0.010 0.011 0.007 4 5 4 4 3 2 04403923+5027402 H2335 04 40 39.24 +50 18 01.8 20.933 18.638 2.294 1.798 L L 0.083 0.007 0.083 0.207 L L 1 2 1 1 0 0 04403923+5018016 L2336 04 40 39.24 +50 27 14.2 L 18.519 L L L L L 0.027 L L L L 0 2 0 0 0 0 L L2337 04 40 39.26 +50 19 06.5 21.818 20.007 1.811 L L L 0.152 0.145 0.210 L L L 1 1 1 0 0 0 L L2338 04 40 39.30 +50 27 11.6 15.843 14.918 0.920 0.691 −0.039 0.219 0.001 0.003 0.003 0.005 0.005 0.006 4 5 4 4 4 2 04403929+5027116 L2339 04 40 39.32 +50 28 47.4 18.428 17.077 1.350 1.059 0.428 0.156 0.013 0.023 0.011 0.008 0.020 0.041 4 5 4 3 2 1 04403931+5028473 L2340 04 40 39.32 +50 31 39.1 21.388 18.611 2.801 1.465 L L 0.063 0.006 0.045 0.244 L L 2 3 2 1 0 0 04403932+5031392 L2341 04 40 39.34 +50 27 19.6 13.204 12.338 0.859 0.623 −0.298 0.147 0.005 0.008 0.001 0.001 0.001 0.018 3 5 3 3 3 1 04403935+5027196 L2342 04 40 39.38 +50 33 01.5 16.611 15.251 1.352 1.131 0.627 L 0.004 0.002 0.004 0.004 0.014 L 2 3 2 2 1 0 04403938+5033015 L
a -H C represents the Hα index [ aº - +V IH ( ) 2].b H: Hα emission stars; h: Hα emission star candidates.
5
TheAstronomicalJournal,149:127
(25pp),2015
April
Lim
etal.
Table 5Photometric Data for NGC 1931
ID aJ2000 dJ2000 V I -V I -B V -U B -H C V I -V I -B V -U B -H C Nobs 2MASSID Hα
705 05 31 23.46 +34 12 27.6 21.091 18.103 3.031 L L −1.609 0.007 0.031 0.058 L L 0.079 2 3 2 0 0 1 05312347+3412276 H706 05 31 23.47 +34 10 47.2 21.032 18.326 2.690 1.529 L −0.555 0.041 0.037 0.071 0.221 L 0.099 2 3 2 2 0 1 05312345+3410471 H707 05 31 23.47 +34 13 28.0 19.460 17.885 1.567 1.205 0.593 0.038 0.001 0.013 0.013 0.062 0.083 0.073 3 4 3 2 2 1 05312347+3413281 -708 05 31 23.48 +34 12 18.4 21.762 18.790 2.950 L L L 0.085 0.029 0.050 L L L 2 2 2 0 0 0 05312349+3412182 -709 05 31 23.49 +34 13 06.1 20.549 17.648 2.938 1.704 L −1.336 0.001 0.045 0.056 0.105 L 0.058 2 4 2 2 0 1 05312347+3413060 H710 05 31 23.50 +34 14 02.0 21.590 18.543 3.048 L L −1.852 0.084 0.054 0.100 L L 0.109 1 1 1 0 0 1 L L711 05 31 23.51 +34 18 16.3 20.080 18.087 1.985 1.519 L 0.055 0.027 0.001 0.021 0.062 L 0.058 2 3 2 2 0 1 05312351+3418161 L712 05 31 23.53 +34 14 44.8 21.151 18.865 2.286 L L L 0.104 0.062 0.121 L L L 1 1 1 0 0 0 05312356+3414448 L713 05 31 23.53 +34 13 41.5 17.125 15.433 1.629 1.346 0.648 0.023 0.020 0.019 0.004 0.031 0.014 0.013 4 4 4 4 4 2 05312353+3413415 L714 05 31 23.55 +34 15 05.5 16.541 15.444 1.091 0.782 0.479 0.313 0.008 0.002 0.010 0.006 0.009 0.012 4 4 4 4 4 2 05312355+3415056 L715 05 31 23.57 +34 13 09.2 21.865 18.669 3.196 L L −1.347 0.116 0.047 0.125 L L 0.154 1 1 1 0 0 1 05312357+3413097 L716 05 31 23.57 +34 13 35.3 19.420 17.059 2.377 1.811 L L 0.045 0.004 0.044 0.057 L L 4 4 4 2 0 0 05312356+3413353 L717 05 31 23.60 +34 10 59.6 20.964 17.982 2.958 1.642 L −0.206 0.047 0.019 0.023 0.131 L 0.102 2 4 2 1 0 1 L L718 05 31 23.60 +34 13 54.2 19.331 17.506 1.826 1.543 L −0.105 0.001 0.038 0.044 0.100 L 0.072 4 4 4 2 0 1 L L719 05 31 23.60 +34 14 10.2 21.592 18.259 3.333 L L L 0.104 0.031 0.109 L L L 1 2 1 0 0 0 L L720 05 31 23.61 +34 10 32.2 21.686 18.904 2.787 L L L 0.017 0.013 0.031 L L L 2 2 2 0 0 0 05312361+3410320 L721 05 31 23.64 +34 11 12.7 21.413 19.373 2.021 L L L 0.041 0.068 0.119 L L L 2 2 2 0 0 0 L L722 05 31 23.68 +34 10 40.7 15.000 14.352 0.640 0.472 0.201 0.314 0.005 0.001 0.004 0.003 0.005 0.007 4 4 4 4 4 2 05312367+3410407 L
6
TheAstronomicalJournal,149:127
(25pp),2015
April
Lim
etal.
3.1. The Extent of NGC 1624 and NGC 1931
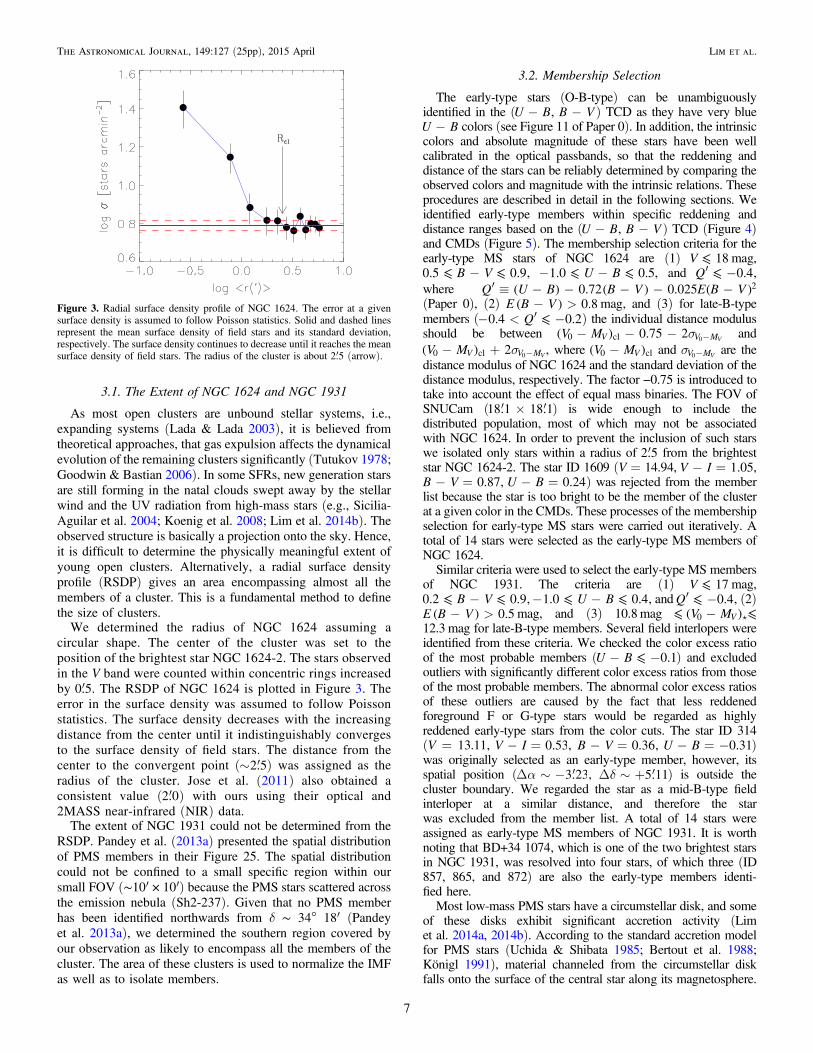
As most open clusters are unbound stellar systems, i.e.,expanding systems (Lada & Lada 2003), it is believed fromtheoretical approaches, that gas expulsion affects the dynamicalevolution of the remaining clusters significantly (Tutukov 1978;Goodwin & Bastian 2006). In some SFRs, new generation starsare still forming in the natal clouds swept away by the stellarwind and the UV radiation from high-mass stars (e.g., Sicilia-Aguilar et al. 2004; Koenig et al. 2008; Lim et al. 2014b). Theobserved structure is basically a projection onto the sky. Hence,it is difficult to determine the physically meaningful extent ofyoung open clusters. Alternatively, a radial surface densityprofile (RSDP) gives an area encompassing almost all themembers of a cluster. This is a fundamental method to definethe size of clusters.
We determined the radius of NGC 1624 assuming acircular shape. The center of the cluster was set to theposition of the brightest star NGC 1624-2. The stars observedin the V band were counted within concentric rings increasedby ¢0.5. The RSDP of NGC 1624 is plotted in Figure 3. Theerror in the surface density was assumed to follow Poissonstatistics. The surface density decreases with the increasingdistance from the center until it indistinguishably convergesto the surface density of field stars. The distance from thecenter to the convergent point (~ ¢2.5) was assigned as theradius of the cluster. Jose et al. (2011) also obtained aconsistent value ( ¢2.0) with ours using their optical and2MASS near-infrared (NIR) data.
The extent of NGC 1931 could not be determined from theRSDP. Pandey et al. (2013a) presented the spatial distributionof PMS members in their Figure 25. The spatial distributioncould not be confined to a small specific region within oursmall FOV (∼10′ × 10′) because the PMS stars scattered acrossthe emission nebula (Sh2-237). Given that no PMS memberhas been identified northwards from δ ∼ 34° 18′ (Pandeyet al. 2013a), we determined the southern region covered byour observation as likely to encompass all the members of thecluster. The area of these clusters is used to normalize the IMFas well as to isolate members.
3.2. Membership Selection
The early-type stars (O-B-type) can be unambiguouslyidentified in the ( -U B, -B V ) TCD as they have very blue
-U B colors (see Figure 11 of Paper 0). In addition, the intrinsiccolors and absolute magnitude of these stars have been wellcalibrated in the optical passbands, so that the reddening anddistance of the stars can be reliably determined by comparing theobserved colors and magnitude with the intrinsic relations. Theseprocedures are described in detail in the following sections. Weidentified early-type members within specific reddening anddistance ranges based on the ( -U B, -B V ) TCD (Figure 4)and CMDs (Figure 5). The membership selection criteria for theearly-type MS stars of NGC 1624 are (1) ⩽V 18 mag,
-⩽ ⩽B V0.5 0.9, - -⩽ ⩽U B1.0 0.5, and ¢ -⩽Q 0.4,where ¢ º - - - - -Q U B B V E B V( ) 0.72( ) 0.025 ( )2
(Paper 0), (2) - >E B V( ) 0.8 mag, and (3) for late-B-typemembers (- < ¢ -⩽Q0.4 0.2) the individual distance modulusshould be between s- - - -V M( ) 0.75 2V V M0 cl V0 and
s- + -V M( ) 2V V M0 cl V0 , where -V M( )V0 cl and s -V MV0 are thedistance modulus of NGC 1624 and the standard deviation of thedistance modulus, respectively. The factor −0.75 is introduced totake into account the effect of equal mass binaries. The FOV ofSNUCam ( ¢ ´ ¢18.1 18.1) is wide enough to include thedistributed population, most of which may not be associatedwith NGC 1624. In order to prevent the inclusion of such starswe isolated only stars within a radius of ¢2.5 from the brighteststar NGC 1624-2. The star ID 1609 (V = 14.94, - =V I 1.05,
- =B V 0.87, - =U B 0.24) was rejected from the memberlist because the star is too bright to be the member of the clusterat a given color in the CMDs. These processes of the membershipselection for early-type MS stars were carried out iteratively. Atotal of 14 stars were selected as the early-type MS members ofNGC 1624.Similar criteria were used to select the early-type MS members
of NGC 1931. The criteria are (1) ⩽V 17 mag,-⩽ ⩽B V0.2 0.9,- -⩽ ⩽U B1.0 0.4, and ¢ -⩽Q 0.4, (2)
- >E B V( ) 0.5 mag, and (3) 10.8mag -⩽ ⩽V M( )V012.3 mag for late-B-type members. Several field interlopers wereidentified from these criteria. We checked the color excess ratioof the most probable members ( - -⩽U B 0.1) and excludedoutliers with significantly different color excess ratios from thoseof the most probable members. The abnormal color excess ratiosof these outliers are caused by the fact that less reddenedforeground F or G-type stars would be regarded as highlyreddened early-type stars from the color cuts. The star ID 314(V = 13.11, - =V I 0.53, - =B V 0.36, - = -U B 0.31)was originally selected as an early-type member, however, itsspatial position ( aD ~ - ¢3.23, dD ~ + ¢5.11) is outside thecluster boundary. We regarded the star as a mid-B-type fieldinterloper at a similar distance, and therefore the starwas excluded from the member list. A total of 14 stars wereassigned as early-type MS members of NGC 1931. It is worthnoting that BD+34 1074, which is one of the two brightest starsin NGC 1931, was resolved into four stars, of which three (ID857, 865, and 872) are also the early-type members identi-fied here.Most low-mass PMS stars have a circumstellar disk, and some
of these disks exhibit significant accretion activity (Limet al. 2014a, 2014b). According to the standard accretion modelfor PMS stars (Uchida & Shibata 1985; Bertout et al. 1988;Königl 1991), material channeled from the circumstellar diskfalls onto the surface of the central star along its magnetosphere.
Figure 3. Radial surface density profile of NGC 1624. The error at a givensurface density is assumed to follow Poisson statistics. Solid and dashed linesrepresent the mean surface density of field stars and its standard deviation,respectively. The surface density continues to decrease until it reaches the meansurface density of field stars. The radius of the cluster is about ¢2.5 (arrow).
7
The Astronomical Journal, 149:127 (25pp), 2015 April Lim et al.
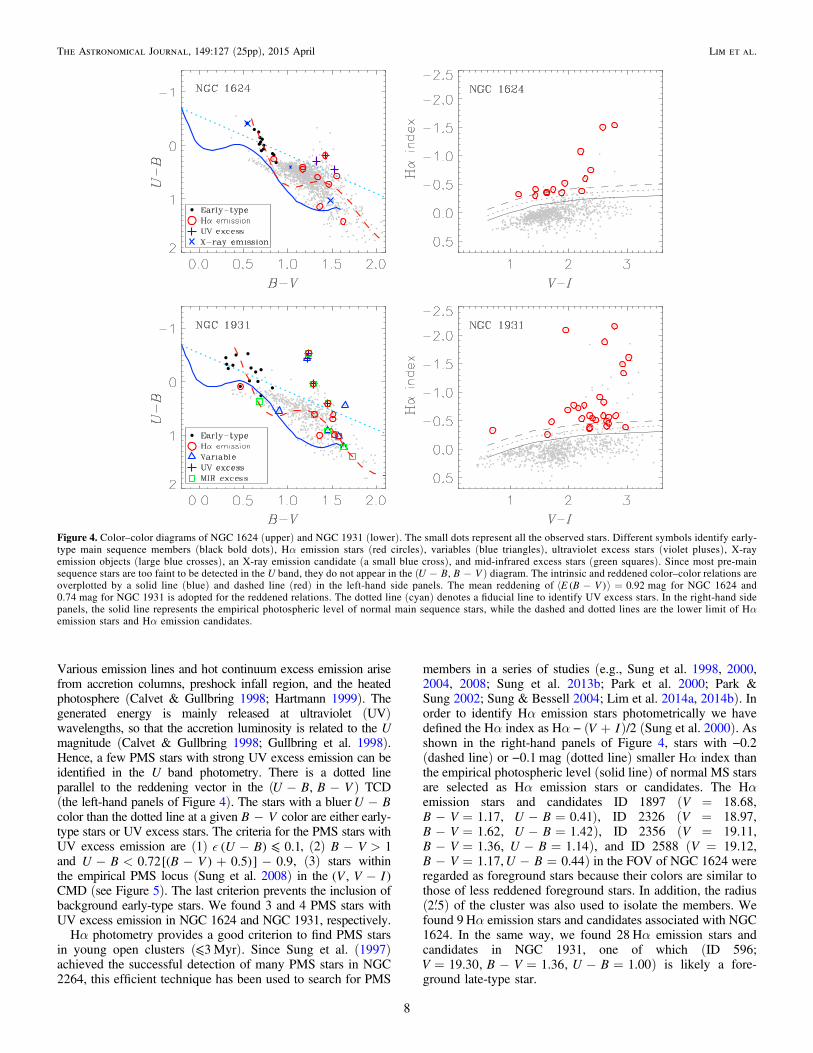
Various emission lines and hot continuum excess emission arisefrom accretion columns, preshock infall region, and the heatedphotosphere (Calvet & Gullbring 1998; Hartmann 1999). Thegenerated energy is mainly released at ultraviolet (UV)wavelengths, so that the accretion luminosity is related to the Umagnitude (Calvet & Gullbring 1998; Gullbring et al. 1998).Hence, a few PMS stars with strong UV excess emission can beidentified in the U band photometry. There is a dotted lineparallel to the reddening vector in the ( - -U B B V, ) TCD(the left-hand panels of Figure 4). The stars with a bluer -U Bcolor than the dotted line at a given -B V color are either early-type stars or UV excess stars. The criteria for the PMS stars withUV excess emission are (1) - ⩽ U B( ) 0.1, (2) - >B V 1and - < - + -U B B V0.72[( ) 0.5)] 0.9, (3) stars withinthe empirical PMS locus (Sung et al. 2008) in the -V V I( , )CMD (see Figure 5). The last criterion prevents the inclusion ofbackground early-type stars. We found 3 and 4 PMS stars withUV excess emission in NGC 1624 and NGC 1931, respectively.
Hα photometry provides a good criterion to find PMS starsin young open clusters (⩽3Myr). Since Sung et al. (1997)achieved the successful detection of many PMS stars in NGC2264, this efficient technique has been used to search for PMS
members in a series of studies (e.g., Sung et al. 1998, 2000,2004, 2008; Sung et al. 2013b; Park et al. 2000; Park &Sung 2002; Sung & Bessell 2004; Lim et al. 2014a, 2014b). Inorder to identify Hα emission stars photometrically we havedefined the Hα index as Hα − ( +V I)/2 (Sung et al. 2000). Asshown in the right-hand panels of Figure 4, stars with −0.2(dashed line) or −0.1 mag (dotted line) smaller Hα index thanthe empirical photospheric level (solid line) of normal MS starsare selected as Hα emission stars or candidates. The Hαemission stars and candidates ID 1897 (V = 18.68,
- =B V 1.17, - =U B 0.41), ID 2326 (V = 18.97,- =B V 1.62, - =U B 1.42), ID 2356 (V = 19.11,- =B V 1.36, - =U B 1.14), and ID 2588 (V = 19.12,- =B V 1.17, - =U B 0.44) in the FOV of NGC 1624 were
regarded as foreground stars because their colors are similar tothose of less reddened foreground stars. In addition, the radius( ¢2.5) of the cluster was also used to isolate the members. Wefound 9 Hα emission stars and candidates associated with NGC1624. In the same way, we found 28 Hα emission stars andcandidates in NGC 1931, one of which (ID 596;= - = - =V B V U B19.30, 1.36, 1.00) is likely a fore-
ground late-type star.
Figure 4. Color–color diagrams of NGC 1624 (upper) and NGC 1931 (lower). The small dots represent all the observed stars. Different symbols identify early-type main sequence members (black bold dots), Hα emission stars (red circles), variables (blue triangles), ultraviolet excess stars (violet pluses), X-rayemission objects (large blue crosses), an X-ray emission candidate (a small blue cross), and mid-infrared excess stars (green squares). Since most pre-mainsequence stars are too faint to be detected in the U band, they do not appear in the ( -U B, -B V ) diagram. The intrinsic and reddened color–color relations areoverplotted by a solid line (blue) and dashed line (red) in the left-hand side panels. The mean reddening of á - ñ =E B V( ) 0.92 mag for NGC 1624 and0.74 mag for NGC 1931 is adopted for the reddened relations. The dotted line (cyan) denotes a fiducial line to identify UV excess stars. In the right-hand sidepanels, the solid line represents the empirical photospheric level of normal main sequence stars, while the dashed and dotted lines are the lower limit of Hαemission stars and Hα emission candidates.
8
The Astronomical Journal, 149:127 (25pp), 2015 April Lim et al.
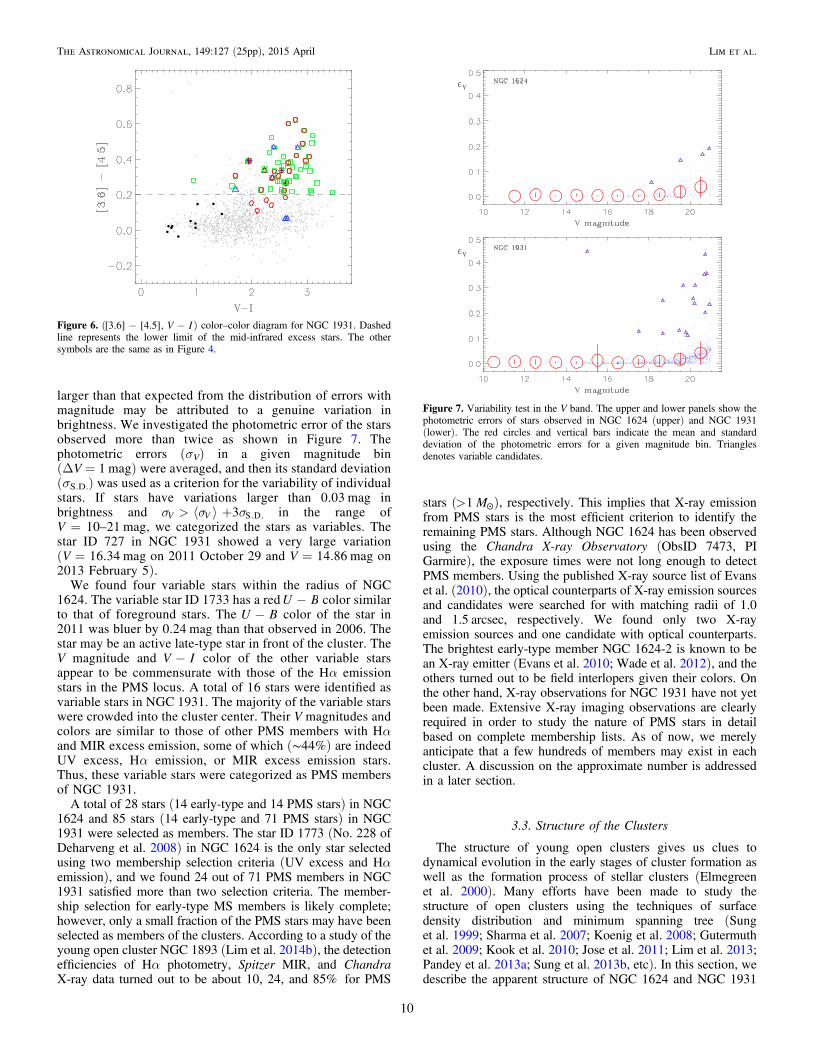
The dust emission from circumstellar disks of PMS stars isprominent at infrared (IR) wavelength, particularly the mid-infrared (MIR). A number of young stellar objects in variousSFRs have been identified through extensive imaging surveyswith the Spitzer Space Telescope (Caramazza et al. 2008;Gutermuth et al. 2008; Koenig et al. 2008; Sung et al. 2009)etc). We used the Spitzer Galactic Legacy IR Mid-PlaneSurvey Extraordinaire 360° catalog (GLIMPSE360; Whitneyet al. 2008, 2011) to identify PMS members with MIR excessemission. The GLIMPSE360 survey is a “warm mission,” sothat only the 3.6 and 4.5 μm bands were available. Unfortu-nately, NGC 1624 ( = ◦l 155 .356, = ◦b 2 .616) was not coveredin the survey program because of its high Galactic latitude. Thecatalog allows us to select PMS members with a circumstellardisk in NGC 1931. A total of 1249 optical counterparts in thecatalog were found within a matching radius of 1. 0. Weattempted to identify the PMS members in the( - -V I[3.6] [4.5], ) TCD as shown in Figure 6. Themajority of the Hα emission stars exhibited MIR excessemission. Stars with a -[3.6] [4.5] color larger than 0.2 mag
(dashed line) were selected as PMS member candidates, andthen the empirical PMS locus (Sung et al. 2008) was used toisolate the PMS members among the candidates. From thisprocedure, a total of 54 PMS stars with MIR excess emissionwere selected as members of NGC 1931. Although it is difficultto make a detailed classification due to the absence ofinformation in other IRAC bands (5.8 and 8.0 μm), most ofthem may be Class II objects (see also Figure 18 of Pandeyet al. 2013a).It is a well known observational fact that PMS stars,
particularly classical T-Tauri stars, are variable objects withan amplitude of 0.1–2 mag in the form of irregular variation(Grankin et al. 2007). The observations of NGC 1624 andNGC 1931 were made at two different epochs. The timedifference between the first and the second observation wasabout ∼4.9 and 1.2 yr for NGC 1624 and NGC 1931,respectively. Since the photometric errors from the averagingprocess used in Section 2.3 (originally from Equation (2) ofSung & Lee 1995) represent the consistency of magnitudeand colors from several observations, a photometric error
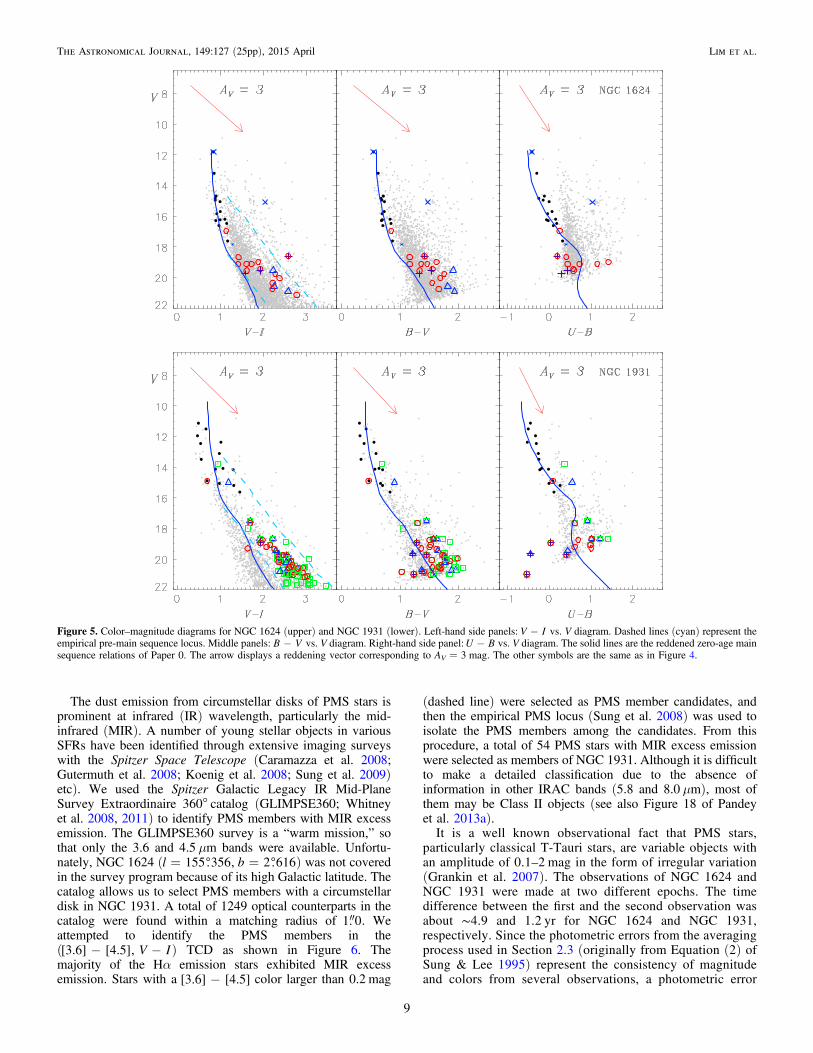
Figure 5. Color–magnitude diagrams for NGC 1624 (upper) and NGC 1931 (lower). Left-hand side panels: -V I vs. V diagram. Dashed lines (cyan) represent theempirical pre-main sequence locus. Middle panels: -B V vs. V diagram. Right-hand side panel: -U B vs. V diagram. The solid lines are the reddened zero-age mainsequence relations of Paper 0. The arrow displays a reddening vector corresponding to AV = 3 mag. The other symbols are the same as in Figure 4.
9
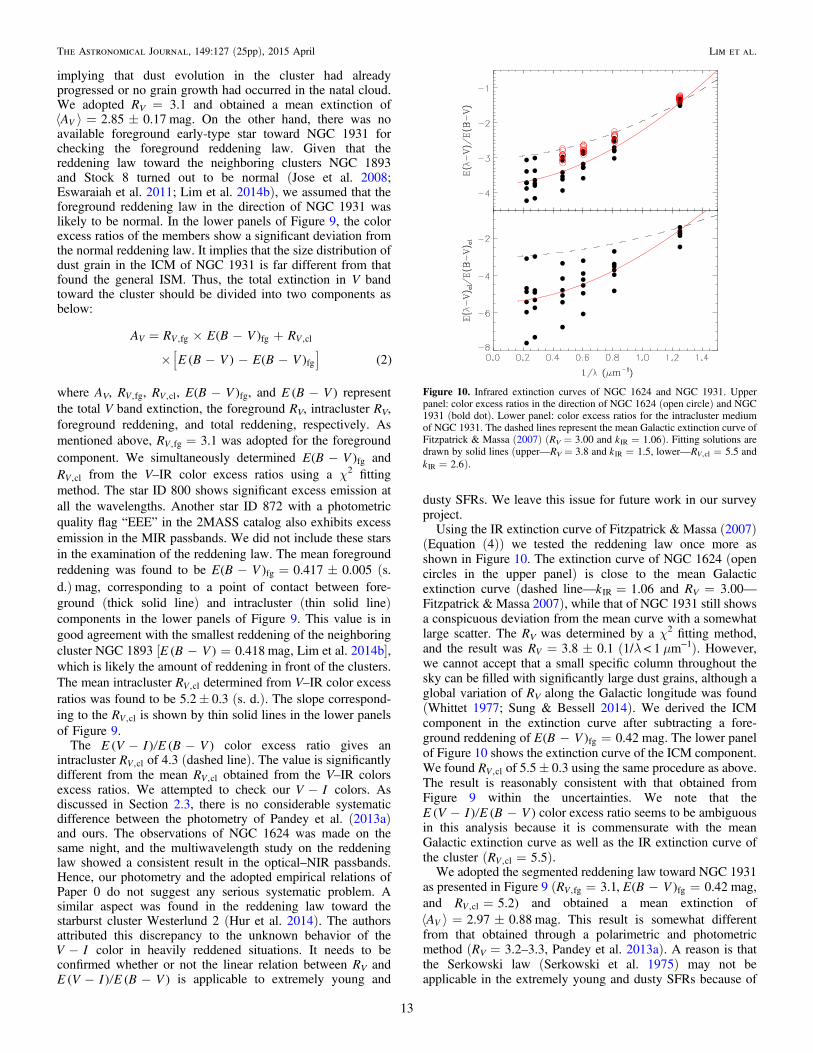
The Astronomical Journal, 149:127 (25pp), 2015 April Lim et al.
larger than that expected from the distribution of errors withmagnitude may be attributed to a genuine variation inbrightness. We investigated the photometric error of the starsobserved more than twice as shown in Figure 7. Thephotometric errors (σV) in a given magnitude bin(ΔV = 1 mag) were averaged, and then its standard deviation(σS.D.) was used as a criterion for the variability of individualstars. If stars have variations larger than 0.03 mag inbrightness and s s s> á ñ +3V V S.D. in the range ofV = 10–21 mag, we categorized the stars as variables. Thestar ID 727 in NGC 1931 showed a very large variation(V = 16.34 mag on 2011 October 29 and V = 14.86 mag on2013 February 5).
We found four variable stars within the radius of NGC1624. The variable star ID 1733 has a red -U B color similarto that of foreground stars. The -U B color of the star in2011 was bluer by 0.24 mag than that observed in 2006. Thestar may be an active late-type star in front of the cluster. TheV magnitude and -V I color of the other variable starsappear to be commensurate with those of the Hα emissionstars in the PMS locus. A total of 16 stars were identified asvariable stars in NGC 1931. The majority of the variable starswere crowded into the cluster center. Their V magnitudes andcolors are similar to those of other PMS members with Hαand MIR excess emission, some of which (∼44%) are indeedUV excess, Hα emission, or MIR excess emission stars.Thus, these variable stars were categorized as PMS membersof NGC 1931.
A total of 28 stars (14 early-type and 14 PMS stars) in NGC1624 and 85 stars (14 early-type and 71 PMS stars) in NGC1931 were selected as members. The star ID 1773 (No. 228 ofDeharveng et al. 2008) in NGC 1624 is the only star selectedusing two membership selection criteria (UV excess and Hαemission), and we found 24 out of 71 PMS members in NGC1931 satisfied more than two selection criteria. The member-ship selection for early-type MS members is likely complete;however, only a small fraction of the PMS stars may have beenselected as members of the clusters. According to a study of theyoung open cluster NGC 1893 (Lim et al. 2014b), the detectionefficiencies of Hα photometry, Spitzer MIR, and ChandraX-ray data turned out to be about 10, 24, and 85% for PMS
stars (> ☉M1 ), respectively. This implies that X-ray emissionfrom PMS stars is the most efficient criterion to identify theremaining PMS stars. Although NGC 1624 has been observedusing the Chandra X-ray Observatory (ObsID 7473, PIGarmire), the exposure times were not long enough to detectPMS members. Using the published X-ray source list of Evanset al. (2010), the optical counterparts of X-ray emission sourcesand candidates were searched for with matching radii of 1.0and 1.5 arcsec, respectively. We found only two X-rayemission sources and one candidate with optical counterparts.The brightest early-type member NGC 1624-2 is known to bean X-ray emitter (Evans et al. 2010; Wade et al. 2012), and theothers turned out to be field interlopers given their colors. Onthe other hand, X-ray observations for NGC 1931 have not yetbeen made. Extensive X-ray imaging observations are clearlyrequired in order to study the nature of PMS stars in detailbased on complete membership lists. As of now, we merelyanticipate that a few hundreds of members may exist in eachcluster. A discussion on the approximate number is addressedin a later section.
3.3. Structure of the Clusters
The structure of young open clusters gives us clues todynamical evolution in the early stages of cluster formation aswell as the formation process of stellar clusters (Elmegreenet al. 2000). Many efforts have been made to study thestructure of open clusters using the techniques of surfacedensity distribution and minimum spanning tree (Sunget al. 1999; Sharma et al. 2007; Koenig et al. 2008; Gutermuthet al. 2009; Kook et al. 2010; Jose et al. 2011; Lim et al. 2013;Pandey et al. 2013a; Sung et al. 2013b, etc). In this section, wedescribe the apparent structure of NGC 1624 and NGC 1931
Figure 6. ( - -V I[3.6] [4.5], ) color–color diagram for NGC 1931. Dashedline represents the lower limit of the mid-infrared excess stars. The othersymbols are the same as in Figure 4.
Figure 7. Variability test in the V band. The upper and lower panels show thephotometric errors of stars observed in NGC 1624 (upper) and NGC 1931(lower). The red circles and vertical bars indicate the mean and standarddeviation of the photometric errors for a given magnitude bin. Trianglesdenotes variable candidates.
10
The Astronomical Journal, 149:127 (25pp), 2015 April Lim et al.

using the surface density distribution, with additional informa-tion from previous studies.
The appearance of the H II region Sh2-212 associated withNGC 1624 is close to a symmetric shell structure. An innerregion filled with hot ionized gas and a shocked outer regionconstitute the apparent gas structure (see Figure 1 of Joseet al. 2011). A molecular filament with different velocitycomponents in the range of −32 to −37 km s−1 surrounds thesouthern part of the cluster, stretching out to the north-west(Deharveng et al. 2008). The filament incubates at least fiveclumps, one of which is likely to be associated with an UCHIIin the western part of the cluster. The brightest star NGC 1624-2 (O7f?p—Walborn et al. 2010; Sota et al. 2011) is locatednear the center of the cluster. Other members are distributed inthe vicinity of the star as shown in the left-hand panel ofFigure 8. We obtained the surface density distribution of NGC1624 using stars observed in the V band (contour). Theconcentration of stars appears high in the center of the cluster,and the spatial distribution approximates to a circular shape.
On the other hand, NGC 1931 is enclosed within a dustymolecular cloud (see Figure 1 of Pandey et al. 2013a). Thenatal cloud also exhibits a hierarchical structure. The innerregion is filled with hot ionized gas produced by the radiationfrom a few bright stars while polycyclic aromatic hydrocarbonmolecules are glowing in the outer region. The right-hand panelin Figure 8 shows the spatial distribution of cluster members.The early-type MS members appear to be divided into twogroups, a northern and a southern group. A high stellar densityregion is seen between the groups, implying that masssegregation among the members may not yet be established.While many variable PMS members are located in the denseregion, the majority of Hα emission stars are found in thevicinity of the southern group. The PMS members with MIRexcess emission are spread out across the whole region,however the stars in the northern part of the cluster show aweak concentration. The surface density distribution (contour)reflects such an elongated shape. The apparent shape is in agood agreement with the result of Pandey et al. (2013a). Theseobservational properties may be related to the star formationhistory within NGC 1931.
3.4. Reddening and the Reddening Law
As most open clusters are formed in the Galactic plane, aregion where interstellar matter is unevenly distributed,reddening corrections are crucial to obtaining reliable physicalquantities. The interstellar reddening is basically determined bycomparing an observed color with the intrinsic one. The( - -U B B V, ) TCD is a very useful tool because thereddening vector has been well established in the diagram
- - = + -E U B E B V E B V[ ( ) ( ) 0.72 0.025 ( ) ; Paper 0].The intrinsic color relations of Paper 0 were adopted to obtainthe reddening of the individual early-type members (see Table1 in Paper 0).The reddening of NGC 1624 determined from 14 early-type
members is in the range of - =E B V( ) 0.83–1.01 mag, andthe mean value is á - ñ = E B V( ) 0.92 0.05 (s.d.)mag.The result is in close agreement with that of previous studies,e.g., - =E B V( ) 0.88–0.94 mag (Moffat et al. 1979),0.84–0.87 mag (Chini & Wink 1984), 0.70–0.90 mag (Sujatha& Babu 2006), and 0.76–1.00 mag (Jose et al. 2011).The reddening of NGC 1931 obtained from 14 early-typemembers ranges from - =E B V( ) 0.51–1.01 mag. The meanreddening is á - ñ = E B V( ) 0.74 0.17 (s.d.)mag. Thisresult is also commensurate with that of previous studies, e.g.,
- =E B V( ) 0.49–0.93 mag (Moffat et al. 1979),0.47–1.00 mag (Pandey & Mahra 1986), 0.55–1.00 mag (Bhattet al. 1994), 0.52–0.72 mag (Bonatto & Bica 2009), and0.50–0.90 mag (Pandey et al. 2013a). The dispersion in thereddening indicates that there is differential reddening acrosseach cluster. The differential reddening in NGC 1624 appearsto be less significant than that found in NGC 1931.Unlike early-type MS stars, it is difficult to determine the
reddening for the PMS stars because the intrinsic colors can bealtered by hot and cold spots on the surface, accretion activities,and the obscuration by a circumstellar disk (Grankinet al. 2007). Simultaneous imaging (color) and spectroscopic(spectral type) observations are required to determine thereddening of individual PMS stars accurately. In the absence ofsuch data, we estimated the reddening of PMS stars by using aweighted-mean reddening value at a given position from thereddening distribution of the early-type members, where the
Figure 8. Spatial distribution of members of NGC 1624 (left) and NGC 1931 (right). The solid, dashed, and dotted–dashed lines show contours corresponding to 80,60, and 40% level of the maximum surface density, respectively. The size of each symbol is proportional to the brightness of individual stars. The other symbols arethe same as in Figure 4.
11
The Astronomical Journal, 149:127 (25pp), 2015 April Lim et al.

weight was given by an exponential function with respect to thedistance from the individual early-type members.
The reddening law toward young open clusters provides anopportunity to study the spatial distribution of interstellarmatter in the Galaxy as well as the dust evolution in SFRs. Theratio of total-to-selective extinction (RV) is a basic tool toinvestigate the reddening law, being also a crucial parameter tocorrect the total extinction in the visual band. The parameter isclosely related to the size distribution of dust grains. The RV
found in several extremely young SFRs present deviations fromthe normal reddening law (Greve 2010; Hur et al. 2012).Previous studies on NGC 1624 have adopted the normalreddening law (RV = 3.1, Chini & Wink 1984; Joseet al. 2011), while Pandey et al. (2013a) showed, fromphotometric and polarimetric data, that the reddening lawtoward NGC 1931 is slightly different from that found in thegeneral ISM. In order to check the reddening law toward theseclusters we investigated various color excess ratios in theoptical and IR passbands as performed in the series of studies(Kook et al. 2010; Lim et al. 2011; Hur et al. 2012; Sunget al. 2013b; Lim et al. 2014a, 2014b).
Lim et al. (2014a) have noted that several mid–late-B-typeMS stars in the young open cluster IC 1848 have a bluer colorthan that of normal B-type MS stars. Since the bluer color may
not reflect the genuine photospheric color of the stars, the early-type members with - ⩽U B 0.3 for NGC 1624 and with
- -⩽U B 0.2 for NGC 1931 were chosen to avoid such acolor anomaly. We used 2MASS NIR data (tagged as aphotometric quality flag “AAA”) as well as our optical data forthe stars. For MIR data, the Spitzer GLIMPSE360 catalog(Whitney et al. 2008, 2011) was used to obtain the V–MIRcolor excess. The various color excesses l-E V( ) in theoptical and IR passbands were computed by comparing theobserved colors with the intrinsic relations from Paper 0 andSung et al. (in preparation). The RV is expressed as a linearrelation for each color excess ratio l- -E V E B V( ) ( )(Guetter & Vrba 1989; Sung et al. 2013b). We present thecolor excess ratios of the cluster members in Figure 9. Thethick solid line (blue) in the figure represents the slopecorresponding to the normal reddening law (RV = 3.1).There is a foreground early-type star in the direction of NGC
1624 that was helpful for checking the difference between thegeneral ISM and the intracluster medium (ICM). As shown inthe upper panels of Figure 9, all the color excess ratiosconsistently indicate that the ICM of NGC 1624 is indis-tinguishable from the general ISM. The mean RV obtained fromdifferent color excess ratios was 3.12± 0.01 (s. d.). This resultis in good agreement with that examined by Jose et al. (2011),
Figure 9. Color excess ratios obtained from the early-type star toward NGC 1624 (upper row) and NGC 1931 (middle and lower panels). The dots and the open circledenote the cluster members and a foreground early-type star. Thick solid (blue), thin solid (green), and dashed (cyan) lines corresponds to the normal reddening law(RV = 3.1) and the intracluster reddening relations ( =R 5.2V ,cl and 4.3). The extinction toward NGC 1624 follows the normal reddening law, whereas the colorexcess ratios toward NGC 1931 exhibit a deviation from the normal reddening law. See the main text for details.
12
The Astronomical Journal, 149:127 (25pp), 2015 April Lim et al.
implying that dust evolution in the cluster had alreadyprogressed or no grain growth had occurred in the natal cloud.We adopted RV = 3.1 and obtained a mean extinction ofá ñ = A 2.85 0.17V mag. On the other hand, there was noavailable foreground early-type star toward NGC 1931 forchecking the foreground reddening law. Given that thereddening law toward the neighboring clusters NGC 1893and Stock 8 turned out to be normal (Jose et al. 2008;Eswaraiah et al. 2011; Lim et al. 2014b), we assumed that theforeground reddening law in the direction of NGC 1931 waslikely to be normal. In the lower panels of Figure 9, the colorexcess ratios of the members show a significant deviation fromthe normal reddening law. It implies that the size distribution ofdust grain in the ICM of NGC 1931 is far different from thatfound the general ISM. Thus, the total extinction in V bandtoward the cluster should be divided into two components asbelow:
= ´ - +
´ éë - - - ù
û
A R E B V R
E B V E B V
( )
( ) ( ) (2)
V V V,fg fg ,cl
fg
where AV, RV ,fg, RV ,cl, -E B V( )fg, and -E B V( ) representthe total V band extinction, the foreground RV, intracluster RV,foreground reddening, and total reddening, respectively. Asmentioned above, =R 3.1V ,fg was adopted for the foregroundcomponent. We simultaneously determined -E B V( )fg andRV ,cl from the V–IR color excess ratios using a χ2
fittingmethod. The star ID 800 shows significant excess emission atall the wavelengths. Another star ID 872 with a photometricquality flag “EEE” in the 2MASS catalog also exhibits excessemission in the MIR passbands. We did not include these starsin the examination of the reddening law. The mean foregroundreddening was found to be - = E B V( ) 0.417 0.005fg (s.d.)mag, corresponding to a point of contact between fore-ground (thick solid line) and intracluster (thin solid line)components in the lower panels of Figure 9. This value is ingood agreement with the smallest reddening of the neighboringcluster NGC 1893 [ - =E B V( ) 0.418 mag, Lim et al. 2014b],which is likely the amount of reddening in front of the clusters.The mean intracluster RV ,cl determined from V–IR color excessratios was found to be 5.2± 0.3 (s. d.). The slope correspond-ing to the RV ,cl is shown by thin solid lines in the lower panelsof Figure 9.
The - -E V I E B V( ) ( ) color excess ratio gives anintracluster RV ,cl of 4.3 (dashed line). The value is significantlydifferent from the mean RV ,cl obtained from the V–IR colorsexcess ratios. We attempted to check our -V I colors. Asdiscussed in Section 2.3, there is no considerable systematicdifference between the photometry of Pandey et al. (2013a)and ours. The observations of NGC 1624 was made on thesame night, and the multiwavelength study on the reddeninglaw showed a consistent result in the optical–NIR passbands.Hence, our photometry and the adopted empirical relations ofPaper 0 do not suggest any serious systematic problem. Asimilar aspect was found in the reddening law toward thestarburst cluster Westerlund 2 (Hur et al. 2014). The authorsattributed this discrepancy to the unknown behavior of the-V I color in heavily reddened situations. It needs to be
confirmed whether or not the linear relation between RV and- -E V I E B V( ) ( ) is applicable to extremely young and
dusty SFRs. We leave this issue for future work in our surveyproject.Using the IR extinction curve of Fitzpatrick & Massa (2007)
(Equation (4)) we tested the reddening law once more asshown in Figure 10. The extinction curve of NGC 1624 (opencircles in the upper panel) is close to the mean Galacticextinction curve (dashed line— =k 1.06IR and RV = 3.00—Fitzpatrick & Massa 2007), while that of NGC 1931 still showsa conspicuous deviation from the mean curve with a somewhatlarge scatter. The RV was determined by a χ2
fitting method,and the result was = R 3.8 0.1V (1/λ < 1 μm−1). However,we cannot accept that a small specific column throughout thesky can be filled with significantly large dust grains, although aglobal variation of RV along the Galactic longitude was found(Whittet 1977; Sung & Bessell 2014). We derived the ICMcomponent in the extinction curve after subtracting a fore-ground reddening of - =E B V( ) 0.42fg mag. The lower panelof Figure 10 shows the extinction curve of the ICM component.We found RV ,cl of 5.5± 0.3 using the same procedure as above.The result is reasonably consistent with that obtained fromFigure 9 within the uncertainties. We note that the
- -E V I E B V( ) ( ) color excess ratio seems to be ambiguousin this analysis because it is commensurate with the meanGalactic extinction curve as well as the IR extinction curve ofthe cluster ( =R 5.5V ,cl ).We adopted the segmented reddening law toward NGC 1931
as presented in Figure 9 ( =R 3.1V ,fg , - =E B V( ) 0.42fg mag,and =R 5.2)V ,cl and obtained a mean extinction ofá ñ = A 2.97 0.88V mag. This result is somewhat differentfrom that obtained through a polarimetric and photometricmethod (RV = 3.2–3.3, Pandey et al. 2013a). A reason is thatthe Serkowski law (Serkowski et al. 1975) may not beapplicable in the extremely young and dusty SFRs because of
Figure 10. Infrared extinction curves of NGC 1624 and NGC 1931. Upperpanel: color excess ratios in the direction of NGC 1624 (open circle) and NGC1931 (bold dot). Lower panel: color excess ratios for the intracluster mediumof NGC 1931. The dashed lines represent the mean Galactic extinction curve ofFitzpatrick & Massa (2007) (RV = 3.00 and =k 1.06IR ). Fitting solutions aredrawn by solid lines (upper—RV = 3.8 and =k 1.5IR , lower— =R 5.5V ,cl and
=k 2.6IR ).
13
The Astronomical Journal, 149:127 (25pp), 2015 April Lim et al.

the efficiency and timescale for grain alignment, the probablecomplex structure of the magnetic field in the ICM, as well asthe depolarization effect by foreground dust grains. The otherreason is that the authors did not consider the foreground andintracluster components separately, and therefore their RV couldbe underestimated. Nevertheless, their results also suggest thatthe reddening law in the direction of NGC 1931 is not normal.We conclude that the evolution of dust grains within the clusteris still in progress.
3.5. Distance
Young open clusters (<10Myr) are a useful tracer of thelocal spiral arm structure in the Galaxy (Dias & Lépine 2005).We have been using the zero-age main sequence (ZAMS)fitting method to determine distances to open clusters in a seriesof studies. The canonical ZAMS fitting method should be madeafter correction for interstellar reddening. In order to reduceuncertainties arising from the reddening correction, Paper 0introduced the reddening-independent indices as below:
º - -Q V V I2.45( ) (3)VI
º - -Q V V J1.33( ) (4)VJ
º - -Q V V H1.17( ) (5)VH
º - -( )Q V V K1.10 . (6)VK SS
The modified Johnson Q ¢ = - - -Q U B B V[ ( ) 0.72( )- -E B V0.025 ( ) ]2 is used as the abscissa of new CMDs.These reddening-independent indices give a few advantages inZAMS fitting procedure. The indices are based on UBVIJHKS
multicolor photometry, and thus the ZAMS fitting to the CMDsof young open clusters can be made consistently with respect todifferent colors. The colors of early-type stars are less affectedby metallicity because, in general, few strong metallic linesapart from a few light elements are found in their spectra. Wehave determined the distance of young open clusters usingthese indices (Lim et al. 2014a, 2014b).
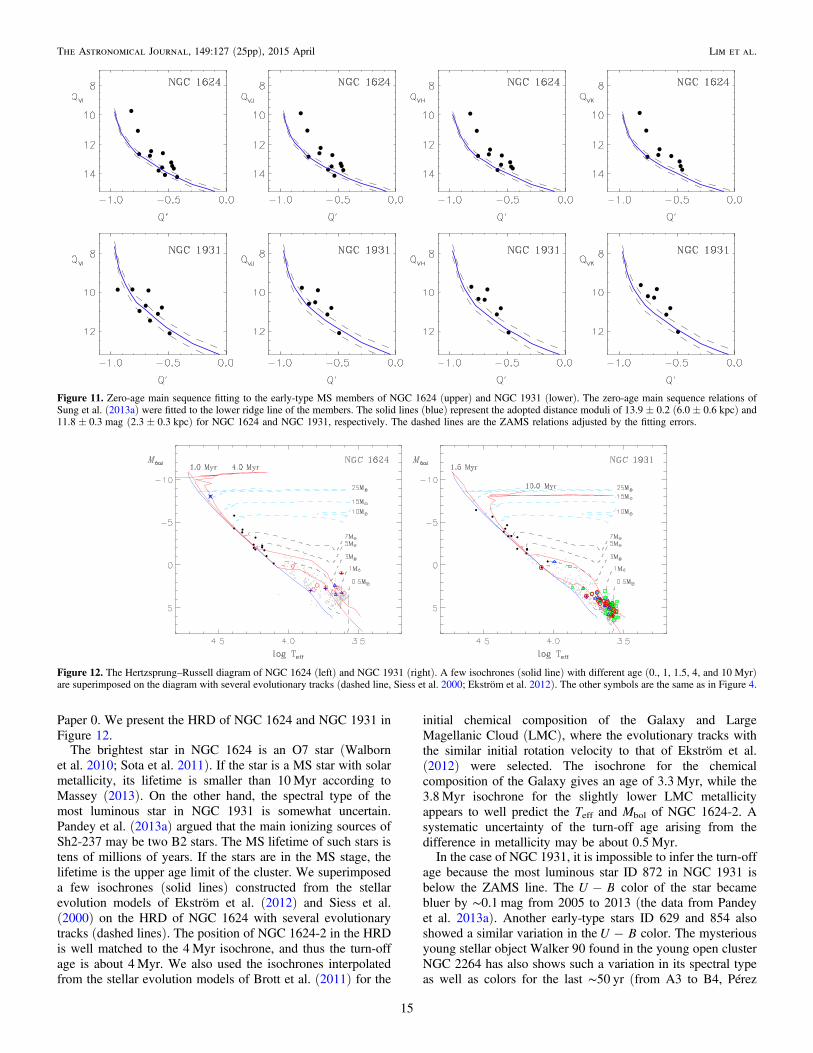
A large fraction of high-mass stars constitute binary systems(Sana et al. 2012). The luminosity of such stars appears higherthan that expected from ZAMS stars at a given color oreffective temperature. In addition, physical properties, such asstellar rotation and overshooting, cause the MS band to bewider in the high-mass regime (Martins & Palacios 2013).Therefore, the faintest MS stars at a given color in the CMDshave been regarded as ZAMS stars (Johnson & Hiltner 1956).It is worth noting that some of the early-type members maypossibly reveal a color anomaly as mentioned in the previoussection. Allowing for this point we carefully fitted the ZAMSrelations of Paper 0 to the lower ridge line of the clustersequence in Figure 11 after adjusting the relations above andbelow it. The lower ridge line could be confined between theZAMS relations (dashed lines) shifted by± 0.2–0.3 mag foreach cluster. The fitted distance modulus of NGC 1624 andNGC 1931 was 13.9± 0.2 mag (6.0± 0.6 kpc) and11.8± 0.3 mag (2.3± 0.3 kpc), respectively. This result placesNGC 1624 ( = ◦l 155 .356, = ◦b 2 .616) in the outer arm andNGC 1931 ( = ◦l 173 . 898, = ◦b 0 . 281) in the Perseus arm.
Previous studies used either ZAMS or isochrone fitting in thedetermination of distance. The distance to NGC 1624 obtainedin this work is in good agreement with the results of previousstudies, e.g., 6.0 kpc (Moffat et al. 1979; Sujatha & Babu 2006;
Jose et al. 2011) and 6.1–6.5 (Deharveng et al. 2008). It isinteresting that Sujatha & Babu (2006) obtained a distanceconsistent with that of other studies although their photometryshows a serious systematic difference in V (Figure 2). Chini &Wink (1984) obtained a distance of 10.3 kpc using spectro-scopic parallax for two bright stars. In their study, the starswere classified as O6I and B1III, respectively. Since theirspectral classification is somewhat different from that of arecent study for the brightest star NGC 1624-2 (O7f?p—Walborn et al. 2010; Sota et al. 2011), their distance may beshifted systematically. A similar discussion has been made inJose et al. (2011). In the case of NGC 1931, Pandey et al.(2013a) refined their previous results (Pandey & Mahra 1986;Bhatt et al. 1994) and published a new distance of 2.3± 0.3 kpc. Bonatto & Bica (2009) obtained a distance of2.4± 0.3 kpc from the 2MASS NIR photometry. AlthoughMoffat et al. (1979) reported a rather smaller value (1.8 kpc),our result is in good agreement with that of more recent studies.
4. HERTZSPRUNG–RUSSELL DIAGRAM
The HRD is a basic tool to understand the evolution of stars.The effective temperature (Teff) of stars is a crucial parameterfor constructing the HRD. We used the relations published inPaper 0 (Table 5) to obtain the Teff and bolometric correctionfor individual stars. The Teff of the star NGC 1624-2 wasdetermined from the spectral type–Teff relation. Although thespectral type and luminosity class of the star seem to beuncertain—O5.5 V (Moffat et al. 1979), O6I (Chini &Wink 1984), O7f?p (Walborn et al. 2010; Sota et al. 2011),and O6.5f?cp–O8f?cp (a variation in the spectral type has beenreported by Wade et al. 2012)—we assumed the star to be anO7 MS star according to the recent classification (Sotaet al. 2011; Wade et al. 2012). It is worth noting that theabsolute magnitude of NGC 1624-2 (MV = −4.66 mag) isreasonably consistent with that of O7 MS stars(MV = −4.90 mag) rather than that of O7 supergiant stars(MV = −6.05 to −6.95 mag, see Table 4 of Paper 0). Thedifference between an O7 MS and giant star is only about165 K in Teff, and the stars have the same bolometric correctionvalue (Paper 0). If NGC 1624-2 is a supergiant star, thedifference between MS and supergiant stars increases up to800 K in Teff and 0.1 mag in bolometric correction. The Teff ofother early-type MS stars was inferred from the color–Teffrelations. We averaged the Teff estimated from each color–Teffrelation with weights.We set the weights of Teff estimated from the -U B versus
Teff relation to be 0.5, 1.0, 1.5, 2.0, and 2.5 in the -U B( )0color range of 0.07 to −0.1 mag, −0.1 to −0.3 mag, −0.3 to−0.5 mag, −0.5 to −0.7 mag, and −0.7 to −1.2 mag, respec-tively, set it to be 0 for late-type stars. The temperaturesensitivity of the -V I color is not high enough to estimate theTeff of early-type stars. We assigned each weight of Teff inferredfrom the -B V versus Teff relation and the -V I versus Teffrelation to 1.0 and 0.5 for stars with - < -B V( ) 0.240 mag.For MS stars with - <B V( ) 0.180 mag, the weights of Teffestimated from -B V versus Teff relation and -V I versusTeff relations were set to be 1.0 and 0.7, respectively. Since the-V I color is a good temperature indicator for cool stars, we
only used -V I versus Teff relations (Bessell 1995; Bessellet al. 1998) for PMS stars. The bolometric correction values forall the members were inferred from their Teff using Table 5 in
14
The Astronomical Journal, 149:127 (25pp), 2015 April Lim et al.
Paper 0. We present the HRD of NGC 1624 and NGC 1931 inFigure 12.
The brightest star in NGC 1624 is an O7 star (Walbornet al. 2010; Sota et al. 2011). If the star is a MS star with solarmetallicity, its lifetime is smaller than 10Myr according toMassey (2013). On the other hand, the spectral type of themost luminous star in NGC 1931 is somewhat uncertain.Pandey et al. (2013a) argued that the main ionizing sources ofSh2-237 may be two B2 stars. The MS lifetime of such stars istens of millions of years. If the stars are in the MS stage, thelifetime is the upper age limit of the cluster. We superimposeda few isochrones (solid lines) constructed from the stellarevolution models of Ekström et al. (2012) and Siess et al.(2000) on the HRD of NGC 1624 with several evolutionarytracks (dashed lines). The position of NGC 1624-2 in the HRDis well matched to the 4Myr isochrone, and thus the turn-offage is about 4 Myr. We also used the isochrones interpolatedfrom the stellar evolution models of Brott et al. (2011) for the
initial chemical composition of the Galaxy and LargeMagellanic Cloud (LMC), where the evolutionary tracks withthe similar initial rotation velocity to that of Ekström et al.(2012) were selected. The isochrone for the chemicalcomposition of the Galaxy gives an age of 3.3 Myr, while the3.8Myr isochrone for the slightly lower LMC metallicityappears to well predict the Teff and Mbol of NGC 1624-2. Asystematic uncertainty of the turn-off age arising from thedifference in metallicity may be about 0.5 Myr.In the case of NGC 1931, it is impossible to infer the turn-off
age because the most luminous star ID 872 in NGC 1931 isbelow the ZAMS line. The -U B color of the star becamebluer by ∼0.1 mag from 2005 to 2013 (the data from Pandeyet al. 2013a). Another early-type stars ID 629 and 854 alsoshowed a similar variation in the -U B color. The mysteriousyoung stellar object Walker 90 found in the young open clusterNGC 2264 has also shows such a variation in its spectral typeas well as colors for the last ∼50 yr (from A3 to B4, Pérez
Figure 11. Zero-age main sequence fitting to the early-type MS members of NGC 1624 (upper) and NGC 1931 (lower). The zero-age main sequence relations ofSung et al. (2013a) were fitted to the lower ridge line of the members. The solid lines (blue) represent the adopted distance moduli of 13.9 ± 0.2 (6.0 ± 0.6 kpc) and11.8 ± 0.3 mag (2.3 ± 0.3 kpc) for NGC 1624 and NGC 1931, respectively. The dashed lines are the ZAMS relations adjusted by the fitting errors.
Figure 12. The Hertzsprung–Russell diagram of NGC 1624 (left) and NGC 1931 (right). A few isochrones (solid line) with different age (0., 1, 1.5, 4, and 10 Myr)are superimposed on the diagram with several evolutionary tracks (dashed line, Siess et al. 2000; Ekström et al. 2012). The other symbols are the same as in Figure 4.
15
The Astronomical Journal, 149:127 (25pp), 2015 April Lim et al.
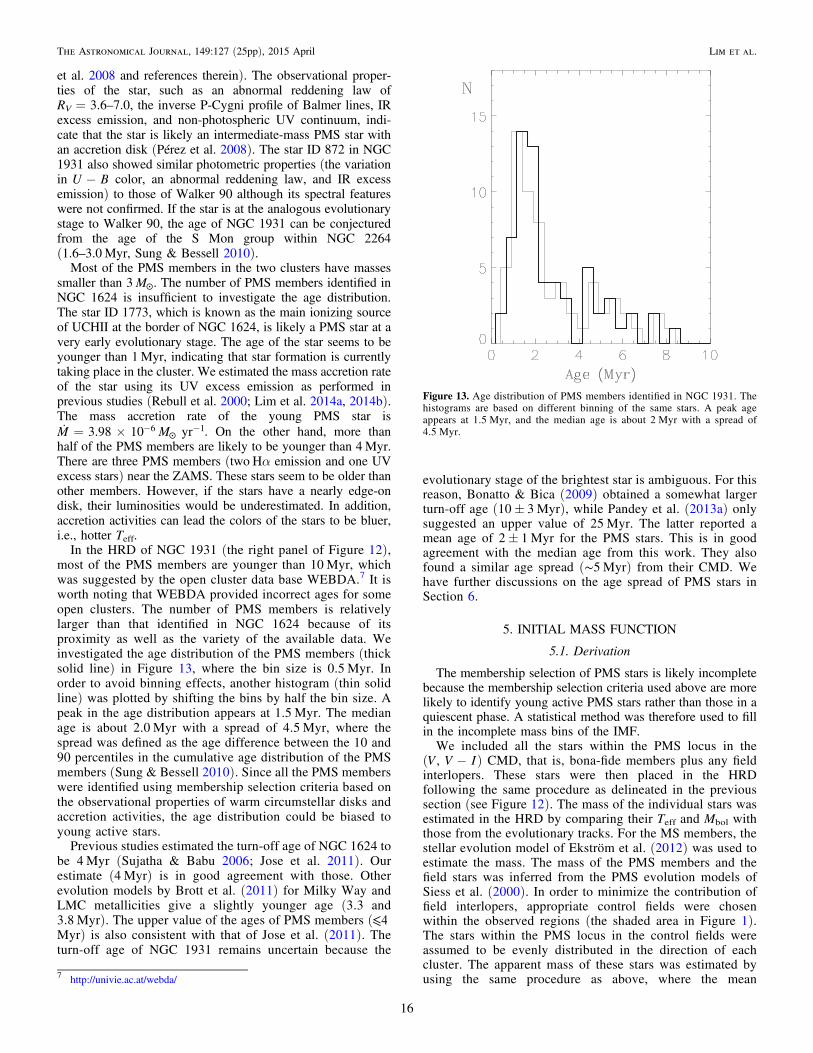
et al. 2008 and references therein). The observational proper-ties of the star, such as an abnormal reddening law ofRV = 3.6–7.0, the inverse P-Cygni profile of Balmer lines, IRexcess emission, and non-photospheric UV continuum, indi-cate that the star is likely an intermediate-mass PMS star withan accretion disk (Pérez et al. 2008). The star ID 872 in NGC1931 also showed similar photometric properties (the variationin -U B color, an abnormal reddening law, and IR excessemission) to those of Walker 90 although its spectral featureswere not confirmed. If the star is at the analogous evolutionarystage to Walker 90, the age of NGC 1931 can be conjecturedfrom the age of the S Mon group within NGC 2264(1.6–3.0Myr, Sung & Bessell 2010).
Most of the PMS members in the two clusters have massessmaller than 3 ☉M . The number of PMS members identified inNGC 1624 is insufficient to investigate the age distribution.The star ID 1773, which is known as the main ionizing sourceof UCHII at the border of NGC 1624, is likely a PMS star at avery early evolutionary stage. The age of the star seems to beyounger than 1Myr, indicating that star formation is currentlytaking place in the cluster. We estimated the mass accretion rateof the star using its UV excess emission as performed inprevious studies (Rebull et al. 2000; Lim et al. 2014a, 2014b).The mass accretion rate of the young PMS star is
= ´ - -☉M M˙ 3.98 10 yr6 1. On the other hand, more than
half of the PMS members are likely to be younger than 4Myr.There are three PMS members (two Hα emission and one UVexcess stars) near the ZAMS. These stars seem to be older thanother members. However, if the stars have a nearly edge-ondisk, their luminosities would be underestimated. In addition,accretion activities can lead the colors of the stars to be bluer,i.e., hotter Teff.
In the HRD of NGC 1931 (the right panel of Figure 12),most of the PMS members are younger than 10 Myr, whichwas suggested by the open cluster data base WEBDA.7 It isworth noting that WEBDA provided incorrect ages for someopen clusters. The number of PMS members is relativelylarger than that identified in NGC 1624 because of itsproximity as well as the variety of the available data. Weinvestigated the age distribution of the PMS members (thicksolid line) in Figure 13, where the bin size is 0.5 Myr. Inorder to avoid binning effects, another histogram (thin solidline) was plotted by shifting the bins by half the bin size. Apeak in the age distribution appears at 1.5 Myr. The medianage is about 2.0 Myr with a spread of 4.5 Myr, where thespread was defined as the age difference between the 10 and90 percentiles in the cumulative age distribution of the PMSmembers (Sung & Bessell 2010). Since all the PMS memberswere identified using membership selection criteria based onthe observational properties of warm circumstellar disks andaccretion activities, the age distribution could be biased toyoung active stars.
Previous studies estimated the turn-off age of NGC 1624 tobe 4 Myr (Sujatha & Babu 2006; Jose et al. 2011). Ourestimate (4 Myr) is in good agreement with those. Otherevolution models by Brott et al. (2011) for Milky Way andLMC metallicities give a slightly younger age (3.3 and3.8 Myr). The upper value of the ages of PMS members (⩽4Myr) is also consistent with that of Jose et al. (2011). Theturn-off age of NGC 1931 remains uncertain because the
evolutionary stage of the brightest star is ambiguous. For thisreason, Bonatto & Bica (2009) obtained a somewhat largerturn-off age (10± 3 Myr), while Pandey et al. (2013a) onlysuggested an upper value of 25 Myr. The latter reported amean age of 2± 1 Myr for the PMS stars. This is in goodagreement with the median age from this work. They alsofound a similar age spread (∼5 Myr) from their CMD. Wehave further discussions on the age spread of PMS stars inSection 6.
5. INITIAL MASS FUNCTION
5.1. Derivation
The membership selection of PMS stars is likely incompletebecause the membership selection criteria used above are morelikely to identify young active PMS stars rather than those in aquiescent phase. A statistical method was therefore used to fillin the incomplete mass bins of the IMF.We included all the stars within the PMS locus in the
( -V V I, ) CMD, that is, bona-fide members plus any fieldinterlopers. These stars were then placed in the HRDfollowing the same procedure as delineated in the previoussection (see Figure 12). The mass of the individual stars wasestimated in the HRD by comparing their Teff and Mbol withthose from the evolutionary tracks. For the MS members, thestellar evolution model of Ekström et al. (2012) was used toestimate the mass. The mass of the PMS members and thefield stars was inferred from the PMS evolution models ofSiess et al. (2000). In order to minimize the contribution offield interlopers, appropriate control fields were chosenwithin the observed regions (the shaded area in Figure 1).The stars within the PMS locus in the control fields wereassumed to be evenly distributed in the direction of eachcluster. The apparent mass of these stars was estimated byusing the same procedure as above, where the mean
Figure 13. Age distribution of PMS members identified in NGC 1931. Thehistograms are based on different binning of the same stars. A peak ageappears at 1.5 Myr, and the median age is about 2 Myr with a spread of4.5 Myr.
7 http://univie.ac.at/webda/
16
The Astronomical Journal, 149:127 (25pp), 2015 April Lim et al.
reddening and distance of the two clusters applied to thestars. We note that the apparent mass does not mean realstellar mass.
The IMF is, in general, expressed as x ºD
N
m Slog ·, where N,
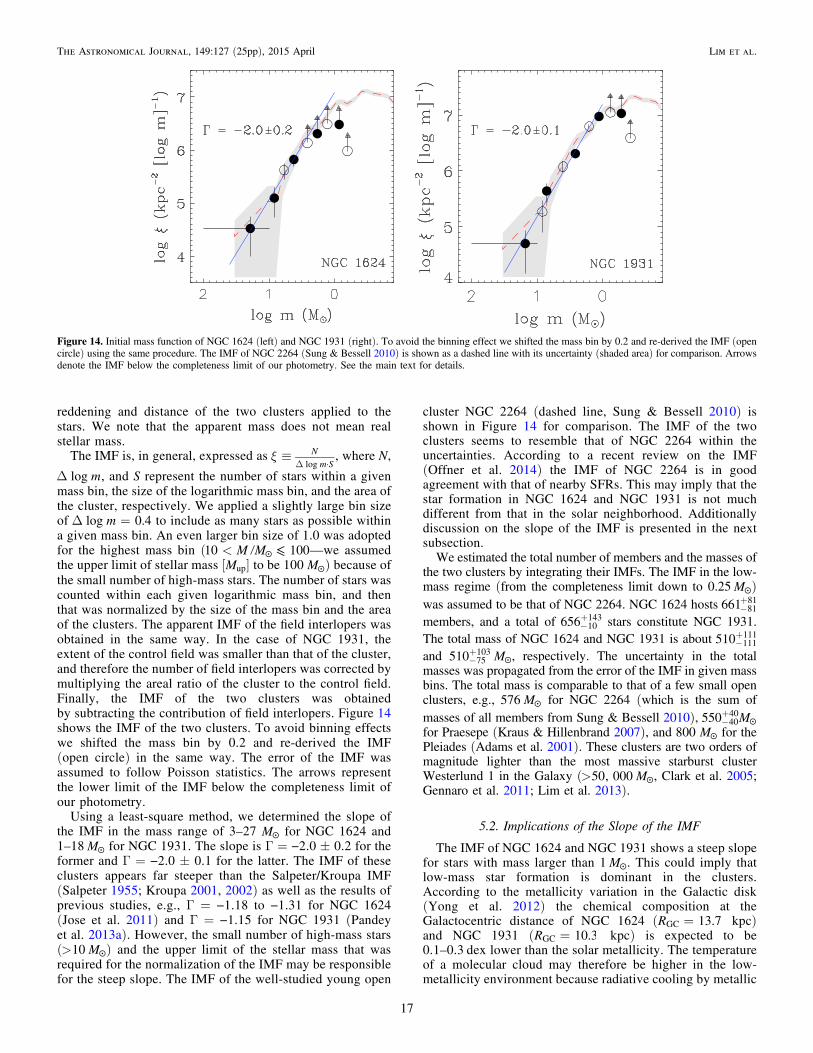
D mlog , and S represent the number of stars within a givenmass bin, the size of the logarithmic mass bin, and the area ofthe cluster, respectively. We applied a slightly large bin sizeof D =mlog 0.4 to include as many stars as possible withina given mass bin. An even larger bin size of 1.0 was adoptedfor the highest mass bin ( < ⩽☉M M10 100—we assumedthe upper limit of stellar mass [Mup] to be 100 ☉M ) because ofthe small number of high-mass stars. The number of stars wascounted within each given logarithmic mass bin, and thenthat was normalized by the size of the mass bin and the areaof the clusters. The apparent IMF of the field interlopers wasobtained in the same way. In the case of NGC 1931, theextent of the control field was smaller than that of the cluster,and therefore the number of field interlopers was corrected bymultiplying the areal ratio of the cluster to the control field.Finally, the IMF of the two clusters was obtainedby subtracting the contribution of field interlopers. Figure 14shows the IMF of the two clusters. To avoid binning effectswe shifted the mass bin by 0.2 and re-derived the IMF(open circle) in the same way. The error of the IMF wasassumed to follow Poisson statistics. The arrows representthe lower limit of the IMF below the completeness limit ofour photometry.
Using a least-square method, we determined the slope ofthe IMF in the mass range of 3–27 ☉M for NGC 1624 and1–18 ☉M for NGC 1931. The slope is Γ = −2.0 ± 0.2 for theformer and Γ = −2.0 ± 0.1 for the latter. The IMF of theseclusters appears far steeper than the Salpeter/Kroupa IMF(Salpeter 1955; Kroupa 2001, 2002) as well as the results ofprevious studies, e.g., Γ = −1.18 to −1.31 for NGC 1624(Jose et al. 2011) and Γ = −1.15 for NGC 1931 (Pandeyet al. 2013a). However, the small number of high-mass stars(> ☉M10 ) and the upper limit of the stellar mass that wasrequired for the normalization of the IMF may be responsiblefor the steep slope. The IMF of the well-studied young open
cluster NGC 2264 (dashed line, Sung & Bessell 2010) isshown in Figure 14 for comparison. The IMF of the twoclusters seems to resemble that of NGC 2264 within theuncertainties. According to a recent review on the IMF(Offner et al. 2014) the IMF of NGC 2264 is in goodagreement with that of nearby SFRs. This may imply that thestar formation in NGC 1624 and NGC 1931 is not muchdifferent from that in the solar neighborhood. Additionallydiscussion on the slope of the IMF is presented in the nextsubsection.We estimated the total number of members and the masses of
the two clusters by integrating their IMFs. The IMF in the low-mass regime (from the completeness limit down to 0.25 ☉M )was assumed to be that of NGC 2264. NGC 1624 hosts -
+661 8181
members, and a total of -+656 10
143 stars constitute NGC 1931.The total mass of NGC 1624 and NGC 1931 is about -
+510 111111
and -+
☉M510 75103 , respectively. The uncertainty in the total
masses was propagated from the error of the IMF in given massbins. The total mass is comparable to that of a few small openclusters, e.g., ☉M576 for NGC 2264 (which is the sum ofmasses of all members from Sung & Bessell 2010), -
+☉M550 40
40
for Praesepe (Kraus & Hillenbrand 2007), and 800 ☉M for thePleiades (Adams et al. 2001). These clusters are two orders ofmagnitude lighter than the most massive starburst clusterWesterlund 1 in the Galaxy (> ☉M50, 000 , Clark et al. 2005;Gennaro et al. 2011; Lim et al. 2013).
5.2. Implications of the Slope of the IMF
The IMF of NGC 1624 and NGC 1931 shows a steep slopefor stars with mass larger than 1 ☉M . This could imply thatlow-mass star formation is dominant in the clusters.According to the metallicity variation in the Galactic disk(Yong et al. 2012) the chemical composition at theGalactocentric distance of NGC 1624 ( =R 13.7GC kpc)and NGC 1931 ( =R 10.3GC kpc) is expected to be0.1–0.3 dex lower than the solar metallicity. The temperatureof a molecular cloud may therefore be higher in the low-metallicity environment because radiative cooling by metallic
Figure 14. Initial mass function of NGC 1624 (left) and NGC 1931 (right). To avoid the binning effect we shifted the mass bin by 0.2 and re-derived the IMF (opencircle) using the same procedure. The IMF of NGC 2264 (Sung & Bessell 2010) is shown as a dashed line with its uncertainty (shaded area) for comparison. Arrowsdenote the IMF below the completeness limit of our photometry. See the main text for details.
17
The Astronomical Journal, 149:127 (25pp), 2015 April Lim et al.

ions will be lower (Caramazza et al. 2012). Furthermore,there is a relation between the mass accretion rate of a starand the temperature of a cloud ( µM T˙ 3 2, Susa et al. 2014).As a result, high-mass stars may be formed advantageously insuch a low-metallicity environment, rather than active low-mass star formation. However, the IMF of the two clusters isinconsistent with this expectation.
To properly interpret the IMF of the clusters we will firstdiscuss a few issues concerning the subtraction of field stars,dynamical evolution, and stochastic effects.
We carried out checks to see whether the subtraction of fieldinterpolators had been adequately carried out because had thecontribution of field interlopers been improperly subtractedwithin a given mass bin, the resultant IMF would bemisleading. We examined the V band LF of stars in eachcontrol field using the synthetic stellar population model for theGalaxy (Robin et al. 2003). The synthetic LF was scaled tohave the same area as that of each control field. The observedLF was compared with the synthetic one. The LF of stars in thecontrol field for NGC 1931 ( = ◦l 173 .90, = ◦b 0 .28) is in goodagreement with the synthetic one, while the stellar populationmodel overestimated the number of stars toward NGC 1624 atV ∼ 19 mag. Because of the Galactic warp found at l = 90°(Robin et al. 2003), the synthetic stellar population in thedirection of NGC 1624 ( = ◦l 155 .356, = ◦b 2 .616), which islinearly interpolated from those between l = 90° and 180°, maynot warrant consistency with the observational result. Alter-natively, we obtained the IMF of NGC 1624 selecting differentcontrol fields (the western region aD = - ¢6.0, dD = + ¢3.5 orthe southwestern region aD = - ¢7.5, dD = - ¢6.5 in Figure 1).The slopes of the IMFs were about Γ = −2.2 ± 0.3 and−2.0± 0.3, respectively. Hence, the uncertainty arising fromthe subtraction of field interlopers has a negligible contributionto the slope.
Kroupa (2001) has presented a segmented IMF based oncompiled data. In his alpha-plot, a non-negligible scatter wasfound in the mass range of 1–100 ☉M . The author attributedthe cause of the scatter to dynamical effects and Poissonnoise. It used to be believed that young open clusters weretoo young to have undergone dynamical mass segregation;however, a few young open clusters show clear signs of masssegregation, e.g., Arches cluster (Habibi et al. 2013), NGC3603 (Pang et al. 2013), NGC 6231 (Raboud & Mermil-liod 1998; Sung et al. 2013b), Orion Nebula Cluster (ONC)
(Hillenbrand & Hartmann 1998), Westerlund 1 (Gennaroet al. 2011; Lim et al. 2013), etc. Several studies, throughmultiple sets of numerical simulation, suggested that themass segregation found in young clusters has a dynamicalorigin (McMillan et al. 2007; Allison et al. 2009, 2010;Moeckel & Bonnell 2009). If dynamical evolution hadefficiently operated within young clusters, a number of low-mass members would have evaporated into the outskirtsof the cluster region. Consequently, one would expect theIMF to be biased toward bright stars, and therefore show ashallow slope. The steep slope of the IMF in this work isinconsistent with this expectation of the effects. Thus, thecontribution of the dynamical effect may be less significantfor the clusters.The total number of members belonging to NGC 1624 and
NGC 1931 is so small, that its measured IMF is vulnerable tostochastic effects. In order to test for this effect on the slope ofthe IMF, multiple sets of Monte-Carlo simulations wereconducted for three cases with the total number of clustermembers ( =N 100, 1000, and 3000). The Kroupa IMF(Kroupa 2001) was used as the underlying IMF for stars withmass larger than 0.5 ☉M . The simulation for each case was run10,000 times. The IMF of the model clusters was derived usingthe same procedure described as above. The size of the massbin was set to D =mlog 0.4, while a bin size of 1.0 wasadopted for the highest mass bin if the number of stars withmass larger than 10 ☉M was smaller than five. Figure 15displays the distribution of Γ with the total number of clustermembers. The dispersion of the distribution appears to be largein model clusters with a small number of members, while theIMF of model clusters with a large number of members showsa higher consistency with the underlying IMF. However, thepossibility that the IMF of a given cluster has a slope steeperthan Γ = −2.0 is only about 10% in the case of =N 100, andthe likelihood decreases with the increase of the total number ofcluster members. It implies that the possibility that the IMF ofthe two clusters in the present work exhibits a steeper slopethan −2.0 is about 1%. Therefore, the stochastic effect seemsnot to explain our results reasonably. Although the Kroupa/Salpeter IMF provides a representative slope of the stellar IMFin a given mass range, it remains to be seen whether or not theslope is universal. Future work on the IMF of small, youngopen clusters will be used observationally to examine thisissue.
Figure 15. Distribution of the IMF slope (Γ) with the total number of cluster members. A Monte-Carlo simulation was performed 10,000 times for the modelclusters consisting of 100, 1000, and 3000 members, respectively. The histograms are based on different binning of the same artificial stars (thick and thin solidlines).
18
The Astronomical Journal, 149:127 (25pp), 2015 April Lim et al.
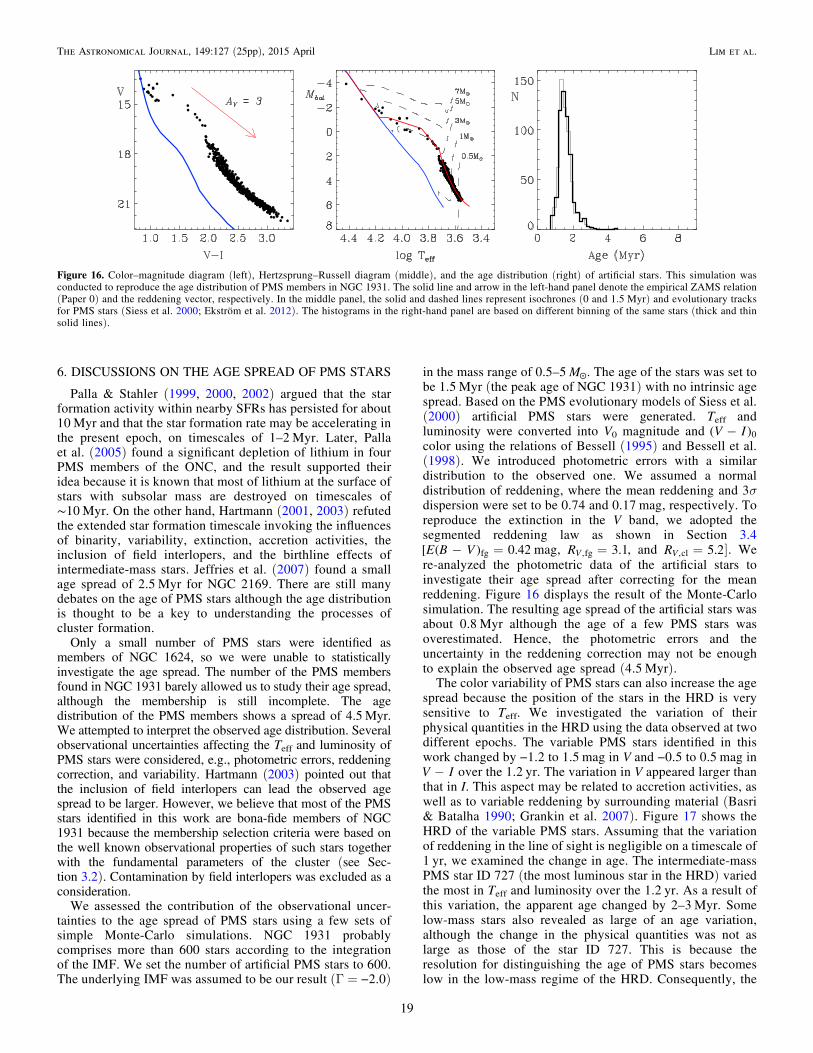
6. DISCUSSIONS ON THE AGE SPREAD OF PMS STARS
Palla & Stahler (1999, 2000, 2002) argued that the starformation activity within nearby SFRs has persisted for about10 Myr and that the star formation rate may be accelerating inthe present epoch, on timescales of 1–2 Myr. Later, Pallaet al. (2005) found a significant depletion of lithium in fourPMS members of the ONC, and the result supported theiridea because it is known that most of lithium at the surface ofstars with subsolar mass are destroyed on timescales of∼10 Myr. On the other hand, Hartmann (2001, 2003) refutedthe extended star formation timescale invoking the influencesof binarity, variability, extinction, accretion activities, theinclusion of field interlopers, and the birthline effects ofintermediate-mass stars. Jeffries et al. (2007) found a smallage spread of 2.5 Myr for NGC 2169. There are still manydebates on the age of PMS stars although the age distributionis thought to be a key to understanding the processes ofcluster formation.
Only a small number of PMS stars were identified asmembers of NGC 1624, so we were unable to statisticallyinvestigate the age spread. The number of the PMS membersfound in NGC 1931 barely allowed us to study their age spread,although the membership is still incomplete. The agedistribution of the PMS members shows a spread of 4.5 Myr.We attempted to interpret the observed age distribution. Severalobservational uncertainties affecting the Teff and luminosity ofPMS stars were considered, e.g., photometric errors, reddeningcorrection, and variability. Hartmann (2003) pointed out thatthe inclusion of field interlopers can lead the observed agespread to be larger. However, we believe that most of the PMSstars identified in this work are bona-fide members of NGC1931 because the membership selection criteria were based onthe well known observational properties of such stars togetherwith the fundamental parameters of the cluster (see Sec-tion 3.2). Contamination by field interlopers was excluded as aconsideration.
We assessed the contribution of the observational uncer-tainties to the age spread of PMS stars using a few sets ofsimple Monte-Carlo simulations. NGC 1931 probablycomprises more than 600 stars according to the integrationof the IMF. We set the number of artificial PMS stars to 600.The underlying IMF was assumed to be our result (Γ = −2.0)
in the mass range of 0.5–5 ☉M . The age of the stars was set tobe 1.5 Myr (the peak age of NGC 1931) with no intrinsic agespread. Based on the PMS evolutionary models of Siess et al.(2000) artificial PMS stars were generated. Teff andluminosity were converted into V0 magnitude and -V I( )0color using the relations of Bessell (1995) and Bessell et al.(1998). We introduced photometric errors with a similardistribution to the observed one. We assumed a normaldistribution of reddening, where the mean reddening and 3σdispersion were set to be 0.74 and 0.17 mag, respectively. Toreproduce the extinction in the V band, we adopted thesegmented reddening law as shown in Section 3.4
- =E B V[ ( ) 0.42fg mag, =R 3.1V ,fg , and =R 5.2V ,cl ]. Were-analyzed the photometric data of the artificial stars toinvestigate their age spread after correcting for the meanreddening. Figure 16 displays the result of the Monte-Carlosimulation. The resulting age spread of the artificial stars wasabout 0.8 Myr although the age of a few PMS stars wasoverestimated. Hence, the photometric errors and theuncertainty in the reddening correction may not be enoughto explain the observed age spread (4.5 Myr).The color variability of PMS stars can also increase the age
spread because the position of the stars in the HRD is verysensitive to Teff. We investigated the variation of theirphysical quantities in the HRD using the data observed at twodifferent epochs. The variable PMS stars identified in thiswork changed by −1.2 to 1.5 mag in V and −0.5 to 0.5 mag in-V I over the 1.2 yr. The variation in V appeared larger than
that in I. This aspect may be related to accretion activities, aswell as to variable reddening by surrounding material (Basri& Batalha 1990; Grankin et al. 2007). Figure 17 shows theHRD of the variable PMS stars. Assuming that the variationof reddening in the line of sight is negligible on a timescale of1 yr, we examined the change in age. The intermediate-massPMS star ID 727 (the most luminous star in the HRD) variedthe most in Teff and luminosity over the 1.2 yr. As a result ofthis variation, the apparent age changed by 2–3 Myr. Somelow-mass stars also revealed as large of an age variation,although the change in the physical quantities was not aslarge as those of the star ID 727. This is because theresolution for distinguishing the age of PMS stars becomeslow in the low-mass regime of the HRD. Consequently, the
Figure 16. Color–magnitude diagram (left), Hertzsprung–Russell diagram (middle), and the age distribution (right) of artificial stars. This simulation wasconducted to reproduce the age distribution of PMS members in NGC 1931. The solid line and arrow in the left-hand panel denote the empirical ZAMS relation(Paper 0) and the reddening vector, respectively. In the middle panel, the solid and dashed lines represent isochrones (0 and 1.5 Myr) and evolutionary tracksfor PMS stars (Siess et al. 2000; Ekström et al. 2012). The histograms in the right-hand panel are based on different binning of the same stars (thick and thinsolid lines).
19
The Astronomical Journal, 149:127 (25pp), 2015 April Lim et al.
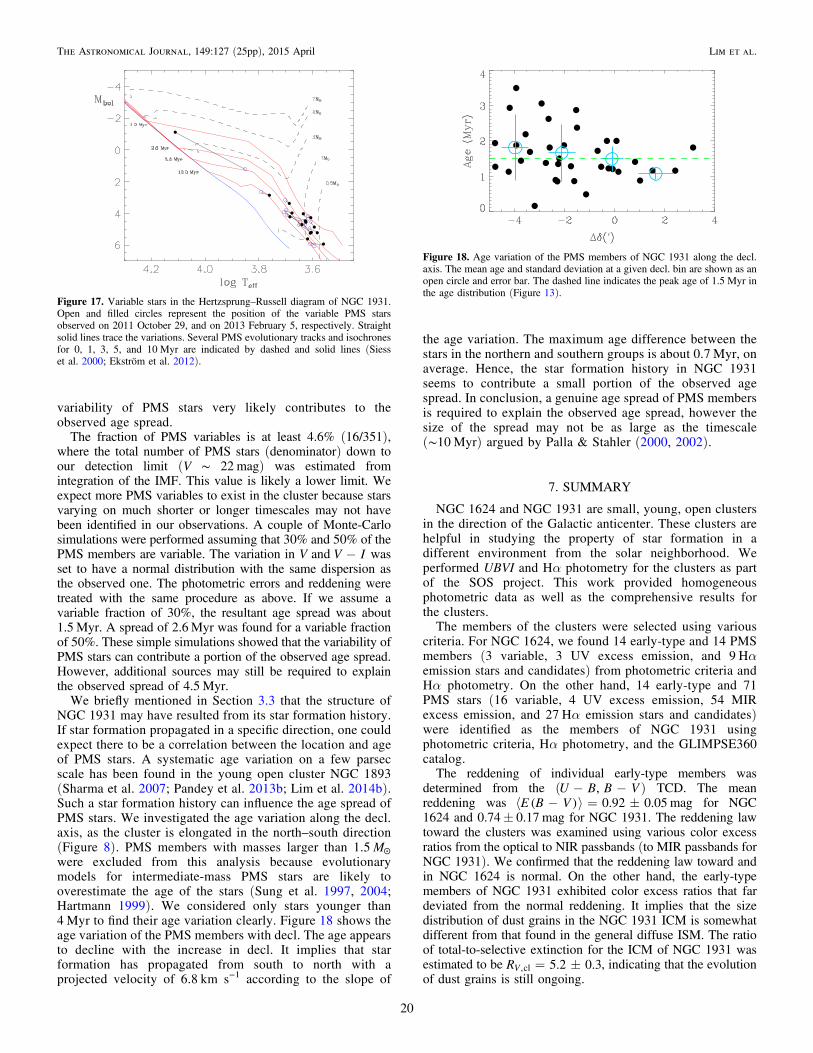
variability of PMS stars very likely contributes to theobserved age spread.
The fraction of PMS variables is at least 4.6% (16/351),where the total number of PMS stars (denominator) down toour detection limit (V ∼ 22 mag) was estimated fromintegration of the IMF. This value is likely a lower limit. Weexpect more PMS variables to exist in the cluster because starsvarying on much shorter or longer timescales may not havebeen identified in our observations. A couple of Monte-Carlosimulations were performed assuming that 30% and 50% of thePMS members are variable. The variation in V and -V I wasset to have a normal distribution with the same dispersion asthe observed one. The photometric errors and reddening weretreated with the same procedure as above. If we assume avariable fraction of 30%, the resultant age spread was about1.5 Myr. A spread of 2.6Myr was found for a variable fractionof 50%. These simple simulations showed that the variability ofPMS stars can contribute a portion of the observed age spread.However, additional sources may still be required to explainthe observed spread of 4.5 Myr.
We briefly mentioned in Section 3.3 that the structure ofNGC 1931 may have resulted from its star formation history.If star formation propagated in a specific direction, one couldexpect there to be a correlation between the location and ageof PMS stars. A systematic age variation on a few parsecscale has been found in the young open cluster NGC 1893(Sharma et al. 2007; Pandey et al. 2013b; Lim et al. 2014b).Such a star formation history can influence the age spread ofPMS stars. We investigated the age variation along the decl.axis, as the cluster is elongated in the north–south direction(Figure 8). PMS members with masses larger than 1.5 ☉Mwere excluded from this analysis because evolutionarymodels for intermediate-mass PMS stars are likely tooverestimate the age of the stars (Sung et al. 1997, 2004;Hartmann 1999). We considered only stars younger than4 Myr to find their age variation clearly. Figure 18 shows theage variation of the PMS members with decl. The age appearsto decline with the increase in decl. It implies that starformation has propagated from south to north with aprojected velocity of 6.8 km s−1 according to the slope of
the age variation. The maximum age difference between thestars in the northern and southern groups is about 0.7 Myr, onaverage. Hence, the star formation history in NGC 1931seems to contribute a small portion of the observed agespread. In conclusion, a genuine age spread of PMS membersis required to explain the observed age spread, however thesize of the spread may not be as large as the timescale(∼10 Myr) argued by Palla & Stahler (2000, 2002).
7. SUMMARY
NGC 1624 and NGC 1931 are small, young, open clustersin the direction of the Galactic anticenter. These clusters arehelpful in studying the property of star formation in adifferent environment from the solar neighborhood. Weperformed UBVI and Hα photometry for the clusters as partof the SOS project. This work provided homogeneousphotometric data as well as the comprehensive results forthe clusters.The members of the clusters were selected using various
criteria. For NGC 1624, we found 14 early-type and 14 PMSmembers (3 variable, 3 UV excess emission, and 9 Hαemission stars and candidates) from photometric criteria andHα photometry. On the other hand, 14 early-type and 71PMS stars (16 variable, 4 UV excess emission, 54 MIRexcess emission, and 27 Hα emission stars and candidates)were identified as the members of NGC 1931 usingphotometric criteria, Hα photometry, and the GLIMPSE360catalog.The reddening of individual early-type members was
determined from the ( - -U B B V, ) TCD. The meanreddening was á - ñ = E B V( ) 0.92 0.05 mag for NGC1624 and 0.74± 0.17 mag for NGC 1931. The reddening lawtoward the clusters was examined using various color excessratios from the optical to NIR passbands (to MIR passbands forNGC 1931). We confirmed that the reddening law toward andin NGC 1624 is normal. On the other hand, the early-typemembers of NGC 1931 exhibited color excess ratios that fardeviated from the normal reddening. It implies that the sizedistribution of dust grains in the NGC 1931 ICM is somewhatdifferent from that found in the general diffuse ISM. The ratioof total-to-selective extinction for the ICM of NGC 1931 wasestimated to be = R 5.2 0.3V ,cl , indicating that the evolutionof dust grains is still ongoing.
Figure 18. Age variation of the PMS members of NGC 1931 along the decl.axis. The mean age and standard deviation at a given decl. bin are shown as anopen circle and error bar. The dashed line indicates the peak age of 1.5 Myr inthe age distribution (Figure 13).
Figure 17. Variable stars in the Hertzsprung–Russell diagram of NGC 1931.Open and filled circles represent the position of the variable PMS starsobserved on 2011 October 29, and on 2013 February 5, respectively. Straightsolid lines trace the variations. Several PMS evolutionary tracks and isochronesfor 0, 1, 3, 5, and 10 Myr are indicated by dashed and solid lines (Siesset al. 2000; Ekström et al. 2012).
20
The Astronomical Journal, 149:127 (25pp), 2015 April Lim et al.
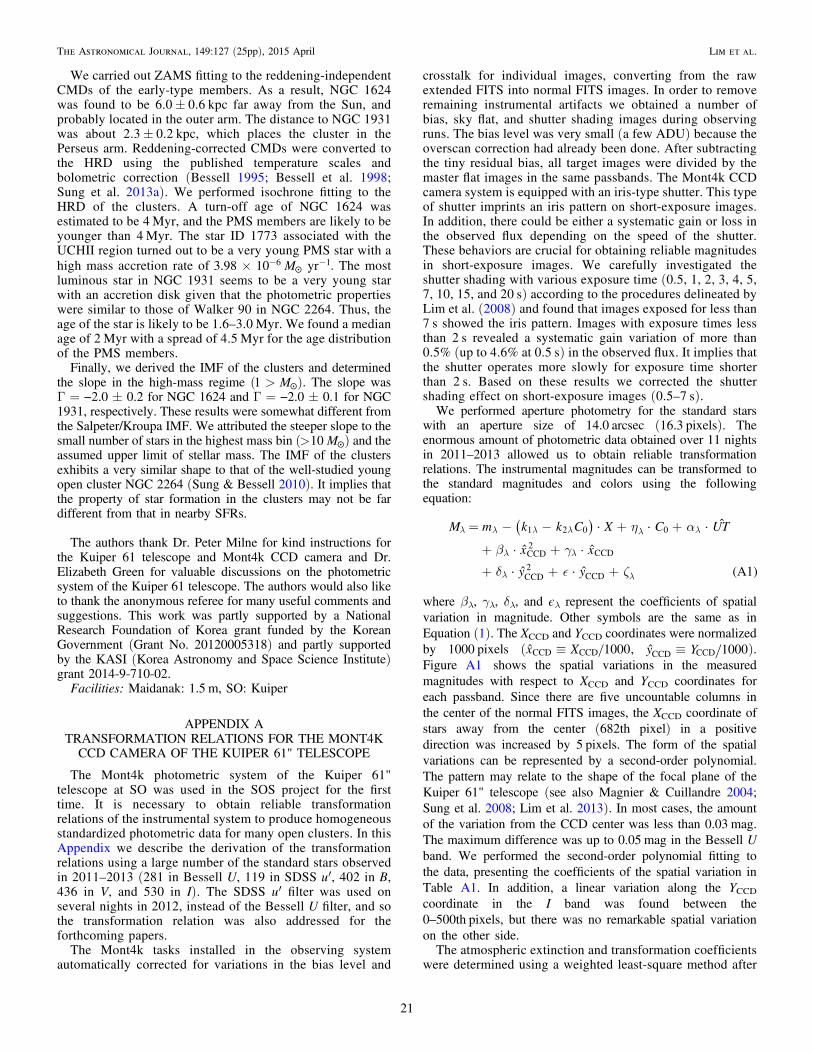
We carried out ZAMS fitting to the reddening-independentCMDs of the early-type members. As a result, NGC 1624was found to be 6.0± 0.6 kpc far away from the Sun, andprobably located in the outer arm. The distance to NGC 1931was about 2.3± 0.2 kpc, which places the cluster in thePerseus arm. Reddening-corrected CMDs were converted tothe HRD using the published temperature scales andbolometric correction (Bessell 1995; Bessell et al. 1998;Sung et al. 2013a). We performed isochrone fitting to theHRD of the clusters. A turn-off age of NGC 1624 wasestimated to be 4 Myr, and the PMS members are likely to beyounger than 4 Myr. The star ID 1773 associated with theUCHII region turned out to be a very young PMS star with ahigh mass accretion rate of ´ -3.98 10 6 -
☉M yr 1. The mostluminous star in NGC 1931 seems to be a very young starwith an accretion disk given that the photometric propertieswere similar to those of Walker 90 in NGC 2264. Thus, theage of the star is likely to be 1.6–3.0 Myr. We found a medianage of 2 Myr with a spread of 4.5 Myr for the age distributionof the PMS members.
Finally, we derived the IMF of the clusters and determinedthe slope in the high-mass regime ( > ☉M1 ). The slope wasΓ = −2.0 ± 0.2 for NGC 1624 and Γ = −2.0 ± 0.1 for NGC1931, respectively. These results were somewhat different fromthe Salpeter/Kroupa IMF. We attributed the steeper slope to thesmall number of stars in the highest mass bin (> ☉M10 ) and theassumed upper limit of stellar mass. The IMF of the clustersexhibits a very similar shape to that of the well-studied youngopen cluster NGC 2264 (Sung & Bessell 2010). It implies thatthe property of star formation in the clusters may not be fardifferent from that in nearby SFRs.
The authors thank Dr. Peter Milne for kind instructions forthe Kuiper 61 telescope and Mont4k CCD camera and Dr.Elizabeth Green for valuable discussions on the photometricsystem of the Kuiper 61 telescope. The authors would also liketo thank the anonymous referee for many useful comments andsuggestions. This work was partly supported by a NationalResearch Foundation of Korea grant funded by the KoreanGovernment (Grant No. 20120005318) and partly supportedby the KASI (Korea Astronomy and Space Science Institute)grant 2014-9-710-02.
Facilities: Maidanak: 1.5 m, SO: Kuiper
APPENDIX ATRANSFORMATION RELATIONS FOR THE MONT4K
CCD CAMERA OF THE KUIPER 61" TELESCOPE
The Mont4k photometric system of the Kuiper 61"telescope at SO was used in the SOS project for the firsttime. It is necessary to obtain reliable transformationrelations of the instrumental system to produce homogeneousstandardized photometric data for many open clusters. In thisAppendix we describe the derivation of the transformationrelations using a large number of the standard stars observedin 2011–2013 (281 in Bessell U, 119 in SDSS u′, 402 in B,436 in V, and 530 in I). The SDSS u′ filter was used onseveral nights in 2012, instead of the Bessell U filter, and sothe transformation relation was also addressed for theforthcoming papers.
The Mont4k tasks installed in the observing systemautomatically corrected for variations in the bias level and
crosstalk for individual images, converting from the rawextended FITS into normal FITS images. In order to removeremaining instrumental artifacts we obtained a number ofbias, sky flat, and shutter shading images during observingruns. The bias level was very small (a few ADU) because theoverscan correction had already been done. After subtractingthe tiny residual bias, all target images were divided by themaster flat images in the same passbands. The Mont4k CCDcamera system is equipped with an iris-type shutter. This typeof shutter imprints an iris pattern on short-exposure images.In addition, there could be either a systematic gain or loss inthe observed flux depending on the speed of the shutter.These behaviors are crucial for obtaining reliable magnitudesin short-exposure images. We carefully investigated theshutter shading with various exposure time (0.5, 1, 2, 3, 4, 5,7, 10, 15, and 20 s) according to the procedures delineated byLim et al. (2008) and found that images exposed for less than7 s showed the iris pattern. Images with exposure times lessthan 2 s revealed a systematic gain variation of more than0.5% (up to 4.6% at 0.5 s) in the observed flux. It implies thatthe shutter operates more slowly for exposure time shorterthan 2 s. Based on these results we corrected the shuttershading effect on short-exposure images (0.5–7 s).We performed aperture photometry for the standard stars
with an aperture size of 14.0 arcsec (16.3 pixels). Theenormous amount of photometric data obtained over 11 nightsin 2011–2013 allowed us to obtain reliable transformationrelations. The instrumental magnitudes can be transformed tothe standard magnitudes and colors using the followingequation:
h a
b g
d z
= - - + +
+ +
+ + +
l l l l l l
l l
l l
( )M m k k C X C UT
x x
y y
· · · ˆ
· ˆ · ˆ
· ˆ · ˆ (A1)
1 2 0 0
CCD2
CCD
CCD2
CCD
where βλ, γλ, δλ, and ϵλ represent the coefficients of spatialvariation in magnitude. Other symbols are the same as inEquation (1). The XCCD and YCCD coordinates were normalizedby 1000 pixels ( ºx Xˆ 1000CCD CCD , ºy Yˆ 1000CCD CCD ).Figure A1 shows the spatial variations in the measuredmagnitudes with respect to XCCD and YCCD coordinates foreach passband. Since there are five uncountable columns inthe center of the normal FITS images, the XCCD coordinate ofstars away from the center (682th pixel) in a positivedirection was increased by 5 pixels. The form of the spatialvariations can be represented by a second-order polynomial.The pattern may relate to the shape of the focal plane of theKuiper 61" telescope (see also Magnier & Cuillandre 2004;Sung et al. 2008; Lim et al. 2013). In most cases, the amountof the variation from the CCD center was less than 0.03 mag.The maximum difference was up to 0.05 mag in the Bessell Uband. We performed the second-order polynomial fitting tothe data, presenting the coefficients of the spatial variation inTable A1. In addition, a linear variation along the YCCDcoordinate in the I band was found between the0–500th pixels, but there was no remarkable spatial variationon the other side.The atmospheric extinction and transformation coefficients
were determined using a weighted least-square method after
21
The Astronomical Journal, 149:127 (25pp), 2015 April Lim et al.
correcting for the spatial variations. Figure A2 shows thetransformation relations for the Mont4k CCD camera system.A combination of a few straight lines constitutes thetransformation relations. Since there was only one extremelyred star ( - >V I 3 ) in the I transformation with respect to-V I color, the transformation relation may be uncertain in
that color range. The V transformation with respect to -V Ishows a plateau for the reddest stars ( - >V I 1.55). The TiOband spectral features in late-type stars are related to thisplateau as seen in other studies (Sung & Bessell 2000; Limet al. 2009, 2013). The B transformation was approximated
by a combination of two straight lines, and the coefficientsare very small. The transformation relations of the Bessell Uand SDSS u′ filters exhibit opposite trends to each other. Anonlinear behavior was found in the U transformation.According to Sung & Bessell (2000) and Lim et al. (2009)this aspect is caused by the Balmer discontinuity in the fluxesof B-F-type stars and difference between the responsefunctions of the Johnson–Cousins standard system andnatural photometric systems. Such a nonlinearity can becorrected using dereddened -B V colors as shown in thelower-right panels of Figure A2. The aspect of the nonlinearcorrection term appears as an opposite trend in the Bessell Uand SDSS u′ transformation relations. The transformationcoefficients with respect to given colors are summarized inTable A2 .On the other hand, we found that standard stars with an
intrinsically red color appeared systematically brighter thanother stars in the Bessell U filter after correcting with all thecoefficients above (see the upper panel in Figure A3 ). Unlikethe Bessell U filter used at MAO, the U filter attached to theMont4k CCD camera exhibits the so-called red leak. Sincethe contribution of red light drastically increases for
- >U B 1, a careful correction for the red leak effect was
Figure A1. Spatial variation of the measured magnitudes with respect to the XCCD (left) or YCCD (right) coordinates of the Mont4k CCD chip. The XCCD coordinatesof stars in a positive direction from the CCD center ( =X 682CCD ) was increased by 5 pixels because of five uncountable columns in the center of the normal FITSimages. All the pixel coordinates of the standard stars on the CCD chip have been divided by 1000. Most spatial variations appear in the form of a second-orderpolynomial equation. The variation of the I magnitude along the YCCD can be approximated by a combination of two straight lines. The maximum difference betweenthe center and edge of the CCD is less than 0.05 mag.
Table A1Spatial Variation Coefficients of the Mont4k CCD Camera
Filter β γ δ ϵ Remark
I 0.062 −0.086 L −0.052 <Y 500CCD pixels
V 0.024 −0.029 0.046 −0.066 LB 0.029 −0.029 0.043 −0.063 LU 0.042 −0.052 0.058 −0.097 Lu′ 0.030 −0.049 0.047 −0.066 L
22
The Astronomical Journal, 149:127 (25pp), 2015 April Lim et al.
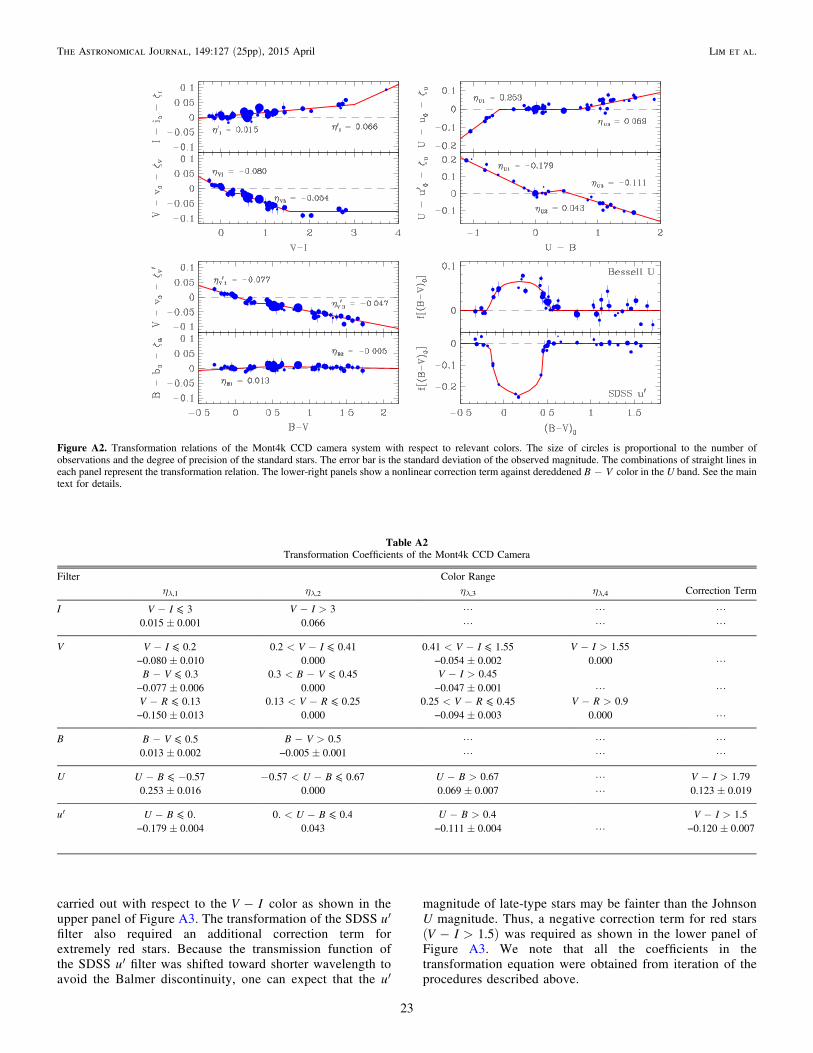
carried out with respect to the -V I color as shown in theupper panel of Figure A3. The transformation of the SDSS u′filter also required an additional correction term forextremely red stars. Because the transmission function ofthe SDSS u′ filter was shifted toward shorter wavelength toavoid the Balmer discontinuity, one can expect that the u′
magnitude of late-type stars may be fainter than the JohnsonU magnitude. Thus, a negative correction term for red stars( - >V I 1.5) was required as shown in the lower panel ofFigure A3. We note that all the coefficients in thetransformation equation were obtained from iteration of theprocedures described above.
Table A2Transformation Coefficients of the Mont4k CCD Camera
Filter Color Rangeηλ,1 ηλ,2 ηλ,3 ηλ,4 Correction Term
I - ⩽V I 3 - >V I 3 L L L0.015 ± 0.001 0.066 L L L
V - ⩽V I 0.2 < - ⩽V I0.2 0.41 < - ⩽V I0.41 1.55 - >V I 1.55−0.080 ± 0.010 0.000 −0.054 ± 0.002 0.000 L
- ⩽B V 0.3 < - ⩽B V0.3 0.45 - >V I 0.45−0.077 ± 0.006 0.000 −0.047 ± 0.001 L L
- ⩽V R 0.13 < - ⩽V R0.13 0.25 < - ⩽V R0.25 0.45 - >V R 0.9−0.150 ± 0.013 0.000 −0.094 ± 0.003 0.000 L
B - ⩽B V 0.5 - >B V 0.5 L L L0.013 ± 0.002 −0.005 ± 0.001 L L L
U - -⩽U B 0.57 - < - ⩽U B0.57 0.67 - >U B 0.67 L - >V I 1.790.253 ± 0.016 0.000 0.069 ± 0.007 L 0.123 ± 0.019
u′ - ⩽U B 0. < - ⩽U B0. 0.4 - >U B 0.4 - >V I 1.5−0.179 ± 0.004 0.043 −0.111 ± 0.004 L −0.120 ± 0.007
Figure A2. Transformation relations of the Mont4k CCD camera system with respect to relevant colors. The size of circles is proportional to the number ofobservations and the degree of precision of the standard stars. The error bar is the standard deviation of the observed magnitude. The combinations of straight lines ineach panel represent the transformation relation. The lower-right panels show a nonlinear correction term against dereddened -B V color in the U band. See the maintext for details.
23
The Astronomical Journal, 149:127 (25pp), 2015 April Lim et al.
REFERENCES
Adams, J. D., Stauffer, J. R., Monet, D. G., Skrutskie, M. F., &Beichman, C. A. 2001, AJ, 121, 2053
Allison, R. J., Goodwin, S. P., Parker, R. J., Portegies Zwart, S. F., &de Grijs, R. 2010, MNRAS, 407, 1098
Allison, R. J., Goodwin, S. P., Parker, R. J., et al. 2009, ApJL, 700, L99Basri, G., & Batalha, C. 1990, ApJ, 363, 654Bastian, N., Covey, K. R., & Meyer, M. R. 2010, ARA&A, 48, 339Bertout, C., Basri, G., & Bouvier, J. 1988, ApJ, 330, 350Bessell, M. S. 1990, PASP, 102, 1181Bessell, M. S. 1995, in Proc. ESO Workshop, The Bottom of the Main
Sequence and Beyond, ed. C. G. Tinney (Berlin: Springer), 123Bessell, M. S., Castelli, F., & Plez, B. 1998, A&A, 333, 231Bhatt, B. C., Pandey, A. K., Mahra, H. S., & Paliwal, D. C. 1994, BASI,
22, 291Bonatto, C., & Bica, E. 2009, MNRAS, 397, 1915Brott, I., de Mink, S. E., Cantiello, M., et al. 2011, A&A, 530, 1115Calvet, N., & Gullbring, E. 1998, ApJ, 509, 802Caramazza, M., Micela, G., Prisinzano, L., et al. 2008, A&A, 488, 211Caramazza, M., Micela, G., Prisinzano, L., et al. 2012, A&A, 539, 74Chini, R., & Wink, J. E. 1984, A&A, 139, 5Clark, J. S., Negueruela, I., Crowther, P. A., & Goodwin, S. P. 2005, A&A,
434, 949Deharveng, L., Lefloch, B., Kurtz, S., et al. 2008, A&A, 482, 585Dias, W. S., & Lépine, J. R. D. 2005, ApJ, 629, 825Ekström, S., Georgy, C., Eggenberger, P., et al. 2012, A&A, 537, 146Elmegreen, B. G., Efremov, Y., Pudritz, R. E., & Zinnecker, H. 2000, in
Protostars and Planets IV ed. V. Mannings, A. P. Boss, & S. S. Russell,(Tucson, AZ: Univ. Arizona Press), 179
Eswaraiah, C., Pandey, A. K., Maheswar, G., et al. 2011, MNRAS, 411, 1418Evans, I. N., Primini, F. A., Glotfelty, K. J., et al. 2010, ApJS, 189, 37Fitzpatrick, E. L., & Massa, D. 2007, ApJ, 663, 320Gennaro, M., Brandner, W., Stolte, A., & Henning, Th. 2011, MNRAS, 412, 2469Glushkov, Y. I., Denisyuk, E. K., & Karyagina, Z. V. 1975, A&A, 39, 481Goodwin, S. P., & Bastian, N. 2006, MNRAS, 373, 752Grankin, K. N., Melnikov, S. Y., Bouvier, J., Herbst, W., & Shevchenko, V. S.
2007, A&A, 461, 183Greve, A. 2010, A&A, 518, 62Guetter, H. H., & Vrba, F. J. 1989, AJ, 98, 611Gullbring, E., Hartmann, L., Briceño, C., & Calvet, N. 1998, ApJ, 492, 323Gutermuth, R. A., Myers, P. C., Megeath, S. T., et al. 2008, ApJ, 674, 336Gutermuth, R. A., Megeath, S. T., Myers, P. C., et al. 2009, ApJS, 184, 18Habibi, M., Stolte, A., Brandner, W., Hußmann, B., & Motohara, K. 2013,
A&A, 556, 26Hartmann, L. 1999, NewAR, 43, 1Hartmann, L. 2001, AJ, 121, 1030Hartmann, L. 2003, ApJ, 585, 398Hillenbrand, L. A., & Hartmann, L. W. 1998, ApJ, 492, 540Hur, H., Park, B.-G., Sung, H., et al. 2014, MNRAS, 446, 3797
Hur, H., Sung, H., & Bessell, M. S. 2012, AJ, 143, 41Im, M., Ko, J., Cho, Y., et al. 2010, JKAS, 43, 75Jeffries, R. D., Oliveira, J. M., Naylor, T., Mayne, N. J., & Littlefair, S. P.
2007, MNRAS, 376, 580Johnson, H. L., & Hiltner, W. A. 1956, ApJ, 123, 267Jose, J., Pandey, A. K., Ogura, K., et al. 2011, MNRAS, 411, 2530Jose, J., Pandey, A. K., Ojha, D. K., et al. 2008, MNRAS, 384, 1675Kraus, A. L., & Hillenbrand, L. A. 2007, AJ, 134, 2340Kilkenny, D., van Wyk, F., Roberts, G., Marang, F., & Cooper, D. 1998,
MNRAS, 294, 93Koenig, X. P., Allen, L. E., Gutermuth, R. A., et al. 2008, ApJ, 688, 1142Kook, S.-H., Sung, H., & Bessell, M. S. 2010, JKAS, 43, 141Kroupa, P. 2001, MNRAS, 322, 231Kroupa, P. 2002, Sci, 295, 82Königl, A. 1991, ApJ, 370, 39Lada, C., & Lada, E. 2003, ARA&A, 41, 57Landolt, A. U. 1992, AJ, 104, 340Lim, B., Chun, M.-Y., Sung, H., et al. 2013, AJ, 145, 46Lim, B., Sung, H., Bessell, M. S., Karimove, R., & Ibrahimov, M. 2009, JKAS,
42, 161Lim, B., Sung, H., Karimov, R., & Ibrahimov, M. 2011, JKAS, 44, 39Lim, B., Sung, H., Karimov, R., & Ibrahimov, M. 2008, PKAS, 23, 1Lim, B., Sung, H., Kim, J. S., Bessell, M. S., & Karimov, R. 2014, MNRAS,
438, 1451Lim, B., Sung, H., Kim, J. S., Bessell, M. S., & Park, B.-G. 2014, MNRAS,
443, 454Magnier, E. A., & Cuillandre, J.-C. 2004, PASP, 116, 449Martins, F., & Palacios, A. 2013, A&A, 560, 16Massey, P. 2013, NewA, 57, 14McMillan, S. L. W., Vesperini, E., & Portegies Zwart, S. F. 2007, ApJL,
655, L45Menzies, J. W., Marang, F., Laing, J. D., Coulson, I. M., & Engelbrecht, C. A.
1991, MNRAS, 248, 642Moeckel, N., & Bonnell, I. A. 2009, MNRAS, 400, 657Moffat, A. F. J., Fitzgerald, M. P., & Jackson, P. D. 1979, A&AS, 38, 197Offner, S. S. R., Clark, P. C., Hennebelle, P., et al. 2014, in Protostars and
Planets VI, ed. H. Beuther, et al. (Tucson, AZ: Univ. Arizona Press) in press(arXiv:1312.5326)
Palla, F., Randich, S., Flaccomio, E., & Pallavicini, R. 2005, ApJL, 626, L49Palla, F., & Stahler, S. W. 1999, ApJ, 525, 772Palla, F., & Stahler, S. W. 2000, ApJ, 540, 255Palla, F., & Stahler, S. W. 2002, ApJ, 581, 1194Pandey, A. K., Eswaraiah, C., Sharma, S., et al. 2013a, ApJ, 764, 172Pandey, A. K., Samal, M. R., Chauhan, N., et al. 2013b, NewA, 19, 1Pandey, A. K., Upadhyay, K., Nakada, Y., & Ogura, K. 2003, A&A, 397, 191Pandey, A. K., & Mahra, H. S. 1986, Ap&SS, 120, 107Pang, X., Grebel, E. K., Allison, R., et al. 2013, ApJ, 764, 73Park, B.-G., Sung, H., Bessell, M. S., & Kang, Y. H. 2000, AJ, 120, 894Park, B.-G., & Sung, H. 2002, AJ, 123, 892Pérez, M. R., McCollum, B., van den Ancker, M. E., & Joner, M. D. 2008,
A&A, 486, 533Porras, A., Christopher, M., Allen, L., et al. 2003, AJ, 126, 1916Raboud, D., & Mermilliod, J.-C. 1998, A&A, 333, 897Rebull, L. M., Hillenbrand, L. A., Strom, S. E., et al. 2000, AJ, 119, 3026Robin, A. C., Reylé, C., Derriére, S., & Picaud, S. 2003, A&A, 409, 523Salpeter, E. E. 1955, ApJ, 121, 161Sana, H., de Mink, S. E., de Koter, A., et al. 2012, Sci, 337, 444Serkowski, K., Mathewson, D. S., & Ford, V. L. 1975, ApJ, 196, 261Sharma, S., Pandey, A. K., Ojha, D. K., et al. 2007, MNRAS, 380, 114Sicilia-Aguilar, A., Hartmann, L. W., Briceño, C., Muzerolle, J., & Calvet, N.
2004, AJ, 128, 805Siess, L., Dufour, E., & Forestini, M. 2000, A&A, 358, 5931Skrutskie, M. F., Cutri, R. M., Stiening, R., et al. 2006, AJ, 131, 1163Sota, A., Apellániz, J. M., Walborn, N. R., et al. 2011, ApJS, 193, 24Sujatha, S., & Babu, G. S. D. 2006, Ap&SS, 305, 399Sung, H., & Bessell, M. S. 2000, PASA, 17, 244Sung, H., & Bessell, M. S. 2004, AJ, 127, 1014Sung, H., & Bessell, M. S. 2010, AJ, 140, 2070Sung, H., & Bessell, M. S. 2014, in ASP Conf. Ser. 482, The 10th Pacific Rim
Conf. Stellar Astrophysics, ed. H.-W. Lee, Y. W. Kang, & K.-C. Leung(San Francisco, CA: ASP), 275
Sung, H., Bessell, M. S., & Chun, M.-Y. 2004, AJ, 128, 1684Sung, H., Bessell, M. S., Chun, M.-Y., Karimov, R., & Ibrahimov, M. 2008,
AJ, 135, 441Sung, H., Bessell, M. S., Lee, H.-W., Kang, Y. H., & Lee, S.-W. 1999,
MNRAS, 310, 982
Figure A3. Additional correction terms in the U band for the intrinsic red stars( - >U B 1.0). Upper: red leak effect found in the Bessell U filter attached tothe Mont4k CCD camera system. The contribution of the red light can beremoved by a linear regression for stars ( - >V I 1.79). Lower: more flux inthe U band is required for late-type stars because our SDSS u′ filter wasdesigned to avoid the Balmer discontinuity toward shorter wavelength. Anadditional correction can be made with a straight line for red stars( - >V I 1.5).
24
The Astronomical Journal, 149:127 (25pp), 2015 April Lim et al.

Sung, H., Bessell, M. S., & Lee, S.-W. 1997, AJ, 114, 2644Sung, H., Bessell, M. S., & Lee, S.-W. 1998, AJ, 115, 734Sung, H., Chun, M.-Y., & Bessell, M. S. 2000, AJ, 120, 333Sung, H., & Lee, S.-W. 1995, JKAS, 28, 119Sung, H., Lim, B., Bessell, M. S., et al. 2013a, JKAS, 46, 103Sung, H., Sana, H., & Bessell, M. S. 2013b, AJ, 145, 37Sung, H., Stauffer, J. R., & Bessell, M. S. 2009, AJ, 138, 1116Susa, H., Hasegawa, K., & Tominaga, N. 2014, ApJ, 792, 32
Tutukov, A. V. 1978, A&A, 70, 57Uchida, Y., & Shibata, K. 1985, PASJ, 37, 515Wade, G. A., Apellániz, J. M., Martins, F., et al. 2012, MNRAS, 425, 1278Walborn, N. R., Sota, A., Maíz Apellániz, J., et al. 2010, ApJL, 711, L143Whitney, B., Arendt, R., Babler, B., et al. 2008, Spitzer Proposal ID#60020Whitney, B., Benjamin, R., Meade, M., et al. 2011, BAAS, 43, 241.16Whittet, D. C. B. 1977, MNRAS, 180, 29Yong, D., Carney, B. W., & Friel, E. D. 2012, AJ, 144, 95
25
The Astronomical Journal, 149:127 (25pp), 2015 April Lim et al.