Embed Size (px)
Citation preview
Neuropsychologia 81 (2016) 94–106
Contents lists available at ScienceDirect
Neuropsychologia
http://d0028-39
n CorrPA 1521
E-m
journal homepage: www.elsevier.com/locate/neuropsychologia
The sequential structure of brain activation predicts skill
John R. Anderson a,n, Daniel Bothell a, Jon M. Fincham a, Jungaa Moon a
a Department of Psychology, Carnegie Mellon University, Pittsburgh, PA 15213, United States
a r t i c l e i n f o
Article history:Received 23 September 2015Received in revised form15 December 2015Accepted 16 December 2015Available online 18 December 2015
Keywords:Computational ModelingfMRIExpertizeLearning
x.doi.org/10.1016/j.neuropsychologia.2015.12.032/& 2015 Elsevier Ltd. All rights reserved.
espondence to: Department of Psychology�3, United States.ail address: [email protected] (J.R. Anderson).
a b s t r a c t
In an fMRI study, participants were trained to play a complex video game. They were scanned early andthen again after substantial practice. While better players showed greater activation in one region (rightdorsal striatum) their relative skill was better diagnosed by considering the sequential structure of wholebrain activation. Using a cognitive model that played this game, we extracted a characterization of themental states that are involved in playing a game and the statistical structure of the transitions amongthese states. There was a strong correspondence between this measure of sequential structure and theskill of different players. Using multi-voxel pattern analysis, it was possible to recognize, with relativelyhigh accuracy, the cognitive states participants were in during particular scans. We used the sequentialstructure of these activation-recognized states to predict the skill of individual players. These findingsindicate that important features about information-processing strategies can be identified from a model-based analysis of the sequential structure of brain activation.
& 2015 Elsevier Ltd. All rights reserved.
1. Introduction
This paper is concerned with identifying the patterns of brainactivation that are associated with skilled performance in a com-plex task. Many studies have investigated perceptual expertize inrecognizing visual patterns (e.g., Bilalić et al., 2011, Scherf et al.,2011; Tarr and Gauthier, 2000). The typical result is greater acti-vation in visual areas like the fusiform for objects in the domain ofthe expertize. There is also increased distinctiveness in the acti-vation patterns in these regions (Haxby et al., 2000, Nestor et al.,2011). However, increased activation is not always a sign of in-creased skill. Looking at other domains such as problem solving orvisual-motor tasks, researchers have found that higher skill wascharacterized by decreased activation, which is taken as a sign ofimproved processing efficiency (Anderson, 2005; Gobel et al.,2011; Poldrack et al., 1998). Chein et al. (2005, 2012) emphasizethe drop out of different brain regions as a skill develops.
While activation in specific regions may reflect expertize insome tasks and patterns of activation across regions may reflectexpertize in other tasks, such static perspectives ignore the im-portance of the sequential structure of many tasks. Behavioralstudies have shown that experts often approach a task with a verydifferent sequence of mental steps than someone less expert(Anderson et al., 1984; Larkin, 1981). This paper will describe such
14
Baker Hall 345D, Pittsburgh,
a task where expertize is reflected dynamically in how wholebrain activity changes over an episode of doing the task. That is,expertize is reflected by patterns in the spatial-temporal structureof brain activation. We will describe how these patterns can bemeasured by combining of multi-voxel pattern analysis (MVPA –
e.g., Norman et al., 2006; Pereira et al., 2009) and hidden Markovmodels (HMMs, e.g., Rabiner, 1989) to recognize patterns definedin reference to a cognitive model of how the task should be per-formed. While the current task is a video game whose sequentialstructure is relatively easy to identify, the general approach isapplicable to a wide range of tasks.
1.1. The Space Fortress game
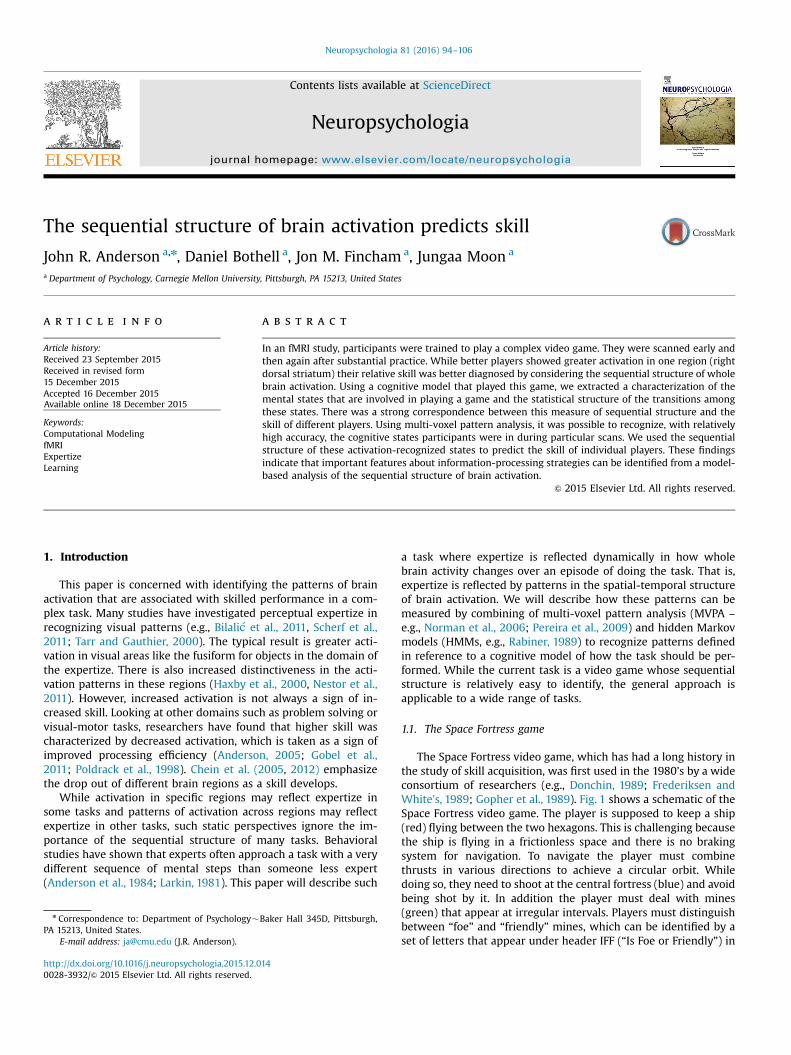
The Space Fortress video game, which has had a long history inthe study of skill acquisition, was first used in the 1980's by a wideconsortium of researchers (e.g., Donchin, 1989; Frederiksen andWhite's, 1989; Gopher et al., 1989). Fig. 1 shows a schematic of theSpace Fortress video game. The player is supposed to keep a ship(red) flying between the two hexagons. This is challenging becausethe ship is flying in a frictionless space and there is no brakingsystem for navigation. To navigate the player must combinethrusts in various directions to achieve a circular orbit. Whiledoing so, they need to shoot at the central fortress (blue) and avoidbeing shot by it. In addition the player must deal with mines(green) that appear at irregular intervals. Players must distinguishbetween “foe” and “friendly” mines, which can be identified by aset of letters that appear under header IFF (“Is Foe or Friendly”) in
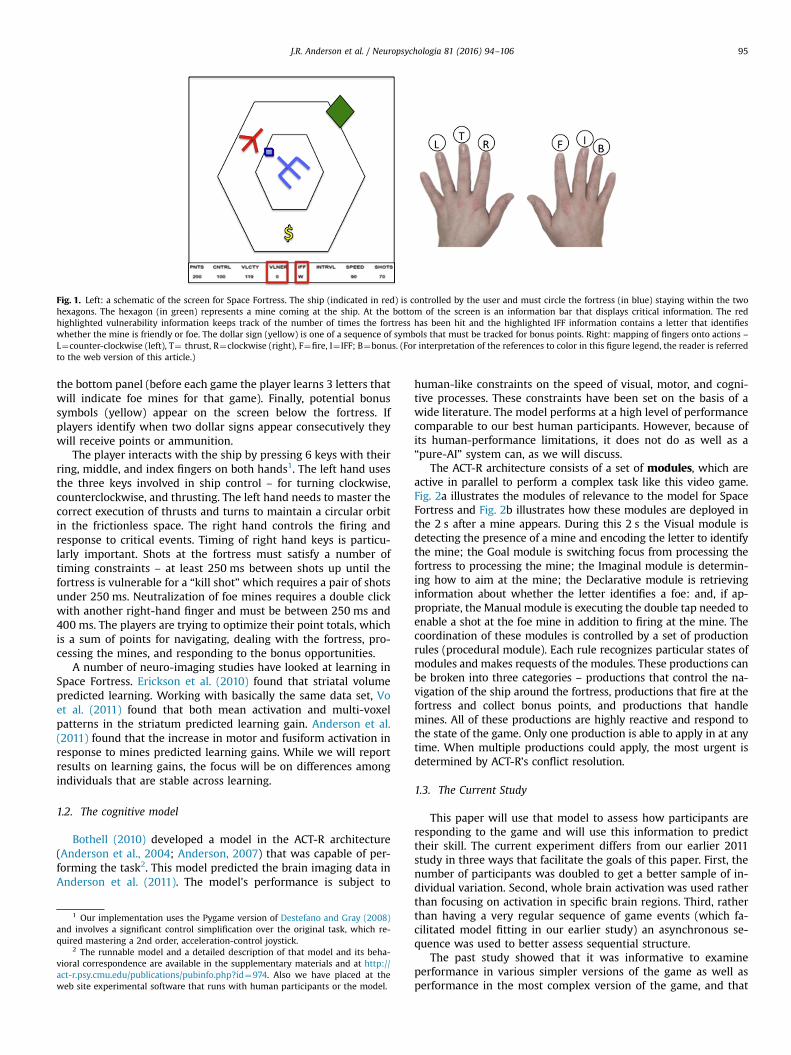
Fig. 1. Left: a schematic of the screen for Space Fortress. The ship (indicated in red) is controlled by the user and must circle the fortress (in blue) staying within the twohexagons. The hexagon (in green) represents a mine coming at the ship. At the bottom of the screen is an information bar that displays critical information. The redhighlighted vulnerability information keeps track of the number of times the fortress has been hit and the highlighted IFF information contains a letter that identifieswhether the mine is friendly or foe. The dollar sign (yellow) is one of a sequence of symbols that must be tracked for bonus points. Right: mapping of fingers onto actions –L¼counter-clockwise (left), T¼ thrust, R¼clockwise (right), F¼fire, I¼ IFF; B¼bonus. (For interpretation of the references to color in this figure legend, the reader is referredto the web version of this article.)
J.R. Anderson et al. / Neuropsychologia 81 (2016) 94–106 95
the bottom panel (before each game the player learns 3 letters thatwill indicate foe mines for that game). Finally, potential bonussymbols (yellow) appear on the screen below the fortress. Ifplayers identify when two dollar signs appear consecutively theywill receive points or ammunition.
The player interacts with the ship by pressing 6 keys with theirring, middle, and index fingers on both hands1. The left hand usesthe three keys involved in ship control – for turning clockwise,counterclockwise, and thrusting. The left hand needs to master thecorrect execution of thrusts and turns to maintain a circular orbitin the frictionless space. The right hand controls the firing andresponse to critical events. Timing of right hand keys is particu-larly important. Shots at the fortress must satisfy a number oftiming constraints – at least 250 ms between shots up until thefortress is vulnerable for a “kill shot” which requires a pair of shotsunder 250 ms. Neutralization of foe mines requires a double clickwith another right-hand finger and must be between 250 ms and400 ms. The players are trying to optimize their point totals, whichis a sum of points for navigating, dealing with the fortress, pro-cessing the mines, and responding to the bonus opportunities.
A number of neuro-imaging studies have looked at learning inSpace Fortress. Erickson et al. (2010) found that striatal volumepredicted learning. Working with basically the same data set, Voet al. (2011) found that both mean activation and multi-voxelpatterns in the striatum predicted learning gain. Anderson et al.(2011) found that the increase in motor and fusiform activation inresponse to mines predicted learning gains. While we will reportresults on learning gains, the focus will be on differences amongindividuals that are stable across learning.
1.2. The cognitive model
Bothell (2010) developed a model in the ACT-R architecture(Anderson et al., 2004; Anderson, 2007) that was capable of per-forming the task2. This model predicted the brain imaging data inAnderson et al. (2011). The model's performance is subject to
1 Our implementation uses the Pygame version of Destefano and Gray (2008)and involves a significant control simplification over the original task, which re-quired mastering a 2nd order, acceleration-control joystick.
2 The runnable model and a detailed description of that model and its beha-vioral correspondence are available in the supplementary materials and at http://act-r.psy.cmu.edu/publications/pubinfo.php?id¼974. Also we have placed at theweb site experimental software that runs with human participants or the model.
human-like constraints on the speed of visual, motor, and cogni-tive processes. These constraints have been set on the basis of awide literature. The model performs at a high level of performancecomparable to our best human participants. However, because ofits human-performance limitations, it does not do as well as a“pure-AI” system can, as we will discuss.
The ACT-R architecture consists of a set of modules, which areactive in parallel to perform a complex task like this video game.Fig. 2a illustrates the modules of relevance to the model for SpaceFortress and Fig. 2b illustrates how these modules are deployed inthe 2 s after a mine appears. During this 2 s the Visual module isdetecting the presence of a mine and encoding the letter to identifythe mine; the Goal module is switching focus from processing thefortress to processing the mine; the Imaginal module is determin-ing how to aim at the mine; the Declarative module is retrievinginformation about whether the letter identifies a foe: and, if ap-propriate, the Manual module is executing the double tap needed toenable a shot at the foe mine in addition to firing at the mine. Thecoordination of these modules is controlled by a set of productionrules (procedural module). Each rule recognizes particular states ofmodules and makes requests of the modules. These productions canbe broken into three categories – productions that control the na-vigation of the ship around the fortress, productions that fire at thefortress and collect bonus points, and productions that handlemines. All of these productions are highly reactive and respond tothe state of the game. Only one production is able to apply in at anytime. When multiple productions could apply, the most urgent isdetermined by ACT-R’s conflict resolution.
1.3. The Current Study
This paper will use that model to assess how participants areresponding to the game and will use this information to predicttheir skill. The current experiment differs from our earlier 2011study in three ways that facilitate the goals of this paper. First, thenumber of participants was doubled to get a better sample of in-dividual variation. Second, whole brain activation was used ratherthan focusing on activation in specific brain regions. Third, ratherthan having a very regular sequence of game events (which fa-cilitated model fitting in our earlier study) an asynchronous se-quence was used to better assess sequential structure.
The past study showed that it was informative to examineperformance in various simpler versions of the game as well asperformance in the most complex version of the game, and that
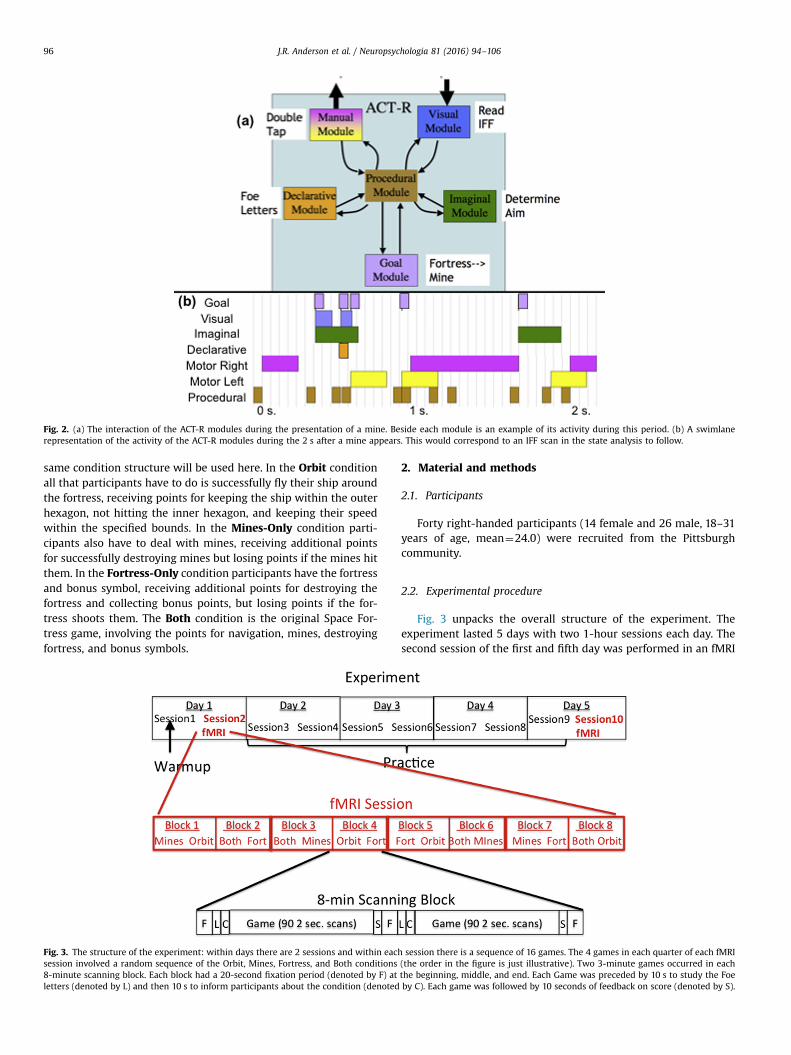
Fig. 2. (a) The interaction of the ACT-R modules during the presentation of a mine. Beside each module is an example of its activity during this period. (b) A swimlanerepresentation of the activity of the ACT-R modules during the 2 s after a mine appears. This would correspond to an IFF scan in the state analysis to follow.
J.R. Anderson et al. / Neuropsychologia 81 (2016) 94–10696
same condition structure will be used here. In the Orbit conditionall that participants have to do is successfully fly their ship aroundthe fortress, receiving points for keeping the ship within the outerhexagon, not hitting the inner hexagon, and keeping their speedwithin the specified bounds. In the Mines-Only condition parti-cipants also have to deal with mines, receiving additional pointsfor successfully destroying mines but losing points if the mines hitthem. In the Fortress-Only condition participants have the fortressand bonus symbol, receiving additional points for destroying thefortress and collecting bonus points, but losing points if the for-tress shoots them. The Both condition is the original Space For-tress game, involving the points for navigation, mines, destroyingfortress, and bonus symbols.
Fig. 3. The structure of the experiment: within days there are 2 sessions and within eachsession involved a random sequence of the Orbit, Mines, Fortress, and Both conditions8-minute scanning block. Each block had a 20-second fixation period (denoted by F) atletters (denoted by L) and then 10 s to inform participants about the condition (denoted
2. Material and methods
2.1. Participants
Forty right-handed participants (14 female and 26 male, 18–31years of age, mean¼24.0) were recruited from the Pittsburghcommunity.
2.2. Experimental procedure
Fig. 3 unpacks the overall structure of the experiment. Theexperiment lasted 5 days with two 1-hour sessions each day. Thesecond session of the first and fifth day was performed in an fMRI
session there is a sequence of 16 games. The 4 games in each quarter of each fMRI(the order in the figure is just illustrative). Two 3-minute games occurred in eachthe beginning, middle, and end. Each Game was preceded by 10 s to study the Foeby C). Each game was followed by 10 seconds of feedback on score (denoted by S).
3 The definition of a “excess of extreme values” is more than .5% of the scanswith values more than 10% from baseline.
4 To review the considerations that drove this choice, the problem is that someparticipants will change their breathing patterns when the game playing getschallenging and this has identifiable effects on the BOLD response. We did try anumber of alternative regions but found that using a grey-matter are, that did notrespond to task structure, like the auditory region, provided the best correlate.
J.R. Anderson et al. / Neuropsychologia 81 (2016) 94–106 97
magnet.The Space Fortress game was the same as in Anderson et al.
(2011) with one difference that allowed us to better assess se-quential structure: rather than mines appearing regularly onceevery 20 s they appeared at random intervals uniformly sampledfrom 4–8 s. In all sessions participants responded with three fin-gers (ring, middle, and index) in two data gloves (see Fig. 1 formapping of fingers). In each session they performed 8 two-gamescanning blocks for a total of 16 games per session. Each gamebegan with 20 s of fixation, then 10 s to memorize the 3 lettersthat would be used to identify “foe” mines in that game, and then10 s notifying them of the condition (Orbit, Mines-Only, Fortress-Only, or Both) of the upcoming game. The game lasted for 3 minand was followed by 10 s in which participants could study theirscore. A final 14-second fixation period followed the feedback forthe second game in a block.
There were 10 sessions, administered 2 per day. On the first andfifth day, there were 4 games in each of the Orbit, Mines-Only,Fortress-Only, and Both conditions. Each game appeared once inrandom order in each set of four games in a session. The secondsessions of the first and fifth days (Sessions between 2 and 10)were conducted in the scanner. Half of the participants practicedthe Both condition during the intervening 3 days and half alter-nated between the Mines-Only and Fortress-Only conditions dur-ing those days.
2.3. Imaging analysis
Images were acquired using gradient echo–echo planar image(EPI) acquisition on a 3 T Verio Scanner using a 32-channel RFhead coil, with 2 s. repetition time (TR), 30 ms echo time (TE), 79degree flip angle, and 20 cm field of view (FOV). We acquired 34axial slices on each TR using a 3.2 mm thick, 64�64 matrix. Thisproduces voxels that are 3.2 mm high and 3.125 � 3.125 mm2. Theanterior commissure-posterior commissure (AC-PC) line was onthe 11th slice from the bottom scan slice. Acquired images werepre-processed and analyzed using AFNI (Cox, 1996; Cox and Hyde,1997). Functional images were motion-corrected using 6-para-meter 3D registration. All images were then slice-time centered at1 s and co-registered to a common reference structural MRI bymeans of a 12-parameter 3D registration and smoothed with a6 mm full-width-at-half-maximum 3D Gaussian filter to accom-modate individual differences in anatomy.
We calculated the mean maximum movement per block. Roll,pitch and yaw were (in degrees) 0.66, 1.65, and 0.80, respectively.Translations in z, x and y directions were (in mm) 2.06, 0.77 and0.94 respectively. Only yaw showed a significant decrease fromSession 2 to Session 10 (from 90 degrees to 71 degrees; t(35)¼2.24, po0.05) and it was not significantly correlated with score.
In complex tasks like this, which involve many cognitive pro-cesses, the focus is on patterns of activity across the whole braincommon across individuals. As a step of dimension reduction andto accommodate variations in anatomy over participants that maynot be dealt with in co-registration, we aggregated the voxels ineach slice into larger 2�2 voxel regions. The fundamental moti-vation is to predict across individuals and this eliminates ourability to have very precise localization. The process of co-regis-tration in itself already forgoes strong inference on smaller sub-cortical structures, independent of other dimension reductionsthat we may apply. We chose only to aggregate in the 2D planebecause the mismatch between subject brains can be dramatic atthe curvature around inferior frontal brain regions. In this area,moving from one slice to the next in the inferior direction, there isoften an abrupt transition from signal to non-signal (imagine thesaggital view). There are 12,481 such 2�2 regions. However, someof these show an excess of extreme values for some participants,
likely reflecting differences in anatomy3. Most of these outlyingregions were located on the top and bottom slices as well as nearthe perimeter of the brain. Eliminating these resulted in 9,029usable regions for analyses.
To correct for brain-wide activation fluctuations that were nottask related (for instance, due to changes in breathing patternsfound while playing video games, Birn et al., 2008), we regressedout correlated activity involving bilateral regions of the secondaryauditory cortex (two bilateral rectangular volumes defined as5�5�4 voxels in the functional acquisition matrix centered atTalairach coordinates 7 42, �61, �9). These regions correspondto the Aural module in ACT-R and should not be engaged in theSpace Fortress task. We regressed the full 8-minute BOLD responsein each of the 9029 regions against the mean BOLD response inthese reference regions. The corrected activity for a region of in-terest was the residual BOLD response not predicted plus themean BOLD signal in that region for that 8-minute period. An-derson et al. (2011) found that this residual measure did notchange the direction of any of the effects but increased the sig-nificance of many. Performing this step of analysis keeps ourprocessing with the earlier publication4.
The means of the scans 4 through 6 in each fixation periodwere used to establish baselines for each game. The baseline forany scan in the first game of a block was calculated as the lineartrend between the first and second fixation means. The baselinefor the second game was calculated as the linear trend betweenthe second and third means. The BOLD response on any game scanwas calculated as its percent change from its baseline. A Wienerfilter (Glover, 1999) with a noise parameter of .1 was used to de-convolve the BOLD response into an inferred activity signal oneach scan. The hemodynamic function used in this deconvolutionis the SPM difference of gammas (Friston et al., 2011: gamma(6,1)-gamma(16,1)/6). The Appendix reports an exploration of the ef-fects of variations on this deconvolution step on classification andprovides a justification of the hemodynamic function we used.
The output of this process is an estimation of activity in 9029regions during each of the 90 two-second scans in a game. How-ever, because of high correlation among regions this reflectsnothing like 9029 independent pieces of information. For thepurpose of identifying sequential patterns, we performed a spatialprincipal component analysis (PCA) of the voxel activity whereeach voxel was treated as a variable that varies over scans, games,and participants. Separate PCAs were done for Sessions between2 and 10. The first 100 components of these PCAs were used insubsequent analyses. These captured just over 73% of the totalvariance in each session. To focus on the sequential changes acrossthe course of games (rather than differences among games withina condition), the 100 PCA scores for each game were standardizedto have means equal to the mean for that condition and variance 1.The predictive analyses will use these normalized PCA scores overthe 90 2-second scans that define a game.
3. Results
3.1. Preliminary analyses
Our focus will be on relating participants’ average scores to
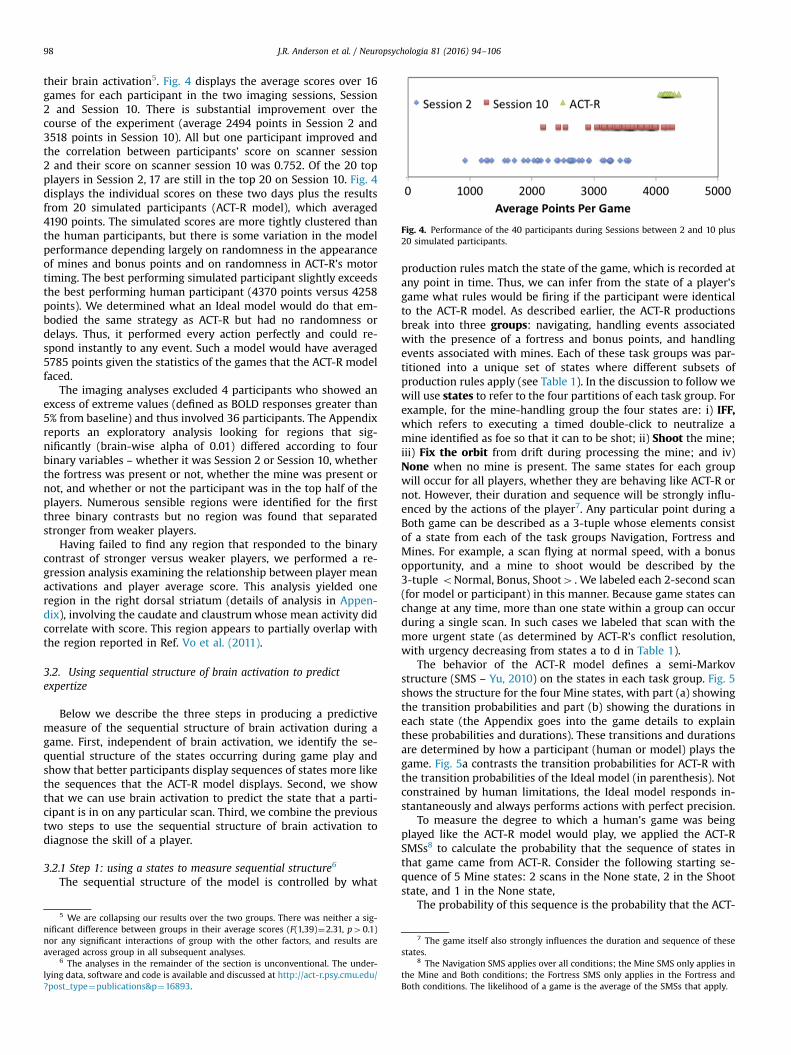
Fig. 4. Performance of the 40 participants during Sessions between 2 and 10 plus20 simulated participants.
J.R. Anderson et al. / Neuropsychologia 81 (2016) 94–10698
their brain activation5. Fig. 4 displays the average scores over 16games for each participant in the two imaging sessions, Session2 and Session 10. There is substantial improvement over thecourse of the experiment (average 2494 points in Session 2 and3518 points in Session 10). All but one participant improved andthe correlation between participants’ score on scanner session2 and their score on scanner session 10 was 0.752. Of the 20 topplayers in Session 2, 17 are still in the top 20 on Session 10. Fig. 4displays the individual scores on these two days plus the resultsfrom 20 simulated participants (ACT-R model), which averaged4190 points. The simulated scores are more tightly clustered thanthe human participants, but there is some variation in the modelperformance depending largely on randomness in the appearanceof mines and bonus points and on randomness in ACT-R’s motortiming. The best performing simulated participant slightly exceedsthe best performing human participant (4370 points versus 4258points). We determined what an Ideal model would do that em-bodied the same strategy as ACT-R but had no randomness ordelays. Thus, it performed every action perfectly and could re-spond instantly to any event. Such a model would have averaged5785 points given the statistics of the games that the ACT-R modelfaced.
The imaging analyses excluded 4 participants who showed anexcess of extreme values (defined as BOLD responses greater than5% from baseline) and thus involved 36 participants. The Appendixreports an exploratory analysis looking for regions that sig-nificantly (brain-wise alpha of 0.01) differed according to fourbinary variables – whether it was Session 2 or Session 10, whetherthe fortress was present or not, whether the mine was present ornot, and whether or not the participant was in the top half of theplayers. Numerous sensible regions were identified for the firstthree binary contrasts but no region was found that separatedstronger from weaker players.
Having failed to find any region that responded to the binarycontrast of stronger versus weaker players, we performed a re-gression analysis examining the relationship between player meanactivations and player average score. This analysis yielded oneregion in the right dorsal striatum (details of analysis in Appen-dix), involving the caudate and claustrumwhose mean activity didcorrelate with score. This region appears to partially overlap withthe region reported in Ref. Vo et al. (2011).
3.2. Using sequential structure of brain activation to predictexpertize
Below we describe the three steps in producing a predictivemeasure of the sequential structure of brain activation during agame. First, independent of brain activation, we identify the se-quential structure of the states occurring during game play andshow that better participants display sequences of states more likethe sequences that the ACT-R model displays. Second, we showthat we can use brain activation to predict the state that a parti-cipant is in on any particular scan. Third, we combine the previoustwo steps to use the sequential structure of brain activation todiagnose the skill of a player.
3.2.1 Step 1: using a states to measure sequential structure6
The sequential structure of the model is controlled by what
5 We are collapsing our results over the two groups. There was neither a sig-nificant difference between groups in their average scores (F(1,39)¼2.31, p40.1)nor any significant interactions of group with the other factors, and results areaveraged across group in all subsequent analyses.
6 The analyses in the remainder of the section is unconventional. The under-lying data, software and code is available and discussed at http://act-r.psy.cmu.edu/?post_type¼publications&p¼16893.
production rules match the state of the game, which is recorded atany point in time. Thus, we can infer from the state of a player'sgame what rules would be firing if the participant were identicalto the ACT-R model. As described earlier, the ACT-R productionsbreak into three groups: navigating, handling events associatedwith the presence of a fortress and bonus points, and handlingevents associated with mines. Each of these task groups was par-titioned into a unique set of states where different subsets ofproduction rules apply (see Table 1). In the discussion to follow wewill use states to refer to the four partitions of each task group. Forexample, for the mine-handling group the four states are: i) IFF,which refers to executing a timed double-click to neutralize amine identified as foe so that it can to be shot; ii) Shoot the mine;iii) Fix the orbit from drift during processing the mine; and iv)None when no mine is present. The same states for each groupwill occur for all players, whether they are behaving like ACT-R ornot. However, their duration and sequence will be strongly influ-enced by the actions of the player7. Any particular point during aBoth game can be described as a 3-tuple whose elements consistof a state from each of the task groups Navigation, Fortress andMines. For example, a scan flying at normal speed, with a bonusopportunity, and a mine to shoot would be described by the3-tuple oNormal, Bonus, Shoot4 . We labeled each 2-second scan(for model or participant) in this manner. Because game states canchange at any time, more than one state within a group can occurduring a single scan. In such cases we labeled that scan with themore urgent state (as determined by ACT-R’s conflict resolution,with urgency decreasing from states a to d in Table 1).
The behavior of the ACT-R model defines a semi-Markovstructure (SMS – Yu, 2010) on the states in each task group. Fig. 5shows the structure for the four Mine states, with part (a) showingthe transition probabilities and part (b) showing the durations ineach state (the Appendix goes into the game details to explainthese probabilities and durations). These transitions and durationsare determined by how a participant (human or model) plays thegame. Fig. 5a contrasts the transition probabilities for ACT-R withthe transition probabilities of the Ideal model (in parenthesis). Notconstrained by human limitations, the Ideal model responds in-stantaneously and always performs actions with perfect precision.
To measure the degree to which a human's game was beingplayed like the ACT-R model would play, we applied the ACT-RSMSs8 to calculate the probability that the sequence of states inthat game came from ACT-R. Consider the following starting se-quence of 5 Mine states: 2 scans in the None state, 2 in the Shootstate, and 1 in the None state,
The probability of this sequence is the probability that the ACT-
7 The game itself also strongly influences the duration and sequence of thesestates.
8 The Navigation SMS applies over all conditions; the Mine SMS only applies inthe Mine and Both conditions; the Fortress SMS only applies in the Fortress andBoth conditions. The likelihood of a game is the average of the SMSs that apply.
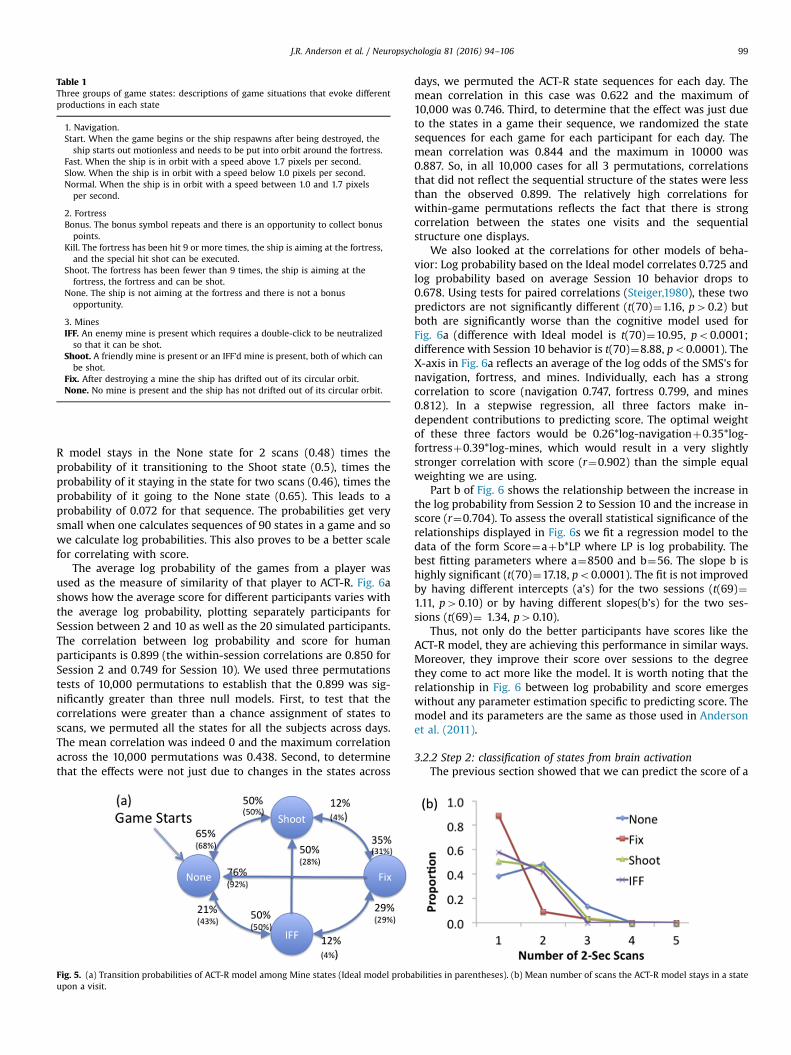
Table 1Three groups of game states: descriptions of game situations that evoke differentproductions in each state
1. Navigation.Start. When the game begins or the ship respawns after being destroyed, theship starts out motionless and needs to be put into orbit around the fortress.
Fast. When the ship is in orbit with a speed above 1.7 pixels per second.Slow. When the ship is in orbit with a speed below 1.0 pixels per second.Normal. When the ship is in orbit with a speed between 1.0 and 1.7 pixelsper second.
2. FortressBonus. The bonus symbol repeats and there is an opportunity to collect bonuspoints.
Kill. The fortress has been hit 9 or more times, the ship is aiming at the fortress,and the special hit shot can be executed.
Shoot. The fortress has been fewer than 9 times, the ship is aiming at thefortress, the fortress and can be shot.
None. The ship is not aiming at the fortress and there is not a bonusopportunity.
3. MinesIFF. An enemy mine is present which requires a double-click to be neutralizedso that it can be shot.
Shoot. A friendly mine is present or an IFF'd mine is present, both of which canbe shot.
Fix. After destroying a mine the ship has drifted out of its circular orbit.None. No mine is present and the ship has not drifted out of its circular orbit.
J.R. Anderson et al. / Neuropsychologia 81 (2016) 94–106 99
R model stays in the None state for 2 scans (0.48) times theprobability of it transitioning to the Shoot state (0.5), times theprobability of it staying in the state for two scans (0.46), times theprobability of it going to the None state (0.65). This leads to aprobability of 0.072 for that sequence. The probabilities get verysmall when one calculates sequences of 90 states in a game and sowe calculate log probabilities. This also proves to be a better scalefor correlating with score.
The average log probability of the games from a player wasused as the measure of similarity of that player to ACT-R. Fig. 6ashows how the average score for different participants varies withthe average log probability, plotting separately participants forSession between 2 and 10 as well as the 20 simulated participants.The correlation between log probability and score for humanparticipants is 0.899 (the within-session correlations are 0.850 forSession 2 and 0.749 for Session 10). We used three permutationstests of 10,000 permutations to establish that the 0.899 was sig-nificantly greater than three null models. First, to test that thecorrelations were greater than a chance assignment of states toscans, we permuted all the states for all the subjects across days.The mean correlation was indeed 0 and the maximum correlationacross the 10,000 permutations was 0.438. Second, to determinethat the effects were not just due to changes in the states across
Fig. 5. (a) Transition probabilities of ACT-R model among Mine states (Ideal model probaupon a visit.
days, we permuted the ACT-R state sequences for each day. Themean correlation in this case was 0.622 and the maximum of10,000 was 0.746. Third, to determine that the effect was just dueto the states in a game their sequence, we randomized the statesequences for each game for each participant for each day. Themean correlation was 0.844 and the maximum in 10000 was0.887. So, in all 10,000 cases for all 3 permutations, correlationsthat did not reflect the sequential structure of the states were lessthan the observed 0.899. The relatively high correlations forwithin-game permutations reflects the fact that there is strongcorrelation between the states one visits and the sequentialstructure one displays.
We also looked at the correlations for other models of beha-vior: Log probability based on the Ideal model correlates 0.725 andlog probability based on average Session 10 behavior drops to0.678. Using tests for paired correlations (Steiger,1980), these twopredictors are not significantly different (t(70)¼1.16, p40.2) butboth are significantly worse than the cognitive model used forFig. 6a (difference with Ideal model is t(70)¼10.95, po0.0001;difference with Session 10 behavior is t(70)¼8.88, po0.0001). TheX-axis in Fig. 6a reflects an average of the log odds of the SMS's fornavigation, fortress, and mines. Individually, each has a strongcorrelation to score (navigation 0.747, fortress 0.799, and mines0.812). In a stepwise regression, all three factors make in-dependent contributions to predicting score. The optimal weightof these three factors would be 0.26*log-navigationþ0.35*log-fortressþ0.39*log-mines, which would result in a very slightlystronger correlation with score (r¼0.902) than the simple equalweighting we are using.
Part b of Fig. 6 shows the relationship between the increase inthe log probability from Session 2 to Session 10 and the increase inscore (r¼0.704). To assess the overall statistical significance of therelationships displayed in Fig. 6s we fit a regression model to thedata of the form Score¼aþb*LP where LP is log probability. Thebest fitting parameters where a¼8500 and b¼56. The slope b ishighly significant (t(70)¼17.18, po0.0001). The fit is not improvedby having different intercepts (a’s) for the two sessions (t(69)¼1.11, p40.10) or by having different slopes(b’s) for the two ses-sions (t(69)¼ 1.34, p40.10).
Thus, not only do the better participants have scores like theACT-R model, they are achieving this performance in similar ways.Moreover, they improve their score over sessions to the degreethey come to act more like the model. It is worth noting that therelationship in Fig. 6 between log probability and score emergeswithout any parameter estimation specific to predicting score. Themodel and its parameters are the same as those used in Andersonet al. (2011).
3.2.2 Step 2: classification of states from brain activationThe previous section showed that we can predict the score of a
bilities in parentheses). (b) Mean number of scans the ACT-R model stays in a state
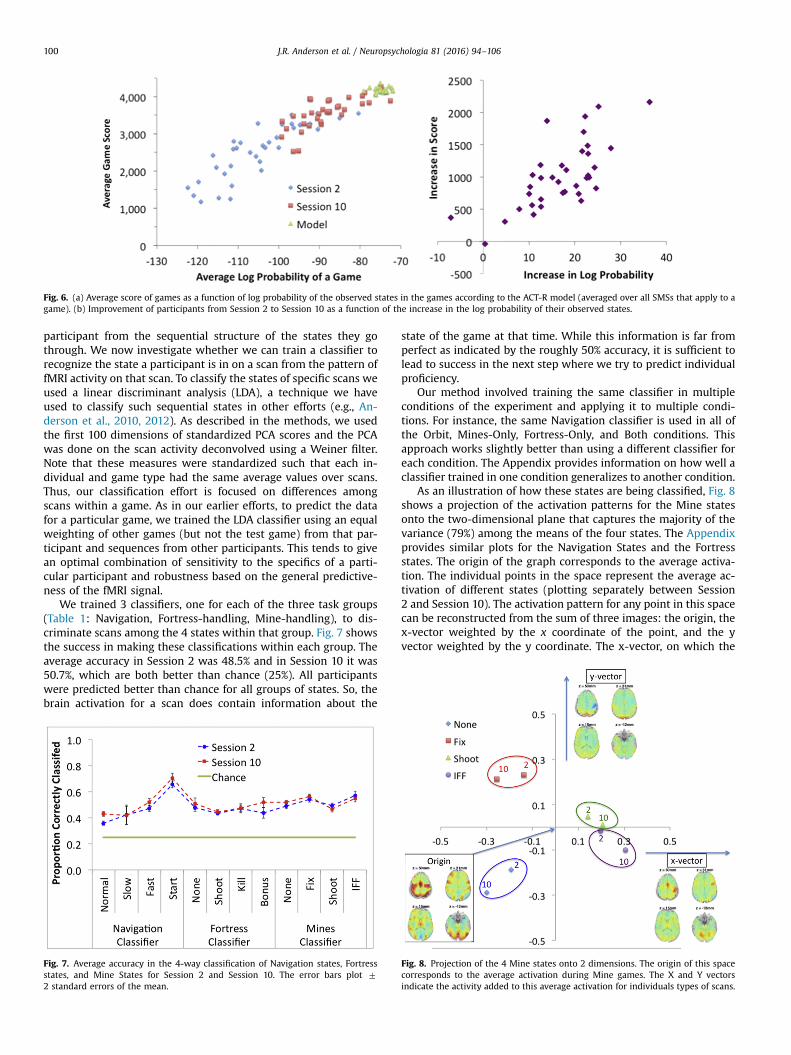
Fig. 6. (a) Average score of games as a function of log probability of the observed states in the games according to the ACT-R model (averaged over all SMSs that apply to agame). (b) Improvement of participants from Session 2 to Session 10 as a function of the increase in the log probability of their observed states.
J.R. Anderson et al. / Neuropsychologia 81 (2016) 94–106100
participant from the sequential structure of the states they gothrough. We now investigate whether we can train a classifier torecognize the state a participant is in on a scan from the pattern offMRI activity on that scan. To classify the states of specific scans weused a linear discriminant analysis (LDA), a technique we haveused to classify such sequential states in other efforts (e.g., An-derson et al., 2010, 2012). As described in the methods, we usedthe first 100 dimensions of standardized PCA scores and the PCAwas done on the scan activity deconvolved using a Weiner filter.Note that these measures were standardized such that each in-dividual and game type had the same average values over scans.Thus, our classification effort is focused on differences amongscans within a game. As in our earlier efforts, to predict the datafor a particular game, we trained the LDA classifier using an equalweighting of other games (but not the test game) from that par-ticipant and sequences from other participants. This tends to givean optimal combination of sensitivity to the specifics of a parti-cular participant and robustness based on the general predictive-ness of the fMRI signal.
We trained 3 classifiers, one for each of the three task groups(Table 1: Navigation, Fortress-handling, Mine-handling), to dis-criminate scans among the 4 states within that group. Fig. 7 showsthe success in making these classifications within each group. Theaverage accuracy in Session 2 was 48.5% and in Session 10 it was50.7%, which are both better than chance (25%). All participantswere predicted better than chance for all groups of states. So, thebrain activation for a scan does contain information about the
Fig. 7. Average accuracy in the 4-way classification of Navigation states, Fortressstates, and Mine States for Session 2 and Session 10. The error bars plot 72 standard errors of the mean.
state of the game at that time. While this information is far fromperfect as indicated by the roughly 50% accuracy, it is sufficient tolead to success in the next step where we try to predict individualproficiency.
Our method involved training the same classifier in multipleconditions of the experiment and applying it to multiple condi-tions. For instance, the same Navigation classifier is used in all ofthe Orbit, Mines-Only, Fortress-Only, and Both conditions. Thisapproach works slightly better than using a different classifier foreach condition. The Appendix provides information on how well aclassifier trained in one condition generalizes to another condition.
As an illustration of how these states are being classified, Fig. 8shows a projection of the activation patterns for the Mine statesonto the two-dimensional plane that captures the majority of thevariance (79%) among the means of the four states. The Appendixprovides similar plots for the Navigation States and the Fortressstates. The origin of the graph corresponds to the average activa-tion. The individual points in the space represent the average ac-tivation of different states (plotting separately between Session2 and Session 10). The activation pattern for any point in this spacecan be reconstructed from the sum of three images: the origin, thex-vector weighted by the x coordinate of the point, and the yvector weighted by the y coordinate. The x-vector, on which the
Fig. 8. Projection of the 4 Mine states onto 2 dimensions. The origin of this spacecorresponds to the average activation during Mine games. The X and Y vectorsindicate the activity added to this average activation for individuals types of scans.
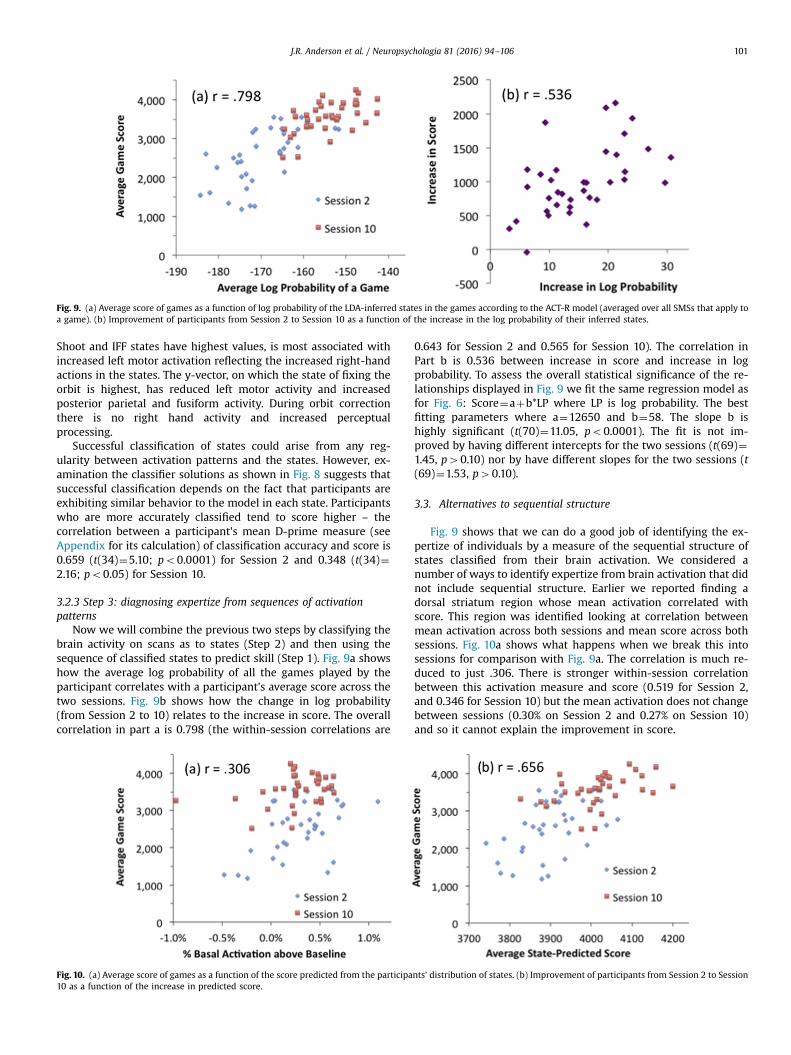
Fig. 9. (a) Average score of games as a function of log probability of the LDA-inferred states in the games according to the ACT-R model (averaged over all SMSs that apply toa game). (b) Improvement of participants from Session 2 to Session 10 as a function of the increase in the log probability of their inferred states.
J.R. Anderson et al. / Neuropsychologia 81 (2016) 94–106 101
Shoot and IFF states have highest values, is most associated withincreased left motor activation reflecting the increased right-handactions in the states. The y-vector, on which the state of fixing theorbit is highest, has reduced left motor activity and increasedposterior parietal and fusiform activity. During orbit correctionthere is no right hand activity and increased perceptualprocessing.
Successful classification of states could arise from any reg-ularity between activation patterns and the states. However, ex-amination the classifier solutions as shown in Fig. 8 suggests thatsuccessful classification depends on the fact that participants areexhibiting similar behavior to the model in each state. Participantswho are more accurately classified tend to score higher – thecorrelation between a participant's mean D-prime measure (seeAppendix for its calculation) of classification accuracy and score is0.659 (t(34)¼5.10; po0.0001) for Session 2 and 0.348 (t(34)¼2.16; po0.05) for Session 10.
3.2.3 Step 3: diagnosing expertize from sequences of activationpatterns
Now we will combine the previous two steps by classifying thebrain activity on scans as to states (Step 2) and then using thesequence of classified states to predict skill (Step 1). Fig. 9a showshow the average log probability of all the games played by theparticipant correlates with a participant's average score across thetwo sessions. Fig. 9b shows how the change in log probability(from Session 2 to 10) relates to the increase in score. The overallcorrelation in part a is 0.798 (the within-session correlations are
Fig. 10. (a) Average score of games as a function of the score predicted from the participa10 as a function of the increase in predicted score.
0.643 for Session 2 and 0.565 for Session 10). The correlation inPart b is 0.536 between increase in score and increase in logprobability. To assess the overall statistical significance of the re-lationships displayed in Fig. 9 we fit the same regression model asfor Fig. 6: Score¼aþb*LP where LP is log probability. The bestfitting parameters where a¼12650 and b¼58. The slope b ishighly significant (t(70)¼11.05, po0.0001). The fit is not im-proved by having different intercepts for the two sessions (t(69)¼1.45, p40.10) nor by have different slopes for the two sessions (t(69)¼1.53, p40.10).
3.3. Alternatives to sequential structure
Fig. 9 shows that we can do a good job of identifying the ex-pertize of individuals by a measure of the sequential structure ofstates classified from their brain activation. We considered anumber of ways to identify expertize from brain activation that didnot include sequential structure. Earlier we reported finding adorsal striatum region whose mean activation correlated withscore. This region was identified looking at correlation betweenmean activation across both sessions and mean score across bothsessions. Fig. 10a shows what happens when we break this intosessions for comparison with Fig. 9a. The correlation is much re-duced to just .306. There is stronger within-session correlationbetween this activation measure and score (0.519 for Session 2,and 0.346 for Session 10) but the mean activation does not changebetween sessions (0.30% on Session 2 and 0.27% on Session 10)and so it cannot explain the improvement in score.
nts’ distribution of states. (b) Improvement of participants from Session 2 to Session
9 Also the earlier studies used a joystick and its additional motor demands may
J.R. Anderson et al. / Neuropsychologia 81 (2016) 94–106102
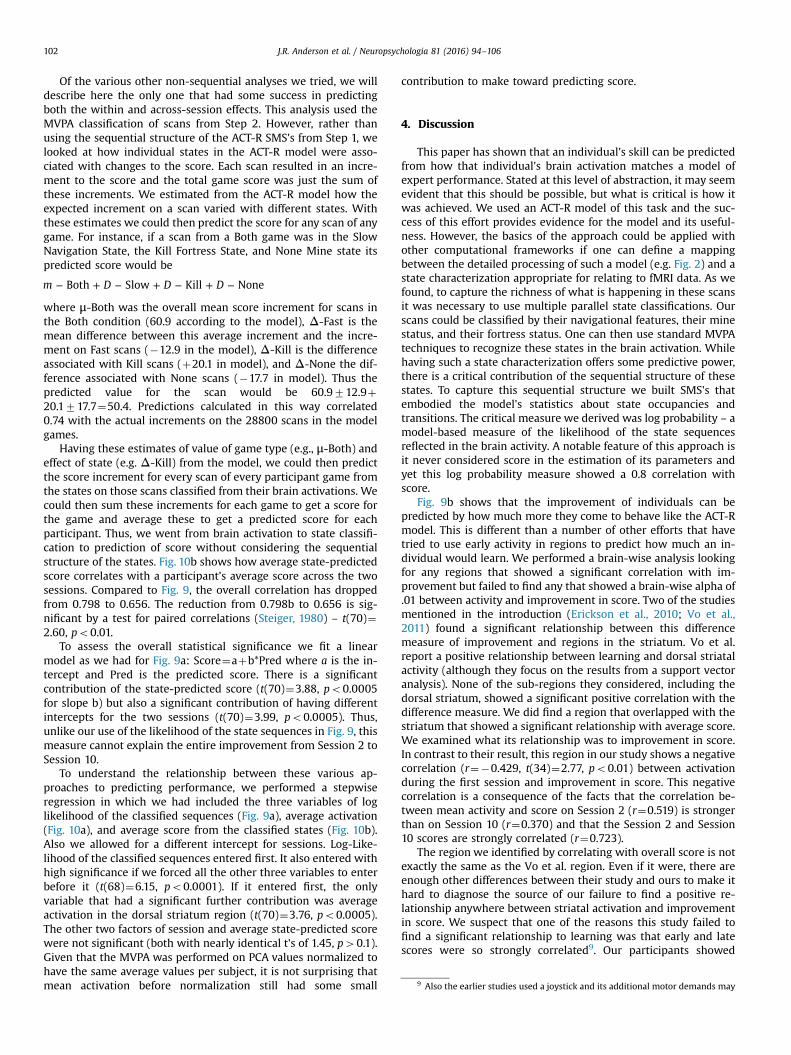
Of the various other non-sequential analyses we tried, we willdescribe here the only one that had some success in predictingboth the within and across-session effects. This analysis used theMVPA classification of scans from Step 2. However, rather thanusing the sequential structure of the ACT-R SMS's from Step 1, welooked at how individual states in the ACT-R model were asso-ciated with changes to the score. Each scan resulted in an incre-ment to the score and the total game score was just the sum ofthese increments. We estimated from the ACT-R model how theexpected increment on a scan varied with different states. Withthese estimates we could then predict the score for any scan of anygame. For instance, if a scan from a Both game was in the SlowNavigation State, the Kill Fortress State, and None Mine state itspredicted score would be
− + − + − + −m D D DBoth Slow Kill None
where μ-Both was the overall mean score increment for scans inthe Both condition (60.9 according to the model), Δ-Fast is themean difference between this average increment and the incre-ment on Fast scans (�12.9 in the model), Δ-Kill is the differenceassociated with Kill scans (þ20.1 in model), and Δ-None the dif-ference associated with None scans (�17.7 in model). Thus thepredicted value for the scan would be 60.9712.9þ20.1717.7¼50.4. Predictions calculated in this way correlated0.74 with the actual increments on the 28800 scans in the modelgames.
Having these estimates of value of game type (e.g., μ-Both) andeffect of state (e.g. Δ-Kill) from the model, we could then predictthe score increment for every scan of every participant game fromthe states on those scans classified from their brain activations. Wecould then sum these increments for each game to get a score forthe game and average these to get a predicted score for eachparticipant. Thus, we went from brain activation to state classifi-cation to prediction of score without considering the sequentialstructure of the states. Fig. 10b shows how average state-predictedscore correlates with a participant’s average score across the twosessions. Compared to Fig. 9, the overall correlation has droppedfrom 0.798 to 0.656. The reduction from 0.798b to 0.656 is sig-nificant by a test for paired correlations (Steiger, 1980) – t(70)¼2.60, po0.01.
To assess the overall statistical significance we fit a linearmodel as we had for Fig. 9a: Score¼aþb*Pred where a is the in-tercept and Pred is the predicted score. There is a significantcontribution of the state-predicted score (t(70)¼3.88, po0.0005for slope b) but also a significant contribution of having differentintercepts for the two sessions (t(70)¼3.99, po0.0005). Thus,unlike our use of the likelihood of the state sequences in Fig. 9, thismeasure cannot explain the entire improvement from Session 2 toSession 10.
To understand the relationship between these various ap-proaches to predicting performance, we performed a stepwiseregression in which we had included the three variables of loglikelihood of the classified sequences (Fig. 9a), average activation(Fig. 10a), and average score from the classified states (Fig. 10b).Also we allowed for a different intercept for sessions. Log-Like-lihood of the classified sequences entered first. It also entered withhigh significance if we forced all the other three variables to enterbefore it (t(68)¼6.15, po0.0001). If it entered first, the onlyvariable that had a significant further contribution was averageactivation in the dorsal striatum region (t(70)¼3.76, po0.0005).The other two factors of session and average state-predicted scorewere not significant (both with nearly identical t's of 1.45, p40.1).Given that the MVPA was performed on PCA values normalized tohave the same average values per subject, it is not surprising thatmean activation before normalization still had some small
contribution to make toward predicting score.
4. Discussion
This paper has shown that an individual's skill can be predictedfrom how that individual's brain activation matches a model ofexpert performance. Stated at this level of abstraction, it may seemevident that this should be possible, but what is critical is how itwas achieved. We used an ACT-R model of this task and the suc-cess of this effort provides evidence for the model and its useful-ness. However, the basics of the approach could be applied withother computational frameworks if one can define a mappingbetween the detailed processing of such a model (e.g. Fig. 2) and astate characterization appropriate for relating to fMRI data. As wefound, to capture the richness of what is happening in these scansit was necessary to use multiple parallel state classifications. Ourscans could be classified by their navigational features, their minestatus, and their fortress status. One can then use standard MVPAtechniques to recognize these states in the brain activation. Whilehaving such a state characterization offers some predictive power,there is a critical contribution of the sequential structure of thesestates. To capture this sequential structure we built SMS's thatembodied the model's statistics about state occupancies andtransitions. The critical measure we derived was log probability – amodel-based measure of the likelihood of the state sequencesreflected in the brain activity. A notable feature of this approach isit never considered score in the estimation of its parameters andyet this log probability measure showed a 0.8 correlation withscore.
Fig. 9b shows that the improvement of individuals can bepredicted by how much more they come to behave like the ACT-Rmodel. This is different than a number of other efforts that havetried to use early activity in regions to predict how much an in-dividual would learn. We performed a brain-wise analysis lookingfor any regions that showed a significant correlation with im-provement but failed to find any that showed a brain-wise alpha of.01 between activity and improvement in score. Two of the studiesmentioned in the introduction (Erickson et al., 2010; Vo et al.,2011) found a significant relationship between this differencemeasure of improvement and regions in the striatum. Vo et al.report a positive relationship between learning and dorsal striatalactivity (although they focus on the results from a support vectoranalysis). None of the sub-regions they considered, including thedorsal striatum, showed a significant positive correlation with thedifference measure. We did find a region that overlapped with thestriatum that showed a significant relationship with average score.We examined what its relationship was to improvement in score.In contrast to their result, this region in our study shows a negativecorrelation (r¼�0.429, t(34)¼2.77, po0.01) between activationduring the first session and improvement in score. This negativecorrelation is a consequence of the facts that the correlation be-tween mean activity and score on Session 2 (r¼0.519) is strongerthan on Session 10 (r¼0.370) and that the Session 2 and Session10 scores are strongly correlated (r¼0.723).
The region we identified by correlating with overall score is notexactly the same as the Vo et al. region. Even if it were, there areenough other differences between their study and ours to make ithard to diagnose the source of our failure to find a positive re-lationship anywhere between striatal activation and improvementin score. We suspect that one of the reasons this study failed tofind a significant relationship to learning was that early and latescores were so strongly correlated9. Our participants showed
J.R. Anderson et al. / Neuropsychologia 81 (2016) 94–106 103
dramatic improvements over the course of the experiment, but thebest performers tended to stay the best performers. Their perfor-mance was largely a function of the strategy they adopted early inplaying the game and the effect of practice was largely to honethat strategy.
5. Conclusions
This research has indicated that one can predict individualdifferences in performance by classifying scans of brain activityinto discrete states and then examining the sequential structure ofthese states. The Space Fortress game allows a direct approach tothe classification step because we can map external states of thegame directly onto model states. This then provides an objectivebasis for training a classifier to recognize the states. This is possiblein Space Fortress because the internal state of the ACT-R model(and probably any successful cognitive model of the task) is highlyreactive to the external state of the game. Such a direct mappingbetween external states and relevant mental states is true formany human activities (such a driving) but hardly all. In morereflective situations like mathematical problem solving people gothrough critical mental states that are not indicated by changes inthe external world or in their overt behavior.
We have also modeled such reflective tasks with hidden Mar-kov models (HMMs – because the states are now hidden) wherewe infer people's mental states by changes in brain activation andconnect these HMM models to ACT-R cognitive models (e.g. An-derson and Fincham, 2014). These efforts differ from the currenteffort in that there is not an external definition of the mental state.Rather, we induce a mapping from brain activation to model statesthat maximizes the regularity in the imaging data. We went backto the data in Anderson & Fincham, classified the scans into statesgiven the induced mapping, and then looked at the log prob-abilities of these scans according to the model described in thatpaper. We did find a positive correlation (r¼0.644 for 75 partici-pants) between this measure and percent of the problems parti-cipants got correct. Thus, it may be possible more generally to usethe sequential structure of brain activation to predict success in atask.
Acknowledgments
This work was supported ONR grant N000140910098, and aJames S. McDonnell Scholar Award. We would like to thank ArynPyke for her comments on the manuscript. Correspondence con-cerning this article should be addressed to John R Anderson, De-partment of Psychology, Carnegie Mellon University, Pittsburgh,PA 15213 (email: [email protected]). The analyses and models in thispaper can be obtained at http://act-r.psy.cmu.edu/?post_type¼publications&p¼16893
Appendix A. Regions showing Effects of Binary Contrasts andCorrelation with Score
We performed a standard GLM of bold activity to determinewhich regions showed effects of four binary variables – whether itwas Session 2 or Session 10, whether the fortress was present ornot, whether the mine was present or not, and whether or not theparticipant was in the top half of the players. The threshold for
(footnote continued)somehow be critical.
significance for the interaction was at least 10 contiguous voxels ata voxel-wise alpha of po0.0001. Spatial smoothness of these datawere computed over the residuals and used as input for simulationto estimate brain-wise alpha to be less than 0.01 (Cox, 1996; Coxand Hyde, 1997).
No region showed a significant difference between better andweaker players. Table A1 lists regions showing significant effects ofthe other binary contrasts. Activation was higher in Session 2 re-lative to Session 10 in superior parietal regions associated withspatial attention and the fusiform areas, suggesting that partici-pants are better managing the visual demands of the task at theend of the experiment. The fortress conditions show increasedactivation in the left motor region controlling the right hand, andin the bilateral fusiform region. This reflects the demand forshooting and monitoring of number of shots. The mine conditionsshow increased activity in the lateral inferior prefrontal cortex andthe posterior parietal cortex, which are regions in the ACT-R modelthat are responsible for handling the memory demands of themines conditions.
We also conducted an analysis of the correlation betweenaverage score over the two sessions and average voxel activation.Using the same threshold as with the binary contrasts (10 con-tiguous voxels with a significance less than 0.0001) no regionreached significance. However, if we used an alternative thresholdmore appropriate for correlation of p¼0.0025 with 40 contiguousvoxels, which also corresponds to a brain-wise alpha of 0.01, wedid find one right dorsal striatum region that consisted of 52voxels overlapping with the caudate and nearby regions like theclaustrum (Talairach coordinates of x ¼ 21, y ¼ 7, z ¼ 22).
Training in all versus specific conditions
Fig. 7 presents classification performance training the classifieron all other games but the game being predicted. So for instance,in predicting the Navigation states for a Fortress-Only game we arealso including games from different experimental conditions suchas Mines-Only. This raises the question of whether it would bebetter to restrict training just to games from the same condition.Table A2 compares success in prediction when training and testingon different combinations of conditions.
The training cases consist of all games from the 35 other par-ticipants plus 35 copies of the games of the participant. In thecases where the training and test conditions are the same, weexcluded the game being tested in making these 35 copies fortraining. The measure reported in the table is the D-prime mea-sure of discriminability (Wickens, 2002) generalized to four cate-gories. This involves calculating 4 D-primes, one for each state. TheD-prime for a state is calculated from probability of a “hit”, whichis correctly labeling a scan from that state, and the probability of a“false alarm”, which is assigning a scan from a different state tothat state. The definition of D-prime is
− = ( − )– ( − − )d prime Z p hit Z p false alarm
where Z is the inverse of the cumulative Gaussian distribution. TheD-primes reported in the table are the average of the D-primes forthe 4 states. The D-primes are further averaged over participantsand Sessions 2 and 10. Parts (a) – (c) of the table report perfor-mance for the three groups of states. All the D-primes in Table A2are positive and they are positive for all participants. Thus, with allcombinations of training and testing categories there is informa-tion to discriminate states. Part (d) of the table reports resultsaveraged over different experimental conditions. Testing on thesame condition as trained results in better performance thantraining on a different condition (second versus first row in part d).
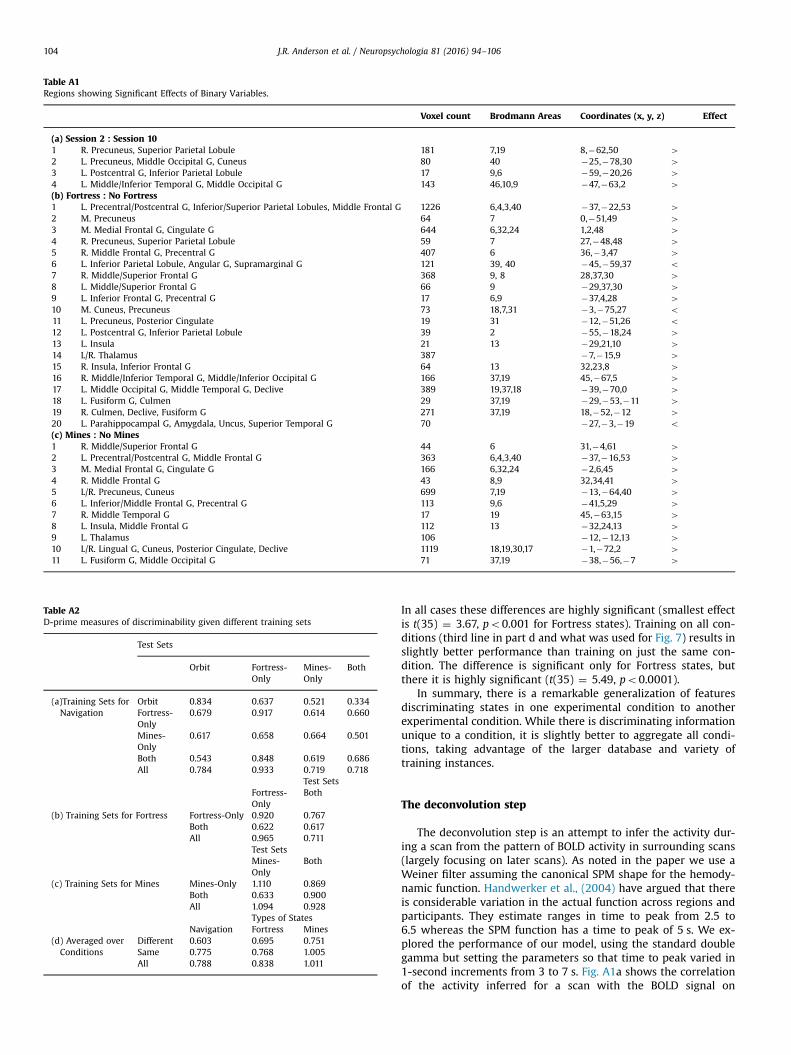
Table A1Regions showing Significant Effects of Binary Variables.
Voxel count Brodmann Areas Coordinates (x, y, z) Effect
(a) Session 2 : Session 101 R. Precuneus, Superior Parietal Lobule 181 7,19 8,�62,50 42 L. Precuneus, Middle Occipital G, Cuneus 80 40 �25,�78,30 43 L. Postcentral G, Inferior Parietal Lobule 17 9,6 �59,�20,26 44 L. Middle/Inferior Temporal G, Middle Occipital G 143 46,10,9 �47,�63,2 4(b) Fortress : No Fortress1 L. Precentral/Postcentral G, Inferior/Superior Parietal Lobules, Middle Frontal G 1226 6,4,3,40 �37,�22,53 42 M. Precuneus 64 7 0,�51,49 43 M. Medial Frontal G, Cingulate G 644 6,32,24 1,2,48 44 R. Precuneus, Superior Parietal Lobule 59 7 27,�48,48 45 R. Middle Frontal G, Precentral G 407 6 36,�3,47 46 L. Inferior Parietal Lobule, Angular G, Supramarginal G 121 39, 40 �45,�59,37 o7 R. Middle/Superior Frontal G 368 9, 8 28,37,30 48 L. Middle/Superior Frontal G 66 9 �29,37,30 49 L. Inferior Frontal G, Precentral G 17 6,9 �37,4,28 410 M. Cuneus, Precuneus 73 18,7,31 �3,�75,27 o11 L. Precuneus, Posterior Cingulate 19 31 �12,�51,26 o12 L. Postcentral G, Inferior Parietal Lobule 39 2 �55,�18,24 413 L. Insula 21 13 �29,21,10 414 L/R. Thalamus 387 �7,�15,9 415 R. Insula, Inferior Frontal G 64 13 32,23,8 416 R. Middle/Inferior Temporal G, Middle/Inferior Occipital G 166 37,19 45,�67,5 417 L. Middle Occipital G, Middle Temporal G, Declive 389 19,37,18 �39,�70,0 418 L. Fusiform G, Culmen 29 37,19 �29,�53,�11 419 R. Culmen, Declive, Fusiform G 271 37,19 18,�52,�12 420 L. Parahippocampal G, Amygdala, Uncus, Superior Temporal G 70 �27,�3,�19 o(c) Mines : No Mines1 R. Middle/Superior Frontal G 44 6 31,�4,61 42 L. Precentral/Postcentral G, Middle Frontal G 363 6,4,3,40 �37,�16,53 43 M. Medial Frontal G, Cingulate G 166 6,32,24 �2,6,45 44 R. Middle Frontal G 43 8,9 32,34,41 45 L/R. Precuneus, Cuneus 699 7,19 �13,�64,40 46 L. Inferior/Middle Frontal G, Precentral G 113 9,6 �41,5,29 47 R. Middle Temporal G 17 19 45,�63,15 48 L. Insula, Middle Frontal G 112 13 �32,24,13 49 L. Thalamus 106 �12,�12,13 410 L/R. Lingual G, Cuneus, Posterior Cingulate, Declive 1119 18,19,30,17 �1,�72,2 411 L. Fusiform G, Middle Occipital G 71 37,19 �38,�56,�7 4
Table A2D-prime measures of discriminability given different training sets
Test Sets
Orbit Fortress-Only
Mines-Only
Both
(a)Training Sets forNavigation
Orbit 0.834 0.637 0.521 0.334Fortress-Only
0.679 0.917 0.614 0.660
Mines-Only
0.617 0.658 0.664 0.501
Both 0.543 0.848 0.619 0.686All 0.784 0.933 0.719 0.718
Test SetsFortress-Only
Both
(b) Training Sets for Fortress Fortress-Only 0.920 0.767Both 0.622 0.617All 0.965 0.711
Test SetsMines-Only
Both
(c) Training Sets for Mines Mines-Only 1.110 0.869Both 0.633 0.900All 1.094 0.928
Types of StatesNavigation Fortress Mines
(d) Averaged overConditions
Different 0.603 0.695 0.751Same 0.775 0.768 1.005All 0.788 0.838 1.011
J.R. Anderson et al. / Neuropsychologia 81 (2016) 94–106104
In all cases these differences are highly significant (smallest effectis t(35) ¼ 3.67, po0.001 for Fortress states). Training on all con-ditions (third line in part d and what was used for Fig. 7) results inslightly better performance than training on just the same con-dition. The difference is significant only for Fortress states, butthere it is highly significant (t(35) ¼ 5.49, po0.0001).
In summary, there is a remarkable generalization of featuresdiscriminating states in one experimental condition to anotherexperimental condition. While there is discriminating informationunique to a condition, it is slightly better to aggregate all condi-tions, taking advantage of the larger database and variety oftraining instances.
The deconvolution step
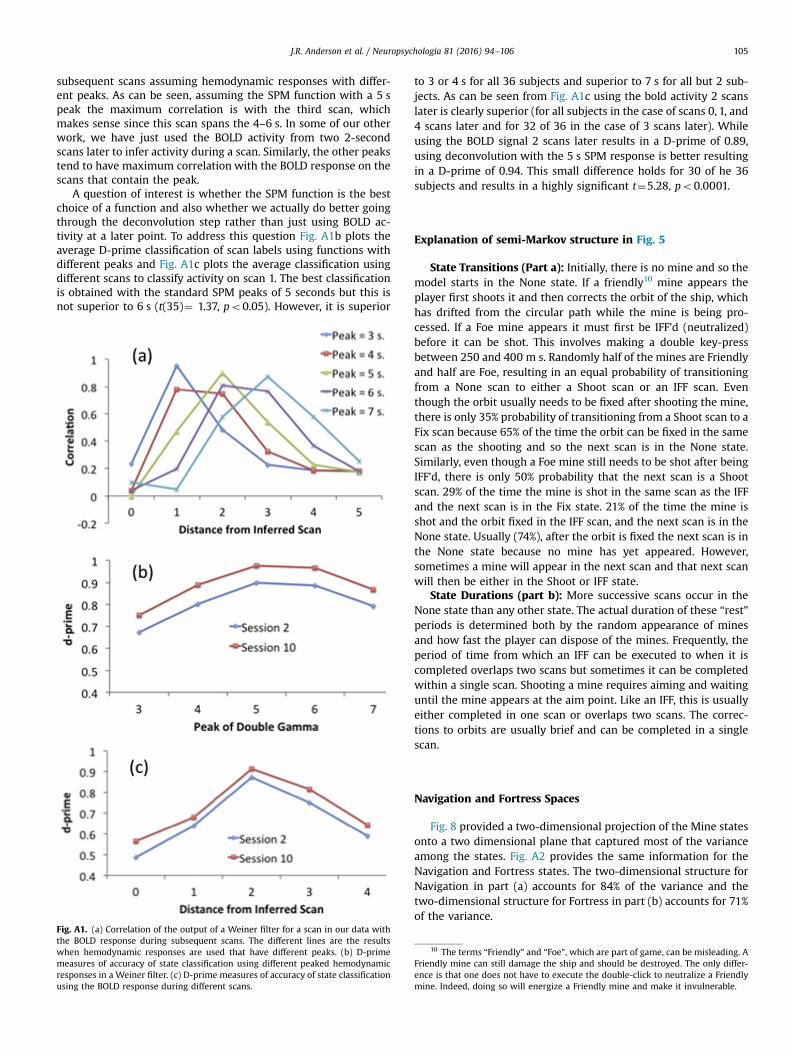
The deconvolution step is an attempt to infer the activity dur-ing a scan from the pattern of BOLD activity in surrounding scans(largely focusing on later scans). As noted in the paper we use aWeiner filter assuming the canonical SPM shape for the hemody-namic function. Handwerker et al., (2004) have argued that thereis considerable variation in the actual function across regions andparticipants. They estimate ranges in time to peak from 2.5 to6.5 whereas the SPM function has a time to peak of 5 s. We ex-plored the performance of our model, using the standard doublegamma but setting the parameters so that time to peak varied in1-second increments from 3 to 7 s. Fig. A1a shows the correlationof the activity inferred for a scan with the BOLD signal on
J.R. Anderson et al. / Neuropsychologia 81 (2016) 94–106 105
subsequent scans assuming hemodynamic responses with differ-ent peaks. As can be seen, assuming the SPM function with a 5 speak the maximum correlation is with the third scan, whichmakes sense since this scan spans the 4–6 s. In some of our otherwork, we have just used the BOLD activity from two 2-secondscans later to infer activity during a scan. Similarly, the other peakstend to have maximum correlation with the BOLD response on thescans that contain the peak.
A question of interest is whether the SPM function is the bestchoice of a function and also whether we actually do better goingthrough the deconvolution step rather than just using BOLD ac-tivity at a later point. To address this question Fig. A1b plots theaverage D-prime classification of scan labels using functions withdifferent peaks and Fig. A1c plots the average classification usingdifferent scans to classify activity on scan 1. The best classificationis obtained with the standard SPM peaks of 5 seconds but this isnot superior to 6 s (t(35)¼ 1.37, po0.05). However, it is superior
Fig. A1. (a) Correlation of the output of a Weiner filter for a scan in our data withthe BOLD response during subsequent scans. The different lines are the resultswhen hemodynamic responses are used that have different peaks. (b) D-primemeasures of accuracy of state classification using different peaked hemodynamicresponses in a Weiner filter. (c) D-prime measures of accuracy of state classificationusing the BOLD response during different scans.
to 3 or 4 s for all 36 subjects and superior to 7 s for all but 2 sub-jects. As can be seen from Fig. A1c using the bold activity 2 scanslater is clearly superior (for all subjects in the case of scans 0, 1, and4 scans later and for 32 of 36 in the case of 3 scans later). Whileusing the BOLD signal 2 scans later results in a D-prime of 0.89,using deconvolution with the 5 s SPM response is better resultingin a D-prime of 0.94. This small difference holds for 30 of he 36subjects and results in a highly significant t¼5.28, po0.0001.
Explanation of semi-Markov structure in Fig. 5
State Transitions (Part a): Initially, there is no mine and so themodel starts in the None state. If a friendly10 mine appears theplayer first shoots it and then corrects the orbit of the ship, whichhas drifted from the circular path while the mine is being pro-cessed. If a Foe mine appears it must first be IFF’d (neutralized)before it can be shot. This involves making a double key-pressbetween 250 and 400 m s. Randomly half of the mines are Friendlyand half are Foe, resulting in an equal probability of transitioningfrom a None scan to either a Shoot scan or an IFF scan. Eventhough the orbit usually needs to be fixed after shooting the mine,there is only 35% probability of transitioning from a Shoot scan to aFix scan because 65% of the time the orbit can be fixed in the samescan as the shooting and so the next scan is in the None state.Similarly, even though a Foe mine still needs to be shot after beingIFF’d, there is only 50% probability that the next scan is a Shootscan. 29% of the time the mine is shot in the same scan as the IFFand the next scan is in the Fix state. 21% of the time the mine isshot and the orbit fixed in the IFF scan, and the next scan is in theNone state. Usually (74%), after the orbit is fixed the next scan is inthe None state because no mine has yet appeared. However,sometimes a mine will appear in the next scan and that next scanwill then be either in the Shoot or IFF state.
State Durations (part b): More successive scans occur in theNone state than any other state. The actual duration of these “rest”periods is determined both by the random appearance of minesand how fast the player can dispose of the mines. Frequently, theperiod of time from which an IFF can be executed to when it iscompleted overlaps two scans but sometimes it can be completedwithin a single scan. Shooting a mine requires aiming and waitinguntil the mine appears at the aim point. Like an IFF, this is usuallyeither completed in one scan or overlaps two scans. The correc-tions to orbits are usually brief and can be completed in a singlescan.
Navigation and Fortress Spaces
Fig. 8 provided a two-dimensional projection of the Mine statesonto a two dimensional plane that captured most of the varianceamong the states. Fig. A2 provides the same information for theNavigation and Fortress states. The two-dimensional structure forNavigation in part (a) accounts for 84% of the variance and thetwo-dimensional structure for Fortress in part (b) accounts for 71%of the variance.
10 The terms “Friendly” and “Foe”, which are part of game, can be misleading. AFriendly mine can still damage the ship and should be destroyed. The only differ-ence is that one does not have to execute the double-click to neutralize a Friendlymine. Indeed, doing so will energize a Friendly mine and make it invulnerable.
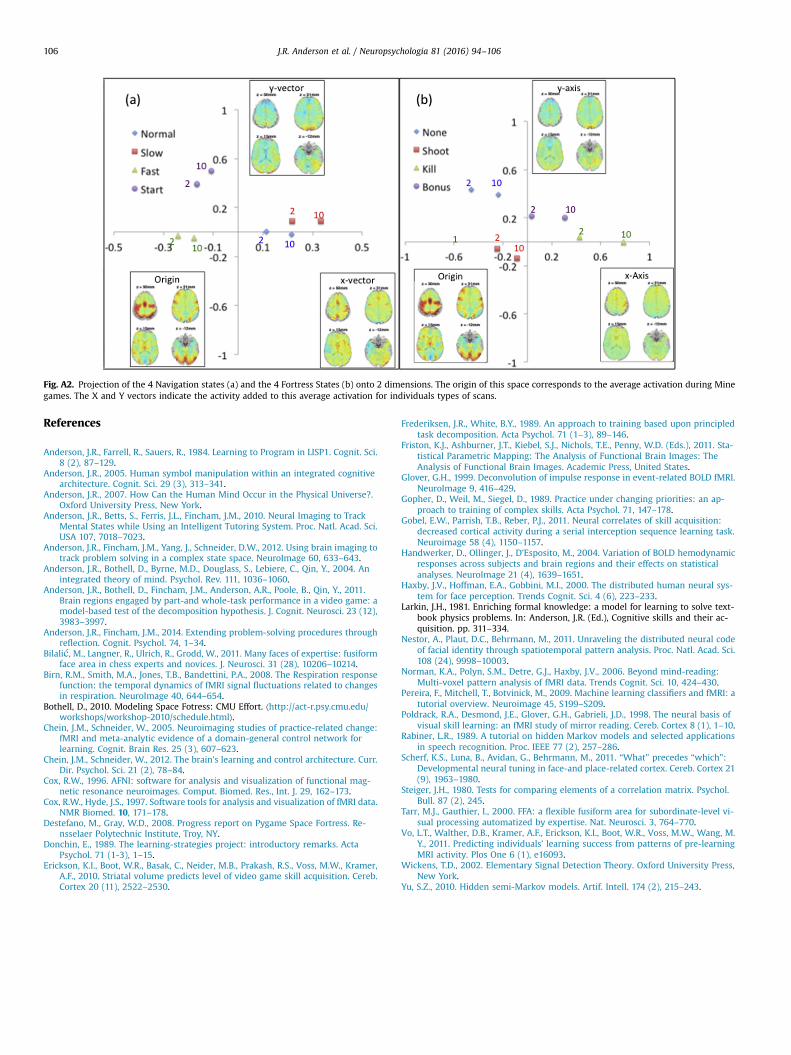
Fig. A2. Projection of the 4 Navigation states (a) and the 4 Fortress States (b) onto 2 dimensions. The origin of this space corresponds to the average activation during Minegames. The X and Y vectors indicate the activity added to this average activation for individuals types of scans.
J.R. Anderson et al. / Neuropsychologia 81 (2016) 94–106106
References
Anderson, J.R., Farrell, R., Sauers, R., 1984. Learning to Program in LISP1. Cognit. Sci.8 (2), 87–129.
Anderson, J.R., 2005. Human symbol manipulation within an integrated cognitivearchitecture. Cognit. Sci. 29 (3), 313–341.
Anderson, J.R., 2007. How Can the Human Mind Occur in the Physical Universe?.Oxford University Press, New York.
Anderson, J.R., Betts, S., Ferris, J.L., Fincham, J.M., 2010. Neural Imaging to TrackMental States while Using an Intelligent Tutoring System. Proc. Natl. Acad. Sci.USA 107, 7018–7023.
Anderson, J.R., Fincham, J.M., Yang, J., Schneider, D.W., 2012. Using brain imaging totrack problem solving in a complex state space. NeuroImage 60, 633–643.
Anderson, J.R., Bothell, D., Byrne, M.D., Douglass, S., Lebiere, C., Qin, Y., 2004. Anintegrated theory of mind. Psychol. Rev. 111, 1036–1060.
Anderson, J.R., Bothell, D., Fincham, J.M., Anderson, A.R., Poole, B., Qin, Y., 2011.Brain regions engaged by part-and whole-task performance in a video game: amodel-based test of the decomposition hypothesis. J. Cognit. Neurosci. 23 (12),3983–3997.
Anderson, J.R., Fincham, J.M., 2014. Extending problem-solving procedures throughreflection. Cognit. Psychol. 74, 1–34.
Bilalić, M., Langner, R., Ulrich, R., Grodd, W., 2011. Many faces of expertise: fusiformface area in chess experts and novices. J. Neurosci. 31 (28), 10206–10214.
Birn, R.M., Smith, M.A., Jones, T.B., Bandettini, P.A., 2008. The Respiration responsefunction: the temporal dynamics of fMRI signal fluctuations related to changesin respiration. NeuroImage 40, 644–654.
Bothell, D., 2010. Modeling Space Fotress: CMU Effort. ⟨http://act-r.psy.cmu.edu/workshops/workshop-2010/schedule.html⟩.
Chein, J.M., Schneider, W., 2005. Neuroimaging studies of practice-related change:fMRI and meta-analytic evidence of a domain-general control network forlearning. Cognit. Brain Res. 25 (3), 607–623.
Chein, J.M., Schneider, W., 2012. The brain's learning and control architecture. Curr.Dir. Psychol. Sci. 21 (2), 78–84.
Cox, R.W., 1996. AFNI: software for analysis and visualization of functional mag-netic resonance neuroimages. Comput. Biomed. Res., Int. J. 29, 162–173.
Cox, R.W., Hyde, J.S., 1997. Software tools for analysis and visualization of fMRI data.NMR Biomed. 10, 171–178.
Destefano, M., Gray, W.D., 2008. Progress report on Pygame Space Fortress. Re-nsselaer Polytechnic Institute, Troy, NY.
Donchin, E., 1989. The learning-strategies project: introductory remarks. ActaPsychol. 71 (1-3), 1–15.
Erickson, K.I., Boot, W.R., Basak, C., Neider, M.B., Prakash, R.S., Voss, M.W., Kramer,A.F., 2010. Striatal volume predicts level of video game skill acquisition. Cereb.Cortex 20 (11), 2522–2530.
Frederiksen, J.R., White, B.Y., 1989. An approach to training based upon principledtask decomposition. Acta Psychol. 71 (1–3), 89–146.
Friston, K.J., Ashburner, J.T., Kiebel, S.J., Nichols, T.E., Penny, W.D. (Eds.), 2011. Sta-tistical Parametric Mapping: The Analysis of Functional Brain Images: TheAnalysis of Functional Brain Images. Academic Press, United States.
Glover, G.H., 1999. Deconvolution of impulse response in event-related BOLD fMRI.NeuroImage 9, 416–429.
Gopher, D., Weil, M., Siegel, D., 1989. Practice under changing priorities: an ap-proach to training of complex skills. Acta Psychol. 71, 147–178.
Gobel, E.W., Parrish, T.B., Reber, P.J., 2011. Neural correlates of skill acquisition:decreased cortical activity during a serial interception sequence learning task.Neuroimage 58 (4), 1150–1157.
Handwerker, D., Ollinger, J., D’Esposito, M., 2004. Variation of BOLD hemodynamicresponses across subjects and brain regions and their effects on statisticalanalyses. NeuroImage 21 (4), 1639–1651.
Haxby, J.V., Hoffman, E.A., Gobbini, M.I., 2000. The distributed human neural sys-tem for face perception. Trends Cognit. Sci. 4 (6), 223–233.
Larkin, J.H., 1981. Enriching formal knowledge: a model for learning to solve text-book physics problems. In: Anderson, J.R. (Ed.), Cognitive skills and their ac-quisition. pp. 311–334.
Nestor, A., Plaut, D.C., Behrmann, M., 2011. Unraveling the distributed neural codeof facial identity through spatiotemporal pattern analysis. Proc. Natl. Acad. Sci.108 (24), 9998–10003.
Norman, K.A., Polyn, S.M., Detre, G.J., Haxby, J.V., 2006. Beyond mind-reading:Multi-voxel pattern analysis of fMRI data. Trends Cognit. Sci. 10, 424–430.
Pereira, F., Mitchell, T., Botvinick, M., 2009. Machine learning classifiers and fMRI: atutorial overview. Neuroimage 45, S199–S209.
Poldrack, R.A., Desmond, J.E., Glover, G.H., Gabrieli, J.D., 1998. The neural basis ofvisual skill learning: an fMRI study of mirror reading. Cereb. Cortex 8 (1), 1–10.
Rabiner, L.R., 1989. A tutorial on hidden Markov models and selected applicationsin speech recognition. Proc. IEEE 77 (2), 257–286.
Scherf, K.S., Luna, B., Avidan, G., Behrmann, M., 2011. “What” precedes “which”:Developmental neural tuning in face-and place-related cortex. Cereb. Cortex 21(9), 1963–1980.
Steiger, J.H., 1980. Tests for comparing elements of a correlation matrix. Psychol.Bull. 87 (2), 245.
Tarr, M.J., Gauthier, I., 2000. FFA: a flexible fusiform area for subordinate-level vi-sual processing automatized by expertise. Nat. Neurosci. 3, 764–770.
Vo, L.T., Walther, D.B., Kramer, A.F., Erickson, K.I., Boot, W.R., Voss, M.W., Wang, M.Y., 2011. Predicting individuals’ learning success from patterns of pre-learningMRI activity. Plos One 6 (1), e16093.
Wickens, T.D., 2002. Elementary Signal Detection Theory. Oxford University Press,New York.
Yu, S.Z., 2010. Hidden semi-Markov models. Artif. Intell. 174 (2), 215–243.


![arXiv:1904.03582v1 [cs.CV] 7 Apr 2019 · latter predicts the labels in a sequential fashion, based on some orders either pre-defined or learned. Another line of works implicitly](https://img.pdfslide.net/doc/110x75/5e0d85e63b7ab3241e6762e3/arxiv190403582v1-cscv-7-apr-2019-latter-predicts-the-labels-in-a-sequential.jpg)