Embed Size (px)
Citation preview

Braceland, M., Bickerdike, R., Tinsley, J., Cockerill, D., Mcloughlin, M.F., Graham, D.A., Burchmore, R.J., Weir, W., Wallace, C., and Eckersall, P.D. (2013) The serum proteome of Atlantic salmon, Salmo salar, during pancreas disease (PD) following infection with salmonid alphavirus subtype 3 (SAV3). Journal of Proteomics, 94 . pp. 423-436. ISSN 1874-3919 (doi:10.1016/j.jprot.2013.10.016) Copyright © 2013 The Authors http://eprints.gla.ac.uk/88358/
Deposited on: 11 December 2013
Enlighten – Research publications by members of the University of Glasgow
http://eprints.gla.ac.uk
J O U R N A L O F P R O T E O M I C S 9 4 ( 2 0 1 3 ) 4 2 3 – 4 3 6
Ava i l ab l e on l i ne a t www.sc i enced i r ec t . com
ScienceDirect
www.e l sev i e r . com/ loca te / j p ro t
The serum proteome of Atlantic salmon, Salmo salar,
during pancreas disease (PD) following infectionwith salmonid alphavirus subtype 3 (SAV3)☆M. Bracelanda, R. Bickerdikeb, J. Tinsleyb, D. Cockerillc, M.F. Mcloughlind, D.A. Grahame,R.J. Burchmore f, W. Weira, C. Wallaceg, P.D. Eckersalla,⁎aInstitute of Biodiversity, Animal Health and Comparative Medicine, University of Glasgow, Bearsden Rd, Glasgow, G61 1QH, Scotland, UKbBioMar Ltd., North Shore Road, Grangemouth Docks, Grangemouth, FK3 8UL, Scotland, UKcMarine Harvest Scotland, Farms Office Blar Mhor Industrial Estate, Fort William, PH33 7PT, Scotland, UKdAquatic Vet Services, 35 Cherryvalley Pk, Belfast, BT5 6PN, Northern Ireland, UKeFish Diseases Unit, Agri-food and Biosciences Institute, Stoney Rd, Stormont, Belfast, BT4 3SD, Northern Ireland, UKfInstitute of Infection, Immunity & Inflammation, University of Glasgow, Bearsden Rd Glasgow, G61 1QH, Scotland, UKgVESO Vikan, Aquamedical Contract Research, Vikan, N-7800 Namsos, Norway
A R T I C L E I N F O
☆ This is an open-access article distributeduse, distribution, and reproduction in any m⁎ Corresponding author at: Institute of Biodiver
Rd, Glasgow G61 1QH, UK. Tel.: +44 141 330 573E-mail address: david.eckersall@glasgow.
1874-3919/$ – see front matter © 2013 The Ahttp://dx.doi.org/10.1016/j.jprot.2013.10.016
A B S T R A C T
Article history:Received 13 June 2013Accepted 11 October 2013Available online 18 October 2013
Salmonid alphavirus is the aetological agent of pancreas disease (PD) in marine Atlanticsalmon, Salmo salar, and rainbow trout, Oncorhynchus mykiss, with most outbreaks in Norwaycaused by SAV subtype 3 (SAV3). This atypical alphavirus is transmittedhorizontally causing asignificant economic impact on the aquaculture industry. This histopathological andproteomic study, using an established cohabitational experimental model, investigated thecorrelation between tissue damageduring PD and a number of serumproteins associatedwiththese pathologies in Atlantic salmon. The proteins were identified by two-dimensionalelectrophoresis, trypsin digest and peptide MS/MS fingerprinting. A number of humoralcomponents of immunitywhichmay act as biomarkers of the diseasewere also identified. Forexample, creatine kinase, enolase and malate dehydrogenase serum concentrations wereshown to correlate with pathology during PD. In contrast, hemopexin, transferrin, andapolipoprotein, amongst others, altered during later stages of the disease and did not correlatewith tissue pathologies. This approach has given new insight into not only PD but also fishdisease as a whole, by characterisation of the protein response to infection, throughpathological processes to tissue recovery.
Biological significanceSalmonid alphavirus causes pancreas disease (PD) in Atlantic salmon, Salmo salar, and has amajor economic impact on the aquaculture industry. A proteomic investigation of thechange to the serum proteome during PD has been made with an established experimentalmodel of the disease. Serum proteins were identified by two-dimensional electrophoresis,trypsin digest and peptide MS/MS fingerprinting with 72 protein spots being shown to alter
Keywords:Atlantic salmonAlpha virusPathology2-Dimension electrophoresisSerum proteomeBiomarkers
under the terms of the Creative Commons Attribution License, which permits unrestrictededium, provided the original author and source are credited.sity, Animal Health and ComparativeMedicine, Garscube Estate, University of Glasgow, Bearsden2; fax: +44 141 330 2483.ac.uk (P.D. Eckersall).
uthors. Published by Elsevier B.V. All rights reserved.
424 J O U R N A L O F P R O T E O M I C S 9 4 ( 2 0 1 3 ) 4 2 3 – 4 3 6
significantly over the 12 week period of the infection. The concentrations of certainproteins in serum such as creatine kinase, enolase and malate dehydrogenase were shownto correlate with tissue pathology while other proteins such as hemopexin, transferrin, andapolipoprotein, altered in concentration during later stages of the disease and did notcorrelate with tissue pathologies. The protein response to infection may be used to monitordisease progression and enhance understanding of the pathology of PD.
© 2013 The Authors. Published by Elsevier B.V. All rights reserved.
1. Introduction
First described in farmed Atlantic salmon, Salmo salar L., fromScotland, in 1976, pancreas disease (PD) is characterized bylethargy and other behavioural modifications, sequential acutenecrosis of the pancreatic acinar cells, cardiomyopathy andskeletal muscle necrosis, fibrosis and degeneration whilstdamage to the kidney, liver and brain can also be observed insome individuals [1–3]. Subsequent to the initial histopath-ological characterization of PD in Scotland the disease wasdescribed in other regions including: North America [4], Norway[5], Ireland [6], France and Spain [7]. It was not until 1995,however, that the aetiological agent of the disease wasdiscovered and given the name salmon pancreas disease virus(SPDV) [8]. Two years later, the aetiological agent of sleepingdisease (SD), which shares the same pathogenesis as PD, infreshwater rainbow trout, Oncorhynchus mykiss, was alsoisolated and named sleeping disease virus (SDV) [9]. Furtheranalysis of these viruses revealed that both SDV and SPDVpossessed phenotypic and genotypic similarity with serologicalcross-reactivity also being observed [10]. Thus SDV and SPDVwere identified as two related isolates of the same virus and thespecies name salmonid alphavirus (SAV) proposed.
Knowledge of SAVs has grown considerably since theiridentification. For instance, there are at present six closely relatedsubtypes defined [11,12]. These differ not only in geographicallocation [13,14] but also between aquatic environments. Forexample, SAV 2 is the only subtype commonly detected infreshwater systems, causing SD in freshwater trout, though ithas also been identified in salmon in the marine environment[13]. In addition, recent work has suggested that there may bedifferences between strains in the infection dynamics [15] andminor differences in prevalence and severity of tissue damage[16].
Natural outbreaks of PD in Atlantic salmon have only beenreported in the seawater phase of production [3]. In light ofthis, it would seem that if vertical transmission does occur itsimpact would be negligible [17], with horizontal transmissionbeing by far the most important means of virus spread [18,19]with shedding of mucus and faeces being recently describedas transmission routes for SAV [15].
Proteomics is a well-established post-genomic tool whichallows investigation of complex biological systems involved inpathology and physiology in model organisms and livestock,such as; fish, cattle and pigs [20–22]. However, despitesome notable exceptions, aquaculture research using thismethodology has had limited application in fish biology [23].Furthermore, there have been fewer attempts to determinethe relationship between pathology and proteome. Therefore,this study aims to investigate the modification of the Atlanticsalmon serum proteome profile caused by PD, using SAV3 as
the aetiological agent, in order to identify serum biomarkersof the disease in relation to tissue damage as assessed byhistopathology. In addition, this study explores serumproteome changes over a 12 week period to highlightbiomarkers of the most critical period of pathology anddisease recovery. Virology, serology and RT-PCR were used toexperimentally demonstrate the horizontal spread of SAV andto confirm the virus was the aetiological agent of observedpathology.
2. Materials and methods
2.1. Fish husbandry and challenge
The following experimental procedure was approved by theNorwegian National Animal Research Authority (NARA) priorto the trial commencing.
Seven hundred Atlantic salmon (Salmo salar) parr of meanweight 30 g, (<15% CV) were randomly distributed intoduplicate 1 m3 tanks (=1400 total fish). Following six weekacclimatisation the fish were fed to a target of 1.5% bodyweight per day. Commercial formulated feed was offered tothe fish throughout the experiment (CPK 2 mm; 3 mm, BioMarAS, Denmark). Water temperature was maintained at 12–14 ±1 °C, water flow 0.8 l/kg min, and light/dark regime 12:12 h.After 42 days, 60 fish from each duplicate tank weretransferred into triplicate 0.6 m3 tanks and water temperaturewas increased to 14 ± 1 °C. Additional fish from the duplicatetanks were maintained separately to be used as Trojanshedders i.e. twelve challenge tanks all containing 120 fish(with Trojan fish to be added later). Naïve fish to be used asTrojans were marked by clipping their adipose fin andinjected with SAV 3 infected CHSE cell culture supernatantat ca. 105 TCID/fish into their intraperitoneal cavity. Thirtyinoculated Trojans were added to each of the challenge tanks6 days after their assembly. The challenge and time course ofsampling were staggered between replicate tanks over threeconsecutive days and kept constant at each sampling.Cohabitant fish were sampled at 0, 2, 3, 4, 5, 6, 8, 10 and12 weeks post challenge (wpc). At each time point 9 fish pertank were killed by lethal overdose of anaesthetic benzocainechloride (Apotekproduksjon AS, Oslo, Norway), 1 g/10 L waterfor 5 min being used and blood collected in non-heparinisedvacutainers for analysis of serum biochemistry and serologicaland virological analysis. From 6 of these fish, pyloric caecae andpancreas (hereafter referred to as pancreas), heart andskeletal muscle tissue were processed from standardisedlocations for histology. Fish sampled at time point 0 wereremoved from the tanks before the addition of Trojanshedders.

425J O U R N A L O F P R O T E O M I C S 9 4 ( 2 0 1 3 ) 4 2 3 – 4 3 6
2.2. Virological, serological and RT-PCR testing
Assessment of virology was carried out in order to confirmthat SAV was absent at the start of the trial and subsequentlyto confirm that any changes in histopathology and the serumproteome were caused by SAV infection and thus PD. Virusneutralization (VN) testing, virus isolation and real-timeRT-PCR testing were carried out as previously described [15].
2.3. Histopathology
Tissues for histology from the salmon were immediatelyfixed in 3.5% v/v formaldehyde in buffered saline pH 7.0(4.0 g NaH2PO4.2H2O, 6.5 g Na2HPO4.2H2O) prior to furtherprocessing by standard paraffin wax techniques, sectionedand stained with haematoxylin and eosin (H & E). The tissuesections were examined by an experienced pathologist anda scoring system was used to semi-quantify the distributionand severity of the tissue lesions in the pancreas, heart andskeletal muscle as used in previous studies [16,24]. A meanscore was calculated at each time point for tissues to firstlydemonstrate the pathological damage caused by SAVinfection/PD and also to examine the relationship betweentissue damage and the serum proteome (see Section 2.5 forfurther information).
2.4. Sample preparation and two-dimensionalelectrophoresis (2DE)
One microlitre of each serum sample collected from each fishsampled at each time point was pooled according to week tocreate pooled samples for the analysis of changing proteincomposition throughout the time course. The protein concen-tration of the pooled samples was determined by Bradford assay,using Bradford Reagent (Sigma-Aldrich, Poole UK), in accordancewith the manufacturer's protocol. Concentrations were used toallow dilution of samples to an equal protein loading (of 208 μg)for 2DE protein separation by isoelectric focusing based onisoelectric point (pI) and sodium dodecyl sulphate poly-acrylamide gel electrophoresis (SDS-PAGE) based on molecularweight (Mw). Three replicate 2DE gels were run of the pool ofsamples from each time point. Separation by pI was carried outusing 11 cm immobilized pH Gradient (IPG) strip with a pH rangeof 3 to 10 (BioRad,HemelHempstead, UK). After protein loading ofthe IPG strips, with serum diluted in a rehydration buffer (8 MUrea, 2% CHAPS, 50 mM DTT, 0.2% Bio-Lyte®) (BioRad, HemelHempstead, UK) and covered in 500 μl of mineral oil, a combinedrehydration and focusing step was carried out over 17 h with atotal of 35,000 V-h. The IPG strips were removed, oil drained andthen treated with two equilibration buffers both made from astock solution comprised of 6 M urea, 0.375 M Tris–HCl, pH 8.8,2% (w/v) SDS, 20% (v/v) glycerol, the first of these containing 2%(w/v) dithiothreitol (Sigma-Aldrich, Poole, UK) to reduce theproteins and subsequently the alkylating agent iodoacetamideat 2.5% (w/v) (Sigma-Aldrich, Poole, UK). IPG strips were thenplaced onto Criterion SDS-PAGE gels and submerged in XT Mopsrunning buffer and subjected to electrophoresis at 200 V for onehour (Bio-Rad, Hemel Hempstead UK). Subsequently gels werestained in Coomassie brilliant blue G-250 dye 0.1% (w/v) inde-stain solution for 1 h and then de-stained using a solution of
methanol:water:acetic acid, (4:5:1) overnight, scanned and savedin 16-bit grey TIFF format images for gel image analysis.
2.5. Gel image analysis
Images were uploaded onto ‘Nonlinear Progenesis SameSpots’2D gel image analysis software (Nonlinear Dynamics,Newcastle, UK) which was used to identify protein spotswhich were differentially expressed through time (inferred bythe programme by normalised spot intensities). Initial resultswere filtered using the programme's statistical analysisfunction, with only those with a power value of >80% andANOVA significance score of <0.05 between groups of replicategels, being chosen for protein identification. To investigate therelationship among different time-points and different proteinswith respect to spot intensity, the dataset was analysed usingcluster analysis. ArrayStar software (DNASTAR, Madison, WI,USA) was used to perform Hierarchical Cluster Analysis basedon Euclidean distance and the results were illustrated in theform of a heat map.
Spot information (profiles) was also used in a generallinear model procedure in SAS version 9.3 (SAS Institute, Cary,N. Carolina) for regression analysis. Each spot was regressedon the mean value of each tissue's histopathological score ateach sampling time point in a separate model. Therefore, theprobability that a protein spot increased or decreased inintensity in association with tissue damage as determined byhistopathology was determined.
2.6. Spot preparation and mass-spectrometry
Chosen protein spots were excised manually by scalpel andplaced in individual vials to be subjected to in-gel digestion forprotein extraction prior to identification viamass spectrometryanalysis. Gel pieces were washed with 100 mM NH4HCO3 for30 min and then for a further hour with 100 mM NH4HCO3 in50% (v/v) acetonitrile. After eachwashall solventwasdiscarded.Gel plugs were then dehydrated with 100% acetonitrile for10 min prior to solvent being removed and dried completely byvacuum centrifugation. Dry gel pieces were then rehydratedwith 10 μl trypsin at a concentration of 20 ng/μl in 25 mMNH4HCO3 (Cat No. V5111, Promega, Madison, WI, USA) andproteins allowed to digest overnight at 37 °C. This liquid wastransferred to a fresh tube, and gel pieces washed for 10 minwith 10 μl of 50% acetonitrile. This wash was pooled with thefirst extract, and the tryptic peptides dried to completion.Tryptic peptides were solubilized in 0.5% (v/v) formic acid andfractionated on a nanoflow uHPLC system (Thermo RSLCnano)before analysis by electrospray ionisation (ESI)mass spectrometryon an Amazon ion trap MS/MS (Bruker Daltonics). Peptideseparation was performed on a Pepmap C18 reversed phasecolumn (LC Packings), using a 5–85% v/v acetonitrile gradient (in0.5% v/v formic acid) run over 45 min. at a flow rate of 0.2μl/min.Mass spectrometric (MS) analysis was performed using acontinuous duty cycle of survey MS scan followed by up to fiveMS/MS analyses of the most abundant peptides, choosing themost intense multiply-charged ions with dynamic exclusion for120 s. MS data were processed using Data Analysis software(Bruker) and theautomatedMatrix ScienceMascotDaemonserver(v2.1.06). Protein identifications were assigned using the Mascot
426 J O U R N A L O F P R O T E O M I C S 9 4 ( 2 0 1 3 ) 4 2 3 – 4 3 6
search engine to interrogate protein sequences in the NCBIdatabases restricting the search to teleostei, allowing a masstolerance of 0.4 Da for both MS and MS/MS analyses. In addition,the search consistedof a carbamidomethyl fixedmodificationanda variable oxidation.
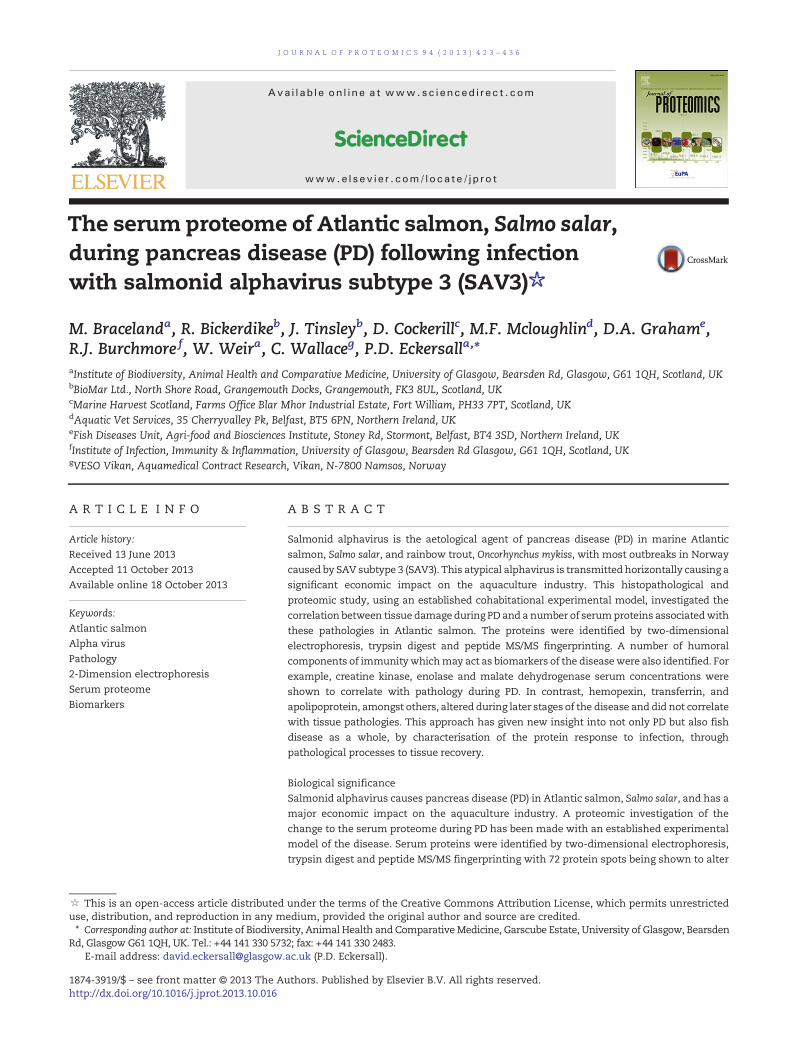
Fig. 1 – Histopathological scoring of mean lesion scores inrelation to week post challenge with SAV in pancreas (Pan),heart (HT), red muscle (RM) and white muscle (WM) ofsalmon (n = 9 per time point).
3. Results
3.1. Virology, serology and RT-PCR
Cohabitant fish were SAV free before introduction of Trojanshedders, as determined by virus isolation, virus neutralizationand RT-PCR (Table 1). Post introduction there was a subsequenthorizontal spread of the viral infection with the majority ofsampled fish being infected by week 4.
3.2. Histopathology of pancreas disease
Negligible mortality was observed pre-and post trial. Thedevelopment of lesions over time is illustrated in Fig. 1, whichshows mean lesion scores for each tissue at each samplingpoint. The pancreas was the first tissue to develop lesions atweek 2 and was also the slowest to recover, with a minority ofsamples still not fully recovered by week 12. Conversely, theheart demonstrates an extremely quick recovery, with a peakin lesion severity in fish sampled in week 4 and then a rapidrecovery. Since this study was based upon a cohabitationmodel individuals were likely to be at different stages in thedisease process at each sampling point due to variation in thetime of infection. The histopathological damage to red andwhite muscle was more delayed with the peak damageoccurring at 6 and 8 weeks respectively.
3.3. Profiling changes in the serum proteome
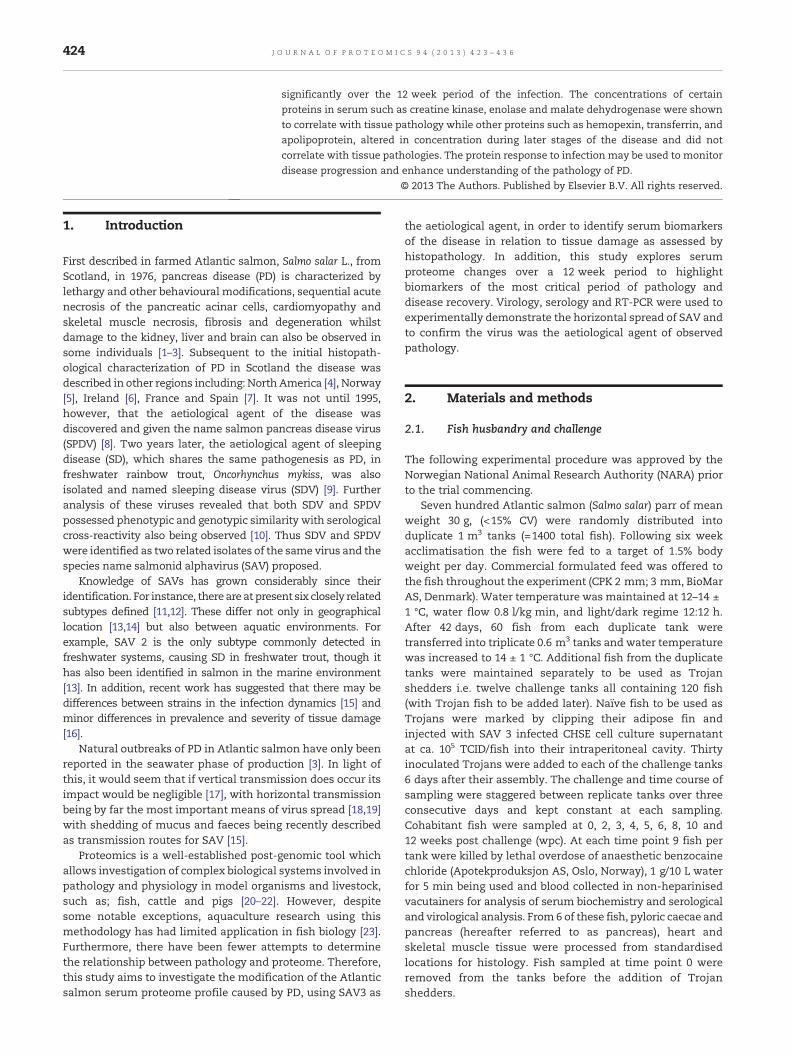
There were a number of clearly visible differences in theserum proteome over the 12 week period of the trial,illustrated in Fig. 2 where sample gels from each of the ninesampling time points can be seen. However, to quantify and
Table 1 – The percentage of samples from salmonsampled at each time point that gave positive results forSAV infection detected by reverse transcriptasepolymerase chain reaction (RT-PCR), virus identification(SAV) and virus neutralisation (VN). Where ‘–’ indicatesthat testing was not carried out.
Sampling timepoint
Positive samples (% of total)
RT-PCR SAV VN
W0 – 0 0W2 75 – –W3 87 – –W4 97 13 27W5 88 2 67W6 – – –W8 – – –W10 – – –W12 – – –
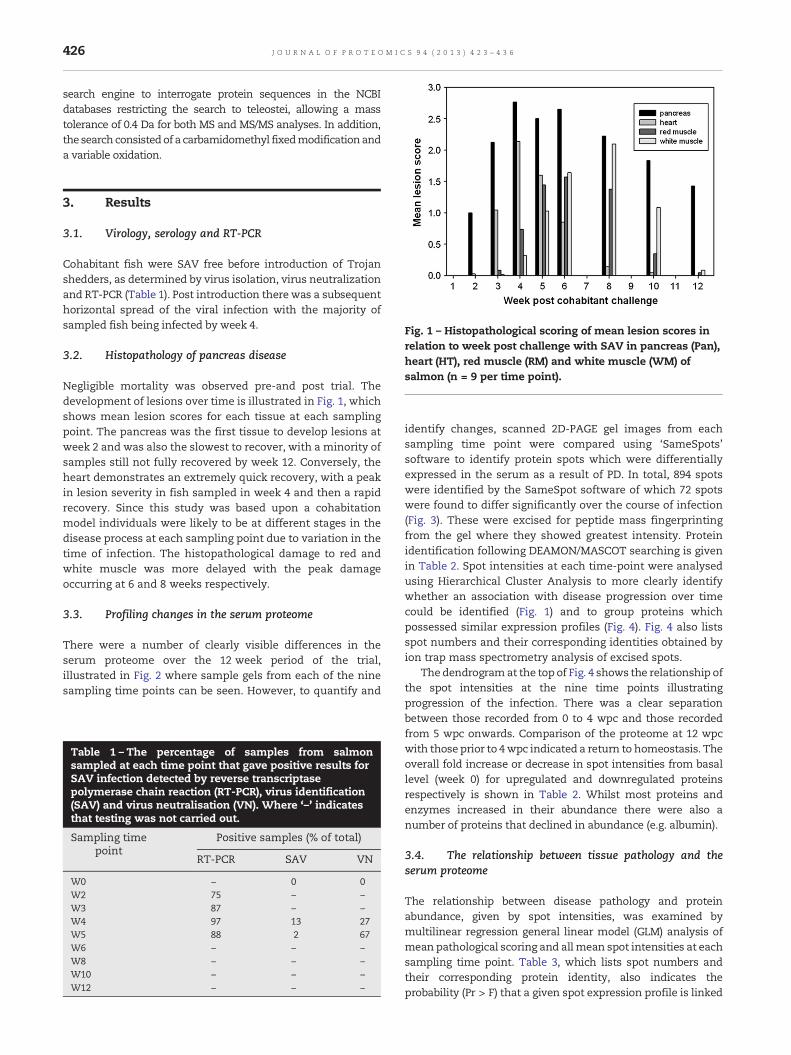
identify changes, scanned 2D-PAGE gel images from eachsampling time point were compared using ‘SameSpots’software to identify protein spots which were differentiallyexpressed in the serum as a result of PD. In total, 894 spotswere identified by the SameSpot software of which 72 spotswere found to differ significantly over the course of infection(Fig. 3). These were excised for peptide mass fingerprintingfrom the gel where they showed greatest intensity. Proteinidentification following DEAMON/MASCOT searching is givenin Table 2. Spot intensities at each time-point were analysedusing Hierarchical Cluster Analysis to more clearly identifywhether an association with disease progression over timecould be identified (Fig. 1) and to group proteins whichpossessed similar expression profiles (Fig. 4). Fig. 4 also listsspot numbers and their corresponding identities obtained byion trap mass spectrometry analysis of excised spots.
The dendrogramat the top of Fig. 4 shows the relationship ofthe spot intensities at the nine time points illustratingprogression of the infection. There was a clear separationbetween those recorded from 0 to 4 wpc and those recordedfrom 5 wpc onwards. Comparison of the proteome at 12 wpcwith those prior to 4wpc indicated a return to homeostasis. Theoverall fold increase or decrease in spot intensities from basallevel (week 0) for upregulated and downregulated proteinsrespectively is shown in Table 2. Whilst most proteins andenzymes increased in their abundance there were also anumber of proteins that declined in abundance (e.g. albumin).
3.4. The relationship between tissue pathology and theserum proteome
The relationship between disease pathology and proteinabundance, given by spot intensities, was examined bymultilinear regression general linear model (GLM) analysis ofmean pathological scoring and allmean spot intensities at eachsampling time point. Table 3, which lists spot numbers andtheir corresponding protein identity, also indicates theprobability (Pr > F) that a given spot expression profile is linked
Fig. 2 – Sample images of 2-dimension electrophoresis gels from all sampling time points from week 0 to 12 post challenge.From left to right: Top row = Week 0, 2 and 3 images. Middle row = Week 4, 5 and 6 images. Bottom row = Week 8, 10 and 12images.
Fig. 3 – Protein spots identified on 2-dimension electrophoresis as being as being differentially expressed following infectionsuperimposed on a week 0 image. Molecular weight (MW) is indicated on protein standard ladder in kilodalton (kD) andisoelectric point (pI) range also shown.
427J O U R N A L O F P R O T E O M I C S 9 4 ( 2 0 1 3 ) 4 2 3 – 4 3 6
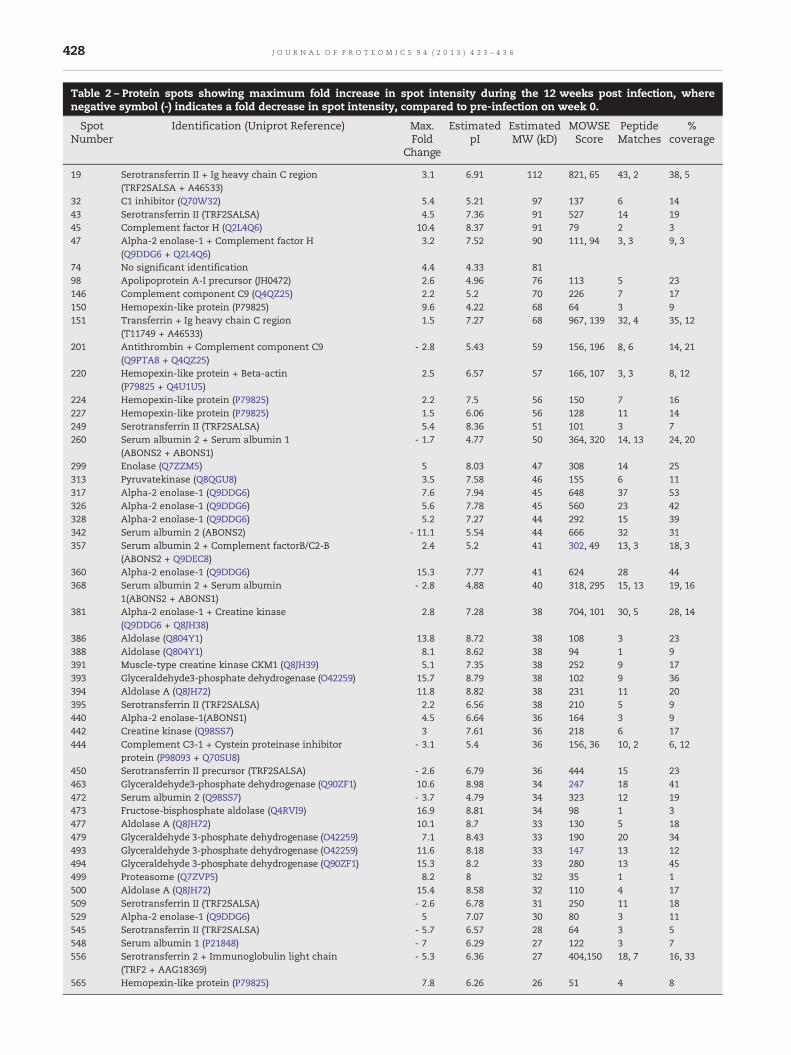
Table 2 – Protein spots showing maximum fold increase in spot intensity during the 12 weeks post infection, wherenegative symbol (-) indicates a fold decrease in spot intensity, compared to pre-infection on week 0.
SpotNumber
Identification (Uniprot Reference) Max.Fold
Change
EstimatedpI
EstimatedMW (kD)
MOWSEScore
PeptideMatches
%coverage
19 Serotransferrin II + Ig heavy chain C region(TRF2SALSA + A46533)
3.1 6.91 112 821, 65 43, 2 38, 5
32 C1 inhibitor (Q70W32) 5.4 5.21 97 137 6 1443 Serotransferrin II (TRF2SALSA) 4.5 7.36 91 527 14 1945 Complement factor H (Q2L4Q6) 10.4 8.37 91 79 2 347 Alpha-2 enolase-1 + Complement factor H
(Q9DDG6 + Q2L4Q6)3.2 7.52 90 111, 94 3, 3 9, 3
74 No significant identification 4.4 4.33 8198 Apolipoprotein A-I precursor (JH0472) 2.6 4.96 76 113 5 23146 Complement component C9 (Q4QZ25) 2.2 5.2 70 226 7 17150 Hemopexin-like protein (P79825) 9.6 4.22 68 64 3 9151 Transferrin + Ig heavy chain C region
(T11749 + A46533)1.5 7.27 68 967, 139 32, 4 35, 12
201 Antithrombin + Complement component C9(Q9PTA8 + Q4QZ25)
- 2.8 5.43 59 156, 196 8, 6 14, 21
220 Hemopexin-like protein + Beta-actin(P79825 + Q4U1U5)
2.5 6.57 57 166, 107 3, 3 8, 12
224 Hemopexin-like protein (P79825) 2.2 7.5 56 150 7 16227 Hemopexin-like protein (P79825) 1.5 6.06 56 128 11 14249 Serotransferrin II (TRF2SALSA) 5.4 8.36 51 101 3 7260 Serum albumin 2 + Serum albumin 1
(ABONS2 + ABONS1)- 1.7 4.77 50 364, 320 14, 13 24, 20
299 Enolase (Q7ZZM5) 5 8.03 47 308 14 25313 Pyruvatekinase (Q8QGU8) 3.5 7.58 46 155 6 11317 Alpha-2 enolase-1 (Q9DDG6) 7.6 7.94 45 648 37 53326 Alpha-2 enolase-1 (Q9DDG6) 5.6 7.78 45 560 23 42328 Alpha-2 enolase-1 (Q9DDG6) 5.2 7.27 44 292 15 39342 Serum albumin 2 (ABONS2) - 11.1 5.54 44 666 32 31357 Serum albumin 2 + Complement factorB/C2-B
(ABONS2 + Q9DEC8)2.4 5.2 41 302, 49 13, 3 18, 3
360 Alpha-2 enolase-1 (Q9DDG6) 15.3 7.77 41 624 28 44368 Serum albumin 2 + Serum albumin
1(ABONS2 + ABONS1)- 2.8 4.88 40 318, 295 15, 13 19, 16
381 Alpha-2 enolase-1 + Creatine kinase(Q9DDG6 + Q8JH38)
2.8 7.28 38 704, 101 30, 5 28, 14
386 Aldolase (Q804Y1) 13.8 8.72 38 108 3 23388 Aldolase (Q804Y1) 8.1 8.62 38 94 1 9391 Muscle-type creatine kinase CKM1 (Q8JH39) 5.1 7.35 38 252 9 17393 Glyceraldehyde3-phosphate dehydrogenase (O42259) 15.7 8.79 38 102 9 36394 Aldolase A (Q8JH72) 11.8 8.82 38 231 11 20395 Serotransferrin II (TRF2SALSA) 2.2 6.56 38 210 5 9440 Alpha-2 enolase-1(ABONS1) 4.5 6.64 36 164 3 9442 Creatine kinase (Q98SS7) 3 7.61 36 218 6 17444 Complement C3-1 + Cystein proteinase inhibitor
protein (P98093 + Q70SU8)- 3.1 5.4 36 156, 36 10, 2 6, 12
450 Serotransferrin II precursor (TRF2SALSA) - 2.6 6.79 36 444 15 23463 Glyceraldehyde3-phosphate dehydrogenase (Q90ZF1) 10.6 8.98 34 247 18 41472 Serum albumin 2 (Q98SS7) - 3.7 4.79 34 323 12 19473 Fructose-bisphosphate aldolase (Q4RVI9) 16.9 8.81 34 98 1 3477 Aldolase A (Q8JH72) 10.1 8.7 33 130 5 18479 Glyceraldehyde 3-phosphate dehydrogenase (O42259) 7.1 8.43 33 190 20 34493 Glyceraldehyde 3-phosphate dehydrogenase (O42259) 11.6 8.18 33 147 13 12494 Glyceraldehyde 3-phosphate dehydrogenase (Q90ZF1) 15.3 8.2 33 280 13 45499 Proteasome (Q7ZVP5) 8.2 8 32 35 1 1500 Aldolase A (Q8JH72) 15.4 8.58 32 110 4 17509 Serotransferrin II (TRF2SALSA) - 2.6 6.78 31 250 11 18529 Alpha-2 enolase-1 (Q9DDG6) 5 7.07 30 80 3 11545 Serotransferrin II (TRF2SALSA) - 5.7 6.57 28 64 3 5548 Serum albumin 1 (P21848) - 7 6.29 27 122 3 7556 Serotransferrin 2 + Immunoglobulin light chain
(TRF2 + AAG18369)- 5.3 6.36 27 404,150 18, 7 16, 33
565 Hemopexin-like protein (P79825) 7.8 6.26 26 51 4 8
428 J O U R N A L O F P R O T E O M I C S 9 4 ( 2 0 1 3 ) 4 2 3 – 4 3 6

Table 2 (continued)
SpotNumber
Identification (Uniprot Reference) Max.Fold
Change
EstimatedpI
EstimatedMW (kD)
MOWSEScore
PeptideMatches
%coverage
568 Transferrin (Q8AYG2) - 3.6 7.36 26 285 12 36575 Apolipoprotein A-I + Ig light chain precursor
(JH0472 + AAG18369)1.8 6.62 26 188, 76 8, 4 28, 24
584 Malatedehydrogenase1a (B8JMZ0) 5.8 8.88 25 70 1 4586 Apolipoprotein A-I (JH0472) 1.9 4.76 25 262 8 27598 Apolipoprotein A-I (JH0472) 1.5 5.15 24 257 19 42602 No significant identification. 3.6 8.63 24608 Triosephosphate isomerase (Q70I40) 2.8 8.5 24 170 6 22613 Serum albumin 2 (ABONS2) 2.4 8.1 24 488 19 23623 Triosephosphate isomerase + Ig light chain
(Q70I40 + AAG18369)3.4 8.57 23 305, 109 10, 5 49, 19
624 Triosephosphate isomerase (Q70I40) 2.4 8.1 23 194 11 50626 Ig light chain (AAG18369) 2.4 7.26 23 190 8 24627 Triosephosphate isomerase + Ig light chain
constant region (Q70I40 + AAN40739)2.6 7.53 23 131, 87 5, 4 22, 25
628 Triosephosphate isomerase (Q70I40) 3.9 7.85 23 432 19 65642 Apolipoprotein A-I (JH0472) 3.8 5.57 21 435 27 37656 Serotransferrin II (TRF2SALSA) - 5.3 8.63 20 251 6 10668 Apolipoprotein A-I (JH0472) - 4.8 5.17 19 325 19 34669 Apolipoprotein A-1 (JH0472) - 4.1 5.42 19 221 14 32687 Serotransferrin II (TRF2SALSA) 4.6 7.93 18 199 7 12702 Prostaglandin D synthase (Q9DFD7) - 3.3 8.16 17 82 1 9738 Putative oncoprotein nm 23 (Q2L4Q6) 7.2 7.3 14 58 11 22741 Nucleoside diphosphate kinase (Q7ZZQ7) 4.6 6.9 14 58 8 22
429J O U R N A L O F P R O T E O M I C S 9 4 ( 2 0 1 3 ) 4 2 3 – 4 3 6
with a particular tissue pathology, with values <0.05 beingregarded as significant.
In addition, expression profiles were plotted on a graph foreach protein (see Supplementary Information) against themean pathology pattern of each tissue sampled. Fig. 5illustrates the relationship between mean white musclehistopathology results and the spot intensity of protein spot313, identified as pyruvate kinase between weeks 2 and 12.Week 0 was removed from this analysis as white muscleshowed no lesions at this time point. Graphs for otherproteins are given as extra material.
The alterations in serum proteins as a result of PD fell intoeither of two categories. The first of these were proteins whichdemonstrated a change in serum abundance (spot intensity)that was associated with damage to a particular tissue ortissues where an increase in intensity was significantlyrelated to the damage. In contrast there were proteins forwhich the abundance change was not associated directly withtissue damage and were likely to be present in serum ashumoral components of host defence (Table 3). Amongthe group of proteins, the concentration of which was associatedwith tissue pathology, were a number of enzymes described byontology as being involved in intracellular pathways. Theseinclude creatine kinase, enolases, triosephosphate isomerase,and malate dehydrogenase 1a. The second group of proteins,alteration of whichwere not related to tissue damage, included anumber of well defined (in other systems) humoralconstituents of the immune response such as a number ofcomplement components, hemopexin, transferrin, andapolipoprotein.
4. Discussion
4.1. Monitoring pancreas disease via proteomics
The analysis of spot profiles at weekly sampling points (Fig. 3)demonstrated that the serum proteome of salmon was alteredmarkedly in response to SAV3. In addition, the heat map ofproteome responses following the 2-DE showed a distinctchange in the serum proteome between pre and post week 4(Fig. 4), with the exception of week 12, which clustered withsamples collected between weeks 1 and 4; thus, indicating thenear return of homeostasis. These results corresponded withthe histopathological results (Fig. 1) indicating that 2DE couldbe used as a useful investigative approach to monitor PD.Furthermore, using both histopathology and proteomicapproaches allowed proteomic results to be separated intoproteins and enzymes which rise or fall in association withtissue damage and those which were part of the host responseto SAV3 (Table 3) as their alteration in intensitywas unrelated tothe histopathology score. The use of hierarchical clustering toanalyse spot intensities effectively highlighted the commonresponses within groups of protein spots and clearly illustrateda temporal trend in the dataset. It is important to note that thisanalysis was carried out using pooled samples, determined bytime point. Whilst, there is an argument for using biologicalreplicates using individual fish it was considered that poolingsamples prior to electrophoresis was the optimal approach. Asthis study was a cohabitation trial there are, due to infectiondynamics, fish at various disease stages which would, when
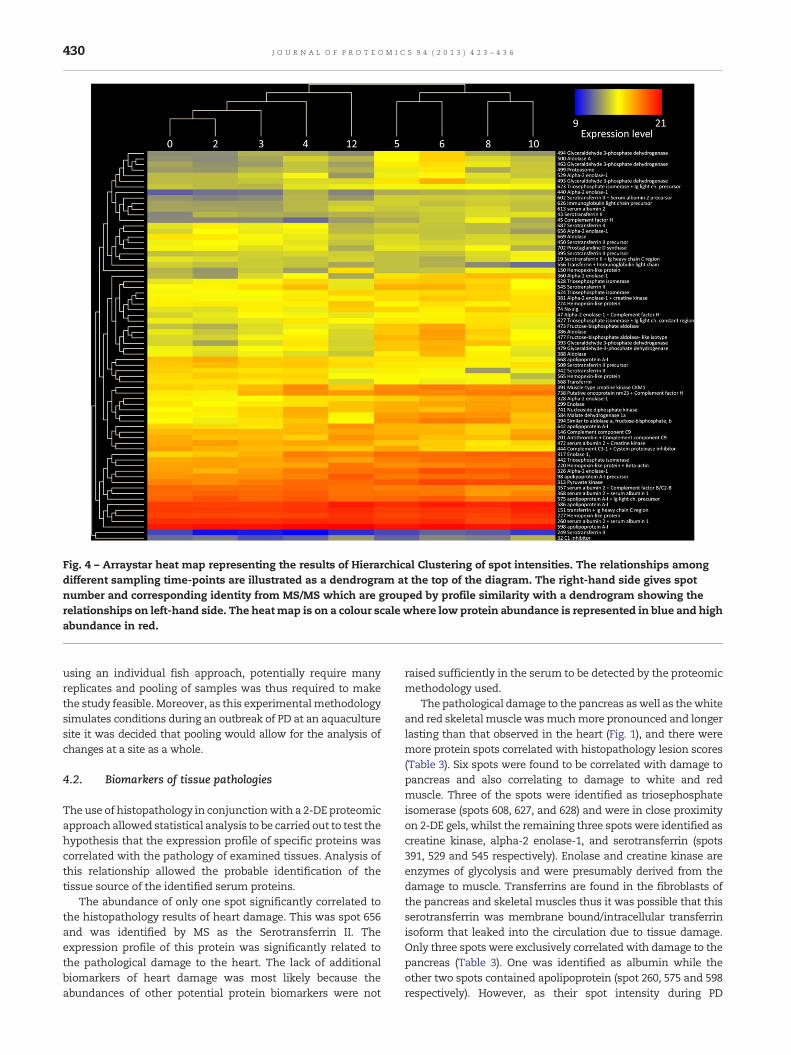
Fig. 4 – Arraystar heat map representing the results of Hierarchical Clustering of spot intensities. The relationships amongdifferent sampling time-points are illustrated as a dendrogram at the top of the diagram. The right-hand side gives spotnumber and corresponding identity from MS/MS which are grouped by profile similarity with a dendrogram showing therelationships on left-hand side. The heatmap is on a colour scale where low protein abundance is represented in blue and highabundance in red.
430 J O U R N A L O F P R O T E O M I C S 9 4 ( 2 0 1 3 ) 4 2 3 – 4 3 6
using an individual fish approach, potentially require manyreplicates and pooling of samples was thus required to makethe study feasible. Moreover, as this experimentalmethodologysimulates conditions during an outbreak of PD at an aquaculturesite it was decided that pooling would allow for the analysis ofchanges at a site as a whole.
4.2. Biomarkers of tissue pathologies
The use of histopathology in conjunctionwith a 2-DE proteomicapproach allowed statistical analysis to be carried out to test thehypothesis that the expression profile of specific proteins wascorrelated with the pathology of examined tissues. Analysis ofthis relationship allowed the probable identification of thetissue source of the identified serum proteins.
The abundance of only one spot significantly correlated tothe histopathology results of heart damage. This was spot 656and was identified by MS as the Serotransferrin II. Theexpression profile of this protein was significantly related tothe pathological damage to the heart. The lack of additionalbiomarkers of heart damage was most likely because theabundances of other potential protein biomarkers were not
raised sufficiently in the serum to be detected by the proteomicmethodology used.
The pathological damage to the pancreas aswell as thewhiteand red skeletalmuscle wasmuchmore pronounced and longerlasting than that observed in the heart (Fig. 1), and there weremore protein spots correlated with histopathology lesion scores(Table 3). Six spots were found to be correlated with damage topancreas and also correlating to damage to white and redmuscle. Three of the spots were identified as triosephosphateisomerase (spots 608, 627, and 628) and were in close proximityon 2-DE gels, whilst the remaining three spots were identified ascreatine kinase, alpha-2 enolase-1, and serotransferrin (spots391, 529 and 545 respectively). Enolase and creatine kinase areenzymes of glycolysis and were presumably derived from thedamage to muscle. Transferrins are found in the fibroblasts ofthe pancreas and skeletal muscles thus it was possible that thisserotransferrin was membrane bound/intracellular transferrinisoform that leaked into the circulation due to tissue damage.Only three spots were exclusively correlated with damage to thepancreas (Table 3). One was identified as albumin while theother two spots contained apolipoprotein (spot 260, 575 and 598respectively). However, as their spot intensity during PD

431J O U R N A L O F P R O T E O M I C S 9 4 ( 2 0 1 3 ) 4 2 3 – 4 3 6
infectiononly increased by<2 fold theywereunlikely candidatesas biomarkers of pancreas damage.
The two types of skeletal muscle studied in thisinvestigation were white and red muscle. These muscle fibresare differentiated by two functional characteristics, specificallycontractile speed and metabolic activity. White fibres (fast)possess a higher action potential due to the quicker generationof ATP by glycolysis compared to red (slow) fibres which ingeneral terms generate ATP by oxidative (aerobic) processes.However, glycolysis does occur in red muscle fibres, whichexplains the finding that many glycolytic enzymes were foundto rise in serum spot intensities at the peak of PD pathologicaldamage to bothmuscle types (Table 3). Many of these glycolyticenzymes have been observed and studied in both muscle typesin salmon [25], and have been found to possess higher activitylevels in white muscles than in red [26,27]. Only two spots,identified as Glyceraldehyde-3-phosphatedehydrogenase andaldolase A (479 and 500 respectively), were exclusivelyidentified as related to red muscle pathology. Rather thanhighlighting themetabolic differences between these two typesof Salmo salar skeletal muscle these differences may indicatethat red and white muscle fibres display a differentialexpression of multiple isozymes of these enzymes.
Conversely this study identified a number of possible uniquebiomarkers ofwhitemuscle damagedue to SAV3 as spots 43, 45,249, 299, 313, 326, 328, and 738 (for protein identification seeTables 2 or 3) were related to histopathological change in whitemuscle. An explanation of this observation is that in Atlanticsalmon the white muscle mass is much greater than red.Complement factor H (CFH) was one of the proteins found inthis study to be a possible biomarker of white muscle damage;in fact all three spots identified as this protein (45, 47 and 738)possess expression profiles that correlated significantly withwhite muscle pathology. This glycoprotein is an importantcomponent of the innate immune system with a number ofknown functions related to it being a regulator of thecomplement system alternative pathway [28] and acting toreduce local concentrations of toxic products of inflammation[29]. The expression profile of all three spots which containedCFH was that of a continuous rise in intensity until a peak atweek 8wpc and then a sharp fall to near basal intensities inweek 12.
4.3. Humoral components of the serum response duringpancreas disease
Complement is a vital component of the immune system ofall animals. However, fish are unique in that their comple-ment components exhibit a greater diversity than that ofthose observed in the mammalian system [30]. In addition toComplement Factor H described above, other Complementcomponents were identified by 2DE and found to changefollowing SAV3 challenge in salmon but without a correlationto histopathology. Thus complement components C3, C9,complement factor B, and the complement inhibitor C1 (spots444, 146, 357 and 32 respectively), which have been previouslycharacterised as part of the fish innate immune system,were identified in protein spots on 2DE. Interestingly thecomplement membrane attack complex (MAC), of which C9 isa pivotal component, damages the envelope of enveloped
viruses [31]. Moreover, it has been shown that salmonidantibodies are dependent on the presence of complement toneutralize viral hemorrhagic septicemia virus (VHSV) andinfectious hematopoietic necrosis virus (IHNV) both of whichare enveloped rhabdoviruses [30]. Given that SAV is also anenveloped virus it is possible that complement also plays arole in its neutralization by Atlantic salmon antibodies in vivo.The expression profiles of C3 and complement factor B fellsignificantly at 5wpc whilst at the same time fractions ofimmunoglobulins rose sharply, (for example spot 626), whichmay have indicated that as immunoglobulins were synthesisedto combat SAV, complement components declined in theirserum concentration. In contrast, the expression profile of C1inhibitor was substantially different from these previouslydiscussed complement components (Fig. 3). The late peak inserum abundance of this protein at 10 wpc may indicate thatin the latter stages of disease recovery (Fig. 4) it wasadvantageous to inhibit complement activation due to theharmful effects of the alternative pathway andMAC can haveon host tissues [32].
Hemopexin-like protein (spots 150, 220, 224, 227 and 565)was found to be significantly altered during SAV3 infection. Inmammalian specieshemopexin is anacute phase protein (APP),synthesised in hepatocytes and extra-hepatocytic sites to besecreted into circulation, and possesses a high affinity for freecirculating haem thus facilitating its clearance [33]. Hemopexinin teleostei is usually referred to as hemopexin-like protein andhas been studied at a genetic level by a number of groups. Itsexpression is highly up regulated during bacterial infections ofAtlantic salmon [34] and rainbow trout [35] with the proposalthat hemopexin-like protein is up regulated inorder to clear freehaem from the circulation which would be detrimental to theproliferation of bacteria. In this study the expression profiles ofthe hemopexin-like protein spots was also found to changefollowing infection. The first four of these spots were in closeproximity and exhibited very similar expression profilesremaining near basal week 0 levels until at 5wpc they increasedsharply and reached their peak intensity at 10wpc and startedto fall again by 12wpc. This may have indicated an increase inserum haem concentration during PD with higher levels ofhemopexin being synthesised to aid its clearance. In otherteleost species two isoforms of hemopexin-like protein havebeen identified. For instance, medaka (Oryzias latipes) possessestwo hemopexin-like proteins which differ not only in theirtissue expression locations but also in their ability to bind heam[36]. Interestingly, spot 565 showed the opposite from thesepreviously discussed spots in terms of expression profile.Despite also displaying early stable expression levels it fellsharply in intensity at 5wpc and continued to fall until 10wpcbefore starting to rise. Therefore, it is possible that Atlanticsalmon also possess two isoforms of hemopexin-like proteinwith the first contained in spots 150, 220, 224 and 227 and thesecond located in spot 565. However it is possible thatalterations in the hemopexin-like protein spots, especially forthe lowermolecular weight spot 565, could be due to unspecificdegradation of proteins of higher molecular weight. It wasnotable that the matched peptides profiles were similarbetween the hemopexin-like spots so that the differences inthese protein spots could be due to post translationalmodification or degradation. However it is possible that there
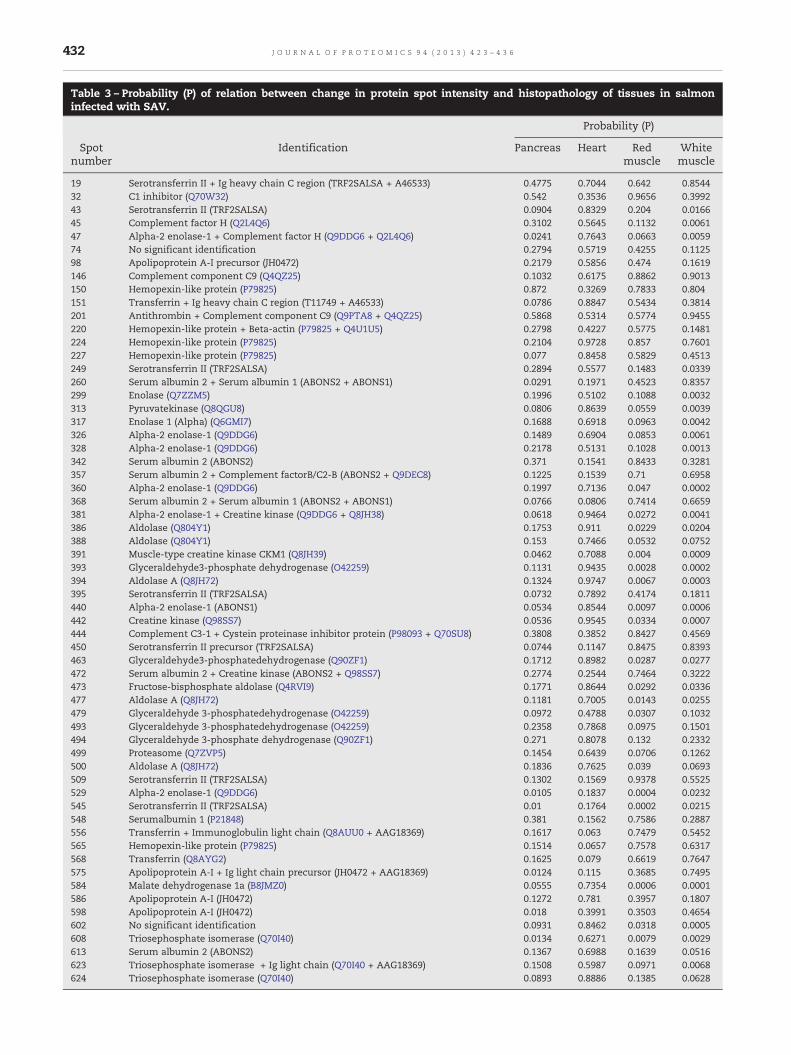
Table 3 – Probability (P) of relation between change in protein spot intensity and histopathology of tissues in salmoninfected with SAV.
Probability (P)
Spotnumber
Identification Pancreas Heart Redmuscle
Whitemuscle
19 Serotransferrin II + Ig heavy chain C region (TRF2SALSA + A46533) 0.4775 0.7044 0.642 0.854432 C1 inhibitor (Q70W32) 0.542 0.3536 0.9656 0.399243 Serotransferrin II (TRF2SALSA) 0.0904 0.8329 0.204 0.016645 Complement factor H (Q2L4Q6) 0.3102 0.5645 0.1132 0.006147 Alpha-2 enolase-1 + Complement factor H (Q9DDG6 + Q2L4Q6) 0.0241 0.7643 0.0663 0.005974 No significant identification 0.2794 0.5719 0.4255 0.112598 Apolipoprotein A-I precursor (JH0472) 0.2179 0.5856 0.474 0.1619146 Complement component C9 (Q4QZ25) 0.1032 0.6175 0.8862 0.9013150 Hemopexin-like protein (P79825) 0.872 0.3269 0.7833 0.804151 Transferrin + Ig heavy chain C region (T11749 + A46533) 0.0786 0.8847 0.5434 0.3814201 Antithrombin + Complement component C9 (Q9PTA8 + Q4QZ25) 0.5868 0.5314 0.5774 0.9455220 Hemopexin-like protein + Beta-actin (P79825 + Q4U1U5) 0.2798 0.4227 0.5775 0.1481224 Hemopexin-like protein (P79825) 0.2104 0.9728 0.857 0.7601227 Hemopexin-like protein (P79825) 0.077 0.8458 0.5829 0.4513249 Serotransferrin II (TRF2SALSA) 0.2894 0.5577 0.1483 0.0339260 Serum albumin 2 + Serum albumin 1 (ABONS2 + ABONS1) 0.0291 0.1971 0.4523 0.8357299 Enolase (Q7ZZM5) 0.1996 0.5102 0.1088 0.0032313 Pyruvatekinase (Q8QGU8) 0.0806 0.8639 0.0559 0.0039317 Enolase 1 (Alpha) (Q6GMI7) 0.1688 0.6918 0.0963 0.0042326 Alpha-2 enolase-1 (Q9DDG6) 0.1489 0.6904 0.0853 0.0061328 Alpha-2 enolase-1 (Q9DDG6) 0.2178 0.5131 0.1028 0.0013342 Serum albumin 2 (ABONS2) 0.371 0.1541 0.8433 0.3281357 Serum albumin 2 + Complement factorB/C2-B (ABONS2 + Q9DEC8) 0.1225 0.1539 0.71 0.6958360 Alpha-2 enolase-1 (Q9DDG6) 0.1997 0.7136 0.047 0.0002368 Serum albumin 2 + Serum albumin 1 (ABONS2 + ABONS1) 0.0766 0.0806 0.7414 0.6659381 Alpha-2 enolase-1 + Creatine kinase (Q9DDG6 + Q8JH38) 0.0618 0.9464 0.0272 0.0041386 Aldolase (Q804Y1) 0.1753 0.911 0.0229 0.0204388 Aldolase (Q804Y1) 0.153 0.7466 0.0532 0.0752391 Muscle-type creatine kinase CKM1 (Q8JH39) 0.0462 0.7088 0.004 0.0009393 Glyceraldehyde3-phosphate dehydrogenase (O42259) 0.1131 0.9435 0.0028 0.0002394 Aldolase A (Q8JH72) 0.1324 0.9747 0.0067 0.0003395 Serotransferrin II (TRF2SALSA) 0.0732 0.7892 0.4174 0.1811440 Alpha-2 enolase-1 (ABONS1) 0.0534 0.8544 0.0097 0.0006442 Creatine kinase (Q98SS7) 0.0536 0.9545 0.0334 0.0007444 Complement C3-1 + Cystein proteinase inhibitor protein (P98093 + Q70SU8) 0.3808 0.3852 0.8427 0.4569450 Serotransferrin II precursor (TRF2SALSA) 0.0744 0.1147 0.8475 0.8393463 Glyceraldehyde3-phosphatedehydrogenase (Q90ZF1) 0.1712 0.8982 0.0287 0.0277472 Serum albumin 2 + Creatine kinase (ABONS2 + Q98SS7) 0.2774 0.2544 0.7464 0.3222473 Fructose-bisphosphate aldolase (Q4RVI9) 0.1771 0.8644 0.0292 0.0336477 Aldolase A (Q8JH72) 0.1181 0.7005 0.0143 0.0255479 Glyceraldehyde 3-phosphatedehydrogenase (O42259) 0.0972 0.4788 0.0307 0.1032493 Glyceraldehyde 3-phosphatedehydrogenase (O42259) 0.2358 0.7868 0.0975 0.1501494 Glyceraldehyde 3-phosphate dehydrogenase (Q90ZF1) 0.271 0.8078 0.132 0.2332499 Proteasome (Q7ZVP5) 0.1454 0.6439 0.0706 0.1262500 Aldolase A (Q8JH72) 0.1836 0.7625 0.039 0.0693509 Serotransferrin II (TRF2SALSA) 0.1302 0.1569 0.9378 0.5525529 Alpha-2 enolase-1 (Q9DDG6) 0.0105 0.1837 0.0004 0.0232545 Serotransferrin II (TRF2SALSA) 0.01 0.1764 0.0002 0.0215548 Serumalbumin 1 (P21848) 0.381 0.1562 0.7586 0.2887556 Transferrin + Immunoglobulin light chain (Q8AUU0 + AAG18369) 0.1617 0.063 0.7479 0.5452565 Hemopexin-like protein (P79825) 0.1514 0.0657 0.7578 0.6317568 Transferrin (Q8AYG2) 0.1625 0.079 0.6619 0.7647575 Apolipoprotein A-I + Ig light chain precursor (JH0472 + AAG18369) 0.0124 0.115 0.3685 0.7495584 Malate dehydrogenase 1a (B8JMZ0) 0.0555 0.7354 0.0006 0.0001586 Apolipoprotein A-I (JH0472) 0.1272 0.781 0.3957 0.1807598 Apolipoprotein A-I (JH0472) 0.018 0.3991 0.3503 0.4654602 No significant identification 0.0931 0.8462 0.0318 0.0005608 Triosephosphate isomerase (Q70I40) 0.0134 0.6271 0.0079 0.0029613 Serum albumin 2 (ABONS2) 0.1367 0.6988 0.1639 0.0516623 Triosephosphate isomerase + Ig light chain (Q70I40 + AAG18369) 0.1508 0.5987 0.0971 0.0068624 Triosephosphate isomerase (Q70I40) 0.0893 0.8886 0.1385 0.0628
432 J O U R N A L O F P R O T E O M I C S 9 4 ( 2 0 1 3 ) 4 2 3 – 4 3 6

Table 3 (continued)
Probability (P)
Spotnumber
Identification Pancreas Heart Redmuscle
Whitemuscle
626 Ig light chain (AAG18369) 0.1144 0.7554 0.1929 0.0606627 Triosephosphate isomerase + Ig light chain constant region (Q70I40 + AAN40739) 0.0396 0.6455 0.0066 0.0115628 Triosephosphate isomerase (Q70I40) 0.0082 0.3003 0.0001 0.0047642 Apolipoprotein A-I (JH0472) 0.4075 0.7725 0.675 0.6736656 Serotransferrin II (TRF2SALSA) 0.0929 0.0296 0.7203 0.6526668 Apolipoprotein A-I (JH0472) 0.2306 0.1865 0.8973 0.4736669 Apolipoprotein A-1 (JH0472) 0.5808 0.4595 0.5278 0.3262687 Serotransferrin II (TRF2SALSA) 0.1577 0.0552 0.8437 0.5952702 Prostaglandin D synthase (Q9DFD7) 0.1102 0.356 0.2959 0.4512738 Putative oncoprotein nm 23 (Q2L4Q6) 0.1136 0.9017 0.0695 0.0056741 Nucleoside diphosphate kinase (Q7ZZQ7) 0.0736 0.8809 0.0467 0.007
433J O U R N A L O F P R O T E O M I C S 9 4 ( 2 0 1 3 ) 4 2 3 – 4 3 6
could be two homologous isoforms thus more work isrequired to ascertain if, as in goldfish, salmon possess multiplehemopexin isoforms.
A total of 13 protein spots, differentially expressed during PD,were identified as transferrin (Tf) (Fig. 3). This glycoprotein is oneof several humoral proteins with an affinity to iron. This ironbinding by Tf facilitates the transport of iron from the circulationto cells [37,38] thus preventing a potentially toxic iron build up,although other functions are known [39]. The intensities of 4 ofthe 13 Tf spots had a significant relationshipwith tissue damage(pancreas and skeletal muscle) and have been previouslydiscussed. However, the change in expression of nine Tf spotsdid not exhibit such a relationship to tissue damage, and werethus deemed components of the immune system response toSAV infection. Of these Tf spots number 151 was by far thelargest (in terms of area),migratedwith the highestMr (~68 kDa)and remained at a relatively constant expression level untilbetween 8 and 10wpc at which point its expression increasedsharply only to fall slightly by 12wpc. This spot was presumablythe main protein constituent of Tf in the serum and is the full
Fig. 5 – Plotting spot 313 (pyruvate kinase) mean intensity and msampling time points. Open circles plot histopathology scores an
length isoform. Other spots identified as Tf were smaller in sizewith lowerMr than spot 151. These could have been degradationproducts, although Stafford et al. [39,40] have shown that certaintransferrin fragments may not be just simply degradationproducts to be eliminated from the circulation, but play asignificant role in the innate immune system of fish. Thesestudies demonstrated the ability of transferrin fragments (butnot full length transferrin) of goldfish (Carassius auratus) toinduce nitric oxide (NO) activation ofmacrophageswhich is vitalin viral disease recovery since NO is a potent antiviral-agent andimmune system modulator [41]. This observation of multipletransferrin fragments with different expression profiles mayalso help explain the considerable variability in the reporting oftransferrin as either a positive or negative APP [38] in the fishimmune system as certain approaches in studies may or maynot detect these fragments in terms of total transferrin.However, given the large number of spots (13 in total) whichcontained the protein it cannot be overlooked that, as with otherproteins, many of these change in concentration due tounspecific degradation.
ean histopathological scoring of white muscle againstd filled circles plot spot intensity at a given time point.
434 J O U R N A L O F P R O T E O M I C S 9 4 ( 2 0 1 3 ) 4 2 3 – 4 3 6
Interestingly the S-nitrosylation of glyceraldehyde3-phosphate dehydrogenase (GAPDH) within cells can initiatea cascade ultimately ending in apoptosis of cells [42].However, this study not only found GAPDH spots associatedwith tissue pathologies, but also two spots (493 and 494)which rose dramatically in intensity at 5wpc reachingtheir peak expression at 6wpc before falling to near basalintensities at 8wpc independently of tissue damage. SinceGADPH is regarded as an intracellular enzyme involved inglycolysis this at first may be regarded as a surprisingobservation. However, endogenous authentic GADPH haspreviously been shown to be secreted outside of cells withoutcausing cell lysis by Yamaji et. al. [43] leading to thehypothesis that it may possess a role in defence againstpathogens. Therefore, GADPH may be classed as an exampleof a moonlight protein where a primarily intracellular proteinis secreted by cells and exhibits very different functionsextracellularly. Another intracellular enzyme found by 2DEthat may possess ‘moonlighting’ functions extracellularly wasthe cytoplasmic glycolytic enzyme aldolase. This study foundtwo spots of aldolase that showed no relationship withhistopathology (Table 3) though whether there is a moonlightingfunction of this enzyme is currently unknown.
Other proteins found in this study which increased in serumconcentration were the apolipoproteins. Apolipoprotein A-1together with apolipoprotein A-II constitute the most abundantcirculating protein observed in teleosts. Its primary function isthe binding and transportation of lipids. However, other antiviral,antimicrobial and anti-inflammatory defensive functions areknown [44,45]. This study identified four protein spotscontaining apolipoprotein which did not exhibit a relationshipbetween expression profile and histology. Interestingly, despiteapolipoprotein being widely defined as negative acutephase proteins in mammals all, except spot 668, exhibited asteady increase in intensity with a peak at approximately 6 or8wpc confirming previous results which found apolipoprotein tobe up regulated during fish disease [46,47]. This findingdemonstrated amajor difference in the expression of this proteinduring disease in fish and may indicate additional functions ofthe protein in fish that do not exist in mammalianapolipoprotein. Despite this, as with transferrin, the possibilityof this expression profile being due to non specific degradation ofprotein cannot be overlooked.
Protein synthesis can also fall during disease as a shift dueto a preferential synthesis of specific proteins. This is thewidely accepted hypothesis of why albumin (an extremelyabundant serum protein in all animals) is observed to act as anegative acute phase protein in most instances. This studyalso observed albumin to be down regulated following SAV3challenge with the protein spots containing it showing asteady decline in expression. Albumin hepatic expression hasalso been shown to be reduced in other fish species during anumber of diseases [48]. Whilst albumin is a well knownnegative acute phase protein two other proteinswhich declinedin serum abundance during PD are not as well documented.These are antithrombin (spot 201) and prostaglandin-D synthase(spot 702). Antithrombin inactivates several enzymes involved inthe coagulation system and thus down regulationmay allow thebenefits of coagulation during disease. Prostaglandin-D synthasein serum has not been studied to any extent in fish or other
species immunity, although inhibition of the protein has beenshown to correlate with muscular necrosis [49] which may havesignificance in PD and other viral diseases that cause necrosis ofmuscle fibres.
5. Conclusion
This histopathological and proteomic study of PD in Atlanticsalmon, Salmo salar, has identified numerous serum proteinswhich are altered in abundance during the disease. A correlationbetween pathology and changes in spot intensity of intracellularproteins and enzymes was established, including variations in anumber of tissue specific isozymes. Furthermore alterations, notassociated with histopathology, were identified for componentsof humoral immunity which were presumably involved in bothlimiting the establishment of PD and aiding the return tohomeostasis. A number of proteins, including complementcomponents, apolipoprotein, hemopexin, and transferrin wereidentified as increasing in serum concentration, whilst albuminand antithrombin levels appeared to decrease during PD. Prior totheir use as biomarkers of either tissue damage or humoralresponse in PD, the diagnostic value of these proteins should bevalidated by complementary approaches, such as; westernblotting, immunohistochemistry and ELISA. However, theproteomics approach described here could be used in toinvestigate other disease challenge models to look for points ofsimilarity and difference between diseases of importance inaquaculture to identify protein change most associated withmorbidity and death, and to deliver insights into diseaseaetiology and identify mitigation strategies.
Acknowledgements
BBSRC (CASE, project BB/I532837/1), Biosciences KTN, BioMarLtd, and Marine Harvest Scotland Ltd are gratefully thankedfor their support of this study. Dr Phil Cash of the ProteomicsLaboratory, University of Aberdeen and Prof. Michael Stear ofthe Genes and Proteins Laboratory, University of Glasgow, arealso thanked for their advice and guidance.
Appendix A. Supplementary data
Supplementary data to this article can be found online athttp://dx.doi.org/10.1016/j.jprot.2013.10.016.
R E F E R E N C E S
[1] Munro ALS, Ellis EAE, McVicar AH, McLay HA, Needham EA.An exocrine pancreas disease of farmed Atlantic salmon inScotland. Helgol Meeresun 1984;37:571–86.
[2] McVicar A. Pancreas disease of farmed Atlantic salmon,Salmo salar, in Scotland: epidemiology and early pathology.Aquaculture 1987;67:71–8.
[3] McLoughlinM,GrahamD.Alphavirus infections in salmonids—areview. J Fish Dis 2007;30:511–31.

435J O U R N A L O F P R O T E O M I C S 9 4 ( 2 0 1 3 ) 4 2 3 – 4 3 6
[4] Kent M, Elston R. Pancreas disease in pen-reared Atlanticsalmon in North America. Bull Eur Assoc Fish Pathol1987;7:29–31.
[5] Poppe T, Rimstad E, Hyllseth B. Pancreas disease in Atlanticsalmon (Salmo salar) postsmolts infected with infectiouspancreatic necrosis virus (IPNV). Bull Eur Assoc Fish Pathol1989;9:83–5.
[6] Murphy TM, Rodger HD, Drinan EM, Gannon F, Kruse P,Korting W. The sequential pathology of pancreas disease inAtlantic salmon farms in Ireland. J Fish Dis 1992;15:401–8.
[7] Raynard R, H.G.M.A.L.S. Pancreas disease of Atlantic salmon:proceedings of a European Commission Workshop. Aberdeen:Scottish Office Aquaculture Report No. 1, The Scottish OfficeAgriculture and Fisheries Department; 1992 2–4.
[8] Nelson RT, McLoughlin MF, Rowley HM, Platten MA,McCormick JI. Isolation of a toga-like virus from farmedAtlantic salmon Salmo salar with pancreas disease. DisAquat Org 1995;22:25.
[9] Castric J, Baudin Laurencin F, Bremont M, Jeffroy J, Le Ven A,Bearxotti M. Isolation of the virus responsible for sleepingdisease in experimentally infected rainbow trout(Oncorhynchus mykiss). Bull Eur Assoc Fish Pathol1997;17:27.
[10] Weston J, Villoing S, Bremont M, Castric J, Pfeffer M, JewhurstV, et al. Comparison of two aquatic alphaviruses, salmonpancreas disease virus and sleeping disease virus, by usinggenome sequence analysis, monoclonal reactivity, andcross-infection. J Virol 2002;76:6155–63.
[11] Fringuelli E, Rowley HM, Wilson JC, Hunter R, Rodger H,Graham DA. Phylogenetic analyses and molecularepidemiology of European salmonid alphaviruses (SAV)based on partial E2 and nsP3 gene nucleotide sequences. JFish Dis 2008;31:811–23.
[12] Graham DA, Fringuelli E, Wilson C, Rowley HM, Brown A,Rodger H, et al. Prospective longitudinal studies of salmonidalphavirus infections on two Atlantic salmon farms inIreland; evidence for viral persistence. J Fish Dis2010;33(2):123–35.
[13] Graham DA, Fringuelli E, Rowley HM, Cockerill D, Cox DI,Turnbull T, et al. Geographical distribution of salmonidalphavirus subtypes in marine farmed Atlantic salmon,Salmo salar L., in Scotland and Ireland. J Fish Dis2012;35:755–65.
[14] Jansen MD, Taksdal T, Wasmuth MA, Gjerset B, Brun E, OlsenAB, et al. Salmonid alphavirus (SAV) and pancreas disease(PD) in Atlantic salmon, Salmo salar L., in freshwater andseawater sites in Norway from 2006 to 2008. J Fish Dis2010;33:391–402.
[15] Graham DA, Frost P, McLaughlin K, Rowley HM, Gabestad I,Gordon A, et al. A comparative study of marine salmonidalphavirus subtypes 1–6 using an experimental cohabitationchallenge model. J Fish Dis 2011;34:273–86.
[16] Christie KE, Graham DA, McLoughlin MF, Villoing S, Todd D,Knappskog D. Experimental infection of Atlantic salmonSalmo salar pre-smolts by ip injection with new Irish andNorwegian salmonid alphavirus (SAV) isolates: acomparative study. Dis Aquat Organ 2007;75:13–22.
[17] Kongtorp RT, Sten A, Andreassen PA, Aspehaug V, GrahamDA, Lyngstad TM, et al. Lack of evidence for verticaltransmission of SAV 3 using gametes of Atlantic salmon,Salmo salar L., exposed by natural and experimental routes. JFish Dis 2010;33:879–88.
[18] Rodger H, Mitchell S. Epidemiological observations ofpancreas disease of farmed Atlantic salmon, Salmo salar L.,in Ireland. J Fish Dis 2007;30:157–67.
[19] Bratland A, Nylund A. Studies on the possibility of verticaltransmission of Norwegian salmonid alphavirus inproduction of Atlantic salmon in Norway. J Aquat AnimHealth 2009;21:173–8.
[20] Bendixen E, Danielsen M, Hollung K, Gianazza E, Miller I.Farm animal proteomics—a review. J Proteomics2011;74:282–93.
[21] Forné I, Agulleiro MJ, Asensio E, Abián J, Cerdà J. 2-D DIGEanalysis of Senegalese sole (Solea senegalensis) testis proteomein wild-caught and hormone-treated F1 fish. Proteomics2009;9:2171–81.
[22] Eckersall PD, Whitfield PD. Methods in animal proteomics.Wiley-Blackwell; 2011.
[23] Rodrigues PM, Silva TS, Dias J, Jessen F. Proteomics inaquaculture: applications and trends. J Proteomics2012;75:4325–45.
[24] McLoughlin MF, Graham DA, Norris A, Matthews D, Foyle L,Rowley HM, et al. Virological, serological andhistopathological evaluation of fish strain susceptibility toexperimental infection with salmonid alphavirus. Dis AquatOrgan 2006;72:125–33.
[25] Halver JE. Enzyme and systems of intermediary metabolismin “Fish nutrition”. In: Halver JE, editor. New York andLondon: Academic Press; 1972. p. 225.
[26] Johnston IA. A comparative study of glycolysis in red andwhite muscles of the trout (Salmo gairdneri) and mirror carp(Cyprinus carpio). J Fish Biol 1977;11:575–88.
[27] Martínez M, Bédard M, Dutil JD, Guderley H. Does condition ofAtlantic cod (Gadus morhua) have a greater impact uponswimming performance at Ucrit or sprint speeds? J Exp Biol2004;207:2979–90.
[28] Meri S, Pangburn ML. Discrimination between activators andnonactivators of the alternative pathway of complement:regulation via a sialic acid/polyanion binding site on factor H.Proc Natl Acad Sci 1990;87:3982–6.
[29] Józsi M, Manuelian T, Heinen S, Oppermann M, Zipfel PF.Attachment of the soluble complement regulator factor H tocell and tissue surfaces: relevance for pathology. HistolHistopathol 2004;19:251–8.
[30] Holland MCH, Lambris JD. The complement system inteleosts. Fish Shellfish Immunol 2002;12:399–420.
[31] Nakao M, Tsujikura M, Ichiki S, Vo TK, Somamoto T. Thecomplement system in teleost fish: progress ofpost-homolog-hunting researches. Dev Comp Immunol2011;35:1296–308.
[32] Lorenzen N, Lapatra SE. Immunity to rhabdoviruses inrainbow trout: the antibody response. Fish Shellfish Immunol1999;9:345–60.
[33] Wicher KB, Fries E. Evolutionary aspects of hemoglobinscavengers. Antioxid Redox Signal 2010;12:249–59.
[34] Tsoi SC, Ewart KV, Penny S, Melville K, Liebscher RS, BrownLL, et al. Identification of immune-relevant genes fromAtlantic salmon using suppression subtractive hybridization.Marine Biotechnol 2004;6:199–214.
[35] Bayne CJ, Gerwick L, Fujiki K, Nakao M, Yano T.Immune-relevant (including acute phase) genes identified inthe livers of rainbow trout, Oncorhynchus mykiss, by means ofsuppression subtractive hybridization. Dev Comp Immunol2001;25:205–17.
[36] Hirayama M, Kobiyama A, Kinoshita S, Watabe S. Theoccurrence of two types of hemopexin-like protein inmedakaand differences in their affinity to heme. J Exp Biol2004;207:1387–98.
[37] Ellis A. Innate host defense mechanisms of fish againstviruses and bacteria. Dev Comp Immunol 2001;25:827–39.
[38] Bayne CJ, Gerwick L. The acute phase response and innateimmunity of fish. Dev Comp Immunol 2001;25:725–43.
[39] Stafford JL, Belosevic M. Transferrin and the innate immuneresponse of fish: identification of a novel mechanism ofmacrophage activation. Dev Comp Immunol 2003;27:539–54.
[40] Stafford JL, Neumann N, Belosevic M. Products of proteolyticcleavage of transferrin induce nitric oxide response ofgoldfish macrophages. Dev Comp Immunol 2001;25:101–15.
436 J O U R N A L O F P R O T E O M I C S 9 4 ( 2 0 1 3 ) 4 2 3 – 4 3 6
[41] Akaike T, Maeda H. Nitric oxide and virus infection.Immunology 2000;101:300–8.
[42] Hara MR, Agrawal N, Kim SF, Cascio MB, Fujimuro M, Ozeki Y,et al. S-nitrosylated GAPDH initiates apoptotic cell death bynuclear translocation following Siah1 binding. Nat Cell Biol2005;7(7):665–74.
[43] Yamaji R, Chatani E, Harada N, Sugimoto K, Inui H, Nakano Y.Glyceraldehyde-3-phosphate dehydrogenase in theextracellular space inhibits cell spreading. Biochim BiophysActa Gen Subj 2005;1726:261–71.
[44] Villarroel F, Bastías A, Casado A, Amthauer R, Concha MI.Apolipoprotein AI, an antimicrobial protein in Oncorhynchusmykiss: evaluation of its expression in primary defencebarriers and plasma levels in sick and healthy fish. FishShellfish Immunol 2007;23:197–209.
[45] Whyte SK. The innate immune response of finfish—a reviewof current knowledge. Fish Shellfish Immunol2007;23:1127–51.
[46] Magnadóttir B. Innate immunity of fish (overview). FishShellfish Immunol 2006;20:137–51.
[47] Russell S, Hayes MA, Simko E, Lumsden JS. Plasma proteomicanalysis of the acute phase response of rainbow trout(Oncorhynchus mykiss) to intraperitoneal inflammation andLPS injection. Dev Comp Immunol 2006;30:393–406.
[48] Gerwick L, Corley-Smith G, Bayne CJ. Gene transcript changesin individual rainbow trout livers following an inflammatorystimulus. Fish Shellfish Immunol 2007;22:157–71.
[49] Mohri I, Aritake K, Taniguchi H, Sato Y, Kamauchi S, NagataN, et al. Inhibition of prostaglandin D synthase suppressesmuscular necrosis. Am J Pathol 2009;174:1735–44.