Embed Size (px)
Citation preview
The Shadow Economy in Europe, 2010Using electronic payment systems to combat the shadow economy
sponsored by
Friedrich Schneider, Ph.D.
VISA EuropeIn Europe, there are more than 407 million Visa debit, credit and commercial cards. In the 12 months ending June 2010, those cards were used to make purchases and cash withdrawals to the value of over €1.4 trillion. In Europe, 11.2 percent of consumer spending at point of sale is with a Visa card, and more than 70 percent of that is on Visa debit cards. Visa Europe is owned and operated by more than 4,000 European member banks and was incorporated in July 2004. In October 2007, Visa Europe became independent of the new global Visa Inc., with an exclusive, irrevocable and perpetual licence in Europe. As a dedicated European payment system it is able to respond quickly to the specific market needs of European banks and their customers—cardholders and retailers—and to meet the European Commission’s objective to create a true internal market for payments. Visa enjoys unsurpassed acceptance around the world. In addition, Visa/PLUS is one of the world’s largest global ATM networks, offering cash access in local currency in over 200 countries. For more information, visit www.visaeurope.com.Visa Europe, as sponsor, accepts no responsibility or liability for any information or content providedin this paper or associated presentation or work.
Friedrich Schneider, Ph.D. Dr. Schneider is one of the leading experts on the shadow economy. He has published multiple articles and books on the shadow economy. He is a professor of economics and the chair of the Department of Economics at Johannes Kepler University of Linz in Austria.
A.T. KearneyA.T. Kearney is a global strategic management consulting firm known for helping clients gain lasting results through a unique combination of strate-gic insight and collaborative working style. The firm was established in 1926 to provide management advice concerning issues on the CEO’s agenda. Today, we serve the largest global clients in all major industries and have specific expertise in cards and payments. A.T. Kearney’s offices are located in major business centres in 37 countries, including 25 offices in Europe.
A.T. Kearney | THE SHADOW ECONOMY IN EUROPE, 2010 1
At an estimated €2.1 trillion, Europe’s shadow economy is signifi-cant. It ranges from 8 percent of GDP (gross domestic product) in Switzerland and Austria to more than 30 percent in some Central
and Eastern European countries. Governments have devised clear objec-tives to reduce this “other” marketplace, but the range of causes makes finding a solution a complex task. A new study explores the structure and impact of the shadow economy and evaluates the role that electronic payments can play in reducing it.
The “shadow economy,” a blurry area of com-merce that includes legal activity hidden deliber-ately from public authorities, is a part of everyday life almost everywhere. A painter offers his work at half price by doing it outside the official econ-omy and avoiding taxes. A bar owner accepts €5 for a glass of wine and doesn’t report the sale to authorities. A construction company doesn’t report income to the government to avoid meet-ing legal standards, such as minimum wage or safety regulations. Although the exact size of the shadow economy is difficult to ascertain, it’s believed to be about €2.1 trillion in Europe.1 In Germany and France, this economy is about one-eighth the size of the countries’ official GDP, but in less-developed East-ern European nations, such as Bulgaria, Croatia, Lithuania and Estonia, it’s 30 percent or more. More people are inclined to work outside the normal, legal framework as the global economy
continues to struggle. Therefore, it’s important to understand the positive and negative effects of the shadow economy, so countries can take the right steps toward capturing lost revenues, protecting workers, and providing for their citizens. Within this context, A.T. Kearney and Fried-rich Schneider, Ph.D., professor of economics and chairperson of the Department of Economics at Johannes Kepler University in Linz, Austria, con-ducted a study to explore the structure of the shadow economy in Europe and identify measures to reduce it. Dr. Schneider divided the shadow economy into 12 industry sectors in six European countries. A.T. Kearney analyzed the data and evaluated the range of solutions used in countries around the world. The firm also explored which industry subsectors could benefit most from the use of electronic payment systems to reduce the size and impact of the shadow economy (see side-bar: About the Study on page 2).
1 Friedrich Schneider. “Size and Development of the Shadow Economy of 31 European Countries from 2003 to 2010,” July 2010. (http://www.econ.jku.at/members/Schneider/files/publications/LatestResearch2010/ShadEcEurope31_Sept2010_RevisedVersion.pdf). The calculation is for 2010 and encompasses the 27 countries of the European Union plus Croatia, Norway, Switzerland and Turkey.The 2010 GDP estimates are taken from Eurostat.

THE SHADOW ECONOMY IN EUROPE, 2010 | A.T. Kearney2
The study, first completed in 2008, was updated in 2010 to include more insights into the impact of the global economic crisis on the shadow economy, and to explore new practices governments are using to reduce the effects of the shadow economy.
The Size of the ShadowThe shadow economy is the realm of legal business activities performed outside the purview of author-ities. It doesn’t include illegal activities and crimes, such as drug dealing, smuggling, money launder-ing or embezzlement, or household enterprises
About the Study
Measuring the shadow economy is a complex science, and explaining all of the approaches would fill a science book. This overview provides a brief look at the methods we used in this study to measure the shadow econ-omy of six countries: Direct. We analyzed publicly available information about the shadow economy, such as information from anonymous surveys. Researchers found that survey participants were surprisingly honest and provided important details about the shadow economy. Indirect. We used macro- economic indicators of the real economy to discern the shadow economy’s impact. Such approaches must rely on macroeconomic fig- ures that often aren’t dependable or suffer from systematic failures. These figures include discrepancies between national expenditures and income statistics, differences between the official and actual labor force, statis-tics on transactions and currency demand, and comparisons between electricity consumption and the output of the real economy. Model or latent estimation. We used a statistical technique called MIMIC (multiple indicators, multi-ple causes) to create a structural model for the shadow economy and exam-
ine the relationships between this economy and several input factors, such as the share of direct taxation or the social security burden. The model consists of observed and unobserved variables and specifies causal relation-ships among the unobserved variables.
Breakdown by Industry SegmentsThe study broke down the shadow economy by industry segments to compare it to the official economy. This was difficult, because the Euro-pean economy has different industry classifications from the questionnaires. As a result, the researchers were forced in some cases to exercise their own judgment when dividing up industries, and some activities, such as entertainment and some house-hold services, couldn’t be placed into official categories. As there is no official breakdown of the GDP per industry segment, we used GVA (gross value added), which is the value of the goods or services minus the cost of inputs used to pro-duce them. The difference between GVA and GDP is mainly in the treat-ment of taxes and subsidies on prod-ucts or services. The following three-step approach was used to evaluate areas most likely to be helped by electronic payments:
Country analysis. We selected six focus countries with relevant shadow economies (Germany, Italy, Poland, Romania, Spain and Turkey) and then divided each shadow econ-omy into 12 sectors, based on our research and questionnaires. We used our own estimates to compare undeclared work against under- reporting. Sector analysis. We selected the three sectors with the highest share of sales underreporting, based on our estimates, and split them into 30 subsectors, based on official categories. As detailed question-naires weren’t available for each subcategory, we used information on industry sub-sectors and researcher judgment to produce an educated estimate. Addressable areas. We identi-fied the most promising subsectors for electronic payments by analyzing the suggested amount of shadow economy concentration (based on the sector analysis), the size of the subsectors, and the potential impact of payment systems. We determined this impact by deriving the number of low-value payments, current pen-etration of electronic payments, con-venience of electronic payments, profit margins, and the share of undeclared work.

A.T. Kearney | THE SHADOW ECONOMY IN EUROPE, 2010 3
that, by law, don’t need to be registered with the government. Figure 1 shows the extent of the shadow economy in the European Union by size and percentage of GDP. Germany, Italy and France account for about half of Europe’s shadow economy. In Eastern Europe, the shadow economy is much larger in relation to the official economy than it is in Western Europe. For example, Turkey, with an official GDP of €441 billion in 2009, has a shadow economy of about €127 billion. The shadow economy can be divided into two parts. “Undeclared work,” which refers to wages that workers and businesses don’t declare to the government to avoid taxes or documentation,
accounts for about two-thirds of the shadow economy.2 Undeclared work is widespread in construction, agriculture and household services, such as cleaning, babysitting, elderly care and tutor-ing. According to a recent study by Dr. Schneider, in Europe’s more developed economies, such as Germany, 30 to 35 percent of the population has taken on second and even third jobs and doesn’t declare the additional income to tax authorities, costing the country billions of euros per year. The other one-third comes from under-reporting, which occurs primarily when cash-based businesses, such as small shops, bars and taxis, report only part of their income to avoid some of the tax burden. This is common in cash-based
Figure 1The shadow economy in relation to total GDP
Notes: Data for EU-27 (no shadow economy data on Cyprus, Luxembourg, Malta), plus Norway, Switzerland and EU candidate countries in 2009. The size of the shadow economy is calculated using the MIMIC and currency demand methodSources: Dr. Friedrich Schneider, Johannes Kepler University of Linz, Austria; A.T. Kearney analysis
Shadow economy
Official GDP
352
2,40
922
11,
907
170
5857
229
339
60 45 42 23 32 24 2116
4
335
1,52
120
5
5923
733
168
127
441
80
23 34 22 11 14 9 11 8 5 4 1419273435456393116
137
310
17122
3274
275
293
1,56
3
15%
Western Europe
€ b
illio
ns
Southern Europe Eastern Europe
Ger
man
y
Fran
ce
U.K
.
Net
herla
nds
Switz
erla
nd
Bel
gium
Swed
en
Nor
way
Aus
tria
Den
mar
k
Finl
and
Irel
and
Italy
Spai
n
Gre
ece
Port
ugal
Turk
ey
Pola
nd
Czec
h Re
p.
Rom
ania
Hun
gary
Slov
ak R
ep.
Croa
tia
Slov
enia
Bul
garia
Lith
uani
a
Latv
ia
Esto
nia
12%11%
10%8%
18%
15% 15%
8%
14% 14% 13%
22%
25%
20% 20%
29%
26%25%
17%
29%
24%
17%
30%
33%
30% 30%
27%
Shadow economyas percentage of GDPShas
1,05
1
%17%
EU-27 average: 20%355
2 The exact division between undeclared work and underreporting is just an estimate, as the data does not exist to draw a scientific conclusion.
THE SHADOW ECONOMY IN EUROPE, 2010 | A.T. Kearney4
businesses that require little documentation, such as a bar owner taking money for a drink and not documenting it, or a plumber receiving cash for his services at a private household without issuing a receipt or declaring the income. Although the size of the shadow economy declined in 2009 because of the economic down-turn, the shadow economy has recovered and is on the rise again. Governments indicate that the past two years have brought setbacks to their efforts to rein in the shadow economy, as unemployment and stagnating living standards reduced compliance and created more incentives to engage in shadow activities. Recent hikes and planned increases in VAT (value added tax), personal income tax, social security contributions, or corporate profit tax are likely to exacerbate the problem in 2011. The research for this paper breaks down the structure, scope and effects of the shadow economy in Europe.3 The study includes a scientific analysis of the shadow econ-omy for a wide range of industries in Germany, Italy, Poland, Romania, Spain and Turkey. We examined various solutions proposed and implemented by different countries and evaluated the role that electronic payments can play in reducing the shadow economy. We divided each industry into sub-categories and examined each one to determine which areas would be most promising for electronic payments.
What Lurks in the ShadowsIt’s important to understand exactly who benefits from such transactions when considering the factors that drive the shadow economy. In some cases, the benefits are shared between the payee
and payer. A typical example is the tradesman who offers a 50 percent cash discount to a customer. The customer saves money on the work and the tradesman saves money on the taxes. Undeclared work is difficult to quantify, as it’s in the best interest of both sides to remain hidden. In other instances, the benefits are realized by only one side, usually the one receiving payment. The bar owner who doesn’t declare a beer sale, for exam-ple, might still charge full price for the beer.
Four main factors influence the size and scope of the shadow economy in any given location: Savings. By working outside the active econ-omy, participants can avoid taxes and possibly social security payments, circumvent tax and labor regulations, and sidestep paperwork. A strong causal relationship exists between a country’s tax rate and the size of its shadow economy. Saving money draws people into this other economy, especially during an economic downturn. Lack of a “guilty conscience.” The shadow economy often is considered to be a normal part of society. This attitude is prevalent in places where the perceived quality of state institutions and benefits is low, and in some Eastern European countries where there is little confidence in the state. The benefits of the shadow economy also are
3 We chose to analyze these 12 countries because of their different cultures and varied stages of development: Bulgaria, Czech Republic, Germany, Greece, Hungary, Italy, Ireland, Poland, Portugal, Romania, Spain and Turkey.
More people are inclined to
work outside the normal, legal
framework as the global econ-
omy continues to struggle.
A.T. Kearney | THE SHADOW ECONOMY IN EUROPE, 2010 5
immediate, while state benefits are usually indirect, collective or deferred. Ease of participation. Paying with cash makes it easier not to declare work. Since cash payments cannot be traced, they are used for both unde-clared work and underreporting. Many Europe-ans do additional undeclared work on the side and receive payments in cash. Low risk of detection. Participating in the shadow economy is illegal, but the less chance there is of getting caught, and the lower the penalties, the more people will consider the risk worthwhile. The difficulty of reducing the shadow econ-omy stems in part from its ambiguous role in society. The shadow economy certainly has nega-tive effects. For example, governments lose revenues from income tax and social security contributions, and they cannot enforce safety rules outside the official economy. This other economy also pro-motes behaviors that have a negative impact on society. These include inequality of competition, which occurs when shadow services are signifi-cantly cheaper than those from the official econ-omy. It also promotes a “free-ride” attitude among some citizens, who take official benefits without paying for them. Some of these negatives are offset by other, more positive factors, at least in terms of unre-ported work. For example, much of the money ends up benefiting the economy as a whole. The study estimates that about two-thirds of shadow-economy income is spent in the official economy. This boosts national economic growth and amasses VAT, which makes up for at least part of the lost revenues. Additionally, many of the services offered
in the shadow economy would likely vanish if forced to exist in the official economy. Indeed, in Germany, more than two-thirds of services offered in the shadow economy would disappear or would be performed by customers themselves.4
These positive factors make it difficult to quantify the exact toll the shadow economy takes on a country’s official economy. In any case, the shadow economy is large and can’t be ignored by any government, particularly in times of eco-nomic crisis.
The Search for SolutionsGovernments are under pressure as slow growth and high unemployment take their toll on fiscal budgets. As a result, many European countries are debating the shadow economy and measures to curb it. When we originally studied this other economy in 2008, we interviewed more than 20 public officials in Europe, including ministers of finance, tax authorities, and association leaders, to determine measures used to limit the shadow economy.5
For this 2010 update, we dug deeper into the shadow economy of 12 European countries. We explored the measures introduced during the past decade and assessed their impact and effective-ness. We compared ideas among different coun-tries and discussed possible new measures in view of each country’s past track record and level of development. We also created a broad database of more than 150 measures from around the world, including more than 120 from Europe.6
The findings reveal that most countries focus foremost on curbing undeclared work and creat-ing credible laws and penalties. Other measures
4 Friedrich Schneider. “Shadow Economies Around the World: What Do We Really Know?” European Journal of Political Economy, Vol. 21/3, September 2005, pp. 598-642.5 Interviews took place in September 2008 by telephone and in person.6 The database includes a record of measures collected by the European Foundation for the Improvement of Living and Working Conditions (Eurofound: http://www.eurofound.europa.eu/areas/labourmarket/tackling/search.php), by the European Industrial Relations Observatory, and from studies by the European Commission, including “Undeclared Work in an Enlarged Union” in 2004.
THE SHADOW ECONOMY IN EUROPE, 2010 | A.T. Kearney6
focus on tax fraud, a crime that certainly is related to the shadow economy but that isn’t considered part of the shadow economy. The broad spectrum of enforcement measures falls under two umbrellas, negative and positive.7
Negative enforcement. All new regulations, controls and penalties to limit the shadow econ-omy by the force of law are considered negative measures. These include identification cards for construction workers, the forced use of electronic payments, onsite visits by public authorities, or tax audits by inspectors. These measures tend to be unpopular, and their success depends on reliable enforcement and solid penalties. The Decreto Bersani is a sweeping law passed in Italy in 2006 that imposed strict penalties on shadow economy activities. It’s an example of a powerful enforcement technique. Under this law, the government can close a retailer temporarily that fails to issue a sales receipt three times in a five-year period or it can shut down construction sites if government inspectors find employment irregularities. Italy brought in €9.1 billion in additional tax revenues by enforcing receipts at retailers along with other measures the govern-ment added in 2009. More common measures include monetary penalties and the loss of benefits for shadow econ-omy participants. In Poland, for example, compa-nies that are caught employing undeclared work-ers lose their eligibility for EU or government subsidies and must return any funding already granted to them. In Portugal and Italy, doctors, lawyers and other professionals have been prose-cuted following probes by tax authorities of differences between tax declarations and apparent living standards. Positive enforcement (indirect and direct). Some of the most powerful measures to curtail the
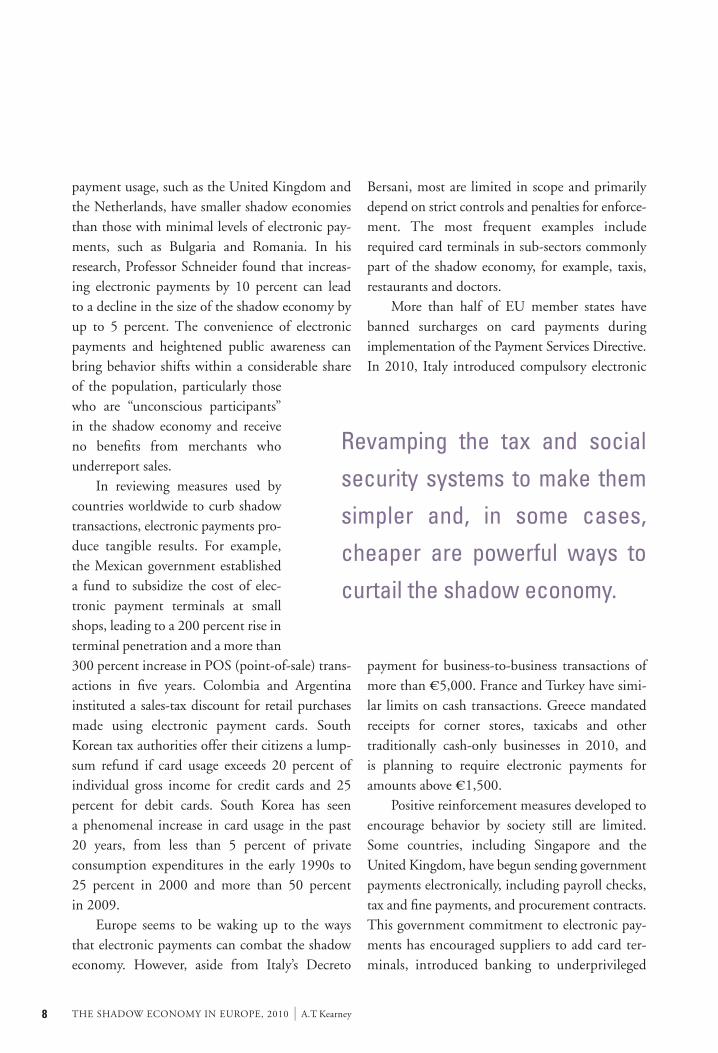
shadow economy are considered indirect. Primary among these measures is revamping the tax and social security systems to make them simpler and, in some cases, cheaper. In Germany, for example, the government introduced “mini-jobs” reform, simplifying the red tape and taxes to encourage lower-wage workers, such as household servants, to join the official economy. In the past several years, some Eastern European countries, including Slovakia, Bulgaria and Romania, have introduced flat-tax rates for individuals and corporations and reduced social security contributions to discourage tax evasion. Some countries use direct incentives to encour-age participation in the official economy, such as Belgium’s system of vouchers offered to workers in household jobs, or the Czech model of reduced VAT rates for maintenance and repairs in private households. On top of the benefits of document-ing and legalizing income streams, the measure also encourages homeowners to invest in their homes by using specialists rather than opting for do-it-yourself. Some countries have produced strong results by improving the lines of communication between citizens and governments. In Denmark, the gov-ernment sponsored a marketing campaign designed to illustrate the costs of the shadow economy to citizens. It showed the harm caused by lost tax payments and asked, “What if everyone worked undeclared?” In Portugal, the “Ask for a receipt” campaign sought to raise public aware-ness about the impact of sales underreporting. The results were promising throughout the cam-paign, but long-term changes in behavior require persistent communication. Such campaigns might have less effect in countries where the shadow economy is an entrenched part of doing business. Still, they can bring the shadow economy to the
7 European Foundation for the Improvement of Living and Working Conditions.
A.T. Kearney | THE SHADOW ECONOMY IN EUROPE, 2010 7
public’s attention and provide a forum for report-ing incidents. Of the leaders interviewed, most under- stood that enforcement was contingent not only on measuring the shadow economy but also on measuring the success of initiatives to curtail such economies. Yet measurement can be elusive. Tangible results could be discerned in just 10 percent of government actions, either because the government action was too recent or it was one of many variables in play. Our research also reveals that underreporting hasn’t been broadly addressed in Europe. In fact, while evaluating more than 120 measures used to curtail the shadow economy in Europe, we found that just a quarter focused on sales underreport-
ing. Even fewer measures considered the increased use of electronic payments.
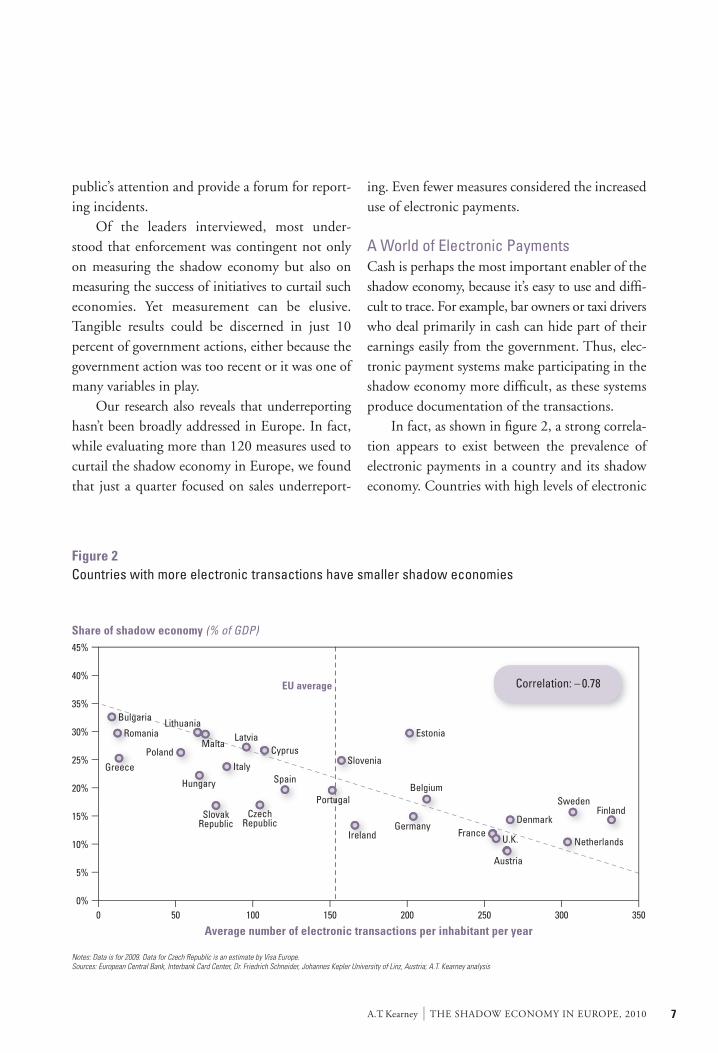
A World of Electronic PaymentsCash is perhaps the most important enabler of the shadow economy, because it’s easy to use and diffi-cult to trace. For example, bar owners or taxi drivers who deal primarily in cash can hide part of their earnings easily from the government. Thus, elec-tronic payment systems make participating in the shadow economy more difficult, as these systems produce documentation of the transactions. In fact, as shown in figure 2, a strong correla-tion appears to exist between the prevalence of electronic payments in a country and its shadow economy. Countries with high levels of electronic
Figure 2Countries with more electronic transactions have smaller shadow economies
Notes: Data is for 2009. Data for Czech Republic is an estimate by Visa Europe.Sources: European Central Bank, Interbank Card Center, Dr. Friedrich Schneider, Johannes Kepler University of Linz, Austria; A.T. Kearney analysis
Share of shadow economy (% of GDP)
Average number of electronic transactions per inhabitant per year
EU average
45%
40%
35%
30%Bulgaria
Romania
Cyprus
GreecePoland
Hungary
Slovenia
Estonia
Spain
PortugalBelgium
Sweden
DenmarkFrance
U.K. Netherlands
Austria
Finland
GermanyIreland
LithuaniaLatvia
Italy
CzechRepublic
SlovakRepublic
25%
20%
15%
10%
5%
0%0 50 100 150 200 250 350300
Correlation: – 0.78
Malta
THE SHADOW ECONOMY IN EUROPE, 2010 | A.T. Kearney8
payment usage, such as the United Kingdom and the Netherlands, have smaller shadow economies than those with minimal levels of electronic pay-ments, such as Bulgaria and Romania. In his research, Professor Schneider found that increas-ing electronic payments by 10 percent can lead to a decline in the size of the shadow economy by up to 5 percent. The convenience of electronic payments and heightened public awareness can bring behavior shifts within a considerable share of the population, particularly those who are “unconscious participants” in the shadow economy and receive no benefits from merchants who underreport sales. In reviewing measures used by countries worldwide to curb shadow transactions, electronic payments pro-duce tangible results. For example, the Mexican government established a fund to subsidize the cost of elec-tronic payment terminals at small shops, leading to a 200 percent rise in terminal penetration and a more than 300 percent increase in POS (point-of-sale) trans-actions in five years. Colombia and Argentina instituted a sales-tax discount for retail purchases made using electronic payment cards. South Korean tax authorities offer their citizens a lump-sum refund if card usage exceeds 20 percent of individual gross income for credit cards and 25 percent for debit cards. South Korea has seen a phenomenal increase in card usage in the past 20 years, from less than 5 percent of private consumption expenditures in the early 1990s to 25 percent in 2000 and more than 50 percent in 2009. Europe seems to be waking up to the ways that electronic payments can combat the shadow economy. However, aside from Italy’s Decreto
Bersani, most are limited in scope and primarily depend on strict controls and penalties for enforce-ment. The most frequent examples include required card terminals in sub-sectors commonly part of the shadow economy, for example, taxis, restaurants and doctors. More than half of EU member states have banned surcharges on card payments during implementation of the Payment Services Directive. In 2010, Italy introduced compulsory electronic
payment for business-to-business transactions of more than €5,000. France and Turkey have simi-lar limits on cash transactions. Greece mandated receipts for corner stores, taxicabs and other traditionally cash-only businesses in 2010, and is planning to require electronic payments for amounts above €1,500. Positive reinforcement measures developed to encourage behavior by society still are limited. Some countries, including Singapore and the United Kingdom, have begun sending government payments electronically, including payroll checks, tax and fine payments, and procurement contracts. This government commitment to electronic pay-ments has encouraged suppliers to add card ter-minals, introduced banking to underprivileged
Revamping the tax and social
security systems to make them
simpler and, in some cases,
cheaper are powerful ways to
curtail the shadow economy.
A.T. Kearney | THE SHADOW ECONOMY IN EUROPE, 2010 9
groups, and spurred more card usage among pub-lic-sector employees. In Bulgaria, banks and pay-ment providers have joined forces to improve the penetration of electronic payments. E-ticket and e-parking solutions in many countries, such as Austria, Turkey and the United Kingdom, are the first steps toward addressing low-value payments. Many of these initiatives are in the early stages, so success rates are difficult to judge.
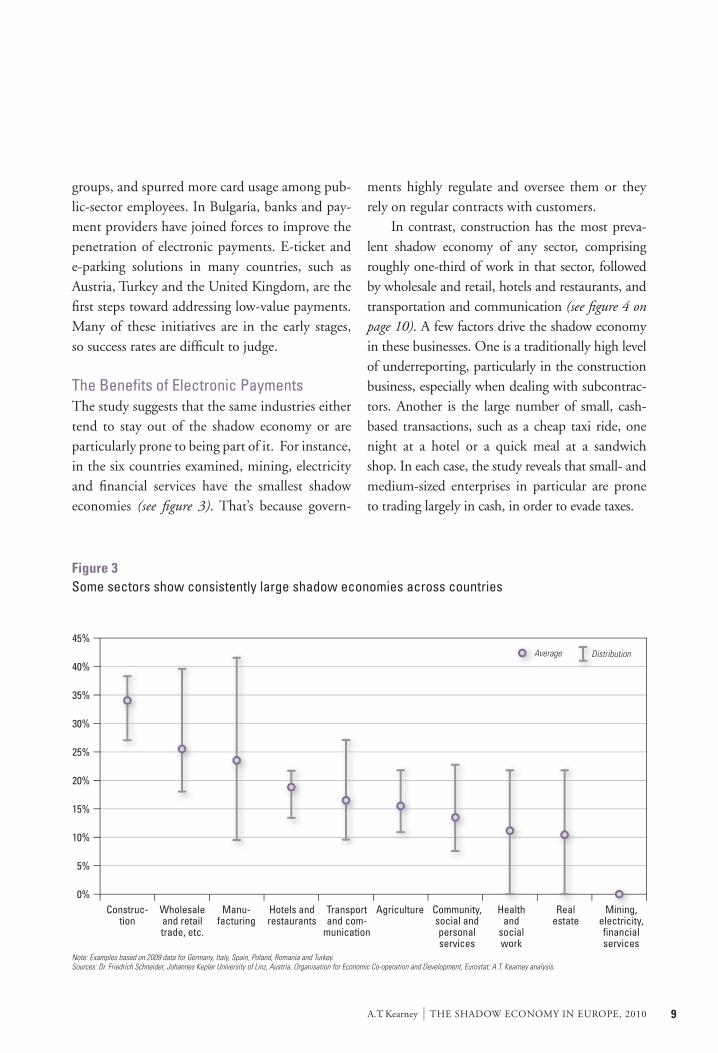
The Benefits of Electronic Payments The study suggests that the same industries either tend to stay out of the shadow economy or are particularly prone to being part of it. For instance, in the six countries examined, mining, electricity and financial services have the smallest shadow economies (see figure 3). That’s because govern-
ments highly regulate and oversee them or they rely on regular contracts with customers. In contrast, construction has the most preva-lent shadow economy of any sector, comprising roughly one-third of work in that sector, followed by wholesale and retail, hotels and restaurants, and transportation and communication (see figure 4 on page 10). A few factors drive the shadow economy in these businesses. One is a traditionally high level of underreporting, particularly in the construction business, especially when dealing with subcontrac-tors. Another is the large number of small, cash-based transactions, such as a cheap taxi ride, one night at a hotel or a quick meal at a sandwich shop. In each case, the study reveals that small- and medium-sized enterprises in particular are prone to trading largely in cash, in order to evade taxes.
Figure 3Some sectors show consistently large shadow economies across countries
Note: Examples based on 2009 data for Germany, Italy, Spain, Poland, Romania and Turkey.Sources: Dr. Friedrich Schneider, Johannes Kepler University of Linz, Austria, Organisation for Economic Co-operation and Development, Eurostat; A.T. Kearney analysis.
Average Distribution
45%
40%
35%
30%
25%
20%
15%
10%
5%
0%AgricultureManu-
facturingConstruc-
tionWholesaleand retailtrade, etc.
Hotels andrestaurants
Transportand com-
munication
Realestate
Healthand
socialwork
Community,social andpersonalservices
Mining,electricity,financialservices

THE SHADOW ECONOMY IN EUROPE, 2010 | A.T. Kearney10
For a more detailed analysis, we selected three industries for a “deep dive”—wholesale and retail, hotels and restaurants, and transportation and communication, which represent an estimated 20 to 25 percent of the shadow economy. We selected
these industries because underreporting comprises a large share of the shadow economy, both in business-to-business and business-to-consumer sales (see figure 5). These industries are also wide-ranging. For example, transportation and communication
Figure 4Three sectors were chosen because of the size of their shadow economies and addressability
1Other personal services include entertainment, massage, prostitution, household services and others.Material costs account for about 30 percent of this segment, including new and second-handgoods and materials, and may be partly reported in both official and unofficial GDP figures.Note: Findings are based on 2009 data for Germany, Italy and Turkey, and 2008 data for Spain, Poland and Romania
Realestate
Manu-facturing
Whole-sale and
retail
Transportand
commun-ication
Construc-tion
Healthand
socialwork
Commun-ity, social,
andpersonalservices
Hotelsand
restaur-ants
Agri-culture
Privatehouse-
holds withemployedpersons
Sectorswithoutshadow
economy
Otherpersonalservices1
Split ofGDP
Shadow economy 2009(€ billion)
GDP 2009(€ billion)
1,349
1,005
661
424 386 377234 199 135
37
1,156
102 154 14064 126
40 2240 21 5 5
441
37 5
8% 15% 21% 15% 33% 11% 9% 20% 15% 13% — —Shadoweconomy %
of sector
64
15%
40
11%
22
9% 20% 15%
Sources: Eurostat, Dr. Friedrich Schneider,Johannes Kepler University of Linz, Austria; A.T. Kearney analysis
Figure 5Three industries represent 20 to 25 percent of the shadow economy
Notes: Findings are based on 2009 data for Germany, Italy and Turkey, and 2008 data for Spain, Poland and Romania. B2C is business-to-consumer; B2B is business-to-business.Sources: Eurostat, Dr. Friedrich Schneider, Johannes Kepler University of Linz, Austria; A.T. Kearney analysis
30-40 25-35 115-125 45-55 15-25 5-10 0-5 20-30 5-10 0-2 — <40
Realestate
Manu-facturing
Whole-sale and
retail
Transportand
commun-ication
Construc-tion
Healthand
socialwork
Commun-ity, social,
andpersonalservices
Hotelsand
restaur-ants
Agri-culture
Privatehouse-
holds withemployedpersons
Sectorswithoutshadow
economy
Otherpersonalservices
Indicativesplit (%)
Size of theshadow
economy(€ billion)
Under-reporting
(€ billion)
Undeclared workB2C underreporting
B2B underreporting
102 154 140 64 126 40 22 40 21 5 5 441

A.T. Kearney | THE SHADOW ECONOMY IN EUROPE, 2010 11
includes both highly regulated services with a miniscule shadow economy (such as mail, telecom and air travel) and unregulated businesses that deal mostly in cash (such as taxi services). We determined which sectors could benefit most from electronic payments by comparing the size of the shadow economy in that industry to the potential for introducing electronic payment sys-tems. To determine this potential, we took into account such factors as the current prevalence of payment systems and the convenience of using them. We selected sectors that have a high share of underreporting versus undeclared work, and therefore have one-sided benefits that serve as an opportunity to formalize the transactions through electronic payments. Based on these criteria, we identified several sectors that would benefit most from electronic payments (see figure 6). These sectors include cars
and car parts, non-specialized retail stores, restau-rants and bars, catering, and transportation (such as taxis). We found a few others specific to indi-vidual countries, such as fuel sales in Turkey and budget hotels in Italy and Spain. By targeting these sectors, governments could address up to 50 percent of the shadow economy in the three industries highlighted in figure 4 and bring busi-nesses and individuals out of the shadow economy, especially in rural areas where cash transactions are prevalent. Ample reasons exist to implement electronic payment technology, even in small businesses. Electronic payments already are widespread throughout much of society, with credit cards, debit cards and direct deposits representing com-mon and accepted forms of payment. Portable card readers offer instant online transactions. Computer-chip technology allows fast completion
Figure 6Sectors where electronic payments can pay off
Note: The focus countries for this analysis are Germany, Italy, Spain, Poland and Turkey. Source: A.T. Kearney analysis
Wholesale and retail
Hotels and restaurants
Transportation
Bold = targeted subsectors
Bubble size = gross valueadded in the subsector
Hig
hLo
w Tra
Ho
Tra
W
Ho
Add
ress
abili
ty
HighLowShadow economy concentration
Fuel sales
Watertransport
Car and motorcyclerepairs
Cars andcar parts
Canteensand catering
Out-of-storeretail
Restaurantsand bars
Taxis, buses andcommercial
transport
Budgetaccommodation
Non-specializedretail stores
Supportingtransportactivities
Wholesaletrade and
commissiontrade
Pharmaceuticaland cosmetic
retail
Railways
Pipelinestransport
Airtransport
Specializedretail stores
Hotels
THE SHADOW ECONOMY IN EUROPE, 2010 | A.T. Kearney12
of card payments. Online and mobile banking offer access to up-to-date information about trans-actions, account balances and payment receipts, as well as speedy payments.
Breaking the Vicious CycleFigure 7 illustrates two areas that have emerged for address-ing the shadow economy. In the past, general initiatives against the shadow economy have pre-vailed. These include ensuring law enforcement capabilities, creating a “guilty conscience,” reducing red tape, fostering financial inclusion, and reduc-ing material advantage in the tax and social security burden. The second area, cash displacement, is more complex, since it means changing habits and coordinating actions among
many stakeholders, including governments, banks, payment providers and merchants. Planned initia-tives must build on one another to ensure improve-ment. These initiatives must be sequenced logically
and combined, from creating the infrastructure to guaranteeing its usage. We’ve identified a few ways to employ elec-tronic payments to encourage cash displacement and help reduce the shadow economy: Discourage cash circulation. Easy access to cash, particularly with no-fee ATMs (automated teller machines), slows down the transition to electronic transactions. Typically, the absence of ATM fees leads to less inhibited cash withdrawals and subsequently encourages cash payments at the point-of-sale. Although we do not advocate “withdrawal taxes” for ATMs, we do think that not charging fees could be perceived as a clear sign in favour of cash. It is too early to evaluate the impact on payments behaviour of measures, such as the Portugal government’s abolition of ATM fees as of 1 January 2010. Nevertheless, creating more transparency about the true cost of cash can help discourage cash usage and change the common perception that cash is a “free” and efficient payment means (see sidebar: The Unknown Cost of Cash).
Figure 7How to address the shadow economy
Source: A.T. Kearney analysis
Cashdisplacement
Generalinitiatives
EncouragePOS use
Reducered tape
Increaseelectronicpayments
Broadencard
acceptance
Fosterfinancialinclusion
Createa “guilty
conscience”
Discouragecash
circulation
Encouragecash
deposits
Ensure lawenforcement
Reducematerial
advantage
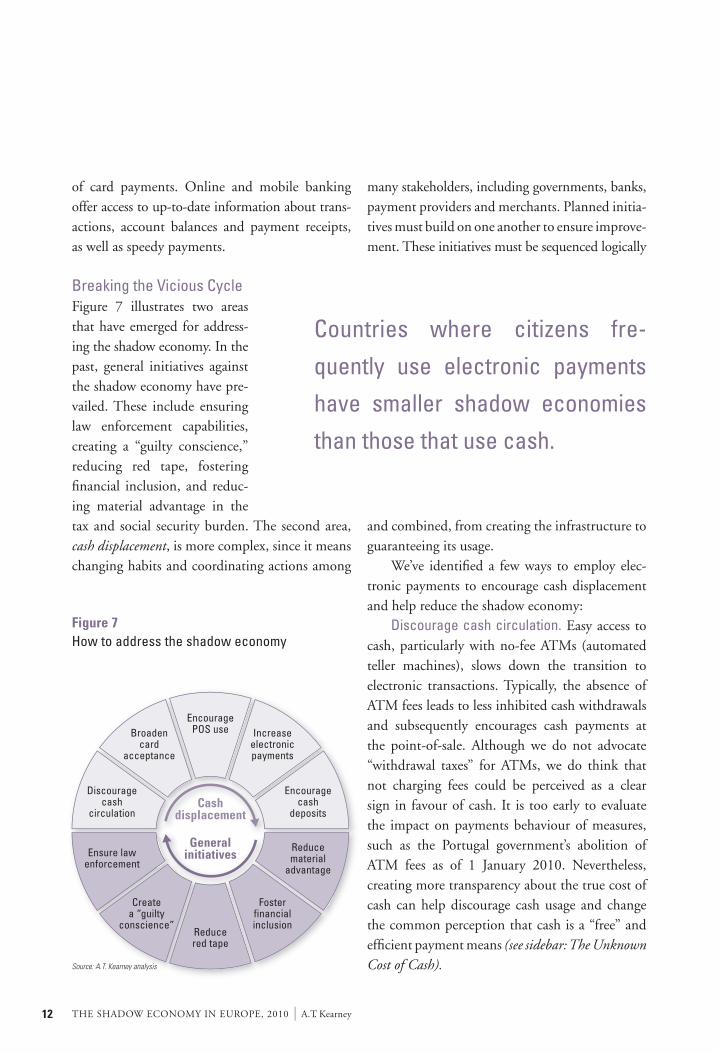
Countries where citizens fre-
quently use electronic payments
have smaller shadow economies
than those that use cash.
A.T. Kearney | THE SHADOW ECONOMY IN EUROPE, 2010 13
Broaden card acceptance. Credit and debit card acceptance is not yet a given in Europe. Even countries with a high penetration of POS termi-nals, such as Portugal or Turkey, have had issues with certain merchant categories (fast food and beauty spas in Portugal) or geographic areas (as is the case in Anatolia in eastern Turkey) that have been slow to adopt. Countries with more limited POS networks can take a first step toward provid-ing customers with non-cash options simply by making it easier to use cards. Industries with a high percentage of low-value payments and a large share of the shadow economy, such as bars and taxis, are good places to begin.
Encourage POS use. The average European makes up to 1,000 payments in a given year, 80 percent of them in cash. In particular, low-value payments (below €15) are almost exclusively paid for with cash. Creating incentives for people who use their cards in these situations, such as adding VAT discounts for card purchases and abolishing surcharges for card payments, are easy measures to change behavior. More sophisticated ways to encourage card use include value-added services at the POS or from the card. Barclaycard’s One-Pulse, for example, combines a contactless card for low-value payments, a credit card, and an Oys-ter card for London transit. In the medium term,
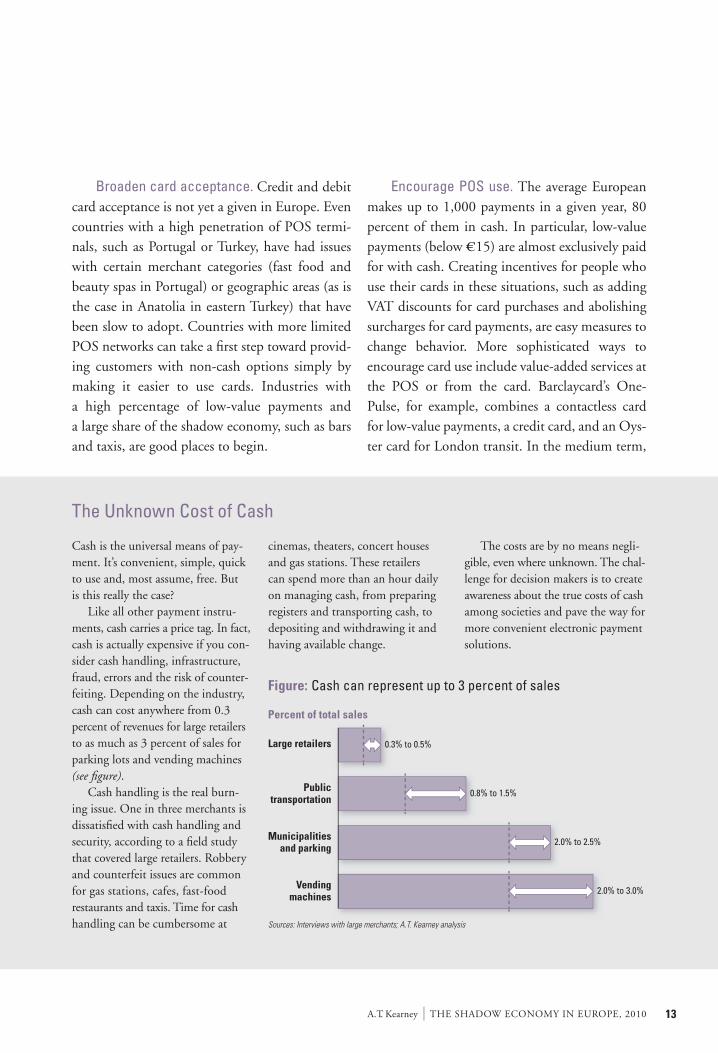
The Unknown Cost of Cash
Cash is the universal means of pay-ment. It’s convenient, simple, quick to use and, most assume, free. But is this really the case? Like all other payment instru-ments, cash carries a price tag. In fact, cash is actually expensive if you con-sider cash handling, infrastructure, fraud, errors and the risk of counter-feiting. Depending on the industry, cash can cost anywhere from 0.3 percent of revenues for large retailers to as much as 3 percent of sales for parking lots and vending machines (see figure). Cash handling is the real burn-ing issue. One in three merchants is dissatisfied with cash handling and security, according to a field study that covered large retailers. Robbery and counterfeit issues are common for gas stations, cafes, fast-food restaurants and taxis. Time for cash handling can be cumbersome at
cinemas, theaters, concert houses and gas stations. These retailers can spend more than an hour daily on managing cash, from preparing registers and transporting cash, to depositing and withdrawing it and having available change.
The costs are by no means negli-gible, even where unknown. The chal-lenge for decision makers is to create awareness about the true costs of cash among societies and pave the way for more convenient electronic payment solutions.
Figure: Cash can represent up to 3 percent of sales
Sources: Interviews with large merchants; A.T. Kearney analysis
Percent of total sales
2.0% to 3.0%
Large retailers
Publictransportation
Municipalitiesand parking
Vendingmachines
2.0% to 2.5%
0.8% to 1.5%
0.3% to 0.5%

THE SHADOW ECONOMY IN EUROPE, 2010 | A.T. Kearney14
increasing usage will depend on the ability to seg-ment clients based on their card-related behavior and to create campaigns that target increased usage in certain categories. Increase electronic payments. In any econ-omy, governments are among the largest initiators and recipients of payments. They can serve as role models by adopting electronic payments. Governments have many options, including man-dating that salary payments for public sector workers are made to checking accounts, that unemployment benefits or pensions are distrib-uted to pre-paid cards, that taxes and fines are paid online, and that cards or money transfers are used for all public sector purchases. South Korea, for example, is sending all government payments electronically and provides incentives for citizens and business partners to do the same. Between 1998 and 2002, electronic payments helped South Korea increase tax revenues from $46 billion to $76 billion. At the same time, South Korea even-tually cut costs by 90 percent, saving $23 million, as the program became more efficient. Encourage cash deposits. Few measures have been created to encourage depositing cash in
banks, yet countermeasures exist in some coun-tries. The fees that financial institutions in Brazil charge to deposit cash, for example, make it diffi-cult for the country to reduce the amount of cash in circulation, which in turn is a setback to other efforts against the shadow economy. Free cash deposits, the ability to make ATM deposits, and attractive interest rates on balances are steps to encourage cash displacement.
Lining Up for Action Governments aren’t powerless to recoup revenues lost to shadow economies. Public mandates to increase the use of electronic payments are proven ways to reduce the size and scope of a shadow economy. Banks and payment system companies can do their part by exploring commercially viable uses for electronic payments, identifying oppor-tunities for using prepaid cards instead of cash, encouraging small merchants and public officials to use payment systems, and continuing to improve the systems’ technology. Electronic payments can help countries increase revenues and reduce cash, the shadow economy’s key enabler. Reducing the shadow economy is an achievable task.
A.T. Kearney | THE SHADOW ECONOMY IN EUROPE, 2010 15
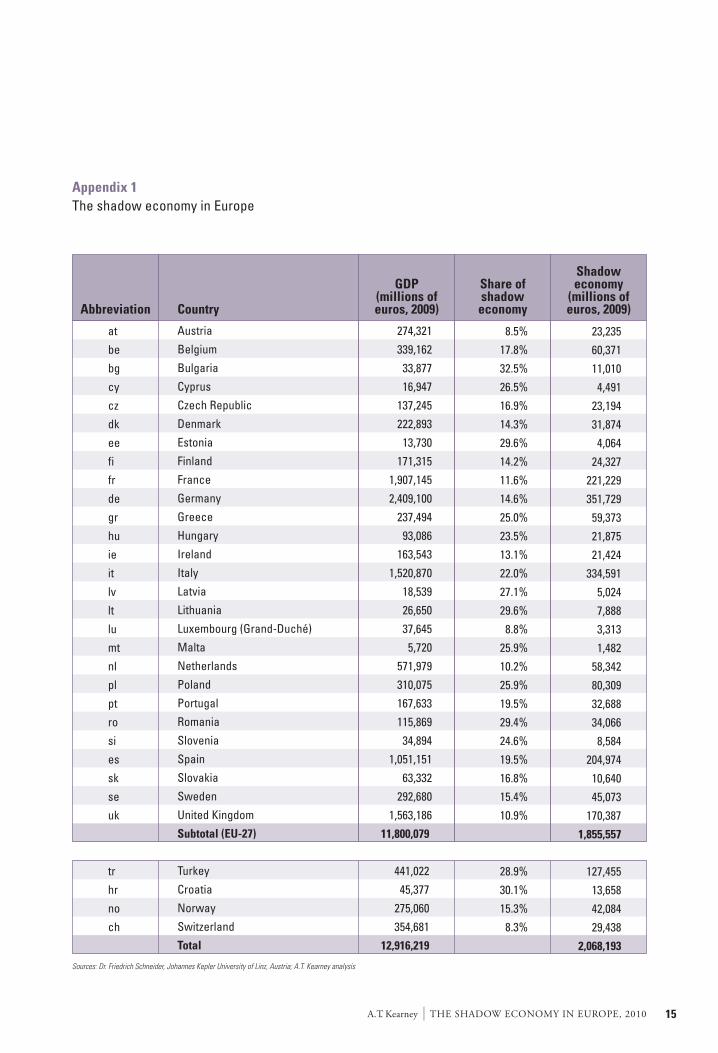
Appendix 1The shadow economy in Europe
GDP(millions ofeuros, 2009)CountryAbbreviation
Share ofshadow
economy
Shadoweconomy
(millions ofeuros, 2009)
Austria
Belgium
Bulgaria
Cyprus
Czech Republic
Denmark
Estonia
Finland
France
Germany
Greece
Hungary
Ireland
Italy
Latvia
Lithuania
Luxembourg (Grand-Duché)
Malta
Netherlands
Poland
Portugal
Romania
Slovenia
Spain
Slovakia
Sweden
United Kingdom
Subtotal (EU-27)
Turkey
Croatia
Norway
Switzerland
Total
274,321
339,162
33,877
16,947
137,245
222,893
13,730
171,315
1,907,145
2,409,100
237,494
93,086
163,543
1,520,870
18,539
26,650
37,645
5,720
571,979
310,075
167,633
115,869
34,894
1,051,151
63,332
292,680
1,563,186
11,800,079
441,022
45,377
275,060
354,681
12,916,219
at
be
bg
cy
cz
dk
ee
fi
fr
de
gr
hu
ie
it
lv
lt
lu
mt
nl
pl
pt
ro
si
es
sk
se
uk
tr
hr
no
ch
8.5%
17.8%
32.5%
26.5%
16.9%
14.3%
29.6%
14.2%
11.6%
14.6%
25.0%
23.5%
13.1%
22.0%
27.1%
29.6%
8.8%
25.9%
10.2%
25.9%
19.5%
29.4%
24.6%
19.5%
16.8%
15.4%
10.9%
28.9%
30.1%
15.3%
8.3%
23,235
60,371
11,010
4,491
23,194
31,874
4,064
24,327
221,229
351,729
59,373
21,875
21,424
334,591
5,024
7,888
3,313
1,482
58,342
80,309
32,688
34,066
8,584
204,974
10,640
45,073
170,387
1,855,557
127,455
13,658
42,084
29,438
2,068,193
Sources: Dr. Friedrich Schneider, Johannes Kepler University of Linz, Austria; A.T. Kearney analysis

THE SHADOW ECONOMY IN EUROPE, 2010 | A.T. Kearney16
Appendix 2
Shadow econom
y per industry sector in the five focus countries
GD
P(m
illions ofeuros, 2009)
Share ofshadow
economy
Shadoweconom
y(m
illions ofeuros, 2009)
Agriculture, hunting and forestry
Fishing
Mining and quarrying
Manufacturing
Electricity, gas and water supply
Construction
Hotels and restaurants
Transport, storage and comm
unication
Financial intermediation
Real estate, renting and business activities
Public administration and defense; com
pulsory social security
Education
Health and social w
ork
Other com
munity, social and personal service activities
Private households with em
ployed persons
Extra-territorial organizations and bodies
Total
Entertainment, m
assage, prostitution, household services, and other
Total shadow econom
y
26,518
1,374
5,409
245,303
34,835
95,554
166,300
60,482
110,751
81,929
356,068
103,644
75,544
93,349
46,861
16,9490
1,520,870
Section A
Section B
Section C
Section D
Section E
Section F
Section G
Section H
Section I
Section J
Section K
Section L
Section M
Section N
Section O
Section P
Section Q
14%8%0%
18%0%
27%
21%
22%
15%0%9%0%0%
14%
10%
13%5%
22%
3,587
1110
44,2350
25,847
34,487
13,088
16,9760
32,10400
12,625
4,648
2,1390
189,847
144,745
334,591
GD
P(m
illions ofeuros, 2009)
Share ofshadow
economy
GERM
AN
YITA
LY
Shadoweconom
y(m
illions ofeuros, 2009)
19,259
222
4,828
460,075
68,977
103,697
245,028
40,583
134,905
102,403
647,908
147,363
112,880
193,337
119,228
8,407-
2,409,100
11%5%0%9%0%
36%
18%
16%
10%0%5%0%0%9%8%
11%5%
15%
2,191110
43,6170
37,358
44,137
6,541
14,0690
30,71300
18,329
9,043
956
206,964
144,765
351,729
Sources: Dr. Friedrich Schneider, Johannes Kepler University of Linz, Austria; A.T. Kearney analysis
Wholesale and retail trade; repair of m
otor vehicles;personal and household goods
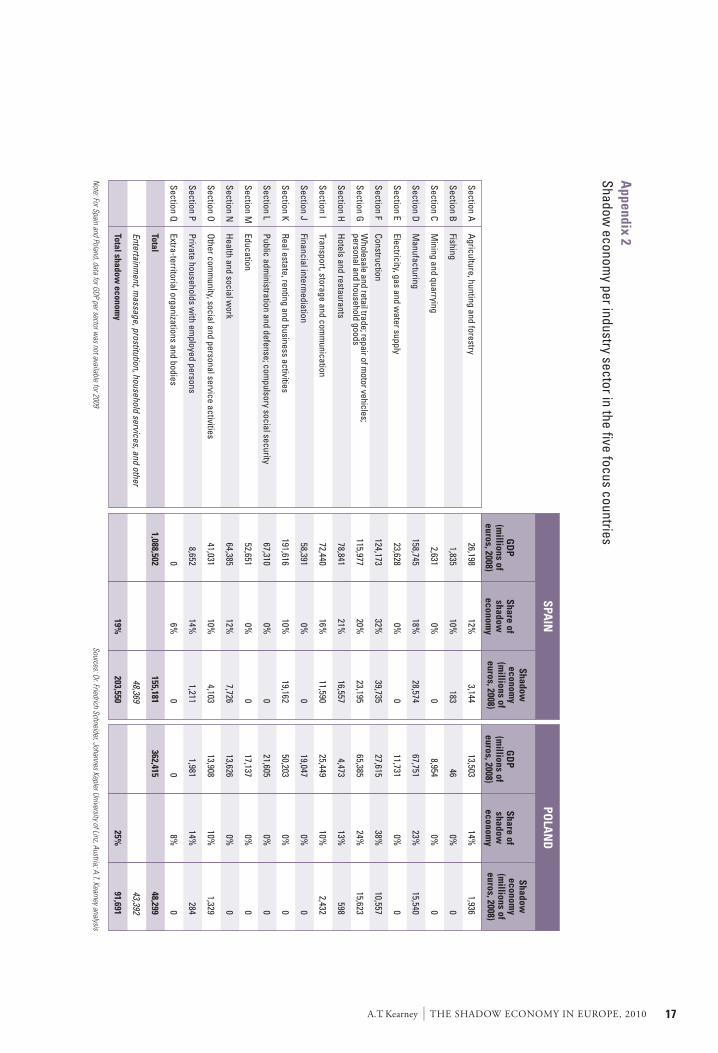
A.T. Kearney | THE SHADOW ECONOMY IN EUROPE, 2010 17
Appendix 2
Shadow econom
y per industry sector in the five focus countries
GD
P(m
illions ofeuros, 2008)
Share ofshadow
economy
Shadoweconom
y(m
illions ofeuros, 2008)
Agriculture, hunting and forestry
Fishing
Mining and quarrying
Manufacturing
Electricity, gas and water supply
Construction
Hotels and restaurants
Transport, storage and comm
unication
Financial intermediation
Real estate, renting and business activities
Public administration and defense; com
pulsory social security
Education
Health and social w
ork
Other com
munity, social and personal service activities
Private households with em
ployed persons
Extra-territorial organizations and bodies
Total
Entertainment, m
assage, prostitution, household services, and other
Total shadow econom
y
13,50346
8,954
67,751
11,731
27,615
65,385
4,473
25,449
19,047
50,203
21,605
17,137
13,626
13,908
1,9810
362,415
Section A
Section B
Section C
Section D
Section E
Section F
Section G
Section H
Section I
Section J
Section K
Section L
Section M
Section N
Section O
Section P
Section Q
14%0%0%
23%0%
38%
24%
13%
10%0%0%0%0%0%
10%
14%8%
25%
1,93600
15,5400
10,557
15,623
598
2,43200000
1,329
2840
48,299
43,392
91,691
GD
P(m
illions ofeuros, 2008)
Share ofshadow
economy
SPAIN
POLA
ND
Shadoweconom
y(m
illions ofeuros, 2008)
26,198
1,835
2,631
158,745
23,628
124,173
115,977
78,841
72,440
58,391
191,616
67,310
52,651
64,385
41,031
8,6520
1,088,502
12%
10%0%
18%0%
32%
20%
21%
16%0%
10%0%0%
12%
10%
14%6%
19%
3,144
1830
28,5740
39,735
23,195
16,557
11,5900
19,16200
7,726
4,103
1,2110
155,181
48,369
203,550
Note: For Spain and Poland, data for GDP per sector w
as not available for 2009Sources: Dr. Friedrich Schneider, Johannes Kepler University of Linz, Austria; A.T. Kearney analysis
Wholesale and retail trade; repair of m
otor vehicles;personal and household goods
THE SHADOW ECONOMY IN EUROPE, 2010 | A.T. Kearney18
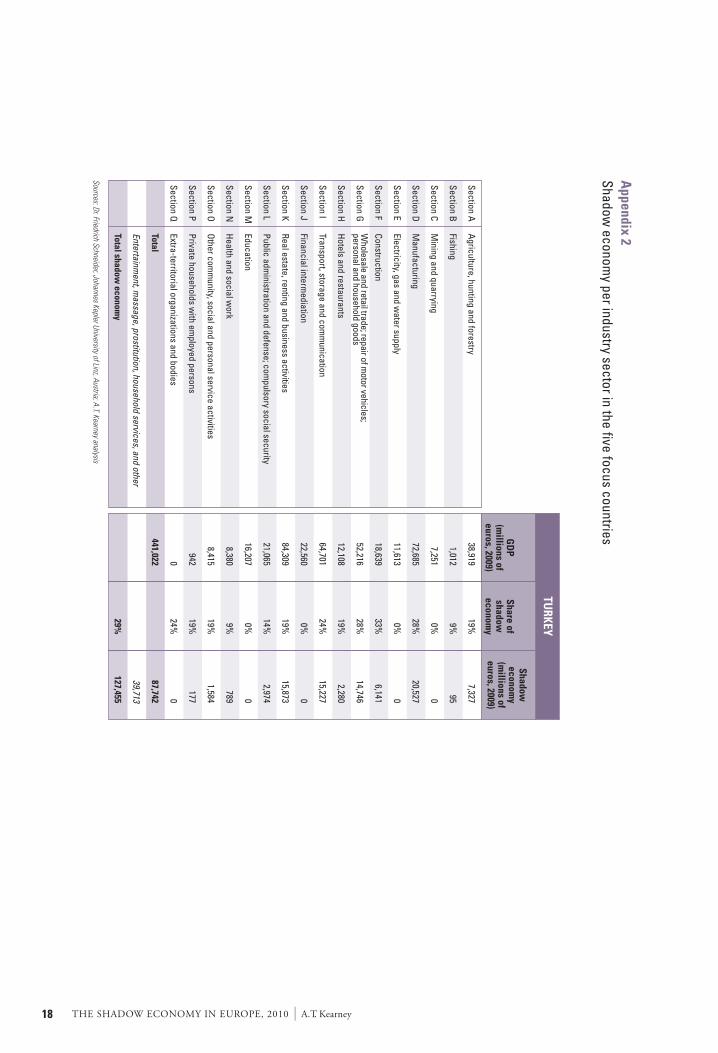
Appendix 2
Shadow econom
y per industry sector in the five focus countries
Agriculture, hunting and forestry
Fishing
Mining and quarrying
Manufacturing
Electricity, gas and water supply
Construction
Hotels and restaurants
Transport, storage and comm
unication
Financial intermediation
Real estate, renting and business activities
Public administration and defense; com
pulsory social security
Education
Health and social w
ork
Other com
munity, social and personal service activities
Private households with em
ployed persons
Extra-territorial organizations and bodies
Total
Entertainment, m
assage, prostitution, household services, and other
Total shadow econom
y
Section A
Section B
Section C
Section D
Section E
Section F
Section G
Section H
Section I
Section J
Section K
Section L
Section M
Section N
Section O
Section P
Section Q
GD
P(m
illions ofeuros, 2009)
Share ofshadow
economy
TURKEY
Shadoweconom
y(m
illions ofeuros, 2009)
38,919
1,012
7,251
72,685
11,613
18,639
52,216
12,108
64,701
22,560
84,309
21,065
16,207
8,380
8,415
9420
441,022
19%9%0%
28%0%
33%
28%
19%
24%0%
19%
14%0%9%
19%
19%
24%
29%
7,327950
20,5270
6,141
14,746
2,280
15,2270
15,873
2,9740
789
1,584
1770
87,742
39,713
127,455
Sources: Dr. Friedrich Schneider, Johannes Kepler University of Linz, Austria; A.T. Kearney analysis
Wholesale and retail trade; repair of m
otor vehicles;personal and household goods
A.T. Kearney is a global management consulting firm that uses strategic insight, tailored solutions and a collaborative working style to help clients achieve sustainable results. Since 1926, we have been trusted advisors on CEO-agenda issues to the world’s leading corporations across all major industries. A.T. Kearney’s offices are located in major business centers in 37 countries.
AMERICAS Atlanta | Boston | Chicago | Dallas | Detroit | Mexico City New York | San Francisco | São Paulo | Toronto | Washington, D.C.
EUROPE Amsterdam | Berlin | Brussels | Bucharest | Copenhagen Düsseldorf | Frankfurt | Helsinki | Kiev | Lisbon | Ljubljana | London Madrid | Milan | Moscow | Munich | Oslo | Paris | Prague | Rome Stockholm | Stuttgart | Vienna | Warsaw | Zurich
ASIA PACIFIC Bangkok | Beijing | Hong Kong | Jakarta | Kuala Lumpur Melbourne | Mumbai | New Delhi | Seoul | Shanghai | Singapore Sydney | Tokyo
MIDDLE EAST Abu Dhabi | Dubai | Johannesburg | Manama | Riyadh& AFRICA
For information on obtaining additional copies, permission to reprint or translate this work, and all other correspondence, please contact:
A.T. Kearney, Inc.
Marketing & Communications
222 West Adams Street
Chicago, Illinois 60606 U.S.A.
1 312 648 0111
email: [email protected]
www.atkearney.com
Copyright 2010, A.T. Kearney, Inc. All rights reserved. No part of this work may be reproduced in any form without written permission from the copyright holder. A.T. Kearney® is a registered mark of A.T. Kearney, Inc. A.T. Kearney, Inc. is an equal opportunity employer.
A.T. Kearney Korea LLC is a separate and independent legal entity operating under the A.T. Kearney name in Korea.

PDF ATK.1010.159