Embed Size (px)
Citation preview
THE SIMPLE ECONOMICS OF COMMODITY
PRICE SPECULATION
Christopher R. Knittel and Robert S. Pindyck
Massachusetts Institute of Technology
July 2013
Knittel and Pindyck (MIT) PRICE SPECULATION July 2013 1 / 32
Introduction
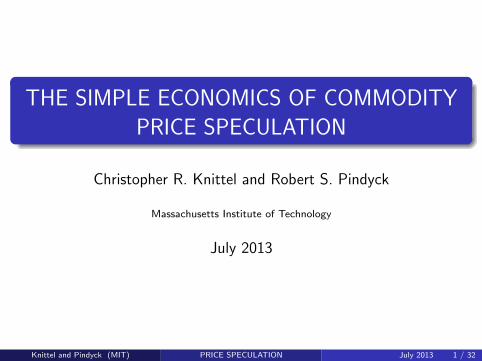
“Commodities have become an investment class: declines intheir prices may simply reflect the whims of speculators.”
The Economist, June 23, 2012.
“Federal legislation should bar pure oil speculators entirely fromcommodity exchanges in the United States.”
Joseph Kennedy II, N.Y. Times, April, 10, 2012.
Sharp increases in oil prices:
$40 per barrel in 2004 to $70 in 2006 to $140 in July 2008.Fell to $38 in early 2009, then increased to $110 in 2011.
Are “speculators” to blame? Should futures trading be limited?
Confusion over commodity price speculation and how it works.
We try to clarify the potential and actual effects of speculatorson commodity prices.
Focus on crude oil because it has received the most attention.
Knittel and Pindyck (MIT) PRICE SPECULATION July 2013 2 / 32
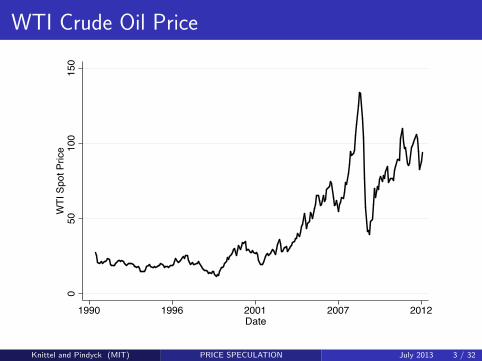
WTI Crude Oil Price
050
100
150
WTI
Spo
t Pric
e
1990 1996 2001 2007 2012Date
Knittel and Pindyck (MIT) PRICE SPECULATION July 2013 3 / 32
Outline
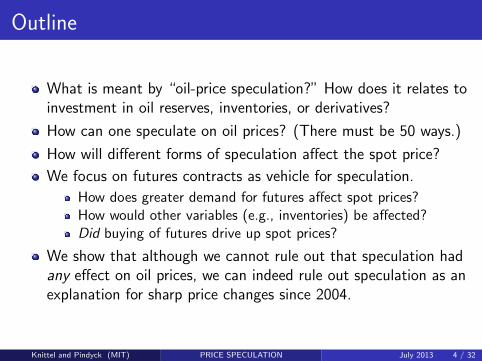
What is meant by “oil-price speculation?” How does it relates toinvestment in oil reserves, inventories, or derivatives?
How can one speculate on oil prices? (There must be 50 ways.)
How will different forms of speculation affect the spot price?
We focus on futures contracts as vehicle for speculation.
How does greater demand for futures affect spot prices?How would other variables (e.g., inventories) be affected?Did buying of futures drive up spot prices?
We show that although we cannot rule out that speculation hadany effect on oil prices, we can indeed rule out speculation as anexplanation for sharp price changes since 2004.
Knittel and Pindyck (MIT) PRICE SPECULATION July 2013 4 / 32
Related Research
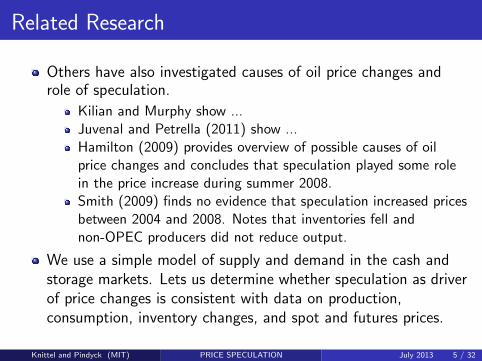
Others have also investigated causes of oil price changes androle of speculation.
Kilian and Murphy show ...Juvenal and Petrella (2011) show ...Hamilton (2009) provides overview of possible causes of oilprice changes and concludes that speculation played some rolein the price increase during summer 2008.Smith (2009) finds no evidence that speculation increased pricesbetween 2004 and 2008. Notes that inventories fell andnon-OPEC producers did not reduce output.
We use a simple model of supply and demand in the cash andstorage markets. Lets us determine whether speculation as driverof price changes is consistent with data on production,consumption, inventory changes, and spot and futures prices.
Knittel and Pindyck (MIT) PRICE SPECULATION July 2013 5 / 32
What Is “Oil Price Speculation?”
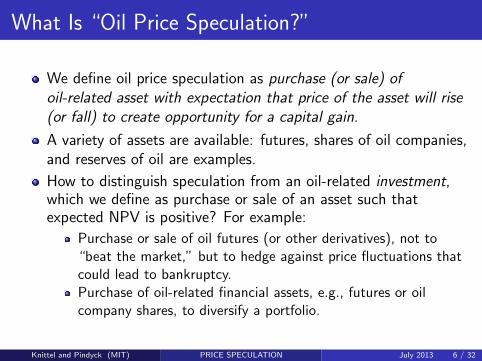
We define oil price speculation as purchase (or sale) ofoil-related asset with expectation that price of the asset will rise(or fall) to create opportunity for a capital gain.
A variety of assets are available: futures, shares of oil companies,and reserves of oil are examples.
How to distinguish speculation from an oil-related investment,which we define as purchase or sale of an asset such thatexpected NPV is positive? For example:
Purchase or sale of oil futures (or other derivatives), not to“beat the market,” but to hedge against price fluctuations thatcould lead to bankruptcy.Purchase of oil-related financial assets, e.g., futures or oilcompany shares, to diversify a portfolio.
Knittel and Pindyck (MIT) PRICE SPECULATION July 2013 6 / 32
Speculation vs. Investment
Difficult or impossible to differentiate between speculativeactivity and investment.
What we call an “investment” and what we call “speculation”are likely to be the same thing, or at best ambiguous.
What oil price speculation is not: a shift in fundamentals, e.g.,shift in consumption demand or supply (e.g., strike or hurricanethat shuts down some output).
Want to distinguish that from a price change caused byspeculators or investors betting on a change in price not alreadyaccounted for by expected shifts in demand and supply.
Knittel and Pindyck (MIT) PRICE SPECULATION July 2013 7 / 32
How to Speculate on Oil Prices
Buy Stocks of Oil Companies. This is most common way tospeculate (or invest) in oil.
If speculators become “bullish” and buy oil company stocks,driving up stock prices, what would it do to price of oil?
In the short run, would have no effect on oil production orconsumption, and thus no effect on price of oil.In longer run, stock prices of oil companies will be higher thanotherwise, lowering companies’ cost of capital.Would encourage investment in exploration and development,and eventually lead to more oil production and lower prices.
Knittel and Pindyck (MIT) PRICE SPECULATION July 2013 8 / 32
How to Speculate on Oil Prices
Hold Physical Oil in situ. Can “speculate” on higher prices bykeeping the oil in the ground rather than producing it.Something oil companies can do, but not hedge funds.Depends on whether reserves are undeveloped or developed.
Undeveloped reserves have been discovered, but productionrequires large sunk cost investments in development. To “bet”on price increase, oil company could delay development.What would happen? Lower production and higher prices —but only after one or two years.Evidence? Normally rising oil prices increase the return fromdevelopment, and lead to rising rig rental rates and rigutilization. Were rig rates and utilization instead falling?Developed reserves have production wells, etc. needed toproduce oil. But once reserve is developed and productionbegins, rate of production cannot be easily varied.So this is not an economical way to speculate.
Knittel and Pindyck (MIT) PRICE SPECULATION July 2013 9 / 32
How to Speculate on Oil Prices
Hold Physical Oil Above Ground. Oil producers and consumersnormally hold inventories, e.g., to facilitate production anddelivery scheduling and avoid stockouts.In principle, inventories could be held to speculate: Buy oil andstore it in tanks, oil tankers, etc.Not something hedge funds or mutual funds can do.Were oil companies (or industrial consumers of oil) accumulating“excess” inventories during periods of suspected speculation?Can test for this using futures price data.
Hold Oil Futures. The easiest, lowest cost, and most commonway to speculate on oil prices.
very low transaction costs, even for individual investor.Important means of investment for hedge funds, some ETFs,mutual funds, and also individuals.Most common means for oil price speculation.
Knittel and Pindyck (MIT) PRICE SPECULATION July 2013 10 / 32
Framework
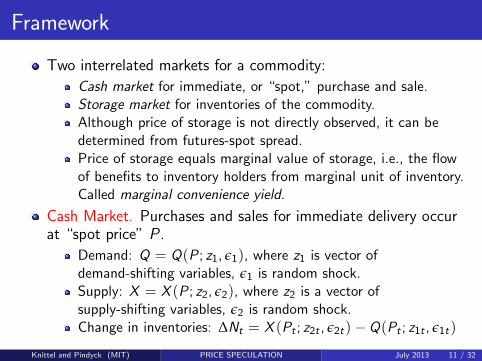
Two interrelated markets for a commodity:
Cash market for immediate, or “spot,” purchase and sale.Storage market for inventories of the commodity.Although price of storage is not directly observed, it can bedetermined from futures-spot spread.Price of storage equals marginal value of storage, i.e., the flowof benefits to inventory holders from marginal unit of inventory.Called marginal convenience yield.
Cash Market. Purchases and sales for immediate delivery occurat “spot price” P .
Demand: Q = Q(P; z1, ε1), where z1 is vector ofdemand-shifting variables, ε1 is random shock.Supply: X = X (P; z2, ε2), where z2 is a vector ofsupply-shifting variables, ε2 is random shock.Change in inventories: ∆Nt = X (Pt ; z2t , ε2t)−Q(Pt ; z1t , ε1t)
Knittel and Pindyck (MIT) PRICE SPECULATION July 2013 11 / 32
Framework (Con’t)
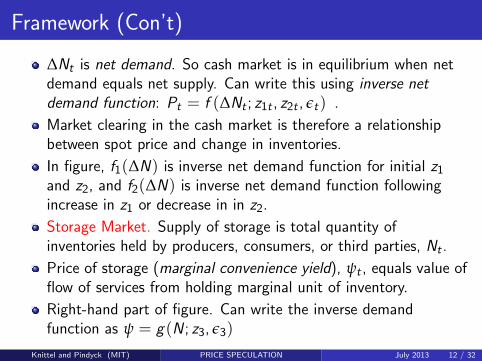
∆Nt is net demand. So cash market is in equilibrium when netdemand equals net supply. Can write this using inverse netdemand function: Pt = f (∆Nt ; z1t , z2t , εt) .
Market clearing in the cash market is therefore a relationshipbetween spot price and change in inventories.
In figure, f1(∆N) is inverse net demand function for initial z1and z2, and f2(∆N) is inverse net demand function followingincrease in z1 or decrease in in z2.
Storage Market. Supply of storage is total quantity ofinventories held by producers, consumers, or third parties, Nt .
Price of storage (marginal convenience yield), ψt , equals value offlow of services from holding marginal unit of inventory.
Right-hand part of figure. Can write the inverse demandfunction as ψ = g(N ; z3, ε3)
Knittel and Pindyck (MIT) PRICE SPECULATION July 2013 12 / 32
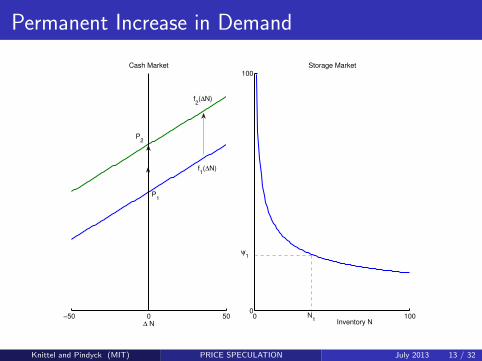
Permanent Increase in Demand
−50 0 50
Cash Market
∆ N0 100
0
100Storage Market
Inventory N
P1
f1(∆N)
N1
P2
f2(∆N)
ψ1
Knittel and Pindyck (MIT) PRICE SPECULATION July 2013 13 / 32
Spot Price, Futures Price, Convenience Yield
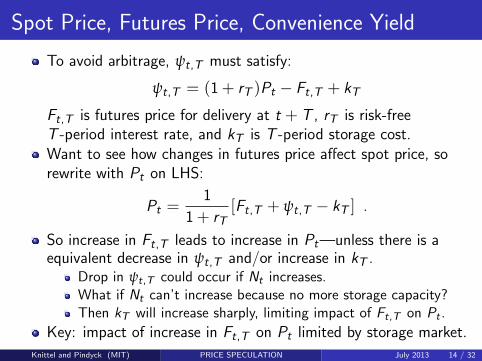
To avoid arbitrage, ψt,T must satisfy:
ψt,T = (1 + rT )Pt − Ft,T + kT
Ft,T is futures price for delivery at t + T , rT is risk-freeT -period interest rate, and kT is T -period storage cost.Want to see how changes in futures price affect spot price, sorewrite with Pt on LHS:
Pt =1
1 + rT[Ft,T + ψt,T − kT ] .
So increase in Ft,T leads to increase in Pt—unless there is aequivalent decrease in ψt,T and/or increase in kT .
Drop in ψt,T could occur if Nt increases.What if Nt can’t increase because no more storage capacity?Then kT will increase sharply, limiting impact of Ft,T on Pt .
Key: impact of increase in Ft,T on Pt limited by storage market.
Knittel and Pindyck (MIT) PRICE SPECULATION July 2013 14 / 32
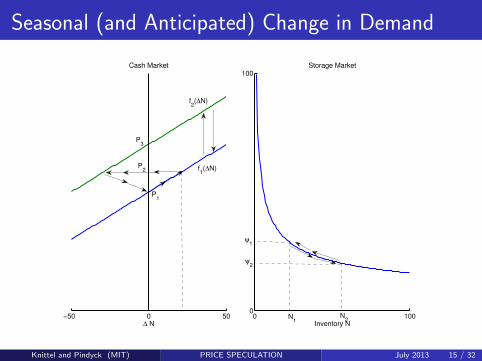
Seasonal (and Anticipated) Change in Demand
−50 0 50
Cash Market
∆ N0 100
0
100Storage Market
Inventory N
P1
P2
P3
f1(∆N)
f2(∆N)
N1
N2
ψ1
ψ2
Knittel and Pindyck (MIT) PRICE SPECULATION July 2013 15 / 32
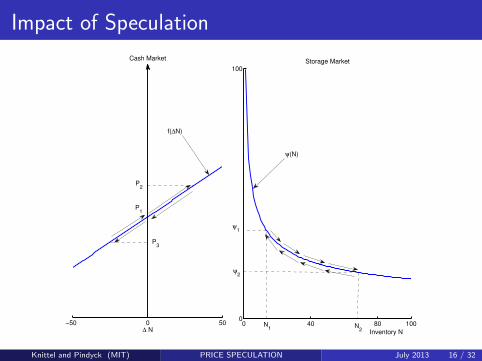
Impact of Speculation
−50 0 50
Cash Market
∆ N0 40 80 100
0
100Storage Market
Inventory NN
1 N2
ψ1
ψ2
P1
P2
ψ(N)
f(∆N)
P3
Knittel and Pindyck (MIT) PRICE SPECULATION July 2013 16 / 32
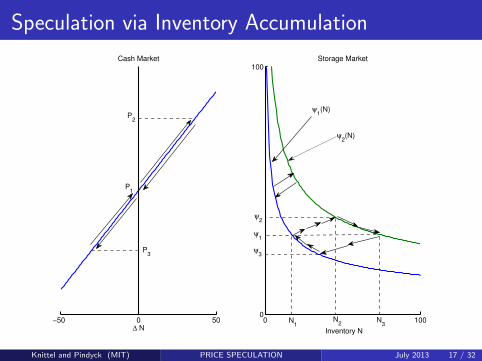
Speculation via Inventory Accumulation
−50 0 50
Cash Market
∆ N0 100
0
100Storage Market
Inventory N
P2
P1
P3
N1
N2
N3
ψ1
ψ2
ψ3
ψ1(N)
ψ2(N)
Knittel and Pindyck (MIT) PRICE SPECULATION July 2013 17 / 32
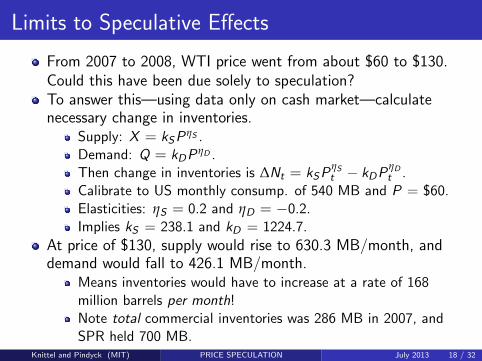
Limits to Speculative Effects
From 2007 to 2008, WTI price went from about $60 to $130.Could this have been due solely to speculation?To answer this—using data only on cash market—calculatenecessary change in inventories.
Supply: X = kSPηS .
Demand: Q = kDPηD .
Then change in inventories is ∆Nt = kSPηSt − kDP
ηDt .
Calibrate to US monthly consump. of 540 MB and P = $60.Elasticities: ηS = 0.2 and ηD = −0.2.Implies kS = 238.1 and kD = 1224.7.
At price of $130, supply would rise to 630.3 MB/month, anddemand would fall to 426.1 MB/month.
Means inventories would have to increase at a rate of 168million barrels per month!Note total commercial inventories was 286 MB in 2007, andSPR held 700 MB.
Knittel and Pindyck (MIT) PRICE SPECULATION July 2013 18 / 32
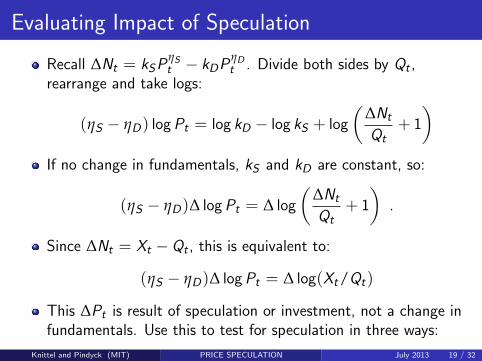
Evaluating Impact of Speculation
Recall ∆Nt = kSPηSt − kDP
ηDt . Divide both sides by Qt ,
rearrange and take logs:
(ηS − ηD) log Pt = log kD − log kS + log
(∆Nt
Qt+ 1
)If no change in fundamentals, kS and kD are constant, so:
(ηS − ηD)∆ log Pt = ∆ log
(∆Nt
Qt+ 1
).
Since ∆Nt = Xt − Qt , this is equivalent to:
(ηS − ηD)∆ log Pt = ∆ log(Xt/Qt)
This ∆Pt is result of speculation or investment, not a change infundamentals. Use this to test for speculation in three ways:
Knittel and Pindyck (MIT) PRICE SPECULATION July 2013 19 / 32
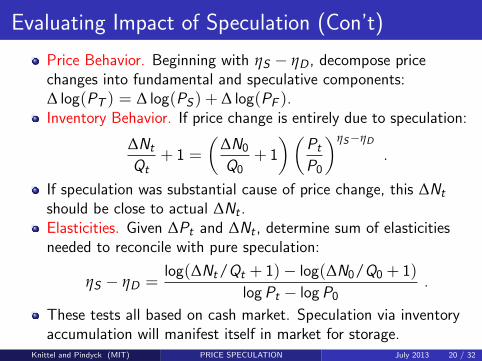
Evaluating Impact of Speculation (Con’t)
Price Behavior. Beginning with ηS − ηD , decompose pricechanges into fundamental and speculative components:∆ log(PT ) = ∆ log(PS ) + ∆ log(PF ).Inventory Behavior. If price change is entirely due to speculation:
∆Nt
Qt+ 1 =
(∆N0
Q0+ 1
)(Pt
P0
)ηS−ηD
.
If speculation was substantial cause of price change, this ∆Nt
should be close to actual ∆Nt .Elasticities. Given ∆Pt and ∆Nt , determine sum of elasticitiesneeded to reconcile with pure speculation:
ηS − ηD =log(∆Nt/Qt + 1)− log(∆N0/Q0 + 1)
log Pt − log P0.
These tests all based on cash market. Speculation via inventoryaccumulation will manifest itself in market for storage.
Knittel and Pindyck (MIT) PRICE SPECULATION July 2013 20 / 32
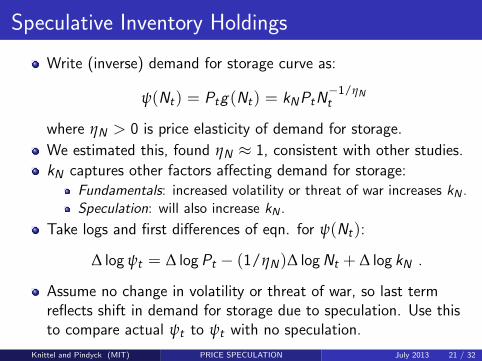
Speculative Inventory Holdings
Write (inverse) demand for storage curve as:
ψ(Nt) = Ptg(Nt) = kNPtN−1/ηNt
where ηN > 0 is price elasticity of demand for storage.
We estimated this, found ηN ≈ 1, consistent with other studies.
kN captures other factors affecting demand for storage:Fundamentals: increased volatility or threat of war increases kN .Speculation: will also increase kN .
Take logs and first differences of eqn. for ψ(Nt):
∆ log ψt = ∆ log Pt − (1/ηN)∆ log Nt + ∆ log kN .
Assume no change in volatility or threat of war, so last termreflects shift in demand for storage due to speculation. Use thisto compare actual ψt to ψt with no speculation.
Knittel and Pindyck (MIT) PRICE SPECULATION July 2013 21 / 32
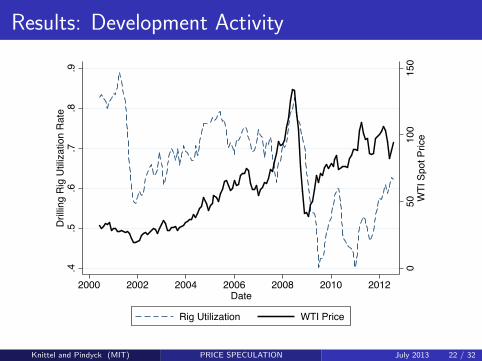
Results: Development Activity
050
100
150
WTI
Spo
t Pric
e
.4.5
.6.7
.8.9
Dril
ling
Rig
Util
izat
ion
Rat
e
2000 2002 2004 2006 2008 2010 2012Date
Rig Utilization WTI Price
Knittel and Pindyck (MIT) PRICE SPECULATION July 2013 22 / 32
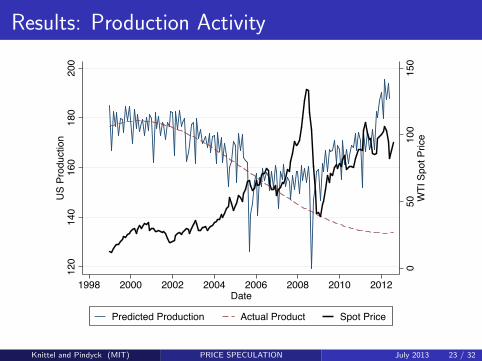
Results: Production Activity
050
100
150
WTI
Spo
t Pric
e
120
140
160
180
200
US
Prod
uctio
n
1998 2000 2002 2004 2006 2008 2010 2012Date
Predicted Production Actual Product Spot Price
Knittel and Pindyck (MIT) PRICE SPECULATION July 2013 23 / 32
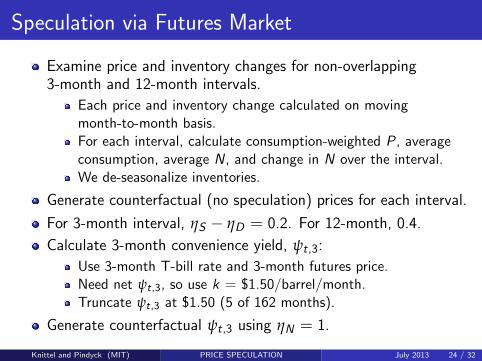
Speculation via Futures Market
Examine price and inventory changes for non-overlapping3-month and 12-month intervals.
Each price and inventory change calculated on movingmonth-to-month basis.For each interval, calculate consumption-weighted P, averageconsumption, average N, and change in N over the interval.We de-seasonalize inventories.
Generate counterfactual (no speculation) prices for each interval.
For 3-month interval, ηS − ηD = 0.2. For 12-month, 0.4.
Calculate 3-month convenience yield, ψt,3:
Use 3-month T-bill rate and 3-month futures price.Need net ψt,3, so use k = $1.50/barrel/month.Truncate ψt,3 at $1.50 (5 of 162 months).
Generate counterfactual ψt,3 using ηN = 1.
Knittel and Pindyck (MIT) PRICE SPECULATION July 2013 24 / 32
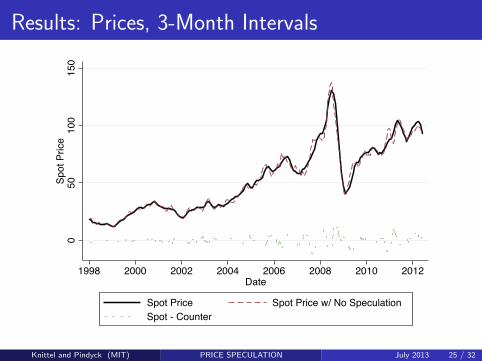
Results: Prices, 3-Month Intervals
050
100
150
Spot
Pric
e
1998 2000 2002 2004 2006 2008 2010 2012Date
Spot Price Spot Price w/ No SpeculationSpot - Counter
Knittel and Pindyck (MIT) PRICE SPECULATION July 2013 25 / 32
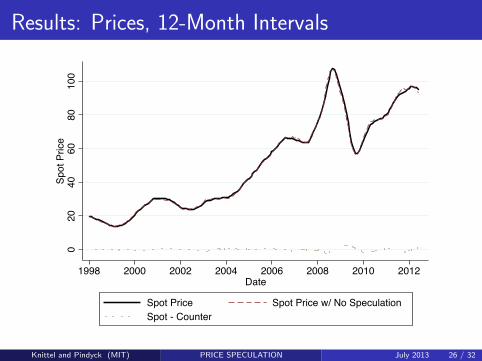
Results: Prices, 12-Month Intervals
020
4060
8010
0Sp
ot P
rice
1998 2000 2002 2004 2006 2008 2010 2012Date
Spot Price Spot Price w/ No SpeculationSpot - Counter
Knittel and Pindyck (MIT) PRICE SPECULATION July 2013 26 / 32
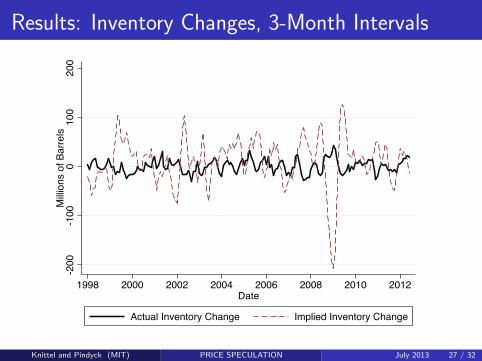
Results: Inventory Changes, 3-Month Intervals
-200
-100
010
020
0M
illion
s of
Bar
rels
1998 2000 2002 2004 2006 2008 2010 2012Date
Actual Inventory Change Implied Inventory Change
Knittel and Pindyck (MIT) PRICE SPECULATION July 2013 27 / 32
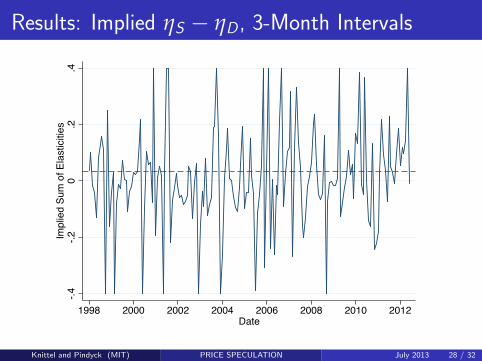
Results: Implied ηS − ηD , 3-Month Intervals
-.4-.2
0.2
.4Im
plie
d Su
m o
f Ela
stic
ities
1998 2000 2002 2004 2006 2008 2010 2012Date
Knittel and Pindyck (MIT) PRICE SPECULATION July 2013 28 / 32
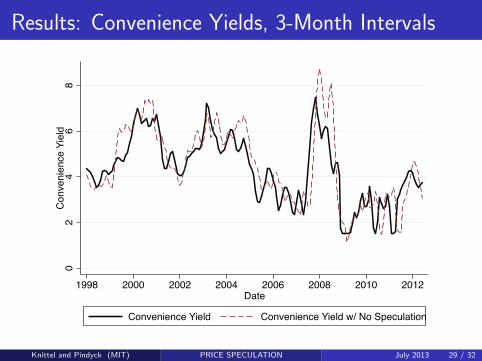
Results: Convenience Yields, 3-Month Intervals
02
46
8C
onve
nien
ce Y
ield
1998 2000 2002 2004 2006 2008 2010 2012Date
Convenience Yield Convenience Yield w/ No Speculation
Knittel and Pindyck (MIT) PRICE SPECULATION July 2013 29 / 32
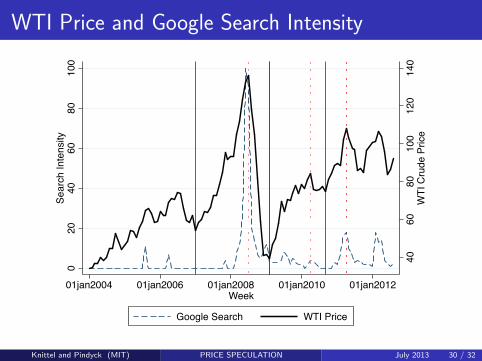
WTI Price and Google Search Intensity
4060
8010
012
014
0W
TI C
rude
Pric
e
020
4060
8010
0Se
arch
Inte
nsity
01jan2004 01jan2006 01jan2008 01jan2010 01jan2012Week
Google Search WTI Price
Knittel and Pindyck (MIT) PRICE SPECULATION July 2013 30 / 32
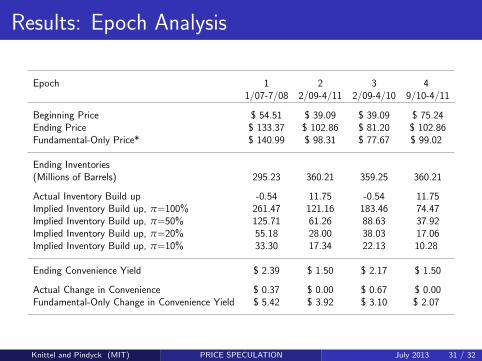
Results: Epoch Analysis
Epoch 1 2 3 41/07-7/08 2/09-4/11 2/09-4/10 9/10-4/11
Beginning Price $ 54.51 $ 39.09 $ 39.09 $ 75.24Ending Price $ 133.37 $ 102.86 $ 81.20 $ 102.86Fundamental-Only Price* $ 140.99 $ 98.31 $ 77.67 $ 99.02
Ending Inventories(Millions of Barrels) 295.23 360.21 359.25 360.21
Actual Inventory Build up -0.54 11.75 -0.54 11.75Implied Inventory Build up, π=100% 261.47 121.16 183.46 74.47Implied Inventory Build up, π=50% 125.71 61.26 88.63 37.92Implied Inventory Build up, π=20% 55.18 28.00 38.03 17.06Implied Inventory Build up, π=10% 33.30 17.34 22.13 10.28
Ending Convenience Yield $ 2.39 $ 1.50 $ 2.17 $ 1.50
Actual Change in Convenience $ 0.37 $ 0.00 $ 0.67 $ 0.00Fundamental-Only Change in Convenience Yield $ 5.42 $ 3.92 $ 3.10 $ 2.07
Knittel and Pindyck (MIT) PRICE SPECULATION July 2013 31 / 32
Conclusions
Simple model of cash and storage markets can be used to assessspeculation as driver of price changes.
Can’t rule out speculation had any effect on oil prices, but:Can rule out speculation caused sharp price changes after 2004.Unless one believes ηS and ηD ≈ 0, inventories and futures-spotspreads inconsistent with speculation as significant driver ofprices.If anything, speculation had slight stabilizing effect on prices.
Simplicity of our approach has limitations:Yields results that are qualitative in nature.Can’t estimate specific fraction of a ∆P due to speculation.Instead, conclude any effects of speculation very small.Why not use equations of our model to get precise estimates?Because model is too simple.
Finally, can’t distinguish “speculation” from “investment.”
Knittel and Pindyck (MIT) PRICE SPECULATION July 2013 32 / 32