Embed Size (px)
Citation preview

540
The SingScore: a macroinvertebrate biotic index
The Singscore: a macroinvertebrate biotic index for assessing the health of Singapore’s streams and canals
Tanya J. Blakely1, 2*, Hans S. Eikaas3, 4 & J.S. Harding2
Abstract. Worldwide, lotic ecosystems have been greatly modified by urbanisation, which has resulted in the impairment of physico-chemical conditions and the degradation of benthic communities. Singapore represents one of the most densely populated and urbanised nations globally, with more than 7,000 people per km2. Despite this high degree of urbanisation, relatively large forested areas remain in the Central Catchment Nature Reserve (CCNR) in the centre of the country. Thus, Singapore’s lotic systems range from highly-impacted concreted canals in residential and commercial areas, to mildly-impacted, sand-dominated and forested streams within the CCNR. Although the use of macroinvertebrate biotic indices has a long history in freshwater ecology and they are now widely established in monitoring regimes around the world, few biotic indices have been developed for the tropics. This is particularly the case for Southeast Asia. We present the SingScore, a new biotic index developed for measuring the health of Singapore’s lotic ecosystems using stream macroinvertebrates. We conducted extensive surveys of the macroinvertebrate communities inhabiting 47 study sites within streams, rivers and canals throughout Singapore’s mainland, and measured a suite of physical and chemical parameters at all sites. We collected 59,116 macroinvertebrates, belonging to 74 different taxonomic groups (68 families and 6 higher taxa). Using multivariate ordination techniques and weighted averaging, we assigned tolerance scores (ranging from 1: pollution tolerant; to 10: pollution sensitive) to each of the 74 macroinvertebrate taxa. The SingScore was then calculated by summing the tolerance scores of all taxa present at a site and dividing by the number of taxa present at that site. The SingScore was multiplied by a constant of 20 to give SingScores between 0 and 200. We propose four likely water quality categories for running waters in Singapore: Poor (SingScore < 80), Fair (80–99), Good (100–119) and Excellent (120+). We envisage that the SingScore will enable more accurate monitoring of the health of Singapore’s streams, rivers and canals.
Key words. canonical correspondence analysis; macroinvertebrates; stream health; tropics; urbanisation; weighted averaging
RAFFLES BULLETIN OF ZOOLOGY 62: 540–548Date of publication: 25 July 2014http://zoobank.org/urn:lsid:zoobank.org:pub:8994F28C-1D6D-42AF-8217-C932422ABB5F
© National University of SingaporeISSN 2345-7600 (electronic) | ISSN 0217-2445 (print)
1Boffa Miskell, PO Box 110, Christchurch 8053, New Zealand2School of Biological Sciences, University of Canterbury, Private Bag 4800, Christchurch, New Zealand; Email: [email protected] (TJB) (*corresponding author)3The Public Utilities Board Singapore, 40 Scotts Road, Environment Building #15-01, 228231 Singapore4DHI Water & Environment (S) Pte, Ltd., 1 Clean Loop, #03-05 CleanTech One, 637141 Singapore
Conservation & Ecology
INTRODUCTION
Stream ecosystems worldwide are subjected to extensive modification through human activities and developments, such as urbanisation, ultimately leading to poorer water quality and ecosystem health. In many regions, the quality of waterways, or stream health, has been assessed by monitoring a range of water chemistry parameters. Although water chemistry is widely accepted internationally as a means of determining the condition of a waterway, it can vary markedly, both daily and seasonally, and episodic events can be missed by spot sampling programmes. Thus, in order to determine accurate trends in waterway health, water chemistry data need to be collected frequently and over long periods. However,
this can be time consuming and expensive, especially if numerous parameters are measured.
Conversely, many macroinvertebrates live most of their lives in freshwaters, and their diversity, omnipresence, and sensitivity to environmental stressors, including organic and inorganic pollutants, can make them effective estimators of overall, integrated water quality (Rosenberg & Resh, 1993). Macroinvertebrates can be used to calculate many types of indices, including diversity, dissimilarity, multimetric, and biotic indices. Biotic indices differ from diversity, dissimilarity, and multimetric indices in that they are a numerical estimation of stream health based on the tolerance or sensitivity of macroinvertebrates to an environmental gradient (e.g., organic or inorganic pollution) (Rosenberg & Resh, 1993). However, as biotic indices are based on local or indigenous macroinvertebrates, they are usually specific to the geographical area sampled and it is therefore often inappropriate to fit biotic indices developed elsewhere to locally encountered communities.
The use of macroinvertebrates as stream health indicators has a long history in freshwater ecology (Kolkwitz and Marsson, 1902) and macroinvertebrate biotic indices are now widely established in monitoring regimes around the world (e.g.,
541
RAFFLES BULLETIN OF ZOOLOGY 2014
Biological Monitoring Working Party, 1978; Stark, 1985; Hilsenhoff, 1988; Chessman, 1995, 2003; Simpson & Norris, 2000; Mustow, 2002; Davy-Bowker et al., 2005; Hued & de los Ángeles Bistoni, 2005). However, few biotic indices have been developed for the tropics, particularly Southeast Asia. Nevertheless, the Biological Monitoring Working Party (BMWP) Index widely used in the United Kingdom has been applied in some Asian countries, including India (De Zwart & Trivedi, 1994) and Thailand (Mustow, 2002).
In 2008, the Public Utilities Board (PUB) of Singapore (the national water agency) saw the need for a macroinvertebrate biotic index specific to Singapore’s running waters in order to monitor the long-term health of streams and canals, and to provide a tool for assessing ecosystem recovery of canals following restoration projects. Here we present the results of a PUB-funded research project to develop a robust macroinvertebrate biotic index for assessing the ecosystem health of Singapore’s streams and canals.
METHODS
Study sites. Singapore is a highly populated (> 5.0 million), but small (approx. 723 km2) island-nation, located 137 km north of the equator (1°18' N 103°50' E) and immediately south of the Malay Peninsula. Its climate is typical of equatorial-tropical regions, with relatively constant temperature, high humidity and high annual rainfall (mean annual rainfall, 2375 mm; Corlett, 1992). Singapore has a multitude of lotic ecosystems including about 20 small, forested streams within the Central Catchment Nature Reserve (CCNR), and a complex network of larger concrete canals and smaller drains. Many of these waterways are highly modified as storm-water drainage networks for the ever expanding urban areas. More than half of Singapore is urbanised, and many of the inland swamps that once occurred over much of the country have been filled and the majority of the larger streams have been impounded to create drinking water reservoirs (Corlett, 1992). Despite this enormous pressure from urban development on the main island, a few sand-dominated ‘natural’ streams still remain within the approximately 600 ha of rainforest of the CCNR (Corlett, 1992; National Parks Board, 2010). However, outside the CCNR the landscape has largely been converted from once abundant, lowland dipterocarp forest, to what is now dominated by residential and commercial developments (Corlett, 1992), interlaced with over 7000 km of concrete drains and canals.
Many of these lotic systems are linked to reservoirs, which are managed by the PUB for the provision of domestic and commercial water supplies. In 2010, there were 16 reservoirs on mainland Singapore, of which four are within the CCNR (i.e., Upper Seletar, Upper Peirce, Lower Peirce and MacRitchie Reservoirs). These CCNR reservoirs are connected via a complex network of concrete canals, water channels, or transfer pipes that transport water around much of Singapore. Many of these reservoirs were constructed more than 50 years ago by damming rivers and swamplands, and only one un-impounded freshwater system remained within the CCNR in 2010: the Nee Soon Swamp Forest, located
southeast of Upper Seletar Reservoir. This lotic system is considered to be of high conservation importance, as it provides habitat for a number of unique aquatic species. The remaining CCNR forested streams flowed into Upper Seletar, Upper Pierce, Lower Pierce and MacRitchie Reservoirs and were small (< 2m wide) and short (i.e., the longest stream was only 3.6 km long, and the shortest was just 116 m long). Nevertheless, the majority of Singapore’s waterways flowed through urban and industrial areas, and were highly modified stormwater canals of uniform flow (dominated by runs) and shape, with concrete walls and beds.
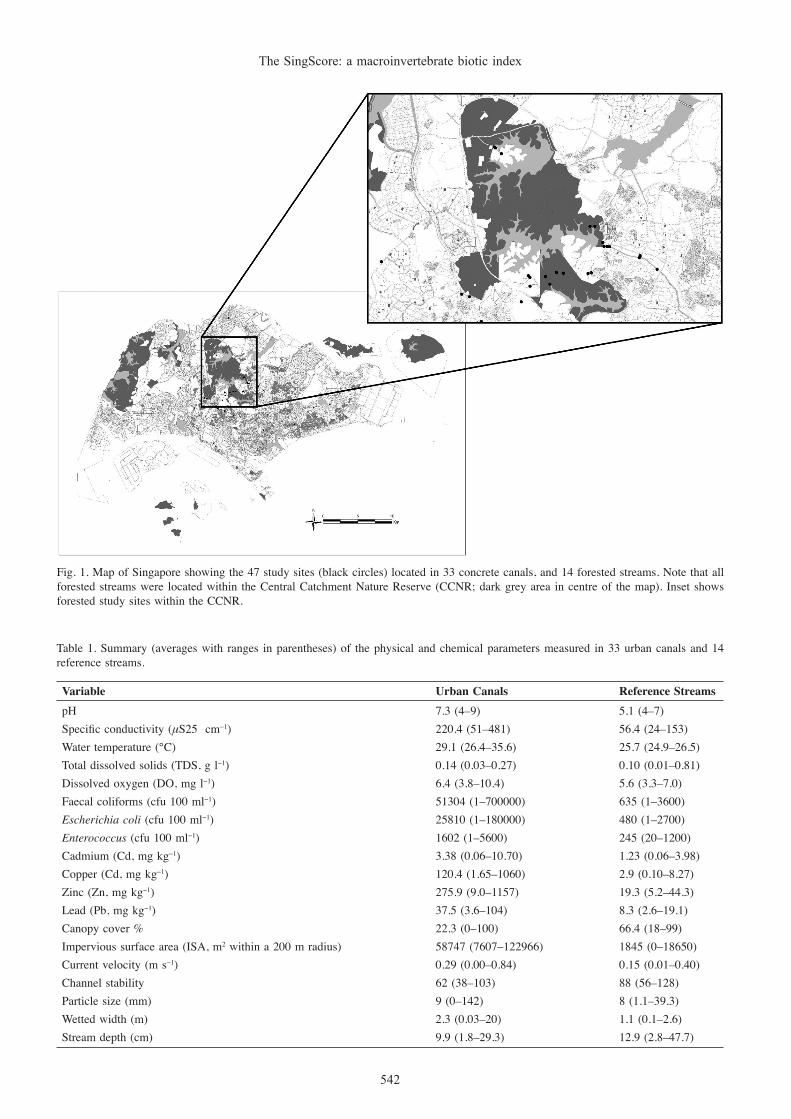
Survey methods. Physico-chemical characteristics, and macroinvertebrate communities, were surveyed once at each of 47 sites located on Singapore’s main island between August 2008 and March 2009 (Fig. 1). At each site, a sampling reach about 10× the wetted width of the stream channel was established.
Thirty-three of the study sites were concrete canals and 14 sites were relatively natural, forested streams (hereafter termed ‘reference streams’) within the CCNR. Although all sites could be placed into one of these two categories they encompassed a wide range of physical and chemical characteristics (Table 1). For example, urban canals varied in size from very small drains to large concrete “rivers” such as the upper reaches of the Rochor Canal and the Kallang River. The natural water courses sampled were sand-dominated streams flowing into MacRitchie, Upper Seletar, Upper Peirce and Lower Peirce Reservoirs, and the few remaining un-impounded streams draining Nee Soon Swamp Forest.
Physico-chemical parameters. A range of physico-chemical parameters were measured at each site during baseflow conditions, between August 2008 and March 2009. In-stream habitat conditions were categorised by measuring mean stream depth (cm) and mean wetted width (m) along each of three equally spaced transects. Mean substrate size (mm) was also estimated at each site, with the longest axis of 15 randomly selected particles on each of the three transects being measured. Mean current velocity (m s-1) was measured with a Marsh-McBirney Flowmate 2000. Lower-bank and stream-bed stability (channel stability) were estimated using the method of Pfankuch (1975). Percent canopy cover was estimated at each site using a Foliage Cover Scale (Landcare Research, 2008). Impervious surface area (ISA, m2) within a 200 m radius of each site was estimated using a landcover database in a GIS. The longitude and latitude of each site was recorded with a handheld GPS unit (Trimble Recon Pathfinder XC).
Spot measures of pH, specific conductivity (µS25 cm-1), dissolved oxygen (DO, mg l-1), total dissolved solids (TDS, g l-1), and water temperature (°C) were recorded with a YSI Professional Plus hand held meter. A composite sample of deposited inorganic sediment was collected from each study reach and tested for copper (Cu), cadmium (Cd), lead (Pb), and zinc (Zn) in the laboratory (Setsco Services PTE Ltd, Singapore) using standard methods (APHA: Pt 3120B).
542
The SingScore: a macroinvertebrate biotic index
Table 1. Summary (averages with ranges in parentheses) of the physical and chemical parameters measured in 33 urban canals and 14 reference streams.
Variable Urban Canals Reference StreamspH 7.3 (4–9) 5.1 (4–7)Specific conductivity (μS25 cm−1) 220.4 (51–481) 56.4 (24–153)Water temperature (°C) 29.1 (26.4–35.6) 25.7 (24.9–26.5)Total dissolved solids (TDS, g l−1) 0.14 (0.03–0.27) 0.10 (0.01–0.81)Dissolved oxygen (DO, mg l−1) 6.4 (3.8–10.4) 5.6 (3.3–7.0)Faecal coliforms (cfu 100 ml−1) 51304 (1–700000) 635 (1–3600)Escherichia coli (cfu 100 ml−1) 25810 (1–180000) 480 (1–2700)Enterococcus (cfu 100 ml−1) 1602 (1–5600) 245 (20–1200)Cadmium (Cd, mg kg−1) 3.38 (0.06–10.70) 1.23 (0.06–3.98)Copper (Cd, mg kg−1) 120.4 (1.65–1060) 2.9 (0.10–8.27)Zinc (Zn, mg kg−1) 275.9 (9.0–1157) 19.3 (5.2–44.3)Lead (Pb, mg kg−1) 37.5 (3.6–104) 8.3 (2.6–19.1)Canopy cover % 22.3 (0–100) 66.4 (18–99)Impervious surface area (ISA, m2 within a 200 m radius) 58747 (7607–122966) 1845 (0–18650)Current velocity (m s−1) 0.29 (0.00–0.84) 0.15 (0.01–0.40)Channel stability 62 (38–103) 88 (56–128)Particle size (mm) 9 (0–142) 8 (1.1–39.3)Wetted width (m) 2.3 (0.03–20) 1.1 (0.1–2.6)Stream depth (cm) 9.9 (1.8–29.3) 12.9 (2.8–47.7)
Fig. 1. Map of Singapore showing the 47 study sites (black circles) located in 33 concrete canals, and 14 forested streams. Note that all forested streams were located within the Central Catchment Nature Reserve (CCNR; dark grey area in centre of the map). Inset shows forested study sites within the CCNR.

543
RAFFLES BULLETIN OF ZOOLOGY 2014
Numbers of faecal bacteria (Enterococcus, Escherichia coli, and total faecal coliforms) were measured in a 100 ml water sample collected in pre-washed (phosphate free detergent and distilled water) plastic containers at each site. Samples were kept on ice until returning to the laboratory (within 4 hours), where the number of colony forming units (cfu 100 ml−1) of faecal coliforms (APHA: Pt 9222D), Enterococcus (APHA: Pt 9230C), and total E. coli (APHA: Pt 9222G) were measured using standard methods (Setsco Services PTE Ltd, Singapore).
Macroinvertebrate sampling. Benthic macroinvertebrates were sampled qualitatively with a kick net (250 µm mesh). At each site the full range of microhabitats present (e.g., pools, log jams, leaf packs) were sampled to maximise the likelihood of collecting all species present including rare and habitat-specific species. All samples were preserved in the field in 90% ethanol.
In the laboratory, samples were rinsed with water on a 250 µm mesh Endecott sieve, and all aquatic macroinvertebrates were removed and identified under 100× magnification. Specimens were identified to family-level, except for Ostracoda, Copepoda, Isopoda, Amphipoda, Acari, and Collembola, using Dudgeon (1999), Yule & Yong (2004), Mekong River Commission (2008) and Merritt et al. (2008).
STATISTICAL ANALYSES
We first evaluated the relative practicability and utility of methods available for devising a biotic index, including multi-metric and predictive modelling, weighted averaging and the development of tolerance scores. We concluded that the limited number and variety of waterways in Singapore meant that weighted averaging and tolerance scores were the methods best suited to our study (cf. Jimenez-Valverde et al., 2009).
Development of the SingScore index was a two-step process, using a procedure based on that of Smith et al. (2007). First, we used multivariate ordination techniques to identify the environmental (i.e., physico-chemical) variables that best explained variation in macroinvertebrate community composition among the 47 sites. We then used weighted averaging (WA) techniques to calculate tolerance scores for each macroinvertebrate family, based on the urbanisation gradient determined by multivariate ordination techniques.
Determining the urbanisation gradient. We used multivariate ordination techniques on presence-absence macroinvertebrate data to determine which physico-chemical variables best explained variation in community composition among the sites. An initial unconstrained Detrended Correspondence Analysis (DCA), using presence-absence family-level data, revealed that the longest gradient length (DCA axis 1: 3.466) was greater than 3.0 and thus unimodal methods were appropriate for exploring the variation in our macroinvertebrate community data (ter Braak & Verdonschot, 1995; Lepš & Šmilauer, 2003). We therefore used Canonical Correspondence Analysis (CCA) and Weighted Averaging (WA) to develop the biotic index (the SingScore).
We assessed for collinearity among the 19 environmental and 2 spatial variables using a correlation matrix. Concentrations of zinc and faecal coliforms were both highly intercorrelated (r > 0.9) with other variables, and were therefore removed from the matrix. We also controlled for the spatially autocorrelated nature of our data since the reference sites were all located within the CCNR (i.e., in the centre of Singapore; Fig. 1). Therefore, the longitude and latitude of each site were included as covariables in subsequent partial CCA (pCCA) analyses.
We conducted a pCCA, based on presence-absence data, inter-species differences and Hill’s scaling (Lepš & Šmilauer, 2003) using a forward selection procedure, to rank the measured environmental variables in order of their importance in explaining macroinvertebrate community composition (ter Braak & Verdonschot, 1995). This process is analogous to forward stepwise regression, where the significance of each explanatory variable is tested using a Monte Carlo permutation test with 999 random permutations. Channel stability, particle size, wetted width, and stream depth were the first four variables to be selected in the forward selection procedure. However, as we were primarily interested in quantifying the effects of urbanisation on community composition, we included these physical variables with the spatial variables as covariates in the final pCCA. This enabled us to focus on the effects of urbanisation (e.g., heavy metal concentrations, conductivity, and pH), rather than physical factors that may change longitudinally along a waterway, and so better discriminate the environmental variables that best explained variation in community composition across the urban gradient. Again, forward selection was used with a Monte Carlo permutation test with 999 random permutations. The overall significance of each pCCA ordination was tested in the same way. All multivariate ordinations were conducted in CANOCO version 4.55 (ter Braak & Smilauer, 2006).
Development of tolerance scores using Weighted Averaging. We used Weighted Averaging (WA) to determine tolerance scores for each macroinvertebrate family (as described by Smith et al., 2007) based on both copper and pH as these two variables explained significant variation in macroinvertebrate community composition (as determined by the final pCCA and the forward selection procedure) along the urbanisation gradient. Values for copper concentration and pH at each site were ranked, separately. These variables were then split into 12 “bins” to give approximately equal numbers of samples (i.e., sites) in each bin. An optimal value for each macroinvertebrate family was then calculated for both copper concentration and pH, separately, by dividing the sum of the weighted proportion (Wprop) of times a family occurred within the 12 bins, by the sum of the unweighted proportion (Uprop) of times a family occurred within the bins.
Environmental optima (Ei) = ,
where Wprop equals the mean environmental variable of the bin mean, multiplied by the proportion of times the family occurred within the bin Uprop.
∑ (Wprop) bin1+bin2+…+bin12
∑ (Uprop) bin1+bin2+…+bin12
544
The SingScore: a macroinvertebrate biotic index
Environmental optima for each family were therefore approximately equal to the mean of the respective environmental variables of the bin in which each family had the greatest number of occurrences.
A tolerance value was then assigned to each family on the basis of these environmental optima. First, the environmental optima were sorted in ascending order, separately, and split into 10 groups so that each group consisted of eight families (except for one group which had 7 families). Families in the first group (i.e., n = 8), with the lowest values of each environmental variable, were assigned a 10; the next eight families were assigned a 9, and so on until the last seven families were assigned a 1. Thus, a tolerance value of 10 represents intolerance to the environmental variable, while a value of 1 represents tolerance.
Assessing the performance of the SingScore. We compared the performance of the SingScore with two widely used macroinvertebrate indices: the BMWP (1978) and the BMWPThai (Mustow, 2002).
First, we compared tolerance values used in the three indices by calculating Pearson correlations. However, as not all of the 74 macroinvertebrate groups (families and higher taxa) found in Singapore are represented in the BMWP and BMWPThai, we omitted macroinvertebrate families found only in Singapore from the analysis. Second, we calculated BMWP and BMWPThai scores for each of the sites (based on their respective tolerance scores for taxa found at each of our study sites) and compared them with SingScores as above.
SingScores were then correlated with seven of the physico-chemical and biotic parameters that differed between urban canals and the reference streams: specific conductivity, pH, water temperature, total E. coli, copper concentration, ISA and taxa richness, for each of the sites. Total E. coli, copper concentration and taxa richness were ln-transformed prior to analysis.
Finally, we used non-metric multidimensional scaling (NMDS) ordination and analysis of similarities (ANOSIM) to assign likely water-quality categories to the calculated SingScores. An NMDS ordination, with 500 random permutations, was used to investigate differences in macroinvertebrate community composition (presence-absence data) among sites. The NMDS ordination ranked sites such that distance in ordination space represented community dissimilarity (in this case using the Bray-Curtis metric), where sites closest together were more similar in composition than those further apart (Quinn & Keough, 2002). Goodness-of-fit of the NMDS ordination was assessed by the magnitude of the associated ‘stress’ value (Quinn & Keough, 2002).
An ANOSIM, with 999 permutations, was used to test for significant differences in community composition among the four SingScore water-quality categories: poor, fair, good and excellent. ANOSIM is a nonparametric permutation procedure applied to the rank similarity matrix underlying the NMDS ordination and compares the degree of separation among and within groups using the test statistic, R. When R equals 0 there is no distinguishable difference in community composition among groups, whereas an R value of 1 indicates
completely distinct communities among groups (Quinn & Keough, 2002). A global R statistic was first calculated, to determine whether there was an overall difference in community composition among all groups. Where a significant difference (α = 0.05) was detected (i.e., R > 0), pairwise comparisons were made between groups. NMDS and ANOSIM analyses were conducted in Primer version 5.1.2 (Clarke & Warwick, 2001).
RESULTS
A total of 74 taxonomic groups (68 families and 6 higher taxa) of macroinvertebrates were recorded in the urban canals and natural forested streams.
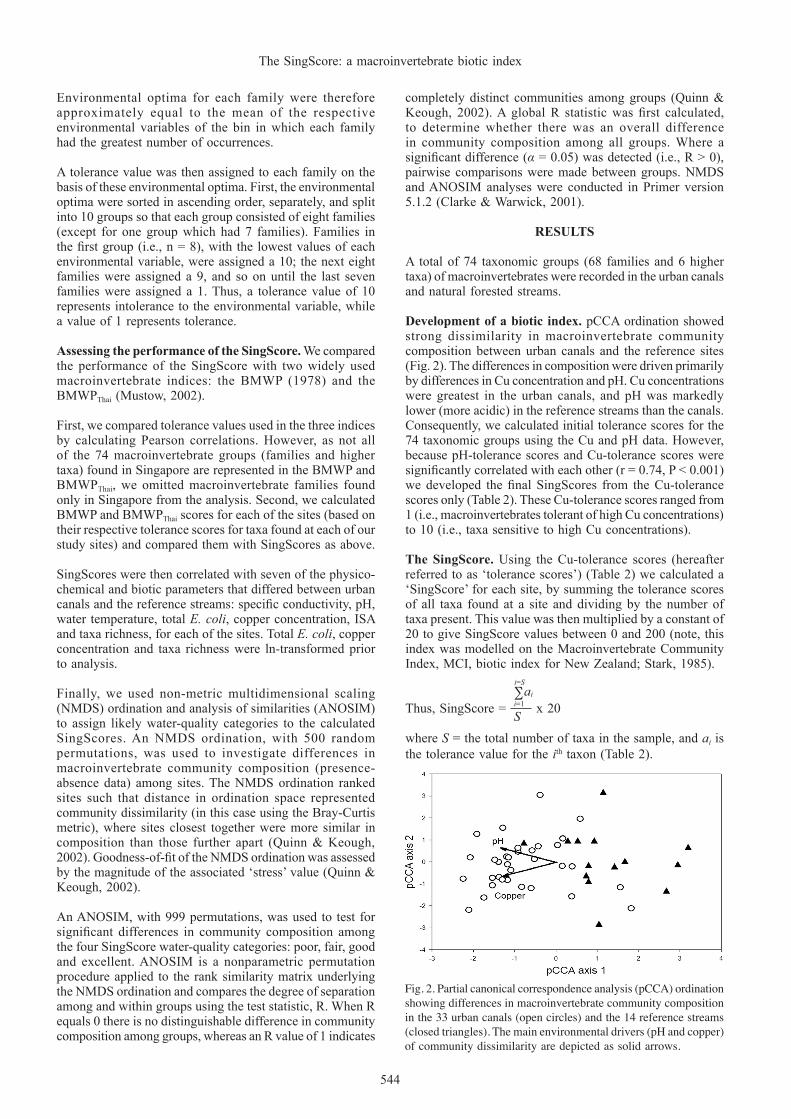
Development of a biotic index. pCCA ordination showed strong dissimilarity in macroinvertebrate community composition between urban canals and the reference sites (Fig. 2). The differences in composition were driven primarily by differences in Cu concentration and pH. Cu concentrations were greatest in the urban canals, and pH was markedly lower (more acidic) in the reference streams than the canals. Consequently, we calculated initial tolerance scores for the 74 taxonomic groups using the Cu and pH data. However, because pH-tolerance scores and Cu-tolerance scores were significantly correlated with each other (r = 0.74, P < 0.001) we developed the final SingScores from the Cu-tolerance scores only (Table 2). These Cu-tolerance scores ranged from 1 (i.e., macroinvertebrates tolerant of high Cu concentrations) to 10 (i.e., taxa sensitive to high Cu concentrations).
The SingScore. Using the Cu-tolerance scores (hereafter referred to as ‘tolerance scores’) (Table 2) we calculated a ‘SingScore’ for each site, by summing the tolerance scores of all taxa found at a site and dividing by the number of taxa present. This value was then multiplied by a constant of 20 to give SingScore values between 0 and 200 (note, this index was modelled on the Macroinvertebrate Community Index, MCI, biotic index for New Zealand; Stark, 1985).
Thus, SingScore = x 20
where S = the total number of taxa in the sample, and ai is the tolerance value for the ith taxon (Table 2).
Fig. 2. Partial canonical correspondence analysis (pCCA) ordination showing differences in macroinvertebrate community composition in the 33 urban canals (open circles) and the 14 reference streams (closed triangles). The main environmental drivers (pH and copper) of community dissimilarity are depicted as solid arrows.
∑i=S
i=1ai
S

545
RAFFLES BULLETIN OF ZOOLOGY 2014
Table 2. SingScore-tolerance scores derived from multivariate ordination and a weighted averaging technique, for macroinvertebrates in Singapore’s lotic waters.
Macroinvertebrates SingScore-Tolerance Scores Macroinvertebrates SingScore-Tolerance ScoresPlatyhelminthes Hemiptera Dugesiidae 3 Corixidae 10 Gerridae 5Polychaeta Helotrephidae 4Nereididae 6 Mesoveliidae 10 Naucoridae 7Oligochaeta Notonectidae 8Tubificidae 2 Veliidae 7 Hirudinea Megaloptera Erpobdellidae 1 Sialidae 8Glossiphoniidae 2 Haemadipsidae 5 Trichoptera Calamoceratidae 9Mollusca Ecnomidae 6Ampullariidae 3 Hydropsychidae 7Ancylidae 1 Hydroptilidae 6Bithyniidae 3 Leptoceridae 7Lymnaeida 1 Odontoceridae 10Physidae 2 Philopotamidae 8Planorbidae 2 Polycentropodidae 9Thiaridae 1 Lepidoptera Crustacea Crambidae 5Amphipoda 2 Atyidae 6 Coleoptera Copepoda 4 Curculionidae 6Isopoda 1 Dytiscidae 5Ostracoda 3 Hydraenidae 8Palaemonidae 7 Hydrophilidae 6Parathelphusidae 9 Scirtidae 8 Odonata (Zygoptera) Diptera Amphipterygidae 10 Athericidae 10Calopterygidae 8 Canacidae 6Coenagrionidae 3 Ceratopogonidae 3Euphaeidae 9 Chironomidae 2Platycnemididae 5 Corethrellidae 10Platystictidae 8 Culicidae 1 Dolichopodidae 1Odonata (Anisoptera) Empididae 4Aeshnidae 9 Ephydridae 4Corduliidae 5 Muscidae 6Gomphidae 8 Psychodidae 2Libellulidae 4 Simuliidae 7 Syrphidae 4Ephemeroptera Tipulidae 3Baetidae 7 Caenidae 7 Collembola 5Heptageniidae 9 Leptophlebiidae 10 Acari 4 Plecoptera Leuctridae 10 Perlidae 9

546
The SingScore: a macroinvertebrate biotic index
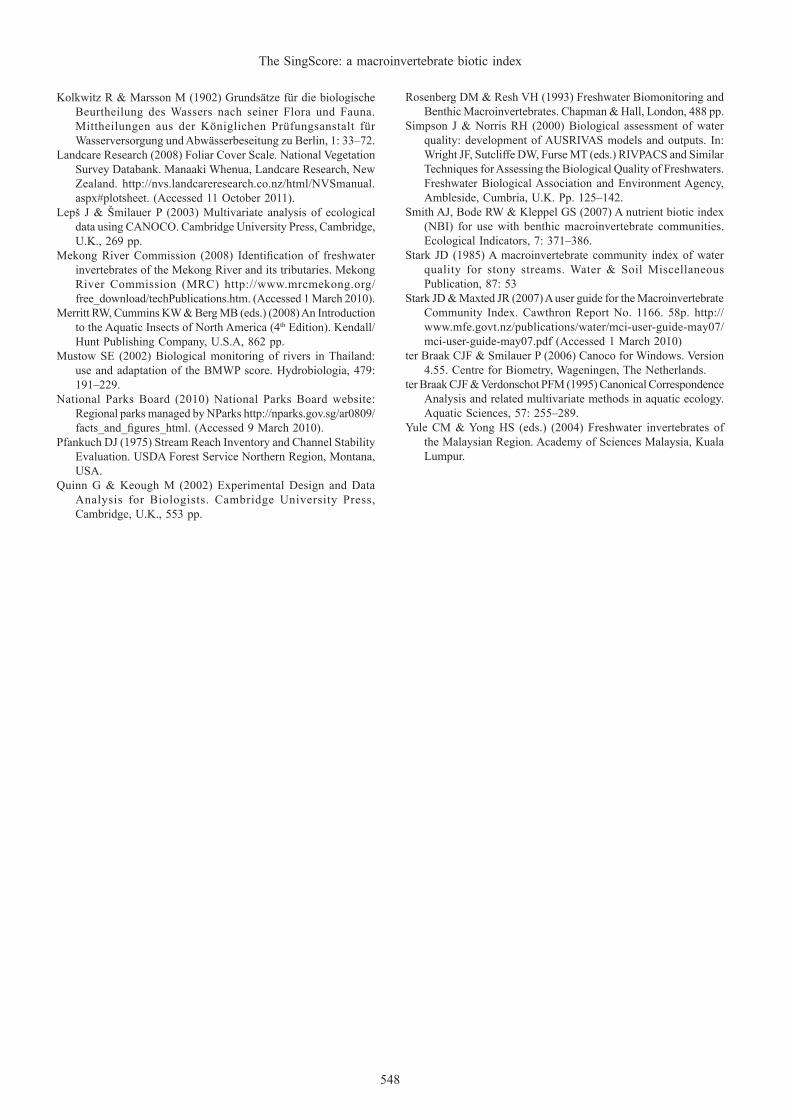
Fig. 3. Non-metric multidimensional scaling (NMDS) ordination based on a Bray-Curtis matrix of dissimilarities calculated from presence-absence data illustrating compositional differences in macroinvertebrate communities among the sites. The NMDS gave a good representation of actual community dissimilarities (2-dimensional stress = 0.16) and ANOSIM separated the sites into four relatively distinct groups (ANOSIM, Global R = 0.769, P = 0.001), interpreted as likely water-quality categories (poor: closed circle; fair: open square; good: closed triangle; excellent: open circle). Axes are scaled identically so that sites closest together are more similar in macroinvertebrate community composition than those further apart.
Table 3. Categories of likely water quality of a stream or site, based on SingScore tolerance values for macroinvertebrates in Singapore’s lotic waterways (modelled on Stark, 1998; Stark & Maxted, 2007).
SingScore Likely Water Quality0–79 Poor80–99 Fair100–119 Good120+ Excellent
Assessing the performance of the SingScore. Our taxa tolerance scores (SingScores) were significantly correlated with both the BMWP tolerance scores (r = 0.65, P < 0.001) and the BMWPThai
tolerance scores (r = 0.59, P < 0.001). We also found that sites with high conductivity (and therefore probably high levels of metals and other contaminants), had the lowest SingScores (r = −0.75, P < 0.001). Similarly, sites with higher water temperatures (r = −0.67, P < 0.001), a greater abundance of E. coli (r = −0.66, P < 0.001), and more impervious surface area (r = −0.72, P < 0.001) had lower SingScores. SingScore was significantly, and negatively correlated with pH (r = −0.81, P < 0.001), because the natural forested streams tended to have more acidic waters and higher SingScores. Sites with the greatest macroinvertebrate richness also had the greatest SingScores (r = 0.53, P < 0.001).
The NMDS ordination gave a reasonable representation of actual community dissimilarities (2-dimensional stress value = 0.16), and separated the sites into four relatively distinct groups (ANOSIM, Global R = 0.769, P = 0.001; Fig. 3). Based on these differences in community composition, we assigned each group to one of four SingScore water-quality categories: poor, fair, good or excellent (Table 3; modelled on the water-quality categories of Stark, 1998; and Stark & Maxted, 2007). However, it is important to note that although there were compositional differences in the macroinvertebrate communities between the poor / excellent (R = 0.953, P = 0.001), poor / good (R = 0.849, P = 0.001), poor / fair (R = 0.666, P = 0.001), and fair / excellent (R = 0.649, P = 0.002) water-quality categories, there was overlap between the fair / good (R = 0.028, P = 0.362) and good / excellent (R = 0.105, P = 0.362) categories (Fig. 3).
DISCUSSION
Biotic indices as numerical estimators of stream health, based on the tolerance or sensitivity of macroinvertebrates to an environmental gradient, are now widely established in monitoring regimes around the world (e.g., Biological Monitoring Working Party, 1978; Stark, 1985; Hilsenhoff, 1988; Chessman, 1995, 2003; Simpson & Norris, 2000; Mustow, 2002; Davy-Bowker et al., 2005; Hued & de los Ángeles Bistoni, 2005). Moreover, the importance of using a biotic index that is based on local or indigenous macroinvertebrates is well understood. As few biotic indices have been developed for Southeast Asia, and more generally the tropics (but see, De Zwart & Trivedi, 1994; Mustow, 2002), and as our data are based on comprehensive collections of taxa from throughout Singapore, we believe the development of the SingScore provides a robust tool for objective monitoring of stream health in Singapore.
Through multivariate ordination techniques we determined that the concentration of copper in stream sediments and pH in the water column were strong drivers of differences in community composition between urban canals and forested reference sites. Subsequent use of weighted averaging allowed us to assign tolerance scores in an objective manner to each of the macroinvertebrate-taxonomic groups found in Singapore’s lotic ecosystems. As tolerance scores for Cu and pH were highly correlated, the final SingScore-tolerance scores were based on copper concentrations only (Table 2). The SingScores can be calculated for individual streams or sites, based on their respective macroinvertebrate communities. Importantly, when the SingScore is calculated, the water quality of the stream or site can be classified as either poor, fair, good or excellent (Table 3). However, it is important to note that there can be overlap between these water-quality categories (as our analyses showed), and boundaries between them need to be regarded as flexible. Thus, sites should be assigned to a SingScore water-quality category based on primary water-quality information (e.g., physico-chemical information) as well as the SingScore.
Our assessments of the validity of the SingScore, and its associated tolerance scores, suggest the index is of comparable quality to other biotic indices, including one devised for systems in Southeast Asia (BMWPThai). However, in Singapore we found many macroinvertebrate groups (families and higher taxa) in addition to those previously assigned BMWP and BMWPThai tolerance scores. Thus, the SingScore is a more comprehensive index for determining the health of Singapore’s running waters.
547
RAFFLES BULLETIN OF ZOOLOGY 2014
Stream health in Singapore. The SingScores calculated for our sites indicated that urban canals in Singapore generally have poor water quality. Nevertheless, three canals were categorised as ‘fair’ and one as ‘good’. Conductivity was low in these canals and we found high taxonomic richness, including caddisflies and mayflies, at these sites. Surprisingly, only eight of the 14 forested, reference sites (57%) had excellent water quality and one of the reference sites had only fair–good water quality, despite being located within the CCNR. These poorer quality reference streams were either located very nearby to a road with higher surrounding impervious surface area than the other reference sites, or were within areas around reservoirs (e.g., MacRitchie Reservoir and Rifle Range Road) that are frequented by recreational users and army personnel. These findings highlight the fact that even streams within the CCNR are negatively affected by urbanisation to some extent.
Tolerance scores versus multi-metrics and predictive models. There has been considerable debate in the literature over the relative merits of biotic indices, multi-metrics and predictive models (Karr, 1999; Hawkins et al., 2000). Each methodology has strengths and weaknesses, and prior to developing the SingScore, we evaluated the relative practicability and utility of each approach in the context of the size of the Singapore dataset and the types of personnel who would be using the method. We concluded that a multi-metric approach could have been used with our dataset however, the very distinct community differences between forested and concrete canals along the urbanisation gradient resulted in a dataset well suited to tolerance score development. Furthermore, a predictive model, which typically requires large datasets to develop observed versus expected metrics, was not suitable for use in developing the SingScore because of the relatively small number of waterways in the country and the very low number of streams available for determining the ‘reference’ condition. Consequently, we opted to develop a biotic index, which would provide an easy to use and robust measure for Singapore’s water-quality monitoring staff.
CONCLUSIONS
Singapore’s lotic ecosystems have variable physical and chemical conditions ranging from relatively good to very poor water quality. Despite the high level of urbanisation in the country, the waterways were found to support at least 74 benthic macroinvertebrate families and higher taxa. Moreover, many of the macroinvertebrate taxa had very different tolerances to water quality, and therefore are useful indicators of the health and condition of streams and drains in Singapore. We envisage the SingScore will be a useful and robust tool for long-term monitoring, and will provide a reliable means of assessing the success of restoration and remediation of drains and canals throughout Singapore. Finally, although we developed the index using data from Singapore it should also be useful in neighbouring Southeast Asian countries where similar taxa and land-use pressures occur.
ACKNOWLEDGEMENTS
Thanks to the Public Utilities Board, Singapore for funding this work. Jun Hien Chong, Michelle Sim Cheng Hua (PUB, Singapore), Stephen Moore (Landcare Research, New Zealand), and Esther Clews (NUS, Singapore) helped in the field. Ewan Isherwood and Jo O’Cock (University of Canterbury, New Zealand) helped in the laboratory. Michael Winterbourn (University of Canterbury) and Peter Cranston (University of California, Davis) assisted with macroinvertebrate identifications. Permission to sample and collect from the streams within the Central Catchment Nature Reserve and Nee Soon Swamp Forest was granted by the National Parks Board of Singapore (NP / RP826 & NP / RP901). Help provided by Parks Board staff Sharon Chan, Benjamin Lee, Tzi Ming Leong and Jonathon Goh is particularly appreciated.
LITERATURE CITED
BMWP (Biological Monitoring Working Party) (1978) Final Report: Assessment and Presentation of the Biological Quality of Rivers in Great Britain. BMWP, Department of the Environment, London.
Chessman BC (1995) Rapid assessment of rivers using macroinvertebrates: a procedure based on habitat-specific sampling, family-level identification and a biotic index. Australian Journal of Ecology, 20: 122–129.
Chessman BC (2003) New sensitivity grades for Australian river macroinvertebrates. Marine and Freshwater Research, 54: 95–103.
Clarke KR & Warwick RM (2001) Changes in Marine Communities: An Approach to Statistical Analysis and Interpretation. Version 2. PRIMER-E Ltd, Plymouth, U.K, 176 pp.
Corlett RT (1992) The ecological transformation of Singapore, 1819-1990. Journal of Biogeography, 19: 411–420.
Davy-Bowker J, Murphy JF, Rutt GP, Steel JEC & Furse MT (2005) The development and testing of a macroinvertebrate biotic index for detecting the impact of acidity on streams. Archiv für Hydrobiologie, 163: 383–403.
De Zwart D & Trivedi RC (1994) Manual on Integrated Water Quality Evaluation (Report 802023003). National Institute of Public Health and Environmental Protection (RIVM), Bilthoven, The Netherlands.
Dudgeon D (1999) Tropical Asian Streams: Zoobenthos, Ecology and Conservation. Hong Kong University Press, Hong Kong, 830 pp.
Hawkins CP, Norris RH, Hogue JN & Feminella JW (2000) Development and evaluation of predictive models for measuring the biological integrity of streams. Ecological Applications, 10: 1456–1477.
Hilsenhoff WL (1998) Rapid field assessment of organic pollution with a family-level biotic index. Journal of the North American Benthological Society, 7: 65–68.
Hued AC & de los Ángeles Bistoni M (2005) Development and validation of a Biotic Index for evaluation of environmental quality in the central region of Argentina. Hydrobiologia, 543: 279–298.
Jimenez-Valverde A, Lobo JM & Hortal J (2009) The effect of prevalence and its interaction with sample size on the reliability of species distribution models. Community Ecology, 10: 196–205.
Karr JR (1999) Defining and measuring river health. Freshwater Biology, 41: 221–234.
548
The SingScore: a macroinvertebrate biotic index
Kolkwitz R & Marsson M (1902) Grundsätze für die biologische Beurtheilung des Wassers nach seiner Flora und Fauna. Mittheilungen aus der Königlichen Prüfungsanstalt für Wasserversorgung und Abwässerbeseitung zu Berlin, 1: 33–72.
Landcare Research (2008) Foliar Cover Scale. National Vegetation Survey Databank. Manaaki Whenua, Landcare Research, New Zealand. http://nvs.landcareresearch.co.nz/html/NVSmanual.aspx#plotsheet. (Accessed 11 October 2011).
Lepš J & Šmilauer P (2003) Multivariate analysis of ecological data using CANOCO. Cambridge University Press, Cambridge, U.K., 269 pp.
Mekong River Commission (2008) Identification of freshwater invertebrates of the Mekong River and its tributaries. Mekong River Commission (MRC) http://www.mrcmekong.org/free_download/techPublications.htm. (Accessed 1 March 2010).
Merritt RW, Cummins KW & Berg MB (eds.) (2008) An Introduction to the Aquatic Insects of North America (4th Edition). Kendall/Hunt Publishing Company, U.S.A, 862 pp.
Mustow SE (2002) Biological monitoring of rivers in Thailand: use and adaptation of the BMWP score. Hydrobiologia, 479: 191–229.
National Parks Board (2010) National Parks Board website: Regional parks managed by NParks http://nparks.gov.sg/ar0809/facts_and_figures_html. (Accessed 9 March 2010).
Pfankuch DJ (1975) Stream Reach Inventory and Channel Stability Evaluation. USDA Forest Service Northern Region, Montana, USA.
Quinn G & Keough M (2002) Experimental Design and Data Analysis for Biologists. Cambridge University Press, Cambridge, U.K., 553 pp.
Rosenberg DM & Resh VH (1993) Freshwater Biomonitoring and Benthic Macroinvertebrates. Chapman & Hall, London, 488 pp.
Simpson J & Norris RH (2000) Biological assessment of water quality: development of AUSRIVAS models and outputs. In: Wright JF, Sutcliffe DW, Furse MT (eds.) RIVPACS and Similar Techniques for Assessing the Biological Quality of Freshwaters. Freshwater Biological Association and Environment Agency, Ambleside, Cumbria, U.K. Pp. 125–142.
Smith AJ, Bode RW & Kleppel GS (2007) A nutrient biotic index (NBI) for use with benthic macroinvertebrate communities. Ecological Indicators, 7: 371–386.
Stark JD (1985) A macroinvertebrate community index of water quality for stony streams. Water & Soil Miscellaneous Publication, 87: 53
Stark JD & Maxted JR (2007) A user guide for the Macroinvertebrate Community Index. Cawthron Report No. 1166. 58p. http://www.mfe.govt.nz/publications/water/mci-user-guide-may07/mci-user-guide-may07.pdf (Accessed 1 March 2010)
ter Braak CJF & Smilauer P (2006) Canoco for Windows. Version 4.55. Centre for Biometry, Wageningen, The Netherlands.
ter Braak CJF & Verdonschot PFM (1995) Canonical Correspondence Analysis and related multivariate methods in aquatic ecology. Aquatic Sciences, 57: 255–289.
Yule CM & Yong HS (eds.) (2004) Freshwater invertebrates of the Malaysian Region. Academy of Sciences Malaysia, Kuala Lumpur.


![INDEX [] · 2016-04-27 · INDEX S. No. Title Author Page No. 1. Biotic and Abiotic Resources Management in Wheat for Sustainable Agriculture R.S. Shukla 1-7 2. Soil Biotic Resources:](https://img.pdfslide.net/doc/110x75/5ebd12d361acb64459343325/index-2016-04-27-index-s-no-title-author-page-no-1-biotic-and-abiotic.jpg)