Embed Size (px)
Citation preview
8/3/2019 The Six Sigma Process
http://slidepdf.com/reader/full/the-six-sigma-process 1/50
The Six Sigma Process
In this module we introduce the Six Sigma process. Many companies have tailored this process to meet
their specific needs and so have their own version of the process. We will use a fairly generic process
that should serve you well even if your company process is a bit different.
Reference
• This module is based The Six Sigma Handbook , by Thomas Pyzdek, published by McGraw-Hill, and Six
Sigma for Dummies, by Craig Gygi, Neil DeCarlo, and Bruce Williams, published by Wiley Publishing, Inc.
Slide two
The primary references for this module are shown on the slide, but I’ve also been influenced by other
things I’ve read and learned over the years.
Why study the Six Sigma process?
• You need a common process that may be used to guide all quality improvement projects in the
Company
• The Six Sigma process is the state-of-the-art process for doing “problem solving” projects, and those
projects are the heart of quality improvement
• The Six Sigma process is PROVEN
Slide three
We mentioned in our quality management module that a company needed to create a common quality
culture so that all its associates know how to interact and work within that culture. Over the last few
years, a Six Sigma process has served as that culture for many of the top global organizations. As a
result, we have learned a lot about the process and how to make it work extremely well. I am sure we
will continue to improve it in future years, but I believe it is very good for professionals to have a solid
understanding of the state-of-the-art process today. This process is a proven process that has had a
great impact in many different companies around the globe.
4
Outline
• Motivation and background
• Define
• Measure
8/3/2019 The Six Sigma Process
http://slidepdf.com/reader/full/the-six-sigma-process 2/50
• Analyze
• Improve
• Control
Slide four
Since you are enrolled in this course you probably do not need additional motivation to convince you to
study the Six Sigma process. Nonetheless, we will provide a couple of slides of motivation and
background before launching into the standard define, measure, analyze, improve, and control steps of
a typical Six Sigma project.
5
Examples of the Impact of Six Sigma
• General Electric: $7 - $10B in 5 years
• Dupont: $2.4B in 4 years
• Bank of America: $100Ms, cycle time improvements greater than 50%, errors reduced by an order of
magnitude in 3 years
• Motorola: $2.2B in 4 years
• Caterpillar: Paid for itself the first year
Slide five
We have listed some examples of the impact of the Six Sigma process on some high profile
manufacturing and service organizations. The magnitude of these results justifies the statement that Six
Sigma was of strategic importance for these organizations. It is easier to obtain information about Six
Sigma impacts from larger and higher profile companies than others. However, it will be easy for you to
see as we go through this module that the tools and methods of Six Sigma would apply to any
professional organization, large or small. It will also be easy to see that they apply to manufacturing
companies, service organizations, and healthcare organizations. I obtained the information on
Caterpillar from their website and thought it was interesting that a $35 billion a year company could
implement Six Sigma and have it pay for itself in the first year. This is important since companies are
sometimes reluctant to implement a Six Sigma process for fear that it will take a while to start payingback. I think sometimes the companies themselves are too patient with the process and should demand
more. In late 2005, I started to work with a $50 million a year company on the implementation of a
quality revolution via a Six Sigma process, and so I know that it works in smaller firms. This particular
firm is already a leader in its industry but wants to get even better. It is true that the implementation
may be a little different since a smaller firm that cannot afford the dedicated resources like the larger
8/3/2019 The Six Sigma Process
http://slidepdf.com/reader/full/the-six-sigma-process 3/50
companies listed in the slide. We will try to point out some of these differences as we go through this
module.
6
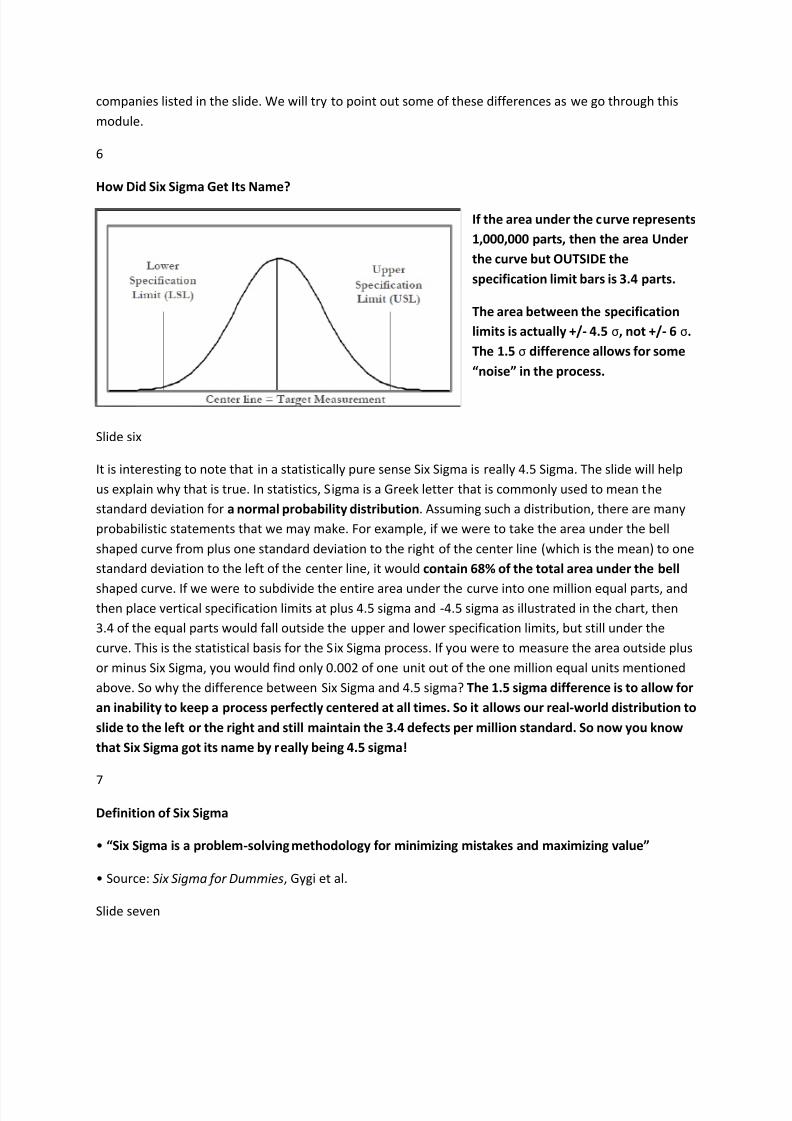
How Did Six Sigma Get Its Name?
If the area under the curve represents
1,000,000 parts, then the area Under
the curve but OUTSIDE the
specification limit bars is 3.4 parts.
The area between the specification
limits is actually +/- 4.5 σ, not +/- 6 σ.
The 1.5 σ difference allows for some
“noise” in the process.
Slide six
It is interesting to note that in a statistically pure sense Six Sigma is really 4.5 Sigma. The slide will help
us explain why that is true. In statistics, Sigma is a Greek letter that is commonly used to mean the
standard deviation for a normal probability distribution. Assuming such a distribution, there are many
probabilistic statements that we may make. For example, if we were to take the area under the bell
shaped curve from plus one standard deviation to the right of the center line (which is the mean) to one
standard deviation to the left of the center line, it would contain 68% of the total area under the bell
shaped curve. If we were to subdivide the entire area under the curve into one million equal parts, andthen place vertical specification limits at plus 4.5 sigma and -4.5 sigma as illustrated in the chart, then
3.4 of the equal parts would fall outside the upper and lower specification limits, but still under the
curve. This is the statistical basis for the Six Sigma process. If you were to measure the area outside plus
or minus Six Sigma, you would find only 0.002 of one unit out of the one million equal units mentioned
above. So why the difference between Six Sigma and 4.5 sigma? The 1.5 sigma difference is to allow for
an inability to keep a process perfectly centered at all times. So it allows our real-world distribution to
slide to the left or the right and still maintain the 3.4 defects per million standard. So now you know
that Six Sigma got its name by really being 4.5 sigma!
7
Definition of Six Sigma
• “Six Sigma is a problem-solving methodology for minimizing mistakes and maximizing value”
• Source: Six Sigma for Dummies, Gygi et al.
Slide seven
8/3/2019 The Six Sigma Process
http://slidepdf.com/reader/full/the-six-sigma-process 4/50
Here we have a simple definition of Six Sigma that emphasizes both minimizing mistakes and maximizing
value, implying that Six Sigma can be used to impact both the bottom line and the top line for a
company. Let’s contrast this definition to the two others that follow.
8
Definition of Six Sigma
• “Six Sigma is a rigorous, focused and highly effective implementation of proven quality principles
and techniques that aims for virtually error free business performance”
• Source: The Six Sigma Handbook , Pyzdek.
This second definition of Six Sigma adds additional insights into some of the “how” of Six Sigma by
introducing quality principles and techniques, but notice that there is no reference in this definition to
anything on the top line. Both of these first two definitions come from the practitioner environment.
Let’s look at a third definition that a group of academics put together.
9
Definition of Six Sigma
• “Six Sigma is an organized parallel -meso structure to reduce variation in organizational processes by
using improvement specialists, a structured method, and performance metrics with the aim of
achieving strategic objectives”
• Source: “Six Sigma: Definition and Underlying Theory” by Schroeder, et al.
Roger Schroeder is the academic director of the Juran Center for Leadership in Quality at the Universityof Minnesota. When this center was being formed, the University sought 10 donors to each give
$100,000 to create a $1 million endowment to start the center. Dr. Juran was one of the first donors
that they approached. He liked the idea so much, that he gave the entire $1 million in order to get things
going! The center engages in a variety of activities to support its primary theme of leadership and
quality.
One of its activities is a bi-annual Summit that is really geared to practicing professionals in industry. I
was fortunate to receive a $4000 faculty Fellowship to attend the 2006 summit. The Fellowship covered
the $3500 registration fee and deferred some of my travel expenses. It was a very impressive
conference, and I would encourage you to go if you ever have the opportunity.
One of the co-authors of the paper referenced in this slide is a professor named Kevin Linderman. Kevin
earned his Ph.D. degree in operations management from the Weatherhead School of Management
before joining the faculty at the Carlson School of Business at the University of Minnesota. I was
fortunate to serve as his doctoral advisor and continue to work with him.
8/3/2019 The Six Sigma Process
http://slidepdf.com/reader/full/the-six-sigma-process 5/50
This definition sounds more like what an academic would write, but it has its virtues. The parallel
structure to which it refers means the structure outside the normal departmental, hierarchical structure
in organizations. We have mentioned earlier that a Quality Council typically forms this structure. The
meso word in the definition simply means that it reaches over all vertical levels in the organization.
You may remember our definition of total quality management talked about extending to all employees
from the top to the bottom of the organization, so this means the same thing. This definition adds still
more content by talking about improvement specialists, a structured method, and performance metrics.
Those of you with some familiarity of the Six Sigma process would agree, I believe, that these are
accurate descriptions.
One of the most important differences in this definition from the earlier two is the reference to
achieving corporate strategic objectives. You may recall in the quality management module that I talked
about how some companies have divorced their quality management process from their corporate
strategy. Clearly, these authors have made that connection and close an important loophole in the
earlier definitions. So even though this definition is a longer definition than the other two, I believe it is a
better definition with greater content than the other two.
10
Outline
• Motivation and background
• Define
• Measure
• Analyze
• Improve
• Control
We now turn to the first of the five widely recognized steps of a Six Sigma project: define. When
Motorola originally developed the Six Sigma process, it actually consisted of eight steps. The first step
was to recognize, meaning that we needed to recognize a need. The last two steps after control were to
sustain and institutionalize. Today, the control step generally includes the activities associated with
sustaining and institutionalizing.
11
Defining Projects
• Finding the right problems
• Defining them correctly – one bite at a time
8/3/2019 The Six Sigma Process
http://slidepdf.com/reader/full/the-six-sigma-process 6/50
8/3/2019 The Six Sigma Process
http://slidepdf.com/reader/full/the-six-sigma-process 7/50
can possibly hurt our company. Because cost reductions are so safe, top executives feel very
comfortable focusing Six Sigma efforts on cost reduction.
Many companies place a very strong emphasis on both customer and employee satisfaction. We will
study customer satisfaction in a later module and you will see why this is so important. A number of
years ago I had the opportunity to work with the CEO of Lubrizol Corp. At the time, the chairman andCEO was Dr. Lester Coleman who had a passion for quality. Dr. Coleman and I ran an executive workshop
entitled Total Quality Management: A Top-Down Approach through the Weatherhead Executive
Education program. He hosted me for an extended visit to his headquarters office and shared many
insights with me about Lubrizol’s approach to quality. During the session, he explained to me that the
company performed a customer satisfaction survey for every customer every year and did the same
thing for every employee. These two metrics were widely regarded as the two most important metrics
driving the company’s success. The financial performance of the company was seen to be the result of
achieving these metrics, as opposed to a driving force in and of itself.
Dr. Coleman was so secure as a professional and so passionate in his beliefs in quality that he
empowered the corporate Quality Council at Lubrizol with the final authority for corporate decisions.
This meant that if the council made a decision different from what Dr. Coleman would make for a
particular problem, their decision would rule. He explained to me that the company had undergone a
major reorganization and that a number of people who were running businesses and producing sound
financial results were replaced with new people because the prior individuals were not running the
businesses using the kind of quality principles that the company felt important to its long-term success.
When we study statistical process control later in the semester, we will study the quantitative definition
of process capability. Many in the automotive industries believe that the obsessive application of the
concept of process capability is what led the Japanese automotive companies to their superior quality
position in the industry. So certainly Six Sigma projects aimed at improving process capability make a lot
of sense and are very popular.
Many companies who have succeeded in implementing a Six Sigma culture find themselves in a strong
growth mode. Thus, another area or focus of Six Sigma projects is output capacity. To the degree that
capacity can be increased without having to add expensive capital equipment that often requires long
lead times to acquire, we can be ahead of the game.
Cycle time has been a common measure of performance in industry for a long, long time. It can be
applied at different levels in the process. The most detailed level is typically the cycle time for producing
a part in a machine. In such applications, it is defined as the average time between the same point in thetime cycle for producing a part. So if we chose the point as the final inspection and acceptance of the
part at a workstation, the cycle time is the average time from doing this for one part until the next. It has
been generally assumed that the shorter we can make the cycle time the greater the velocity of
inventory movement through our system. Improving this velocity should simultaneously improve
customer service and reduce inventory carrying costs. In recent years, the lean manufacturing
movement has challenged whether, in fact, this occurs. We could reduce the cycle time for machining a
8/3/2019 The Six Sigma Process
http://slidepdf.com/reader/full/the-six-sigma-process 8/50
8/3/2019 The Six Sigma Process
http://slidepdf.com/reader/full/the-six-sigma-process 9/50
projects. To me, this is a problem with the implementation of TQM but not with the substance of TQM. I
grant, however, that the Six Sigma movement has placed the financial impact front and center and as a
result gained wider acceptance than the TQM process.
A typical Six Sigma project should be a challenging project that is not easily done, and that cannot be
done within one department. If it can be done within one department, or by one person, we shouldsimply do it that way since that would be the easiest way. In most companies, projects of that scope do
not provide great leverage for improving the company’s performance as compared to projects that are
more challenging and complex and cross multiple department boundaries.
In addition to a rigid requirement for financial impact, another hallmark of Six Sigma projects is very
aggressive goals. A common metric is to improve an existing process by 70%; clearly this is a very
ambitious goal. In the corporate strategy field, this would be called a Big Hairy Audacious Goal (BHAG).
While I believe that it is important to set aggressive goals for Six Sigma projects, I think it's also
important to point out that most managers will be very happy if we achieve 20 or 30% improvements
even though our goal was 70. I believe the reason goals as ambitious as 70% are proposed is to really
put pressure on the team to try to find a revolutionary improvement, as opposed to an incremental
improvement. I have heard professionals who work in a hard-core Six Sigma environments lament the
fact that many good projects that might save 20 or 30% are rejected at the outset because they do not
meet a higher standard. So such projects don't get done and the organization doesn't enjoy the benefits
from them. A counter argument is why would you do those projects if there are other projects you can
do that generate 70% improvements? While I believe a company should exercise some flexibility in
choosing projects and so sometimes projects with goals less than 70% improvement might be selected, I
think it is a good thing to keep the hard edged financial goals in place for Six Sigma projects.
14
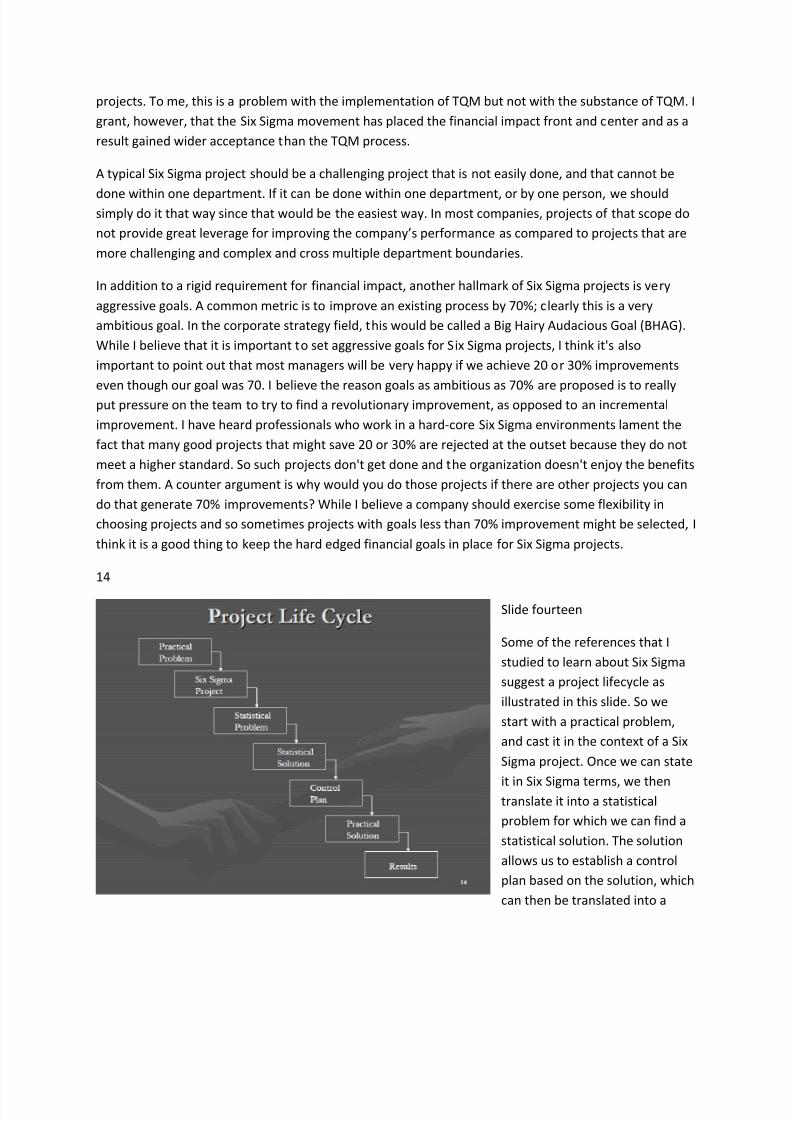
Slide fourteen
Some of the references that I
studied to learn about Six Sigma
suggest a project lifecycle as
illustrated in this slide. So we
start with a practical problem,
and cast it in the context of a Six
Sigma project. Once we can state
it in Six Sigma terms, we thentranslate it into a statistical
problem for which we can find a
statistical solution. The solution
allows us to establish a control
plan based on the solution, which
can then be translated into a
8/3/2019 The Six Sigma Process
http://slidepdf.com/reader/full/the-six-sigma-process 10/50
practical solution that achieves the desired results. As we study Six Sigma, we are probably more flexible
than this diagram would suggest. So we would probably use the word analytical in place of statistical,
and analytical would include quantitative and technical analysis as well as just logical analysis using
simple tools of quality.
15
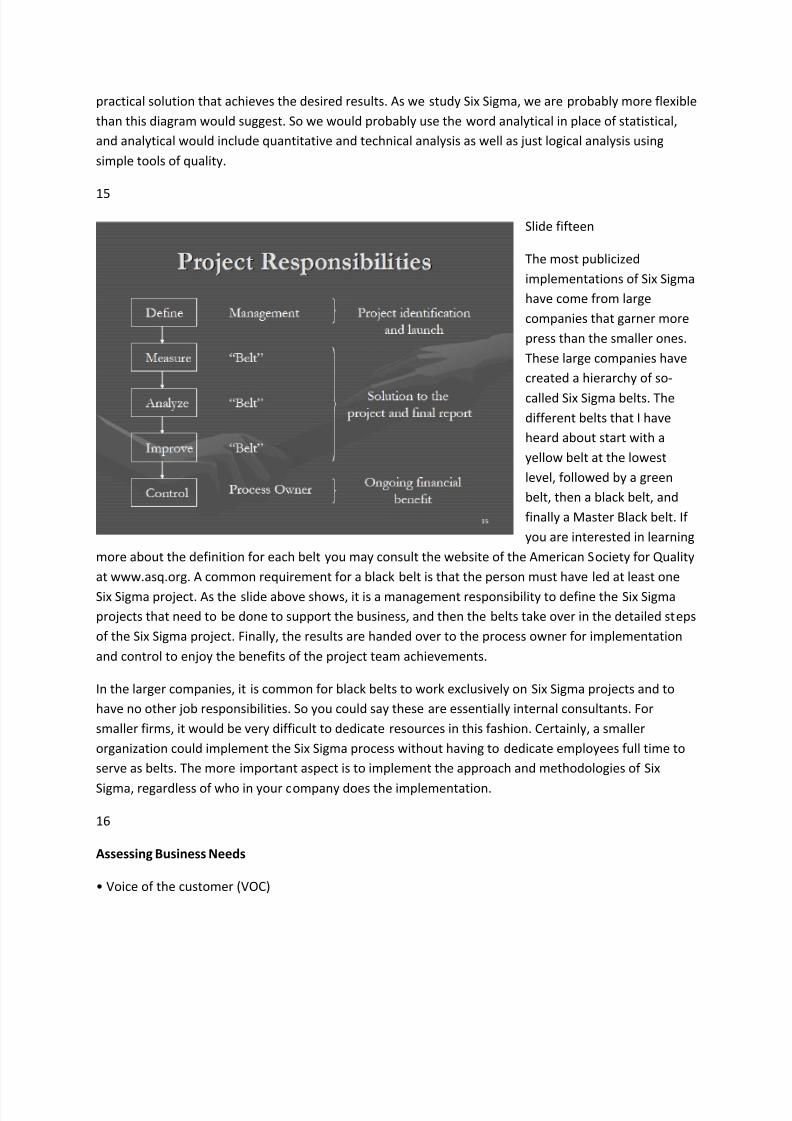
Slide fifteen
The most publicized
implementations of Six Sigma
have come from large
companies that garner more
press than the smaller ones.
These large companies have
created a hierarchy of so-
called Six Sigma belts. The
different belts that I have
heard about start with a
yellow belt at the lowest
level, followed by a green
belt, then a black belt, and
finally a Master Black belt. If
you are interested in learning
more about the definition for each belt you may consult the website of the American Society for Quality
at www.asq.org. A common requirement for a black belt is that the person must have led at least one
Six Sigma project. As the slide above shows, it is a management responsibility to define the Six Sigma
projects that need to be done to support the business, and then the belts take over in the detailed steps
of the Six Sigma project. Finally, the results are handed over to the process owner for implementation
and control to enjoy the benefits of the project team achievements.
In the larger companies, it is common for black belts to work exclusively on Six Sigma projects and to
have no other job responsibilities. So you could say these are essentially internal consultants. For
smaller firms, it would be very difficult to dedicate resources in this fashion. Certainly, a smaller
organization could implement the Six Sigma process without having to dedicate employees full time to
serve as belts. The more important aspect is to implement the approach and methodologies of Six
Sigma, regardless of who in your company does the implementation.
16
Assessing Business Needs
• Voice of the customer (VOC)
8/3/2019 The Six Sigma Process
http://slidepdf.com/reader/full/the-six-sigma-process 11/50
– Customer needs, expectations about your products, services
• Voice of the business (VOB)
–Needs and expectations of the business, including owners and participants
• Problems exist when VOC and VOB are misaligned
When we are defining Six Sigma projects, we need to consider both the voice of the customer and the
voice of the business in order to support our selection of the right projects. The voice of the business
might be telling us that we need higher profits. One way to achieve this would be to simply raise prices.
The problem with such a strategy is that the voice of the customer may be telling us we need to lower
prices. So perhaps a better project in this situation would be to look at the largest cost elements of our
products and try to figure out a way to lower those costs substantially, so that we could simultaneously
lower our prices for customers and improve our profit margins for a business.
17
The Business Case Template for Project Identification
“As a company, our __________ performance for the ______ area is not meeting _________. Overall,
this is causing _________ problems, that are costing us as much as $____ per _____.”
One of the Six Sigma references I consulted suggested that every project proposal should have a
business case made for it. The reason for this is to cause people to think in business terms rather than in
personal terms. Many of us may have pet projects that we have wanted to do for years, but these may
not be the best projects for the business to undertake. So if we are forced to make a business case for
our pet project, we may see the weaknesses in that case so that we don't even propose it. Suchprescreening saves everybody time. The statement in this slide is a template for a business case
statement.
18
Business Case Example
“As a company, our repair parts availability performance for the customer service area is not meeting
customer expectations. Overall, this is causing lost sales and goodwill problems, that are costing us as
much as $500k per year.”
Use silent brainstorming techniques to develop business cases.
This slide contains a good example of a business case statement to support the submission of a Six
Sigma project proposal for consideration. As you can see, the statement above is a more forceful
statement then simply suggesting we should look into our repair parts operation.
19
8/3/2019 The Six Sigma Process
http://slidepdf.com/reader/full/the-six-sigma-process 12/50
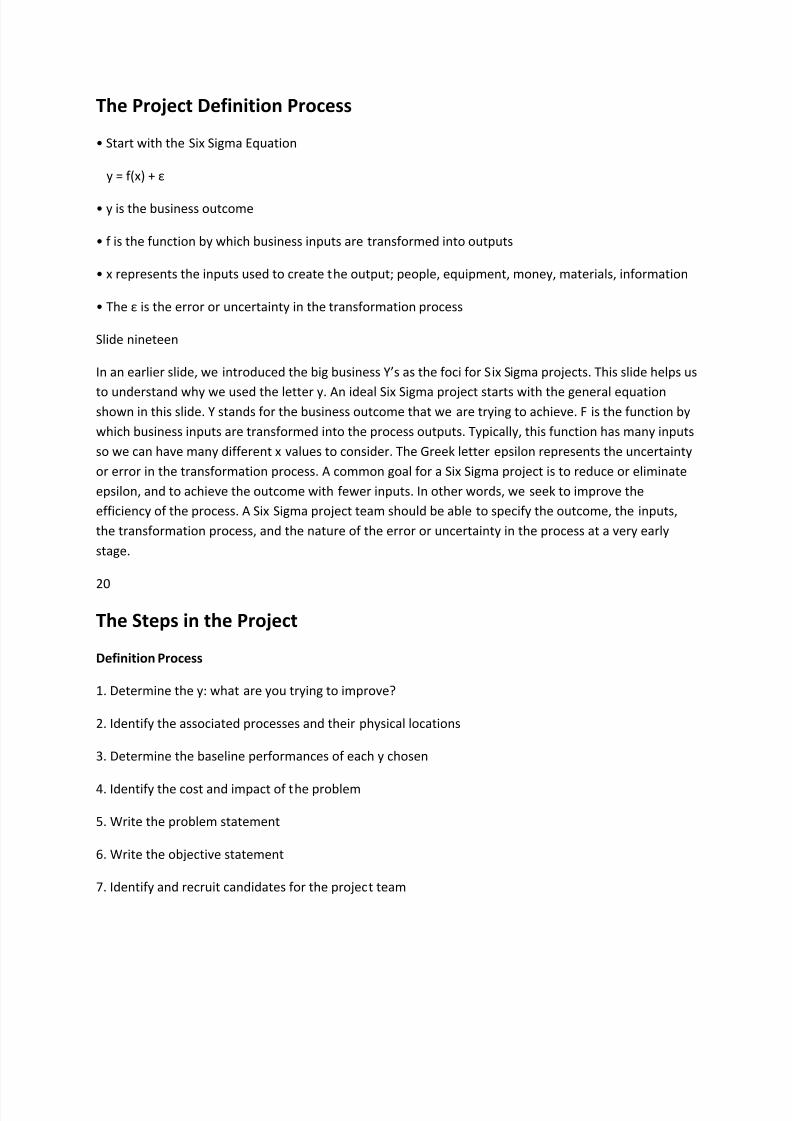
The Project Definition Process
• Start with the Six Sigma Equation
y = f(x) + ε
• y is the business outcome
• f is the function by which business inputs are transformed into outputs
• x represents the inputs used to create the output; people, equipment, money, materials, information
• The ε is the error or uncertainty in the transformation process
Slide nineteen
In an earlier slide, we introduced the big business Y’s as the foci for Six Sigma projects. This slide helps us
to understand why we used the letter y. An ideal Six Sigma project starts with the general equationshown in this slide. Y stands for the business outcome that we are trying to achieve. F is the function by
which business inputs are transformed into the process outputs. Typically, this function has many inputs
so we can have many different x values to consider. The Greek letter epsilon represents the uncertainty
or error in the transformation process. A common goal for a Six Sigma project is to reduce or eliminate
epsilon, and to achieve the outcome with fewer inputs. In other words, we seek to improve the
efficiency of the process. A Six Sigma project team should be able to specify the outcome, the inputs,
the transformation process, and the nature of the error or uncertainty in the process at a very early
stage.
20
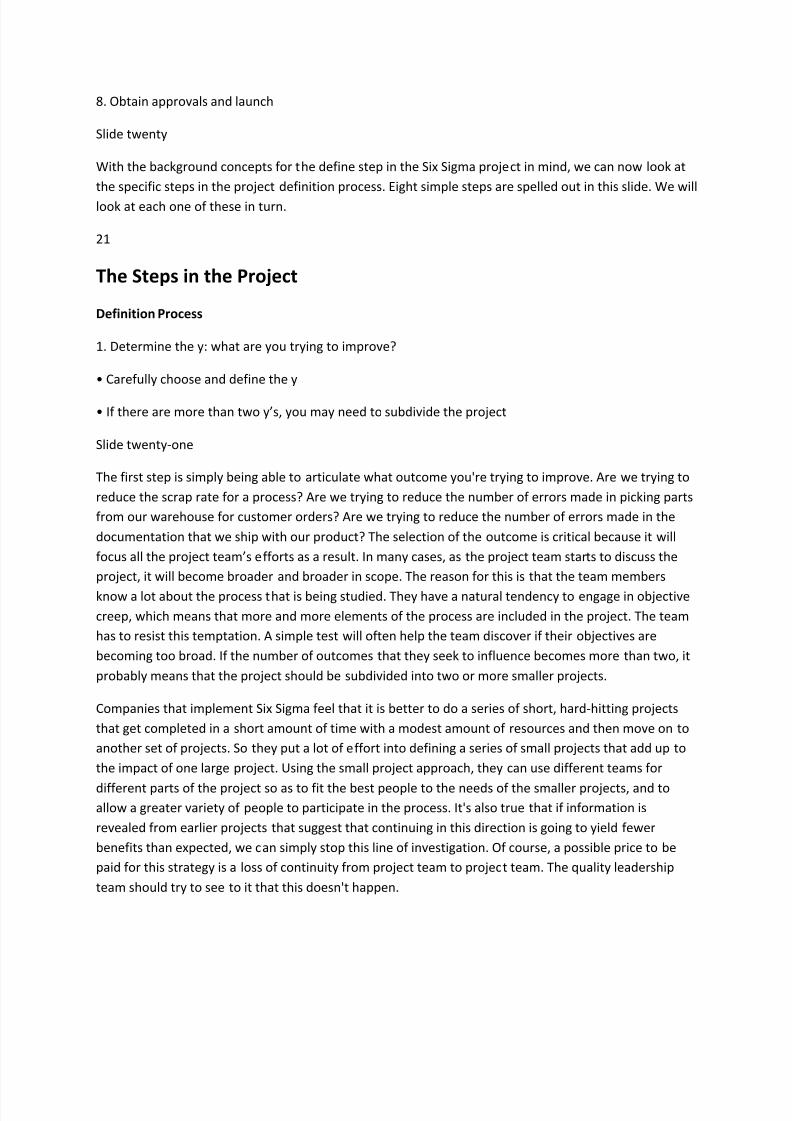
The Steps in the Project
Definition Process
1. Determine the y: what are you trying to improve?
2. Identify the associated processes and their physical locations
3. Determine the baseline performances of each y chosen
4. Identify the cost and impact of the problem
5. Write the problem statement
6. Write the objective statement
7. Ιdentify and recruit candidates for the project team
8/3/2019 The Six Sigma Process
http://slidepdf.com/reader/full/the-six-sigma-process 13/50
8. Obtain approvals and launch
Slide twenty
With the background concepts for the define step in the Six Sigma project in mind, we can now look at
the specific steps in the project definition process. Eight simple steps are spelled out in this slide. We will
look at each one of these in turn.
21
The Steps in the Project
Definition Process
1. Determine the y: what are you trying to improve?
• Carefully choose and define the y
• If there are more than two y’s, you may need to subdivide the project
Slide twenty-one
The first step is simply being able to articulate what outcome you're trying to improve. Are we trying to
reduce the scrap rate for a process? Are we trying to reduce the number of errors made in picking parts
from our warehouse for customer orders? Are we trying to reduce the number of errors made in the
documentation that we ship with our product? The selection of the outcome is critical because it will
focus all the project team’s efforts as a result. In many cases, as the project team starts to discuss the
project, it will become broader and broader in scope. The reason for this is that the team members
know a lot about the process that is being studied. They have a natural tendency to engage in objective
creep, which means that more and more elements of the process are included in the project. The team
has to resist this temptation. A simple test will often help the team discover if their objectives are
becoming too broad. If the number of outcomes that they seek to influence becomes more than two, it
probably means that the project should be subdivided into two or more smaller projects.
Companies that implement Six Sigma feel that it is better to do a series of short, hard-hitting projects
that get completed in a short amount of time with a modest amount of resources and then move on to
another set of projects. So they put a lot of effort into defining a series of small projects that add up to
the impact of one large project. Using the small project approach, they can use different teams for
different parts of the project so as to fit the best people to the needs of the smaller projects, and toallow a greater variety of people to participate in the process. It's also true that if information is
revealed from earlier projects that suggest that continuing in this direction is going to yield fewer
benefits than expected, we can simply stop this line of investigation. Of course, a possible price to be
paid for this strategy is a loss of continuity from project team to project team. The quality leadership
team should try to see to it that this doesn't happen.
8/3/2019 The Six Sigma Process
http://slidepdf.com/reader/full/the-six-sigma-process 14/50
22
The Steps in the Project
Definition Process
2. Identify the associated processes and their physical locations
• Identify the processes involved in creating the y
• Create at least a high level process map for each using flow chart techniques, or a SIPOC diagram
(suppliers, inputs, processes, outputs, customers)
• Identify the locations of the processes
Slide twenty-two
In the normal Six Sigma project, the outcome to be sought is obtained through the behavior of one ormore processes. So the second step in the project definition process is to briefly spell out what these
operational processes are. In addition to simply listing them and identifying their locations, a
recommended approach is to create some sort of a high-level process map for each process. This can be
done utilizing a flowchart which we will study in our tools of quality module. A more elaborate form of a
simple flowchart that has gained favor in Six Sigma projects is called a SIPOC diagram. This diagram
identifies the customers of a process, the outputs they receive, the processes used to create the
outputs, the inputs that the processes use, and the suppliers for those inputs. Even in small company
environments, it is common that these elements are located in different geographies and so
coordination becomes an issue.
Some companies have developed some fairly elaborate techniques in the construction of these
diagrams.
One technique is to move the flowchart symbol into a column that represents a particular department.
The flowchart then appears to jump back and forth between departments, but it gives all involved a
clear picture of which department is responsible for which steps in the process. We will talk more about
how to use such tools in a later module.
23
The Steps in the Project
Definition Process
3. Determine the baseline performances of each y chosen
• How bad is bad?
8/3/2019 The Six Sigma Process
http://slidepdf.com/reader/full/the-six-sigma-process 15/50
• Measure and plot performance (a control chart might be used to show the behavior over time)
Slide twenty-three
Once the big picture is clear and the processes have been identified, the next step is to assess their
health. How bad are the processes? If they are performing at world-class standards, then perhaps we
need to look elsewhere for our Six Sigma project ideas. The team may want to obtain any
documentation of the process performance from the process owners. This could include statistical
process control charts, a tool of quality that we will study later. Assuming that the team decides that
there are opportunities for improving one or more of the processes involved in producing the outcome
we seek, we can move to the next step in the definition process.
24
The Steps in the Project
Definition Process
4. Identify the cost and impact of the problem
• Is it worth doing?
• Hard savings - reduce expenses to produce a financial improvement
• Soft savings (or gains) - are financial benefits that may occur as a result of your project, but cannot be
directly measured and related to your work; an example is improved customer satisfaction leading to
additional business
• Potential savings - are hard savings but require action to achieve; an example is a re-design of aproduct that has not yet been implemented, but should produce a material savings
Slide twenty-four
Now we come to the real question; is this project worth doing? To answer the question, the Six Sigma
process suggests that we consider the three potential areas of impact shown in the slide. First, do we
believe there are some hard savings from this project in the form of reduced costs or expenses that are
likely to result from our efforts? If so, is the magnitude of those gains large compared to the costs of
doing the project? The second area to consider is so-called soft savings or gains. As an example, suppose
you are implementing an ERP system that allows you to closely track your production as it moves
through your facility. This better tracking allows you to answer customer inquiries about the progress of
their orders more exactly. It does not necessarily help you get their orders done faster, better, or
cheaper, but it does allow you to communicate the status of the orders more accurately to the
customers. This could cause your customers to decide that your firm is a better managed firm than your
competitors and it might make them less likely to switch to a competitor. This is a potential benefit, but
it cannot be guaranteed. If you implement the system and provide better information to your customers
and your business picks up, it may still be difficult to claim that it was because of the improved
8/3/2019 The Six Sigma Process
http://slidepdf.com/reader/full/the-six-sigma-process 16/50
communication rather than other things going on in your business. The final area for consideration is
potential savings. Suppose you are doing a study of order entry errors made by order entry personnel
when processing fax orders. You discover that a number of your customers have the capability of doing
EDI. However, you don't currently have the software to support it. You do a financial analysis and
discover that if you purchased it, it would help improve your accuracy and that you would need fewer
order entry people. The combination looks economically viable, but you have to implement the process
in order to make the gain. When your team presents its findings to the quality leadership team of your
company, your team should always include all the potential benefits in order to make the strongest case
for consideration of implementing your ideas.
25
The Steps in the Project
Definition Process
5. Write the problem statement concisely
• Description of problem and metric used
• Where the problem is occurring by process name and location
• The timeframe over which the problem has been occurring
• The size or magnitude of the problem
Slide twenty-five
The fifth step in the problem definition process is to write a concise problem statement. We have anexample in the next slide, but you will see that our concise statement is much longer than the
alternative that we present. So even though we say concise, we do want the elements listed in this slide
to be included. This standard format helps decision-makers compare potential projects so that they can
make good choices of which to staff and support. In some instances, overzealous writers of problem
statements might tell us many details of specific situations that have led them to propose a Six Sigma
project. Such statements will not be as concise as if we follow the template in this slide, and will make it
more difficult for the quality leadership team to understand exactly what is being proposed.
26
The Steps in the Project
Definition Process
5. Write the problem statement concisely
• Poor problem statement – our customer service levels on repair parts are too low and must be
improved
8/3/2019 The Six Sigma Process
http://slidepdf.com/reader/full/the-six-sigma-process 17/50
• Better problem statement – our customer service levels on repair parts average 78 per cent for high
volume parts, and 86 per cent for all others. These are below the target levels of 95% across the board.
Based on production records, they have resulted in interruptions of 10 per cent of our jobs in order to
process emergency orders, causing us to set up the interrupted job twice at an average cost of $500 per
job. Based on customer quotes that were rejected due to length of time needed to fill the order, we
estimate that we could increase revenue by $500k per year, and profit by 35 per cent of that if we could
achieve our target.
Slide twenty-six
We provide a not so good example of a problem statement in this slide and then a better example.
Notice that the poor problem statement is general and vague; it provides no ability for the reader to
assess the potential impact of addressing the problem. The second statement, although it is longer than
the first, is a much more forceful statement that does allow the reader to at least consider what the
impact might be under different assumptions about the effectiveness of the solution. I think it is easy to
see from this example that a good template should be used in your company to guide the development
of problem statements.
27
The Steps in the Project
Definition Process
6. Write the objective statement
• How much is enough?
• Entitlement – is the best performance that a process as currently designed has delivered in actual
operation
• The Hidden Factory – is all the indirect or overhead expense needed to do things the way you do
them; for example, rework stations
• Breakthrough Improvement – a standard rate for Six Sigma projects is 70 per cent
• Write an aggressive objective statement that specifies both the metric improvement and the time to
achieve it
Slide twenty-seven
After we write a problem statement, the next step is to write an objective statement. Here the critical
question is how aggressive should be objective statement be? In addition to the standard suggestion of
a 70% improvement, there are some other ideas in our slide. The first idea is the concept of entitlement.
Suppose that the project is focused on reducing the scrap rate of the manufacturing process. Currently,
the average scrap rate for the process is 2% of all the units produced. But if we look at daily production
8/3/2019 The Six Sigma Process
http://slidepdf.com/reader/full/the-six-sigma-process 18/50
records for the process, we find that at one point in time for a few weeks the process averaged a scrap
rate of only one half of 1%, or 0.5%. The 0.5% rate is the entitlement rate. Since the process has
demonstrated that it is capable of producing this rate, our objective is to figure out how to make it do
this all the time rather than just on a rare occasion.
A second aspect to consider involves the concept of the hidden factory. The hidden factory is all theindirect or overhead operations that are required because of the way you currently do business. For
example, suppose that you have not developed any computerized methods of ordering replenishment
orders in your purchasing department. As a result, you have to have a purchasing agent review every
purchase order before it's released to a supplier for processing. It would probably be pretty easy to
develop some intelligent purchasing reordering rules that would take care of 70 or 80% of the orders
that you place on your suppliers, and that could be done directly by the computer with no human
intervention. The end result of this could be to substantially reduce the number of purchasing agents
needed to do all these purchase order reviews; in other words the elimination of some of the hidden
factory. You might say we are merely transferring the hidden factory from the purchasing department to
the information systems group to do the programming. Notice, however, that the software has to bedeveloped only once whereas the purchasing agent reviews go on and on.
Notice the last bullet on this slide. It is important to put some bounds around the project objective, so
you should not only specify the metric improvement but also the amount of time you expect it to take to
achieve it. This puts some pressure on the project team to maintain a brisk schedule throughout the
duration of the project. The timeline does not need to be at breakneck speed timeline, but it should
keep the pressure on the project team.
28
The Steps in the Project
Definition Process
7. Ιdentify and recruit candidates for the project team
• Process experts from each of the processes involved
• Be sure they can devote the time to the project
• At least one person with broad expertise in the problem solving process and the various tools that can
help
Slide twenty-eight
If every step in the project definition process so far appears to meet the standards in effect in your
company, you can now consider potential team members for the project. Depending on the culture in
your company, you may need to get permission from each person's supervisor in order to approach
them about serving on your team. You want to get the best possible people to serve on your project
8/3/2019 The Six Sigma Process
http://slidepdf.com/reader/full/the-six-sigma-process 19/50
team. It may very well be the case, however, that a number of your first choices are already booked
heavily on other projects. This may either cause you to delay the timing of your project kickoff or to
accept other choices for your project team. Be careful and do not accept team members for your team
that you do not believe can do the job.
A few years ago, I needed an instructor for the new joint degree program between the engineeringschool and the management school that I was managing. This particular need was for an engineering
professor and so I obtained a recommendation from one of the department chairs in the engineering
school. Since I had a number of friends on the engineering faculty, I called one of them and asked for his
opinion of the recommendation that I had received. He told me that he thought the chairperson who
made the recommendation was trying to solve the chairperson’s problem and not my problem, since
the faculty member who had been recommended was not widely regarded as a good instructor. I kept
searching.
Another important point is to make sure that the people on the team can devote adequate time to the
project. A final point is to make sure the team has a Six Sigma or quality expert on the team. If your
company is a small company and does not have the resources to have certified belts on staff, you can
still have a resource person who does bring wide and deep knowledge about the problem-solving
process and the various tools available.
29
The Steps in the Project
Definition Process
8. Obtain approvals and launch
• Get buy-in early!
• The process owner is key!
• Have an executive sponsor to remove obstacles, provide resource support as needed, and keep the
pressure on the team to perform
Slide twenty-nine
With our staffing lined up, we are almost good to go. What remains is to obtain the approval of the
quality leadership team for your project and launch. Even though this is the step where you seek formal
approval, you should typically have discussed this project with the process owner and appropriate
members of the quality leadership team long before now. You should have received encouragement
from those conversations in order to proceed to this point. The process owner is the individual who has
formal authority over the biggest piece of the process being studied, even though this is unlikely to be
the entire process. If this individual is very positive and passionate about your project, then your
chances for success are greatly improved. A good executive sponsor can make a huge difference in how
8/3/2019 The Six Sigma Process
http://slidepdf.com/reader/full/the-six-sigma-process 20/50
easy or hard it is to make progress on a project. In our teambuilding module, we discussed the duties
and responsibilities of the executive sponsor.
30
Outline
• Motivation and background
• Define
•Measure
• Analyze
• Improve
• Control
Slide thirty
We spent a lot of time on the design phase of the Six Sigma process. That's okay because the define
phase is probably the most important phase of the Six Sigma process. It is very, very important that we
get it right. Assuming we did, we are now ready to move on to the measure phase.
31
The Importance of Measurement
• "If you can't measure it, it's not worth doing." - Fred Smith, Federal Express Corporation
• If it doesn’t get measured, it doesn’t get better!
• There is a science of measurement, called metrology, that we will introduce in a later module entitled
“Quality Measurement and MIS”
Slide thirty-one
In our quality management module, we talked about the prominent role that measurement had played
in the quality management process. We used a very similar slide to this one in that module. We note in
the slide in this module that we will be introducing the science of metrology later in the course. We alsotalked about the psychology of measurement in a quality management module. I have an example from
the healthcare field to further illustrate this psychology that I thought you might find interesting. Many
years ago, when I first introduced the total quality management course into our curriculum, I was able
to get the director of quality management for the Cleveland Clinic to come and visit with my class. He
was a physician at the clinic who had taken on the role of quality director. His approach appeared to be
very laid back at first glance. He explained to us that for a particular DRG the clinic would have a
8/3/2019 The Six Sigma Process
http://slidepdf.com/reader/full/the-six-sigma-process 21/50
standard care path. This is simply a recommended program of treatment for that particular disease.
Suppose that patients for a particular DRG that includes a surgical procedure are supposed to receive a
particular medication within two hours after the surgery if the patient exhibits a certain marker (for
example, extremely high blood pressure). What the director and his staff would do is simply measure
the proportion of patients who were receiving the medication if they were supposed to, and also the
proportion of patients receiving it within the proper time frame. They would feed this information back
to the caregivers who were involved in the patient care process. Then they would measure the same
variables again. He reported for whole series of these before and after measures, where the only
intervention was to provide a report that summarized the measurements. In every case, the after
measures showed a dramatic improvement that approached perfection. In a number of cases, the
before measurements were surprisingly low. Obviously, in a medical environment such as this, the staff
is extremely professional so that this gentle feedback process had a profound effect. Nonetheless, the
example illustrates the power of measurement and feedback.
32
Measurement and Statistics
• Definition of statistics – making sense out of data!
• British Prime Minister Benjamin Disraeli once said: “There are three kinds of lies: lies, damn lies, and
statistics.”
• He probably never got a Six Sigma Black Belt!
Slide thirty-two
The use of statistics is often an important feature in the measure, analyze, and improve steps in the SixSigma process. So we introduce it here at the measure step since it is very common to use statistical
measurements as a part of this process. I should note that the definition of statistics shown in this slide
is my definition and not that of a Ph.D. statistician. I should also mention that for students who have had
and remember their basic statistics course, the following section of this module will be a simple review.
If you have not had statistics, this will be a gentle introduction but you will need to become more
knowledgeable in statistics if you expect to be a strong performer in a Six Sigma process.
33
Sample versus Population
• Population is all members of a particular group; i.e. all males working at a particular company
• Sample is a subset of the population; i.e. all males working as machinists at the company
Slide thirty-three
8/3/2019 The Six Sigma Process
http://slidepdf.com/reader/full/the-six-sigma-process 22/50
One of the most powerful aspects of statistics is that we can estimate the characteristics of a large group
by only measuring those characteristics for a small group. The small group is called a sample and the
large group is called the population. We have to be careful about the manner in which we select a
sample or it may not be representative of the population. Whenever we can compute a measure based
on a sample we call it a statistic. If we have the measurements for the entire population and we do a
computation, we call it a population parameter.
34
Discrete versus Continuous Data
• Discrete data can take on only a limited number of values; for example, the number of rooms in a
house is discrete
• Continuous data refers to things that can be measured as finely as our measuring instruments can go;
for example, height can be measured in feet, inches, centimeters, millimeters, etc. as fine as our
measuring instruments can measure it
Slide thirty-four
For anything that we measure, due to the limitations of our measuring instruments, our measurements
are actually discrete. However, phenomena that we want to measure may naturally exist as either
discrete or continuous data. If we want to know how many students are in our class; that is clearly a
discrete measure. We count the number of students and it has to be an integer such as 20 or 34 or some
similar number. If we had fine enough instruments to measure the temperature in our classroom
whenever we are meeting, it could be measured on a somewhat continuous scale. Even though we
normally quote temperatures on a discrete scale, so we might say it's 75° outside today. In reality, it may
be 74.9358°, but our measuring instrument is a digital instrument that only displays integer values of the
temperature. For statistical purposes, it is useful to know whether the data we're working with are
discrete or continuous.
35
Teaching by Example
• In the slides that follow, we will use the data we collected from the class members at a prior client
company consisting of their height, weight, and sex to illustrate statistical measurement and analysis
concepts
Slide thirty-five
Since there were 24 men in the class and only eight women, in some of the illustrations that follow we
will only use the male portion of our data.
8/3/2019 The Six Sigma Process
http://slidepdf.com/reader/full/the-six-sigma-process 23/50
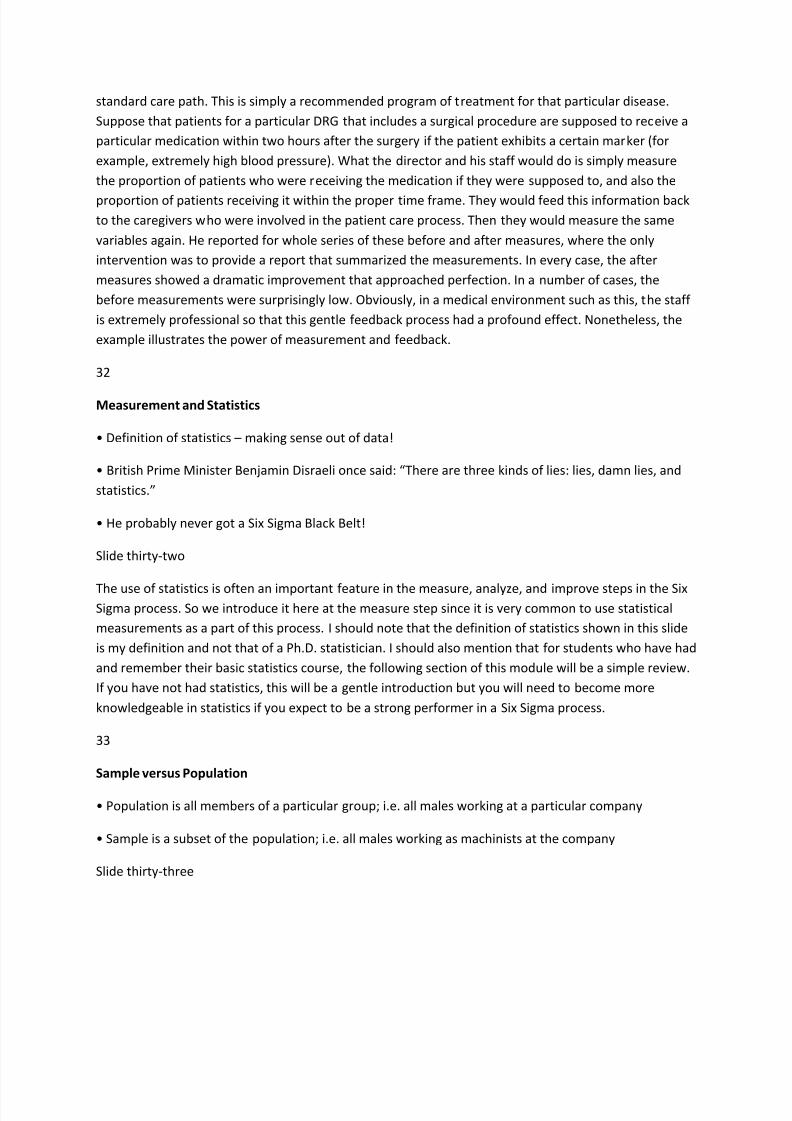
36
Slide thirty-six
We entered the data from our 32 students into an Excel spreadsheet as shown in this slide. We will treat
the height and weight values as being continuous, and the sex variable as discrete. We have coded the
discrete variable with a one for a woman and a zero for a man.
37
Descriptive Statistics
• Descriptive statistics are used to describe something that we have measured so as to summarize the
measurements in some fashion
• Two broad categories are:
–Measures of central tendency
–Measures of dispersion (variation)
8/3/2019 The Six Sigma Process
http://slidepdf.com/reader/full/the-six-sigma-process 24/50
Slide thirty-seven
The first thing we will do with our data is compute some simple descriptive statistics that include both
measures of central tendency and of dispersion or variation.
38
Measures of Central Tendency
• Average or mean
• Median
• Mode
Slide thirty-eight
Three common descriptive statistics that measure the central tendency from a set of data are the mean,
median, and mode. We will illustrate each in the following slides.
39
Average or Mean
• The average or mean of a set of numbers is computed by adding all the numbers together, and then
dividing by the number of numbers
Slide thirty-nine
The arithmetic mean is the same arithmetic mean that you learned about in elementary school.
40
8/3/2019 The Six Sigma Process
http://slidepdf.com/reader/full/the-six-sigma-process 25/50
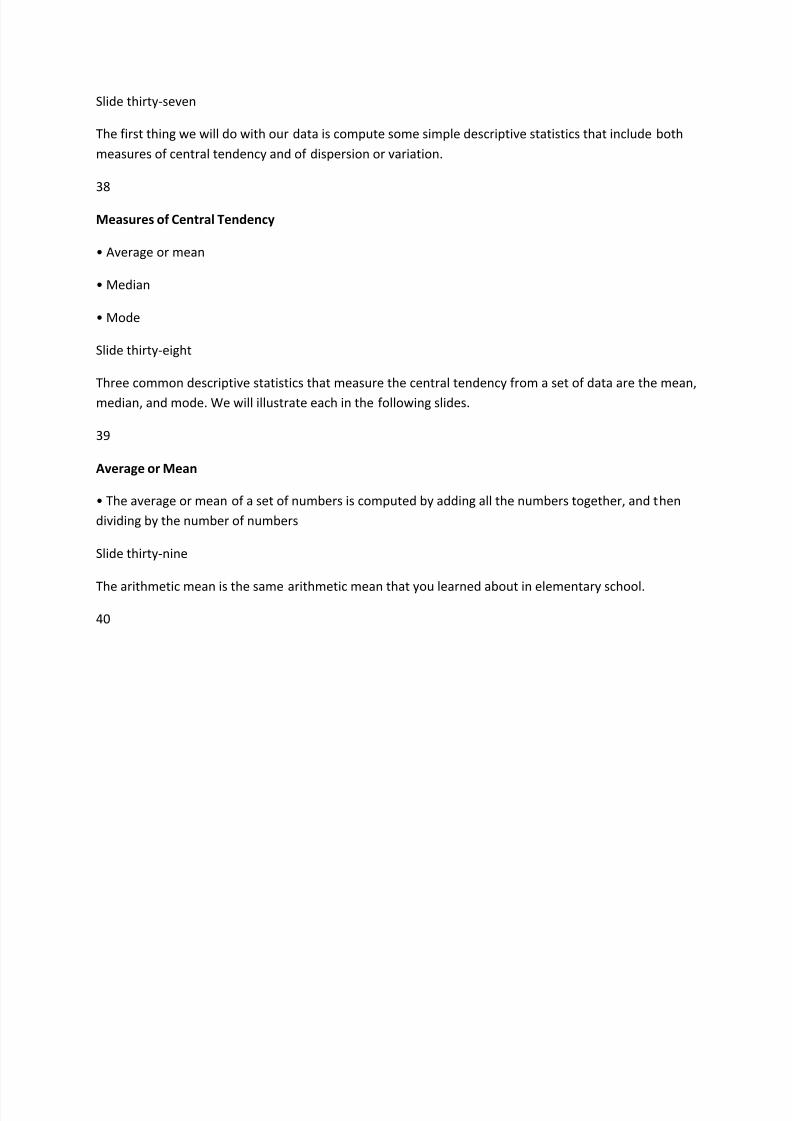
Slide forty
The 24 men in our data set average 71.15 inches in height, and have an average weight of 197.16
pounds. You can verify these results by adding the values shown in the slide and dividing by 24 in each
case since there are 24 males.
41
Median
• The median is the middle value in a sorted set of values if there are an odd number of values
• It is the average of the two middle values, if there is an even number of values in the set
Slide forty-one
In general, the median value is just the middle value of a sorted list of numbers. In case there is an even
number of values, we average the middle two to determine the median.
42
8/3/2019 The Six Sigma Process
http://slidepdf.com/reader/full/the-six-sigma-process 26/50
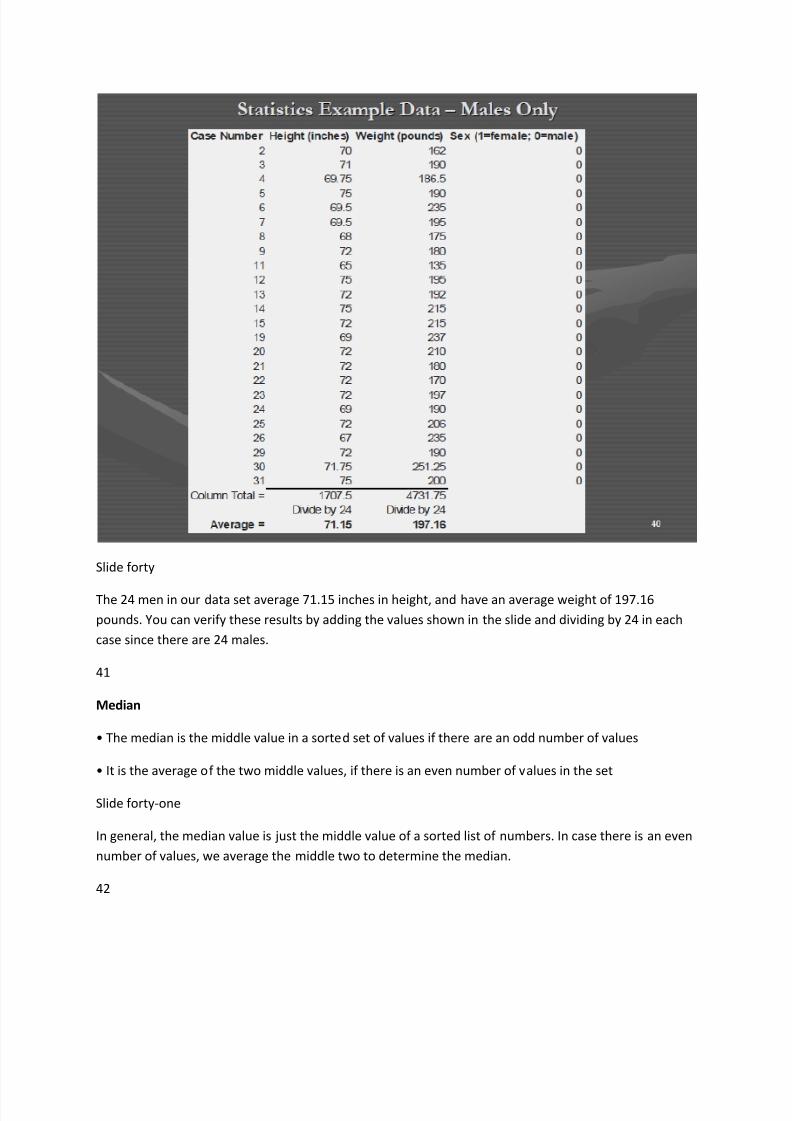
Male Data Sorted by Height
Slide forty-two
For our sample data, we sorted the male data from lowest to greatest height. Since we have 24 values,
we will have to average the middle two to determine the median. To do that, we count down to the
12th and 13th values in the list, and average them as shown in the slide. The result is a median value of
72 inches.
43
Mode
• The mode is the value in the set of values that occurs most frequently
• It is sometimes confusing because there can be multiple modes, or no mode in continuous data if
every measurement is unique
• Not as useful as mean and median
Slide forty-three
8/3/2019 The Six Sigma Process
http://slidepdf.com/reader/full/the-six-sigma-process 27/50
The mode is defined as the value in the data set that occurs the most frequently. It is not considered as
useful as the mean or medium, because there can be multiple modes or no mode at all if every value in
the data set is unique.
44
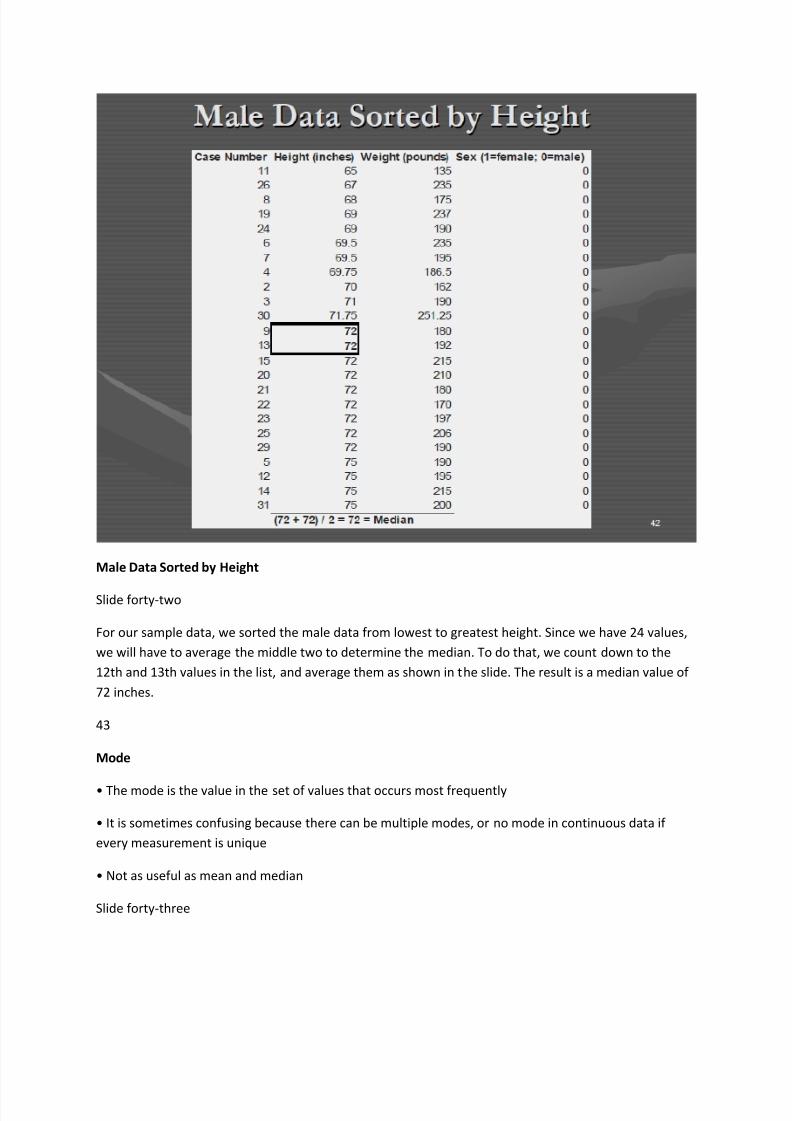
Male Data Sorted by Height
Slide forty-four
For the male data sorted by height, the modal value is 72 and this value occurs nine times in the data.
45
Measures of Dispersion or Variation
• Range
• Mean Absolute Deviation
• Standard Deviation
8/3/2019 The Six Sigma Process
http://slidepdf.com/reader/full/the-six-sigma-process 28/50
Slide forty-five
We will consider these three simple descriptive statistics for measuring variation in the data. Sometimes
when I am explaining measures of variation to people in companies who do not like statistics, they
accuse me of just creating confusion that is unnecessary. So I have come up with a simple example that I
share with them to try to illustrate the importance of variation. I asked them to imagine a bottling andpackaging operation that is filling 12 ounce longneck bottles with their favorite beverage, capping the
bottles, and putting them in cases of 24 bottles each for delivery to our local beverage store. The filling
operation is so fast that we have two people who take the filled bottles and place them in the case
containers. Each person of the two takes every other bottle. Now suppose that be pouring operation
functions as follows. It dispenses 6 ounces of liquid into the first bottle, and then dispenses 18 ounces
for the second bottle. Of course, this overflows the second bottle and some of our precious liquid spills
out and is lost. This pattern of first 6 ounces and then 18 ounces continues so all the odd-numbered
bottles have 6 ounces and all the even-numbered bottles are full to the cap. Now you go to your local
beverage store to pick up a case of your favorite drink. Do you want your case to contain all odd-
numbered bottles or even numbered bottles? In terms of the average, our process is perfect. It isdispensing an average of exactly 12 ounces of beverage per bottle. You can see that variation is a serious
problem in this example. No matter what Prime Minister Disraeli thinks, I think statistics can be
practically useful, especially if they keep me from buying a case of odd-numbered bottles.
46
Range
• The range is the difference between the largest value and the smallest value in a set of data
Slide forty-six
The range is the simplest of the three values and is the difference between the largest value and the
smallest value in a data set.
47
8/3/2019 The Six Sigma Process
http://slidepdf.com/reader/full/the-six-sigma-process 29/50
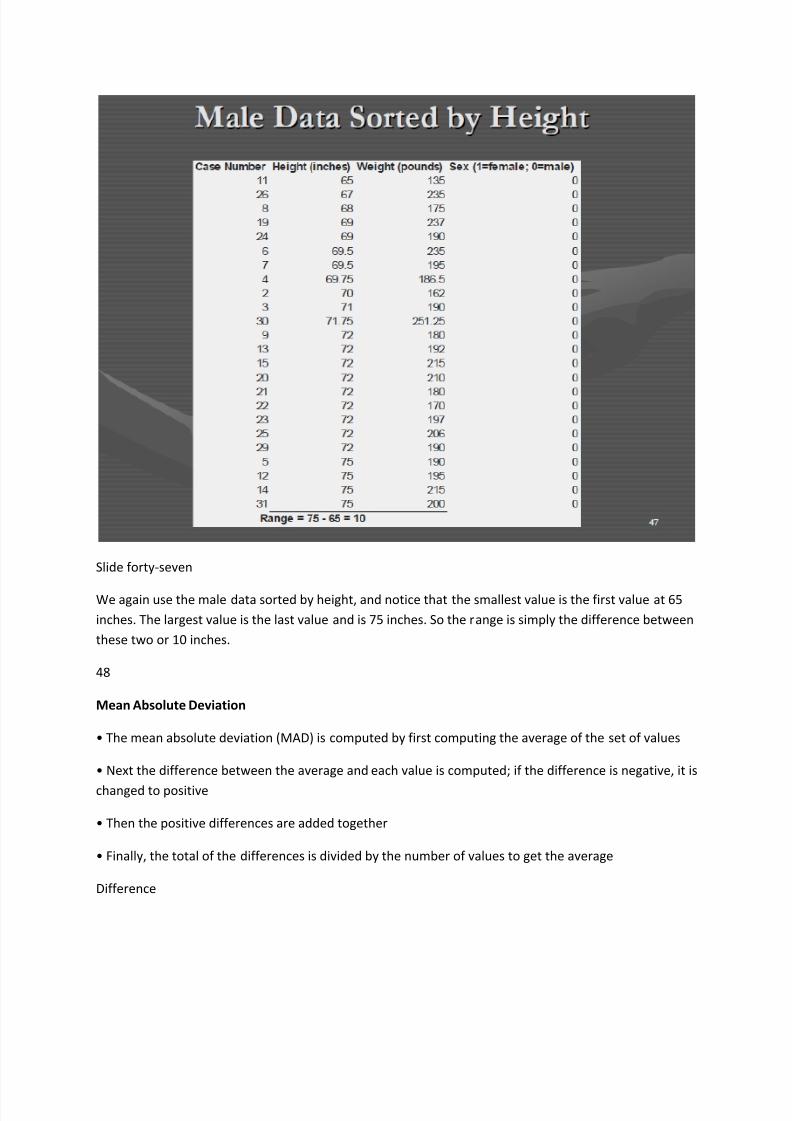
Slide forty-seven
We again use the male data sorted by height, and notice that the smallest value is the first value at 65
inches. The largest value is the last value and is 75 inches. So the range is simply the difference between
these two or 10 inches.
48
Mean Absolute Deviation
• The mean absolute deviation (MAD) is computed by first computing the average of the set of values
• Next the difference between the average and each value is computed; if the difference is negative, it is
changed to positive
• Then the positive differences are added together
• Finally, the total of the differences is divided by the number of values to get the average
Difference
8/3/2019 The Six Sigma Process
http://slidepdf.com/reader/full/the-six-sigma-process 30/50
Slide forty-eight
To compute the mean absolute deviation, we began by computing the difference between the mean
value and each individual value in the data set. Then we add up all those differences and divide by the
number of differences to obtain the average difference between the mean and the individual values.
The higher it is, the greater is the variation in the data. Let's look at an example in the next slide.
49
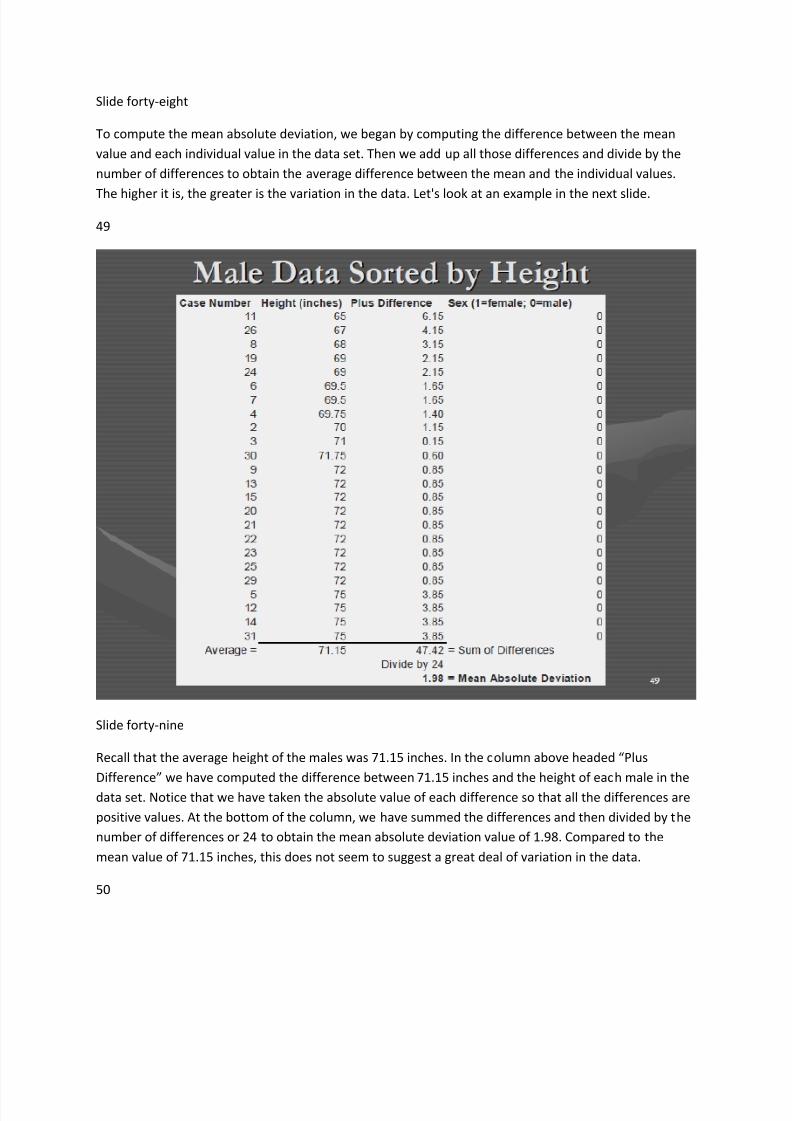
Slide forty-nine
Recall that the average height of the males was 71.15 inches. In the column above headed “Plus
Difference” we have computed the difference between 71.15 inches and the height of each male in the
data set. Notice that we have taken the absolute value of each difference so that all the differences are
positive values. At the bottom of the column, we have summed the differences and then divided by the
number of differences or 24 to obtain the mean absolute deviation value of 1.98. Compared to the
mean value of 71.15 inches, this does not seem to suggest a great deal of variation in the data.
50
8/3/2019 The Six Sigma Process
http://slidepdf.com/reader/full/the-six-sigma-process 31/50
Standard Deviation
• To compute the standard deviation, you start out similarly to the mean absolute deviation
• Instead of taking the positive difference between the average and the individual values, you compute
the squared difference
• Then you add all the squared differences, and divide by the number of differences minus 1
• Finally, you take the square root of that result
• Don't worry if this doesn't make sense now, we will learn how to interpret this value later
Slide fifty
Even if you have had statistics and are familiar with the standard deviation, you have to wonder how
statisticians came up with this value. The process to compute it is described in this slide, but it's easier to
follow with an example so we will go on to the next slide.
51
8/3/2019 The Six Sigma Process
http://slidepdf.com/reader/full/the-six-sigma-process 32/50
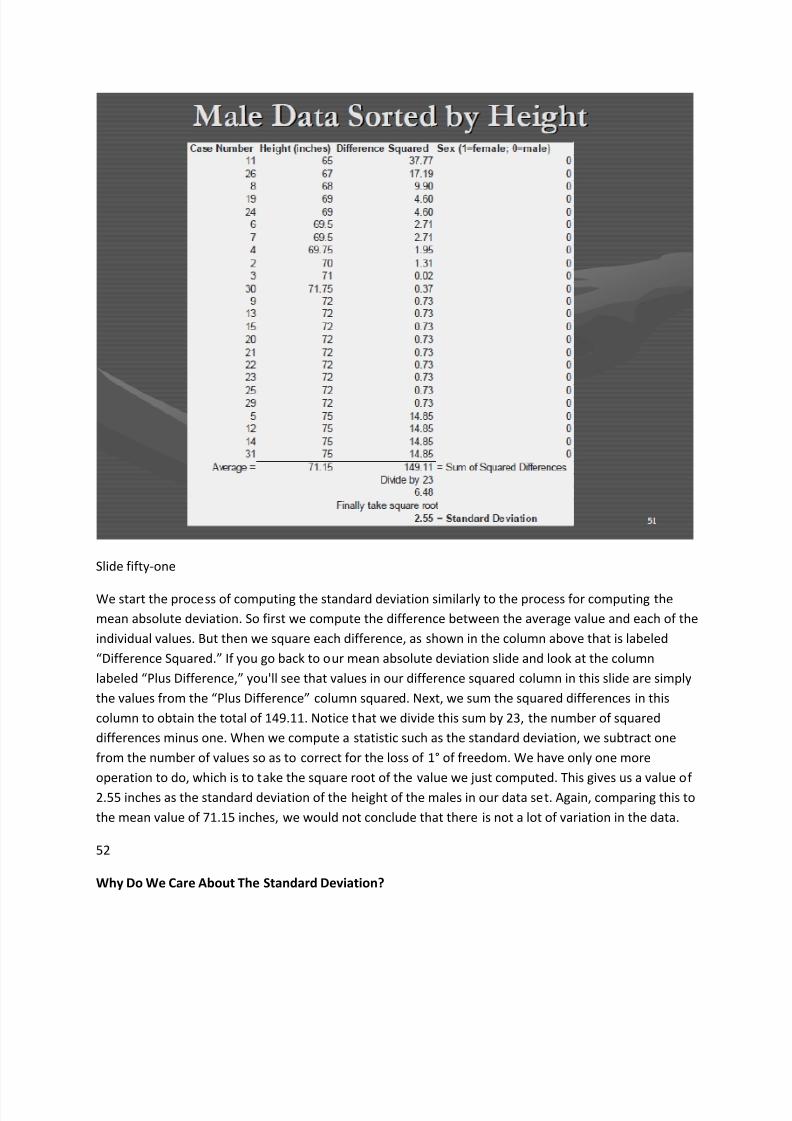
Slide fifty-one
We start the process of computing the standard deviation similarly to the process for computing the
mean absolute deviation. So first we compute the difference between the average value and each of the
individual values. But then we square each difference, as shown in the column above that is labeled
“Difference Squared.” If you go back to our mean absolute deviation slide and look at the column
labeled “Plus Difference,” you'll see that values in our difference squared column in this slide are simply
the values from the “Plus Difference” column squared. Next, we sum the squared differences in this
column to obtain the total of 149.11. Notice that we divide this sum by 23, the number of squared
differences minus one. When we compute a statistic such as the standard deviation, we subtract one
from the number of values so as to correct for the loss of 1° of freedom. We have only one more
operation to do, which is to take the square root of the value we just computed. This gives us a value of
2.55 inches as the standard deviation of the height of the males in our data set. Again, comparing this to
the mean value of 71.15 inches, we would not conclude that there is not a lot of variation in the data.
52
Why Do We Care About The Standard Deviation?
8/3/2019 The Six Sigma Process
http://slidepdf.com/reader/full/the-six-sigma-process 33/50
• If the data come from a normal or bell-shaped curve, we can make statistical statements about the
variation in the data as follows:
– 68.3% of the values should be between +/- one standard deviation or σ
– 95.4% of the values should be between +/- 2σ
– 99.7% of the values should be between +/- 3σ
Slide fifty-two
So we know how to compute the standard deviation, but why should we care? Well, we did learn in the
bottling example above that variation was important and the standard deviation is a measure of
variation. If our data come from a normal probability distribution and we know an estimate of the mean
and the standard deviation of the distribution, we can make statements such as those shown in this
slide about how the values behave. The Greek letter sigma (σ) is generally used in statistics books to
represent the standard deviation. For the normal distribution that we showed in the chart early in this
file, if we measure the area under the curve from minus one standard deviation to the left of the mean
or target value to plus one standard deviation to the right of the mean or target value, it will contain
68.3% of the total area under the curve. The ability to make this kind of statement is why we care about
the standard deviation.
53
Exploring Relationships Between
Variables
• Correlation
• Regression
Slide fifty-three
Sometimes we are interested in exploring the relationship between two or more variables. For such
instances, we employ statistical correlation and regression modeling.
54
Correlation
• Correlation coefficient measures the degree of relationship between two variables
• The range of values for the correlation coefficient is from -1 to +1
• A value of 1 means that the two variables are perfectly, positively correlated
• A value of 0 means there is no correlation between the two variables
8/3/2019 The Six Sigma Process
http://slidepdf.com/reader/full/the-six-sigma-process 34/50
• A value of -1 means that the two variables are perfectly negatively correlated
• On computer printouts, the correlation coefficient is generally abbreviated with the letter r
Slide fifty-four
We use a measure called a correlation coefficient to measure the degree of relationship between two
variables. The relationship is said to be a positive relationship if as the first variable increases the second
variable also increases. The relationship is said to exhibit negative correlation if as the first variable
increases, the second variable decreases. Two variables that exhibit perfect positive correlation will have
a correlation coefficient of one. Similarly, two variables that exhibit perfect negative correlation will
have a correlation coefficient of minus one. Let's look at some sample correlation coefficients for our
data.
55
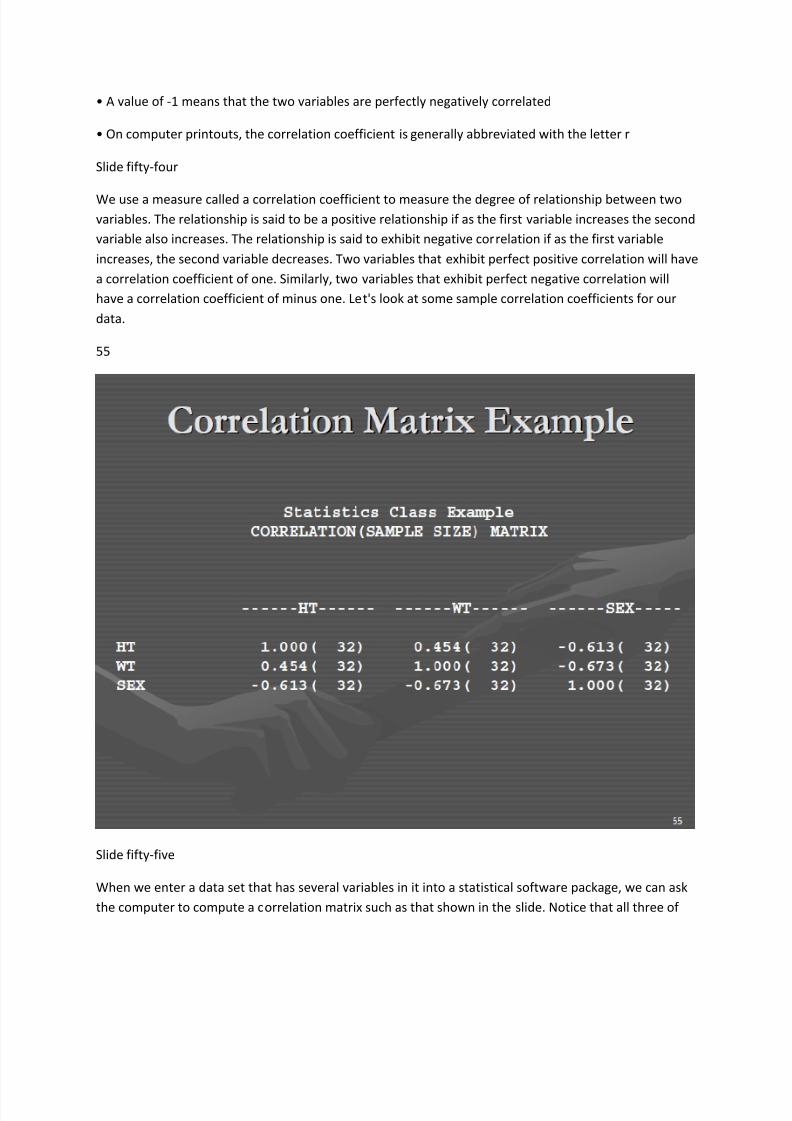
Slide fifty-five
When we enter a data set that has several variables in it into a statistical software package, we can ask
the computer to compute a correlation matrix such as that shown in the slide. Notice that all three of
8/3/2019 The Six Sigma Process
http://slidepdf.com/reader/full/the-six-sigma-process 35/50
our variables are listed down the side as well as across the top. So we are going to compute the
correlation coefficient for every possible pair of relationships. In the process, we compute the
correlation coefficient for each variable with itself, which results in the perfect 1.0 positive correlations
down the diagonal of the matrix. We are more interested in the values off the diagonal. If we read the
first line of the matrix under the column headed WT, we see that the correlation between height (HT)
and weight (WT) is 0.454. This is a positive correlation, which is what we would expect. The taller a
person is, the more we would expect them to weigh.
Reading one column further to the right in the same line, we see the correlation between height (HT)
and sex (SEX) is a -0.613. Remember that we coded this variable with zero for a male and one for a
female. So the higher the value of the sex variable, the shorter the person is likely to be because it is a
female.
56
Regression
• Regression analysis is used to estimate the mathematical relationship between two or more variables
• The goal may be to understand the relationship and/or to predict values of one variable based on the
other(s)
• The variable we are trying to predict is called the dependent variable
• The variables we are using to predict it are called independent variables
• The correlation coefficient is used to measure the "goodness" of fit, or strength of relationship
between the dependent and independent variables
Slide fifty-six
Sometimes we would like to be able to estimate a mathematical relationship between two or more
variables, such that we could use one or several variables to predict the value for a variable of interest
to us. We call the variable we are trying to predict the dependent variable, and the variables that we're
using to predict it independent variables. Let's look at a regression model and then I'll tell you about a
real application of regression I did some time ago.
57
8/3/2019 The Six Sigma Process
http://slidepdf.com/reader/full/the-six-sigma-process 36/50
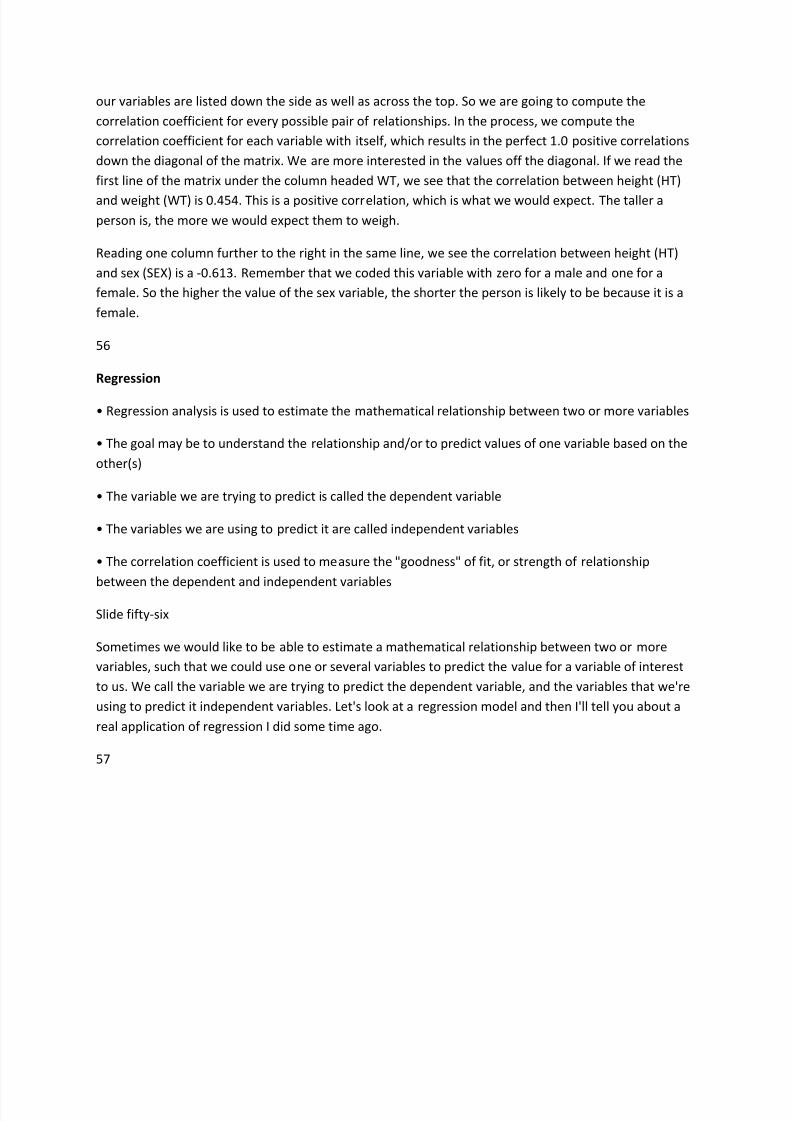
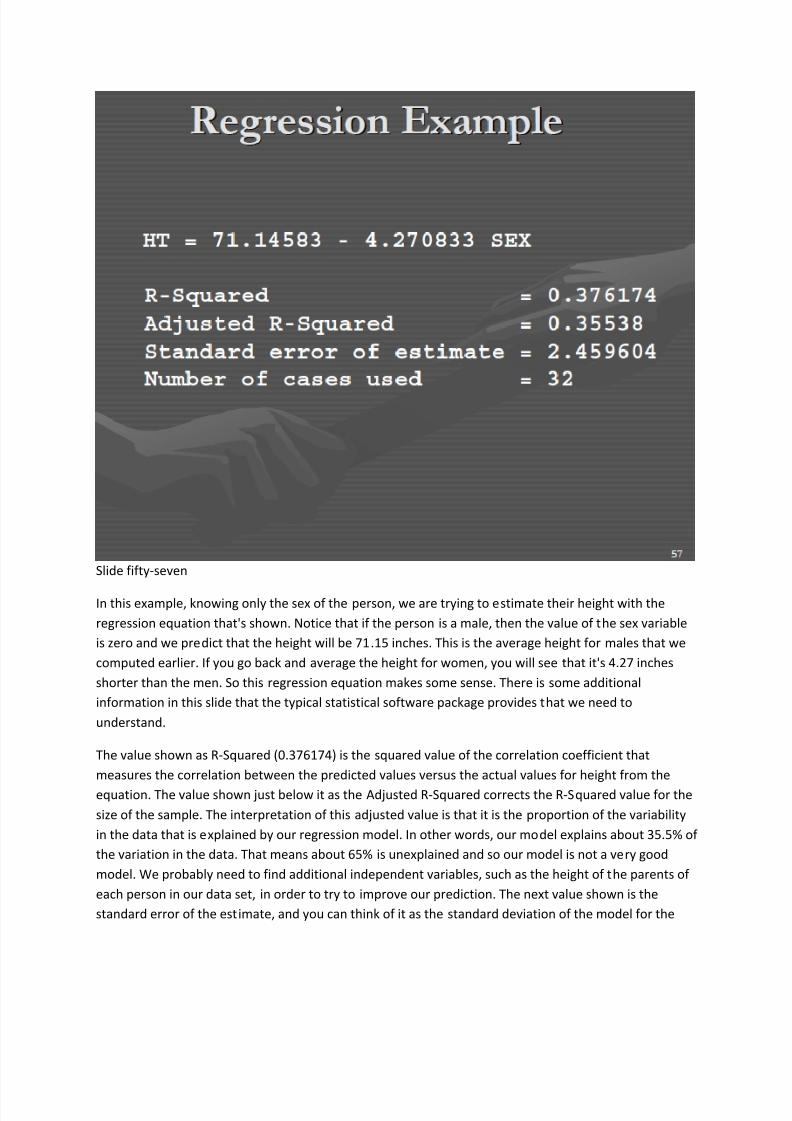
Slide fifty-seven
In this example, knowing only the sex of the person, we are trying to estimate their height with the
regression equation that's shown. Notice that if the person is a male, then the value of the sex variable
is zero and we predict that the height will be 71.15 inches. This is the average height for males that we
computed earlier. If you go back and average the height for women, you will see that it's 4.27 inches
shorter than the men. So this regression equation makes some sense. There is some additional
information in this slide that the typical statistical software package provides that we need to
understand.
The value shown as R-Squared (0.376174) is the squared value of the correlation coefficient that
measures the correlation between the predicted values versus the actual values for height from the
equation. The value shown just below it as the Adjusted R-Squared corrects the R-Squared value for the
size of the sample. The interpretation of this adjusted value is that it is the proportion of the variability
in the data that is explained by our regression model. In other words, our model explains about 35.5% of
the variation in the data. That means about 65% is unexplained and so our model is not a very good
model. We probably need to find additional independent variables, such as the height of the parents of
each person in our data set, in order to try to improve our prediction. The next value shown is the
standard error of the estimate, and you can think of it as the standard deviation of the model for the
8/3/2019 The Six Sigma Process
http://slidepdf.com/reader/full/the-six-sigma-process 37/50
predicted values. Notice that it is slightly smaller than the 2.55 value for the standard deviation that we
computed for males.
This is because the variations in height for the women were included here, and they exhibit less
variability than the men, so they reduce the overall variability. The last value in the slide just tells us that
all 32 people from our data set were included in these computations.
I promised an application example of regression. A number of years ago a graduate student and I were
working on a project for a company called Astro Metallurgical in Wooster, Ohio, that was a subsidiary of
Harsco Corp. The company was a titanium fabrication shop that manufactured heat exchangers and
pressure vessels. To make a pressure vessel, the first operation was to create a rolled and welded
cylinder. This looked like a big tin can where the top and the bottom had been removed. There were
four steps in this process, forming, fitting, seam welding, and re-rolling. The forming process started
with a big sheet of titanium of the proper length and width to create the proper sized cylinder, and then
we folded the sheet until the two edges met to form the basic cylinder shape. The fitting process very
carefully lined the edges up and clamped them together in a few places to keep them aligned. They
were then welded together. Since the welding operation created some stress, the cylinder shape was
sometimes distorted when the welding was completed. So the final step of re-rolling was done to
restore the nice cylinder shape before proceeding to additional operations. The company was having a
difficult time accurately estimating the cost of creating these cylinders, particularly the labor costs
involved in these four processes. As a result, jobs that they bid on and were awarded often resulted in
losses rather than profits because they were underestimated. They were not sure if they lost jobs that
might have been profitable because they overestimated those.
Regression modeling to the rescue! There were only three independent variables available for the sheet
of titanium from which the cylinder would be made; the length, the width, and the thickness. We used
historical data for a lot of jobs that they had completed to build a regression model for each of the four
steps in the process. The models typically explained 95% or more of the variation in the data. I am going
to tell you how the models worked and it will appear obvious to you, but if you ask yourself for these
answers right now, they might not be so obvious.
The two variables that affected the forming process were the length and width of the sheet; the
thickness did not seem to matter, possibly because there was not a wide range of thicknesses. These
same two variables affected the fitting operation. For the welding operation, the thickness and the
length were the two independent variables in the regression equation. Clearly, the thicker the metal the
slower the welding and the longer the sheet the slower the welding. The reroll operation was once again
driven by the length and the width variables. I trained a shop floor employee to build these regressionmodels using the STORM software package. He built a bunch of models and then created a bunch of
tables so that his coworkers could simply use the length, width, and thickness values to enter these
tables and read the estimated times for each of the four operations. We did a number of other projects
as a part of our relationship with this company that further contributed to their success. But this
regression modeling was an important component of what we did. The result of the work we did
together with the people at the company resulted in this company making a profit for the first time in six
8/3/2019 The Six Sigma Process
http://slidepdf.com/reader/full/the-six-sigma-process 38/50
years. The nice thing was that it was a sizable profit. So I guess our equation in this case was regression
equals profit!
58
Six Sigma is about
Minimizing Variation
• Short-term variation
• Long-term variation
Slide fifty-eight
Now that you understand statistical variation, we can share with you that a major objective of the Six
Sigma process is to minimize variation. In fact, you could say that we are often obsessed with minimizing
variation in processes. It is important to distinguish between short-term and long-term variation, sinceshort-term variation is much more difficult to reduce than long-term variation.
59
8/3/2019 The Six Sigma Process
http://slidepdf.com/reader/full/the-six-sigma-process 39/50
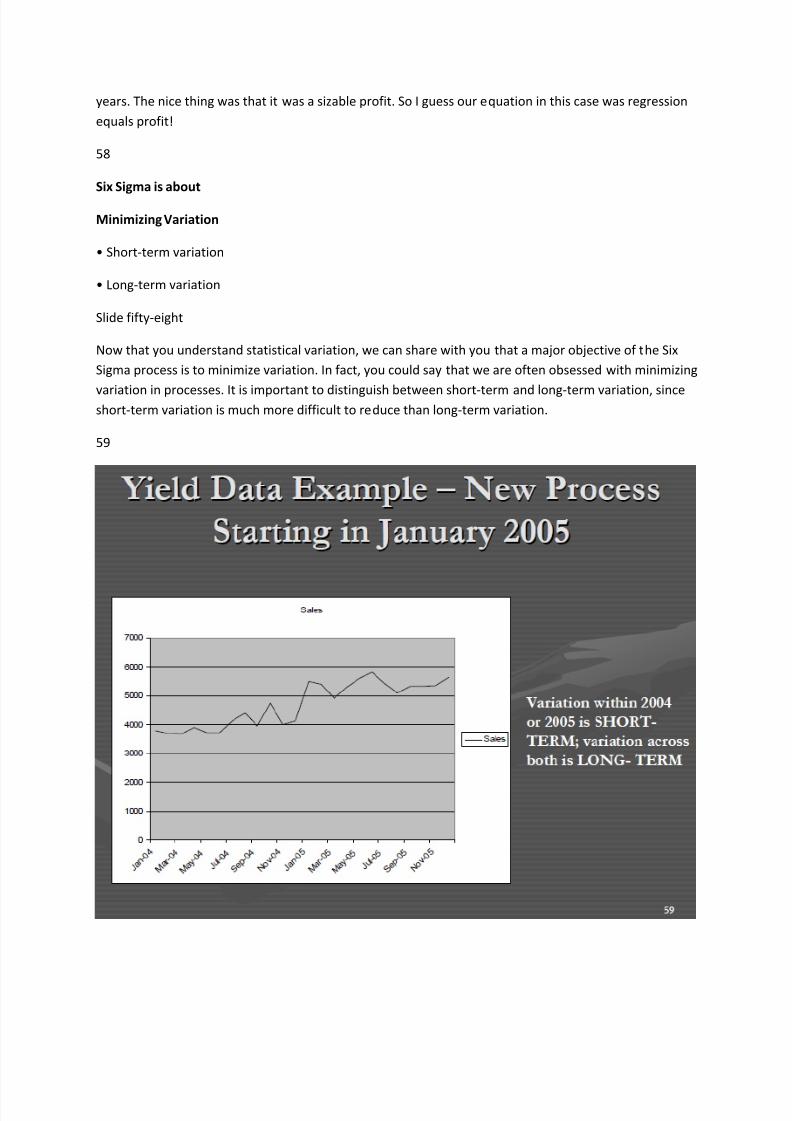
Slide fifty-nine
In the graph in this slide, we have plotted the yield per hour from a process during calendar years 2004
and 2005. We implemented improvements to the process at the end of 2004 during the year end
shutdown. You can see that our yield per hour jumped from around 4000 pounds in 2004 to over 5000
pounds in 2005. If we were to compute the standard deviation of the yield for 2004 alone or for 2005alone, the values would be pretty similar. If we computed the value for both years combined, it would
be higher than either year alone.
60
Short- and Long-Term Variation
• Entitlement = Best observed SHORT-TERM variation
• Forces that cause long-term variation are often called “assignable causes” or “special causes”
• We normally try to reduce long-term variation first because it’s easier!
• Forces that cause short-term variation are often called “random causes” or “common causes”
• It is much harder to reduce this type of variation in a process; normally revolutionary discoveries are
needed
Slide sixty
We introduced the concept of entitlement during the define step of the Six Sigma process. We can use
the concepts of short-term and long-term variation to sharpen our understanding of entitlement. For
process variation, the entitlement value equals the best observed short-term variation in the process. If we accept the entitlement value as our objective for the process, then we would seek to maintain the
process at this value into the indefinite future. We will study more about assignable or special clauses
when we study statistical process control later in the course. For now, we will just say that it is easier to
reduce long-term variation created by assignable or special clauses than it is to reduce short-term
variation of the entitlement variety.
So we normally attack long-term variation first.
61
Short- and Long-Term Variation
• We use measures of variation to determine process capability for a process
– Short-term variation is used to estimate shortterm process capability
– Long-term variation is used to estimate longterm process capability
8/3/2019 The Six Sigma Process
http://slidepdf.com/reader/full/the-six-sigma-process 40/50
• Process capability indices are all based on some ratio of tolerance specifications divided by the
process width (variation)
Slide sixty-one
Six Sigma practitioners often talk about the concept of process capability. We use values of both short-
term and long-term variation to compute various process capability indices of interest. Again, we will
learn exactly how to compute those in the statistical process control module later in the course.
62
Outline
• Motivation and background
• Define
• Measure
• Analyze
• Improve
• Control
Slide sixty-two
We are now ready to consider the analyze phase of a Six Sigma project. We introduced quite a few
statistics in the measure phase because the statistics may be needed during that phase. We point out
however, that many of those same statistics will provide the foundation for the analyze phase. In that
sense, the measure and analyze phase may overlap at times.
63
Objective of Analyze Phase
• We seek to develop a deep understanding of the process behavior based on facts and data and their
analysis
• We want to understand how the x’s in the original Six Sigma function affect the y’s that are of interest
in our project
• At the end of this phase we should be able to suggest changes to the process that we expect to
improve its performance
Slide sixty-three
8/3/2019 The Six Sigma Process
http://slidepdf.com/reader/full/the-six-sigma-process 41/50
When I do applied projects for companies, I often talk about the first phase of the project as being the
saturation phase. The reason for that is that I am trying to saturate myself with the problem that the
company has so I understand it as well as the company personnel understand it.
The analyze phase of the Six Sigma project represents a similar saturation for the Six Sigma project
team. The team should understand the process as well as or better than anyone on the planet whenthey have finished the analyze phase. With a deep understanding of the process, they should be in a
great position to propose how to change it so as to improve it in a significant way.
64
What We Use to Analyze
• Team building process
• The 7 tools of quality
• Measurements from the process
• Statistical analysis of the measurements
• The team’s theory of the process
– For physical processes, this can be based on chemistry and/or physics, for example
– For business processes, flow charts may show this
Slide sixty-four
What tools, techniques, and concepts do we use during the analyze phase of a Six Sigma project? In
addition to the statistical analysis of any data available to us, we use the teambuilding process
constantly in managing our Six Sigma team and facilitating its work. We may use any of the seven basic
tools of quality, even though they are simpler than some of our sophisticated statistics. Even though
they’re simple, they can be very powerful. In addition to the data and its analysis, the team may have
developed its own theory of how the process works that fills in some blanks that the data did not
provide. We may have to test this theory later, but it may nonetheless be a very valuable output from
the analyze phase and the phases that preceded it.
65
Quality Processes We May
Use to Analyze
• Cost of poor quality
• Methods engineering and reengineering
8/3/2019 The Six Sigma Process
http://slidepdf.com/reader/full/the-six-sigma-process 42/50
• Benchmarking
• Quality auditing
• Vendor relationships
• Quality function deployment
Slide sixty-five
There are additional quality processes that may be used as a part of the analyze phase, and in fact may
be integrated into earlier steps of the Six Sigma process as well. We have listed several of those in this
slide but will not elaborate on them here. We will introduce all of them but quality auditing in later
modules. If anyone is interested in quality auditing, I can point you to a very good reference for that
subject.
66
Outline
• Motivation and background
• Define
• Measure
• Analyze
• Improve
• Control
Slide sixty-six
We are gaining on it; the improve step is the next to the last step in the process.
67
Experimentation and Improvement
• Up to now, no tangible benefit has accrued to the company, even though a lot of new knowledge may
have been gained
• In this phase, the theory of the process that has been developed by the team and the ideas for
improving the process are put to work
• This could also be called “implementation”
8/3/2019 The Six Sigma Process
http://slidepdf.com/reader/full/the-six-sigma-process 43/50
At this point, we said that the team should have ideas about how to improve the process. Notice that
the company does not enjoy any benefit of any kind until the implementation takes place and starts to
produce results. Planning and decision-making are fun parts about being a professional in a company,
but never forget that the only thing the company takes to the bank is implementation. At this point in
the Six Sigma process, we want to start experimenting with our ideas for improvement to determine if
we can put them in the bank!
68
Experimentation and Improvement
• The only way to find out if the suggested changes will work is to try them in some fashion
• Simulation
• Incremental
• Wholistic
Slide sixty-eight
There are three broad categories of ways to test our theories about the process and our ideas for
improving it. We will discuss simulation, incremental approaches, and the wholistic approach of design
of experiments.
69
Experimentation and Improvement
• In simulation, we try to imitate the behavior of the real world system with a computer model so that
we can test changes in the computer before we risk them in the real world process
• We still may try to experiment with the changes via a simulation model in either an incremental or a
wholistic manner
Slide sixty-nine
Computer simulation modeling involves building a computer model to imitate the behavior of a real
world system over some extended period of time. For example, we could simulate the flow of orders
through a factory before we ever built the factory. It is much easier to correct mistakes in the factory
design in a computer simulation model than it is after we have put bricks and mortar together in a
building. Dr. Kamlesh Mathur, the Department Chair for Operations, two graduate students from my
Department, and I are currently building such a manufacturing simulator for a fuel-cell company that is
planning to build a factory in Ohio in the near future.
To the extent that the computer simulation model captures the essence of the real world system, the
simulated behavior should be a good estimate of the real world system behavior if we were to make the
8/3/2019 The Six Sigma Process
http://slidepdf.com/reader/full/the-six-sigma-process 44/50
same changes to the real world system that we made in the simulation model. Simulation models would
typically be used for fairly large-scale projects where it would be very expensive to run physical
experiments on the system. In addition to computer simulation, we should also recognize physical
simulations here. You may be familiar with flight simulators that all are used for training pilots. We have
a company in Cleveland in the medical area that builds simulators to train surgeons for specific types of
surgery.
70
Experimentation and Improvement
• Incremental Approaches
– Trial and error – if the process is at all complex, this will likely be a disaster and the company will be
experimenting permanently
– One-factor-at-a-time – this may be useful if there are a limited number of factors and the team feels
they have a very strong knowledge of the relationships among the factors and the outcome; otherwise,
this can take a long time and lead to erroneous conclusions
Slide seventy
Simple incremental approaches for experimentation and improvement are used more often in industry
than any other approach. Whenever the problems being addressed are manageable enough, this can
work out to be acceptable. We sometimes set up a pilot operation to test our solution with a limited
test, and then if the pilot is successful we scale up for the full implementation. This is similar to test
marketing a new product in a limited geographic area. However, if the problem being studied is of
significant complexity, incremental approaches may simply not be up to the task. We are going tointroduce an example below that I think you will agree seems like a fairly simple problem, but you may
be surprised at its complexity, and by the fact that a formal design of experiments might be needed to
address this problem.
71
Experimentation and Improvement
• Wholistic Approaches
– Design of Experiments (DOE) – in this approach, a carefully designed set of experiments are run on the
process that help prove conclusively how it behaves as a result of different factors that may be
controlled, and the different levels at which they are set
Slide seventy-one
Some Ph.D. programs in statistics offer a two semester sequence in design of experiments. So let me
caution you that the two to three weeks we will spend this semester on design of experiments will not
8/3/2019 The Six Sigma Process
http://slidepdf.com/reader/full/the-six-sigma-process 45/50
make you an expert. What we hope it will do is introduce you to the language of design of experiments
and help you develop an ability to recognize a situation that demands a design of experiments approach,
and to be able to participate with a team to carry it out.
72
Design of Experiments
• Select the factors (x’s) from the team’s knowledge of the process
• Select the factor levels
• Randomize the experiments to protect against unknown nuisance factors
• Block to safeguard against known nuisance factors
• Run the experiments and gather the data
Slide seventy-two
To introduce the concept of design of experiments, let's consider a simple case in which we would like to
develop a recipe and baking procedures to bake the best cake ever. We will measure best by having a
panel of expert tasters whose ratings will be averaged. If we can solve this problem, we can open a
bakery that just bakes this one product, but does it so well that we make a lot of money! What are some
of the factors to be considered in baking a cake? The amount of each ingredient provides a fairly obvious
set of factors. They might include items such as flour, sugar, eggs, milk, and butter. Assuming that we
are using an electric mixer, another factor could be how long do we mix the ingredients? Even before we
mix them, a factor could be the order in which we put them in a mixing bowl. Do we put the moist
ingredients in first, so it is easier to blend the dry ingredients with them? Once the batter is mixed, what
type of baking container do we use? Do we use a round pan, a square pan, or a rectangular pan? Should
the container be made out of metal, or glass? Are you starting to get a headache? Don't, because we're
not done yet. We still have to consider at what temperature to bake the cake, for how long, and
whether to bake it on the top rack or the bottom rack of the oven. If we took a particular value for each
of the factors listed above, then we would typically bake maybe 10 cakes using that set of factors in
order to make sure we were getting some uniformity in the results. Let’s suppose that we took three
levels for each factor listed above (we could easily try more levels for several of the factors, but let’s
keep it simple). The spreadsheet below shows how many cakes we’d have to bake and taste in order to
decide on the best plan if we try every combination, ten times each!
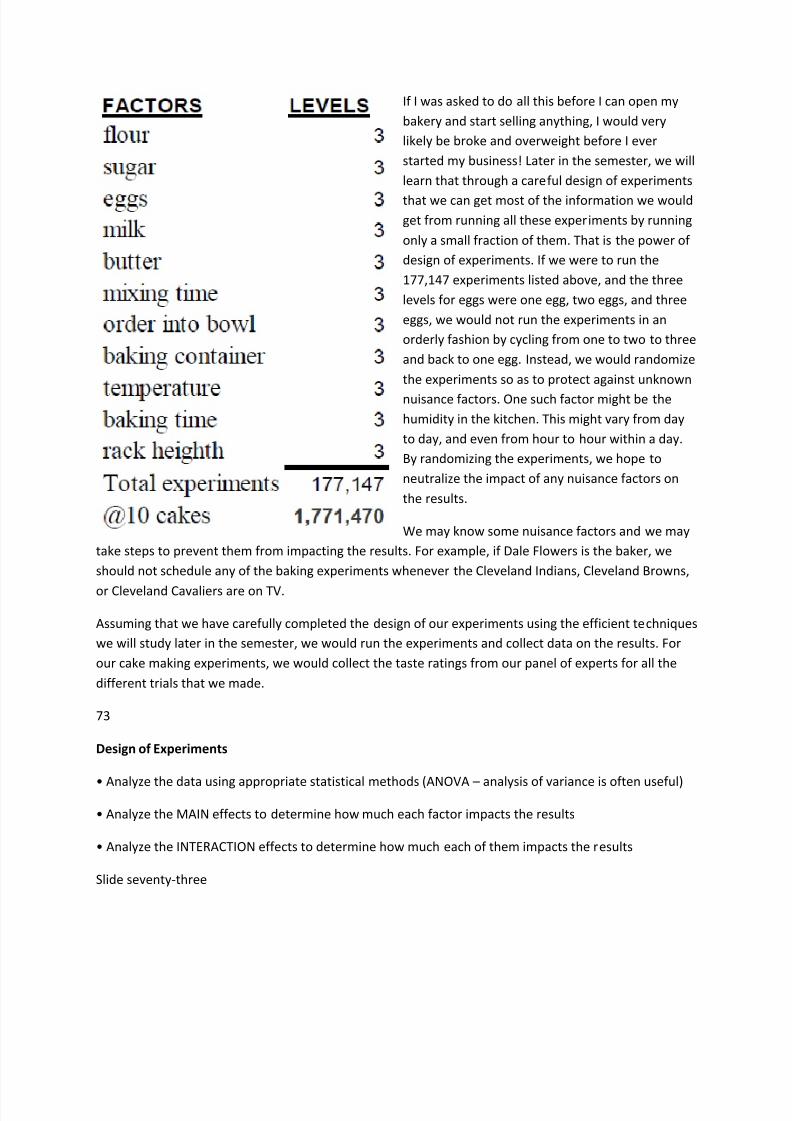
8/3/2019 The Six Sigma Process
http://slidepdf.com/reader/full/the-six-sigma-process 46/50
If I was asked to do all this before I can open my
bakery and start selling anything, I would very
likely be broke and overweight before I ever
started my business! Later in the semester, we will
learn that through a careful design of experiments
that we can get most of the information we would
get from running all these experiments by running
only a small fraction of them. That is the power of
design of experiments. If we were to run the
177,147 experiments listed above, and the three
levels for eggs were one egg, two eggs, and three
eggs, we would not run the experiments in an
orderly fashion by cycling from one to two to three
and back to one egg. Instead, we would randomize
the experiments so as to protect against unknown
nuisance factors. One such factor might be the
humidity in the kitchen. This might vary from day
to day, and even from hour to hour within a day.
By randomizing the experiments, we hope to
neutralize the impact of any nuisance factors on
the results.
We may know some nuisance factors and we may
take steps to prevent them from impacting the results. For example, if Dale Flowers is the baker, we
should not schedule any of the baking experiments whenever the Cleveland Indians, Cleveland Browns,
or Cleveland Cavaliers are on TV.
Assuming that we have carefully completed the design of our experiments using the efficient techniques
we will study later in the semester, we would run the experiments and collect data on the results. For
our cake making experiments, we would collect the taste ratings from our panel of experts for all the
different trials that we made.
73
Design of Experiments
• Analyze the data using appropriate statistical methods (ANOVA – analysis of variance is often useful)
• Analyze the MAIN effects to determine how much each factor impacts the results
• Analyze the INTERACTION effects to determine how much each of them impacts the results
Slide seventy-three
8/3/2019 The Six Sigma Process
http://slidepdf.com/reader/full/the-six-sigma-process 47/50
Once we have the results, we have to apply the appropriate statistical methods to analyze the results.
So you can see that even though we're in the improve step of the Six Sigma process, we are still doing
analysis as a part of our experiments. So the boundaries between the steps in Six Sigma projects are not
necessarily neat and tidy. The analysis of the results will help us determine the main effects and the
interaction effects of our different factors. If the three levels that we tried for butter were one half stick,
three fourths of a stick, and a full stick of butter, then we can perform a statistical analysis to estimate
the main effect of butter on the taste of the cake. Notice, however, that milk is another ingredient that
is also a dairy product. There may be an interaction effect between milk and butter. It is possible to
study such effects and to allow for their estimation.
74
Design of Experiments
• From your analysis, estimate the optimal factor settings for the process and its resulting performance
• Run a confirming experiment to see if the optimal performance is achieved
• If yes, continue on; otherwise, it’s back to the drawing board for additional analysis and experiments!
Slide seventy-four
I mentioned above that an efficient design of experiments may cause us to run only a tiny fraction of all
possible trials. From the results of these experiments, we will be able to estimate the best combination
of factor levels to create the best tasting cake. Suppose that the best combination includes a full stick of
butter and 2 cups of flour. It is very possible that we did not bake a single cake in our experiments that
contained one full stick of butter and 2 cups of flour. So whatever our analysis told us was the best
combination, if we did not run that experiment in our original set of experiments, then we need to do soto confirm that our experts agree that this yields the best tasting cake. This experiment is called a
confirming experiment. If all goes well, then our experts will agree that this is the best cake we found. If
for some reason it is not judged as the best, then it probably means that there were some confounding
or nuisance factors that we did not control for that affected our results. This is bad news, since it means
we have to go back to the drawing board and figure out what to do. We hope this doesn't happen too
often.
75
Outline
• Motivation and background
• Define
• Measure
• Analyze
8/3/2019 The Six Sigma Process
http://slidepdf.com/reader/full/the-six-sigma-process 48/50
• Improve
• Control
Slide seventy-five
We are in the home stretch. Once we have figured out how to improve the process, we want to make
sure that our organization implements our results in precisely the right manner so that benefits will
accrue for a long time into the future.
76
Process Management Summary
• Basically summarizes everything the team has learned about what makes the process tick
• Identifies all the “critical-to-quality” factors including how they impact on the process
• Becomes the primary documentation of the process
Slide seventy-six
Our team should write a process management summary that contains all their important findings. The
summary identifies all the critical to quality (CTQ) factors and explains how they impact the process.
The minutes, charts, graphs, reports, and other documentation that the team prepared following our
team building guidelines will prove invaluable in writing this summary.
77
Process Control Plan
• Focuses on the x’s and what we know about them
• Administrative section provides key information including the process owner
• Operational definition of the control plan
• What is being controlled
• Requirements and current performance levels
• Method of control, and actions to be taken if the process goes out of control
Slide seventy-seven
The simplest way to explain what the process control plan does is to say that it explains exactly what to
do to the x’s in the process in order to achieve our desired y. If you are familiar with computer
programming, it has lots of “if … then” statements. We may have a lot of those in our documentation.
The plan instructs the people implementing the process on what to do when different situations arise in
8/3/2019 The Six Sigma Process
http://slidepdf.com/reader/full/the-six-sigma-process 49/50
order to have the process perform at its best. It is critically important to develop a great process control
plan; remember, the benefit that the organization receives is going to come from implementing the
process control plan. There's that word again, implementation.
78
Process Control Plan
• This step is heavily based on statistical process control that we included in the 7 tools of quality
• Additional concepts used in this step are Poka-Yoke or fool-proofing the process
Slide seventy-eight
In many instances, a statistical process control chart will be utilized by the process and the design of this
chart will be a part of the control plan. So SPC is often a component of a control plan. We will be
studying SPC a little later in the course. The team should spend some time trying to figure out how to
implement the process control plan in the most foolproof way they can. The Japanese call this Poka-
Yoke. For those of you who remember cassette tapes as a way to play music in your car, I can use
cassette players in cars as an example of this technique. When United States car manufacturers
introduced auto cassette players, they created one large rectangular opening into which you were to
place the cassette. If you look at a cassette, you will notice that the plastic container is only open on one
surface of the cassette and you can see the tape through that opening; let's call that surface the bottom.
The correct way to load the cassette into the United States vehicle was to put the bottom end into the
rectangular opening first and push the cassette on in. However, there was nothing to prevent those of
us who are technologically challenged from putting the top in first, in which case we got no music. The
Japanese had a better idea. In their vehicles with cassette players, they created a contoured opening
such that you put the end of the tape in first, and the side of the contoured opening that was larger is
where the bottom had to go. So there was only one way you could insert the tape into the opening. This
is what we mean by foolproofing.
79
Repeat!
• Motivation and background
• Define
• Measure
• Analyze
• Improve
• Control
8/3/2019 The Six Sigma Process
http://slidepdf.com/reader/full/the-six-sigma-process 50/50
Slide seventy-nine
I bet you thought we'd never get here. You now have an introduction to the complete Six Sigma process.
Once you've successfully completed a Six Sigma project, there's always another one waiting so that you
can further improve your organization's operations. This is what we mean by continuous improvement,
and doing it relentlessly is a hallmark of many of our great companies today. I hope this module has de-mystified this thing that we call Six Sigma for you. I'll bet that you now realize that you already knew a
lot of the elements of it, and now you know how it all fits together.
Here’s an exercise that I would like for you to do. Think about some important work or school project
that you had to do as a part of a team or group. Think about how your group did it, and then think about
how you think they would have done it if they used a Six Sigma process. Describe aspects of the project
for which you think the team used Six Sigma concepts, even if the team didn’t call it that. Describe
aspects of the project that would have been different if you had followed the Six Sigma process. Then
tell us if you think the project performance would have improved, stayed the same, or gotten worse if
your team had used the Six Sigma approach. You should also include all the team building concepts from
that module into your analysis of your previous project.