Embed Size (px)
Citation preview
1
The Sixth Carbon Budget
Shipping
2
This document contains a summary of content for the shipping sector from the
CCC’s Sixth Carbon Budget Advice, Methodology and Policy reports.
3
The Committee is advising that the UK set its Sixth Carbon Budget (i.e. the legal limit
for UK net emissions of greenhouse gases over the years 2033-37) to require a
reduction in UK emissions of 78% by 2035 relative to 1990, a 63% reduction from
2019. This will be a world-leading commitment, placing the UK decisively on the
path to Net Zero by 2050 at the latest, with a trajectory that is consistent with the
Paris Agreement.
Our advice on the Sixth Carbon Budget, including emissions pathways, details on
our analytical approach, and policy recommendations for the shipping sector is
presented across three CCC reports, an accompanying dataset, and supporting
evidence.
• An Advice report: The Sixth Carbon Budget – The UK’s path to Net Zero,
setting out our recommendations on the Sixth Carbon Budget (2033-37)
and the UK’s Nationally Determined Contribution (NDC) under the Paris
Agreement. This report also presents the overall emissions pathways for the
UK and the Devolved Administrations and for each sector of emissions, as
well as analysis of the costs, benefits and wider impacts of our
recommended pathway, and considerations relating to climate science
and international progress towards the Paris Agreement. Section 8 of
Chapter 3 in that report contains an overview of the emissions pathways for
the shipping sector.
• A Methodology Report: The Sixth Carbon Budget – Methodology Report,
setting out the approach and assumptions used to inform our advice.
Chapter 9 of that report contains a detailed overview of how we
conducted our analysis for the shipping sector.
• A Policy Report: Policies for the Sixth Carbon Budget and Net zero, setting
out the changes to policy that could drive the changes necessary
particularly over the 2020s. Chapter 8 of that report contains our policy
recommendations for the shipping sector.
• A dataset for the Sixth Carbon Budget scenarios, which sets out more
details and data on the pathways than can be included in this report.
• Supporting evidence including our public Call for Evidence, 10 new
research projects, three expert advisory groups, and deep dives into the
roles of local authorities and businesses.
All outputs are published on our website (www.theccc.org.uk).
For ease, the relevant sections from the three reports for each sector (covering
pathways, method and policy advice) are collated into self-standing documents
for each sector. A full dataset including key charts is also available alongside this
document. This is the self-standing document for the shipping sector. It is set out in
three sections:
1) The approach to the Sixth Carbon Budget analysis for the shipping sector
2) Emissions pathways for the shipping sector
3) Policy recommendations for the shipping sector
The approach to the Sixth Carbon
Budget analysis for the shipping
sector
5 Sixth Carbon Budget - Shipping
The following sections are taken directly from Chapter 9 of the CCC’s
Methodology Report for the Sixth Carbon Budget.1
Introduction and key messages
This chapter sets out the method for the shipping sector’s Sixth Carbon Budget
pathways.
The scenario results of our costed pathways are set out in the accompanying
Advice report. Policy implications are set out in the accompanying Policy report.
For ease, these sections covering pathways, method and policy advice for the
shipping sector are collated in The Sixth Carbon Budget – Shipping. A full dataset
including key charts is also available alongside this document.
The key messages from this chapter are:
• Background. Shipping emissions accounted for 3% of UK GHG emissions in
2018 and were 21% below 1990 levels. Emissions have been on a slow
downward trend over the past two decades, with the past decade seeing
reductions in domestic journeys around the UK coast and in international
export shipping, plus falls in naval shipping. 2020 has seen a drop in GHG
emissions, due to the impact of COVID-19, with a return to pre-pandemic
levels expected in 2022.
• Options for reducing emissions. Mitigation options considered include
improvements in vessel efficiency (including electricity), and use of zero-
carbon fuels (principally ammonia made from low-carbon hydrogen) to
displace fossil marine fuels.
• Analytical approach. Our analysis relies on UMAS shipping modelling of
energy, emissions and costs for the DfT Clean Maritime Plan.2 We have
adapted this analysis for UK bunker fuels sales (instead of an activity basis)
and introduced ammonia costs consistent with the new evidence from our
Fuel Supply analysis.
• Uncertainty. We have used the scenario framework to test the impacts of
uncertainties, to inform our balanced Net Zero Pathway. The key areas of
uncertainty we test relate to ammonia costs, and deployment timings.
Shipping has been impacted by COVID-19, and continues to face
uncertainties about the future size of the sector.
We set out our analysis in the following sections:
1. Sector emissions
2. Options for reducing emissions
3. Approach to analysis for the Sixth Carbon Budget
Sixth Carbon Budget - Shipping 6
1. Sector emissions
This section outlines the recent trends in shipping emissions and their sources. For
more detail, see our 2020 Progress Report to Parliament.3
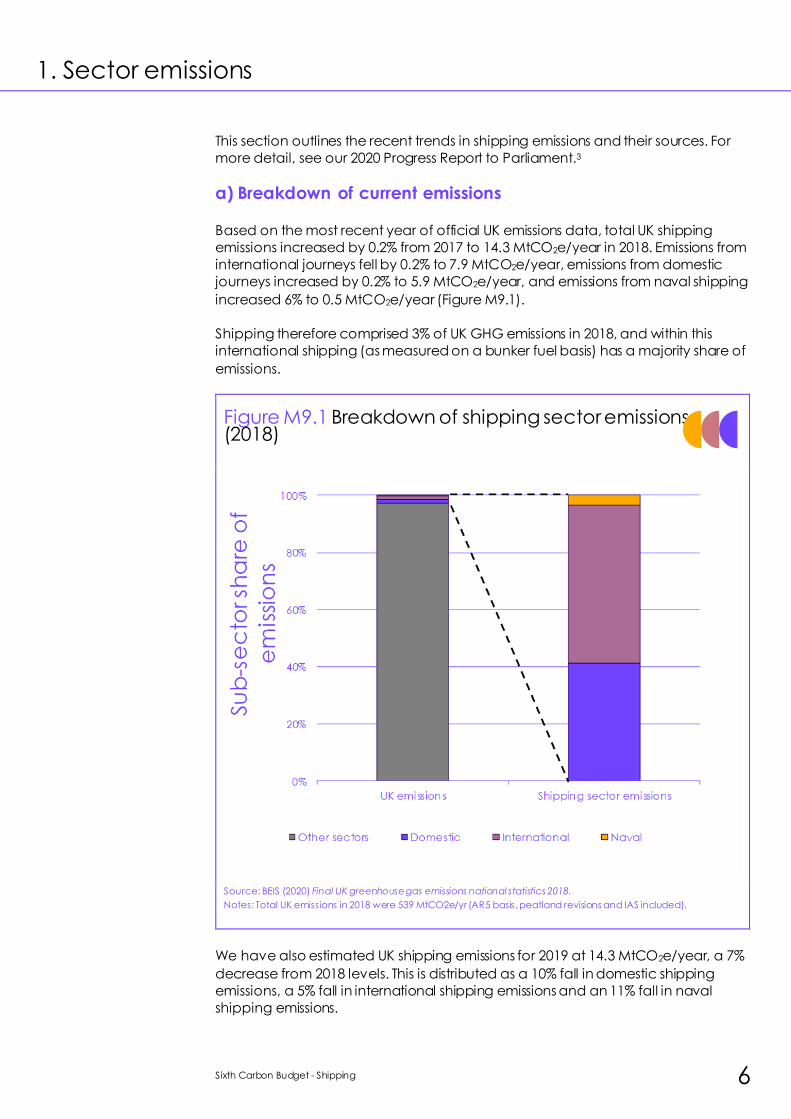
a) Breakdown of current emissions
Based on the most recent year of official UK emissions data, total UK shipping
emissions increased by 0.2% from 2017 to 14.3 MtCO2e/year in 2018. Emissions from
international journeys fell by 0.2% to 7.9 MtCO2e/year, emissions from domestic
journeys increased by 0.2% to 5.9 MtCO2e/year, and emissions from naval shipping
increased 6% to 0.5 MtCO2e/year (Figure M9.1).
Shipping therefore comprised 3% of UK GHG emissions in 2018, and within this
international shipping (as measured on a bunker fuel basis) has a majority share of
emissions.
Figure M9.1 Breakdown of shipping sector emissions (2018)
Source: BEIS (2020) Final UK greenhouse gas emissions national statistics 2018.
Notes: Total UK emissions in 2018 were 539 MtCO2e/yr (AR5 basis, peatland revisions and IAS included).
We have also estimated UK shipping emissions for 2019 at 14.3 MtCO2e/year, a 7%
decrease from 2018 levels. This is distributed as a 10% fall in domestic shipping
emissions, a 5% fall in international shipping emissions and an 11% fall in naval
shipping emissions.
7 Sixth Carbon Budget - Shipping
However, given the COVID-19 pandemic and its impact on the shipping sector,
and the need to reflect this in our analysis in the near-term, we have also
estimated a fall of around 21% in 2020 GHG emissions from 2019 levels (and then a
recovery to 2022), as detailed below in section 3(e). The emissions estimates from
2019 onwards will revised once official BEIS final GHG emissions data is published.
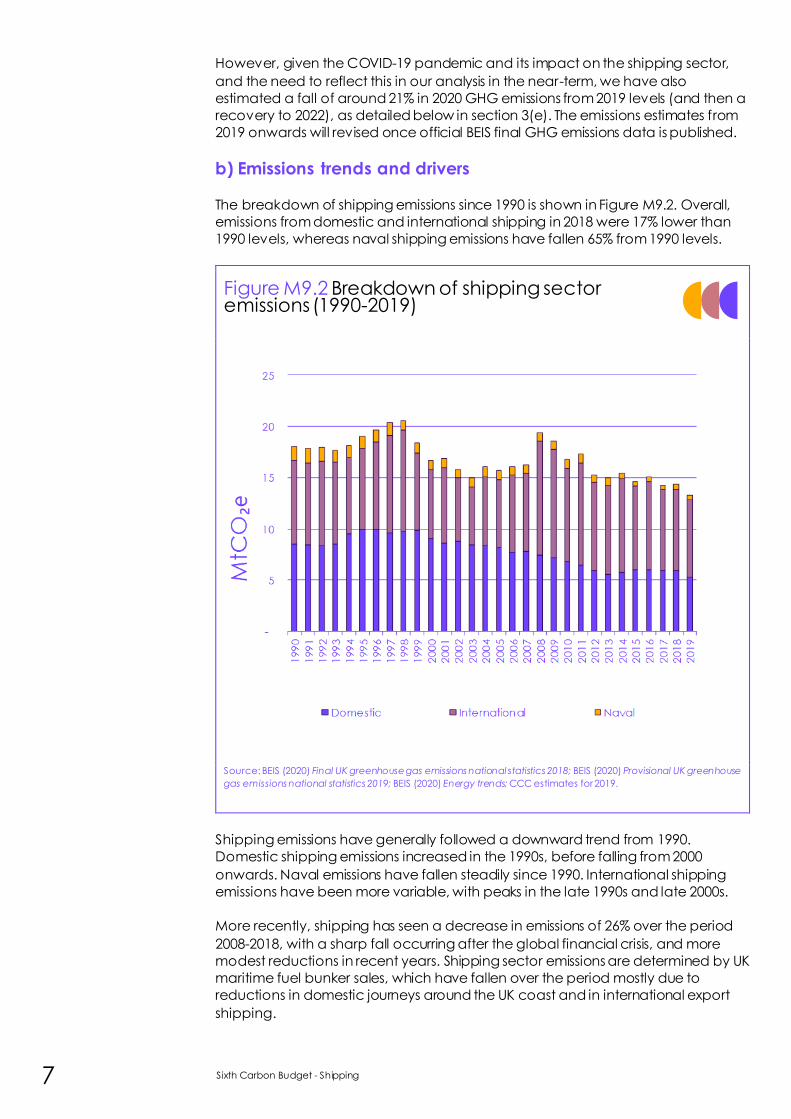
b) Emissions trends and drivers
The breakdown of shipping emissions since 1990 is shown in Figure M9.2. Overall,
emissions from domestic and international shipping in 2018 were 17% lower than
1990 levels, whereas naval shipping emissions have fallen 65% from 1990 levels.
Figure M9.2 Breakdown of shipping sector emissions (1990-2019)
Source: BEIS (2020) Final UK greenhouse gas emissions national statistics 2018; BEIS (2020) Provisional UK greenhouse
gas emissions national statistics 2019; BEIS (2020) Energy trends; CCC estimates for 2019.
Shipping emissions have generally followed a downward trend from 1990.
Domestic shipping emissions increased in the 1990s, before falling from 2000
onwards. Naval emissions have fallen steadily since 1990. International shipping
emissions have been more variable, with peaks in the late 1990s and late 2000s.
More recently, shipping has seen a decrease in emissions of 26% over the period
2008-2018, with a sharp fall occurring after the global financial crisis, and more
modest reductions in recent years. Shipping sector emissions are determined by UK
maritime fuel bunker sales, which have fallen over the period mostly due to
reductions in domestic journeys around the UK coast and in international export
shipping.
Sixth Carbon Budget - Shipping 8
In terms of overall freight tonnages, dry and liquid bulk have seen significant falls (in
particular, less coal and crude oil carried by ship), although container and roll -
on/roll-off freight has increased.
Demand for shipping is primarily driven by freight tonnages, as a result of
economic growth and import/export dependencies, plus other offshore activities
such as fishing, ferries, cruises etc. International fuel bunker sales (the basis for
international shipping emissions) are also not just dependent on activity levels,
given the ability of many international vessels to choose where they refuel, and are
also determined by relative fuel prices in the UK vs abroad.

9 Sixth Carbon Budget - Shipping
2. Options for reducing emissions
Three main emissions reduction options have been explored within the domestic
and international shipping sub-sectors. These include:
• Fleet efficiency improvements. Achieved via a combination of slow
steaming, operational optimisation, ship hull design and new engine
efficiency improvements, onboard renewable power generation (e.g.
solar) and wind propulsion systems. Our analysis uses fleet fuel tCO2/MWh
values from UMAS2 modelling for DfT and does not model individual
improvements from the list above.
• Electrification. Electricity is used in a limited number of niche hybrid & full
electric propulsion vessels (using onboard batteries and motors), and more
widely used to provide shore power/’cold ironing’ (ships temporally
connecting to grid electricity to power onboard systems when docked in
port).
• Zero-carbon fuels. These fuels displace fossil marine fuels, typically requiring
either engine retrofits or new propulsion and energy storage systems, and
have zero accounting CO2 emissions on combustion. In our scenarios, this is
assumed to be ammonia, produced from low-carbon hydrogen and air
separation.
This preference for ammonia in UMAS modelling is due to the potential to retrofit
ship engines at relatively low cost, the higher energy density of ammonia
compared to hydrogen (and therefore a much lower commercial penalty due to
smaller fuel tanks onboard taking up less space), and the lower cost of ammonia
production compared to methanol* (which has to be made from Direct Air
Capture of CO2 and low-carbon hydrogen to achieve the same emissions
intensity). Discussion of the uncertainties associated with the choice of ammonia is
provided in section 3(d) below.
Biofuel routes were excluded, as long-term, our analysis of the best-use of
bioenergy (Chapter 6) shows that use of biofuels in shipping achieves lower GHG
savings compared to uses in other sectors. Transitioning shipping to a carbon-free
fuel such as ammonia, rather than a biofuel that releases CO2 on combustion,
allows finite bioenergy resources to be used in other applications that sequester
the biogenic carbon, leading to lower overall UK emissions. UMAS modelling also
indicates that biofuel availability and use in shipping is likely to delay the transition
to zero-carbon ammonia. Further discussion is provided in section 3(d) below.
Our analysis uses zero-carbon ammonia to displace a fossil fuel mix of heavy fuel oil
(HFO), liquified natural gas (LNG), low-sulphur fuel oil (LSFO) and marine diesel oil
(MDO). The ammonia production route is discussed in more detail in the Fuel
Supply methodology (Chapter 6).
• Our analysis has not assumed differences in economic growth or shipping
demands between the scenarios – a common underpinning shipping
demand trajectory to 2050 is used in the UMAS modelling. There may be
some changes in export/import dependencies between scenarios, e.g.
tonnages of fossil fuels imported, but these have not been modelled.
* Methanol is deployed in UMAS modelling, but at well below 2% of total fuel use in 2050, so for analytical simplicity we
have merged the UMAS methanol results with the ammonia results in presenting our zero-carbon fuel abatement.
Sixth Carbon Budget - Shipping 10
No decarbonisation measures have been modelled in the naval sub-sector – naval
shipping was not included in the UMAS modelling, and there was insufficient
evidence available as to whether zero-carbon ammonia or alternatives would be
suitable for naval shipping operational requirements.
11 Sixth Carbon Budget - Shipping
3. Approach to analysis for the Sixth Carbon Budget
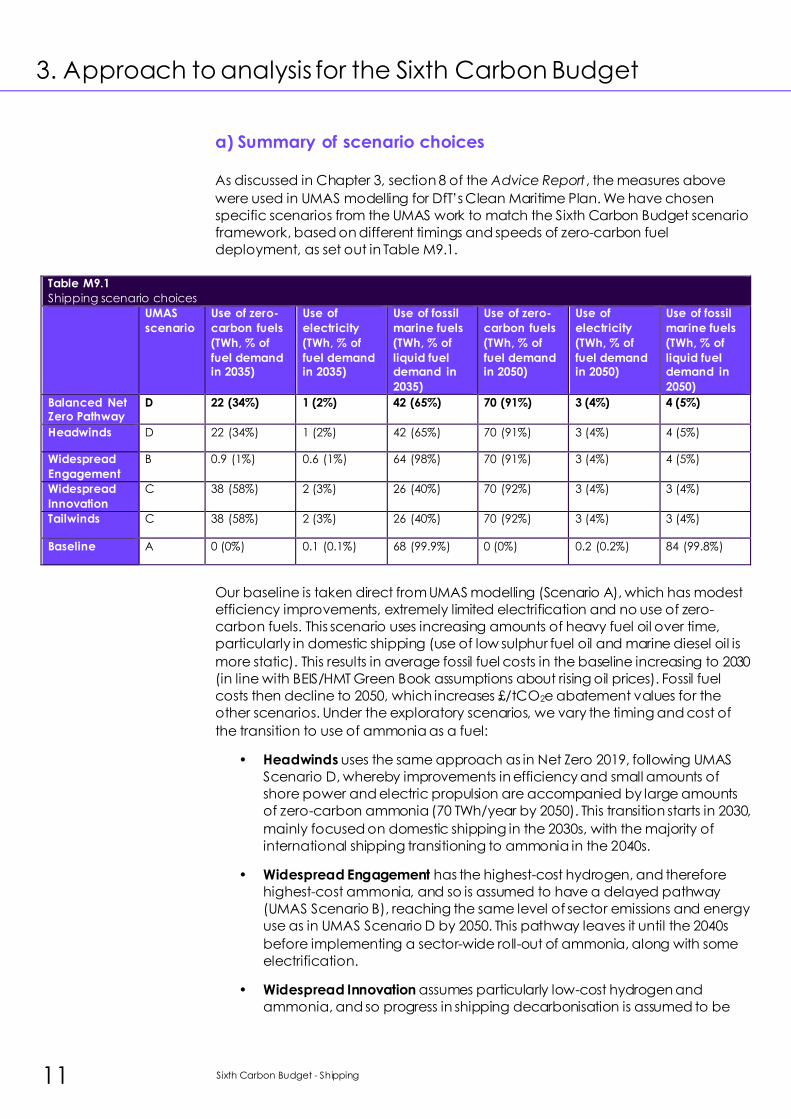
a) Summary of scenario choices As discussed in Chapter 3, section 8 of the Advice Report, the measures above
were used in UMAS modelling for DfT’s Clean Maritime Plan. We have chosen
specific scenarios from the UMAS work to match the Sixth Carbon Budget scenario
framework, based on different timings and speeds of zero-carbon fuel
deployment, as set out in Table M9.1.
Table M9.1
Shipping scenario choices
UMAS
scenario
Use of zero-
carbon fuels
(TWh, % of
fuel demand in 2035)
Use of
electricity
(TWh, % of
fuel demand in 2035)
Use of fossil
marine fuels
(TWh, % of
liquid fuel demand in
2035)
Use of zero-
carbon fuels
(TWh, % of
fuel demand in 2050)
Use of
electricity
(TWh, % of
fuel demand in 2050)
Use of fossil
marine fuels
(TWh, % of
liquid fuel demand in
2050)
Balanced Net Zero Pathway
D 22 (34%) 1 (2%) 42 (65%) 70 (91%) 3 (4%) 4 (5%)
Headwinds D 22 (34%) 1 (2%) 42 (65%) 70 (91%) 3 (4%) 4 (5%)
Widespread
Engagement
B 0.9 (1%) 0.6 (1%) 64 (98%) 70 (91%) 3 (4%) 4 (5%)
Widespread
Innovation
C 38 (58%) 2 (3%) 26 (40%) 70 (92%) 3 (4%) 3 (4%)
Tailwinds C 38 (58%) 2 (3%) 26 (40%) 70 (92%) 3 (4%) 3 (4%)
Baseline A 0 (0%) 0.1 (0.1%) 68 (99.9%) 0 (0%) 0.2 (0.2%) 84 (99.8%)
Our baseline is taken direct from UMAS modelling (Scenario A), which has modest
efficiency improvements, extremely limited electrification and no use of zero-
carbon fuels. This scenario uses increasing amounts of heavy fuel oil over time,
particularly in domestic shipping (use of low sulphur fuel oil and marine diesel oil is
more static). This results in average fossil fuel costs in the baseline increasing to 2030
(in line with BEIS/HMT Green Book assumptions about rising oil prices). Fossil fuel
costs then decline to 2050, which increases £/tCO2e abatement values for the
other scenarios. Under the exploratory scenarios, we vary the timing and cost of
the transition to use of ammonia as a fuel:
• Headwinds uses the same approach as in Net Zero 2019, following UMAS
Scenario D, whereby improvements in efficiency and small amounts of
shore power and electric propulsion are accompanied by large amounts
of zero-carbon ammonia (70 TWh/year by 2050). This transition starts in 2030,
mainly focused on domestic shipping in the 2030s, with the majority of
international shipping transitioning to ammonia in the 2040s.
• Widespread Engagement has the highest-cost hydrogen, and therefore
highest-cost ammonia, and so is assumed to have a delayed pathway
(UMAS Scenario B), reaching the same level of sector emissions and energy
use as in UMAS Scenario D by 2050. This pathway leaves it until the 2040s
before implementing a sector-wide roll-out of ammonia, along with some
electrification.
• Widespread Innovation assumes particularly low-cost hydrogen and
ammonia, and so progress in shipping decarbonisation is assumed to be
Sixth Carbon Budget - Shipping 12
more rapid, following UMAS Scenario C. Full sector decarbonisation is
broadly achieved by 2040, having started in 2030.
• Our Tailwinds scenario matches the Widespread Innovation scenario (UMAS
Scenario C), as the fastest feasible pathway to sector decarbonisation,
given the need to scale-up low-carbon hydrogen for ammonia production.
Our Balanced Net Zero Pathway takes the middle ground, in terms of a phased roll-
out of ammonia over 20 years from 2030 as in the Headwinds scenario (UMAS
Scenario D), to achieve sector decarbonisation by 2050.
It is expected that the Shipping sector can achieve very close to full
decarbonisation in all scenarios by 2050. All scenarios have only very small residual
emissions (<1 MtCO2e/year) from a very limited use of fossil fuels in 2050, and
around half of these residual emissions are in naval shipping, due to no
decarbonisation options being modelled in this sub-sector.
b) Analytical steps
The analysis for the sixth Carbon Budget advice consists of the following steps:
• Coverage.
– Shipping is split into three sub-sectors: domestic, international and
naval.
– Emissions cover CO2, N2O and CH4.
– Coverage is for UK, Scotland, Wales and Northern Ireland.
• Abatement measures are split into two groupings: efficiency (including
electrification) and zero-carbon fuels.
– Domestic and international fuel use trajectories to 2050 are sourced
directly from UMAS modelling for DfT.2 Methanol use values (very small)
are merged with ammonia use values (very large) to create a zero-
carbon fuels grouping.
– Trajectory start points were adjusted for 2016-2019 actual NAEI4 data,
and estimated COVID-19 impacts in 2020-21 (discussed below in
section 3(d)).
– International fuel use is scaled down to a bunker fuel basis from UMAS
activity basis by applying a multiplier of 0.51 (derived from 2019 data).
Naval fuel use is derived separately from NAEI4 and held fixed to 2050.
– Emission savings due to energy efficiency are calculated using the
baseline emissions minus the emissions achieved if applying the
baseline average fuel carbon intensity to the scenario fuel use.
Emissions savings due to zero-carbon fuels are therefore the residual
savings between the scenario and baseline emissions.
– Direct CO2, CH4 and N2O emissions are calculated based on fuel use,
then split into sub-sectors and by devolved administration (DA). DA
splits are discussed below in section 3(c).
– Energy inflows to the sector (as hydrogen-derived fuels, electricity and
fossil fuels) are split into sub-sectors and DAs.
• Costs.
13 Sixth Carbon Budget - Shipping
– UMAS model results were used for operating cost and non-fuel cost
changes from efficiency and increased capital costs (de-annualised
to in-year investment where required, based off UMAS 10% interest rate
and CCC’s assumption of a 15 year lifetime, given UMAS model
lifetimes varies between 0-30 years depending on the measure and
remaining ship life).
– Marginal added costs of zero-carbon fuels were also calculated for
domestic and international sub-sectors. Costs were then split into sub-
sectors and DAs to calculate £/tCO2e abated by each measure, using
CCC’s 3.5% social discount rate. No cost data were available for the
naval sub-sector.
Further assumptions used in the analysis include:
• Constant fuel properties over time are assumed for fuel density, calorific
values and combustion emission values (CO2, N2O and CH4).5 Values are
taken directly from UMAS modelling – these values are similar to, although
very slightly lower than, Defra6 conversion factors.
• Heavy fuel oil, low sulphur fuel oil and marine diesel costs were not given in
the BEIS/HMT Green Book Long-run variable costs of energy supply (LRVCs)
dataset. However, based off UMAS data,7 the cost discount for heavy fuel
oil compared to marine diesel oil is 40%, and the cost discount for low
sulphur heavy fuel oil compared to marine diesel oil is 32%. Marine diesel oil
has been assumed to be equal in cost to diesel in the Green Book dataset,
with heavy fuel oil and low sulphur fuel oil costs aligned to the Green Book
projections.
c) Devolved administrations
The 2018 share of emissions from the NAEI is used to apportion UK emissions to the
level of the devolved administrations (DAs). Splits to DA level are held fixed over
time, with different splits used for domestic, international and naval shipping:
• Domestic: 33.8% Scotland, 4.9% Wales, 3.7% NI, 57.7% England
• International: 4.3% Scotland, 4.6% Wales, 2.3% NI, 88.8% England
• Naval: 7.4% Scotland, 3.4% Wales, 2.2% NI, 86.9% England
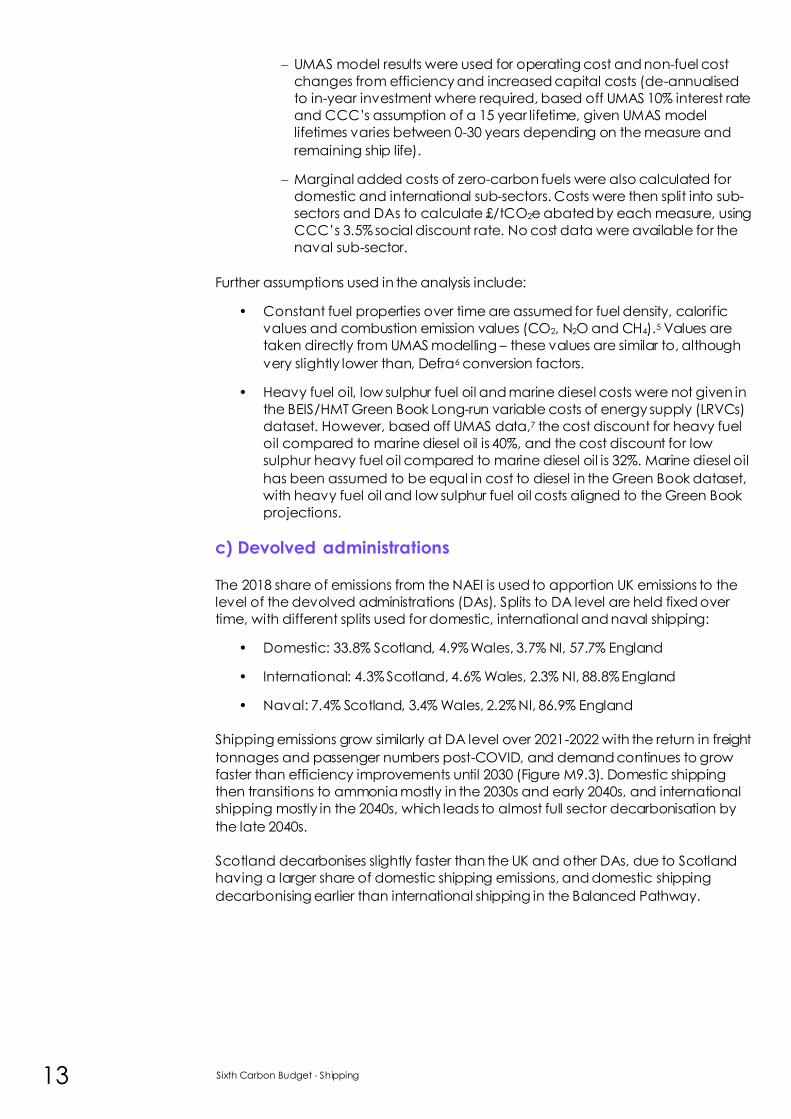
Shipping emissions grow similarly at DA level over 2021-2022 with the return in freight
tonnages and passenger numbers post-COVID, and demand continues to grow
faster than efficiency improvements until 2030 (Figure M9.3). Domestic shipping
then transitions to ammonia mostly in the 2030s and early 2040s, and international
shipping mostly in the 2040s, which leads to almost full sector decarbonisation by
the late 2040s.
Scotland decarbonises slightly faster than the UK and other DAs, due to Scotland
having a larger share of domestic shipping emissions, and domestic shipping
decarbonising earlier than international shipping in the Balanced Pathway.
Sixth Carbon Budget - Shipping 14
Figure M9.3 Comparison of emissions pathways for the UK, Scotland, Wales and Northern Ireland
Source: CCC analysis.
Notes: Shipping sector GHG emissions for the Balanced Net Zero Pathway, split into DAs, and re-based from 2020
levels (at the bottom of the COVID-19 dip).
d) Uncertainties
Given shipping is one of the smaller sectors (3% of current emissions) and is
expected to have decarbonised by 2050 (0.9 MtCO2e/year in the Balanced
Pathway), the following uncertainties may cause some changes in UK emissions in
the near to mid-term. However, these uncertainties will have a decreasing impact
by 2050 as the sector decarbonises, and so their impact on Net Zero is limited:
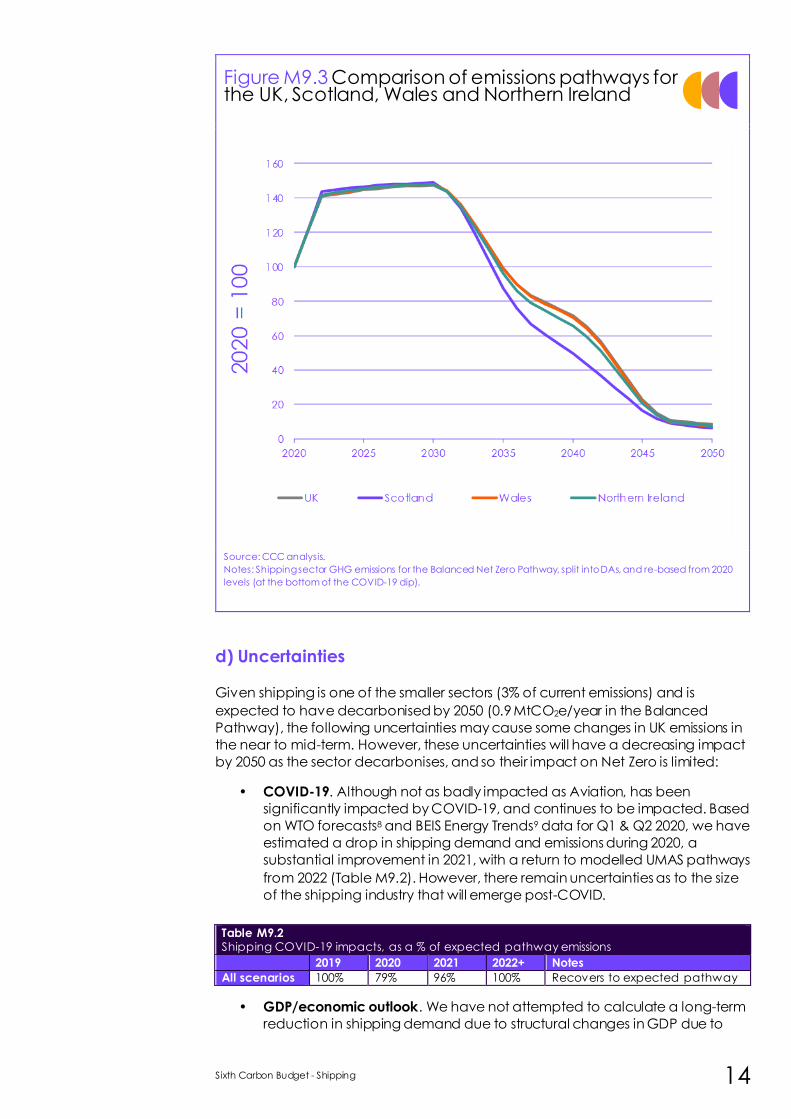
• COVID-19. Although not as badly impacted as Aviation, has been
significantly impacted by COVID-19, and continues to be impacted. Based
on WTO forecasts8 and BEIS Energy Trends9 data for Q1 & Q2 2020, we have
estimated a drop in shipping demand and emissions during 2020, a
substantial improvement in 2021, with a return to modelled UMAS pathways
from 2022 (Table M9.2). However, there remain uncertainties as to the size
of the shipping industry that will emerge post-COVID.
• GDP/economic outlook. We have not attempted to calculate a long-term
reduction in shipping demand due to structural changes in GDP due to
Table M9.2 Shipping COVID-19 impacts, as a % of expected pathway emissions
2019 2020 2021 2022+ Notes
All scenarios 100% 79% 96% 100% Recovers to expected pathway
15 Sixth Carbon Budget - Shipping
COVID-19 (trade has historically correlated to GDP). We also have not
considered any reductions in supply via failures of ports, vessel operators or
ship manufacturers. Longer-term, lower fossil fuel prices could lead to
smaller efficiency gains than previously projected, although this has also
not been assessed.
• Future demands. All UMAS scenarios have the same underlying shipping
demands to 2050. There is considerable uncertainty over the amount of
future growth in the demand for shipping, particularly as the UK sets out to
strike new trade deals globally, and as more rail infrastructure is developed
within the UK (potential modal shifts to/from shipping remain unclear in the
long term). We have not modelled the impact of higher shipping fuel costs
(e.g. ammonia) on the demand for shipping vs other modes or their relative
GHG intensities, nor the impact of decarbonisation across the rest of the
economy on demands for shipping (e.g. due to reduced fossil fuel imports).
• Air quality standards. The strictness of standards that will be in place to 2050
in different world regions and around the UK coast are not yet known.
Particularly strict air quality standards would favour the use of electricity or
hydrogen over the use of ammonia in retrofitted engines (due to NOx
abatement costs) or the use of biofuels. UMAS modelling does include air
quality policies (IMO emissions control area, global sulphur cap), but still
prefers ammonia combustion for the large majority of ship types and sizes.
• Role of biofuels. UMAS modelling excluded the use of biofuels in shipping.
Our analysis shows that the use of biofuels in shipping is not likely to be an
optimal use of bioenergy by 2050, as using a carbon-free fuel in shipping
(such as ammonia) and instead using the biogenic feedstock for other
applications that sequester the biogenic carbon will result in significantly
lower overall UK emissions. However, in the near-term, biofuels used in
shipping would displace fossil fuels.
– There are therefore a number of reasons to suggest that large-scale
use of biofuels in shipping is not desirable, and that the transition to
ammonia (and potentially some methanol or hydrogen) and
electrification needs to be prioritised instead.
– At best, marine biofuels might have a limited niche role, due to, for
example, aviation biojet plants producing some heavy end co-
products that they decide not to recycle, and given the 3.5 TWh/year
of fossil fuels still being used in shipping in 2050 in the Balanced
Pathway that could be substituted. However, this would only comprise
up to 5% of the total marine fuel supply, and this use of biofuels in
shipping would be at least six times smaller than the use of biofuels in
aviation – and would most likely follow SAF developments in the
aviation market, not lead it.
– Biomass to marine FT fuel routes are still under development and waste
fats/oils to biodiesel are relatively limited in supply. Given the li fetime of
infrastructure such as fuel production plants and storage, choices
made in the 2020s still need to be compatible with the long-term best
use of bioenergy.
– If biofuels are assumed to be available to shipping, UMAS modelling
(Scenario J) suggests that one potential consequence is to delay the
transition to the use of ammonia, with a subset of the UK’s domestic
and international shipping fleets continuing to operate on
conventional fuels even in 2050, which would lead to higher overall UK
emissions.
Sixth Carbon Budget - Shipping 16
• Batteries. The uptake of electric propulsion in the UMAS modelling is small
(<0.2 TWh/year in the Balanced Pathway). Although battery costs
reductions are assumed by UMAS, use is limited to smaller niche
applications such as domestic short-distance passenger or car ferries.
Significant breakthroughs in battery capacity and cost by 2050 would be
required to out-compete liquid fuels in those larger ships and longer
journeys that make up the majority of UK emissions.
• Hydrogen in shipping.
– UMAS modelling picks ammonia in preference to hydrogen, because
of the higher costs of onboard storage for hydrogen (including the
additional space taken up that lowers the commercial returns for the
ship). Similar to electric propulsion, hydrogen is being initially explored
for short journeys where energy storage requirements are low.
Breakthroughs in hydrogen storage technology with significantly
improved volumetric density could be possible by 2050, although
would take time to be commercialised and deploy within the fleet.
– UMAS modelling recognises that relatively small changes in costs and
efficiencies could change the commercial balance between
hydrogen and ammonia, as could air quality regulations. However, at
the moment, GW-scale renewable electrolysis plants are being
planned in e.g. Australia10 and Saudi Arabia11, with export of the
hydrogen as ammonia. This reflects the industry’s view that despite the
additional conversion losses, transporting ammonia is significantly
cheaper overall than transporting hydrogen. If this market continues to
develop and costs fall, ammonia stored onboard ships will become
increasingly attractive as a fuel source for propulsion.
• Methanol in shipping.
– UMAS modelling considers that zero-carbon synthetic methanol could
be produced from low-carbon hydrogen plus CO2 sourced from Direct
Air Capture. This synthetic methanol is therefore significantly more
expensive than ammonia or hydrogen, and so only appears in a few
limited applications in UMAS modelling (well under 2% of total fuel use
in 2050, and concentrated in domestic shipping niches). For simplicity
in our analysis, we have combined this small amount of methanol with
ammonia when presenting the zero-carbon fuel findings.
– If Direct Air Capture costs were to fall significantly, such that synthetic
methanol costs were much closer to ammonia costs, then the higher
energy density of methanol could favour it over ammonia in a number
of ship types. However, this methanol route would not likely be
commercially available before 2035-2040, given Direct Air Capture
technology development assumptions (Chapter 12).
• Costs of switching to ammonia. The additional cost from switching to
ammonia will depend heavily on the counterfactual fossil fuel cost (or
blended fossil fuel cost), the cost of hydrogen, and any future improvement
in processing plant capital and operating costs. Our scenarios explore
different hydrogen costs but hold ammonia processing plant costs fixed as
this is commercialised technology. However, projects significantly smaller
than 2,200 tonnes/day,12 or projects further from hydrogen feedstocks,
might be significantly more expensive than modelled. Ammonia costs
therefore have some uncertainty.
17 Sixth Carbon Budget - Shipping
• Estimated time profile of costs. The UMAS model is a fleet stock/sale model
(explicitly covering 72% of the domestic fleet and 69% of the international
fleet), but we only have access to in-year investment costs for domestic
shipping in UMAS scenarios A, C and D. We have therefore had to infer
added investment costs in each year from the annualised costs for
international shipping in all scenarios, and domestic shipping in scenario B,
assuming an average 15 year remaining lifetime on all measures – whereas
the UMAS model uses 0-30 years depending on each ship, its remaining
lifetime and the lifetime of the measure.
• International accounting methodology. Bunker fuel sales are the currently
agreed basis by which countries report international shipping emissions to
the UN. Were an alternative methodology developed and agreed, this
would likely lead to an increase in the UK's international shipping emissions.
For example, the activity basis used for the IMO's 4th GHG study (which is
the same basis used by UMAS modelling, before we adjust back to bunker
fuels) could approximately double UK international shipping emissions
(adding 7-8 MtCO2e/year during the 2020s).
Sixth Carbon Budget - Shipping 18
1 CCC(2020) The Sixth Carbon Budget – Methodology Report. Available at: www.theccc.org.uk
2 UMAS (University Maritime Advisory Services), E4tech, Frontier Economics, CE Delft (2019)
Reducing the maritime sector’s contribution to climate change and ai r pollution. Scenario
Analysis: Take-up of Emissions Reduction Options and their Impacts on Emissions and Costs
3 CCC (2020) 2020 Progress Report to Parliament
4 National Atmospheric Emissions Inventory (2020) UK Greenhouse Gas Inventory, 1990 to 2018:
Annual Report for submission under the Framework Convention on Climate Change
5 All the analysis is conducted on an IPCC AR5 basis with carbon feedbacks, using 34 tCO2e/tCH4,
and 298 tCO2e/tN2O.
6 Defra (2020) Greenhouse gas reporting: conversion factors 2020 7 UMAS, E4tech, Frontier Economics, CE Delft (2019) Reducing the maritime sector’s contribution to
climate change and air pollution. Scenario Analysis: Take-up of Emissions Reduction Options and
their Impacts on Emissions and Costs - Technical Annex. Table 5
8 World Trade Organisation (2020) Trade set to plunge as COVID-19 pandemic upends global
economy
9 BEIS (2020) Energy Trends: UK oil and oil products 10 The Asian Renewable Energy Hub (2020)
11 Air Products (2020) Air Products, ACWA Power and NEOM Sign Agreement for $5 Billion
Production Facility in NEOM Powered by Renewable Energy for Production and Export of Green
Hydrogen to Global Markets 12 70 TWh/year of ammonia would require 15 plants at 2,200 tonnes/day scale, or a greater
number of smaller plants. The Balanced Pathway assumes that 75% of low-carbon ammonia
consumed by UK shipping is produced in the UK (so 11 plants in the UK at 2,200 tonnes/day
scale), with 25% of low-carbon ammonia imported (made via renewable electrolysis abroad).
19 Sixth Carbon Budget - Shipping
Emissions pathways for the
shipping sector
20
The following sections are taken directly from Section 8 of Chapter 3 of the CCC’s
Advice Report for the Sixth Carbon Budget.1
Introduction and key messages
In this section, we set out pathways for how UK domestic shipping plus the UK’s
share of international shipping can be reduced to close to zero by 2050, largely
through the use of zero-carbon fuels such as ammonia.
The evidence base on how to decarbonise shipping in the UK relies on UMAS
modelling for the DfT’s Clean Maritime Plan and internal CCC analysis of zero-
carbon fuel costs. Further details are provided in the Methodology Report.
We present the scenarios for shipping emissions in three parts:
a) The Balanced Net Zero Pathway for shipping
b) Alternative pathways for shipping emissions
c) Investment requirements and costs
a) The Balanced Net Zero Pathway for shipping
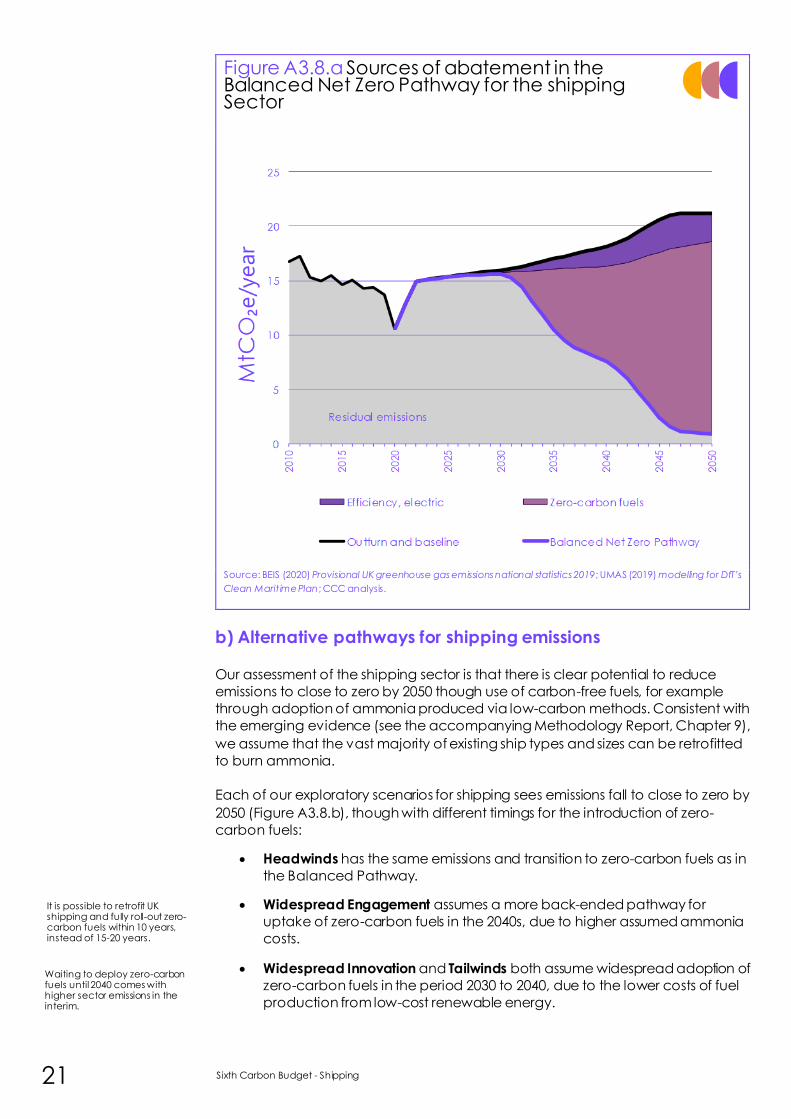
In the Balanced Net Zero Pathway, the shipping sector returns to pre-pandemic
demand levels in 2022. Thereafter, emissions hold relatively flat to 2030, before
reducing to close to zero by 2050 (Figure A3.8.a). This reduction in emissions goes
well beyond the current International Maritime Organisation (IMO) target for a
reduction of 50% in global shipping emissions by 2050 from 2008 levels. We assume
that shipping serving the UK will adopt the zero-carbon fuels required to meet the
global target, but on an accelerated timetable.
The emissions reductions in our scenarios result from some acceleration in
efficiency improvements and electrification relative to baseline forecasts, together
with a wholesale shift to zero-carbon fuels between 2030 and 2050:
• Efficiency and electrification. Total fuel use is assumed to increase by an
average of only 0.9% per annum, compared to 1.2% per annum in the
baseline. By 2050, 3 TWh/year of electricity is used in electric propulsion and
shore power, compared to 0.2 TWh/year in the baseline.
• Zero-carbon fuels comprise the large majority (87%) of the emissions savings
from shipping. In our scenarios, this is assumed to be ammonia, due to the
potential to retrofit ship engines, and its higher energy density compared to
hydrogen and battery electric options. 75% of this ammonia is assumed to
be produced in the UK, using low-carbon hydrogen (see section 5), with the
remainder imported (made abroad using renewable electrolytic
hydrogen). Commercial deployment starts in 2030, with domestic shipping
decarbonising faster than international shipping.
Although it is likely that there would be some reduction in shipping emissions in the
transition to 2050 due to a reduction in shipping demand associated with importing
fossil fuels (see section 5), we have not included this effect in our analysis. The
emissions in the Balanced Net Zero Pathway therefore err on the side of being too
high.
Ships will increasingly plug into the power grid while at port.
Zero-carbon fuels start being used in shipping at scale from 2030.
Shipping can almost completely decarbonise by the late 2040s, due to the use of zero-carbon fuels across almost all the UK fleet.
21 Sixth Carbon Budget - Shipping
Figure A3.8.a Sources of abatement in the Balanced Net Zero Pathway for the shipping Sector
Source: BEIS (2020) Provisional UK greenhouse gas emissions national statistics 2019; UMAS (2019) modelling for DfT’s
Clean Marit ime Plan; CCC analysis.
b) Alternative pathways for shipping emissions
Our assessment of the shipping sector is that there is clear potential to reduce
emissions to close to zero by 2050 though use of carbon-free fuels, for example
through adoption of ammonia produced via low-carbon methods. Consistent with
the emerging evidence (see the accompanying Methodology Report, Chapter 9),
we assume that the vast majority of existing ship types and sizes can be retrofitted
to burn ammonia.
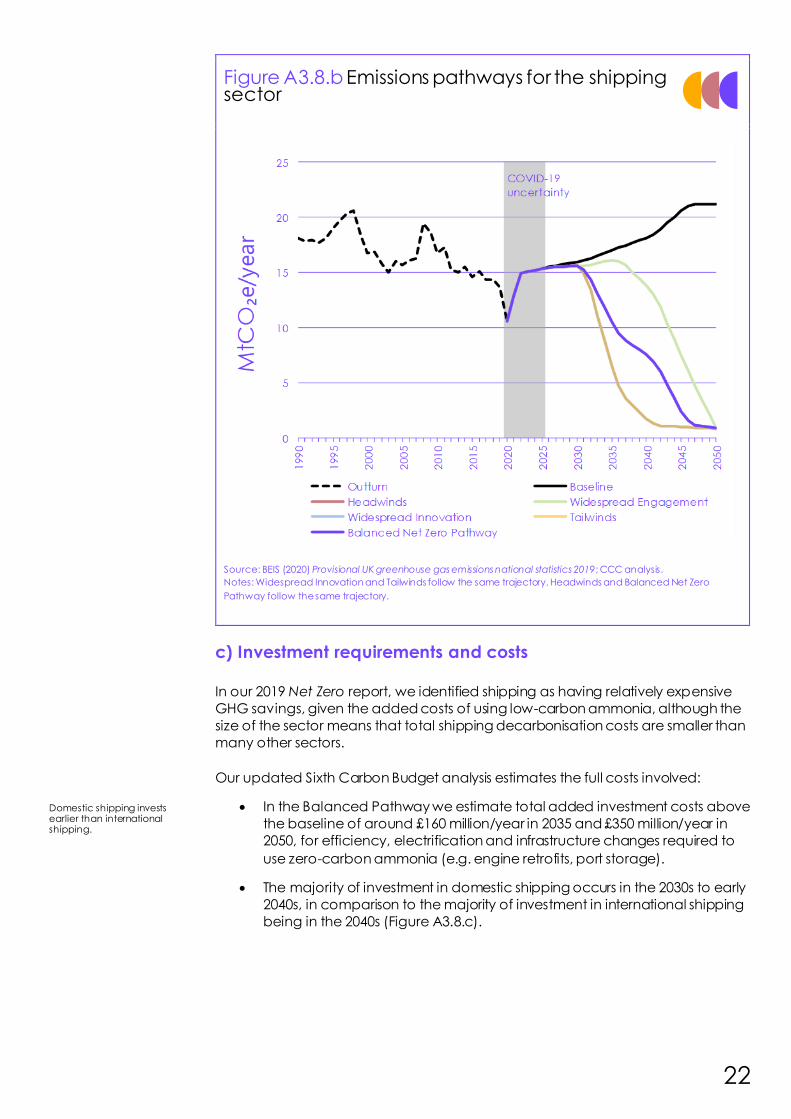
Each of our exploratory scenarios for shipping sees emissions fall to close to zero by
2050 (Figure A3.8.b), though with different timings for the introduction of zero-
carbon fuels:
• Headwinds has the same emissions and transition to zero-carbon fuels as in
the Balanced Pathway.
• Widespread Engagement assumes a more back-ended pathway for
uptake of zero-carbon fuels in the 2040s, due to higher assumed ammonia
costs.
• Widespread Innovation and Tailwinds both assume widespread adoption of
zero-carbon fuels in the period 2030 to 2040, due to the lower costs of fuel
production from low-cost renewable energy.
It is possible to retrofit UK shipping and fully roll-out zero-carbon fuels within 10 years, instead of 15-20 years.
Waiting to deploy zero-carbon fuels until 2040 comes with higher sector emissions in the interim.
22
Figure A3.8.b Emissions pathways for the shipping sector
Source: BEIS (2020) Provisional UK greenhouse gas emissions national statistics 2019; CCC analysis.
Notes: Widespread Innovation and Tailwinds follow the same trajectory. Headwinds and Balanced Net Zero
Pathway follow the same trajectory.
c) Investment requirements and costs In our 2019 Net Zero report, we identified shipping as having relatively expensive
GHG savings, given the added costs of using low-carbon ammonia, although the
size of the sector means that total shipping decarbonisation costs are smaller than
many other sectors.
Our updated Sixth Carbon Budget analysis estimates the full costs involved:
• In the Balanced Pathway we estimate total added investment costs above
the baseline of around £160 million/year in 2035 and £350 million/year in
2050, for efficiency, electrification and infrastructure changes required to
use zero-carbon ammonia (e.g. engine retrofits, port storage).
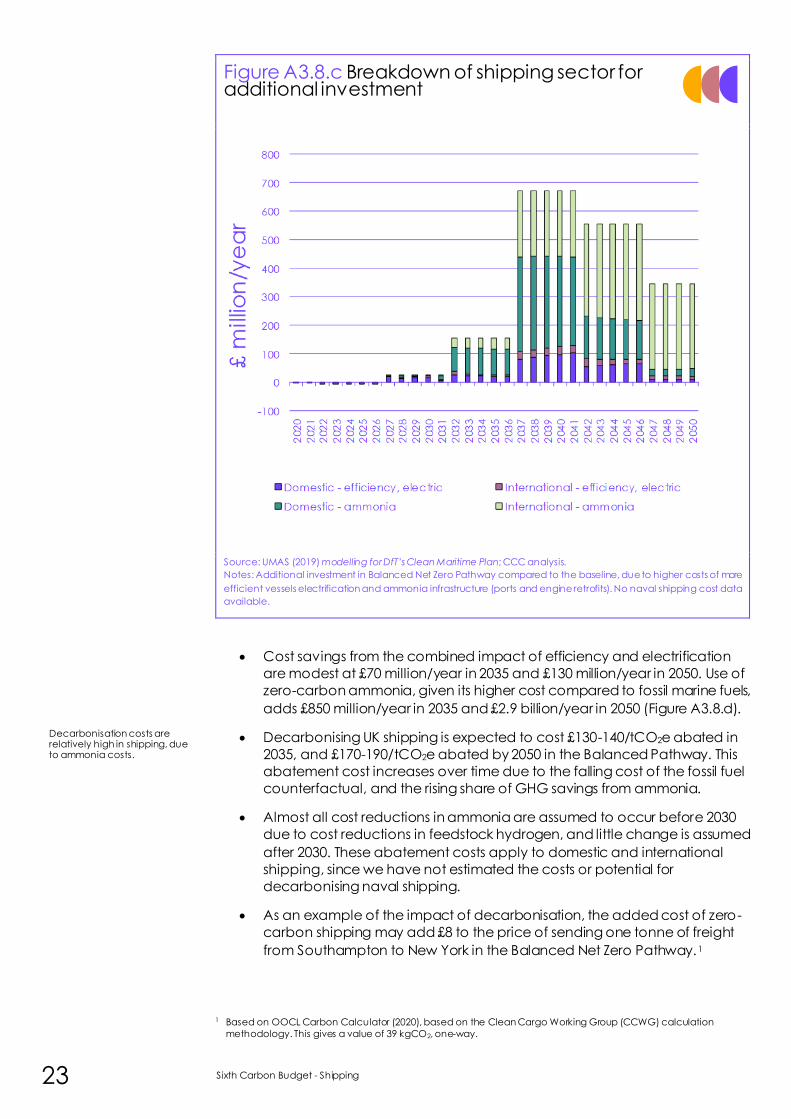
• The majority of investment in domestic shipping occurs in the 2030s to early
2040s, in comparison to the majority of investment in international shipping
being in the 2040s (Figure A3.8.c).
Domestic shipping invests earlier than international shipping.
23 Sixth Carbon Budget - Shipping
Figure A3.8.c Breakdown of shipping sector for additional investment
Source: UMAS (2019) modelling for DfT’s Clean Maritime Plan; CCC analysis.
Notes: Additional investment in Balanced Net Zero Pathway compared to the baseline, due to higher costs of more
efficient vessels electrification and ammonia infrastructure (ports and engine retrofits). No naval shipping cost data
available.
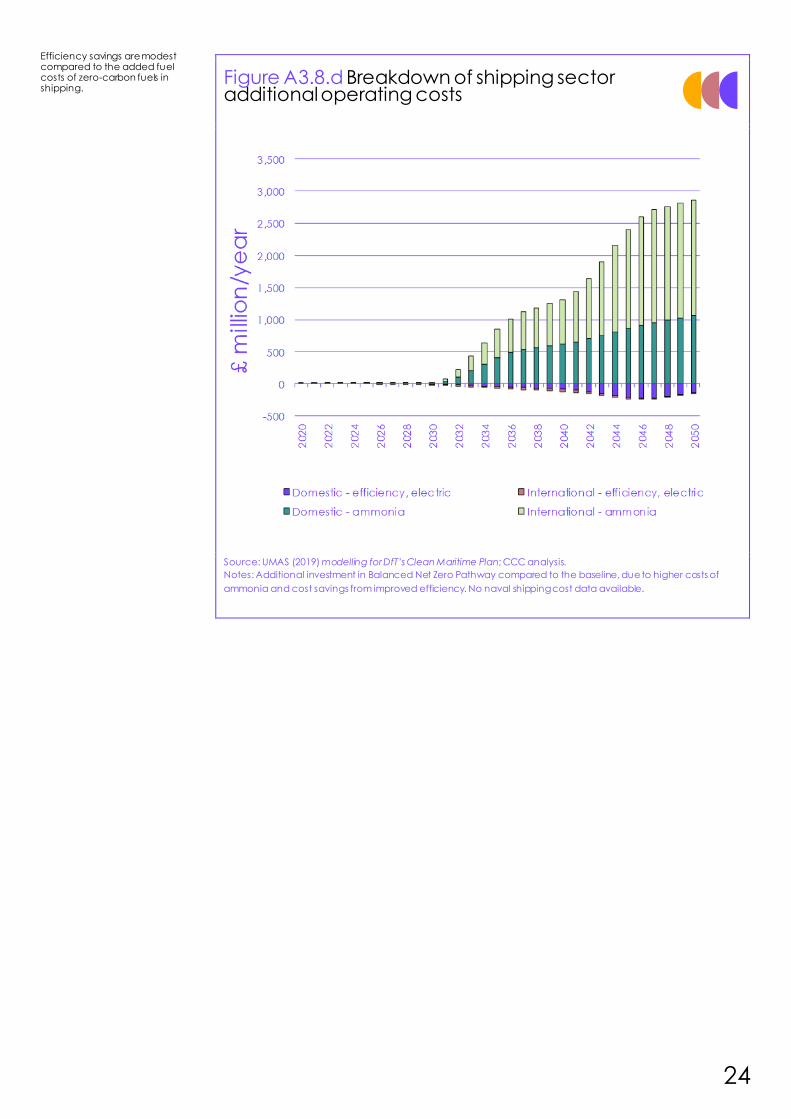
• Cost savings from the combined impact of efficiency and electrification
are modest at £70 million/year in 2035 and £130 million/year in 2050. Use of
zero-carbon ammonia, given its higher cost compared to fossil marine fuels,
adds £850 million/year in 2035 and £2.9 billion/year in 2050 (Figure A3.8.d).
• Decarbonising UK shipping is expected to cost £130-140/tCO2e abated in
2035, and £170-190/tCO2e abated by 2050 in the Balanced Pathway. This
abatement cost increases over time due to the falling cost of the fossil fuel
counterfactual, and the rising share of GHG savings from ammonia.
• Almost all cost reductions in ammonia are assumed to occur before 2030
due to cost reductions in feedstock hydrogen, and little change is assumed
after 2030. These abatement costs apply to domestic and international
shipping, since we have not estimated the costs or potential for
decarbonising naval shipping.
• As an example of the impact of decarbonisation, the added cost of zero-
carbon shipping may add £8 to the price of sending one tonne of freight
from Southampton to New York in the Balanced Net Zero Pathway.1
1 Based on OOCL Carbon Calculator (2020), based on the Clean Cargo Working Group (CCWG) calculation
methodology. This gives a value of 39 kgCO2, one-way.
Decarbonisation costs are relatively high in shipping, due to ammonia costs.
24
Figure A3.8.d Breakdown of shipping sector additional operating costs
Source: UMAS (2019) modelling for DfT’s Clean Maritime Plan; CCC analysis.
Notes: Additional investment in Balanced Net Zero Pathway compared to the baseline, due to higher costs of
ammonia and cost savings from improved efficiency. No naval shipping cost data available.
Efficiency savings are modest compared to the added fuel costs of zero-carbon fuels in shipping.

25 Sixth Carbon Budget - Shipping
1 CCC(2020) The Sixth Carbon Budget – The Path to Net Zero. Available at: www.theccc.org.uk
Policy recommendations for the
shipping sector
27 Sixth Carbon Budget - Shipping
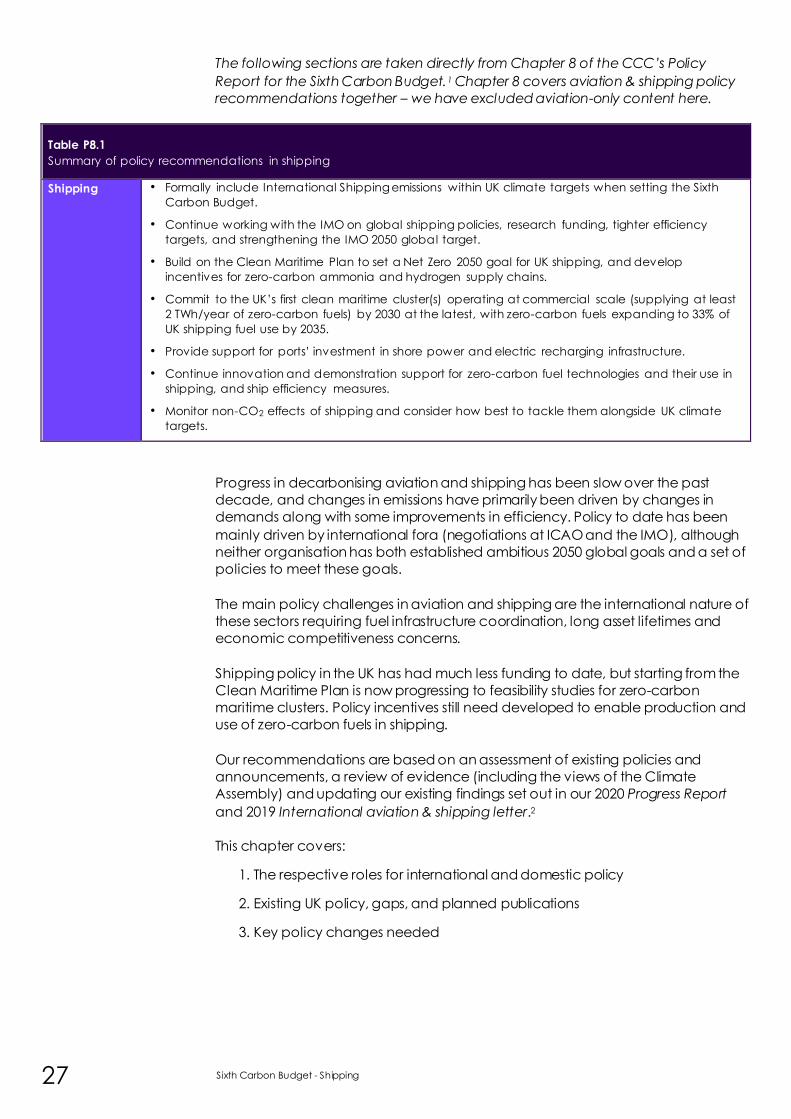
The following sections are taken directly from Chapter 8 of the CCC’s Policy
Report for the Sixth Carbon Budget.1 Chapter 8 covers aviation & shipping policy
recommendations together – we have excluded aviation-only content here.
Table P8.1
Summary of policy recommendations in shipping
Shipping • Formally include International Shipping emissions within UK climate targets when setting the Sixth
Carbon Budget.
• Continue working with the IMO on global shipping policies, research funding, tighter efficiency
targets, and strengthening the IMO 2050 global target.
• Build on the Clean Maritime Plan to set a Net Zero 2050 goal for UK shipping, and develop
incentives for zero-carbon ammonia and hydrogen supply chains.
• Commit to the UK’s first clean maritime cluster(s) operating at commercial scale (supplying at least
2 TWh/year of zero-carbon fuels) by 2030 at the latest, with zero-carbon fuels expanding to 33% of
UK shipping fuel use by 2035.
• Provide support for ports’ investment in shore power and electric recharging infrastructure.
• Continue innovation and demonstration support for zero-carbon fuel technologies and their use in
shipping, and ship efficiency measures.
• Monitor non-CO2 effects of shipping and consider how best to tackle them alongside UK climate
targets.
Progress in decarbonising aviation and shipping has been slow over the past
decade, and changes in emissions have primarily been driven by changes in
demands along with some improvements in efficiency. Policy to date has been
mainly driven by international fora (negotiations at ICAO and the IMO), although
neither organisation has both established ambitious 2050 global goals and a set of
policies to meet these goals.
The main policy challenges in aviation and shipping are the international nature of
these sectors requiring fuel infrastructure coordination, long asset lifetimes and
economic competitiveness concerns.
Shipping policy in the UK has had much less funding to date, but starting from the
Clean Maritime Plan is now progressing to feasibility studies for zero-carbon
maritime clusters. Policy incentives still need developed to enable production and
use of zero-carbon fuels in shipping.
Our recommendations are based on an assessment of existing policies and
announcements, a review of evidence (including the views of the Climate
Assembly) and updating our existing findings set out in our 2020 Progress Report
and 2019 International aviation & shipping letter.2
This chapter covers:
1. The respective roles for international and domestic policy
2. Existing UK policy, gaps, and planned publications
3. Key policy changes needed
Sixth Carbon Budget - Shipping 28
1. The respective roles for international and domestic policy
Even with their emissions formally included in UK carbon budgets and the Net Zero
target, the primary policy approach to reducing emissions from international
aviation and shipping (IAS) should be at the international level. These sectors are
global in nature and there are some risks that a unilateral UK approach to reducing
these emissions could lead to carbon leakage (under certain policy choices) or
competitiveness concerns.
The UK has played a key role in progress by both the International Civil Aviation
Organisation (ICAO) and International Maritime Organisation (IMO). In the context
of international negotiations at the ICAO and the IMO, inclusion of IAS emissions in
the Net Zero target should not be interpreted as a rejection of multi -lateral
approaches or as prejudicing discussions on burden sharing.
However, international approaches are unlikely to overcome all barriers to
decarbonising the IAS sectors. Supplementary domestic policies should also be
pursued where these can help overcome UK-specific market barriers, and where
these do not lead to adverse impacts on competitiveness and/or carbon leakage.
a) International approaches At the international level, global policies consistent with the ambition in the Paris
Agreement are required to provide a level playing field for airlines and shipping
operators, and to guard against the risk of competitive distortions. The international
trade bodies for both aviation and shipping have begun to develop their
approaches but further progress is required:
• Shipping. The IMO has agreed to reduce global international shipping
emissions by at least 50% by 2050 compared to 2008 levels, and fully
decarbonise “as soon as possible” after 2050. It must now put in a place a
package of policies to deliver these targets. That should include carbon
pricing, measures such as slow steaming and operations optimisation,
support for RD&D, and a co-ordinated approach to provision of refuelling
infrastructure and engine retrofits for alternative fuels.
– The IMO’s 2050 ambition should also be strengthened to align with the
more ambitious end of the temperature goal in the Paris Agreement,
given the potential for much deeper reductions in global shipping
emissions (e.g. to nearly zero by 2050 through use of ammonia or other
hydrogen-based fuels).
– In November 2020, IMO formalised some measures towards its 2030
carbon intensity target (a 40% improvement from 2008 levels),
agreeing to new energy efficiency requirements from 2023 and
mandatory carbon intensity targets from 2026. However, more
stretching targets should be introduced for new ship and fleet
efficiencies, given that fleet carbon intensities in 2018 had already
improved by 30% from 2008 levels.3
– Proposals for an International Maritime Research and Development
Board (IMRB), funded by a fuel levy, are still under consideration.
Inclusion of IAS emissions in UK climate targets does not imply taking a unilateral policy approach for them.
International approaches are unlikely to overcome all barriers to decarbonising the IAS sectors.
IMO needs to strengthen its long-term goals and develop a policy package to meet these.
29 Sixth Carbon Budget - Shipping
b) Supplementary domestic policies Supplementary domestic policies that have limited competitiveness or carbon
leakage risks should be pursued in parallel to international approaches to
decarbonisation. These include support for developing alternative fuels and
associated infrastructure, managing demand, decarbonising domestic fleets, and
kick-starting a UK market for greenhouse gas removals (see Chapter 11). These
domestic policy recommendations are discussed in section 3 below.
By taking these domestic and international policy approaches in parallel to
including IAS formally within carbon budgets and the Net Zero target, the UK will
be contributing fully to the global effort to tackle aviation and shipping emissions.
Domestic policy can focus on supporting low-carbon fuels, managing demand, domestic fleet decarbonisation and developing GHG removals.

Sixth Carbon Budget - Shipping 30
2. Existing UK policy, gaps, and planned publications
a) Shipping
Existing UK policy in shipping has been focused on small-scale funding of research
projects, establishment of advisory functions and mapping of priority cluster
locations, all as outcomes of the 2019 Clean Maritime Plan.4 Recent developments
include:
• £20 million is to be invested into a Clean Maritime Demonstration
Programme, to fund several clean maritime cluster feasibility studies at key
sites across the UK, including Orkney and Teesside. This activity has a target
milestone of 2022 for vessels trials starting in Orkney and work launched on
a hydrogen refuelling port in Teesside.
• A consultation on supporting zero-carbon shipping fuels under the
Renewable Transport Fuel Obligation (RTFO) has been expected in 2020.
• A Call for Evidence on non-tax incentives in shipping has been delayed.
However, Government will be providing a response to HM Treasury’s
Carbon Emissions Tax consultation that may extend carbon taxation to
shipping if a UK ETS is not adopted from 2021.
The main policy gaps in shipping include the lack of incentives for commercial use
of zero-carbon fuels in shipping, plus the lack of deployment support for port
infrastructure changes and construction of zero-carbon fuels plants. Higher-level
strategic gaps include the lack of formal inclusion of international emissions in UK
carbon budgets and the Net Zero target, and the need for a sector trajectory to
inform new fuels deployment timings and efficiency expectations.
UK shipping policy has recently emerged out of the Clean Maritime Plan, and is still ramping up.
Shipping innovation and feasibility studies are necessary, but so is a long-term commercial incentive for producing and using zero-carbon fuels in shipping.
31 Sixth Carbon Budget - Shipping
3. Key policy changes needed
a) Shipping The Government should include international shipping emissions within the Sixth
Carbon Budget, subsequent carbon budgets and the 2050 Net Zero target.
The Clean Maritime Plan set out many of the initial decarbonisation steps needed
and commits the UK to ‘moving faster than other countries and faster than
international standards’, although does not yet commit to a firm sector 2050
target. It should now be strengthened to commit to a 2050 Net Zero goal for UK
shipping. Government should also support supply chains and the roll-out of clean
maritime clusters by 2030:
• Develop incentives for zero-carbon ammonia and hydrogen supply chains
for UK shipping.
– To support the deployment of zero-carbon fuels in shipping at low
volumes during the 2020s, one option could be inclusion within the
Renewable Transport Fuel Obligation (RTFO). If this option is pursued,
given the potential for ammonia to become the lowest-cost transport
option for hydrogen globally, and the ability to retrofit existing engines
for ammonia, both fuels should be set on an equal basis for
development fuel support under the RTFO.
– However, in the longer term, for commercial roll-out from 2030, more
bespoke zero-carbon shipping fuel policy will likely be required than
the RTFO, given declining road fuel use. It may also make more sense
for deployment to be paid for by the shipping sector rather than road
fuel users.
– Given these longer-term considerations, alternative policy options to
RTFO inclusion could be considered. These could be including shipping
within a UK emissions trading scheme or carbon taxation. However,
there are risks that either of these options do not provide a high
enough effective carbon price to incentivise the required zero-carbon
fuel infrastructure and any ship retrofits (e.g. we estimate that an
effective carbon price well above £200/tCO2e is likely to be needed in
the 2020s). Supplementary support for construction of new zero-
carbon fuel infrastructure and ship retrofits may therefore be required
alongside these carbon pricing options.
– Any GHG emissions thresholds should incentivise the use of zero
carbon renewable fuels in shipping, with minimal upstream emissions.
• Commit to delivery of a phased roll-out of clean maritime clusters:
– Feasibility studies for the UK’s first zero-carbon shipping clusters
launched in early 2020s.
– Initial smaller-scale port demonstrations in the early to mid-2020s, and
learnings shared.
– A full roll-out plan for zero-carbon shipping fuels, and accompanying
fleet retrofits or modifications, to be in place by the mid-2020s, to allow
time for investment and construction.
Government should commit to a 2050 Net Zero goal for UK shipping.
Incentives need developed for low-carbon hydrogen and ammonia, and a range of policy options exist.
Carbon pricing options will still likely need supplementary policies for zero-carbon fuel infrastructure.
A clear timeline and roll-out plan needs to be published to achieve zero-carbon shipping clusters by 2030.
Sixth Carbon Budget - Shipping 32
– The UK’s first clean maritime cluster at commercial scale (e.g.
supplying more than 2 TWh/year of zero-carbon fuels) to be operating
by 2030 at the latest – and ideally more than one cluster operational
by 2030.
– Roll-out during the early 2030s to achieve a 33% share of zero-carbon
fuels being used in UK shipping by 2035 (this is a ten times scale-up
from 2030, following the Balanced Pathway deployment profile). The
UK’s domestic fleet is likely to take a leading role in initial deployment.
• Accelerate marine RD&D funding, including for ship efficiency measures,
alternative propulsion testing, high efficiency cracking of ammonia to
hydrogen, electro-chemical synthesis of ammonia, and mitigating
ammonia combustion air quality concerns. Conduct further research on
the decarbonisation options available to naval shipping.
• Provide financial support (e.g. capital support or loan guarantees) for ports
looking to invest in shore power and electric vessel charging infrastructure.
• Monitor non-CO2 effects of shipping and consider how best to tackle them
alongside UK climate targets without increasing CO2 emissions.
Further research should continue into efficiency, zero-carbon fuels production and air quality aspects.
33 Sixth Carbon Budget - Shipping
1 CCC(2020) Policies for the Sixth Carbon Budget and Net Zero . Available at: www.theccc.org.uk
2 CCC (2019) Net-zero and the approach to international aviation and shipping emissions 3 IMO (2020) Fourth IMO GHG Study
4 DfT (2019) Clean Maritime Plan