Embed Size (px)
Citation preview


LXBRARIBS

Digitized by the Internet Archive
in 2011 with funding from
Boston Library Consortium IVIember Libraries
http://www.archive.org/details/skillcontentofreOOauto

[OEWEY
Massachusetts Institute of Technology
Department of EconomicsWorking Paper Series
The Skill Content of Recent Tectinologicol Change:An Empirical Exploration
David H. Autor
Frank Levy
Richard Mumane
Working Paper 01-22
June 2001
Room E52-251
50 Memorial Drive
Cambridge, MA 02142
This paper can be dow/nloaded v^ithout charge from the
Social Science Research Netv^ork Paper Collection at
http://papers.ssrn.com/paper.taf?abstract id=27269
1

Massachusetts Institute of Technology
Department of Economics
Working Paper Series
The Skill Content of Recent Technological Change:An Empirical Exploration
David H. Autor
Frank Levy
Richard Mumane
Working Paper 01 -22
June 2001
Room E52-251
50 Memorial Drive
Cambridge, MA 02142
This paper can be downloaded without charge from the
Social Science Research Network Paper Collection at
http://papers.ssrn.conn/paper.taf?abstract id=27269
1
The Skill Content of Recent Technological Change:
An Empirical Exploration
David H. Autor
MIT Department of Economics and NBER
Frank Levy
MIT Department of Urban Studies and Planning and Russell Sage Foundation
Richard J. MurnaneHarvard University Graduate Schojol of Education and NBER^
June 2001
Revised from January 2000
Abstract
We apply an understanding of what computers do - the execution of procedural or rules-based logic - to
study how computer technology alters job skill demands. We contend that computer capital (1) substitutes
for a limited and well-defined set of human activities, those involving routine (repetitive) cognitive and
manual tasks; and (2) complements activities involving non-routine problem solving and interactive tasks.
Provided these tasks are imperfect substitutes, our model implies measurable changes in the task content
of employment, which we explore using representative data on job task requirements over 1960 - 1998.
Computerization is associated with declining relative industry demand for routine manual and cognitive
tasks and increased relative demand for non-routine cognitive tasks. Shifts are evident within detailed
industries, within detailed occupations, and within education groups within industries. Translating
observed task shifts into educational demands, the sum of within-industry and within-occupation task
changes explains thirty to forty percent of the observed relative demand shift favoring college versus non-
college labor during 1970 to 1998, with the largest impact felt after 1980. Changes in task content within
nominally identical occupations explain more than half of the overall demand shift induced by
computerization.
JEL:O30, J23, J31,E23
' We thank the Alfred P. Sloan Foundation, the Russell Sage Foundation and the MIT-Ford Research Collaboration
for financial support and Kokkeong Puah, Detelina Vasileva, and especially Melissa Schettini for excellent research
assistance. We are indebted to Daron Acemoglu, Eli Berman, Lex Borghans, Lawrence Katz, Kevin Lang, ThomasLemieux, Sendhil Mullainathan, Kathryn Shaw and Bas Ter Weel for valuable suggestions. Thanks go to RandyDavis of MIT's Artificial Intelligence Laboratory and Pete Szolovits of MIT's Laboratory for Computer Science for
clarifymg issues in artificial intelligence. We are grateful to Michael Handel for providing access to key data sources
and for expert advice on using the Dictionary of Occupational Titles. The usual disclaimer about responsibility for
errors deserves special emphasis here.
Introduction
Much quantitative and case-study evidence documents a strong association between the adoption of
computers and computer-based technologies and the increased use of college-educated and non-
production labor within detailed industries, within firms, and across plants within industries. These
patterns implicating computerization as a potential source of a demand shift favoring better-educated
labor appear consistently in studies from the U.S., the OECD, Canada and other developed and
developing countries.' While the empirical relationship between computer investment and use of
educated labor is firmly established, it is our view that the conceptual link explaining specifically how
computer technology complements skilled labor or substitutes for unskilled labor is not well
developed. In particular, most studies do not ask, or are prevented by data limitations from answering,
what is it that computers do - or what is it that people do with computers - that causes educated
workers to be relatively more in demand.^
These mechanisms may initially appear trivial; computers substitute for less educated workers in
the performance of simple tasks or and/or complement the performance ofmore educated workers in
complex tasks. Reflection suggests that the relationship between human education and "computer
skills" is more complex. In the economy of the 1970s, long haul truck driving and double entry
bookkeeping were both tasks routinely performed by workers with modest education, typically high
school graduates. In the present economy, computers perform a vast share of the routine bookkeeping
via database and accounting software but do little of the truck driving. Similarly, playing a strong game
Autor, Katz and Krueger ( 1 998) and Berman, Bound and Griliches (1994) present evidence on industry level shifts.
Bresnahan, Brynjolfsson and Hitt (forthcoming) and Levy and Mumane (1996) and Doms, Dunne and Troske (1997)
provide evidence on firm and plant level shifts. Machin and Van Reenen (1998) provide data on the OECD, Gera, Guand Lin (2001) on Canada, and Berman, Bound and Machin (1998) and Berman and Machin (2000) on other
developing and developed countries.
Herbert Simon (1960) provides the first treatment of this question with which we are familiar. His essay introduces
many of the ideas explored here. Influential studies in the ethnography of work literature provide insightftil discussions
of what computers and related technology do in the workplace but do not consider economic implications (Adler,
1986; Orr, 1996; and Zuboff, 1988). Bresnahan (1999), Bresnahan, Brynjolfsson and Hitt (forthcoming), Goldin and
Katz (1998), and Lindbeck and Snower (2000) exemplify important studies in the economic literature that explore whynew technologies and educated labor appear to be relative complements.
of chess and writing a persuasive legal brief are both skilled tasks. Current computer technology can
readily perform the first task but not the second. These examples suggest that neither all 'high' nor all
'low' skilled tasks are equally amenable to computerization. We argue below that present computer
technology has quite specific applications and limitations that make it an incomplete substitute for both
well-educated and less educated human labor.
The objective of this paper is to propose and test a model of how the computerization of workplace
tasks alters job content and thereby human skill demands. We build the model from an understanding
of what computers do - by which we mean the tasks that present computer technology is particularly
suited to performing. By conceptualizing and measuring job skill demands in terms ofjob tasks rather
than the educational credentials ofworkers performing those tasks, we believe our analysis makes
three contributions. First, we provide an explicit account of how computerization alters work content,
exposing the mechanisms undergirding the widely documented observation that computers and
education are relative complements. Second, using representative observational metrics ofjob tasks
from the Dictionary of Occupational Titles (DOT), we analyze the degree to which technological
change has altered the cognitive and manual content ofjobs between 1960 and 1998. A unique virtue
of the DOT is that it permits us to study changes in job content within industries, education groups, and
occupations - phenomena that in all but the first case are not normally observable. Finally, we quantify
the extent to which changes in the structure of work induced by computerization have contributed to
recent observed increases in the relative demand for educated labor. We find that this contribution is
sizable.
Our analysis builds upon two branches of the literature on the demand for skill. The first infers
shifts in the demand for skills from secular trends in the occupational, educational, and gender
composition of employment." The second posits, and in several cases tests empirically, individual and
' See Bound and Johnson (1992); Juhn (1999), Juhn, Murphy and Pierce (1993), Katz and Murphy (1992), Murphyand Welch (1992 and 1993), and Welch (2000).
organizational level complementarities between technological change and workers' learning and
problem solving capabilities.'' Our analysis extends both avenues of research. We first offer a
conceptual framework that makes specific predictions about complementarity and substitutability
between new technology and labor in carrying out workplace tasks. We next explore the empirical
implications of this framework using economy-wide data on the task distribution of employment over
four decades.
1. Framework
For purposes of our framework, it is usefiil to conceptualize a job as a series of tasks: moving an
object, executing a calculation, communicating a piece of information, resolving a discrepancy. In this
context, we ask the question: which tasks can be performed by a computer?^ A good first answer is that
computers perform tasks that can be expressed using procedural or 'rules-based' logic, that is codified
in a fully specified sequence of logical programming commands ("If-Then-Do" statements) that
designate unambiguously what actions the machine will perform and in what sequence at each
contingency to achieve the desired result.^ The simple observation that tasks cannot be computerized
unless they can be proceduralized is the point of departure for our discussion. We focus first on the
computerization of manual tasks and subsequently discuss information processing (cognitive) tasks.^
Important examples include Acemoglu (1999), Bartel and Lichtenberg (1989), Bresnahan (1999), Bresnahan,
Brynjolfsson and Hitt (forthcoming), Casselli (1999), Goldin and Katz (1998), Lindbeck and Snower (2000), Nelson
and Phelps (1966), Schultz (1975), and Welch (1970).
We take as given that the rapidly declining price of computer capital - a 35 percent average annual rate from 1985 to
1996 (Grimm, 1998) - provides firms with strong incentives to answer this question. Jorgenson and Stiroh (1995 and
1999) discuss the importance of the declining price of computer capital in inducing substitution between information
technology and other forms of capital and labor input. The model advanced by Borghans and Ter Weel (2000)
underscores that computers are particularly likely to substitute for (in our terminology) routine tasks performed by
high-wage workers.
The Encyclopedia Brittanica (2000) defines a computer program as a "detailed plan or procedure for solving a
problem with a computer; more specifically, an unambiguous, ordered sequence of computational instructions
necessary to achieve such a solution."
A logical question is whether the requirement for proceduralization is intrinsic to computer technology or is an
artifact of the economic incentives that shaped its development. Our view is that proceduralization is inherent,
although other specific aspects of computer technology may not be. As evidence for this point, we note that Charles
Babbage articulated the notion of procedural programming in his descnption of the "Analytical Engine" in 1837,
almost a century before the first computer was developed (cf Babbage, 1888). Babbage's device was in turn inspired
by what many consider to be the first mechanical computer, the Jacquard Loom developed by Joseph Marie Jacquard
Many manual tasks that humans perform (or used to perform) at their jobs can be specified in
straightforward computer code and accomplished by machines, for example, monitoring the
temperature of a steel finishing line or moving a windshield into place on an assembly line. However, a
problem that arises with many tasks is that, as Michael Polanyi (1966) put it, "we do not know how to
do many of the things we do." Accordingly, it is difficult to develop machines that carry out these
tasks. For example, it is a trivial undertaking for a human child to walk on two legs across a room to
pick an apple from a bowl of fruit. This same task is presently a daunting challenge for computer
science and robotics. Both optical recognition of objects in a visual field and bipedal locomotion across
an uneven surface appear to require enormously sophisticated algorithms, the one in optics and the
other in mechanics, which are currently poorly understood by cognitive science (Pinker, 1 997). These
same problems explain the earlier mentioned inability of computers to perform the tasks of long haul
truckers.^
In this paper we refer to such tasks requiring visual and manual skills as 'non-routine manual
activities.' We emphasize the phrase non-routine because if a manual task is sufficiently well specified
or performed in a well-controlled environment, it often can be automated despite the seeming need for
visual or manual skills that at present are poorly simulated by machines (as, for example, in the case of
industrial robots on assembly lines). It is this 'routineness' or predictability that is lacking in the truck-
in 1801 (Mokyr, 1990). What the Jacquard loom shares with essentially all computers is: first, it is a symbolic
processor, acting upon symbolic representation of information such as binary numbers or, in this case, punched cards;
and, second, its actions are deterministically specified by explicit procedures or programs. Despite the substantial time
interval between initial vision and ultimate implementation, the modem computer is a close relative of Babbage's
machine. As Acemoglu (1998 and 2000) argues forcefully, however, the specific characteristics and applications of the
technology are likely to be endogenously shaped by market forces.
^ It is of course a fallacy to assume that a computer must reproduce all of the functions of a human to perform a task
traditionally done by humans. Automatic Teller Machines, for example, have supplanted many bank teller functions
although they cannot verify signatures or make polite conversation while tallying change. This observation raises the
important question of which if any attributes of a task are intrinsic and which are artifactual characteristics that these
tasks may have obtained precisely because humans traditionally performed them. Although we do not attempt to
address this question here, we surmise that whether the characteristics of a task are intrinsic or merely artifactual, these
historical characteristics generate real costs when automating a task. For example, if robotic technology had preceded
the automobile, it is likely that vehicle navigation would have been designed to rely less heavily on sightedness. Given
the present (sunk) infrastructure of sight-dependent vehicles and visually cued roads, a major cost of automating the
driving example.'
The substitution of machinery for repetitive human labor has of course been a central thrust of
technological change since (at least) the industrial revolution (cf , Hounshell, 1985; Mokyr, 1990; and
Goldin and Katz, 1998). What computer capital uniquely contributes to this process is the capability to
perform symbolic processing, that is, to calculate, store, retrieve, sort, and act upon information."*
Although symbolic processing depends on little more than Boolean algebra, the remarkable generality
of this tool allows computers to supplant or augment human cognition in a vast range of information
processing tasks that had historically been the mind's exclusive dominion. In economic terms,
advances in information technology have sharply lowered the price of accomplishing procedural
cognitive tasks (i.e., rules-based reasoning). Accordingly, computers increasingly substitute for the
routine information processing, communications, and coordinating functions performed by clerks,
cashiers, telephone operators, bank tellers, bookkeepers, and other handlers of repetitive information
processing tasks, a point emphasized by Bresnahan (1999)."
Yet, the applicability of computer capital is nevertheless circumscribed by the need for an
unambiguous, ordered sequence of computational instructions that specify how to achieve a desired
end. As a result, there is little computer technology that can develop, test, and draw inferences from
models, solve new problems, or form persuasive arguments - tasks that many jobs require.'^ In the
task of driving appears to be developing computers that can perform visual processing approximately as well as
humans.
Industrial robots may, for example, select distmct parts from bins, transport parts to work stations on demand, and
perform other non-repetitive manual tasks that require responding appropriately to environmental stimuli. What makes
these robotic feats possible is the extreme predictability of the assembly line, a purposefully engineered attribute. AsSimon (1960) observed, environmental control is a substitute for flexibility. Moreover, the simple distinction between
computer-substitutable and non-substitutable tasks is not absolute. For example, by calculating more efficient long
haul trucking routes, computers can 'substitute' for the labor input of long haul truck drivers without driving trucks.
This observation suggests that there is a non-zero elasticity of substitution between routine and non-routine tasks, a
point we encapsulate in our model.'" This point is emphasized by Weizenbaum (1976) and Bryjolfsson and Hitt (2000).
Autor, Levy, and Mumane (2001) provide an example of this generalization in a study of the automation of check
clearing in a large bank.
Software that recognizes ill structured patterns ('neural networks') and solves problems based upon inductive
reasoning from well-specified models ('model based reasoning') is under development and has been applied
commercially in several cases. But these technologies have had little role in the computer-induced technical change of
words of artificial intelligence pioneer Patrick Winston (1999):
"The goal of understanding intelligence, from a computational point of view, remains elusive.
Reasoning programs still exhibit little or no common sense. Today's language programs
translate simple sentences into database queries, but those language programs are derailed by
idioms, metaphors, convoluted syntax, or ungrammatical expressions. Today's vision programs
recognize engineered objects, but those vision programs are easily derailed by faces, trees, and
mountains."
The capabilities and 'limitations of present computer technology make it, in our terminology, more
substitutable for routine than non-routine tasks. By implication, computers are relative complements to
workers engaged in non-routine tasks. This complementarity flows through three channels.
First, at a mechanical level, computers increase the share of human labor input devoted to non-
routine cognitive tasks by offloading routine manual and cognitive tasks from expensive professionals.
More substantively, an outward shift in the supply of routine informational inputs (both in quantity and
quality) increases the marginal productivity of workers performing non-routine tasks that rely on these
inputs. For example, comprehensive bibliographic searches increase the quality of legal research;
timely market information improves the efficiency of managerial decision-making; richer customer
demographics increase the productivity of salespersons, etc. Third, and perhaps most significantly,
workplace computerization appears to increase the demand for problem-solving tasks - a non-routine
cognitive task by our definition. Because 'solved' problems are intrinsically routine and hence readily
computerized, the comparative advantage of labor in a computerized envirormient is specifically in
handling non-routine problems such as resolving production deficiencies, handling discrepancies and
exceptions, and detecting and resolving unanticipated bottlenecks.'^ In net, these arguments imply that
price declines in computerization should augment the productivity of workers engaged in non-routine
cognitive tasks.
the last three decades. See Davis (1984) for further discussion. Bresnahan (1999) similarly emphasizes that computers
are at best a limited substitute for human decision-making. Levy et al. (1999) provide a discussion of rules-based
reasonmg in the context of auto repair.
" Observational studies that offer this insight include Adler(1986), Autor, Levy and Mumane (2001), Bartel,
Ichniowski and Shaw (2000), Fernandez (1999), Levy and Mumane (1996) and Zuboff (1988).
Table 1 provides examples ofjobs in each cell of our two-by-two matrix of workplace tasks
(routine versus non-routine, manual versus information processing) and states our hypothesis about the
impact of computerization on the tasks in each cell. Although we limit our focus here to task shifts
within occupations, these forces are likely to alter the task and organizational structure of firms along
analogous dimensions.'''
2. Routine and non-routine skills in production: A model
The manner in which an exogenous decline in the price of carrying out 'routine' tasks alters the
task content ofjobs and the wages attached to them depends on the elasticity of substitution between
routine and non-routine tasks and the supplies of workers and capital to each. While these parameters
are not known with any precision, we believe our discussion motivates several plausible assumptions.
First, we have argued above that computer capital is more substitutable for humans in carrying out
routine tasks than non-routine tasks. Second, we believe it is non-controversial that routine and non-
routine tasks are themselves imperfect substitutes. Third, at least in the domain of cognitive tasks, we
observe that greater intensivity of routine inputs increases the marginal productivity of non-routine
inputs.'^
These assumptions structure the production side of our model. Consider the following production
fiinction in which two types of tasks, routine R and non-routine N , are used to produce output, q ,
which sells at price one. For tractability, we assume a constant returns to scale Cobb-Douglas
technology:
(1) q = R'~'N\(5^{0,\).
To encapsulate the notion that computers are more substitutable for routine than non-routine tasks, we
''* See Autor, Levy and Mumane (2001), Bartel, Ichniowski and Shaw (2000), Bresnahan (1999), Bresnahan,
Brynjolfsson and Hitt (1999), and Brynjolfsson and Hitt (2000), Caroli and Van Reenen (forthcoming), Garicano
(2000), Lindbeck and Snower (2000), and Thesmar and Thoenig (2000) for perspectives on these ideas.
While in the model below we aggregate our four tasks groups into only two categories - routine and non-routine -
we suspect that in actuality routine and non-routine manual tasks are substantially less complementary as productive
inputs than are routine and non-routine cognitive tasks.
assume that computer capital, C , and humans are perfect substitutes in carrying out routine tasks, R .
While this assumption is obviously extreme, the only substantive requirement for our model is that
computer capital is more substitutable for humans in carrying out routine than non-routine tasks.'^
Computer capital is supplied perfectly elastically at market price P per efficiency unit, where P is
falling exogenously with time due to technical advances. The declining price of computer capital is the
causal force in our model.
To model labor supply, we assume as in Roy (1951) that workers choose among occupations (here,
routine and non-routine) according to comparative advantage. We model each worker as possessing a
productivity endowment, E(R^ , jV, ) , in routine and non-routine tasks specified in efficiency units
where /?, ,N^ > V / . Define the relative efficiency of individual (i) at non-routine versus routine tasks
as a. = N^ /R. where a e (0,°°) . We assume a large number of workers who choose to supply either
R. efficiency units of routine task input or A''^ efficiency units of non-routine task input. In keeping
with our discussion, we think of the decision to supply labor to routine or non-routine tasks as the
choice of an occupation.
Under these assumptions, it is straightforward to trace out the implications of a technical advance -
a fall in the price of computer capital - for occupational choice, marginal task productivity, and wages
(specified in efficiency units). Given the perfect substitutability of computer capital and routine skills,
the wage per efficiency unit of routine labor is given by
(2) W^=P.
Since workers choose their occupation - that is, to supply routine or non-routine labor - to maximize
earnings, the marginal worker with relative efficiency units a' in routine vs. non-routine tasks is
indifferent between routine and non-routine occupations when
Cobb-Douglas technology implies that the elasticity of substitution between routine and non-routine tasks is one.
Hence, computer capital and non-routine task mputs are relative complements.
- w(3) a =-!^.
W
Equation (3) implies that for a,. < a* , individual i supplies routine labor, and for «.>«',/ supplies
non-routine labor.
To quantify factor supplies to each occupation as a function of a* , denote the functions
g{a), h{a) that give the population endowment in efficiency units of routine and non-routine tasks
respectively for each value of a . We make no assumption on the population distribution of
endowments or their correlation except to require that the joint distribution of R- , N. is non-degenerate
and has mass at all a .' '' Hence, we have gia), h{a) > V a > ; for every a , there is a non-zero set
of workers with total routine efficiency endowment g{a) and non-routine efficiency endowment h{a)
.
Accordingly, both occupations face a strictly upward sloping supply of task input.
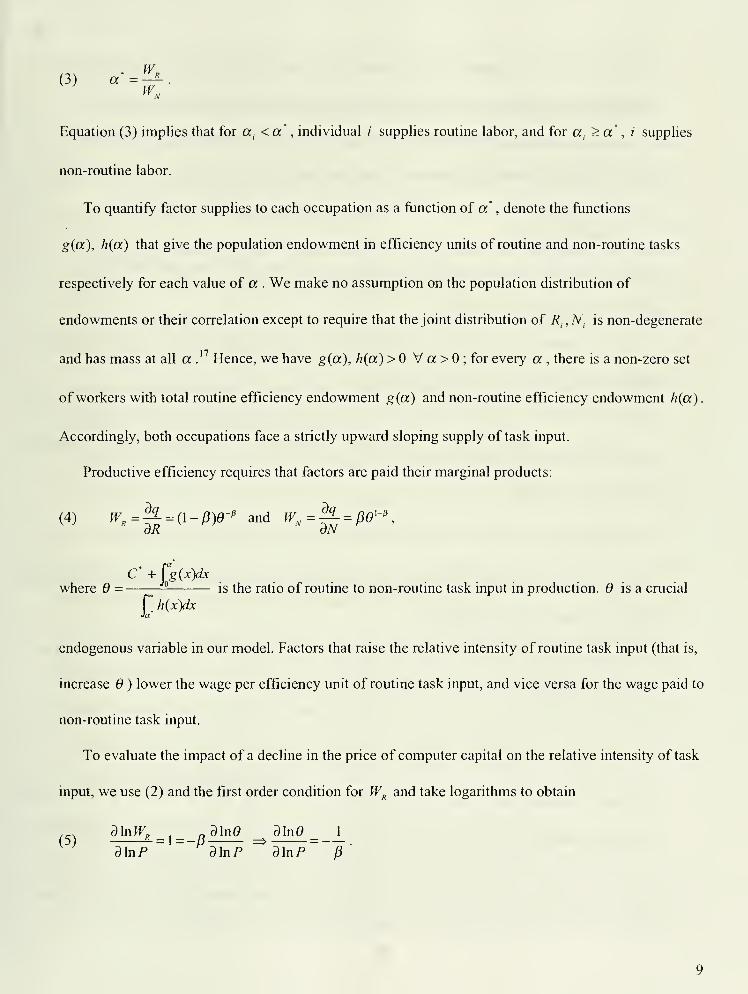
Productive efficiency requires that factors are paid their marginal products:
(4) lV,=^ = (l-[i)e-' and ^F,=^ = ^0'-^
C +fg{x)dxwhere 6 = is the ratio of routine to non-routine task input in production. is a crucial
r Kx)dxJa
endogenous variable in our model. Factors that raise the relative intensity of routine task input (that is,
increase ) lower the wage per efficiency unit of routine task input, and vice versa for the wage paid to
non-routine task input.
To evaluate the impact of a decline in the price of computer capital on the relative intensity of task
input, we use (2) and the first order condition for W,^ and take logarithms to obtain
,^. dlnW, , „ain0 ain0 1
(5) - = l = -B => =.
d\nP d\nP d\nP B
A decline in the price of computer capital reduces the wage per efficiency unit of routine tasks and, as
the final term of (5) indicates, increases the relative intensity of routine task input in production.
Since routine and non-routine tasks are complementary inputs (specifically, q-complements),
increased intensity of routine task input raises the wage per efficiency unit of non-routine task input:
^'
d\nP p
A decline in the price of computing power unambiguously increases the marginal productivity of
workers engaged in non-routine tasks.
In the equations above, wages are specified in efficiency units. Since efficiency units vary over the
population and workers choose their occupation to maximize earnings, a decline in the price of
computer capital alters occupational choice. Consider the impact of a price decline in computer capital
on a' , the relative efficiency endowment of the marginal worker in the routine occupation. Combining
(3), (5) and (6), we find
,_, dlna' _ 1
d\nP ~J'
A fall in the price of computer capital decreases labor supply to the routine occupation and raises labor
supply to the non-routine occupation.
Since we derived above that a decline in the price of computer capital raises the relative intensity
of routine task input (i.e., d\n9/d\nP <0), (7) further implies that
dlnC -^^rifg{x)dx 9,„^-(8) < — <0.
d\nP dlna dlnP
Although labor supply to the routine occupation declines, there is a more than offsetting increase in the
demand for routine tasks in the form of computer capital. Thus, the relative intensity of routine task
Formally, write the probability density function of relative efficiency endowments as f((X) , with /(O) = and
/(a)>0 for a 6(0, °o).
10
input rises even as the relative labor supply of routine task input falls.
The implications for observed wages are ambiguous, however, without further assumptions.
Because an increase in non-routine relative wages may reduce the average productivity (in efficiency
units) of workers entering the non-routine occupation, quality change could reduce observed wages
even as the per-unit price of non-routine tasks rises.
To summarize our simple conceptual framework, we find that a decline in the price of computer
capital lowers the wages of workers carrying out routine tasks and causes employment in these tasks to
contract. Although the demand for routine task input increases as the price of computer capital falls,
this demand is satisfied by substitution of computer capital for human labor. Because greater relative
intensity of routine task input raises the marginal productivity of non-routine tasks, the wage per
efficiency unit of non-routine labor input rises.
Many of the details of our model were chosen for simplicity and are not essential to the basic
results. What is critical is our assumption that computer capital is more substitutable for routine than
non-routine skills, an assumption that we believe is justified by the present state of computer
technology. One dimension of the model we have not explored here is how consumer tastes interact
with price declines and accompanying income gains to shape final demand. Ifwe consider the model
above to characterize production in a single industry and assume that industries have heterogeneous
production technologies, it is plausible, depending on elasticities, that changes in final demand could
amplify or offset changes in industry level demand for skills. For this reason, we focus our empirical
exploration below on the composition of demand at the industry level.'^
3. Empirical Implementation
For example, if there is a strictly positive correlation between workers' ability at carrying out routine and non-
routine tasks, a decline in the price of computer capital reduces average ability (in efficiency units) m both
occupations. Given the decline in Wj^ JW^ , observed wages in the routine occupation unambiguously fall. But wages
in the non-routine occupation may not rise.
Mobius (2000) and Thesmar and Thoenig (2000) provide insightful formal treatments of the impact of technological
change on tastes, market structure, and the implications for the organization of production.
11
The approach of this paper is to conceptuahze jobs in terms of their component tasks rather than
the educational attainments ofjobholders. To implement this approach, we require measures of tasks
performed in particular jobs and their changes over time. We draw on information from the Fourth
(1977) Edition and Revised Fourth (1991) edition of the U.S. Department of Labor's Dictionary of
Occupational Titles. Many of the details of our data construction are provided in the Data Appendix.
Here we discuss the features most salient to our analysis.
The U.S. Department of Labor released the first edition of the DOT in 1939 to "furnish public
employment offices... with information and techniques [to] facilitate proper classification and
placement of work seekers."^'' Although the DOT was updated four times in the ensuing five decades
(1949, 1965, 1977 and 1991), its structure has been little altered. Based upon first-hand observations of
workplaces, DOT examiners using guidelines supplied by the Handbook For Analyzing Jobs rate
occupations along 44 objective and subjective dimensions including training times, physical demands,
and required worker aptitudes, temperaments, and interests. While the Dictionary of Occupational
Titles categorizes more than 1 2 thousand highly detailed occupations, the DOT data we employ here
are based on an aggregation of these detailed occupations into three-digit Census Occupation Codes
(COC) ofwhich there are approximately 450.^'
Using these COC-DOT aggregations, we append DOT occupation characteristics to the Census
IPUMS one percent extracts for 1960, 1970, 1980 and 1990, and to CPS Merged Outgoing Rotation
Group (MORG) files for 1980, 1990 and 1998. We use all observations on non-mstitutionalized,
employed workers, ages 1 8 - 64. For our industry analysis, these individual worker observations are
aggregated to the level of 140 consistent Census industries spanning all sectors of the economy to
provide indicators of average task requirements by industry for 1960, 1970, 1980, 1990 and 1998. All
individual and industry level analyses are performed using as weights fiill-time equivalent hours of
^° U.S. Department of Labor (1939:xi) as quoted in Miller et al (1980).2
!
The actual number varies by Census year.
12
labor supply, which is the product of the individual Census or CPS sampling weight times hours of
work in the sample reference week and, for Census samples, weeks ofwork in the previous year.^^
In measuring changes in task requirements, we exploit two sources of variation. The first consists
of changes over time in the occupational distribution of employment economy-wide, within industries,
and within-education groups within industries, holding task content within occupations at its DOT
1977 level. We refer to this source of variation as the 'extensive' (i.e., across occupations) margin,
which we are able to measure consistently over the period 1960 to 1998.
Variation along the extensive margin does not, however, account for changes in task content within
occupations such as is described in Levy and Mumane (1996), and is accordingly likely to provide an
incomplete picture of changing job task requirements. Hence, we exploit changes between 1977 and
1991 in skill content measures within occupations - the 'intensive' margin - using matched
occupations from the Revised Fourth Edition of the Dictionary of Occupational Titles. This approach
also has limitations. In the Revised Fourth Edition of the DOT, only a subset of occupations was
reevaluated by DOT examiners, and moreover the year of reevaluation varied among occupations.^^
Measured changes along the intensive margin are therefore likely to provide a conservative picture of
the total change in occupational task content.
Although the DOT provides unique, observational measures of occupational task requirements, it
has a number of well-known limitations documented by Miller et al (1980). These include limited
sampling of occupations (particularly in the service sector), imprecise definitions of measured
constructs, and omission of important job skills. One result of these problems is that DOT measures of
the skills required in particular occupations are likely to be imprecisely estimated, particularly for
Because the CPS labor force sub-sample only includes those employed during the survey reference week, it is
intrinsically weighted by weeks of labor force participation.
^^ The weighted fraction of employment reevaluated between 1978 and 1990 in our data is 73 percent, with 32 percent
reevaluated between 1978 and 1984 and 41 percent reevaluated between 1985 and 1990. Occupations were chosen for
reevaluation by DOT examiners partly on the expectation that their content had changed since the previous evaluation.
Hence, the subset that was reevaluated may have changed more than the subset that was not.
13
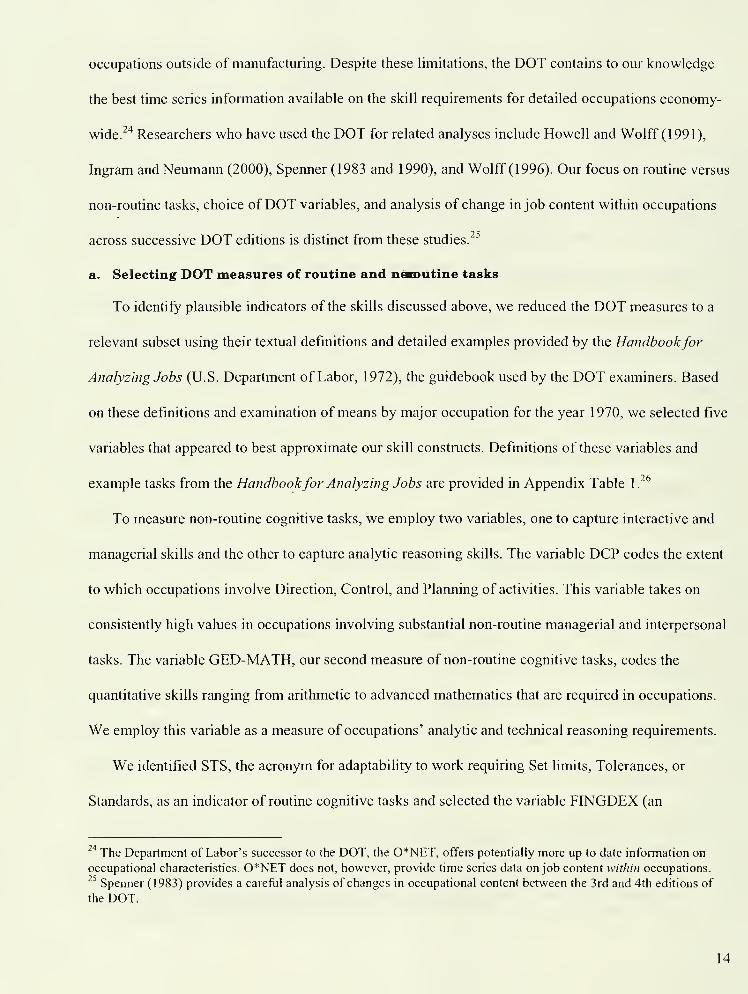
occupations outside of manufacturing. Despite these limitations, the DOT contains to our knowledge
the best time series information available on the skill requirements for detailed occupations economy-
wide.^"* Researchers who have used the DOT for related analyses include Howell and Wolff (1991),
Ingram and Neumann (2000), Spenner (1983 and 1990), and Wolff (1996). Our focus on routine versus
non-routine tasks, choice ofDOT variables, and analysis of change in job content within occupations
across successive DOT editions is distinct from these studies.^^
a. Selecting DOT measures of routine and nen>utine tasks
To identify plausible indicators of the skills discussed above, we reduced the DOT measures to a
relevant subset using their textual definitions and detailed examples provided by the Handbookfor
Analyzing Jobs (U.S. Department of Labor, 1972), the guidebook used by the DOT examiners. Based
on these definitions and examination ofmeans by major occupation for the year 1970, we selected five
variables that appeared to best approximate our skill constructs. Definitions of these variables and
example tasks from the Handbookfor Analyzing Jobs are provided in Appendix Table 1.^^
To measure non-routine cognitive tasks, we employ two variables, one to capture interactive and
managerial skills and the other to capture analytic reasoning skills. The variable DCP codes the extent
to which occupations involve Direction, Control, and Planning of activities. This variable takes on
consistently high values in occupations involving substantial non-routine managerial and interpersonal
tasks. The variable GED-MATH, our second measure of non-routine cognitive tasks, codes the
quantitative skills ranging from arithmetic to advanced mathematics that are required in occupations.
We employ this variable as a measure of occupations' analytic and technical reasoning requirements.
We identified STS, the acronym for adaptability to work requiring Set limits. Tolerances, or
Standards, as an indicator of routine cognitive tasks and selected the variable FINGDEX (an
^'' The Department of Labor's successor to the DOT, the 0*NET, offers potentially more up to date information on
occupational characteristics. 0*NET does not, however, provide time series data on job content within occupations.^' Spenner (1983) provides a careful analysis of changes in occupational content between the 3rd and 4th editions of
the DOT.
14
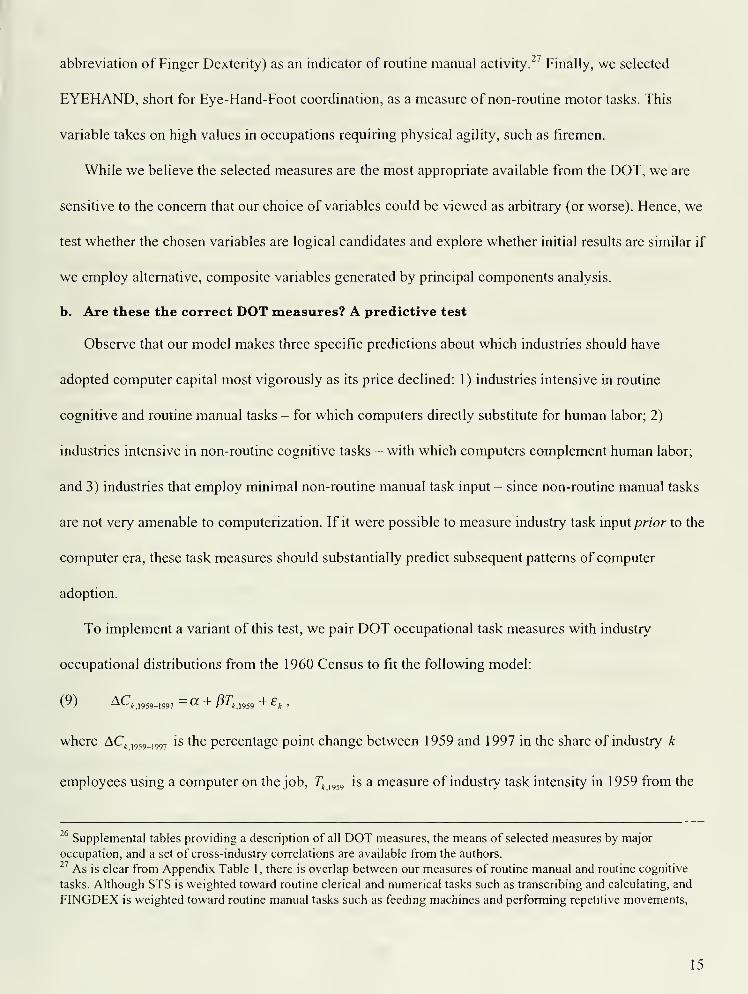
abbreviation of Finger Dexterity) as an indicator of routine manual activity.^^ Finally, we selected
EYEHAND, short for Eye-Hand-Foot coordination, as a measure of non-routine motor tasks. This
variable takes on high values in occupations requiring physical agility, such as firemen.
While we believe the selected measures are the most appropriate available from the DOT, we are
sensitive to the concern that our choice of variables could be viewed as arbitrary (or worse). Hence, we
test whether the chosen variables are logical candidates and explore whether initial results are similar if
we employ alternative, composite variables generated by principal components analysis.
b. Are these the correct DOT measures? A predictive test
Observe that our model makes three specific predictions about which industries should have
adopted computer capital most vigorously as its price declined: 1) industries intensive in routine
cognitive and routine manual tasks - for which computers directly substitute for human labor; 2)
industries intensive in non-routine cognitive tasks - with which computers complement human labor;
and 3) industries that employ minimal non-routine manual task input - since non-routine manual tasks
are not very amenable to computerization. If it were possible to measure industry task input pr/or to the
computer era, these task measures should substantially predict subsequent patterns of computer
adoption.
To implement a variant of this test, we pair DOT occupational task measures with industry
occupational distributions from the 1960 Census to fit the following model:
\y) ACj |,j,_|g,7— CC + p.!
i 1959 + £j ,
where AQi959_,997
is the percentage point change between 1959 and 1997 in the share of industry k
employees using a computer on the job, 7^ ,,59 is a measure of industry task intensity in 1959 from the
Supplemental tables providing a descnption of all DOT measures, the means of selected measures by major
occupation, and a set of cross-industry correlations are available from the authors.
As is clear from Appendix Table 1, there is overlap between our measures of routine manual and routine cognitive
tasks. Although STS is weighted toward routine clerical and numerical tasks such as transcnbing and calculating, and
FINGDEX is weighted toward routine manual tasks such as feeding machines and performing repetitive movements.
15
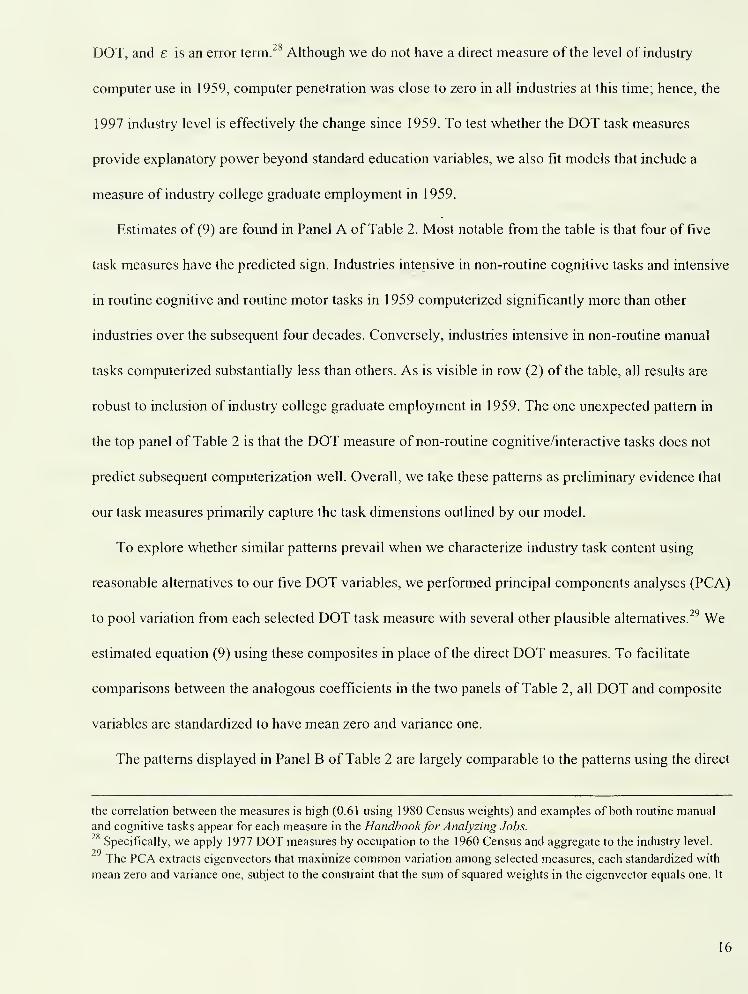
DOT, and e is an error term.^^ Although we do not have a direct measure of the level of industry
computer use in 1959, computer penetration was close to zero in all industries at this time; hence, the
1997 industry level is effectively the change since 1959. To test whether the DOT task measures
provide explanatory power beyond standard education variables, we also fit models that include a
measure of industry college graduate employment in 1959.
Estimates of (9) are found in Panel A of Table 2. Most notable from the table is that four of five
task measures have the predicted sign. Industries intensive in non-routine cognitive tasks and intensive
in routine cognitive and routine motor tasks in 1959 computerized significantly more than other
industries over the subsequent four decades. Conversely, industries intensive in non-routine manual
tasks computerized substantially less than others. As is visible in row (2) of the table, all results are
robust to inclusion of industry college graduate employment in 1959. The one unexpected pattern in
the top panel of Table 2 is that the DOT measure of non-routine cognitive/interactive tasks does not
predict subsequent computerization well. Overall, we take these patterns as preliminary evidence that
our task measures primarily capture the task dimensions outlined by our model.
To explore whether similar patterns prevail when we characterize industry task content using
reasonable alternatives to our five DOT variables, we performed principal components analyses (PCA)
to pool variation from each selected DOT task measure with several other plausible alternatives.^^ We
estimated equation (9) using these composites in place of the direct DOT measures. To facilitate
comparisons between the analogous coefficients in the two panels of Table 2, all DOT and composite
variables are standardized to have mean zero and variance one.
The patterns displayed in Panel B of Table 2 are largely comparable to the patterns using the direct
the correlation between the measures is high (0.61 using 1980 Census weights) and examples of both routine manual
and cognitive tasks appear for each measure in the Handbookfor Analyzing Jobs.^* Specifically, we apply 1977 DOT measures by occupation to the 1960 Census and aggregate to the industry level.
29The PCA extracts eigenvectors that maximize common variation among selected measures, each standardized with
mean zero and variance one, subject to the constraint that the sum of squared weights in the eigenvector equals one. It
16
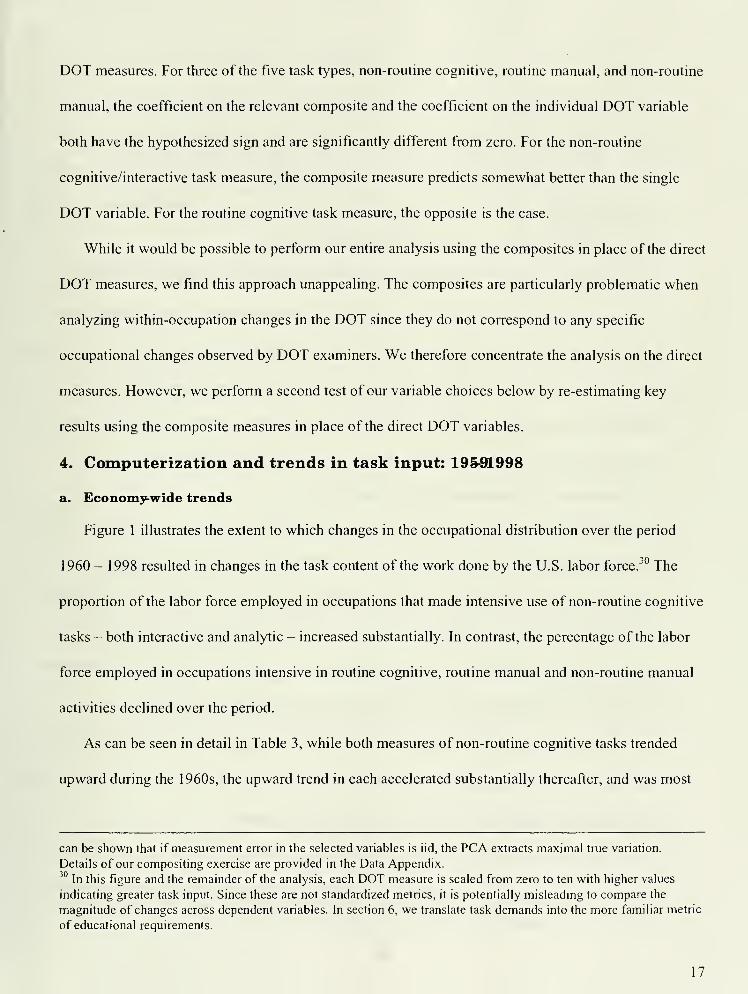
DOT measures. For three of the five task types, non-routine cognitive, routine manual, and non-routine
manual, the coefficient on the relevant composite and the coefficient on the individual DOT variable
both have the hypothesized sign and are significantly different from zero. For the non-routine
cognitive/interactive task measure, the composite measure predicts somewhat better than the single
DOT variable. For the routine cognitive task measure, the opposite is the case.
While it would be possible to perform our entire analysis using the composites in place of the direct
DOT measures, we find this approach unappealing. The composites are particularly problematic when
analyzing within-occupation changes in the DOT since they do not correspond to any specific
occupational changes observed by DOT examiners. We therefore concentrate the analysis on the direct
measures. However, we perform a second test of our variable choices below by re-estimating key
results using the composite measures in place of the direct DOT variables.
4. Computerization and trends in task input: 19&91998
a. £conoiiij<-wide trends
Figure 1 illustrates the extent to which changes in the occupational distribution over the period
1960 - 1998 resulted in changes in the task content of the work done by the U.S. labor force. ^'^ The
proportion of the labor force employed in occupations that made intensive use of non-routine cognitive
tasks - both interactive and analytic - increased substantially. In contrast, the percentage of the labor
force employed in occupations intensive in routine cognitive, routine manual and non-routine manual
activities declined over the period.
As can be seen in detail in Table 3, while both measures of non-routine cognitive tasks trended
upward during the 1 960s, the upward trend in each accelerated substantially thereafter, and was most
can be shown that if measurement error in the selected variables is iid, the PCA extracts maximal true vanation.
Details of our compositing exercise are provided in the Data Appendix.^° In this figure and the remainder of the analysis, each DOT measure is scaled from zero to ten with higher values
indicating greater task input. Since these are not standardized metrics, it is potentially misleading to compare the
magnitude of changes across dependent variables. In section 6, we translate task demands into the more familiar metric
of educational requirements.
17
rapid during the 1980s and 1990s. Equally notably, routine cognitive and routine manual tasks were
both increasing during the 1960s, prior to commencing a decline in the 1970s, which became more
rapid in each subsequent decade. The steady trend against non-routine manual tasks, however, pre-
dates the computer era. These aggregate patterns are also apparent for each gender (Panel B of Table
3), although given the large increases in women's educational attaiiunent and labor force participation
in recent decades, the patterns are more pronounced for women. ^'
For reference, Appendix Table 2 tabulates the DOT task measures by major educational group.
Notably, while tliree of five skill variables are monotonic in educational attainment, the two measures
of routine tasks - cognitive and manual - show a U-shaped relationship to education; in particular, high
school graduates perform substantially more of both types of routine task than either high school
dropouts or college graduates. This non-monotonicity suggests that the DOT measures may provide
information about job task requirements distinct from standard educational categories.
b. Task upgrading: A withi-dndustry phenomenon?
Changes in the task content of the work done by the U.S. labor force could stem from substitution
of computer capital for routine labor inputs within detailed industries, as our model suggests.
Alternatively, shifts in product demand favoring sectors intensive in non-routine activities could give
rise to economy-wide increases in the utilization of non-routine tasks. Since the focus of our
conceptual model and empirical analysis is on changes in task demands within industries, we explore
the extent to which changes in measured job content stem from within-industry shifts.
A standard decomposition of the change in the use of task j in aggregate employment between
years / and t ( AT^ = Tj^ -T, ) into a term reflecting the reallocation of employment across sectors and
a term reflecting changes in task j input within industries is given by
Notably, in the 1960s, women were more (less) concentrated in routine manual and cognitive tasks (non-routine
cognitive analytic and interactive tasks) than were men. By 1998, the gender distributions of tasks had substantially
converged and women performed fewer routine cognitive tasks than did males.
18
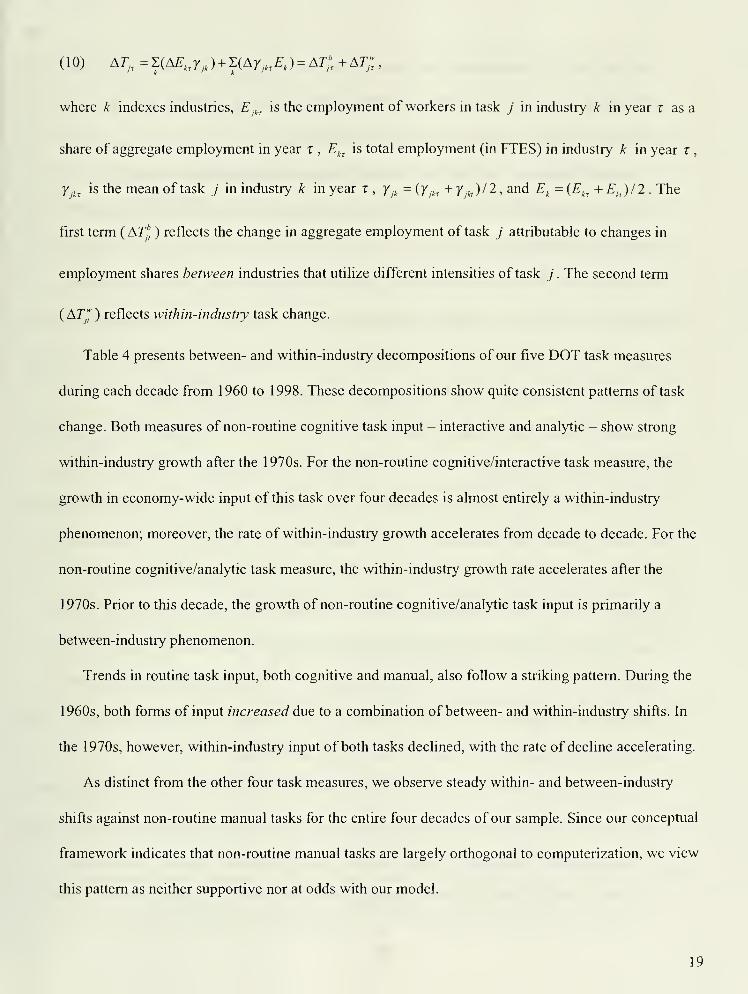
(10) A7;,=z(A^^7^,)+i(Ar^,„£,) = A7;':+Ar;,
where k indexes industries, E^^^ is the employment of workers in task j in industry k in year t as a
share of aggregate employment in year r , E^^ is total employment (in FTES) in industry k in year r
,
7^,^ is the mean of task j in industry k in year t, 7^.^.
= {jji^ +y^^)I1, and E^ ={E^^ + E^)/2 . The
first term ( A7^* ) reflects the change in aggregate employment of task J attributable to changes in
employment shares between industries that utilize different intensities of task j . The second term
( AJJ ) reflects within-industry task change.
Table 4 presents between- and within-industry decompositions of our five DOT task measures
during each decade from 1960 to 1998. These decompositions show quite consistent patterns of task
change. Both measures of non-routine cognitive task input - interactive and analytic - show strong
within-industry growth after the 1970s. For the non-routine cognitive/interactive task measure, the
growth in economy-wide input of this task over four decades is almost entirely a within-industry
phenomenon; moreover, the rate of within-industry growth accelerates from decade to decade. For the
non-routine cognitive/analytic task measure, the within-industry growth rate accelerates after the
1970s. Prior to this decade, the growth of non-routine cognitive/analytic task input is primarily a
between-industry phenomenon.
Trends in routine task input, both cognitive and manual, also follow a striking pattern. During the
1960s, both forms of input increased due to a combination of between- and within-industry shifts. In
the 1970s, however, within-industry input of both tasks declined, with the rate of decline accelerating.
As distinct from the other four task measures, we observe steady within- and between-industry
shifts against non-routine manual tasks for the entire four decades of our sample. Since our conceptual
framework indicates that non-routine manual tasks are largely orthogonal to computerization, we view
this pattern as neither supportive nor at odds with our model.
19
In net, these data indicate that within-industry shifts dominate for the most part the task trends that
we seek to analyze, particularly from the 1970s forward. We now turn to an analysis of the role that
computerization has played in these within-industry task shifts.
c. The time pattern of industry task shifts: Do they predate the computer era?
We begin the analysis of the relationship between computerization and industry task input by
estimating the bivariate regression
(11) Ar,,=a + /?AC,+£^,,,^
where Ar^^,, = T.^^ -7^, is the change in industry input of task j between years t and t and AQ is the
change between 1984 and 1997 in the percentage of industry workers using a computer at their jobs as
estimated from the October Current Population Survey supplements of these years.
In estimating (1 1), we choose the period 1960 to 1998 because it encompasses the recent computer
era and, as importantly, the prior decade. Although the widespread diffusion of desktop computers
during the 1980s and 1990s represents a highly visible technology 'shock' - with the share of workers
using a computer on the job rising from 25 to 5 1 percent between 1 984 and 1 997 - it bears emphasis
that the era of rapid computer investment began in the 1970s (Autor, Katz and Krueger, 1998;
Bresnahan, 1999). Hence, to the degree that industry computer proxies 'predict' occupational task
change during the 1960s, this would suggest that observed trends in task content in computer intensive
sectors pre-date the computer era and hence are unlikely to be caused by computerization. Conversely,
if the relationship between industry computer intensity and task change is not detectable until the 1970s
or later, this is more likely to be consistent with a causal relationship.
Table 5 presents estimates of (1 1) for each of the four decades from I960 - 1998. Each dependent
variable measures ten times the annualized industry level change in the average value of one of the task
indicators. Figure 2 summarizes the time pattern of regression coefficients.
Industries that computerized relatively rapidly during the 1980s and 1990s increased the share of
20
jobs requiring non-routine cognitive/analytic task input during these decades more than did other
industries. However, this was not the case for prior decades. As illustrated in Figure 2, during the
1960s and 1970s, the industries that became the rapidly computerizing industries did not differentially
increase input of non-routine cognitive/analytic tasks.
The pattern is somewhat different for the change in cognitive/interactive tasks. Industries that
subsequently computerized intensively were already raising their input of cognitive/interactive tasks
relatively more rapidly than other industries in the 1960s and 1970s. However, the magnitude and
statistical significance of this relationship increased substantially in the 1980s and 1990s, consistent
with the acceleration in within-industry trends in Table 4. In fact, the estimated impact of
computerization on both measures of non-routine cognitive tasks accounts for eighty to one hundred
percent of the observed within-industry growth in input of these tasks over 1980 - 1998.^"
The relationships between computerization and routine cognitive and routine manual task input
present a mirror image of these patterns. During the 1960s, industries that subsequently underwent
rapid computerization did not significantly shift their routine cognitive or routine manual task input
relative to other industries. Beginning in the 1970s, these same sectors undertook rapid reductions in
routine cognitive and routine manual task input. As above, the impact of computerization accounts for
all of the observed within-industry reduction in routine task input between 1970 and 1990.
Consistent with our framework, there is no significant evidence that rapidly computerizing
industries decreased their use of non-routine manual tasks more rapidly than did other industries during
this period. During the 1 990s, however, rapidly computerizing industries decreased the non-routine
manual task intensity of work less rapidly than did other industries.^^
^" Specifically, the intercept of the bivariate regression of the change in industry non-routine cognitive/analytic task
input on computerization during the 1980s and 1990s is close to zero although the mean of the dependent vanable is
large and positive. In this sense, computerization accounts for the entirety of the observed phenomenon.
This result should be interpreted carefully. It is unlikely that computerization directly increases demand for non-
routine manual tasks; rather, the share of human labor devoted to non-routine manual tasks is likely to rise
21
To further probe the robustness of our variable choices from the DOT, we estimated comparable
models using the composite task measures developed from the pure DOT variables (Appendix Table
3). The time pattern of results for the composite estimates is for the most part comparable to that found
in Table 5. In all cases, the relationship between computerization and the composite task measure is not
statistically significant during the 1960s and becomes statistically and economically significant in
subsequent decades. The decade of the 1970s presents some inconsistencies, however, indicating that
our composites do not perform as well as the pure DOT measures.
d. Employing contemporaneous measures of computerization
The estimates above are consistent with the hypothesis that computerization during the 1980s and
1 990s induced or accelerated industry level task shifts that were not (as) evident in the pre-computer
era of the 1960s. To provide a broader test of the hypothesis that computerization accounts for these
task shifts, we employ a contemporaneous measure of per-worker industry computer investment from
the National Income and Product Accounts ('NIPA', U.S. Department of Commerce, 1993 and 1999).
To measure industry computerization, we calculate the log of real computer investment per full-time
equivalent employee (FTE) over the course of the decade.'''* Since we are interested in the impacts of
computerization as distinct from overall industry capital deepening, we also construct a measure of the
change in the log industry capital labor ratio.
We use these data to estimate stacked first-difference industry task shift models of the form
( 1 2) ^T.,^ = a + 5,„,3„ + <5,„_,o + ^90-98 + ^fh. + ^^l^,. + £,*-.
.
where CI is log industry investment in computer capital per FTE over the contemporaneous decade.
mechanically as routine tasks are displaced. For example, a constant number of workers doing non-routine manual
work such as cleaning and serving would account for a growing share of employment in computer-intensive sectors.
Note that we do not use the change in this measure since the level proxies the flow of new computer capital into an
industry over the decade. The NIPA data are also employed by Bemdt, Morrison and Rosenblum (1995) and Autor,
Katz, and Krueger (1998). We matched data from the Census, CPS, and DOT to NIPA data in 42 aggregated industries
covering all private industry sectors except private household services. Because the NIPA capital variables are
measured at a higher level of aggregation than our dependent variables, we estimate Huber-White robust standard
errors that account for clustering at the NIPA sectoral level. See the Data Appendix for details.
22
AK is the change in the log industry capital labor ratio (also measured in FTEs), the 5's are time
dummies equal to one in each of the post- 1960s decades corresponding to their subscripts, and a is a
common intercept. In this specification, the 5's measure the trend change in industry task input in the
1970s, 1980s, and 1990s relative to the base period of the 1960s. Hence, the key empirical question is
whether by conditioning on measures of industry computer investment, we can explain the trend
changes in task input measured by the 5's .
Note that in estimating this equation, it is not necessary to interpret the industry computer
investment measure, C/^j, , as 'exogenous' (which it surely is not). As vmderscored by our theoretical
model, the exogenous variable in our analysis is the economy-wide decline in the price of computer
capital. Accordingly, the variation we exploit in (12) stems from industries' equilibrium response to
this price decline as they shift the quantities and sources of task input from human to computer capital
according to the new price schedule.^
Table 6 displays estimates of (12). The NIPA measure of computer investment consistently
predicts relative declines in industry employment of both routine cognitive and manual tasks and
relative grovi^h in employment of non-routine cognitive tasks, both analytic and interactive. By
comparing the decadal intercepts (5' 5 ) in the first column of each panel to the observed decadal
changes found at the bottom of the table, one can calculate the fraction of the observed change in the
task measure explained by industry computer investment. Using the 1 960s as the baseline, these
comparisons indicate that computer investment can more than fully explain the trend increase in both
measures of non-routine cognitive task input since the 1960s, and accounts for over eighty percent of
the trend decline in routine cognitive and manual tasks. ^^ Hence, computerization has substantial power
in explaining the observed trend shifts in industry task input in each of the three decades following the
As demonstrated in Table 2, the ability of industries to respond to these price changes depends importantly upon the
mix of task inputs that they employ.
23
1960s.
A notable pattern in these results is that the estimated impact of capital deepening on changes in
industry skill demands is statistically significant in only one of five models, non-routine manual tasks.
Yet, the coefficient on computer investment is significant in all five models that contain the measure of
capital deepening. Consistent with findings of Autor, Katz, and Krueger (1998) and Bresnahan,
Brynjolfsson and Hitt (forthcoming), these results indicate that there appears to be something
distinctive about computer capital's relationship with industry task demands apart from the well-known
pattern of capital-skill complementarity (Griliches, 1969).
5. Computerization and contemporaneous task shifts at the industry,occupation and educational level, 19801998
It is possible to argue that the preceding results primarily provide an explanation for the widely
documented pattern that during recent decades computer intensive industries increased their college
graduate employment and decreased their high school graduate employment more than did other
industries.'^ Our contention, however, is that changes in the demand for workplace tasks are an
underlying cause - not merely a reflection - of relative demand shifts favoring educated labor. If so,
educational upgrading should be only one among several margins through which industries alter task
input. Underlying shifts in task demand should also yield pervasive changes in task content that are
visible within (as well as across) education and occupation groups.
To explore this implication, we examine changes in the task content of work within education and
occupation categories over the two most recent decades. As a baseline, we first analyze the
contemporaneous correlations between computerization and within-industry changes in task content
^^ For example, the calculation for routine cognitive tasks is: [((-0.019 - 0.089) + 0.040 + (-0.122 - 0.089) + 0.002 +
((-0.216 - 0.089) + 0.041)*.8]/([ (-0.019 - 0.089) + (-0.122 - 0.089) + (-0.216 - 0.089)*.8] = 0.87. Note that changes
over 1990-98 are down-weighted by 20 percent due to the shorter time interval.
" Cf, Autor, Katz and Krueger ( 1 998), Berman, Bound and Griliches (1994), Berman, Bound and Machin (1998), and
Machin and Van Reenen (1998). The logic would be that because workers at higher levels of education appear to hold
comparative advantage in non-routine relative to routine tasks (Appendix Table 2), industries undergoing rapid
24
between 1980 and 1998. Next, we examine whether within-industry task shifts are present even among
workers with the same educational attainments. Finally, we exploit direct field observations ft'om
successive revisions of the DOT to ask whether computerization yielded commensurate shifts in task
content within nominally identical occupations. In the concluding section of the paper, we collect these
strands to quantify the contribution of computerization-induced changes in the task content of work to
recent demand shifts favoring educated labor.
a. Extensive chmges within industries and within education groups: 198(1998
Panel A of Table 7 presents a series of estimates in which the dependent variable is the within-
industry change between 1980 and 1998 in each of the five DOT task measures. The explanatory
variable is the change in industry computer use between 1 984 and 1 997, which in this case is a
contemporaneous measure. These results underscore the story told by Tables 5 and 6. Industries that
rapidly computerized during the 1980s and 1990s undertook large relative increases in the share ofjobs
requiring high levels of non-routine cognitive/interactive and cognitive/analytic task input, and
decreased the share requiring routine cognitive and manual tasks.
These changes in industry task content have two components. One is educational upgrading. As has
been widely documented, computerizing industries have substituted towards college-educated workers
who, by our analysis, appear to hold a comparative advantage in non-routine cognitive tasks (cf.
Appendix Table 2). A second component of these task shifts (not previously explored), is task
upgrading within education groups. Industries undertaking computerization may shift the job tasks of
workers of comparable education towards non-routine and against routine tasks.
A unique virtue of our data is that it allows us to gauge the importance of both channels of task
change and estimate the contribution of computerization of each. To perform this decomposition, we
estimate a variant of equation (1 1) in which the dependent variable is the within-industry change in the
computerization may increase input of these tasks through educational upgradmg. Note that the growth of non-routine
manual tasks in computer intensive sectors would not have been predicted by this simple companson.
25
mean of each DOT measure among workers who have the same educational attainments.^^ Since we
pair the 1977 DOT task content measures to education-group-specific industry observations for 1980
and 1 998, observed changes in task input stem solely from shifts in occupational distributions within
education groups within industries. To conserve space, we present and discuss results for high school
graduates and summarize results for all education groups in Figure 3.
The weighted means of the task measures for high school graduates (Panel B of Table 7) indicate
that during 1980 to 1998, the task structvire of high school graduates employment shifted towards non-
routine cognitive/interactive tasks and away from routine cognitive and routine manual tasks. Estimates
of (1 1) for high school graduates reveal that these task shifts were significantly more pronounced in
industries undergoing rapid computerization. Comparison of the estimated intercepts for these models
relative to their weighted means reveals that observed high school graduate employment shifts against
occupations intensive in routine cognitive and manual tasks and towards occupations intensive in non-
routine cognitive tasks were essentially entirely driven by changing employment patterns within
rapidly computerizing sectors.
As is visible from Figure 3, industry-level computerization is associated with within-industry shifts
towards non-routine and against routine tasks within essentially all education groups. A decomposition
analogous to that in equation (10) (shown in Table 8) reveals the importance of within-education group
shifts to the overall pattern of task change. In all but the case of non-routine manual tasks, within
education group task upgrading explains a substantial share - 45 to 9 1 percent - of observed within-
industry task upgrading over these two decades. Hence, the impact of computerization is not confined
to widely observed educational upgrading; within-education group changes in task structure appear at
'* In particular, we replace AT^^ in (11) with Ar^^,,^ where / denotes education groups within industries.
Estimates comparable to Table 7 Panel B for other education groups are found in Appendix Table 4. The pattern of
results for workers with some college is virtually identical to that of high school graduates. The relationships are
almost all of the expected sign for college graduates and high school dropouts but are primanly not statistically
significant. A likely explanation for the weak college graduate results is 'topping out.' Because in 1980, college
26
least equally important.
Notably, in a recent analysis of the inter-industry wage structure, Bartel and Sicherman (1999)
found that technology-intensive industries select workers of greater unobservable skill conditional on
education. Our results suggest a likely causal channel for this finding: within nominally similar
education categories, these industries have differentially shifted the task content of employment against
routine, repetitive tasks and towards tasks demanding cognitive flexibility.
b. Computerization and changes in occupational task content: 19-7T991
The task shifts documented above are measured exclusively by shifts in occupational composition
(the extensive margin). Our framework further implies that pervasive shifts in task demands should
induce parallel changes along the intensive margin. In this section, we exploit direct job evaluations
from successive editions of the DOT to explore whether computerization has yielded commensurate
changes in task content within nominally identical occupations. Specifically, we estimate the equation
(13) AT^,,=a + l3AC„+E„,^,
where AT^^^ is the change in observed occupational task content between the 1977 and 1991 in 3-digit
COC occupation m , and AC„ is the change in occupational computer penetration measured by the
CPS.'''
To make this test as clean as possible, our DOT 1977 - 1991 comparison data set is constructed
using only the subset of occupations appearing in the 1977 DOT and represented by the 1973 CPS file
(National Academy of Sciences, 1981) that provides our DOT-COC crosswalk. In addition, although
the distribution of employment in DOT occupations (of which there are approximately 12,000) has
doubtless shifted within COC occupations in recent decades, we hold this distribution fixed at the 1 973
level to again exclude extraneous variation. Accordingly, the variation exploited in estimates of
graduates were concentrated in occupations with high values of non-routine cognitive tasks and low levels of routine
cognitive and routine manual tasks, this left little room for the task measures to attain fiirther extremes."^ The Fourth and Fourth Revised editions of the DOT were published in 1977 and 1991 respectively. For consistency
with the analysis above, we use the CPS computerization and education measures for 1984 to 1997.
27
equation (13) stems entirely from DOT examiners' reevaluations of the task content of individual
occupations between 1977 and 1991.
For each task measure, we present the results from two specifications in Table 9. The first includes
only the occupational computerization measure. To explore whether intra-occupational task change is
implicitly captured by shifts in the educational distribution of employees in an occupation, the second
specification adds the contemporaneous change in the percentage of workers in the occupation who are
college graduates."
The most visible change in occupational task content between 1977 and 1991 was a pronounced
decrease in routine cognitive tasks. A regression of the routine cognitive task measure on occupational
computerization reveals that input of this task declined by substantially more in rapidly computerizing
occupations. Comparison of the intercept of this regression to the weighted mean of the dependent
variable indicates that the implied impact of computerization is more than sufficient to explain the
observed mean shift against routine cognitive tasks over 1977 to 1991 . A second notable pattern is the
positive relationship between occupational computerization and the input of non-routine
cognitive/analytic tasks. Even though the average level of non-routine cognitive/analytic tasks declined
slightly within occupations, the level increased significantly in rapidly computerizing occupations.
Finally, the input of cognitive/interactive tasks increased within occupations (Column 2), and this shift
was significantly greater in more rapidly computerizing industries.
We find little relationship between computerization and changes in the routine manual task content
of occupations, however. Interestingly, computerization predicts significant increases in the non-
routine manual task content of occupations, a pattern also noted at the industry level.
Comparison across the two specifications in each panel demonstrates that the relationship between
computerization and within-occupation task change is quite insensitive to inclusion of the college
graduate employment share measure. Apparently, observed educational upgrading within occupations
does not provide an adequate summary measure of shifts in occupational task content.
28
6. Computers, task structure, and the demand for college educated labor
Are the pervasive task shifts documented above economically significant? To answer this question,
we draw together the estimated impacts of computerization on task change within industries, within
education groups and within occupations to calculate their net contribution to the deinand for skill as
conventionally measured by educational attainment.
Since units of task input do not have a natural scale, we translate task inputs into educational
requirements using a "fixed coefficients" model of occupational education requirements in 1970 as a
fimction of occupational task inputs measured by the 1970 DOT. Specifically, we estimate:
(14) 7v;=a + r„,A + £,„
where N"' is the employment share (in FTEs) of college graduates in occupation m , T^ isa column
vector containing the DOT means of our routine and non-routine skill measures, and A is a
conformable row vector of coefficients. A is therefore an estimate of college versus non-college
demand as a function of occupational tasks.
We then translate our estimates of changes in job tasks induced by computerization (Tables 6 and
7) into estimates of implied changes in college versus non-college employment along the extensive
margin by calculating
(15) AN^^=^r,MJ,
where AT^^ is a vector of predicted change in industry k's input of each of our five task measures due
to computerization between times t and t from estimates of equation (11) and (12), y^^ is industry
k's average share of employment between t and z. AN^^ is therefore the implied impact of computer-
induced task shifts on the college graduate share of total employment. Similarly, we incorporate
predicted changes on the intensive margin of task input over 1980 to 1998 by adding to AJ^^ the vector
Ar,^ , which is the change from equation (13) in within occupation tasks attributable to
29
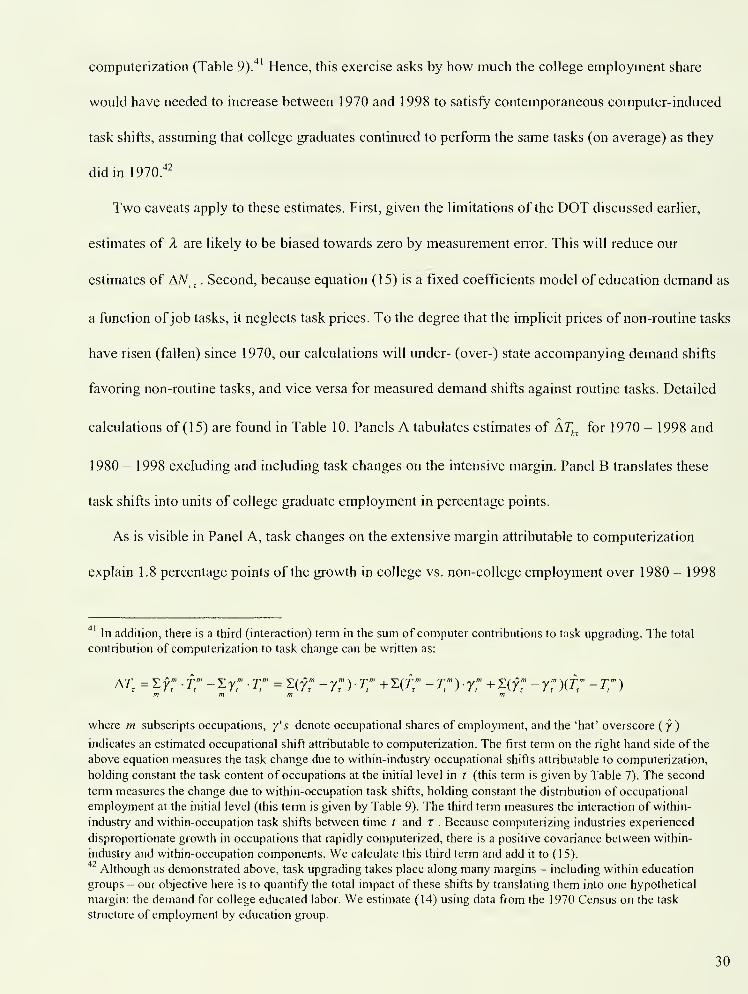
computerization (Table 9)."" Hence, this exercise asks by how much the college employment share
would have needed to increase between 1970 and 1998 to satisfy contemporaneous computer-induced
task shifts, assuming that college graduates continued to perform the same tasks (on average) as they
did in 1970.^^
Two caveats apply to these estimates. First, given the limitations of the DOT discussed earlier,
estimates of X are likely to be biased towards zero by measurement error. This will reduce our
estimates of AA^^^ . Second, because equation (15) is a fixed coefficients model of education demand as
a function ofjob tasks, it neglects task prices. To the degree that the implicit prices of non-routine tasks
have risen (fallen) since 1 970, our calculations will under- (over-) state accompanying demand shifts
favoring non-routine tasks, and vice versa for measured demand shifts against routine tasks. Detailed
calculations of (15) are found in Table 10. Panels A tabulates estimates of AT^^ for 1970 - 1998 and
1980 - 1998 excluding and including task changes on the intensive margin. Panel B translates these
task shifts into units of college graduate employment in percentage points.
As is visible in Panel A, task changes on the extensive margin attributable to computerization
explain 1 .8 percentage points of the growth in college vs. non-college employment over 1980 - 1998
"' In addition, there is a third (interaction) term in the sum of computer contributions to task upgradmg. The total
contribution of computerization to task change can be written as:
Aj, =!/; -f: -i:y:-Tr =i(r; -rnr +i(r;' -r)-/: +2:(fr -r:){f:-Tr)m m m m
where m subscripts occupations, y' s denote occupational shares of employment, and the 'hat' overscore (y)
indicates an estimated occupational shift attributable to computerization. The first term on the right hand side of the
above equation measures the task change due to within-industry occupational shifts attributable to computerization,
holding constant the task content of occupations at the initial level in t (this term is given by Table 7). The second
term measures the change due to within-occupation task shifts, holding constant the distribution of occupational
employment at the initial level (this term is given by Table 9). The third term measures the interaction of within-
industry and within-occupation task shifts between time t and T . Because computerizing industries experienced
disproportionate growth in occupations that rapidly computerized, there is a positive covariance between within-
industry and within-occupation components. We calculate this third term and add it to (15),
Although as demonstrated above, task upgrading takes place along many margins - including within education
groups - our objective here is to quantify the total impact of these shifts by translating them into one hypothetical
margin: the demand for college educated labor. We estimate (14) using data from the 1970 Census on the task
structure of employment by education group.
30
and explain 2.0 percentage points of this growth over 1970 - 1998. Slightly more than half of this
contribution is accounted for by shifts favoring non-routine cognitive tasks, with the remainder
explained by shifts against routine cognitive and manual tasks."*^
Adding the effect of changes along the intensive margin, AT^^ , more than doubles the magnitude
of this impact. Computerization is estimated to have increased the college graduate employment share
by 5.0 percentage points over 1980 - 1998 and 5.3 percentage points over 1970 - 1998. Moreover,
because the intensive margin change is only measured during 1977 to 1991, it is likely that a longer
time series would show that these shifts have even greater explanatory power.
For reference, the estimate of 5.0 percentage points can be compared to the actual change in
college graduate employment between 1980 and 1998, which is 6.83 percentage points. However, this
is not the most appropriate comparison since increases in college employment are likely to be driven in
part by secular trends in the supply of college graduates as well as shifts in demand per se. To make a
more formal comparison, we employ a simple constant elasticity of substitution framework to translate
induced employment shifts into log relative demand shifts for college equivalent labor. In this
framework, we assume that aggregate output, Q^ , is produced using two factors, college (c) and high
school (h) equivalents in the production ftanction
(16) Q,=k(^,NJ''+{l-a,)ib,N,xf,
where N^, and A^^, are the quantities of employed college equivalents and high school equivalents in
period t , o, and b, represent skilled and unskilled labor-augmenting technological change, a, is a
time-varying technology parameter that can be interpreted as indexing the share ofwork activities
allocated to skilled labor, and p is time invariant. The aggregate elasticity of substitution between
"^ The increased demand for non-routme manual tasks makes a small offsetting contribution.
31
college and high school equivalents is given by cr = 1/(1 - p)."^
Under the assumption that the economy operates on its labor demand curve so that college and high
school equivalents are paid their marginal products, we can use (16) to solve for the ratio of marginal
products of the two labor types, yielding the relationship between relative wages (vv„/w^,) and relative
supplies (w,/w„)_
(17) ln(M.„ /w„ ) = 1/a [D, - HN^., /N„ )]
.
Rearranging (17) and taking first differences, the change in the relative demand for college equivalent
labor between times t and t in log quantity units can be written as'^^
(18) AD, = A -D, =Aln[(vv„A^„/w,,Af,j]+(a-l)ln(w„/vv,J.
Change in the relative demand for college equivalents can be written as the sum of the change in the
log relative wage bill and a term that depends positively (negatively) on the change in the log college
wage premium when cr > 1 ( cr < 1 ).
In implementing this framework, we follow Autor, Katz and Krueger (1998) in employing an
elasticity of substitution between college and non-college labor of cr = 1 .4 , a figure that receives broad
empirical support from the literature.''^ Using our Census and CPS samples, we calculate that the
estimated log relative demand for college graduate employment grew by approximately 10 log points
annually over 1970 - 1998 and 7 log pomts over 1980 - 1998 (Panel C of Table 10).
Using these demand shift estimates as a benchmark, we can calculate the share of the estimated
demand shift attributable to computer-induced task shifts. To make this comparison within our "fixed
coefficients" framework, we estimate a version of (18) in which we allow p -4 -co , which implies that
** Autor, Katz and Krueger ( 1 998), Johnson (1997), and Katz and Murphy (1992) implement a similar model. Our
implementation is closest to Autor, Katz and Krueger's, and we update their Table 2 to 1998 to perform the benchmark
demand shift estimates against which we compare our fixed coefficient calculations. Because (16) exhibits constant
returns to scale, we conserve notation by using N^^ and A^^, to refer to employment quantities and employment shares
interchangeably.
'' D,=a\nia,/[\~a,] + ia-\)\nia,/b,).
32
a -> , the relative demand for college equivalents is Leontif (i.e., fixed coefficients). In this special
case, (18) reduces to
(19) AD^=A\niN^jN,,) = \n{l + [AN^JN^,]-ln{\ + [AN,JN,/\.
Here, changes in log relative demand are written entirely in terms of shifts in relative employment.''^
To gauge the contribution of computerization to demand shifts, we replace AiV^^ in (19) with AA^_.^ the
estimated computer-induced change in college graduate employment from equation (15).
For the period 1980 - 1998, task shifts induced by computerization are estimated to have increased
log relative college demand by 2.8 log points annually (Table 10, Panel C). Comparing this number to
the estimated economy-wide shift of 6.7 log points over this period, we find that changes in task
content explain approximately 40 percent of the observed shift. Notably, more than half of this impact
is accounted for by (normally unobservable) shifts along the intensive margin. The analogous
calculation for the three-decade interval finds that computer-induced task shifts explain approximately
30 percent of the demand shift favoring college graduates over 1970 - 1998.''^
In interpreting these estimates, we note that relative demand for college-educated labor in the U.S.
increased substantially from the 1940s through the 1960s, decades prior to computerization (cf
,
Acemoglu, forthcoming; Autor, Katz and Krueger, 1998; Johnson, 1997; and Mishel, Bernstein and
Schmitt, 1997). Hence, a claim that computerization has increased the relative demand for educated
labor requires evidence that computerization has accelerated demand growth beyond trends prevailing
during the 1 960s and earlier. It is therefore noteworthy that the estimates in Table 1 indicate that
computerization contributed to more rapid growth in college employment in the 1970s relative to the
"*Cf., Hamermesh ( 1 993), Heckman, Lochner and Taber ( 1 998), and Katz and Murphy ( 1 992).
* Note that AA'^^^ = —AA'^^^. . For consistency with the fixed coefficients model, we use o = for this calculation. If we
used a= 1.4 instead, our estimate of the contribution of task shifts to observed college demand shifts would be
significantly larger, as follows from the substantial increase in relative wages of college graduates over 1980 - 1998.
"* As with the NIPA estimates in Table 6, we perform all calculations for 1970 - 1998 relative to the 1960s.
Specifically, we subtract off the 1960s trend task change from the task estimates for the 1970s, 1980s, and 1990s on
the assumption that these trends predated computerization and should not be counted as potential computer impacts.
33
1960s, and that this impact was greater still during the 1980s and 1990s. Hence, our evidence suggests
that recent technological change has had an accelerating impact on the task structure of employment
smce the 1970s. Cumulatively, this impact appears to have contributed substantially to demand shifts
favoring college-educated labor.
7. Conclusion
A number of influential studies report a positive correlation between technology investments and
educational upgrading. Our study complements and advances this line of research. By conceptualizing
job skill demands in terms ofjob tasks rather than the educational credentials of workers performing
those tasks, our framework provides an account ofhow computerization and associated organizational
changes alters the composition ofjob tasks. This framework rationalizes the observed correlation
between computerization and increased use of educated labor and predicts pervasive shifts in
workplace task structure that are not observable in conventional data sources. By exploiting consistent,
representative, time series observations on the task structure ofjobs from the Dictionary of
Occupational Titles, we both affirm these predictions and find that they contributed substantially to
demand shifts favoring educated labor over the past three decades. While the limitations of the DOT
also place some constraints on the precision of our analysis, we believe it advances understanding of
the evolving skill content of work.
34
References
Acemoglu, Daron. 1998. "Why Do New Technologies Complement Skills? Directed Technical Change
and Wage Inequality." Quarterly Journal ofEconomics. 113 (4), November, 1055 - 89.
Acemoglu, Daron. 1999. "Changes in Unemployment and Wage Inequality: An Ahemative Theory and
Some Evidence." American Economic Review, 89(5), December, 1259 - 78.
Acemoglu, Daron. forthcoming. "Technical Change, Inequality, and the Labor Market.", Journal ofEconomic Literature.
Adler, Paul S. 1986. "New Technologies, New Skills." California Management Review, 29(1), 9 - 28.
Autor, David H., Lawrence F. Katz, and Alan B. Krueger. 1998. "Computing Inequality: HaveComputers Changed the Labor Market?" Quarterly Journal ofEconomics, 1 13(4), November,
1169-1214.
Autor, David H., Frank Levy and Richard J. Mumane. 2001. "Upstairs, Downstairs: Computers and
Skills on Two Floors of a Large Bank." mimeo, MIT, March.
Babbage, Henry P. 1883. "The Analytical Engine." Proceedings ofthe British Association.
Bartel, Anne P. Ichniowski, Casey and Kathryn Shaw. 2000. "New Technology, Human Resource
Practices and Skill Requirements: Evidence from Plant Visits in Three Industries." mimeo,
Carnegie Mellon University.
Bartel, Ann P. and Frank R. Lichtenberg. 1987. "The Comparative Advantage of Educated Workers in
\mp\emQnim%^>\QyN JQc\mo\o^.'" Review ofEconomics and Statistics, 69(1), 1-11.
Bartel, Ann P. and Nachum Sicherman. 1999. "Technological Change and Wages: An Interindustry
Analysis." Jowr«fl/ ofPolitical Economy, 107(2), April, 285 - 325.
Berman, Eli, John Bound, and Zvi Griliches. 1994. "Changes in the Demand for Skilled Labor within
U.S. Manufacturing Industries: Evidence from the Annual Survey of Manufactures." Quarterly
Journal ofEconomics, 109, 367 - 397.
Berman, Eli, John Bound, and Stephen Machin. 1998. "Implications of Skill-Biased Technological
Change: International Evidence." Quarterly Journal ofEconomics, 1 13, 1245 - 1279.
Berman, Eli and Stephen. 2000. "Skill-Biased Technology Transfer: Evidence of Factor Biased
Technological Change in Developing countries." mimeograph, Boston University, January.
Bemdt, Ernst R. and Catherine J. Morrison. (1995) "High-Tech Capital Formation and Economic
Performance in U.S. Manufacturing Industries: An Exploratory Analysis." Journal of
Econometrics, 65, 9 - 43.
Borghans, Lex and Bas Ter Weel. 2000. "What Happens When Agent T Gets a Computer?" mimeo,
Maastricht University, October.
35
Bound, John, and George Johnson. 1992. "Changes in the Structure of Wages in the 1980s: AnEvaluation of Ahemative Explanations," American Economic Review, 82, 371-392.
Bresnahan, Timothy F. 1999. "Computerization and Wage Dispersion: An Analytical Reinterpretation"
Economic Journal, 109, June, 390 - 415.
Bresnahan, Timothy P., Erik Brynjolfsson, and Lorin M. Hitt. Forthcoming. "Information Technology,
Workplace Organization and the Demand for Skilled Labor: Firm-Level Evidence." Quarterly
Journal ofEconomics.
Bryjolfsson, Erik and Lorin M. Hitt. 2000. "Beyond Computation: Information Technology,
Organizational Transformation and Business Performance." Journal ofEconomic Perspectives,
Fall, 23 - 48. -__-
Caroli, Eve, and John Van Reenen. forthcoming. "Skill-Biased Organizational Change? Evidence from
a Panel of British and French Establishments." Quarterly Journal ofEconomics.
Caselli, Francesco. 1999. "Technological R^tvoXniions." American Economic Review, 89, 78 - 102.
Davis, Randy. 1984. "Diagnostic Reasoning Based on Structure and ^Qhav'iox:." Artificial
Intelligence, 24, December, 347-410.
Doms, Mark, Timothy Dunne, and Kenneth R. Troske. 1997. "Workers, Wages, and Technology."
Quarterly Journal ofEconomics, 1 1 2, 253 - 90.
Fernandez, Roberto. 1999. "Skill-Biased Technological Change and Wage Inequality: Evidence from a
Plant Retooling." mimeo, Stanford University Graduate School of Business, June.
Garicano, Luis. 2000. "Hierarchies and the Organization of Knowledge in Production." Joz/rna/ ofPolitical Economy, 108(5), 874 - 904.
Gera, Surendra, Wulong Gu and Zhengxi Lin. 2001. "Technology and the Demand for Skills in
Canada: An Industry-Level Analysis" Canadian Journal ofEconomics, February.
Goldin, Claudia; Katz, Lawrence F. 1998. "The Origins of Technology-Skill Complementarity."
Quarterly Journal ofEconomics. 1 13(3), August, 693 - 732.
Griliches, Zvi. "Capital-Skill Complementarity." 1969. Review ofEconomics & Statistics, 51(4),
November, 465 - 68.
Grimm, Bruce T. 1998. "Price Indexes for Selected Semiconductors, 1974 - 1996." Survey ofCurrent
Business, February.
Hamermesh, Daniel S. 1993. Labor Demand. New Jersey: Princeton University Press.
Heckman, James J., Lance Lochner, and Christoper Taber. 1998. "Explaining Rising Wage Inequality:
Explorations with a Dynamic General Equilibrium Model of Labor Earnings with Heterogeneous
Agents." Review ofEconomic Dynamics, 1(1), January, 1 - 58.
36
Howell David R. and Edward N. Wolff. 1991. "Trends in the Growth and Distribution of Skills in the
U.S. Workplace, 1960-1985." Industrial and Labor Relations Review, 44(3), April, 486 - 502.
Hounshell, David A. 1984. From the American System to Mass Production, 1800-1932: The
Development ofManufacturing Technology in the United States. Baltimore: Johns Hopkins
University Press.
Ingram, Beth F. and George R. Neumann. 2000. "The Returns to Skill." mimeo, University of Iowa, May.
Jaeger, David A. 1997. "Reconciling the Old and New Census Bureau Education Questions:
Recommendations for Researchers." Journal ofBusiness and Economics Statistics, 15, 300 - 309.
Johnson, George 1997. "Changes in Earnings Inequality: The Role ofDemand Shifts." Journal ofEconomic Perspectives, 11,41 - 54.
Jorgenson, Dale W. and Kevin J. Stiroh. 1995. "Computers and Growth." Economics ofInnovation and
New Technology, 3(3 - 4), 295 - 316.
Jorgenson, Dale W. and Kevin J. Stiroh. 1999. "Information Technology and Growth." American
Economic Review, 89(2), 109 - 1 15.
Juhn, Chinhui. 1999. "Wage Inequality and Demand for Skill: Evidence from Five Decades."
Industrial and Labor Relations Review, 52(3), April, 424 - 43.
Juhn, Chinhui; Murphy, Kevin M; Pierce, Brooks. 1993. "Wage Inequality and the Rise in Returns to
Skill." Journal ofPolitical Economy, 101 (3), June, 410 - 442.
Katz, Lawrence F. and David H. Autor. 1999. "Changes in the Wage Structure and Earnings
Inequality." in Handbook ofLabor Economics, vol. 3, O. Ashenfeher and D. Card, eds.
(Amsterdam: North Holland).
Katz, Lawrence F. and Kevin M. Murphy. 1992. "Changes in Relative Wages, 1963-1987: Supply and
Demand Factors." Quarterly Journal ofEconomics, 107, 35 - 78.
Levy, Frank, Anne Beamish, and Richard J. Mumane. 1999. "Computerization and Skills: Examples
from a Car Dealership." mimeo, MIT Department of Urban Studies and Planning, November.
Levy, Frank and Mumane, Richard J. 1992. "U.S. Earnings Levels and Earnings Inequality: A Review
of Recent Trends and Proposed Explanations." Journal ofEconomic Literature, 30(3), September,
1333-1381.
Levy, Frank and Richard J. Mumane. 1 996. "With What Skills are Computers a Complement?"
American Economic Review. 86 (2) May, 258 - 262.
Lindbeck, Assar, and Dennis J. Snower. 2000. "Multitask Learning and the Reorganization ofWork:
From Tayloristic to Holistic Organization." Journal ofLabor Economics 1 8, 353 - 76.
Machin, Stephen; Van Reenen, John. 1998. "Technology and Changes in Skill Structure: Evidence
from Seven OECD Countries." Quarterly Journal ofEconomics, 113 (4), November, 1215 - 44.
37
Miller, Anne R., Donald J. Treiman, Pamela S. Cain and Patricia A. Roose (editors). 1980. Work, Jobs
and Occupations: A Critical Review of the Dictionary ofOccupational Titles. Washington, DC:National Academy Press.
Mishel, Lawrence, Jared Bernstein, and John Schmitt. 1997. "Did Technology Have Any Effect on the
Growth ofWage Inequality in the 1980s and 1990s?" mimeo, Economic Policy Institute.
Mobius, Markus. 2000. "The Evolution of Work." Mimeograph, Harvard University, September.
Mokyr, Joel. 1990. The Lever ofRiches: Technological Creativity and Economic Progress. New York:
Oxford University Press.
Mumane, Richard J. and Frank Levy. 1 996. Teaching the New Basic Skills. New York: Free Press.
Murphy, Kevin M and Finis Welch. 1992. "The Structure of Wages." Quarterly Journal ofEconomics,
107(1), February, 285 -326.
Murphy, Kevin M and Finis Welch. 1993. "Occupational Change and the Demand for Skill, 1940 -
1990." American Economic Review, 83(2), May, 122 - 36.
National Academy of Science, Committee on Occupational Classification and Analysis. 1981. "Fourth
Edition Dictionary ofDOT Scores for 1970 Census Categories." ICPSR Document #7845, AnnArbor Michigan.
Nelson, Richard R., and Edmund S. Phelps. 1966. "Investment in Humans, Technological Diffusion,
and Economic Growth." American Economic Review, 56.
Orr, Julian E. 1996. Talking about Machines: An Ethnography ofa Modern Job. Ithaca: Cornell
University Press.
Park, Jin Heum. 1994. "Estimation of Sheepskin Effects and Retiims to Schooling Using the Old and
the New CPS Measures of Educational Attainment," Princeton University, Industrial Relations
Section Working Paper No. 338, December.
Pinker, Steven. 1997. How the Mind Works. New York: Norton.
Polanyi, Michael. 1966. The Tacit Dimension. New York: Doubleday.
Priebe, J.A., J. Heinkel, and S. Greene. 1972. "1970 Occupation and Industry Classifications in Terms
of their 1960 Occupation and Industry Elements." Census Bureau Technical Paper # 26.
Roy, A. D. 1951. "Some Thoughts on the Distribution of Earnings." Oxford Economic Papers.
Ruggles Steven, Matthew Sobek et. al.. 1997. Integrated Public Use Microdata Series: Version 2.0,
Minneapolis: Historical Census Projects, University of Minnesota
Schultz, Theodore W. 1975. "The Value of the Ability to Deal with Disequilibria." Journal ofEconomic Literature, 13, 827 - 846.
38
Simon, Herbert A. 1960. "The Corporation: Will it be Managed by Machines?" in M. L. Anshen and
G. L. Bach (eds). Management and the Corporations. 1985, New York: McGraw-Hill, 17-55.
Spenner, Kenneth 1. 1983. "Deciphering Prometheus: Temporal Change in the Skill Level of Work."
American Sociological Review, 48, 824 - 837.
Spenner, Kenneth 1. 1990. "Skill: Meaning, Methods and Measures." Work and Occupations, 17(4),
399-421.
Thesmar, David, and Mathias Thoenig. 2000. "Creative Destruction and Firm Organization Choice: ANew Look into the Growth-Inequality Relationship." Quarterly Journal ofEconomics, 1 15(4),
1201 - 1238, November.
U. S. Department of Commerce. 1993. Fixed Reproducible Tangible Wealth ofthe United States,
1925-89. Washington, DC: U. S. Department of Commerce, Economics and Statistics
Administration, Bureau of Economic Analysis.
U.S. Department of Commerce. 1999. Fixed Reproducible Tangible Wealth of the United States, 1925-
1997. NCN-0229. Washington, DC: U.S. Department of Commerce, Economics and Statistics
Administration, Bureau of Economic Analysis.
U.S. Department of Labor, Manpower Administration. 1972. Handbookfor Analyzing Jobs,
Washmgton, DC.
U.S. Department of Labor. 1939. Dictionary ofOccupational Titles: First Edition. Washington, DC.
U.S. Department of Labor, Employment and Training Administration. 1977. Dictionary of
Occupational Titles: Fourth Edition. Washington, DC.
U.S. Department of Labor, Employment and Training Administration. 1991. Dictionary ofOccupational Titles: Revised Fourth Edition. Washington, DC.
Weizenbaum, Joseph. 1976. Computer Power and Human Reason. San Francisco: W.H. Freeman.
Welch, Finis. 1970. "Education in Production." Journal ofPolitical Economy. 78, 35 - 59.
Welch, Finis.2000. "Growth in Women's Relative Wages and Inequality Among Men: OnePhenomenon or Two?" American Economic Review, May, 444 - 450.
Winston, Patrick H. 1999. "Why I am Optimistic." available at
http://www.ai.mit.edu/people/phw/optimism.htmL July, accessed 6/18/2000.
Wolff, Edward N. 1996. "The Growth of Information Workers in the U.S. Economy, 1950-1990: The
Role of Technological Change, Computerization, and Structural Change." C.V. Starr Center for
Applied Economics, New York University RR#96-4I.
Zuboff, Shoshana. 1988. In the Age ofthe Smart Machine. New York: Basic Books.
39
Data Appendix
A.l. Samples usedfrom Current Population Survey and Census ofPopulations
To calculate occupational and educational distributions economy-wide and within industries for 1960 to
1998, we used observations on all non-institutionalized, employed workers ages 18-64 from the
Census PUMS one percent samples for 1960, 1970, 1980, and 1990 (Ruggles and Sobek, 1997) and the
Merged Outgoing Rotation Groups of the Current Population Survey for the years 1980, 1990, and
1998. All individual and industry level analyses are performed using as weights full-time equivalent
hours of labor supply, which is the product of the individual Census or CPS sampling weight times
hours of work in the sample reference week divided by 35 and, for Census samples, weeks of work in
the previous year. Our method provides equal weight to each hour of labor input in the economy rather
than over-weighting part-time hours as is implicitly done -when using raw Census sampling weights.
Because hours were not reported for the self-employed in the CPS prior to 1994, we assigned self-
employed workers in all CPS samples the average labor hours in their industry-education-year cell. In
cases where industry hours supplied by education category were unavailable (due to an empty industry-
education-year cell), we assigned weekly hours as the mean of workers' education-year cells.
To attain comparable educational categories (high school dropout, high school graduate, some college,
college-plus graduate) across the redefinition of Census's Bureau's education variable introduced in
1990 in the Census and in 1992 in the CPS, we use the method proposed by Jaeger (1997). In data
coded with the pre- 1992 education question (Census PUMS 1960, 1970, and 1980, and CPS MORGfiles 1980 and 1990), we defined high school dropouts as those with fewer than 12 years of completed
schooling; high school graduates as those having 12 years of completed schooling; some college
attendees as those with any schooling beyond 12 years (completed or not) and less than 16 completed
years; and college plus graduates as those with 16 or more years of completed schooling. In data coded
with the revised education question (1990 Census PUMS and 1998 CPS MORG file), we define high
school dropouts as those with fewer than 12 years of completed schooling; high school graduates as
those with either 12 completed years of schooling and/or a high school diploma or G.E.D.; some college
as those attending some college or holding an Associate's Degree (either occupational/vocational or
academic); and college plus as those with a B.A. or higher.
A. 2. Computing DOT Task Meansfor Census Occupation Categories (COCs)
To compute DOT Task Means for 1970 CIC Occupafions, we used a special version of the April 1971
CPS Monthly File issued by the Nafional Academy of Sciences (1981) in which a committee of experts
assigned individual DOT occupation codes and associated DOT measures to each of 60,441 workers in
the sample. Because Census occupation categories are significantly coarser than DOT occupation
categories, the 411 1970 census occupation codes represented in the 1971 CPS were assigned a total of
3,886 unique 1977 DOT occupations.' To convert this micro data sample into DOT task measures by
CIC occupation, we used the CPS sampling weights to calculate weighted means of each DOT measure
by occupation. Because the distribudon of DOT occupations differs substantially by gender within COCoccupation cells, we calculated DOT-occupation means for each occupafion separately by gender. In
cases where a COC cell contained exclusively males or females, we assigned the cell mean to both
genders. This provided a set of 822 DOT occupafion means by 1970 COC and gender.
Although the DOT contains over 1 2,000 occupational titles created originally during the 1 930s, many of these
occupations correspond to extraordinarily narrowly defined manufacturing jobs that are no longer represented in
employment.
Appendix page 1
We next required a method to consistently assign these means to COC occupations for 1960, 1980, and
1990.
To generate DOT means by 1960 occupation, we developed a crosswalk from the 1970 to 1960 COCoccupational classification schemes using information in Priebe and Greene (1972). Our crosswalk
(available on request) provides a set of 21 1 consistent 1960- 1970 occupations that represent the
lowest common level of aggregation needed to obtain a consistent occupation series. We applied the
1970 COC means to our 1970 Census sample by occupation and gender and calculated weighted
gender-occupation means across the 21 1 consistent 1960 - 1970 occupational categories. These means
provide our DOT task measures for 1960 occupational categories.
To generate DOT means for 1980 and 1990 occupations required an additional step. Because there is not
a close correspondence between the 1970 and 1980 COC coding schemes, it was not possible to
develop a bridging crosswalk as we did for 1960 - 1970. Instead, we employed a special Census sample
prepared for the Committee on Occupational Classification and Analysis chaired by Donald Treiman
and kindly supplied to us by Michael Handel. This file contains 122,141 observations from the 1980
Census that have been individually dual coded with both 1970 and 1980 COC occupation codes based
on occupational and other demographic information supplied by Census respondents. To calculate
DOT means by 1980 occupation, we merged the 1970 COC-DOT means describe above to the Treiman
file by gender and 1970 COC occupation, achieving a 97 percent match rate. We next appended to the
Treiman file a set of consistent occupation codes for the years 1980 to 1998 developed by Autor, Katz
and Krueger. These codes resolve minor changes to the COC schemes employed in the 1980 and 1990
Censuses and corresponding CPS files. Finally, to form DOT means by 1980 COC, we calculated labor-
supply weighted means of each DOT measure within consistent 1980 COC occupation gender
categories. These steps provide a set of by-gender DOT means for each of 485 DOT occupations that
are consistent for 1980 - 1998.
A. 3. Computing DOT Task Means by Consistent 1960 - 1998 Industry
To compute DOT task means overall, by industry, and by industry-education cell for 1960 - 1998, weassigned the consistent DOT occupational task means for 1960 - 1998 by gender and occupation to
each observation in our Census and CPS samples for 1960 - 1998. Using labor supply in FTEs as
weights, we calculated means of each DOT measure for each occupation-industry-education-year cell.
These means provide the primary outcome measures for our analysis.
To attain compatibility between changing Census Industry Codes for 1960 - 1998, we use a crosswalk
developed by Autor, Katz, and Krueger (1998) providing 140 consistent CIC industries spanning all
sectors of the economy. This crosswalk includes all CIC industries and attains consistency by
aggregating where necessary to the lowest common level of consistent industry definition among 1970,
1980 and 1990 CIC standards.
A. 4. Calculating Within-Occupation Changes in DOT Task Measures: 1977 - 1991
To measure within-occupation changes in task content, we employed the 1991 Revised Fourth Edition
of the Dictionary of Occupational Titles (available in electronic form as National Academy of Sciences,
1981). Based on a study of select industries to determine which jobs had undergone the most significant
occupational changes since the 1977 publication of the DOT 4* edition, DOT analysts introduced.
Hence, 1 980 COC codes vary within 1 970 COC codes and vice versa in this hand-coded sample.
Appendix page 2
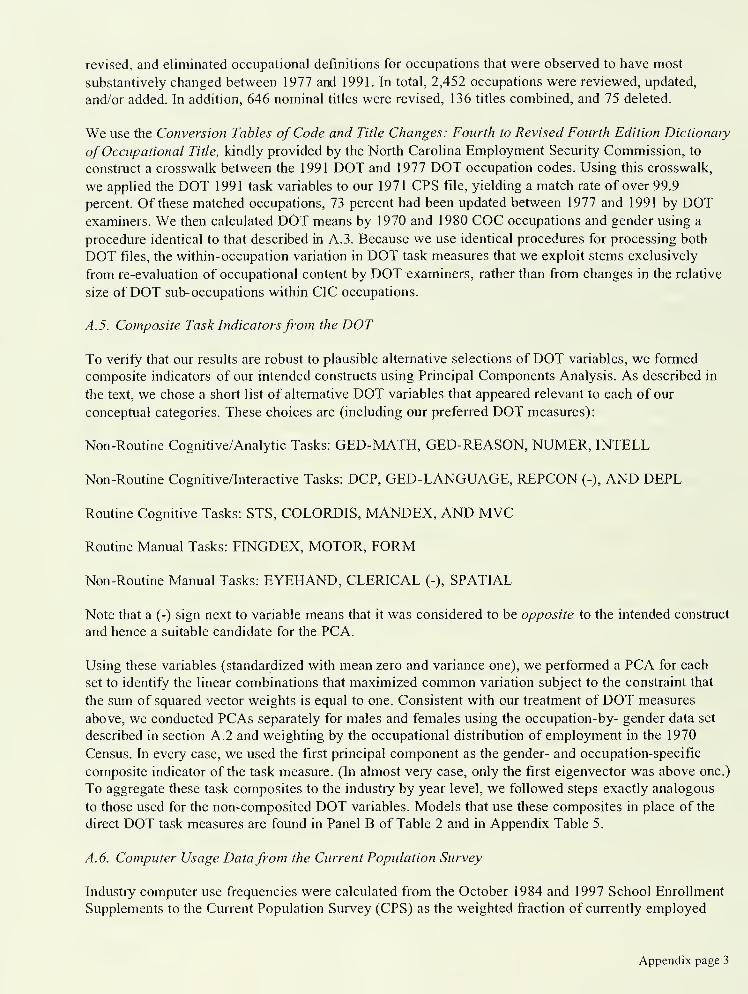
revised, and eliminated occupational definitions for occupations that were observed to have most
substantively changed between 1977 and 1991. In total, 2,452 occupations were reviewed, updated,
and/or added. In addition, 646 nominal titles were revised, 136 titles combined, and 75 deleted.
We use the Conversion Tables ofCode and Title Changes: Fourth to Revised Fourth Edition Dictionary
ofOccupational Title, kindly provided by the North Carolina Employment Security Commission, to
construct a crosswalk between the 1991 DOT and 1977 DOT occupation codes. Using this crosswalk,
we applied the DOT 1991 task variables to our 1971 CPS file, yielding a match rate of over 99.9
percent. Of these matched occupations, 73 percent had been updated between 1977 and 1991 by DOTexaminers. We then calculated DOT means by 1970 and 1980 COC occupations and gender using a
procedure identical to that described in A. 3. Because we use identical procedures for processing both
DOT files, the within-occupation variation in DOT task measures that we exploit stems exclusively
from re-evaluation of occupational content by DOT examiners, rather than from changes in the relative
size of DOT sub- occupations within CIC occupations.
A. 5. Composite Task Indicatorsfrom the DOT
To verify that our results are robust to plausible alternative selections of DOT variables, we formed
composite indicators of our intended constructs using Principal Components Analysis. As described in
the text, we chose a short list of alternative DOT variables that appeared relevant to each of our
conceptual categories. These choices are (including our preferred DOT measures):
Non-Routine Cognitive/Analyfic Tasks: GED-MATH, GED-REASON, NUMER, INTELL
Non-Routine Cognitive/Interactive Tasks: DC?, GED-LANGUAGE, REPCON (-), AND DEPL
Routine Cognitive Tasks: STS, COLORDIS, MANDEX, AND MVC
Routine Manual Tasks: FINGDEX, MOTOR, FORM
Non-Routine Manual Tasks: EYEHAND, CLERICAL (-), SPATIAL
Note that a (-) sign next to variable means that it was considered to be opposite to the intended construct
and hence a suitable candidate for the PCA.
Using these variables (standardized with mean zero and variance one), we performed a PCA for each
set to identify the linear combinations that maximized common variation subject to the constraint that
the sum of squared vector weights is equal to one. Consistent with our treatment of DOT measures
above, we conducted PCAs separately for males and females using the occupation-by- gender data set
described in section A.2 and weighting by the occupational distribution of employment in the 1970
Census. In every case, we used the first principal component as the gender- and occupation-specific
composite indicator of the task measure. (In almost very case, only the first eigenvector was above one.)
To aggregate these task composites to the industry by year level, we followed steps exactly analogous
to those used for the non-composited DOT variables. Models that use these composites in place of the
direct DOT task measures are found in Panel B of Table 2 and in Appendix Table 5.
A. 6. Computer Usage Datafrom the Current Population Survey
Industry computer use frequencies were calculated from the October 1984 and 1997 School Enrollment
Supplements to the Current Population Survey (CPS) as the weighted fraction of currently employed
Appendix page 3
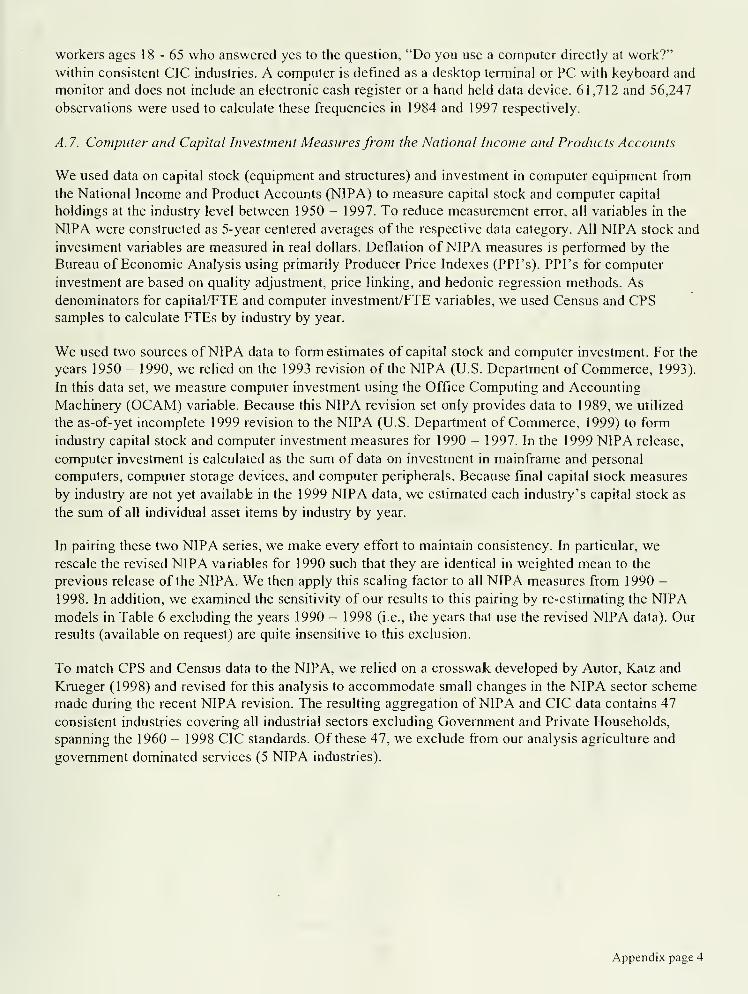
workers ages 1 8 - 65 who answered yes to the question, "Do you use a computer directly at work?"
within consistent CIC industries. A computer is defined as a desktop terminal or PC with keyboard and
monitor and does not include an electronic cash register or a hand held data device. 61,712 and 56,247
observations were used to calculate these frequencies in 1984 and 1997 respectively.
A. 7. Computer and Capital Investment Measuresfrom the National Income and Products Accounts
We used data on capital stock (equipment and structures) and investment in computer equipment from
the National Income and Product Accounts (NIPA) to measure capital stock and computer capital
holdings at the industry level between 1950 - 1997. To reduce measurement error, all variables in the
NIPA were constructed as 5-year centered averages of the respective data category. All NIPA stock and
investment variables are measured in real dollars. Deflation of NIPA measures is performed by the
Bureau of Economic Analysis using primarily Producer Price Indexes (PPI's). PPI's for computer
investment are based on quality adjustment, price linking, and hedonic regression methods. Asdenominators for capital/FTE and computer investment/FTE variables, we used Census and CPSsamples to calculate FTEs by industry by year.
We used two sources ofNIPA data to form estimates of capital stock and computer investment. For the
years 1950 - 1990, we relied on the 1993 revision of the NIPA (U.S. Department of Commerce, 1993).
In this data set, we measure computer investment using the Office Computing and Accounting
Machinery (OCAM) variable. Because this NIPA revision set only provides data to 1989, we utilized
the as-of-yet incomplete 1999 revision to the NIPA (U.S. Department of Commerce, 1999) to form
industry capital stock and computer investment measures for 1990 - 1997. In the 1999 NIPA release,
computer investment is calculated as the sum of data on investment in mainframe and personal
computers, computer storage devices, and computer peripherals. Because final capital stock measures
by industry are not yet availabfe in the 1999 NIPA data, we estimated each industry's capital stock as
the sum of all individual asset items by industry by year.
In pairing these two NIPA series, we make every effort to maintain consistency. In particular, werescale the revised NIPA variables for 1990 such that they are identical in weighted mean to the
previous release of the NIPA. We then apply this scaling factor to all NIPA measures from 1990 -
1998. In addition, we examined the sensitivity of our results to this pairing by re-estimating the NIPAmodels in Table 6 excluding the years 1990 - 1998 (i.e., the years that use the revised NIPA data). Our
results (available on request) are quite insensitive to this exclusion.
To match CPS and Census data to the NIPA, we relied on a crosswak developed by Autor, Katz and
Krueger (1998) and revised for this analysis to accommodate small changes in the NIPA sector scheme
made during the recent NIPA revision. The resulting aggregation of NIPA and CIC data contains 47
consistent industries covering all industrial sectors excluding Government and Private Households,
spanning the 1960 - 1998 CIC standards. Of these 47, we exclude from our analysis agriculture and
government dominated services (5 NIPA industries).
Appendix page 4
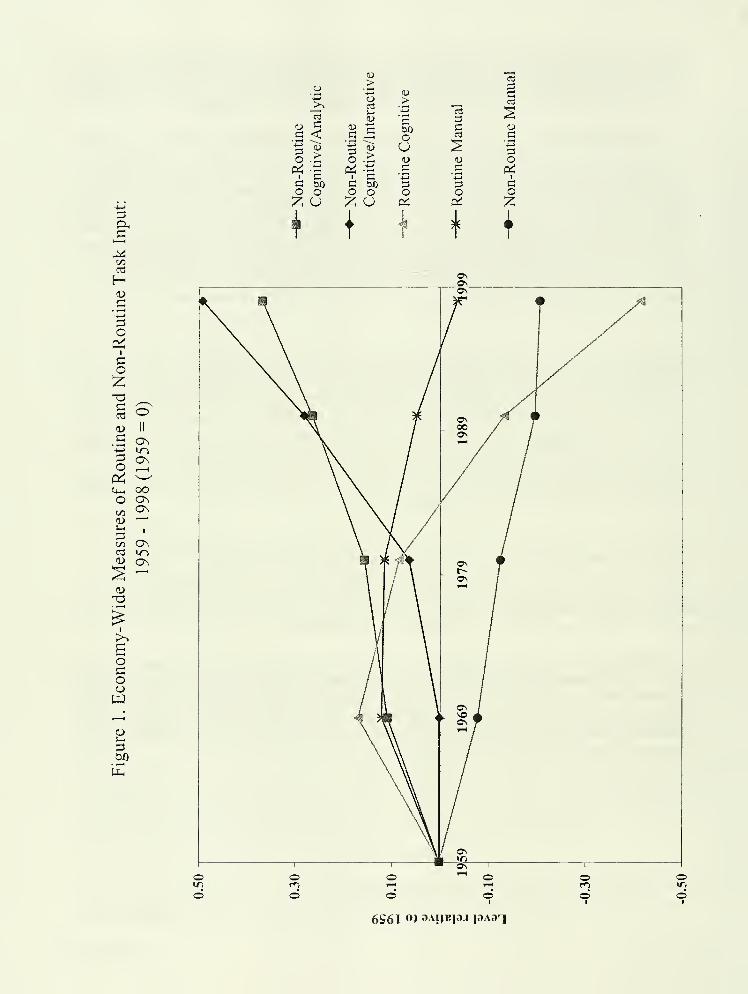
=i
&,ch—
t
C/l
aJ
H<i>
c• F—
)
-l->
;3O0^
co:z;
^3
r3 o<u II
C On-*-; ir>=i 0^OC^<+-, OOo OnC/3
0^fl>
'—
'
!-i
1C/1 a\cd u^(L> 0^
SD-o
ooo
4—
>
OI
co
o• .-H
>
co
G-4—
>
oI
Co
(D>Oct3
>
ao
Z u iz; u
1)>
'S
oUg
O
033
O
c
o0^
i + +
o oI
6S6I 0» 3A!JF|3J I3A3q
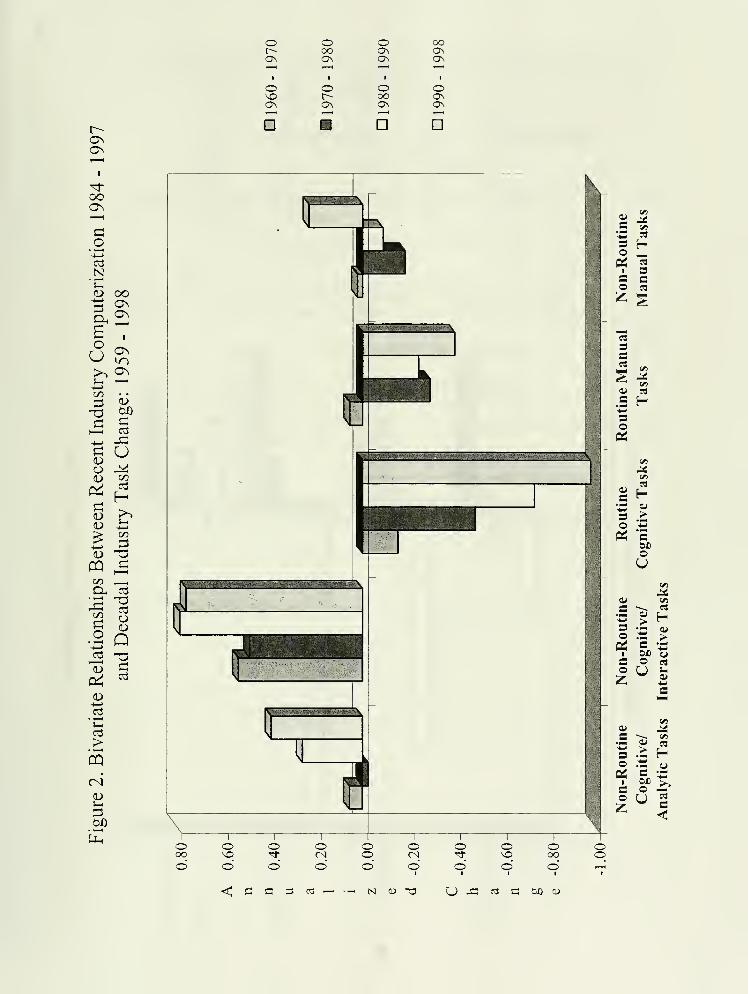
r-ONON'—
'
'*OOON—I
co-1—
>
c3N
• »-H^-1
<u OOONON
H 1
o ONIT)
>> ON;_i j—^-(—
>
rn >
:=! (U
-n u.
n V-l
1—
1
c«
-t-> jhid U(i>
Ci 'v;
(1) (/3
C^
CH) >-
<U i3
^ CD:3
(U -oCQ 1—
^
(/3 ^
a. k3• 1—
(
T3
oo QJ313
T3
a>-4—
'
>
c3
o o o OOr-- OO ON Ono ON Ov ON'—
'
'—
'
'—
'
~'
o o o oVO t^ OO OSON o\ ON O^
D D
C3 —^— N <D 'O U -G rt C tiO U
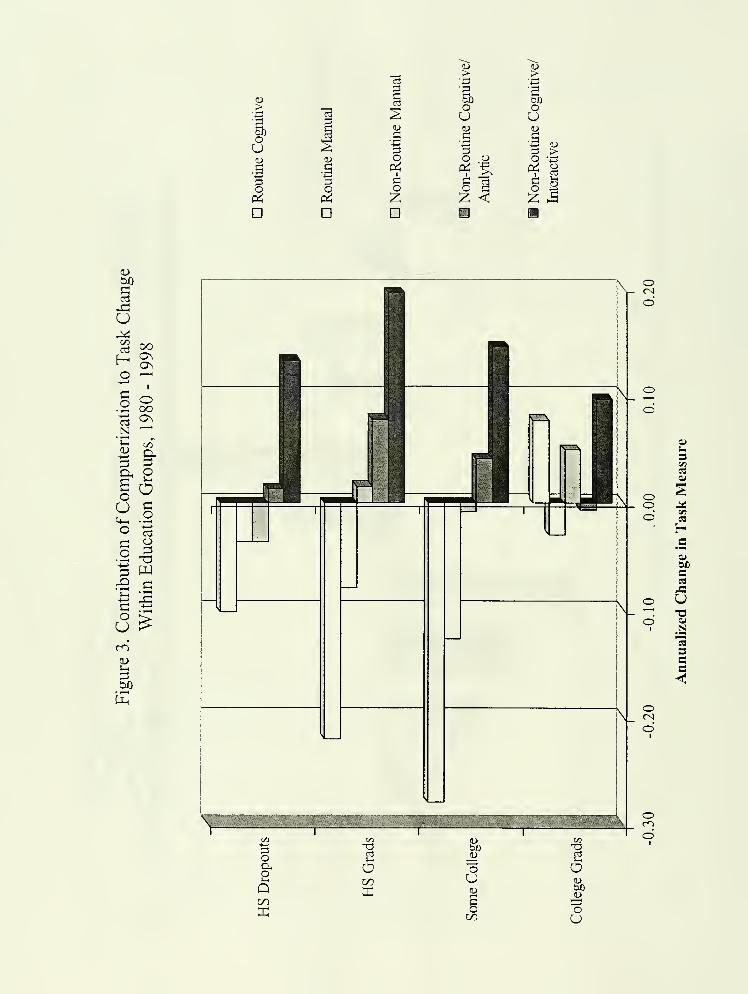
^
1n
oU Su (D
n ^3 So op< p^
O
>
o
3 >q -jzi
1 2o ^
D D
a>tJ)
C(TS
J3U^
ooH Ono 1—1-*—
O• 1—
<
OOi;i
o^N '—
'
;-! C/D
B &^ ;3
a, o
o OU nt^-i
o ts
o3 P-1^ Ci3 ^C -*—
»
o ^m'(!J;-!
=3bJj
[JLh
3COcs
H_C
a>one
U
SCs
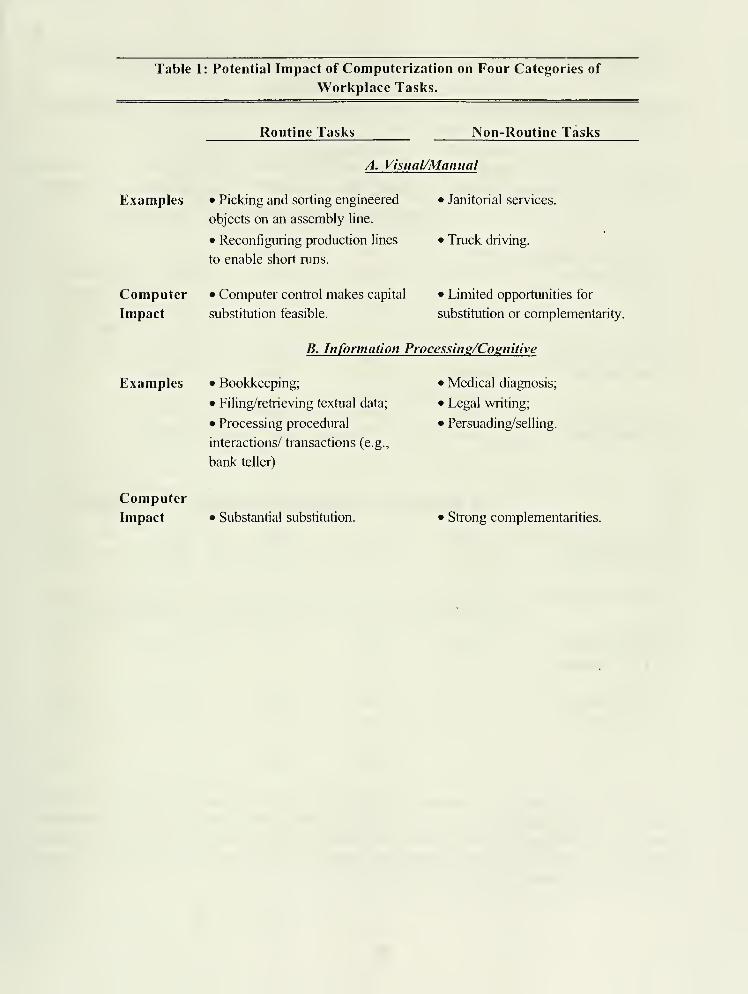
Table 1: Potential Impact of Computerization on Four Categories of
Workplace Tasks.
Routine Tasks Non-Routine Tasks
A. Visual/Manual
Examples • Picking and sorting engineered
objects on an assembly line.
• Reconfiguring production lines
to enable short runs.
• Janitorial services.
• Truck driving.
Computer
Impact
Examples
Computer
Impact
• Computer control makes capital • Limited opportunities for
substitution feasible. substitution or complementarity.
B. Information Processins/Cosnitive
• Bookkeeping;
• Filing/retrieving textual data;
• Processing procedural
interactions/ transactions (e.g.,
bank teller)
• Substantial substitution.
• Medical diagnosis;
• Legal writing;
• Persuading/selling.
Strong complementarities.
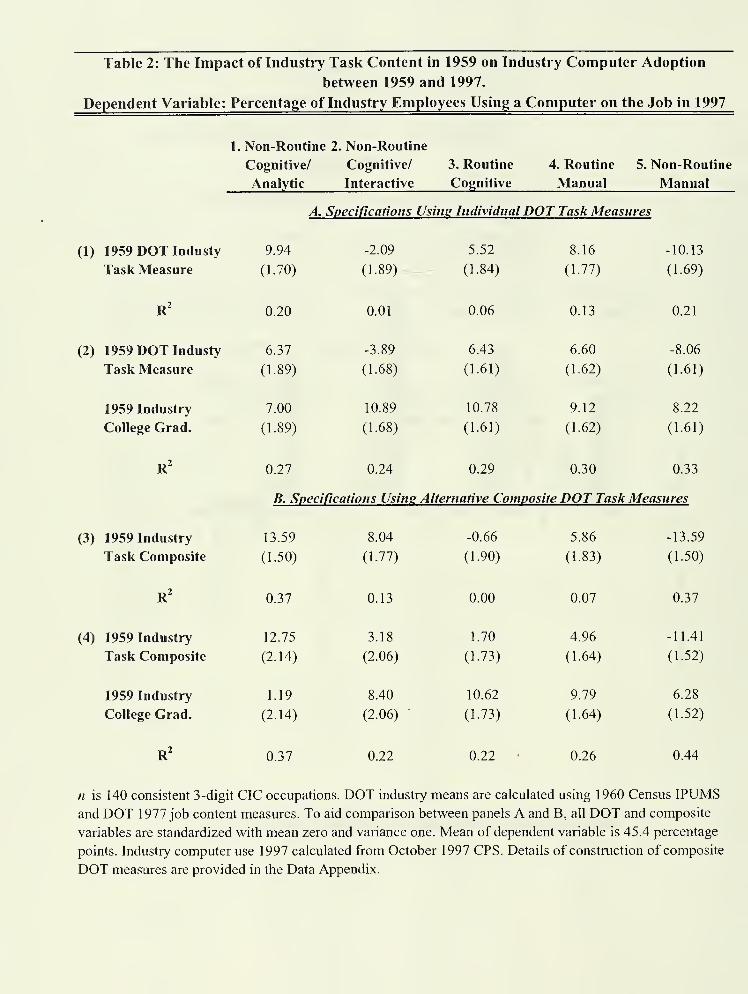
Table 2: The Impact of Industry Task Content in 1959 on Industry Computer Adoption
between 1959 and 1997.
Dependent Variable: Percentage of Industry Employees Using a Computer on the Job in 1997
1. Non-Routine 2. Non-Routine
Cognitive/ Cognitive/ 3. Routine 4. Routine 5. Non-Routine
Analytic Interactive Cognitive Manual Manual
A. Specifications Using Individual DOT Task Measures
(1) 1959 DOT Industy 9.94
Task Measure (1.70)
-2.09
(1.89)
5.52
(1.84)
8.16
(1.77)
-10.13
(1.69)
R' 0.20 0.01 0.06 0.13 0.21
(2) 1959 DOT Industy 6.37 -3.89 6.43 6.60 -8.06
Task Measure (1.89) (1.68) (1.61) (1.62) (1.61)
1959 Industry 7.00 10.89 10.78 9.12 8.22
College Grad. (1.89) (1.68) (1.61) (1.62) (1.61)
R^ 0.27 0.24 0.29 0.30 0.33
B. Specifications Usins Alternative Composite DOT Task Measures
(3) 1959 Industry 13.59
Task Composite (1-50)
8.04
(1.77)
-0.66
(1.90)
5.86
(1.83)
-13.59
(1.50)
R^ 0.37 0.13 0.00 0.07 0.37
(4) 1959 Industry 12.75 3.18 1.70 4.96 -11.41
Task Composite (2.14) (2.06) (1.73) (1.64) (1.52)
1959 Industry 1.19 8.40 10.62 9.79 6.28
College Grad. (2.14) (2.06) (1.73) (1.64) (1.52)
R' 0.37 0.22 0.22 0.26 0.44
n is 140 consistent 3-digit CIC occupations. DOT industry means are calculated using 1960 Census IPUMS
and DOT 1977 job content measures. To aid comparison between panels A and B, all DOT and composite
variables are standardized with mean zero and variance one. Mean of dependent variable is 45.4 percentage
points. Industry computer use 1997 calculated from October 1997 CPS. Details of construction of composite
DOT measures are provided in the Data Appendix.
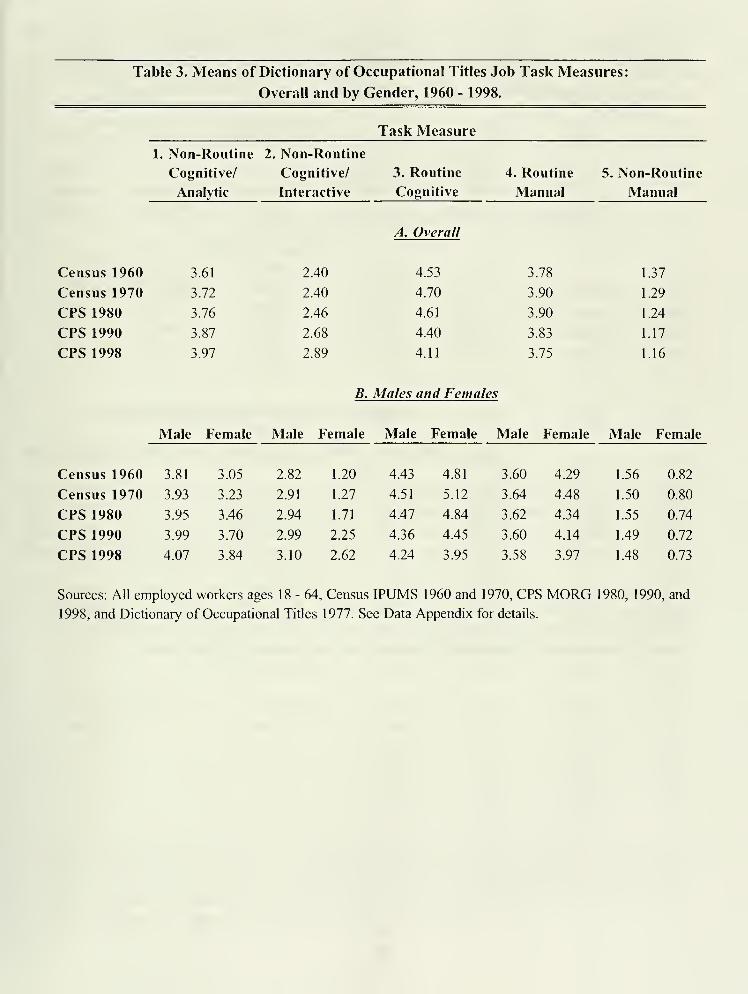
Table 3. Means of Dictionary of Occupational Titles Job Task Measures:
Overall and by Gender, 1960 - 1998.
Task Measure
1. Non-Routine 2. Non-Routine
Cognitive/ Cognitive/ 3. Routine 4. Routine 5. Non-Routine
Analytic Interactive Cognitive Manual Manual
A. Overall
Census 1960 3.61 2.40 4.53 3.78 1.37
Census 1970 3.72 2.40 4.70 3.90 1.29
CPS 1980 3.76 2.46 4.61 3.90 1.24
CPS 1990 3.87 2.68 4.40 3.83 1.17
CPS 1998 3.97 2.89 4.11 3.75 1.16
^ Males and Females
Male Female Male Female Male Female Male Female Male Female
Census 1960 3.81 3.05 2.82 1.20 4.43 4.81 3.60 4.29 1.56 0.82
Census 1970 3.93 3.23 2.91 1.27 4.51 5.12 3.64 4.48 1.50 0.80
CPS 1980 3.95 3.46 2.94 1.71 4.47 4.84 3.62 4.34 1.55 0.74
CPS 1990 3.99 3.70 2.99 2.25 4.36 4.45 3.60 4.14 1.49 0.72
CPS 1998 4.07 3.84 3.10 2.62 4.24 3.95 3.58 3.97 1.48 0.73
Sources: All employed workers ages 18-64, Census IPUMS 1960 and 1970, CPS MORG 1980, 1990, and
1998, and Dictionary of Occupational Titles 1977. See Data Appendix for details.
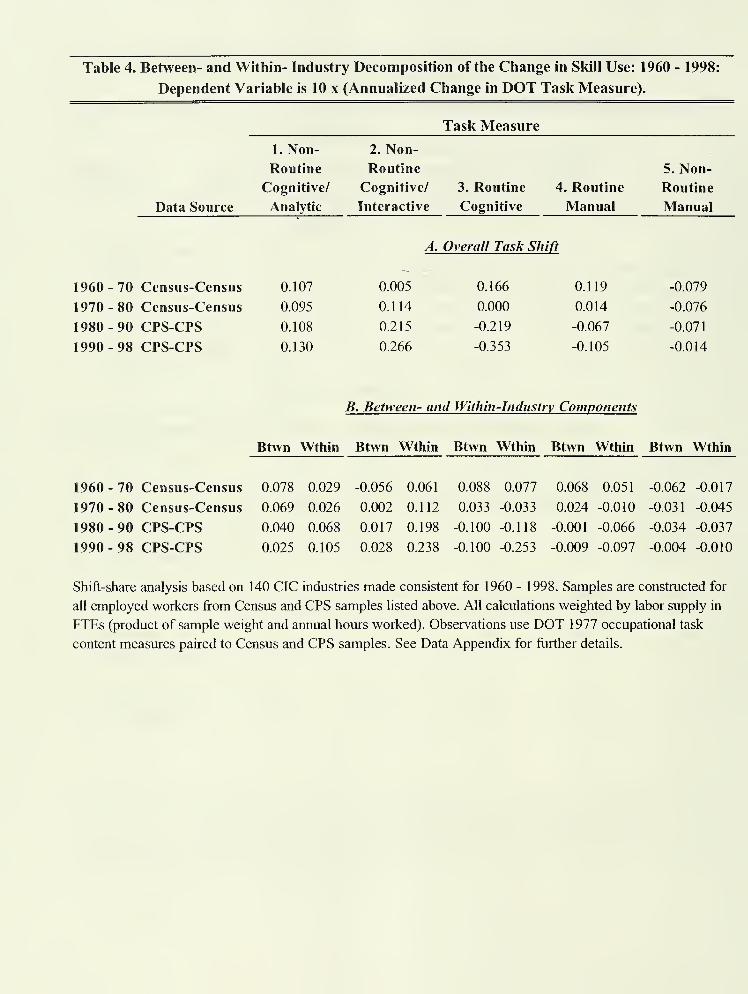
Table 4. Between- and Within- Industry Decomposition of the Change in Skill Use: 1960 - 1998:
Dependent Variable is 10 x (Annualized Change in DOT Task Measure).
Task Measure
1. Non- 2. Non-
Routine Routine 5. Non-
Cognitive/ Cognitive/ 3. Routine 4. Routine Routine
Data Source Analytic Interactive Cognitive Manual Manual
A. Overall Task Shift
1960-70 Census-Census 0.107 0.005 0.166 0.119 -0.079
1970-80 Census-Census 0.095 0.114 0.000 0.014 -0.076
1980-90 CPS-CPS 0.108 0.215 -0.219 -0.067 -0.071
1990 - 98 CPS-CPS 0.130 0.266 -0.353 -0.105 -0.014
B. Betyveen- and Within-Industry Components
1960-70 Census-Census
1970-80 Census-Census
1980-90 CPS-CPS
1990-98 CPS-CPS
Btwn Wthin Btwn Wthin Btwn Wthin Btwn Wthm Btwn Wthin
0.078 0.029 -0.056 0.061 0.088 0.077 0.068 0.051 -0.062 -0.017
0.069 0.026 0.002 0.112 0.033 -0.033 0.024 -0.010 -0.031 -0.045
0.040 0.068 0.017 0.198 -0.100 -0.118 -0.001 -0.066 -0.034 -0.037
0.025 0.105 0.028 0.238 -0.100 -0.253 -0.009 -0.097 -0.004 -0.010
Shift-share analysis based on 140 CIC industries made consistent for 1960 - 1998. Samples are constructed for
all employed workers from Census and CPS samples listed above. All calculations weighted by labor supply in
FTEs (product of sample weight and annual hours worked). Observations use DOT 1977 occupational task
content measures paired to Census and CPS samples. See Data Appendix for fiirther details.
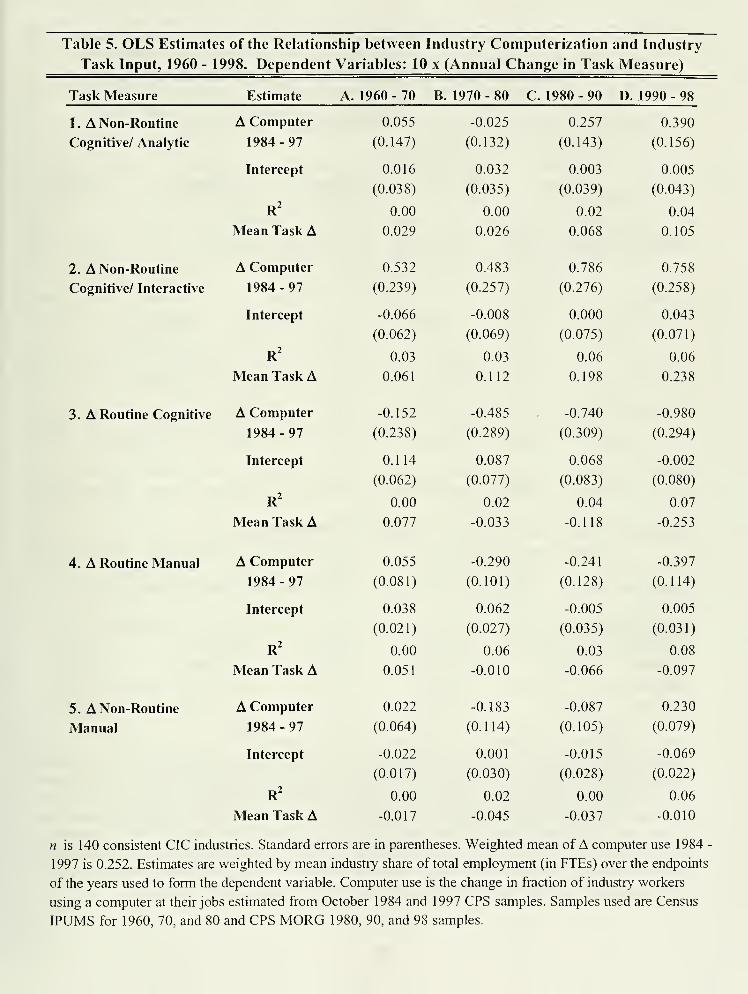
Table 5. OLS Estimates of the Relationship between Industry Computerization and Industry
Task Input, 1960 - 1998. Dependent Variables: 10 x (Annual Change in Task Measure)
Task Measure Estimate A. 1960-70 B. 1970-80 C. 1980 - 90 D. 1990 - 98
1 . A Non-Routine A Computer 0.055 -0.025 0.257 0.390
Cognitive/ Analytic 1984 - 97 (0.147) (0.132) (0.143) (0.156)
Intercept 0.016 0.032 0.003 0.005
(0.038) (0.035) (0.039) (0.043)
R^ 0.00 0.00 0.02 0.04
Mean Task A 0.029 0.026 0.068 0.105
2. A Non-Routine A Computer 0.532 0.483 0.786 0.758
Cognitive/ Interactive 1984 - 97 (0.239) (0.257) (0.276) (0.258)
Intercept -0.066 -0.008 0.000 0.043
(0.062) (0.069) (0.075) (0.071)
R^ 0.03 0.03 0.06 0.06
Mean Task A 0.061 0.112 0.198 0.238
3. A Routine Cognitive A Computer -0.152 -0.485 -0.740 -0.980
1984 - 97 (0.238) (0.289) (0.309) (0.294)
Intercept 0.114 0.087 0.068 -0.002
(0.062) (0.077) (0.083) (0.080)
R^ 0.00 0.02 0.04 0.07
Mean Task A 0.077 -0.033 -0.118 -0.253
4. A Routine Manual A Computer 0.055 -0.290 -0.241 -0.397
1984 - 97 (0.081) (0.101) (0.128) (0.114)
Intercept 0.038 0.062 -0.005 0.005
(0.021) (0.027) (0.035) (0.031)
R^ 0.00 0.06 0.03 0.08
Mean Task A 0.051 -0.010 -0.066 -0.097
5. A Non-Routine A Computer 0.022 -0.183 -0.087 0.230
Manual 1984-97 (0.064) (0.114) (0.105) (0.079)
Intercept -0.022 0.001 -0.015 -0.069
(0.017) (0.030) (0.028) (0.022)
R^ 0.00 0.02 0.00 0.06
Mean Task A -0.017 -0.045 -0.037 -0.010
n is 140 consistent GIG industries. Standard errors are in parentheses. Weighted mean of A computer use 1984 -
1997 is 0.252. Estimates are weighted by mean industry share of total employment (in FTEs) over the endpoints
of the years used to form the dependent variable. Computer use is the change in fraction of industry workers
using a computer at their jobs estimated from October 1984 and 1997 GPS samples. Samples used are Census
IPUMS for 1960, 70, and 80 and GPS MORG 1980, 90, and 98 samples.
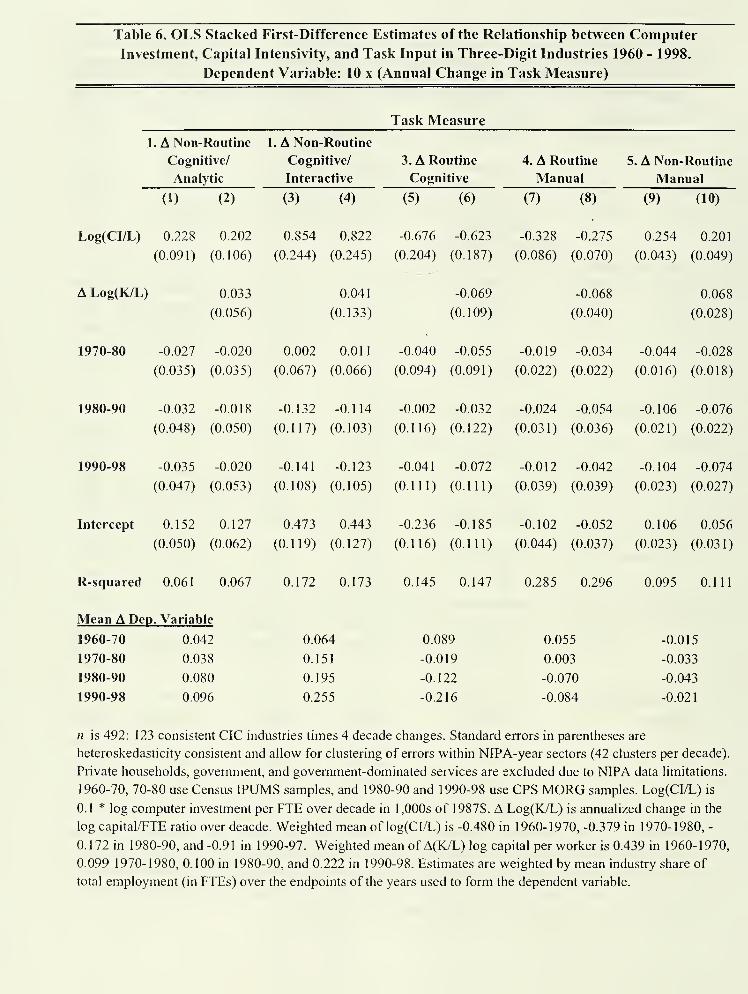
Table 6. OLS Stacked First-Difference Estimates of the Relationship between Computer
Investment, Capital Intensivity, and Task Input in Three-Digit Industries 1960 - 1998.
Dependent Variable: 10 x (Annual Change in Task Measure)
Task Measure
1. A Non-Routine 1. A Non-Routine
Cognitive/ Cognitive/
Analytic Interactive
(1) (2) (3) (4)
3. A Routine
Cognitive
(5) (6)
4. A Routine
Manual
(7) (8)
5. A Non-Routine
Manual
(9) (10)
Log(CI/L) 0.228 0.202 0.854 0.822 -0.676 -0.623 -0.328 -0.275 0.254 0.201
(0.091) (0.106) (0.244) (0.245) (0.204) (0.187) (0.086) (0.070) (0.043) (0.049)
A Log(K/L) 0.033
(0.056)
0.041
(0.133)
-0.069
(0.109)
-0.068
(0.040)
0.068
(0.028)
1970-80 -0.027 -0.020 0.002 0.011 -0.040 -0.055 -0.019 -0.034 -0.044 -0.028
(0.035) (0.035) (0.067) (0.066) (0.094) (0.091) (0.022) (0.022) (0.016) (0.018)
1980-90 -0.032 -0.018 -0.132 -0.114 -0.002 -0.032 -0.024 -0.054 -0.106 -0.076
(0.048) (0.050) (0.117) (0.103) (0.116) (0.122) (0.031) (0.036) (0.021) (0.022)
1990-98 -0.035 -0.020 -0.141 -0.123 -0.041 -0.072 -0.012 -0.042 -0.104 -0.074
(0.047) (0.053) (0.108) (0.105) (0.111) (0.111) (0.039) (0.039) (0.023) (0.027)
Intercept 0.152 0.127 0.473 0.443 -0.236 -0.185 -0.102 -0.052 0.106 0.056
(0.050) (0.062) (0.119) (0.127) (0.116) (0.111) (0.044) (0.037) (0.023) (0.031)
R-squared 0.061 0.067 0.172 0.173 0.145 1.147 0.285 0.296 0.095 0.111
Mean A Dep. Variable
1960-70 0.042 0.064 0.089 0.055 -0.015
1970-80 0.038 0.151 -0.019 0.003 -0.033
1980-90 0.080 0.195 -0.122 -0.070 -0.043
1990-98 0.096 0.255 -0.216 -0.084 -0.021
n is 492: 123 consistent CIC industries times 4 decade changes. Standard errors in parentheses are
heteroskedasticity consistent and allow for clustering of errors within NIPA-year sectors (42 clusters per decade).
Private households, government, and government-dominated services are excluded due to NIPA data limitations.
1960-70, 70-80 use Census IPUMS samples, and 1980-90 and 1990-98 use GPS MORG samples. Log(CI/L) is
0.1 * log computer investment per FTE over decade in 1,000s of 1987$. A Log(K/L) is annualized change in the
log capital/FTE ratio over deacde. Weighted mean of log(CI/L) is -0.480 in 1960-1970, -0.379 in 1970-1980, -
0.172 in 1980-90, and -0.91 in 1990-97. Weighted mean of A(K/L) log capital per worker is 0.439 in 1960-1970,
0.099 1970-1980, 0.100 in 1980-90, and 0.222 in 1990-98. Estimates are weighted by mean industry share of
total employment (in FTEs) over the endpoints of the years used to form the dependent variable.
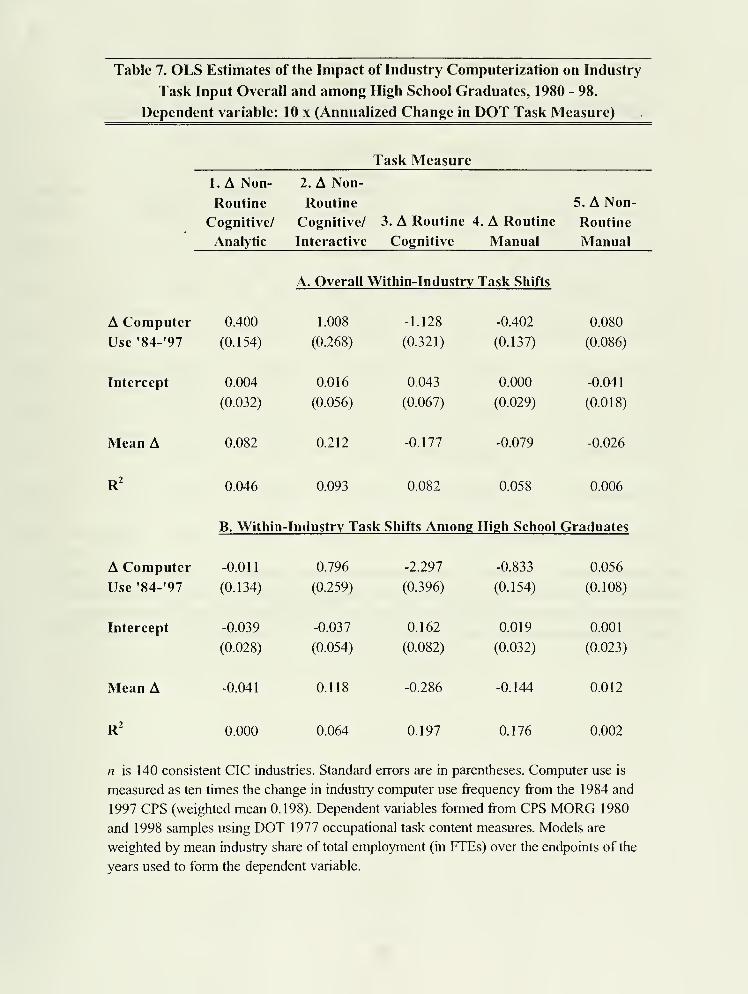
Table 7. OLS Estimates of the Impact of Industry Computerization on Industry
Task Input Overall and among High School Graduates, 1980 - 98.
Dependent variable: 10 x (Annualized Change in DOT Task Measure)
Task Measure
1. A Non- 2. A Non-
Routine Routine 5. A Non-
Cognitive/ Cognitive/ 3. A Routine 4. A Routine Routine
Analytic Interactive Cognitive Manual Manual
A. Overall Within-Industrv Task Shifts
A Computer 0.400 1.008 -1.128 -0.402 0.080
Use '84-'97 (0.154) (0.268) (0.321) (0.137) (0.086)
Intercept 0.004 0.016 0.043 0.000 -0.041
(0.032) (0.056) (0.067) (0.029) (0.018)
Mean A 0.082 0.212 -0.177 -0.079 -0.026
R^ 0.046 0.093 0.082 0.058 0.006
B. Within-Industrv Task Shifts Among High School Graduates
A Computer -0.011 0.796 -2.297 -0.833 0.056
Use '84-'97 (0.134) (0.259) (0.396) (0.154) (0.108)
Intercept -0.039 -0.037 0.162 0.019 0.001
(0.028) (0.054) (0.082) (0.032) (0.023)
Mean A -0.041 0.118 -0.286 -0.144 0.012
R^ 0.000 0.064 0.197 0.176 0.002
n is 140 consistent CIC industries. Standard errors are in parentheses. Computer use is
measured as ten times the change in industry computer use frequency from the 1984 and
1997 CPS (weighted mean 0.198). Dependent vanables formed from CPS MORG 1980
and 1998 samples using DOT 1977 occupational task content measures. Models are
weighted by mean industry share of total employment (in FTEs) over the endpoints of the
years used to form the dependent variable.
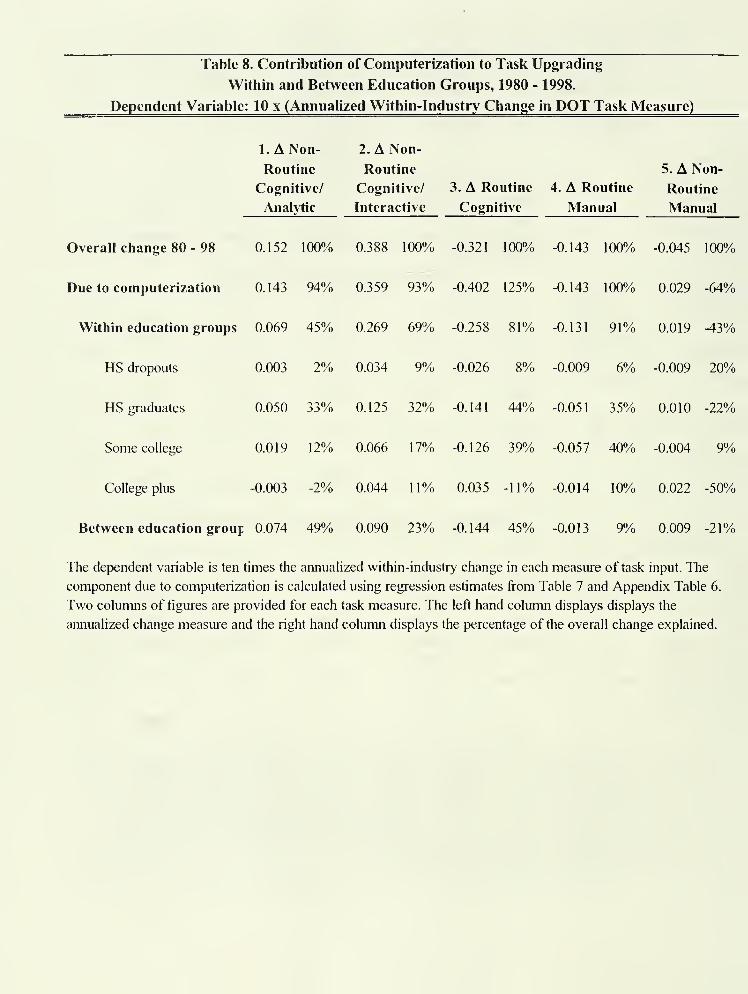
Table 8. Contribution of Computerization to Task Upgrading
Within and Between Education Groups, 1980 - 1998.
Dependent Variable: 10 x (Annualized Within-Industry Change in DOT Task Measure)
l.ANon- 2. A Non-
Routine Routine 5. A Non-
Cognitive/ Cognitive/ 3. A Routine 4. A Routine Routine
Analytic Interactive Cognitive Manual Manual
Overall change 80 - 98 0.152 100% 0.388 100% -0.321 100% -0.143 100% -0.045 100%)
Due to computerization 0.143 94% 0.359 93% -0.402 125% -0.143 100% 0.029 -64%
Within education groups 0.069 45%, 0.269 69% -0.258 81%) -0.131 91%) 0.019 -43%
HS dropouts 0.003 2% 0.034 9%o -0.026 8%) -0.009 6% -0.009 20%>
HS graduates 0.050 33%, 0.125 32% -0.141 44%o -0.051 35% 0.010 -22%
Some college 0.019 12%o 0.066 17%) -0.126 39%o -0.057 40% -0.004 9%
College plus -0.003 -2% 0.044 11%) 0.035 -11% -0.014 10% 0.022 -50%
Between education group 0.074 49% 0.090 23% -0.144 45%) -0.013 9% 0.009 -21%
The dependent variable is ten times the annualized within-industry change in each measvire of task input. The
component due to computerization is calculated using regression estimates from Table 7 and Appendix Table 6.
Two columns of figures are provided for each task measure. The left hand column displays displays the
annualized change measure and the right hand column displays the percentage of the overall change explained.
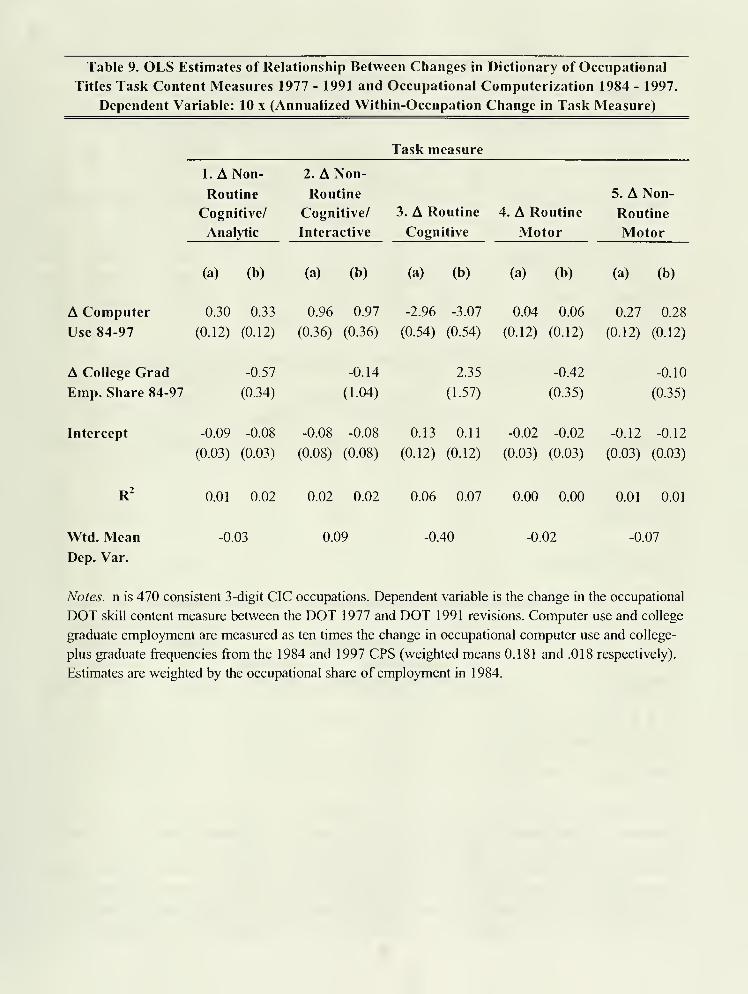
Table 9. OLS Estimates of Relationship Between Changes in Dictionary of Occupational
Titles Task Content Measures 1977 - 1991 and Occupational Computerization 1984 - 1997.
Dependent Variable: 10 x (Annualized Within-Occupation Change in Task Measure)
Task measure
1. A Non- 2. A Non-
Routine Routine 5. A Non-
Cognitive/ Cognitive/ 3. A Routine 4. A Routine Routine
Analytic Interactive Cognitive Motor Motor
(a) (b) (a) (b) (a) (b) (a) (b) (a) (b)
A Computer 0.30 0.33 0.96 0.97 -2.96 -3.07 0.04 0.06 0.27 0.28
Use 84-97 (0.12) (0.12) (0.36) (0.36) (0.54) (0.54) (0.12) (0.12) (0.12) (0.12)
A College Grad -0.57
Emp. Share 84-97 (0.34)
-0.14
(1.04)
2.35
(1.57)
-0.42
(0.35)
-0.10
(0.35)
Intercept -0.09 -0.08 -0.08 -0.08 0.13 0.11 -0.02 -0.02 -0.12 -0.12
(0.03) (0.03) (0.08) (0.08) (0.12) (0.12) (0.03) (0.03) (0.03) (0.03)
R^ 0.01 0.02 0.02 0.02 0.06 0.07 0.00 0.00 O.OI 0.01
Wtd. Mean
Dep. Var.
-0.03 0.09 -0.40 -0.02 -0.07
Notes, n is 470 consistent 3-digit CIC occupations. Dependent variable is the change in the occupational
DOT skill content measure between the DOT 1977 and DOT 1991 revisions. Computer use and college
graduate employment are measured as ten times the change in occupational computer use and college-
plus graduate frequencies from the 1984 and 1997 CPS (weighted means 0.181 and .018 respectively).
Estimates are weighted by the occupational share of employment in 1984.
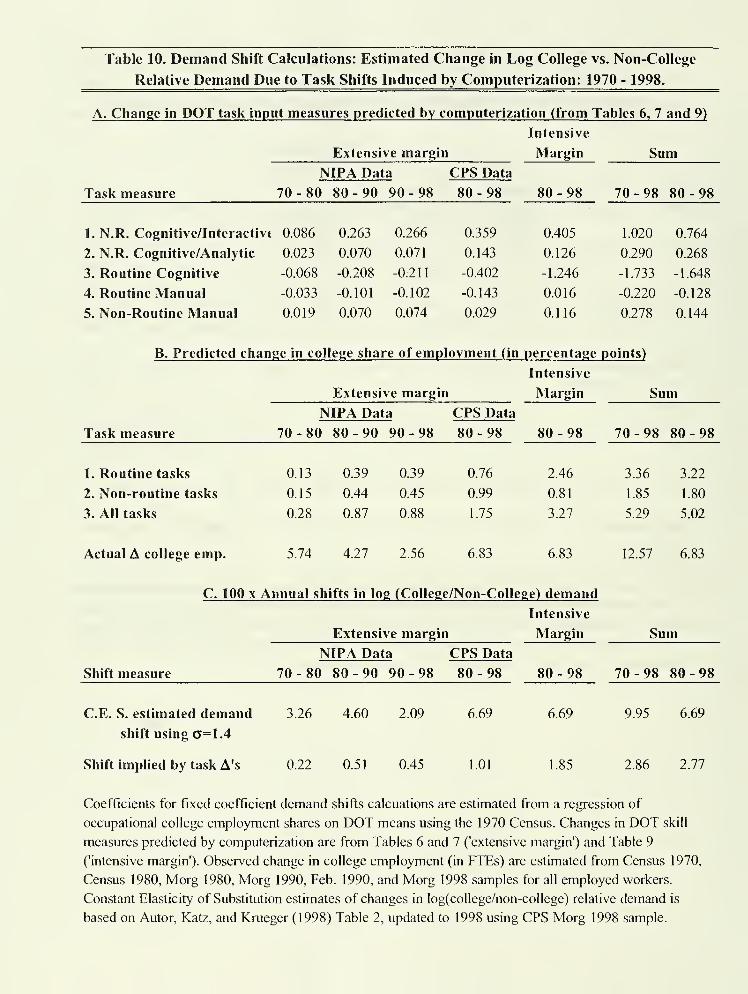
Table 10. Demand Shift Calculations: Estimated Change in Log College vs,. Non-College
Relative Demand Due to Task Shifts Induced by Computerization: 1970 - 1998.
A. Change in DOT task input measures predicted by computerization (from Tables 6, 7 and 9)
Intensive
Extensive margin Margin SumNIPA Data CPS Data
Task measure 70-80 80-90 90-98 80-98 80-98
0.405
70-98 80-98
1. N.R. Cognitive/Interactivt 0.086 0.263 0.266 0.359 1.020 0.764
2. N.R. Cognitive/Analytic 0.023 0.070 0.071 0.143 0.126 0.290 0.268
3. Routine Cognitive -0.068 -0.208 -Olhh -0.402 -1.246 -1.733 -1.648
4. Routine Manual -0.033 -0.101 -0.102 -0.143 0.016 -0.220 -0.128
5. Non-Routine Manual 0.019 0.070 0.074 0.029 0.116 0.278 0.144
B. Predicted change in college share of employment (in percentage points)
Intensive
Extensive margin Margin SumNIPA Data CPS Data
Task measure 70 - 80 80 - 90 90 - 98 80-98 80-98
2.46
70-98 80-98
1. Routine tasks 0.13 0.39 0.39 0.76 3.36 3.22
2. Non-routine tasks 0.15 0.44 0.45 0.99 0.81 1.85 1.80
3. All tasks 0.28 0.87 0.88 1.75 3.27 5.29 5.02
Actual A college emp. 5.74 4.27 2 56 6.83 6.83 12.57 6.83
C. 100 X Annual shifts in log (College/Non-College) demand
Intensive
Extensive margin Margin SumNIPA Data CPS Data
Shift measure 70-80 80-90 90-98 80-98 80-98
6.69
70-98 80-98
C.E. S. estimated demand 3.26 4.60 2.09 6.69 9.95 6.69
shift usingo=1.4
Shift implied by task A's 0.22 0.51 0.45 1.01 1.85 2.86 2.77
Coefficients for fixed coefficient demand shifts calcuations are estimated from a regression of
occupational college employment shares on DOT means using the 1970 Census. Changes in DOT skill
measures predicted by computerization are from Tables 6 and 7 ('extensive margin') and Table 9
('intensive margin'). Observed change in college employment (in FTEs) are estimated from Census 1970,
Census 1980, Morg 1980, Morg 1990, Feb. 1990, and Morg 1998 samples for all employed workers.
Constant Elasticity of Substitution estimates of changes in log(college/non-college) relative demand is
based on Autor, Katz, and Krueger (1998) Table 2, updated to 1998 using CPS Morg 1998 sample.
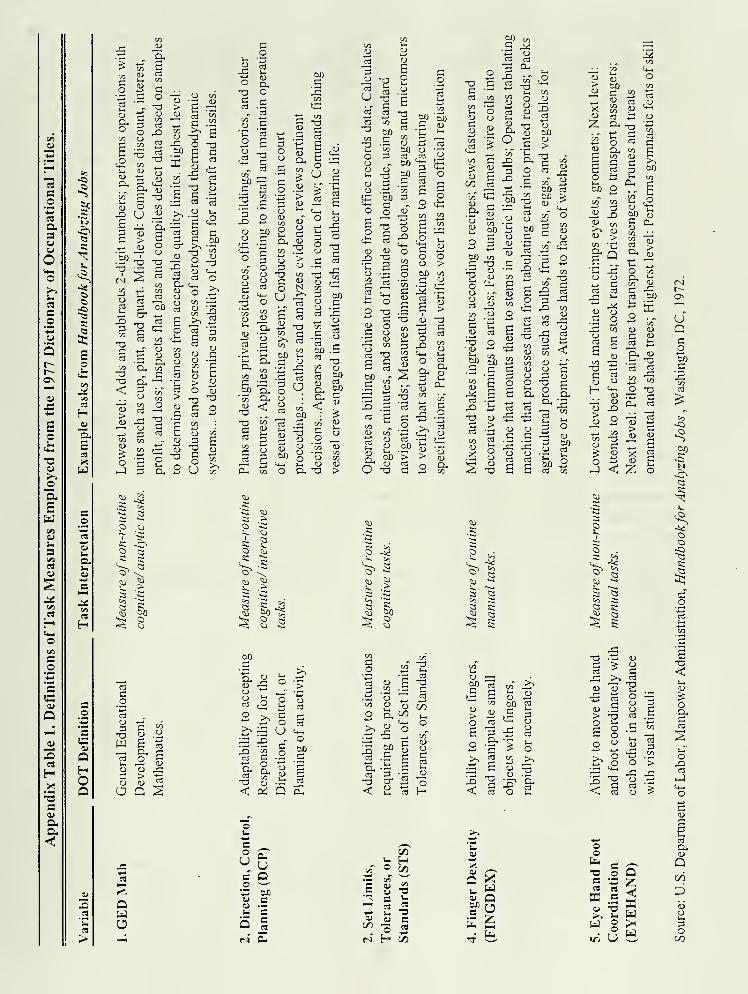
c_o
CS
Q.3uuo
5
o
ss
H
co
cIS
Q
9i
H3ea.a<
-S
H
"a.
E03
e_o•^^
cs
at
a.
a>
so
Ol
aHoa
Ol
>
o SC3
a.o
o. T3
c3O
CO oCO
0) o
(L>
_ >(U UtZ) '—
'
t^ _^ '^
ID co .5CO —
'
E03C>%-ao
dca
- p
CM
~ -^ -^ -7^
C3cr
-ac
c
O
03
3
-o-o< 3
cca
CO CDCT3 u
c^ ow ci:
O COm (D
C C3
O i^
c
C3 O> -o(D c OC rt >=
T3
j:: -oP COo
1. 03 C t>
00 to (D 3W -*—' -7—1
^CO in
o ^1o '5
3 SU
3 P
•5 'o
oj op
^ 8
C
03cj3-a
.2 g(D OJ 42G > -tiCD (D J2:p Q S
rt
QO
T3coj
o
(Da,o
'3
I i
cCD
C'GCD
CO
(D
03
OU^'
od
CDCJ
CDOCCD
r-" ^.3 O,
C 23 <JO 3o T3" CcS O
CD
>CD
CO ^-^
.SPCOID
Co3
COC03
-— IDCI. -^.— COO >^3 CO
'C 60Oh CCO 'wCD C— 3Cu O
CJa
-ac03
CO
CD
COc
'c3tiO03
COa(DMl03(30
<
3 &D
c3
CO < ^bX) : ?-
CDCO
ID —
o ^V-. CD
D, -a
CDCOCOCD
>
ca
-S-*2 ca
s >p 'Ci
ui 2o cu
.Ko' ^3
c^ I >)
^ o ^
bOC
>.a.
r-*
I—
>
oCDOOo3 c2 1
>
03
O >. c r^o 3
>% ~ U C4-.
1 5 - oISca
COC G
T3
On.COID
ID
'5
< oi Q clh
o
a Qo "~^
U S5 I
^ -ar X 03
• - C03 c^
Ca CO"°
bOCO CTD -1^ CO
O 3CJID ID
5^
ID
^ c £3 3 o
C 03
Si"^ "S
N CO ^>^ 3 bfl
" - 2 ID
a •=;
bOC_o
t3C03
ID
T33
CD
Go;-•
og•a3cc!
CO
W) CJo3 ,r3bO
Cc3
S
bOC
co
bX) (30C ID
S 03
bOc
CJ
oeo
o „C4-. "t3
° §CO CJ
CO _J5
E
c03
O>
bO CO
3 '~
CoCJajCO
-OCo3
ID>-ocoa
COCD
.— CD
rE"3
-o srt 3
'3
o ca
CO
ID bO
O T3
O ^ g•5 ciC" CJ
> >g 2
o<D
CO
cu
.g-C;
-5!-. Co
^ 5cu >
t^
CO CO
co-0
cS CD l03•T3
3 CO e'0 ""*
03
CO ^ ID 00n. 00 Lh"*~*
Cj-,
>> CD
co"
bO3
3 IDCJC
0. u>
03•a
'3'3 —
< CDta H
COi> H
«" CO+-• ^^
CO
1CAT3
[3 sC3
h!«
-*-» L. •0a> a> ci/3
"Sfs H 1/1
-a3CO
ID
C/0
ID
oID
a ca
2l^^.E 2 -o
oCJID
CO COID313
CJ k-i
IDID
Q.5
c/T
3 £CD
E3J3
J3
bO3OJ
03
- t: 5P +133
bOC
T3CD
C
CD
03Xi-a3ca
COCDX
CD—
'
CD CO
U-, E(U
CO_aj WCJ
03 iID.3
t/3
bO CO
C 3
E3
.E En 3ID ji:
>ID
3 3
CJ ca
T3 OJID bO
s >D. ^ CO
r^ 5 <L>
2 -cC co' ii"" bO ca
^ -" c^
bO g S3 *-
CJ
'S =« <i3ca -^ ^^
3 3 2S 'S CO
CO r-;
E £ §03-^cii; ,0 CO
B '&%-s-g ^CO 3<D MCOCO IDID
"O
CJ ^s <
-. ID iSID CJ 3O 3 CD
S "^ Eu. Q 3_ D. ^3
ID 5 O
•a
||SbO
03
IDbOc3t-.
OCO
S*-»
a^
^ Co
Ci)^^
S aCo s« c
1 S
CD _^
3 E IDCD
CO bO 3ID> 3
3 i-t
3
E 3 -G o3
'3 ?>> C3 CO >,
E CJ(D rs
1T3303
'3,
2
bu-4^
Xa>
Q X^ ua> QSb ZTTE
" i-l-,
E i2
•c s
o ii
03 "^ -3
'CD
'\ CD
ID Xi>CD 2,
. COCO T3ID
^ CD
kJ <
ID <0
SsgI
KO
cii "^5.. -
aCo
^ g
p ^03
-^
ID ID
S 3n. G
ID
=2
u 3CO .E
_G CO
^ C3ID42
3CO«—
1
>J3 .G
03OJ?1^<; c3
oo
o o Q
5= .S ffi
W 2 >-
UQcobl)
G
Co
K
Ia
4oo
g"
o
s
<
oD,Gc3
ca ^
v^ O fc)
o
Gu
I03
(U
Q00
D
3oCO
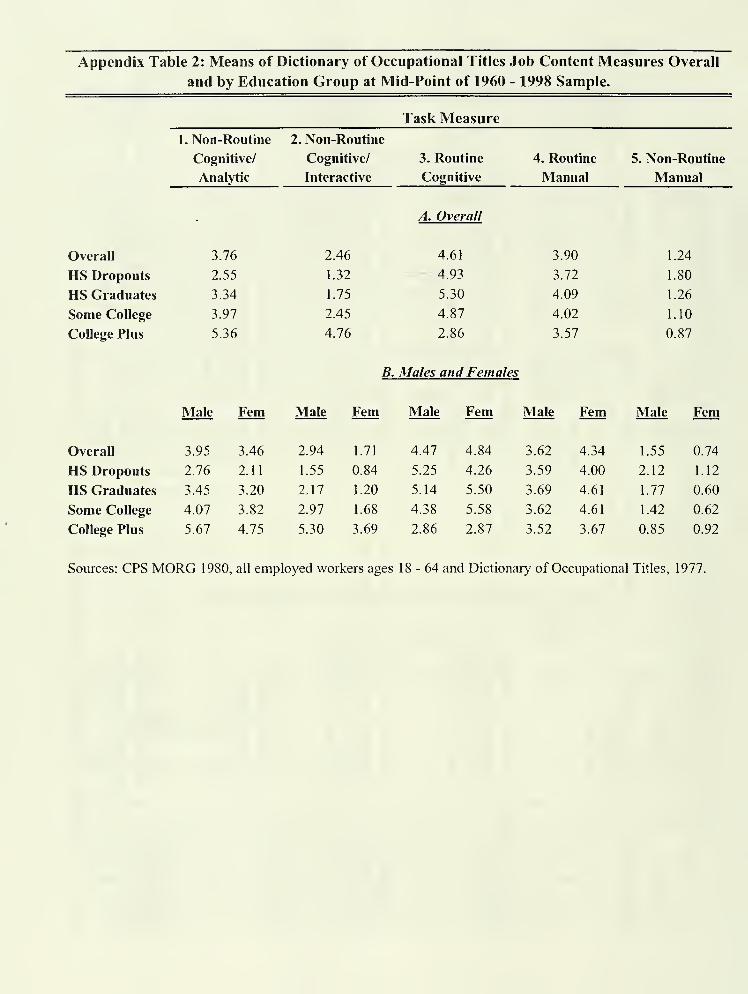
Appendix Table 2: Means of Dictionary of Occupational Titles Job Content Measures Overall
and by Education Group at Mid-Point of 1960 - 1998 Sample.
Task Measure
1. Non-Routine 2. Non-Routine
Cognitive/ Cognitive/ 3. Routine 4. Routine 5. Non-Routine
Analytic Interactive Cognitive Manual Manual
A. Overall
Overall 3.76 2.46 4.61 3.90 1.24
HS Dropouts 2.55 1.32 -----4.93 3.72 1.80
HS Graduates 3.34 1.75 5.30 4.09 1.26
Some College 3.97 2.45 4.87 4.02 1.10
College Plus 5.36 4.76 2.86
B. Males and Females
3.57 0.87
Male Fem Male Fem Male Fem Male Fem Male Fem
Overall 3.95 3.46 2.94 1.71 4.47 4.84 3.62 4.34 1.55 0.74
HS Dropouts 2.76 2.11 1.55 0.84 5.25 4.26 3.59 4.00 2.12 1.12
HS Graduates 3.45 3.20 2.17 1.20 5.14 5.50 3.69 4.61 1.77 0.60
Some College 4.07 3.82 2.97 1.68 4.38 5.58 3.62 4.61 1.42 0.62
College Plus 5.67 4.75 5.30 3.69 2.86 2.87 3.52 3.67 0.85 0.92
Sources: CPS MORG 1980, all employed workers ages 18-64 and Dictionary of Occupational Titles, 1977.
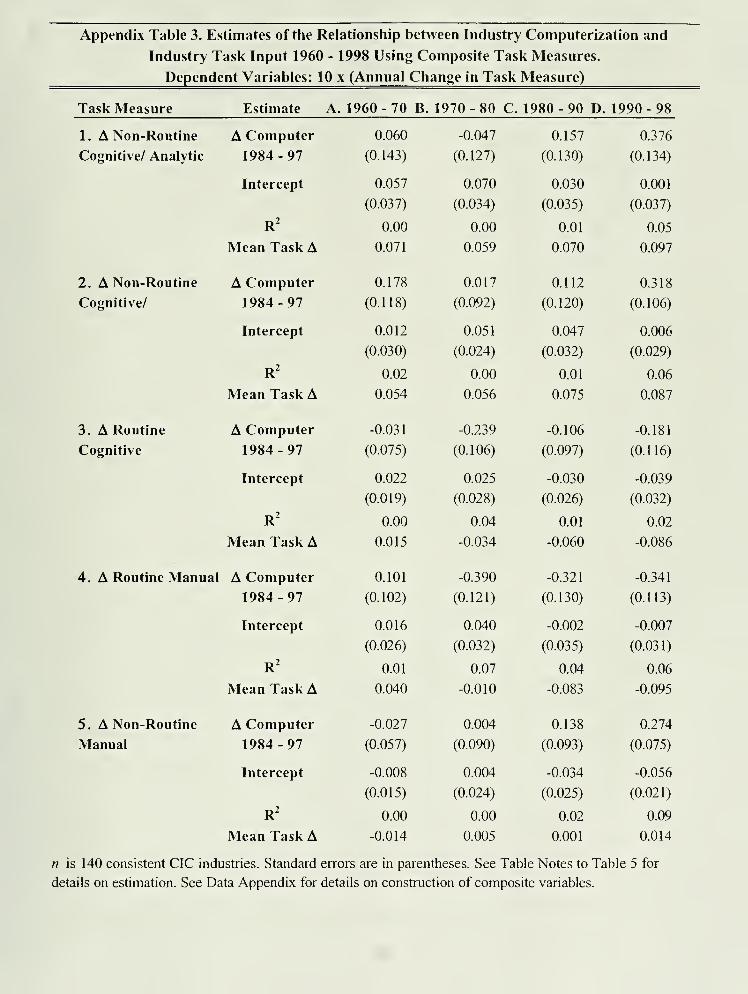
Appendix Table 3. Estimates of the Relationship between Industry Computerization and
Industry Task Input 1960 - 1998 Using Composite Task Measures.
Dependent Variables: 10 x (Annual Change in Task Measure)
Task Measure Estimate A. 1960-70 B. 1970-80 C. 1980-90 D. 1990-98
1. A Non-Routine A Computer 0.060 -0.047 0.157 0.376
Cognitive/ Analytic 1984-97 (0.143) (0.127) (0.130) (0.134)
Intercept 0.057 0.070 0.030 0.001
(0.037) (0.034) (0.035) (0.037)
R^ 0.00 0.00 0.01 0.05
Mean Task A 0.071 0.059 0.070 0.097
2. A Non-Routine A Computer 0.178 0.017 0.112 0.318
Cognitive/ 1984 - 97 (0.118) (0.092) (0.120) (0.106)
Intercept 0.012 0.051 0.047 0.006
(0.030) (0.024) (0.032) (0.029)
R^ 0.02 0.00 0.01 0.06
Mean Task A 0.054 0.056 0.075 0.087
3. A Routine A Computer -0.031 -0.239 -0.106 -0.181
Cognitive 1984-97 (0.075) (0.106) (0.097) (0.116)
Intercept 0.022 0.025 -0.030 -0.039
(0.019) (0.028) (0.026) (0.032)
R^ 0.00 0.04 0.01 0.02
Mean Task A 0.015 -0.034 -0.060 -0.086
4. A Routine Manual A Computer 0.101 -0.390 -0.321 -0.341
1984 - 97 (0.102) (0.121) (0.130) (0.113)
Intercept 0.016 0.040 -0.002 -0.007
(0.026) (0.032) (0.035) (0.031)
R^ 0.01 0.07 0.04 0.06
Mean Task A 0.040 -0.010 -0.083 -0.095
5. A Non-Routine A Computer -0.027 0.004 0.138 0.274
Manual 1984 - 97 (0.057) (0.090) (0.093) (0.075)
Intercept -0.008 0.004 -0.034 -0.056
(0.015) (0.024) (0.025) (0.021)
R^ 0.00 0.00 0.02 0.09
Mean Task A -0.014 0.005 0.001 0.014
n is 140 consistent CIC industries. Standard errors are in parentheses. See Table Notes to Table 5 for
details on estimation. See Data Appendix for details on construction of composite variables.
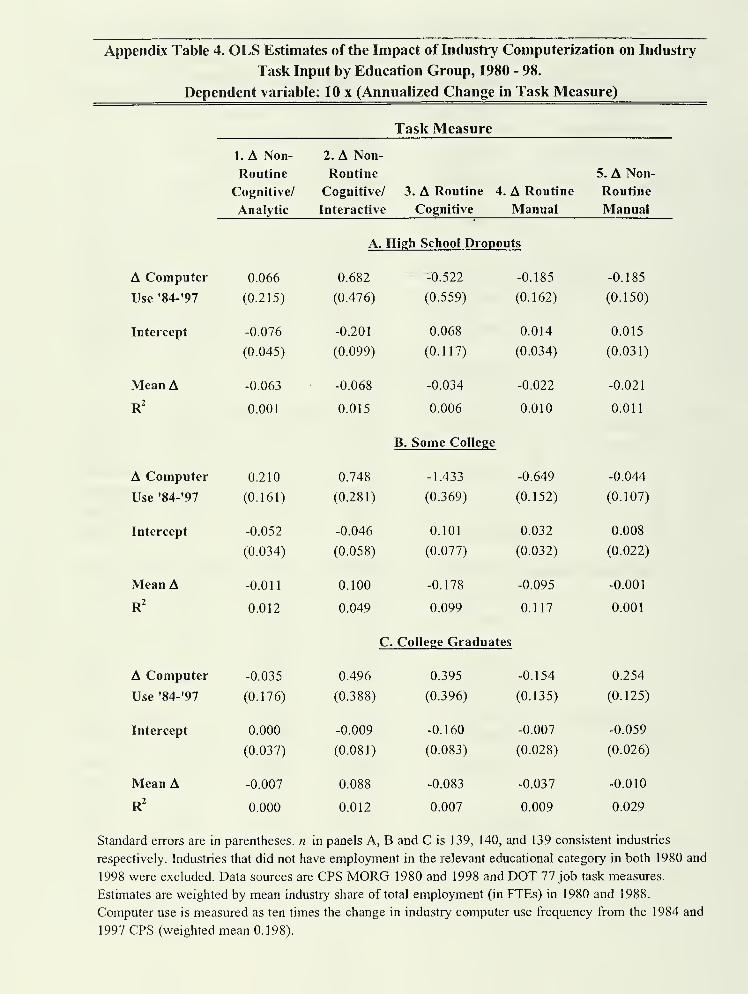
Appendix Table 4. OLS Estimates of the Impact of Industry Computerization on Industry
Task Input by Education Group, 1980 - 98.
Dependent variable: 10 x (Annualized Change in Task Measure)
Task Measure
1. A Non- 2. A Non-
Routine Routine 5. A Non-
Cognitive/ Cognitive/ 3. A Routine 4. A Routine Routine
Analytic Interactive Cognitive Manual Manual
A. High School Dropouts
A Computer 0.066 0.682 ~ - -XJ.522 -0.185 -0.185
Use '84-'97 (0.215) (0.476) (0.559) (0.162) (0.150)
Intercept -0.076 -0.201 0.068 0.014 0.015
(0.045) (0.099) (0.117) (0.034) (0.031)
Mean A -0.063 -0.068 -0.034 -0.022 -0.021
R^ 0.001 0.015 0.006
B. Some College
0.010 0.011
A Computer 0.210 0.748 -1.433 -0.649 -0.044
Use '84-'97 (0.161) (0.281) (0.369) (0.152) (0.107)
Intercept -0.052 -0.046 0.101 0.032 0.008
(0.034) (0.058) (0.077) (0.032) (0.022)
Mean A -0.011 0.100 -0.178 -0.095 -0.001
R' 0.012 0.049 0.099 0.117 0.001
C . College Graduates
A Computer -0.035 0.496 0.395 -0.154 0.254
Use '84-'97 (0.176) (0.388) (0.396) (0.135) (0.125)
Intercept 0.000 -0.009 -0.160 -0.007 -0.059
(0.037) (0.081) (0.083) (0.028) (0.026)
Mean A -0.007 0.088 -0.083 -0.037 -0.010
R^ 0.000 0.012 0.007 0.009 0.029
Standard errors are in parentheses, n in panels A, B and C is 139, 140, and 139 consistent industries
respectively. Industries that did not have employment in the relevant educational category in both 1980 and
1998 were excluded. Data sources are GPS MORG 1980 and 1998 and DOT 77 job task measures.
Estimates are weighted by mean industry share of total employment (in FTEs) in 1980 and 1988.
Computer use is measured as ten times the change in industry computer use frequency from the 1984 and
1997 GPS (weighted mean 0.198).

3 ^k5


Date Due
Lib-26-67

MIT LIBRARIES
3 9080 02246 0874

i,(1i,'''ll
llliliili
m