Embed Size (px)
Citation preview
The Slovak Republic
Economic Division
Taipei Representative Office in Bratislava
2013

2
CONTENT
I. Slovakia Facts & General Information
II. Slovakia's Economy
III. Slovakia´s Bilateral Trade & Investment Relations
IV. Taipei Representative Office in Bratislava

3
Slovakia in Central Europe

4
I. Slovakia Facts & General Information
5
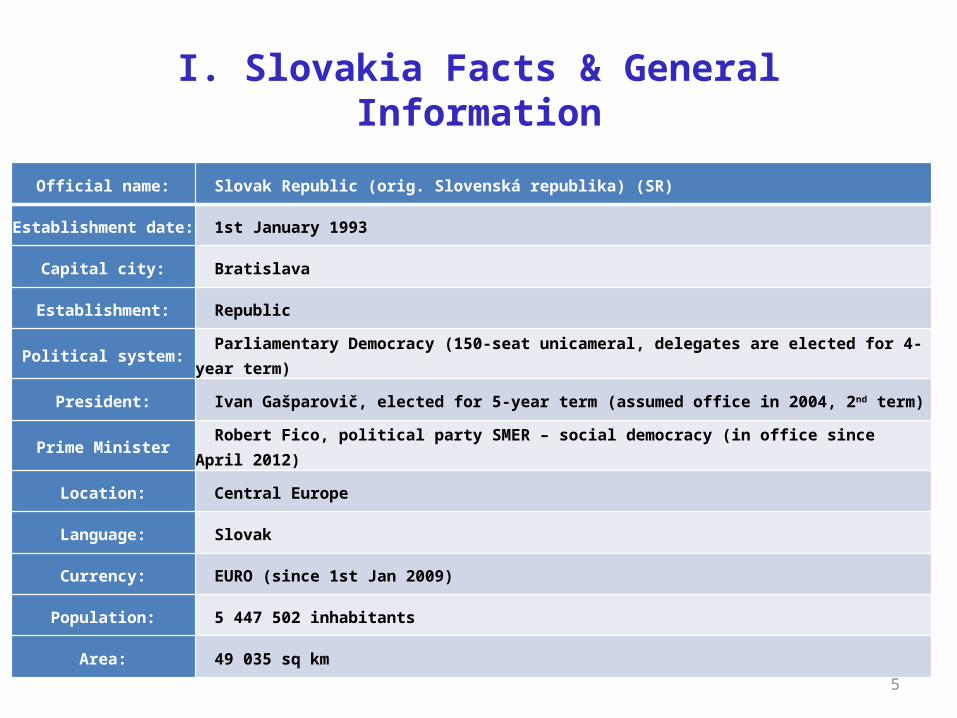
I. Slovakia Facts & General Information
Official name: Slovak Republic (orig. Slovenská republika) (SR)
Establishment date: 1st January 1993
Capital city: Bratislava
Establishment: Republic
Political system: Parliamentary Democracy (150-seat unicameral, delegates are elected for 4-year term)
President: Ivan Gašparovič, elected for 5-year term (assumed office in 2004, 2nd term)
Prime Minister Robert Fico, political party SMER – social democracy (in office since April 2012)
Location: Central Europe
Language: Slovak
Currency: EURO (since 1st Jan 2009)
Population: 5 447 502 inhabitants
Area: 49 035 sq km

6
I. Slovakia Facts & General Information
• Bordering Countries (5): Czech Republic, Poland, Ukraine,
Hungary and Austria
• Population density: 189 persons/sq km. Slovak population
distribution is quite uneven (mountains, lowlands).
• Nationality:
– Slovak nationality represent 85.5% of the whole population
– Hungarian nationality: approx. 520,000 citizens (9.7% of the Slovak population)
– Roma nationality: approx. 90,000 citizens (1.7% of Slovaks)
– Others: Czechs (0.8%), Ruthenians and Ukrainians mostly in eastern Slovak
regions

7
I. Slovakia Facts & General Information
Region Area/ km² Inhabitants Density/km² Districts
Bratislava Region 2,052.6 603,699 249 8
Trnava Region 4,174.2 554,172 133 7
Trenčín Region 4,501.9 600,386 133 9
Nitra Region 6,343.4 708,498 112 7
Žilina Region 6,808.4 694,763 102 11
Banská Bystrica Region 9,454.8 657,119 70 13
Prešov Region 8,974.5 798,596 89 13
Košice Region 6,751.9 771,947 114 11
Source: slovakiasite.com

8
I. Slovakia Facts & General Information
The largest cities of Slovakia
Bratislava - 428,672 inhabitants
Kosice - 240,915 inhabitants
Presov - 92,687 inhabitants
Nitra - 87,357 inhabitants
Zilina - 86,685 inhabitants
Banska Bystrica - 84,919 inhabitants
Trnava - 70,191 inhabitants
Martin - 60,772 inhabitants
Trencin - 58,872 inhabitants
Poprad - 55,037 inhabitantsSource: slovakiasite.com

9
I. Slovakia Facts & General Information
Membership in international organisations
NATO (29 March 2004)
European Union (1 May 2004)
United Nations (1993)
Schengen Agreement (21 December 2007)
Others (WHO, WTO, IMF, OECD, UNESCO..)

10
II. Slovakia's Economy

11
II. Slovakia's Economy
2.1 Key Economic Indicators (2012)
GDP I-IIIQ/2012 € 126 bn
GDP growth (2012 Q3 in %) 2.1
GDP per capita (PPP) – 2012 € 13,100
Unemployment rate (%) 14,4
Gross foreign debt (bn. USD) 66.3
Annual CPI inflation rate (%) 2.4
State budget balance (mil. EUR) -3,811
Deficit ratio (government deficit as % of GDP) -5.3
Index of industry production (%) 8.1
Indicator of economic sentiment (long-term average = 100) 84.1
Pensions (average in EUR) 376
Average monthly nominal wage (EUR) 782
Minimum wage (EUR) 337.7Source: portal.statistics.sk

12
II. Slovakia's Economy
2.2 Share of Sectors on national GDP (2011)
Slovakia GDP I-IIIQ/2012: € 126 bn
Source: portal.statistics.sk
Industry 29.50%
Sales, transportation, accommodation & restaurant services 16.40%
Public administration, defense, social insurance 12.40%
Taxes 9.40%
Construction 8.50%
Administrative services, science & technical activities 5.50%
Activities in the real estate sector 5.30%
Infrastructure & Telecommunication 4.20%
Financial & Insurance Services 3.10%
Agriculture, Forestry & Fishery 2.90%
Art, entertainment & recreational services 2.80%

13
II. Slovakia's Economy
2.3 Car Manufacturing
Vehicle production for 2012: 925 000 cars (increase of annual production by 45%)
Contribution to the total exports of Slovakia: 20%
Three automotive companies in Slovakia:
– VOLKSWAGEN (Bratislava, 1992)
– PSA Peugeot-Citroën (Trnava, 2003)
– Kia Motors (Žilina, 2004)
Company Total sales 2011 Production capacity Export 2011
Volkswagen €5.193bn 400,000/year 99%
Kia Motors Slovakia €3.328bn 300,000/year 99%
PSA Slovakia €1.642bn 300,000/year 99%

14
II. Slovakia's Economy
2.3 Car Manufacturing

15
II. Slovakia's Economy
2.4 Top 10 Companies in Slovakia 2011
COMPANY SALES 2011 (€ bn)
SALES 2010 (€ bn)
Change 2011/2010
(%)
1 Volkswagen Slovakia a.s., Bratislava 5.20 4.00 28.60
2 Slovnaft, a.s., Bratislava 4.74 3.50 35.40
3 Kia Motors Slovakia, s.r.o., Žilina 3.33 2.88 15.20
4 Samsung Electronics Slovakia, s.r.o., Galanta 3.16 3.24 -2.40
5 Slovenské elektrárne, a.s., Bratislava 2.84 2.14 32.70
6Slovenský plynárenský priemysel, a.s., Bratislava 2.51 2.52 -0.40
7 U.S. Steel Košice, s.r.o., Košice 2.43 2.46 -1.30
8 PCA Slovakia, s.r.o., Trnava 1.64 1.65 -0.70
9 Tesco Stores SR, a.s., Bratislava 1.31 1.17 11.90
10 Foxconn Slovakia, s.r.o., Nitra 1.04 1.42 -26.90
Source: firmy.etrend.sk

16
II. Slovakia's Economy
2.5 Allocation of EU Structural Funds
Programming period 2004-2006: € 1.17 bn
Programming period 2007-2013: € 11.4 bn
Programming period 2014-2020: € 14.0 bn (planned)
Source: monitoringfondov.eu

17
II. Slovakia's Economy 2.5 Allocation of EU Structural Funds
Programming period 2007-2013 (in €)
Operation Programme (OP) FundFinancial allocation (€ ml.)
Regional OP ERDF 1,445
OP Environment ERDF+CF 1,820 ERDF 251 CF 1,569
OP Transport ERDF+CF 3,207 ERDF 877 CF 2,329OP Informatization of Society ERDF 988OP Research & Development 1,209OP Competition & Economic growth 777OP Health 250OP Technical support 98OP Bratislava region 87OP Employment ESF 882OP Education ESF 618Total € 11.4 bn
Source: nsrr.sk

18
III. Slovakia´s Bilateral Trade & Investment Relations

19
III. Slovakia´s Bilateral Trade & Investment Relations
3.1 Slovakia´s balance of trade
Year Import (ml. €)
Export (ml.
€)
Balance of trade (ml. €)
2012 54 756,1 58 169,8 3 637
2011 53 966,1 56 407,9 2 441,9
2010 48 653,5 48 791,0 137,5
Source: portal.statistics.sk
20
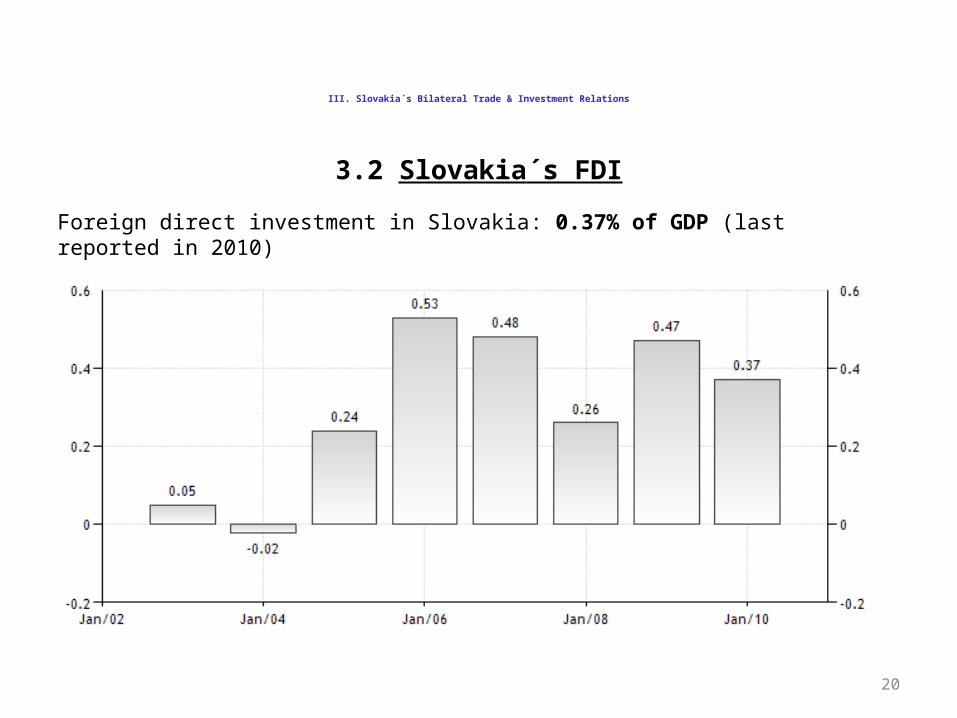
III. Slovakia´s Bilateral Trade & Investment Relations
3.2 Slovakia´s FDI
Foreign direct investment in Slovakia: 0.37% of GDP (last reported in 2010)

21
III. Slovakia´s Bilateral Trade & Investment Relations
3.3 Top 20 import countries (January – October 2012)
Country of origin Total Import (in mil. EUR)
Total Export (in mil.
EUR)Total trade Balance of trade
1 Germany 8341.00 11 300 19641.00 2959.002 Russian Federation 4805.80 2 125.5 6931.30 -2680.303 Czech Republic 4 789.1 7215.40 12004.50 2426.404 Korea 4491.40 80.30 4571.70 -4411.005 China 2954.70 1241.50 4196.20 -1713.206 Poland 1807.30 4152.50 5959.80 2345.207 Hungary 1785.20 3742.10 5527.30 1956.808 Italy 1493.40 2424.20 3917.60 930.709 France 1433.70 2863.70 4297.40 1430.00
10 Austria 1154.10 3523.00 4677.10 2368.9011 Japan 824.90 86.60 911.50 -738.3012 United Kingdom 577.60 2076.40 2654.00 1498.8013 Spain 539.60 919.80 1459.40 380.2014 Netherlands 529.40 1188.60 1718.00 659.2015 Ukraine 506.50 361.50 868.00 -145.0016 Taiwan 481.90 27.80 509.70 -454.1017 United States 441.90 1017.40 1459.30 575.5018 Belgium 441.20 794.30 1235.50 353.1019 Romania 434.90 920.90 1355.80 486.0020 Turkey 318.50 705.50 1024.00 387.00
Source: portal.statistics.sk

22
III. Slovakia´s Bilateral Trade & Investment Relations
3.3 Top 20 export countries (January – October 2012)
Country of destination Total Export (in mil. EUR)
Total Import (in mil. EUR) Total trade Balance of trade
1 Germany 11300.10 8341.00 19641.00 2959.002 Czech Republic 7215.40 4 789.1 12004.50 2426.403 Poland 4152.50 1807.30 5959.80 2345.204 Hungary 3742.10 1785.20 5527.30 1956.805 Austria 3523.00 1154.10 4677.10 2368.906 France 2863.70 1433.70 4297.40 1430.007 Italy 2424.20 1493.40 3917.60 930.708 Russian Federation 2125.50 4805.80 3917.60 -2680.309 United Kingdom 2076.40 577.60 6931.30 1498.80
10 China 1241.50 2954.70 4196.20 -1713.2011 Netherlands 1188.60 529.40 1718.00 659.2012 United States 1017.40 441.90 1459.30 575.5013 Romania 920.90 434.90 1355.80 486.0014 Spain 919.80 539.60 1459.40 380.2015 Belgium 794.30 441.20 1235.50 353.1016 Sweden 778.60 214.90 993.50 563.7017 Turkey 705.50 318.50 1024.00 387.0018 Switzerland 684.80 214.90 899.70 423.3019 Denmark 442.90 183.80 626.70 259.1020 Ukraine 361.50 506.50 868.00 -145.00
Source: portal.statistics.sk

23
III. Slovakia´s Bilateral Trade & Investment Relations
3.3 EU-27 import/export figures (January – October 2012)
Country of Origin/Destination Total Import Total Export BalanceEU-27 31 961,3 43 855,0 11 893,8
Germany 8 341,0 11 300,1 2 959,0Czech Republic 4 789,1 7 215,4 2 426,4Italy 1 493,4 2 424,2 930,7Austria 1 154,1 3 523,0 2 368,9Poland 1 807,3 4 152,5 2 345,2Hungary 1 785,2 3 742,1 1 956,8France 1 433,7 2 863,7 1 430,0United Kingdom 577,6 2 076,4 1 498,8Netherlands 529,4 1 188,6 659,2Belgium 441,2 794,3 353,1Spain 539,6 919,8 380,2Sweden 214,9 778,6 563,7Slovenia 224,2 389,2 165,0Denmark 183,8 442,9 259,1Finland 100,2 143,2 42,9Ireland 115,5 66,7 -48,8Greece 63,4 130,2 66,8Portugal 85,1 122,5 37,5Romania 434,9 920,9 486,0
Bulgaria 85,2 276,0 190,9
Source: portal.statistics.sk

III. Slovakia´s Bilateral Trade & Investment Relations
3.3 Asia & OECD import/export figures(January – October 2012)
24
Country of Origin/Destination Total Import Total Export Balance
Asia 10 281,5 2 745,3 -7 536,2
China 2 954,7 1 241,5 -1 713,2
Korea 4 491,4 80,3 -4 411,0
Taiwan 481,9 27,8 -454,1
Malaysia 186,3 24,6 -161,6
India 149,4 51,1 -98,3
OECD 30 777,4 45 454,1 14 676,7
US 441,9 1 017,4 575,5
Japan 824,9 86,6 -738,3
Turkey 318,5 705,5 387,0
Canada 46,7 116,5 69,8
Source: portal.statistics.sk

25
II. Slovakia's Economy
3.4 Doing Business 2011 (World Bank)
Country Ranking
TAIWAN 33
SLOVAKIA 41
HUNGARY 46
CZECH REPUBLIC 63
POLAND 70

26
III. Slovakia´s Bilateral Trade & Investment Relations
3.5 Taiwanese Trade & Investment Relations in V4 countries
Country Total trade with TAIWAN (USD)
Investment from TAIWAN (USD)
Population of the country
Slovakia 553,2 million 450 million 5,4 mil.
Czech Republic 731 million 375 million 10,6 mil.
Hungary 500 million 400 million 10,0 mil.
Poland 1,1 billion 100 million 38,1 mil.

27
III. Slovakia´s Bilateral Trade & Investment Relations
3.6 Taiwanese Investments in SR
Taiwanese investments in Slovakia represent approx. 450 million EU
- Total trade with Taiwan: €553.2 ml. (January-November 2012)
- Investment from Taiwan: €450 ml.
Foxconn (located in Nitra, 45 ml. EU)
AU Optronics (located in Trenčín, 191 ml. EU)
Delta Electronics (located in Dubnica nad Váhom, 34 ml. EU + 20,5
ml. EU planned new investments from 2013)

28
IV. Taipei Representative Office in Bratislava Economic Division

29
IV. Taipei Representative Office in Bratislava Economic Division
GENERAL TASKS
Promoting economic relations (trade, investment, technical cooperation)
between TW and SR
Collection of trade-related information
Providing trade-related information to relevant companies, associations
Slovak daily news research, analysis & translation
Assistance with trade inquiries
Providing business and procurement opportunities
Meeting with Slovak executive and legislative representatives
Meeting with representatives from relevant institutions, organizations
Presentations at relevant conferences, events

30
IV. Taipei Representative Office in Bratislava Economic Division
SPECIFIC GOALS FOR 2013
Concluding the Memorandum of Understanding
between TW and SR
Offer assistance to Taiwanese delegations
Participation at relevant conferences
Meetings with officials and company representatives

Thank you for your attention!