Embed Size (px)
Citation preview

The Sm-Nd Isotopic Method in the Geochronology Laboratoryof the University of Brasília
S.M.C.L. GIOIA and M.M. PIMENTEL∗
Universidade de Brasília, Instituto de Geociências,
Laboratório de Geocronologia, Cx. Postal 04465, 70910-900 Brasília, DF
Manuscript received November 3, 1998; accepted for publication on November 9, 1999;
contributed by M.M. Pimentel
ABSTRACT
Nd isotopes represent one of the best tools to investigate the processes involved in the evolution
of the continental crust and mantle. This is due mainly to the similar geochemical behaviour of
Sm and Nd, both light rare earth elements, which inhibits their fractionation during most varied
geological processes. In order to carry out crustal evolution studies in central Brazil, the Sm-Nd
isotopic method was implanted at the Geochronology Laboratory of the University of Brasília.
The Sm-Nd separation methodology is basically that described in Richardet al. (1976), with
the addition of some improvements. In this study we describe in detail the methodology used
in Brasília. Precision and accuracy were checked with the international standards such as JB-
3, BCR-1, BHVO-1 and La Jolla, and the following results were found: JB-3 (Nd=15.74 ppm
and Sm=4.28 ppm), BCR-1 (143Nd/144Nd=0.512647±8, Nd=28.73 ppm and Sm=6.66 ppm),
BHVO-1 (Nd=24.83 ppm and Sm=6.2 ppm) and La Jolla (143Nd/144Nd=0.511835±14).
Key words: Sm-Nd method, isotope dilution, ion exchange chromatography, TIMS.
INTRODUCTION
The Sm-Nd geochronometer is based on the decay of147Sm to143Nd, with the emission of anα
particle. The equation below describes the Sm-Nd isotopic evolution for any geological system:
143Nd = 143Ndi + 147Sm(eλt − 1)(1) ,
Equation (1) can also be written as:
143Nd
144Nd=
(143Nd
144Nd
)i
+147Sm
144Nd(eλt − 1)
∗Member of the Academia Brasileira de CiênciasCorrespondence to: S.M.C.L. GioiaE-mail: [email protected]
An. Acad. Bras. Ci., (2000)72 (2)

Sm-Nd ISOTOPIC METHOD 220
The age t of the system can be calculated after the determination of143Nd/144Nd and147Sm/144Nd
ratios. Thermal Ionisation Mass Spectrometry (TIMS) is the most commonly used technique for
the determination of isotopic ratios and also for the determination of REEs concentrations by iso-
tope dilution. The isotopic analysis is the mass spectrometer is preceded by chemical treatment,
involving the addition of a spike solution, dissolution of the sample and the chemical extraction
of Sm and Nd by ion exchange. The extraction of Sm and Nd are accomplished in two stages.
The first stage consists of the bulk separation of lanthanide fraction and in the second stage, the
elements are separated from each other in order to avoid isobaric interference and also the presence
of elements that make the ion beam unstable or that interfere with the ionisation efficiency of Sm
and Nd.
This work reports an efficient method of micro-extraction used for Sm and Nd separation,
based on the method employed by Richardet al. (1976).
METHODOLOGY
Summary of Previous Chemical Separation Methods
Precise and accurate determination of isotopic ratios of metals cannot be achieved if they have not
been efficiently separated from other interfering elements. If traces of elements of the matrix are
present in the aliquot to be analyzed, isobaric interference can happen (Potts 1987). In the pioneer
work of Ketelle & Boyd (1951), the difficulty to obtain efficient separation of each element of the
REE group, was stressed.
The method most commonly applied in the separation of Sm and Nd for isotopic analyses of
geological samples is described in Richardet al. (1976). It firstly uses an ion exchange column
for the REE separation, followed by chromatography of reverse phase in order to separate Sm and
Nd. This second column is packed with polytetrafluorethylene powder (PTFE), impregnated with
DI-(2-etilexil) phosphoric acid (HDEHP).
This method, however, is not capable of separating Ce and Pr, which are present in substantial
amounts in the Nd fraction (White & Patchett 1984). The presence of Ce, for instance, can make the
ion beam unstable if present in large amounts (Whitehouse 1989). Whitehouse (1989) describes a
method capable of reducing the amount of Ce in the Nd fraction, oxidating from Ce3+ to Ce4+ with
KBrO3 and passing the solution through a HDEHP micro-column of approximately 1 cm. Another
method that uses the classic ion exchange chromatography for the separation of the REEs was
introduced by Eugsteret al. (1970) and Dosso & Murthy (1980), where the fractions of Sm and
Nd are separated in a secondary column packed with a cationic resin of the ion ammonium type.
The elements are separated as organometalic complexes formed with the 2-hidroxi-isobutiric acid
(α-HIBA). The method presents good resolution, and the fractions of Sm and Nd are practically
free from other interfering elements. It is, however, a tedious and time-consuming method and the
results do not present significant differences from those obtained by the previous method. Less
An. Acad. Bras. Ci., (2000)72 (2)

Sm-Nd ISOTOPIC METHOD 221
commonly used is the method that uses the anion exchange resin and acetic acid – nitric acid and
methanol as eluent (Hookeret al. 1975, O’Nionset al. 1977). It is more efficient than the one
that uses HDEHP, however it is necessary to work with the142Nd isotope which has142Ce, as an
important isobaric interferent. A fast technique is the chromatography of high resolution Liquid
Chromatography of High Resolution – HPLC (High Performance Liquid Chromatography), and
Ionic Chromatography of High Resolution – HPIC (High Performance Ion Chromatography) which
present high resolution and speed (Cassidy & Chauvel 1989).
Separation Technique Used in Brasília
In Brasília we decided for the method using the HDEHP, with the use of the commercial LN-spec
resin. This also consists of teflon powder impregnated with HDEHP, industrially prepared with a
very small grain size (270 to 150 mesh). It presented very good efficiency for the separation of Ce
and this element is almost totally absent in the Nd fractions (isobaric with142Ce). Another form of
eliminating the interference of Ce is to avoid the use of142Nd isotope for fractionation and isotope
dilution calculations.
Significant amounts of Pr were found in the Nd fraction, however this element does not
represent an interferent when Nd isotopic measurements are done in the metallic form (Nd+)
instead of the oxide form, when small interference with Pr oxides, with masses 158 and 159
happen (Richardet al. 1976). In the same way, samples with high Ba concentrations, can also
present an ineffective separation of Ba in the secondary column, which was proven to the case
in the experiments in this study. However this does not interfere either in the Nd measurement,
because it is ionized before the Nd analysis start due to its lower ionisation temperature (Thirwall
1982). Most of the Ba can be removed during the process of chromatographic separation, eluting
the solution with HNO3 in a cationic resin, before the secondary elution for separation of Sm and
Nd (Verma 1991), or still using the methodology presented by Stray & Dahlgren (1995), which
combines classic chromatography of ionic change and HPIC for the separation and quantification
of REEs in geological samples, based on the method of Le Roex & Watkins (1990).
The separation procedure used in the University of Brasília was efficient for the separation of
Sm and Nd and, although time consuming, the procedure is simple and sufficiently effective. This
is based, firstly, in the separation of the REE group, using a cation resin (primary column) followed
by the extraction of Nd and Sm through a partition separation of phase-reverse (HDEHP), both
using HCl as eluent.
Extraction of Smand Nd of Rock Samples
Sample Digestion
50 to 100 mg of rock sample is mixed with the spike and the mixture is dissolved in teflon bombs
covered with a steel jacket, using 1 mL of distilled conc. HNO3 and 4 mL of concentrated and
An. Acad. Bras. Ci., (2000)72 (2)

Sm-Nd ISOTOPIC METHOD 222
distilled HF. Dissolution is followed by evaporation using a mounted evaporation system with
infrared lamps and teflon capsules. The residue is taken again in HF:HNO3 (4:1) mixture and back
to the oven at ca. 190◦C for 4 days. After complete dissolution, the sample was dried down and 2
mL of concentrated HNO3 were added. The solution was dried down again, a new attack with 6
mL of distilled 6N HCl follows. The solution should be absolutely clear and homogeneous at this
stage. Complete evaporation of the solution sample and addition of 2 mL of distilled 2.5N HCl
follows. During the course of the study the evaporation procedure was modified. Samples are now
evaporated on hot plates, inside clean air cabinets (class-100 air) placed in fume cupboards. This
allows cleaner environment for the evaporation, and also allows the evaporation of a large number
of samples at the same time.
As already observed in other studies (Gettyet al. 1993, Rehkamperet al. 1996 and Sato 1998),
we had successful attacks using Savilex capsules. Some samples, however, such as garnet-rich
rocks and some ultramaphic rocks were not entirely dissolved and needed to be transferred to
bombs.
Separation of the REEs (Calibration of the Primary Column)
A quartz column (i.d. = 8 mm and height = 15 cm) was packed with∼ 2.2g (it evaporates for 60◦C)
or 12 cm of cation resin Bio-Rad AG 50W-X8 200-400 mesh in aqueous solution. The sample
solution is eluted in the column using HCl (Fig. 1). The REE group is collected in the fraction
between 1 and 15 mL of 6N HCl, after elution with 32 mL of 2.5N HCl. Together, with the REEs,
Y and Ba are also collected (Richardet al. 1976). The column is regenerated with ca. 15 mL of
6N HCl and stored in diluted acid solution.
The 2.5N HCl was standardized by titrimetry, with NaCO3 (anhydrous) as base and methyl
orange as indicator.
Separation of Sm and Nd (Calibration of the Secondary Column)
The secondary columns are made of teflon (Savilex ) (i.d. = 5 mm and height = 10 cm) and packed
with LN-Spec resin (liquid resin HDEHP-270-150 mesh powdered teflon coated with di-ethylexil
phosphoric acid). Height of resin bed is 6.5 cm. The REE fractions were totally evaporated and
re-dissolved in 200µL of 0.18N HCl. This solution was loaded into the LN-Spec column. The Nd
fraction was collected in 4 mL of 0.3N HCl after the initial 10 mL of 0.18N HCl (Fig. 2). After the
extraction of Nd, 2 mL of 0.3N HCl were discarded and the Sm fraction was collected in 4 mL of
0.4N HCl, with a flow speed of∼ 1 mL/30 min. The regeneration of the resin was achieved with
6 mL of 6N HCl. The column was conditioned again with the purified 3 mL of H2O (Nanopure)
followed by 2×3 mL of 0.18N HCl.
Chromatographic Columns for Minerals
Smaller columns, where set up for extracting Sm and Nd from low-REE materials.
An. Acad. Bras. Ci., (2000)72 (2)

Sm-Nd ISOTOPIC METHOD 223
Fig. 1 – Separation of the REE group from the main elements of the rock.
As shown in Fig. 3a, the calibration showed the efficiency of the small columns for the
separation of the REEs, using the Bio-Rad AG50W-X8 resin. The resolution of the secondary
column (Fig. 3b) was also very good for separation of Sm-Nd, Ce-Nd, and Sm-Gd.
REE Separation (Primary Column)
The column was packed with cation resin to a height of 7 cm (column of i.d. = 5 mm and height
of 10 cm). The flow speed was set at ca. 1 mL/10 min. 250µL of sample were added and washed
with three times 250µL of 2.5N HCl. 7 mL of 2.5N HCl were discarded and the REE fraction
comes out in 5 mL of 6N HCl. The column was regenerated with 15 mL of 6N HCl. Satisfactory
results have also been obtained working with a larger aliquot of sample (500µL).
Sm-Nd Separation
The column was packed with the LN-spec resin to a height of 7 cm (∼ 100 mg) and 0.5 cm of
anionic resin Bio-Rad 200-400 mesh was added on top. The flow speed was set at 1 mL/50 min.
100µL of sample in 0.18N HCl was added and washed three times with the same amount of 0.18N
HCl. The elution was carried out (Fig. 3b) with 0.18N HCl. The first 6 mL were discarded and Nd
was extracted in 3 mL of 0.3N HCl. Elution of 2 mL of 0.3N HCl, followed and Sm is extracted
in 3 mL of 0.4N HCl. The column is regenerated with 5 mL of 6N HCl.
An. Acad. Bras. Ci., (2000)72 (2)

Sm-Nd ISOTOPIC METHOD 224
Fig. 2 – Sm and Nd separation. The calibration was made with LN-spec resin (HDEHP resin impregnated
in teflon powder of 150-270 mesh). HCl was used as eluent in the calibration.
Preliminary Studies
Partition Coefficient and Separation Factor
The selectivity (Table I) of the liquid HDEHP, using a fine graned (270-150 mesh) powdered teflon
as support, showed better efficiency than using a coarse powder (60-40 mesh), due to the increase
in the ion exchange capacity of the resin. In Fig. 4a, the ion exchange reverse behaviour of HDEHP
resin is observed, where the light REEs are first eluted. For the separation of Ba-La-Ce-Pr-Nd,
the best concentration of HCl to be used proved to be 0.18N. This has been already observed
empirically during the calibration and later on with the determination of the partition coefficient
(Fig. 4b). For the separation of Sm-Eu-Gd the best concentration of HCl proved to be between
0.35 and 0.4N (Fig. 4c and d). In this concentration, a large separation factor (ratio between the
coefficients of distribution of these elements) is observed. The separation of Nd-Sm happens in
concentrations≤0.3N (Fig. 4e and f). The use of stronger acids will result in the elution of some
of the Sm into the Nd fraction.
RESULTS AND DISCUSSION
Analytical Procedure (Mass Spectrometry)
The fraction collected in the secondary column is evaporated with 2 drops of 0.025N H3PO4.
The residue is dissolved in 1µL of 5% distilled HNO3 loaded onto a Re filament of double
An. Acad. Bras. Ci., (2000)72 (2)

Sm-Nd ISOTOPIC METHOD 225
Fig. 3a – Columns calibration for minerals analysis: REEs elution, where was necessary the concentra-
tion correction from blank value obtained in ICP/AES for Ba element.
TABLE I
Chromatographic Columns Resolution
Results
Separation Separation Columns for Rock Analysis Separation Columns for Minerals
Analysis
lanthanide Col. HDEHP 40-60 Col. HDEHP Col. BioRad 8X Col. HDEHP Col. BioRad 8X
mesh 150-270 mesh 200-400 mesh 150-270 mesh 200-400 mesh
La-Ce – 1.42 – 1.2 –
Ce-Nd – 1.0 – 1.3 –
Pr-Nd – – 0.7 –
Nd-Sm 1.5 2.4 – 4.0 –
Sm-Eu – – 2.0 –
Ca-Sr – – 1.1 – 0.6
Rb-Sr – – 2.2 –
filament assembly. The mass spectrometer used was a Finnigan MAT 262 with 7 collectors and
the analyses have been accomplished in static mode. The143Nd/144Nd ratio was normalised using146Nd/144Nd = 0.7219 and the decay constant used was the value revised by Lugmair & Marti
(1978) of 6.54× 10⁻¹²/y. The external precision (Table II) for143Nd/144Nd ratios obtained for the
An. Acad. Bras. Ci., (2000)72 (2)

Sm-Nd ISOTOPIC METHOD 226
Fig. 3b – Columns calibration for minerals analysis: Sm and Nd separation.
different rock standards used varied between 0.0006-0.0016% and the analytical uncertainty for147Sm/144Nd ratio was smaller than 0.19%.
TABLE II
Statistical treatment for the obtained data
Standard SD% *147Sm/144Nd143Nd/144Nd Nd Sm (% error)
BCR-1 0.0007 0.3-0.4 0.7 0.11
BHVO-1 0.0016 0.2 0.03 0.009
JB3 0.0006 0.06 0.8 0.19
SD% = external precision.
∗analytical error for the ratio147Sm/144Nd.
Analytic Control
International rock standards with very well-known Sm and Nd concentrations and Nd isotopic com-
position were analyzed. The analyses of these standards were necessary to test the reproducibility
of the data and mainly to evaluate the reliability of the methodology in rocks of unknown compo-
sition. The standards used (Table III) were: BCR-1 (Ballast-USGS), JB3 (Basalt-GSJ), BHVO-1
(Basalt Hawaiian-USGS), JG2 (Granite-GSJ) and La Jolla.
An. Acad. Bras. Ci., (2000)72 (2)

Sm-Nd ISOTOPIC METHOD 227
Fig. 4 – Determination of lanthanides partition coefficients.
An. Acad. Bras. Ci., (2000)72 (2)

Sm-Nd ISOTOPIC METHOD 228
TABLE III
Recommended values for the used standards (Govindaraju 1994)
Standards La Jolla BCR-1 BHVO-1 JB3 JG2
Nd (ppm) – 28.8 25.2 15.4 25.8
Sm (ppm) – 6.59 6.2 4.27 7.72143Nd/144Nd 0.511860∗ – – – –∗normalised to146Nd/144Nd=0.7219.
The rock standard most frequently used for interlaboratorial comparison is the BCR-1 (Table
IV). Therefore, some analyses of this standard were carried out during this study. They revealed
an average value for the143Nd/144Nd ratio of 0.512632±2 (1σ , n=5). Concentration of Nd and
Sm, were 28.73 ppm and 6.66 ppm respectively being in close agreement with the data obtained
in other laboratories (Table V).
TABLE IV
Values for the analysed standards
Standards La Jolla BCR-1 BHVO-1 JB3 JG2
Nd (ppm) – 28.73 24.83 15.74 25.16
Sm (ppm) – 6.66 6.2 4.28 8.22143Nd/144Nd 0.511835± 14∗ – – – –∗normalised to146Nd/144Nd=0.7219.
The BCR-1 standard, that has been used for so many years, is not available anymore. Therefore,
we also used the BHVO-1 standard (Table IV). However, because BHVO-1 is only a recent rock
standard, not much data from other laboratories are available in the literature.
Nevertheless, results for BCR-1, as well as for BHVO-1, presented good precision and accu-
racy, with the values being comparable to the recommended values.
The results for JB-3 and JG-2 were used in the preliminary evaluation of the method. The
results obtained for standard JB-3 (a basalt) (Table IV) were satisfactory, presenting good precision,
although the Sm and Nd concentrations were consistently 2% below the expected value. The
concentrations results for JG-2 (Table IV) showed much greater scatter around the average, showing
low precision for the final mean value. This value, however, is still statistically the same as the
recommended value. One interpretation for the low precision of the data obtained for JG2 is that
the standard is not as homogeneous (regarding the REE) as the other three rocks standards. This is
only to be expect, because JG2 is a granite standard.
The data for the La Jolla standard in this study tended to be somewhat lower (Table IV) than
the recommended value of 0.511860 (USGS). The average value of 0.511835±14 (1σ ) obtained
An. Acad. Bras. Ci., (2000)72 (2)

Sm-Nd ISOTOPIC METHOD 229
TABLE V
Interlaboratorial Comparison
Laboratories/ Equipment BCR1 BCR1
references 143Nd/144Nd∗ Nd(ppm) Sm(ppm)
This study (UnB) MAT 262 0.512647(8) 28.73(13) 6.66(2)
IG-USP (Kawashitaet al. 1991 VG ISOMASS 354 0.512662(29) 28.52 6.53
PML-Japão (Makobo & Nakamura 1995) 0.512630(3)
RSES-Austrália (Sunet al. 1995) MAT 261 0.512653(5)
(Gladneyet al. 1983) 28.7 6.58
Kobe-Japão (Nakamura 1974) 28.8 6.72
Oxford (Hookeret al. 1975) 29.30 6.67
(Thirlwall 1991) 0.512643
MAINZ (Ito et al. 1987) 0.512647
(Wasserburget al. 1981) 0.512647(20)
∗normalised to146Nd/144Nd=0.7219.
is, however, statistically the same as the recommended if 2σ uncertainties are considered.
The average value obtained for the La Jolla standard is comparable with the values obtained
in other laboratories (Table V). Our mean value of 0.511835±0.000014 is statistically the same as
the expected value of 0.511850 (average of all laboratories).
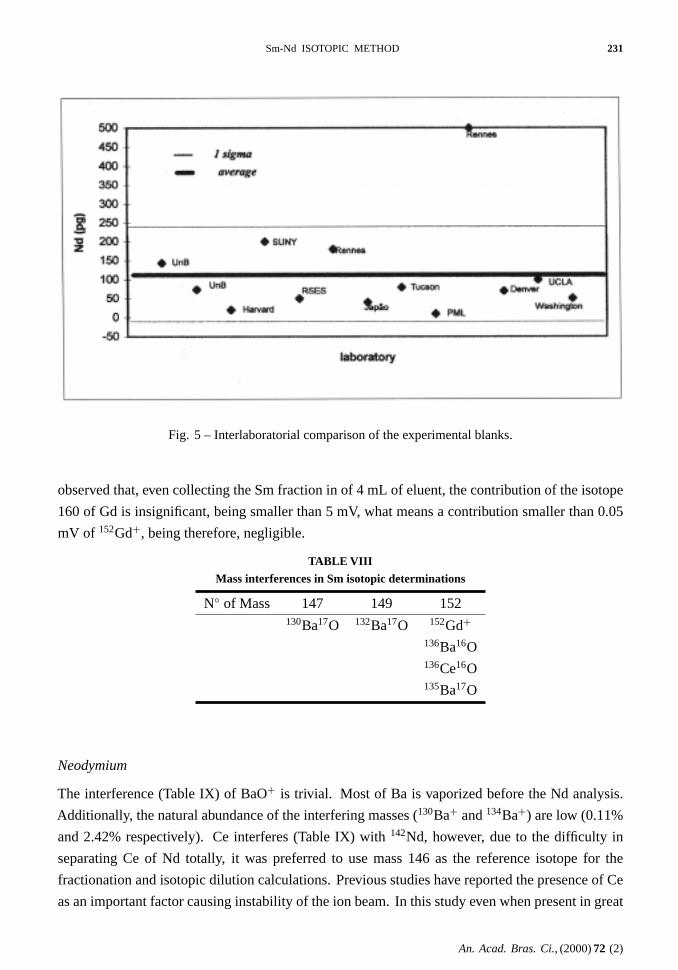
Nd procedure blanks (Table VI) decreased from 385 pg in the beginning of this study to ca.
74 pg towards the end. Nowadays these blanks are commonly around 30 pg. Blanks tend to be
smaller when dissolution is carried out in Savillex capsules.
TABLE VI
Experimental blank data for Nd in the Geochronol-ogy Laboratory of the Brasília
Analyse Nd(pg)
Total Blank 1 (Bomb) 385
Total Blank 2 (Bomb) 144
Total Blank 3 (Bomb) 74
Total Blank 1 (Savilex ) 50
Total Blank of Separation Columns 12-20
The Nd total blanks observed in Geochronology laboratory of the UnB is within the range of
values obtained in other laboratories of the world (Table VII and Fig. 5). As shown in Table VI
An. Acad. Bras. Ci., (2000)72 (2)

Sm-Nd ISOTOPIC METHOD 230
the LN-Spec resin contribute little to the total blank indicating that the largest contribution for the
blank is the memory effect in the dissolution vessels, as well as the reagents.
TABLE VII
Summary of obtained data for total blank in other geochronology laboratories
Laboratory/Reference Blank Nd(pg) Experimental Conditions
HARVARD/(Getty et al. 1993) 20 savilex/acid dissolution
SUNNY/(Hemninget al. 1995) 200 fusion with LiBO2
RSES/(Zhao & McCulloch 1995) 25-100 Bomb/acid dissolution
RSES/(Sunet al. 1995) <50 Bomb/acid dissolution
RENNES/(Chavagnac & Jahn 1996) 180 Savilex and Bomb
acid dissolution
(Mukasaet al. 1994) 40 teflon vial (PFA)
TUCSON/(Patchett & Ruiz 1987) 80 Bomb/acid dissolution
PML/(Maboko & Nakamura 1995) 10 Bomb/acid dissolution
RENNES/(Tourpinet al. 1991) 500 Bomb/acid dissolution
DENVER/(Li 1994) 50-100 Bomb/acid dissolution
UCLA/(DePaolo 1981) 1000 (without purification of HCl)
100
WASHINGTON/(Sorensen & Wilson 1995) 51 Bomb/acid dissolution
Isobaric Interference for Smand Nd
Samarium
136CeO+, 136BaO+ (Table VIII) are isobaric interferents with152Sm+. These interferences can be
suppressed by the average discharge due to the low ionization potential of these species, while the
emission of the152Gd+ is inhibited by its high ionisation potential. In this study it was observed
that the signal of BaO+ is reduced to negligible proportions during the analysis of Sm and its main
contribution, as138BaO+, will only interfere with masses 154 and 155 of Sm, not representing
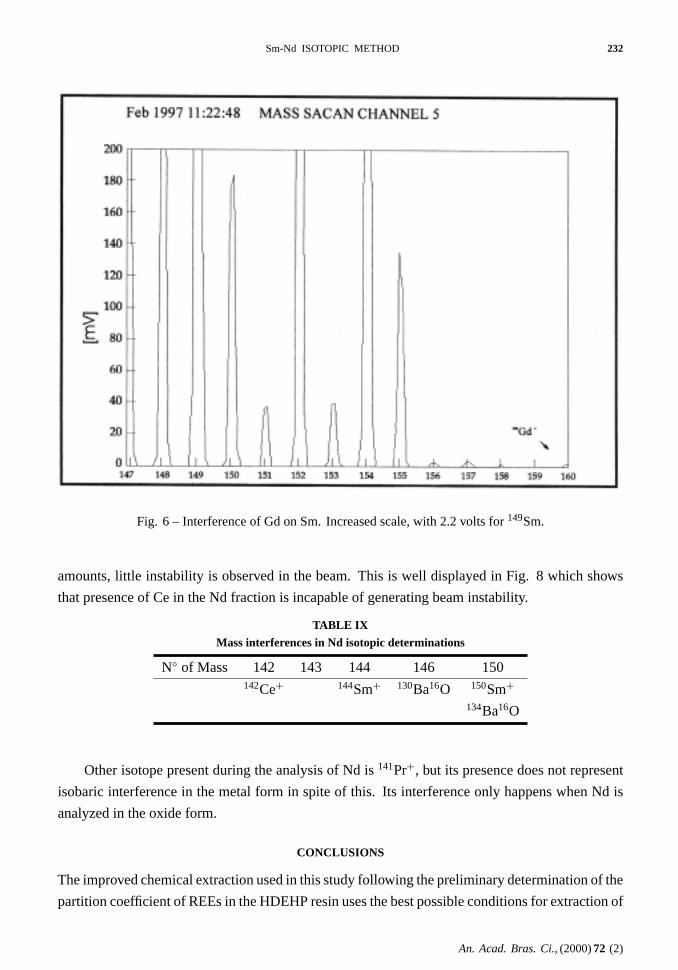
therefore any important interference. Gd was found in inexpressive amounts, as shown in Fig.
6. The amount of Gd is very small and160Gd+ does not appear in the mass scan. To avoid any
possible interference of Gd with152Sm+, used for the concentration calculations, we carried out an
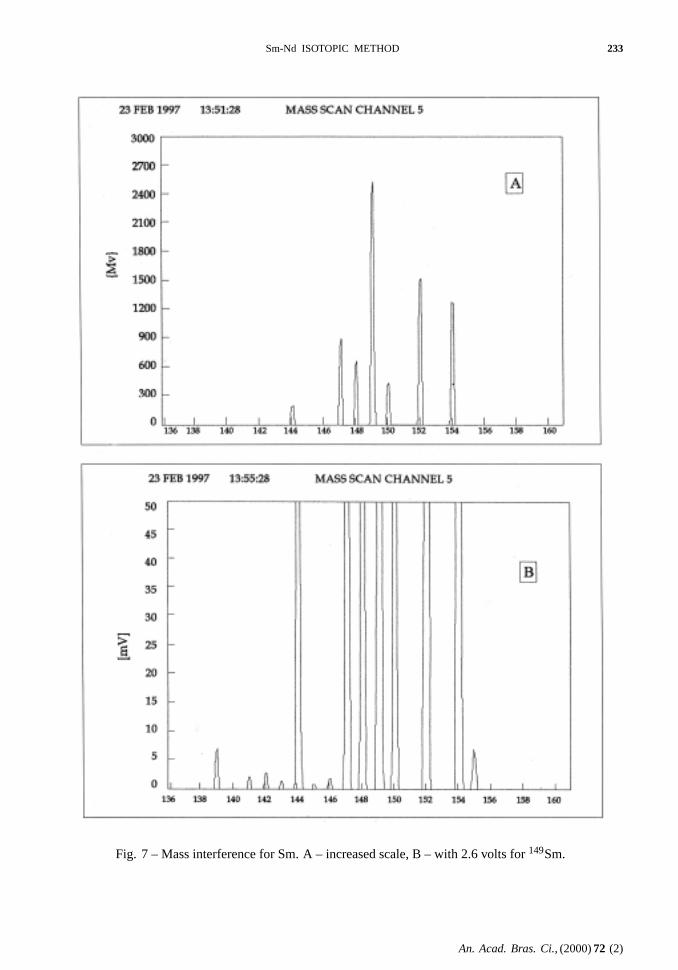
evaluation of the amount of Sm collected in the chromatographic column (Figs. 6 and 7). Maximum
contribution of the mass 155 and detection of the mass 160 is observed when Sm is collected in 4
mL of 0.5N HCl, indicating presence of Gd and/or the presence of oxide species as the144NdO+ or
even144SmO+ (Fig. 7). In the 3 mL Sm fraction an insignificant amount of the mass 155 is present,
which is probably due only to the contribution of the La oxide (139La+ present in the scan). It is
An. Acad. Bras. Ci., (2000)72 (2)
Sm-Nd ISOTOPIC METHOD 231
Fig. 5 – Interlaboratorial comparison of the experimental blanks.
observed that, even collecting the Sm fraction in of 4 mL of eluent, the contribution of the isotope
160 of Gd is insignificant, being smaller than 5 mV, what means a contribution smaller than 0.05
mV of 152Gd+, being therefore, negligible.
TABLE VIII
Mass interferences in Sm isotopic determinations
N◦ of Mass 147 149 152130Ba17O 132Ba17O 152Gd+
136Ba16O136Ce16O135Ba17O
Neodymium
The interference (Table IX) of BaO+ is trivial. Most of Ba is vaporized before the Nd analysis.
Additionally, the natural abundance of the interfering masses (130Ba+ and134Ba+) are low (0.11%
and 2.42% respectively). Ce interferes (Table IX) with142Nd, however, due to the difficulty in
separating Ce of Nd totally, it was preferred to use mass 146 as the reference isotope for the
fractionation and isotopic dilution calculations. Previous studies have reported the presence of Ce
as an important factor causing instability of the ion beam. In this study even when present in great
An. Acad. Bras. Ci., (2000)72 (2)
Sm-Nd ISOTOPIC METHOD 232
Fig. 6 – Interference of Gd on Sm. Increased scale, with 2.2 volts for149Sm.
amounts, little instability is observed in the beam. This is well displayed in Fig. 8 which shows
that presence of Ce in the Nd fraction is incapable of generating beam instability.
TABLE IX
Mass interferences in Nd isotopic determinations
N◦ of Mass 142 143 144 146 150142Ce+ 144Sm+ 130Ba16O 150Sm+
134Ba16O
Other isotope present during the analysis of Nd is141Pr+, but its presence does not represent
isobaric interference in the metal form in spite of this. Its interference only happens when Nd is
analyzed in the oxide form.
CONCLUSIONS
The improved chemical extraction used in this study following the preliminary determination of the
partition coefficient of REEs in the HDEHP resin uses the best possible conditions for extraction of
An. Acad. Bras. Ci., (2000)72 (2)
Sm-Nd ISOTOPIC METHOD 233
Fig. 7 – Mass interference for Sm. A – increased scale, B – with 2.6 volts for149Sm.
An. Acad. Bras. Ci., (2000)72 (2)

Sm-Nd ISOTOPIC METHOD 234
Fig. 8 – Mass interference for Nd. Increased scale, with 2.2 volts for142Nd.
Sm and Nd. The efficiency of the chemical separation appears in the spectrometric analysis where
interferences with other elements are kept to a minimum.
In the mass spectrometry the presence of Ce and mainly Pr in the Nd fraction was observed.
There is absolutely no isobaric interference between Sm and Nd using this procedure. In the
Sm fraction there are detectable amounts of Eu, but this does not represent a problem, because
its isotope do not interfere with the determination of the Sm isotopic ratios. The main isobaric
interference of Sm, Gd, is not detected. Sm and Nd concentrations obtained for the JB3 and BCR-1
rock standards show good accuracy and precision, and isotopic ratio of143Nd/144Nd for BCR-1 and
La Jolla are comparable to the values obtained in other laboratories, demonstrating the reliability
of the methodology used at the University of Brasília.
ACKNOWLEDGEMENTS
The authors thank CAPES and to CNPq, for the financial support. The geochemistry laboratory of
the University of Brasília is also acknowledged for allowing the analyses of REEs by ICP/AES.
An. Acad. Bras. Ci., (2000)72 (2)

Sm-Nd ISOTOPIC METHOD 235
APPENDIX
Notation:
n: normal element
s: spike
i: individual any isotope
j: reference isotope (Nd-146; Sm-152)
u: primary isotope (Nd-150; Sm-149)
v: secondary isotope (Nd-144; Sm-147)
A: atomic mass
iA: atomic mass of an isotope
An: atomic mass of a normal element
As: atomic mass of a spike
W: mass in grams
P: n◦ of atoms
C: conc. in g/mL
F: atomic fraction
Condensed Notation:
RS : ratio of the spike
RN : ratio of the normal element
RM : mix (spike + normal)
�: difference among atomic mass of� = uA−jA; � = vA−jA; � = iA−jA
TABLE I
Isotopic ratios used for isotope dilution calculations in this study
Number Isotopic ratio Nd Isotopic ratio Sm
1 150/146 149/152
2 144/146 147/152
3 143/146
1. Calculation of the Atomic Fraction:
iF = i/j∑i
ij
(1)
2. Representation of the Calculation of the Atomic Mass:
An. Acad. Bras. Ci., (2000)72 (2)

Sm-Nd ISOTOPIC METHOD 236
A =∑i
(i/j × iA)
∑i
ij
(2)
3. Calculation of the Concentrations:
no. of moles = mass of the element/A
mass of the element = C(µg/g)× W (mass in g)
Cn
CS× Wn
WS
× AS
An× jFn
jFS= S1 − T1
T1 −N1(3)
Using the equations (1) and (2) and simplifying the equation above and rearranging for
Cn(µg/g):
Cn = CS × WS
Wn
×∑i
(ijn× iA
)∑i
(ijS × iA
) × S1 − T1
T1 −N1(4)
Calculation of Nd Concentration
Using the equations mentioned, for a mixed spike of Sm and Nd enriched in150Nd (used in the
laboratory of geochronology of UnB), we have:
Nd(µg/g) = Z1 × CS × PS × P.A.
A× Pa
where:
CS = concentration150Nd in the spike = 0.01691492µmols/g
P.A. = atomic mass of Nd (144.24 mol/g)
A = natural abundance of150Nd = 5.6251% (Russet al. 1971 and Wasserburget al. 1981)
Z1 = RS−RMRM−Rn
where:
RM = (146/150)m = measured in the spectrometer and corrected for mass fractionation.
RS = (146/150) of the spike = 0.00464026 (calculated from Table II)
Rn = (146/150) natural = 3.05352835 (calculated from Table I – Wasserburget al. 1981)
Calculation of Sm Concentration
For a mixed spike of Sm and Nd enriched in149Sm:
Sm(µg/g) = Z2 × CS × PS × P.A.
A× Pa
where:
An. Acad. Bras. Ci., (2000)72 (2)

Sm-Nd ISOTOPIC METHOD 237
RM = (147/149) measured in the spectrometer and corrected for mass fractionation
RS = (147/149) in the spike = 0.0033163 (calculated from Table V)
Rn = (147/149) natural = 1.088396 (calculated from Table IV – Wasserburget al. 1981)
CS = concentration of the149Sm in the spike = 0.01334888µmols/g
P.A. = 150.35 mol/g
A = natural abundance of the149Sm = 13.8504%
4. Correction for Mass Fractionation
Thermal ionisation sources, involving the evaporation of the sample starting from a warm filament
is subject to the effect of mass fractionation (Potts 1987).
The exact mathematical form of the fractionation law, that describes the instrumental mass
fractionation by thermal ionisation is not very well known. The isotope chosen for the correction
of the mass fractionation should have great mass difference and their ratio should be also relatively
a close to the unit to minimize uncertainties. For Nd the best choice is150Nd/142Nd and the second
best is146Nd/142Nd (Wasserburget al. 1981). The factor of fractionation of the isotope of Nd for
unit of atomic mass, it is defined as (Wasserburget al. 1981):
αL(u, v) = [(RNuv/RMuv)− 1]muv
(Linear law) (5)
αp(u, v) = [RNuv/RMuv]1
muv − 1 (Power law) (6)
αE(u, v) = ln[RNuv/RMuv]mjln[mu/mv] (Exponential law) (7)
For cases where fractionation is small, these three different laws supply the same corrected values
for the required accuracy. However, for cases in which the fractionation is important, each law will
supply a different value for the corrected values depending on the choice of the isotope (u,v) used
to calculate the correction.
For Nd and presumably also for Sm, the law of exponential fractionation seems to be better to
correct the instrumental fractionation than the linear or power law. Therefore, the use of linear or
power laws can introduce significant errors in the ratio143Nd/144Nd, and this only happens when
running a highly fractional analysis. This effect can be minimised by the choice of a different pair of
isotope for the normalisation. When146Nd/142Nd is used the effect in143Nd/144Nd is insignificant;
however, for this normalisation, significant errors can be introduced in150Nd/144Nd. Also when we
compare data from different laboratories that normalise in a different way, the use of the linear and
power laws introduce small, but significant errors. If the data collected have a small fractionation
(−0.001< α < +0.001), the choice of the fractionation law is not necessary.
The fractionation law was suggested in Russellet al. (1978) for the analysis of Ca and that
An. Acad. Bras. Ci., (2000)72 (2)

Sm-Nd ISOTOPIC METHOD 238
also used the Rayleigh fractionation law.
T1 = M1 × (1 + f ×�1) (8)
that corresponds to the equation of the Linear law. Solving for f (Boelrijk 1968):
f = N2 × S1 −N1 × S2 −M2 × (S1 −N1)+M1 × (S2 −N2)
M2 × (S1 −N1)×�2 −M1 × (S2 −N2)×�1(9)
Nd isotope – Application in the UnB Laboratory
Reference: 146
Primary: 150
Secondary: 144
TABLE II
Ratio used for fractionation correction.
Ratios No.
150/146 1
144/146 2
143/146 3
f = {(144146)n × (150
146)S − (150146)n × (144
146)S − (144146)M [(150
146)S − (150146)n] + (150
146)M × [(144146)S − (144
146)n]}{(144
146)M × [(150146)S − (150
146)n] × (144− 146)− (150146)M × [(144
146)S − (144146)n] × (150− 146)}
Linear law
T3 = M3 × (1 + f ×�3)
T2 = M2 × (1 + f ×�2)
where:
M3 = 143/146
M2 = 144/146
�3 = −3
�2 = −2
N3 = T3 + (T3 − S3)× (T1 −N1)
(S1 − T1)
N2 = T2 + (T2 − S2)× (T1 −N1)
(S1 − T1)
An. Acad. Bras. Ci., (2000)72 (2)
Sm-Nd ISOTOPIC METHOD 239
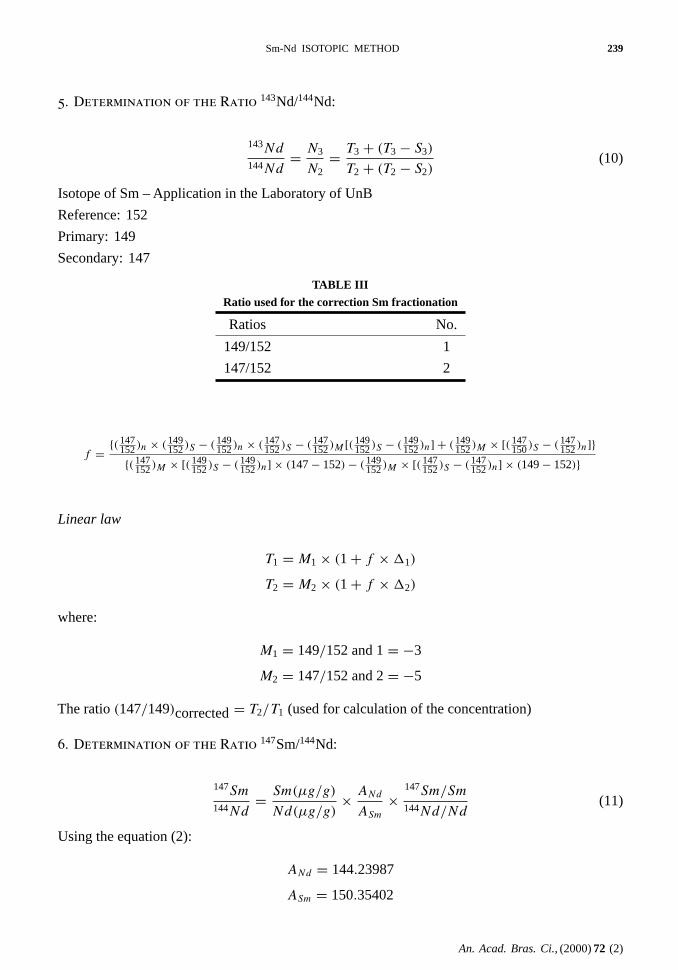
5. Determination of the Ratio 143Nd/144Nd:
143Nd
144Nd= N3
N2= T3 + (T3 − S3)
T2 + (T2 − S2)(10)
Isotope of Sm – Application in the Laboratory of UnB
Reference: 152
Primary: 149
Secondary: 147
TABLE III
Ratio used for the correction Sm fractionation
Ratios No.
149/152 1
147/152 2
f = {(147152)n × (149
152)S − (149152)n × (147
152)S − (147152)M [(149
152)S − (149152)n] + (149
152)M × [(147150)S − (147
152)n]}{(147
152)M × [(149152)S − (149
152)n] × (147− 152)− (149152)M × [(147
152)S − (147152)n] × (149− 152)}
Linear law
T1 = M1 × (1 + f ×�1)
T2 = M2 × (1 + f ×�2)
where:
M1 = 149/152 and 1= −3
M2 = 147/152 and 2= −5
The ratio(147/149)corrected= T2/T1 (used for calculation of the concentration)
6. Determination of the Ratio 147Sm/144Nd:
147Sm
144Nd= Sm(µg/g)
Nd(µg/g)× ANd
ASm×
147Sm/Sm
144Nd/Nd(11)
Using the equation (2):
ANd = 144.23987
ASm = 150.35402
An. Acad. Bras. Ci., (2000)72 (2)

Sm-Nd ISOTOPIC METHOD 240
Using the values of the tables I, IV and VII:
144Nd/Nd = 1/(3.690111− 143/144)
143/144= 0.512 or calculated individually for each sample.147Sm/Sm = 0.5651235/3.7488669= 0.150745
7. Tables of Used Data
The used data for isotopic dilution calculations and Mass Fractionation, are shown in Tables I to
VII.
8. Calculation of the Amount of Spike to be Mixed with the Sample
A correctly spiked mixture should have the150Nd/146Nd ratio close to 1:
Spike
Enriched in150Nd = 0.01691492 moles/g150Nd=[150Ndspike]µmoles atomic× A150 (mass of the isotope 150 of Nd)
using data on Table VII:150Nd=0.01691492× 149.9209 = 2.5359µg/mL
Sample
TABLE I
Isotopic Ratios for natural Nd used for Isotope DilutionCalculations.
Ratio Composition∗ Composition∗∗
142/146 1.581703 1.581712
143/146 0.709269 0.710131
144/146 1.385291 1.385245
145/146 0.48266 0.482642
146/146 1 1
148/146 0.334648 0.334639
150/146 0.32749 0.327479
Total 5.821061 5.821852∗Oxford
∗∗Wasserburget al. 1981.
An. Acad. Bras. Ci., (2000)72 (2)

Sm-Nd ISOTOPIC METHOD 241
% 146Nd natural (Table III) = 17.1767
[146Nd]µg/mL = [Nd]µg/mL×17.1767/145.913126
Factor of Proportion (f) = [150Ndspike]µg/mL/[146Ndamostra]µg/mL (16)
The amount of spikePs(mg) is:
Pa = f × Ps
Pa = (21.5420/[Nd])× Ps (17)
where,Pa = weight of the sample (mg) andPs = weight of the spike (mg).
TABLE II
Isotopic Ratios for Nd in mixed Spike, calibrated againstwith the Blankwash-Tech and BCR-1 rock standards
Ratio ∗Composition Error(±)150/144 196.278416 0.01443186
142/144 0.833347772 1.9776.10−5
143/144 0.49491642 8.5537.10−6
146/144 0.91078328 3.0677.10−5
148/144 0.73598967 3.5142.10−5
145/144 0.43648743 1.1085.10−5
∗Spike previously calibrated in the laboratory of Montreal.
TABLE III
Isotopic Abundance for Nd (%)
Isotopic ∗∗Spike Natural∗
142 0.415241 27.1686
143 0.24667 12.1977
144 0.498281 23.7940
145 0.217493 8.2902
146 0.453826 17.1767
148 0.366730 5.7480
150 97.801821 5.6250
Total 99.999999 100.0001∗Wasserburget al. 1981
∗∗Montreal.
An. Acad. Bras. Ci., (2000)72 (2)

Sm-Nd ISOTOPIC METHOD 242
TABLE IV
Isotopic Ratio for natural Sm used in the Isotopic Dilution
Ratio Composition∗ Composition∗∗
144/152 0.1164211 0.1164212
147/152 0.5651235 0.5651235
148/152 0.4230413 0.4230413
149/152 0.519226 0.5192261
150/152 0.2768503 0.2768391
152/152 1 1
154/152 0.8482157 0.8482157
Total 3.7488779 3.7488669∗Oxford.
∗∗Wasserburget al. 1981.
TABLE V
Isotopic Ratio for natural Nd in mixed Spike, cali-brated using Blankwash-tech and BCR-1 rock stan-dards.
Ratio ∗Composition Error(±)149/152 145.301196 0.00765741
147/152 0.4818679 3.65.10-5
150/152 0.81790385 3.5771.10-5
148/152 0.76123316 5.3087.10-5
144/152 0.04911417 2.0569.10-5
154/152 0.48525055 1.633.10-5∗Montreal.
REFERENCES
Boelrijk NAIM. 1968. A general formula for “double” isotope dilution analysis.Chem Geol 3: 323-325.
Cassidy RM & Chauvel C. 1989. Modern liquid chromatographic techniques for the separation of Nd
and Sr for isotopic analyses.Chem Geol 74: 189-200.
Chavagnac V & Jahn B. 1996. Coesite-bearing eclogites from the Bixiling Complex, Dabie Mountains,
China: Sm-Nd ages, geochemical characteristics and tectonic implications.Chem Geol 133: 29-51.
DePaolo DJ. 1981. Neodymium isotopes in the Colorado front range and crust-mantle evolution in the
An. Acad. Bras. Ci., (2000)72 (2)

Sm-Nd ISOTOPIC METHOD 243
TABLE VI
Isotopic Abundance for Sm (%)
Isotope ∗∗Spike Normal∗
144 0.032985 3.1055
147 0.323626 15.0745
148 0.51125 11.2845
149 97.585324 13.8502
150 0.54931 7.3846
152 0.671607 26.6747
154 0.325898 22.6259
Total 100.032985 99.9999∗Wasserburget al. 1981.
∗Montreal.
TABLE VII
Atomic mass (Wapstra & Bos 1977)
Isotope Nd Isotope Sm
142 141.907731 144 143.912009
143 142.909823 147 146.914907
144 143.910096 148 147.914832
145 144.912582 149 148.917193
146 145.913126 150 149.917285
148 147.916901 152 151.919741
150 149.920900 154 153.922218
Proterozoic.Nature 291: 193-196.
Dosso L & Murthy VR. 1980. A Nd isotope study of the Kerguelen islands: inferences on enriched
oceanic mantle soucers.Earth Planet Sci Lett 48: 268-276.
Eugster O, Tera F, Bernett DS & Wasserburgh GJ. 1970. Isotopic Composition of Gd and Neutron-
Capture Effects in some Meteorites.J Geophys Res 75: 2753-2768.
Getty SR, Selverstone J, Wernicke BP, Jacobsen SB, Aliberti E & Lux DR. 1993. Sm-Nd dating of
multiple garnet growth events in an arc-continent collision zone, northwestern U.S. Cordillera.Contrib
Mineral Petrol 115: 45-57.
Gladney ES, Burns CE & Roelandts I. 1983. 1982 copilation of elemental concentrations in eleven
United States Geological survey rock standards.Geostand Newslett 7: 3-226.
Govindaraju K. 1994. Compilation of working values and sample description for 383 geostandards.
An. Acad. Bras. Ci., (2000)72 (2)

Sm-Nd ISOTOPIC METHOD 244
Geostand Newslett (special Issue), 18: 1-158.
Hemning SR, McLennan SM & Hanson GN. 1995. Geochemical and Nd/Pb isotopic evidence of the
Early Proterozoic Virginia Formation, Minnesota. Implications for the Tectonic Setting of the Animikie
Basin.J Geol 103: 147-168.
Hooker PJ, O’Nions RK& Pankhurst RJ. 1975. Determination of rare-earth elements in USGS standard
rocks by mixed-solvente ion exchange and mass-spectrometric isotope dilution.Chem Geol 16: 189-
196.
Ito E, White WM & Göpel C. 1987. The O, Sr, Nd and Pb isotope geochemistry of MORB.Chem Geol
62: 157-176.
Kawashita K, Diaz M & Tassinari CCG. 1991. 3◦ Congresso de Geoquímica. S. Paulo. vol II: 442-446.
Ketelle BH & Boyd GE. 1951. Further studies of the Ion-Exchange Separation of the rare earths.J Am
Chem Soc 73: 1862-1863.
Le Roex AP & Watkins RT. 1990. Analysis of rare-earth elements in geological samples by gradient
chromatography: An alternative to ICP and INAA.Chem Geol 88: 151-162.
Li X. 1994. A comprehensive U-Pb, Sm-Nd, Rb-Sr and40Ar-39Ar geochronological study on Guidong
Granodiorite, southeast China: records of multiple tectothermal events in a single pluton.Chem Geol
115: 283-295.
Lugmair GW &Marti K. 1978. Lunar inicial143Nd/144Nd: Differencial evolution of the lunar crust and
mantle.Earth Plan Sci Lett 39: 349-357.
Maboko MAH&Nakamura E. 1995. Sm-Nd garnet ages from the Uluguru granulite complex of Eastern
Tanzania: further evidence for post-metamorphic slow cooling in the Mozambique belt.Precamb Res
74: 195-202.
Mukasa SB, Flower MFJ &Miklius A. 1994. The Nd-, Sr- and Pb-isotopic character of lavas from Taal,
Laguna de Bay and Arayat volcanoes, southwestern Luzon, Philippines: implications for arc magma
petrogenesis.Tectonophysics 235: 205-221.
NakamuraN.1974. Determination of REE, Ba, Fe, Mg, Na and K in carbonaceous and ordinary chondrites.
Geochim Cosmochim Acta 38: 757-775.
O’Nions RK, Hamilton PJ & Evensen NM. 1977. Variations in143Nd/144Nd and87Sr/86Sr ratios in
oceanic basalts.Earth Plan Sci Lett 34: 13-22.
Patchett PJ & Ruiz J. 1987. Nd isotopic ages of crust formation and metamorphism in the Precambrian
of eastern and southern Mexico.Contrib Mineral Petrol 96: 523-528.
Potts PJ. 1987.Handbook of Silicate Analysis. London. Blakie. 622p.
Rehkamper M, Gartner M, Gale SJG & Goldstein SL. 1996. Separation of Ce from other Rare-earth
Elements with Application to Sm-Nd and La-Ce Chronometry.Chem Geol 129: 201-208.
Richard P, Shimizu N & Allègre CJ. 1976. 143Nd/146Nd A Natural Tracer: An Application to Oceanic
An. Acad. Bras. Ci., (2000)72 (2)

Sm-Nd ISOTOPIC METHOD 245
Basalts.Earth Plan Sci Lett 31: 269-278.
Russ GP, Burnett DS, Lingeufelter RE & Wasserburg GJ. 1971. Neutron capture on149Sm in lunar
samples.Earth Plan Sci Lett 13: 53-60.
Russell WA, Papanastassiou DA & Tombrello TA. 1978. Ca isotope fractionation on the Earth and
other solar systems materials.Geochim Cosmochim Acta 42: 1075-1090.
Sato K. 1998.Evolução crustal da plataforma sul americana, com base na geoquímica isotópica Sm-Nd.
São Paulo. 297p. (Tese de Doutorado. Instituto de Geociências da USP).
Sorensen HS & Wilson R. 1995. A strontium and neodymium isotopic investigation of the Fongen-
Hyllingen layered intrusion, Norway.J Petrol 36(1): 161-187.
Stray H&Dahlgren S. 1995. A combined classical ion-exchange and HPIC procedure for the separation
of Nd and Sm for isotopic analysis of geological samples.Chem Geol 125: 233-238.
Sun S, Warren RG & Shaw RD. 1995. Nd isotope study of granites from the Arunta Inlier, central
Australia: constraints on geological models and limitation of the method.Precamb Res 71: 301-314.
Thirwall MF. 1982. A triple-filament method for rapid and precise analysis of rare-earth elements by
isotope dilution.Chem Geol 35: 155-166.
Thirwall MF. 1991. Long-term reproducibility of multicollector Sr and Nd isotope ratio analysis.Chem
Geol 94: 85-104.
Tourpin S, Gruau G, Blais S & Fourcade S. 1991. Resetting of REE, and Nd and Sr isotopes during
carbonization of a komatiite flow from Finland.Chem Geol 90: 15-29.
Verma SP. 1991. Usefulness of liquid chromatography for determination of thirtheen rare-elements in rocks
and minerals.Lanthanide Actinide Res 3: 237-257.
Wapstra AH & Box K. 1977. The 1977 atomic mass evaluation in four parts; Part I. Atomic mass table.
At Data Nucl Data Tables 19: 177-214.
Wasserburg GJ, Jacobsen SB, DePaolo DJ, McCulloch MT & Wen T. 1981. Precise determination
of Sm/Nd ratios, Sm and Nd isotopic abundances in standard solutions.Geochim Cosmochim Acta 45:2311-2323.
White WM& Patchett J. 1984. Hf-Nd-Sr isotopes and incompatible element abundances in island arcs:
implications for magma origins and crust-mantle evolution.Earth Plan Sci Lett 67: 167-185.
Whitehouse MJ. 1989. Sm-Nd Evidence for Diachronous Crustal Accretion in the Lewisian Complex of
Northwest Scotland.Tectonophysics 161: 245-256.
Zhao J & McCulloch MT. 1995. Geochemical and Nd isotopic systematics of granites from the Arunta
Inlier, central Australia: implications for Proterozoic crustal evolution.Precamb Res 71: 265-299.
An. Acad. Bras. Ci., (2000)72 (2)