Embed Size (px)
Citation preview
© European Central Bank, 2012
AddressKaiserstrasse 29
60311 Frankfurt am Main, Germany
Postal addressPostfach 16 03 19
60066 Frankfurt am Main, Germany
Telephone+49 69 1344 0
Internethttp://www ecb europa eu
Fax+49 69 1344 6000
All rights reserved.
Any reproduction, publication and reprint in the form of a different publication, whether printed or produced electronically, in whole or in part, is permitted only with the explicit written authorisation of the ECB or the authors.
Information on all of the papers published in the ECB Occasional Paper Series can be found on the ECB’s website, http://www.ecb.europa.eu/pub/scientific/ops/date/html/index.en.html. Unless otherwise indicated, hard copies can be obtained or subscribed to free of charge, stock permitting, by contacting [email protected]
ISSN 1607-1484 (print)
ISSN 1725-6534 (online)
3ECB
Occasional Paper No 137
September 2012
CONTENTS
ABSTRACT 4
ACKNOWLEDGEMENTS 5
EXECUTIVE SUMMARY 6
1 INTRODUCTION 8
2 REVIEW OF RELATED LITERATURE 9
3 SCOPE AND DATA COLLECTION 10
3.1 Retail payment instruments 10
3.2 Relevant stakeholders 12
3.3 Data collection and sample
coverage 12
4 METHODOLOGY 15
4.1 The concept of social and private
costs 15
4.2 Direct and indirect costs and
allocation keys 17
5 SIGNIFICANCE OF SAMPLE
AND DESCRIPTIVE STATISTICS 20
6 COSTS OF RETAIL PAYMENT
INSTRUMENTS 25
6.1 Aggregated social and private
costs 25
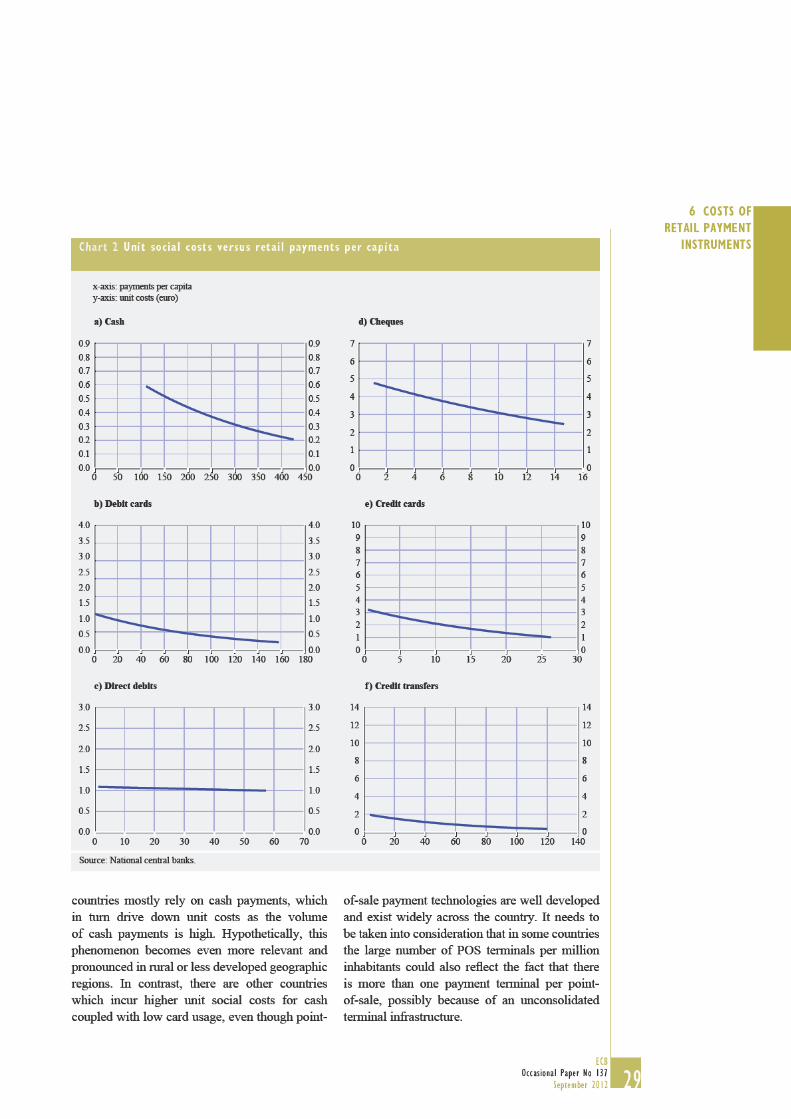
6.2 Unit social costs and economies
of scale of payment instruments 27
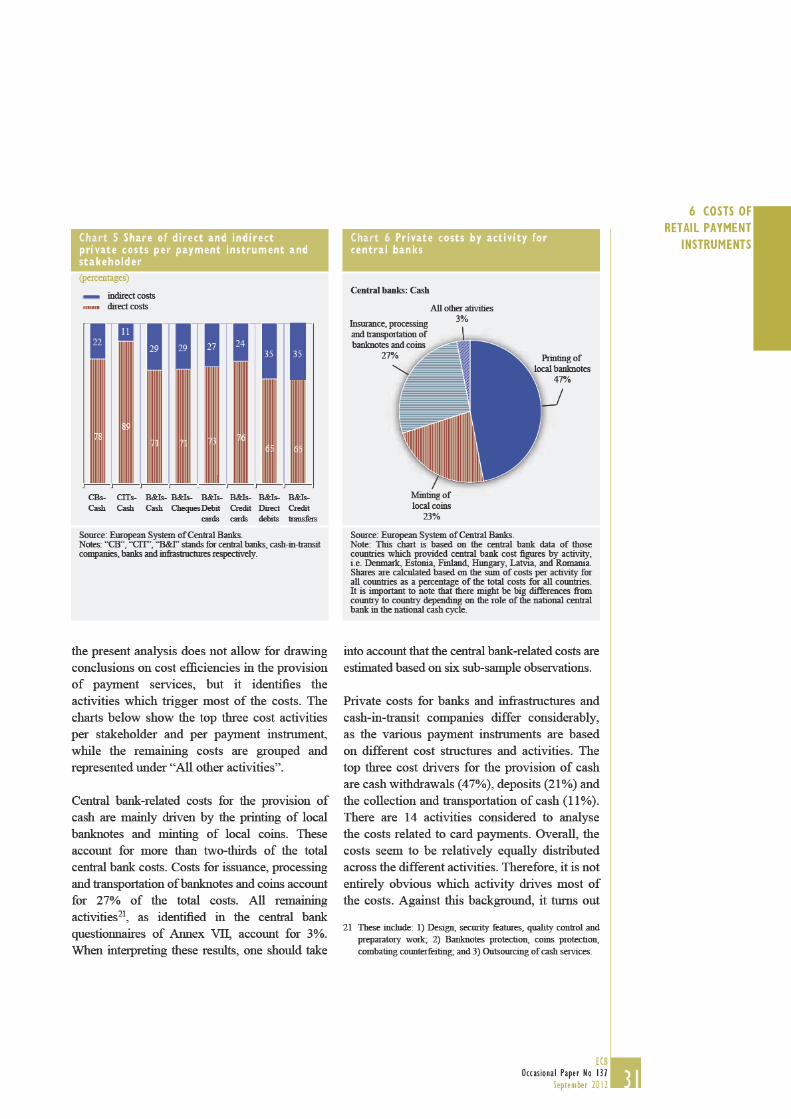
6.3 Direct versus indirect costs
and payment activities 30
6.4 Extrapolation and international
cost comparison of retail
payment instruments 35
6.5 Similarities, distances and
clusters of retail payment markets 38
6.6 Household survey 41
7 CONCLUSION 43
ANNEX 44
REFERENCES 48
CONTENTS
4ECB
Occasional Paper No 137
September 2012
ABSTRACT
The European Central Bank (ECB) carried out a
study of the social and private costs of different
payment instruments with the participation
of 13 national central banks in the European
System of Central Banks (ESCB). It shows that
the costs to society of providing retail payment
services are substantial. On average, they
amount to almost 1% of GDP for the sample of
participating EU countries. Half of the social
costs are incurred by banks and infrastructures,
while the other half of all costs are incurred
by retailers. The social costs of cash payments
represent nearly half of the total social costs,
while cash payments have on average the lowest
costs per transaction, followed closely by debit
card payments. However, in some countries,
cash does not always yield the lowest unit costs.
Despite countries’ own market characteristics,
the European market for retail payments can
be grouped into fi ve distinct payment clusters
with respect to the social costs of payment
instruments, market development, and payment
behaviour. The results from the present study
may trigger a constructive debate about which
policy measures and payment instruments
are suitable for improving social welfare and
realising potential cost savings along the
transaction value chain.
Keywords: Social costs, private costs,
effi ciency, payment instruments
JEL classifi cation: D12, D23, D24, O52
5ECB
Occasional Paper No 137
September 2012
ACKNOWLEDGEMENTS
ACKNOWLEDGEMENTS
We would like to thank all of the central banks that participated in the study. In particular, we would
like to acknowledge the valuable contributions and expert insights of the following colleagues from
the ECB and ESCB national central banks.
Danmarks Nationalbank Mr Anders Mølgaard Pedersen
Eesti Pank Ms Tiina Soosalu
Central Bank of Ireland Ms Margaret Daly
Bank of Greece Mr Panagiotis Fotopoulos
Banco de España Mr Miguel Perez Garcia De Mirasierra
Banca d'Italia Mr Guerino Ardizzi
Latvijas Banka Ms Anda Zalmane
Magyar Nemzeti Bank Ms Anikó Turján
De Nederlandsche Bank Ms Nicole Jonker
Banco de Portugal Ms Maria Tereza Cavaco
Banca Naţională a României Ms Denisa Iatan
Suomen Pankki Mr Kari Takala
Sveriges Riksbank Mr Björn Segendorf
European Central Bank Ms Cécile Bécuwe
6ECB
Occasional Paper No 137
September 2012
EXECUTIVE SUMMARY
The objective of this study is to enhance the
general understanding of the social and private
costs of different retail payment instruments
from a European perspective, with the aim of
helping policy-makers, banks and retailers
promote effi cient payments. The study was
carried out by the ECB with the participation of
13 national central banks of the ESCB. 1
The existing literature is limited. In the past,
some central banks have carried out their own
national-level cost studies.2 At present, however,
there is no comprehensive analysis or empirical
evidence at the European level.
The present study applies the concept of the
private and social costs associated with payment
transactions. Private costs refer to all the costs
incurred by the relevant individual parties in
the payment chain. Social costs are the costs
to society, refl ecting the use of resources in the
production of payment services; that is, the total
cost of production excluding payments, e.g.
fees, tariffs, etc., made to other participants in
the payment chain. In this sense, social costs
measure the sum of the pure costs of producing
payment instruments incurred by the different
stakeholders in the payments market. The
payments considered in the study are cash,
cheque, debit and credit card, direct debit and
credit transfer payments up to €50,000, which
account for at least 5% of all payments in terms
of volume in each country. Furthermore, this
study explores the costs of central banks, banks
and infrastructures, cash-in-transit companies
and retailers; however, the costs incurred by
consumers and households are not considered.
The key results of the study can be summarised
as follows:
The social costs of retail payment instruments 1.
are substantial and amount to €45 billion,
i.e. 0.96% of GDP for the sample of
13 participating EU countries. When
the sample results from the participating
countries are extrapolated to 27 EU Member
States, the social costs of retail payment
instruments are comparable to those of the
sample countries, being close to 1% of GDP
or €130 billion. These results are robust
against the estimation method used.
Half of the social costs are incurred by banks 2.
and infrastructures, while 46% of all social
costs are incurred by retailers. The social
costs related to central banks and cash-in-
transit companies account for 3% and 1%
respectively.
Retailers incur higher private costs than do 3.
banks or infrastructures, as they face higher
external costs to be paid to other payment
chain participants.
Due to the relatively high usage of cash, the 4.
social costs of cash are nearly half of the
total social costs.
On average, cash payments show the lowest 5.
social costs per transaction, followed closely
by debit card payments.
In some countries, cash does not always 6.
yield the lowest unit social costs. In fact, in
more than one-third of the sample countries,
debit card transactions have lower unit costs
than cash transactions.
Economies of scale seem to be present in 7.
the provision of retail payment services for
almost all payment instruments.
1 The following 13 central banks have been actively participating
in the study: Danmarks Nationalbank, Eesti Pank, Central Bank of Ireland, Bank of Greece, Banco de España, Banca d´Italia, Latvijas Banka, Magyar Nemzeti Bank, De Nederlandsche Bank, Banco de Portugal, Banca Naţională a României, Suomen Pankki, and Sveriges Riksbank.
2 Danmarks Nationalbank, Magyar Nemzeti Bank, Suomen Pankki
and Sveriges Riksbank have published their national reports on
the costs of retail payment instruments (respectively Danmarks
Nationalbank, 2012; Turján et al , 2011; Nyandoto, 2011; and
Segendorf and Jansson, 2012) Other participating central banks
indicated their intention to also publish a report from their
national perspective
7ECB
Occasional Paper No 137
September 2012
EXECUTIVE
SUMMARYThe retail payment industry is characterised 8.
by a relatively high proportion of indirect
costs, in particular for non-cash payment
instruments.
Recent data from Denmark and Hungary 9.
suggest that on average about 0.2% of GDP
would need to be added to the social costs of
retail payments if the costs for households
and consumers were considered.3
Each of the countries participating in the 10.
cost study, like every EU27 Member State,
has a unique retail payment market with
its own market characteristics. In a cross-
country comparison, however, some payment
markets appear to be more similar or closer
to each other than to other payment markets
with respect to the social costs of payment
instruments, market development, and
payment behaviour. In fact, the European
market for retail payments can be grouped
into fi ve payment clusters.
With these fi ndings, the study intends to provide
a sound basis and framework for further policy
making and conclusions in relation to the
execution and promotion of cost-effi cient retail
payments for society. The hope is that the results
will trigger a fruitful and constructive debate
about which policy measures and payment
instruments are suitable for improving social
welfare and realising potential cost savings
along the transaction value chain.
3 The social costs of payment instruments to households and
consumers are beyond the scope of the current study
8ECB
Occasional Paper No 137
September 2012
1 INTRODUCTION
Ensuring the smooth functioning of payment
systems and preserving fi nancial stability while
promoting the effi ciency of payment methods
and systems, thus contributing to the optimal
allocation of resources in the economy, are
among central banks’ primary responsibilities.
Gaining a better understanding of how to make
retail payment instruments cost effi cient is
of interest not only to central banks, but also
to commercial banks, retailers, companies
and the general public. To this end, the
European Central Bank (ECB), in close
cooperation with 13 National Central Banks in
the European System of Central Banks (ESCB),
conducted a study with a view to estimating
and analysing the social and private costs of
different retail payment instruments. The goal
is to minimise the total social cost of making
payments without sacrifi cing the availability or
quality of the services. From this perspective,
the social costs of payment instruments relate to
the resource costs incurred by all stakeholders
(i.e. consumers, retailers, companies, banks,
interbank infrastructures, central banks and
cash-in-transit companies) in the course of
all activities along the payment transaction
chain. However, the measurement of social and
private costs is a very complex task, entailing
certain diffi culties and a signifi cant number of
assumptions and simplifi cations. This study
uses a unique multi-country data set based on
the information given in responses to different
questionnaires for each individual stakeholder
and for each retail payment instrument.
The existing literature shows that, in spite
of recent efforts, there is still only limited
knowledge and information available for
making valid comparisons of the costs of
making payments across European countries.
This study attempts to fi ll this void by providing
a consistent and comprehensive cross-country
analysis. It does not consider the differences in
the benefi ts associated with different payment
instruments. Instead, the study provides a
one-year, one-off snapshot of the (total and
average) social and private costs of different
payment instruments. This represents a fi rst step
towards a more dynamic approach to analysing
the rapidly moving European payment market.
In particular, the aim of this work is to analyse
the true cost elements associated with different
payment instruments that are incurred along the
payment chain by the major stakeholders, taking
a European perspective.
The present European study builds on the
existing national studies in a number of ways.
It supports and reconfi rms previous fi ndings.
It also allows for international comparisons of
social costs over time where previous national
studies are available. It examines the social
and private costs of payment instruments for
a number of European countries for which
relevant and reliable data was previously
unavailable. It presents current information
on the social and private costs of payment
instruments that is easily comparable across the
13 countries participating in the study. After
making some simplifying assumptions, the data
from the present study allows for extrapolating
the sample results to the level of the 27 EU
Member States. Finally, the study identifi es
different payment clusters of the European retail
payment market.
The remainder of this paper is structured as
follows. Section 2 reviews the recent literature.
Section 3 presents the scope and data collection.
Section 4 introduces the methodology of
the European study on the costs of retail
payment instruments. Section 5 describes the
sample representativeness and summarises
data statistics. Section 6 presents the results
on the social and private costs of retail payment
instruments from different perspectives.
The fi nal section provides conclusions.
9ECB
Occasional Paper No 137
September 2012
2 REVIEW
OF RELATED
L ITERATURE2 REVIEW OF RELATED LITERATURE
Empirical evidence on the social costs of
retail payment instruments can be useful when
considering the future of the retail payments
industry and the optimal mix of payment
instruments. Over recent years a number of
research studies have tried to shed light on this
debate: see Banco de Portugal (2007); Banque
Nationale de Belgique (2005); Bergman et
al. (2007); Brits and Winder (2005); Gresvik
and Øwre (2003); Humphrey et al. (2003);
Koivuniemi and Kemppainen (2007); Takala
and Viren (2008); and Valverde et al. (2008).
These help to raise general awareness of the
costs to different stakeholders of payment
transactions.
Intuitively, it is clear that the total cost to society
of making payments can be high. However,
until recently not much hard empirical evidence
in support of this intuition was available. In an
early study, the costs of making payments were
estimated to be as much as 3% of gross domestic
product (GDP) (Humphrey et al., 2003). A
number of recent studies by central banks have
provided more detailed estimates, especially
where European countries are concerned. In the
Netherlands, the total cost of all point-of-sale
(POS) payments was estimated to be 0.65% of
GDP in 2002 (Brits and Winder, 2005), while
an equivalent estimation in Belgium amounted
to 0.74% of GDP in 2003 (Bank Nationale de
Belgique, 2005). Banks’ costs in connection
with the production of payment services were
estimated at 0.49% of GDP in Norway (Gresvik
and Øwre, 2003) and 0.77% of GDP in Portugal
(Banco de Portugal, 2007). These fi gures clearly
show that the costs related to payment activities
are not negligible.
The differences between these cost studies
are to some extent explained by the difference
in their scopes; that is, which instruments and
stakeholders are included, and what is the most
accurate costing methodology. This highlights
the importance of adopting a common scope and
methodology for the current study, thus enabling
well-founded cost comparisons. At present, only
limited information and estimations exist as to
the costs and benefi ts of payment instruments
across Europe.
A reviewing of the existing literature shows that
these studies typically consider central banks,
banks and retailers as the major stakeholders
involved in the payment transaction chain. In this
context, the estimation or approximation of the
costs to and payment preferences of consumers
and households is relatively complex, which is
why they are typically excluded from the studies.
In principle, all of these parties incur internal and
external costs and may receive revenue from the
other parties. To avoid the double-counting of
some cost elements, only the “true” production
costs enter the model as the total of all internal
costs. The focus of these studies is mainly on
POS payment instruments, comprising cash,
debit and credit cards and e-money.
Studies in the second group, for example the
Norwegian and Portuguese studies, use the
Activity-Based Costing (ABC) methodology –
at least where the banks’ costs are concerned.
ABC allocates the cost of the activities along the
payment chain to the different payment products
and services within a bank. In addition to POS
payment instruments, these studies also consider
direct debit and credit transfers. As the ABC
methodology proved to be a suitable concept
for analysing relevant costs in payment systems,
it also provides the basis for the present study.
10ECB
Occasional Paper No 136
September 2012
3 SCOPE AND DATA COLLECTION
This section describes the data and measurement
issues of the study. The crucial dimensions of
the study comprise the selection of the payment
instruments, the identifi cation of relevant
stakeholders and the data coverage.
3.1 RETAIL PAYMENT INSTRUMENTS
The study estimates the costs of the most
frequently used retail payment instruments in
Europe. As a general rule, only those payment
instruments with a national market share of
more than 5% of non-cash transaction volumes
are considered. Accordingly, cheque payments
can be reported only for some countries, while
e-purse payments are excluded across the board.
The study defi nes retail payment transactions as
non-critical payments of relatively low values,
i.e. of less than €50,000.4 For banks and
infrastructures, the study covers retail payment
transactions carried out either by individuals or
by companies. For retailers, the analysis focuses
on consumer-to-business payments.5 Therefore,
the payment instruments include those used for
POS payments, i.e. cash, credit and debit cards,
and, in some countries, cheques; they also
include credit transfers and direct debits, which
are used mainly for remote payments.
Credit transfers and direct debits are used by
different business parties. Typically, the heavy
users of credit transfers and direct debits are
large corporates, while retailers use more POS
payment instruments. The inclusion or exclusion
of credit transfers and direct debits can, therefore,
have an effect on the scope of the study and
the data collection process. The retailer and
company survey focuses on POS payments and,
where appropriate, remote payments. The costs
of processing credit transfers and direct debits
were collected from the operators, i.e. interbank
infrastructure providers.
In addition to the costs associated with the
relevant payment instruments, it was important
to collect data on the volumes and values of
cash and non-cash retail payments. Data on
the volume and value of payments are usually
readily available for payment instruments
that are by defi nition electronic, for example
debit and credit cards, and/or those that are
electronically processed, for example cheques,
credit transfers and direct debits. For these
payment instruments, the study has used the
defi nition and methodology of the ECB’s
Statistical Data Warehouse. However, only
customer-to-business payments should be
included, thus excluding interbank payments,
for example.
It is, however, more diffi cult to ascertain the total
value and volume of cash payments. Nevertheless,
for the purpose of this study, a reliable estimate
of the volumes and values of cash payments is of
vital importance, since the results are sensitive to
these fi gures. For this reason, Annex I provides
an overview of alternative methods that were
used by the participating central banks to estimate
the extent of cash usage at the country level, and
discusses their strengths and weaknesses. A more
detailed discussion of the methods presented in
the Annex I can be found also in Gresvik and
Haare (2008), Jonker and Kosse (2009), and
Jonker et al. (2012).
In the 2007 Portuguese study, €100,000 was used as the 4
maximum limit In any case, the number of transactions between
€50,000 and €100,000 seems relatively small and will, therefore,
not have a big impact on the fi ndings
The analysis focuses on consumer-to-business payments for 5
the sake of simplicity The underlying hypothesis is that the
estimated costs would be similar to the costs of the whole retail
world, also taking into account business-to-business payments
12ECB
Occasional Paper No 136
September 2012
3.2 RELEVANT STAKEHOLDERS
Due to the considerable effort necessary to
collect viable data on the costs incurred by all
of the parties in the payment chain, the analysis
focuses on the most important parties:
issuing authorities, i.e. central banks and •
governments;
banks • 6 and interbank infrastructure providers
(automated clearing houses, ATM networks,
etc.) 7;
retailers and companies; and •
cash-in-transit companies. •
Overall, four questionnaires have been developed:
one for banks and interbank infrastructures;
one for retailers covering both retailers and
companies; one for central banks/issuing
authorities; and one for cash-in-transit companies.
The questionnaires are available from the authors
upon special request. With regard to the survey of
cash-in-transit companies, it is well understood
that reporting separately on cash-in-transit
companies was not relevant for all countries.
In cases where the reporting central bank plays
an active role in the operation of a retail payment
system, the central bank in question was invited
to report the data and information regarding non-
cash payment instruments by completing the
bank and infrastructure survey. Any costs for
processing retail transactions via the TARGET2
system are reported by commercial banks using
the banks’ questionnaire.
The surveys concentrate exclusively on the
economic sectors in which fi rms have a strong
direct relationship with consumers. As a result,
the analysis offers a good estimation of the costs
of the POS and remote payment instruments,
such as credit transfers and direct debits. In this
context, the retailer and company surveys target
“non-fi nancial services” and exclude
“manufacturing sectors” and other business-to-
business activities. Following the International
Standard Industrial Classifi cation of All
Economic Activities (ISEC) 8, the survey focuses
on the areas of: retail trade, transport,
telecommunications, accommodation, food, real
estate activities and other services, as well as
services related to public utilities, e.g. electricity,
gas, steam and air conditioning supply, which
are usually provided by a few large companies.
Each participating central bank, taking into
consideration its respective national specifi cities,
defi ned its own sample of retailers.
Experience has shown that payment costs for
consumers are diffi cult to estimate. Therefore,
it has been decided not to include consumers
in the study and, thus, not to conduct consumer
surveys on the costs, benefi ts and perception
of payments. However, for the purpose of
estimating the volume and the value of cash
transactions, some of the participating central
banks carried out consumer surveys.
3.3 DATA COLLECTION AND SAMPLE COVERAGE
For data collection, the participating central
banks, banks and infrastructures, cash-in-transit
companies and retailers collected and provided
quantitative and qualitative information on
their costs and transaction volumes in respect
of the payment instruments that they provide.
Participation in the fact-fi nding exercise has
been voluntary. However, for the results of the
study to be comparable, it was essential that
all participating entities follow and adopt a
common methodology and reporting scheme to
the highest possible extent. The study includes
13 European countries. It covers a representative
share of the overall European retail payments
market, thus allowing for valid cross-country
comparisons.
Every attempt was made to ensure that, as
far as possible, the samples cover retailers of
Banks should also indicate and specify potential fees and costs 6
incurred when information and communication technology (ICT)
services are being outsourced to other parties
This does not include, for example, ICT and other activities 7
outsourced by individual banks
For further details see International Standard Industrial 8
Classifi cation of All Economic Activities at http://unstats un org/
unsd/cr/registry/isic-4 asp
13ECB
Occasional Paper No 136
September 2012
3 SCOPE AND
DATA COLLECTIONdifferent sizes (i.e. small, medium and large 9)
and different industry sectors. For this, it was
important that the population of retailers is rather
heterogeneous. In general, large retailers tend
to have a thorough knowledge of their current
payment volumes and the costs associated
with different payment instruments. Small and
medium-sized enterprises (SMEs), on the other
hand, often do not have accurate and up-to-date
information available on these issues.
With regard to retailers, the criteria set out for
the selection of the sample are crucial because
the costs and benefi ts of accepting different
payment methods could differ among the
retailers, especially according to the following
variables:
size of merchant; •
industry sector; •
typical payment method and value of •
transaction; and
set of payment instruments available to •
customers.
To ensure that the samples are representative
of the European retail payments market as a
whole, the bank and infrastructure survey aimed
to cover a large relevant share of the market.
The retailer and company survey was based
on the pre-defi ned, broad and commonly used
categories of the retail sectors. These industry
sectors were grouped into the following three
main categories, each one refl ecting a typical
purchasing pattern.
1. Remote purchases: Purchases of relatively
high value where payment often takes place
before the provision of the goods or services.
This set of merchants, comprising airlines,
hotels, travel agencies or operators, car
rental fi rms and the like, seems particularly
suitable for comparing the costs of accepting
different payment methods in POS and
card-not-present transactions, as the set
consistently handles both.
This category also includes e-commerce
without physical establishment, which allows
for comparison with cases in which the set of
payment instruments is electronic only.
2. OTC purchases: Frequent purchases of
relatively low value, where payment usually
coincides with the provision of the goods.
This includes, among other merchants,
supermarkets, grocery stores, clothing
retailers, restaurants, bars, pubs, snack bars,
nightclubs and petrol stations.
These merchants usually accept cash and
card payments only.
3. Other purchases: Purchases of relatively
high value where payment often takes
place after the provision of specifi c goods
or services or following a recurring
pattern. Merchants include those offering
professional services (dentists, architects,
etc.), retailers of credence goods, jewellers
and watch shops, and utilities.
These merchants accept cheques and bank
transfers (credit transfers and direct debits),
which may not be accepted by the merchants
in the other categories.
The fi nal decision regarding the composition of
the samples of the cash-in-transit companies and
of the retailers has been left to the discretion of
the participating central banks.
The central banks 10 also ensured the appropriate
number, quality, consistency and comparability
of responses to the surveys by providing direct
and ongoing assistance to participating retailers,
cash-in-transit companies, and banks and
interbank infrastructures. Furthermore, central
For a more specifi c description of the retailer size classifi cation, 9
please refer to the Eurostat defi nitions at http://epp eurostat
ec europa eu/portal/page/portal/european_business/special_sbs_
topics/small_medium_sized_enterprises_SMEs
Some central banks outsourced the data collection for retailers 10
to an external research company, which was responsible for
assuring the quality of the data To see a list of these central
banks, please refer to Table 2
14ECB
Occasional Paper No 136
September 2012
banks carried out quality control procedures by
testing for consistency, validity and dispersion.
With regard to cash-in-transit companies, the
reporting of the requested data has been very
sensitive, in some cases due to the competitive
positions and particularities in some countries.
In cases where the competitive environment did
not allow for a separate reporting, it is possible
to include aggregated fi gures for cash-in-transit
companies as a cost item in the bank and
infrastructure questionnaire.
The relevant data was collected by the respective
central banks with 2009 as the reference year.
All cost items were reported in local currency.
The data was reported to the ECB at an
aggregate national level only, and not at the
level of individual reporting institutions. The
participating central banks were requested to
aggregate and extrapolate the results of the
surveys and provide a clear and consistent
presentation of the main fi ndings in their
national contexts. They were asked to return
to the ECB the four questionnaires completed
at an aggregate national level, representing the
feedback from their respective countries.
17ECB
Occasional Paper No 137
September 2012
4 METHODOLOGY
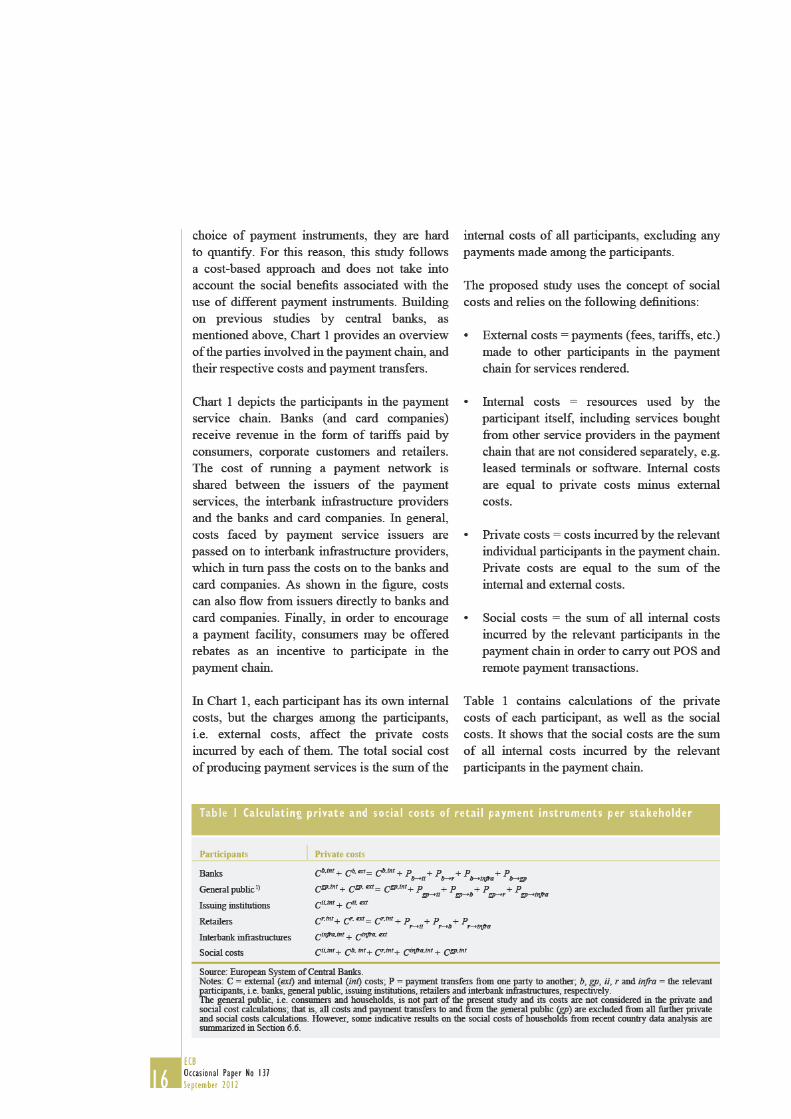
4.2 DIRECT AND INDIRECT COSTS
AND ALLOCATION KEYS
In addition to the distinction between private
and social costs, an analysis of costs typically
depends on the underlying costing systems used
by the individual market participants. Common
to all methods of costing is the assumption
that the production of a product, i.e. payment
services, consumes resources and therefore
implies costs. These costs are then either direct
or indirect.
Direct costs are those that arise from a direct
and exclusive use of resources to make payment
products and services available. In other words,
direct costs are the costs “directly related”
to the activities carried out for each payment
instrument, and which can be imputed in a
straightforward way (e.g. costs associated with
fees and commissions and with staff directly
involved in each activity and with each payment
instrument).
Indirect costs are those that arise from a non-
exclusive use of resources to make payment
products and services available. Indirect
costs are the costs associated with the local
overhead 11 and support functions 12 that are
necessary to carry out the activities involved
with each payment instrument, and should be
imputed using specifi c allocation keys (e.g.
costs associated with rentals, maintenance
and depreciation, and other corporate support
services).
Direct cost allocation is unproblematic, as these
costs can be directly observed and assigned to a
certain activity in the production chain.
However, this is not the case for indirect costs.
Usually, payment systems share several cost
items with other banking and support services.13
Allocation keys are needed to divide the indirect
costs between payment and other services, and
among the different payment services
themselves. Banks rarely have internal costing
systems that developed enough for data on the
costs of different payment instruments to be
available, and even the total cost of producing
payment services is generally not extracted into
a separate cost or profi t centre. For this reason,
this study applies a methodology for allocating
the indirect costs. In the end, the cost allocations
were made at the national level, but it seemed
appropriate to ensure a general framework and
as many common elements as possible.
The ABC method has been developed to
facilitate well-defi ned cost allocation among
different product lines. This method was used
in Gresvik and Haare (2009) and Banco de
Portugal (2007) to estimate the costs to banks,
but not the costs to retailers. The use of this
method requires the basic activities and cost
drivers to be defi ned and assigned among the
payment services. If this is done properly, ABC
can result in coherent fi gures.
Indirect costs could also be allocated on the
basis of more general and higher level allocation
keys, for example simple volumes or roughly
Costs that are direct at the level of the organisational entity that 11
is responsible for executing the concerned activities/delivering
the concerned service or product, but which cannot directly be
allocated to them in an economically feasible way (e g division
head and the secretariat function or other support functions (e g
conceptual work) within the respective organisational entity)
Support functions are all functions that refer to fi nancial 12
accounting and reporting, information and communication
technology (ICT), secretariat services to decision-making
bodies, communication, event and meeting services, language
services & lawyer-linguist services, planning and controlling,
and organisation, internal auditing, internal institutional, legal,
tax and administrative issues, human resources management and
social affairs, and internal services
For example, banks’ computer centres are shared by different 13
applications and the applications available to customers serve
both deposit and payment functions The branch personnel
serve all customers and initiate all transactions at the same
premises using the same terminal facilities The bank cards
and underlying applications for registering cards and customers
serve card usage at both POS and Automated Teller Machines
(ATMs) Banks’ e-banking services provide interfaces for all
kinds of banking services, including remote payment services
The interbank payment network and clearing services provide
common payment services to all or some part of the interbank
infrastructure, depending on the national or local payment
structures Domestic and international payments are still often
routed via different applications and networks, although they do
also share some common facilities Banks’ general management,
administration, general facilities and overhead marketing, legal,
etc functions serve all kinds of product lines within the banks
and other service providers
18ECB
Occasional Paper No 137
September 2012
estimated shares of the costs.14 One important
decision to be made regarding cost allocation is
whether to follow the full or partial cost coverage
approach. To compare the cost effi ciency of the
different payment instruments, data on costs
need to be collected to the extent that the costs
differ among the instruments. To analyse the
total cost of making payments and the extent to
which the revenue from payments covers the
cost of making them, full cost coverage is
necessary, requiring the allocation of all indirect
and overhead costs of the service providers.
Given that the production of payment services
involves support functions to a large extent, a
distinction between direct and indirect costs
is particularly suitable for dealing with this
type of services. Following this approach, we
fi rst identifi ed the main activities involved
in making payment products and services
available. The selection of the cost tasks was
built upon previous well-established national
cost studies. We then allocated costs to these
activities depending on whether they are direct
or indirect.
The total operating costs for the reference year
(i.e. 2009) served as the starting point. These
total operating costs were broken down by cost
item (staff, specialist services, commissions,
depreciations, etc.) and by departmental cost
centre (IT department, marketing department,
accounting department, cards department,
etc.). Accordingly, the surveyed sample banks
were invited to follow three steps to collect the
relevant data and information.
In the fi rst step, the sample banks were asked to
examine all of these cost items and departmental
cost centres in detail to identify:
the relevant shares of the costs which are •
linked to the performance of the activities
directly related to each payment instrument –
these were taken as the direct costs for each
specifi c payment instrument;
the relevant shares of the costs which are •
linked to the development of the support
functions necessary for making payment
products or services available – these were
considered as indirect costs (examples
include costs associated with human
resources management, logistics, buildings
and asset management, overall management
and training); and
the relevant shares not related to the provision •
of payment instruments – this remaining
share of the costs is necessary in order to
check if the sum of the direct and indirect
costs is equal to the total operating costs of
the participating bank or infrastructure.
In this way, the sample banks were able to
report direct costs by payment instrument and
by activity, and the overall indirect costs. Since
the direct costs were already divided by payment
instrument and by activity, it was necessary
to allocate the indirect costs to the different
payment instruments and to the respective
activities.
In the second step, the banks were asked to use
allocation keys to impute the total indirect costs
to the different payment instruments and to the
respective activities. In principle, they were
allowed to use the allocation keys that are best
suited to their situations. The following best
practices proved to be helpful.
For costs associated with human resources •
management and other corporate support
services, the sample banks could apply the
time used by employees to carry out their
tasks or headcount.
For costs associated with IT and •
communications or with the maintenance
and depreciation of machines, banks could
apply the number of machine-hours used for
For example, for branch costs, it could be estimated that 20% 14
belongs to payment services in general and, of this, half is
distributed among payment services based on the volume of
over-the-counter (OTC) cash withdrawals and OTC credit
transfers, and the other half is distributed evenly between card
payments, electronic credit transfers and direct debits, based
on the general marketing and support services provided by the
branch personnel
19ECB
Occasional Paper No 137
September 2012
4 METHODOLOGY
each activity or the number of each type of
transaction carried out.
For costs associated with rentals and •
depreciations, banks could apply the area
occupied by each service or department.
It was suggested that the banks carry out small
in-branch surveys in order to measure, for
example, the time employees dedicate to each
activity (or even to each payment instrument)
and the number of machine-hours used for each
activity.
In the third step, the banks asked to calculate
the total costs of each payment instrument by
summing the costs (direct and imputed indirect
costs) of all activities necessary to make that
instrument available.
With regard to the use of common allocation
keys for imputing indirect costs to the different
payment instruments and to the respective
activities, it is well understood that the
application of the aforementioned criteria by the
banks might have generated different keys, i.e.
percentages. These allocation keys might vary
not only according to the production structure
of the banks (e.g. more outsourcing vs. more
internal staff), but also according to the nature
of banks (e.g. savings vs. commercial banks).
Naturally, and as a realistic refl ection of common
market practice, banks could not be obliged
to use the same allocation keys, given that all
banks across countries and within the countries
themselves do not have the same production
structure. Therefore, it should be kept in mind
that the choice and use of common allocation
keys could infl uence unit and average costs.
The questionnaires for retailers followed a
simplifi ed resource-based approach, taking
into account that these stakeholders may not
have been able to split their costs into direct
and indirect costs. Therefore, the retailer and
company questionnaire adopted broader and
more general measurements and estimations of
the cost of each payment task and instrument.
20ECBOccasional Paper No 137September 2012
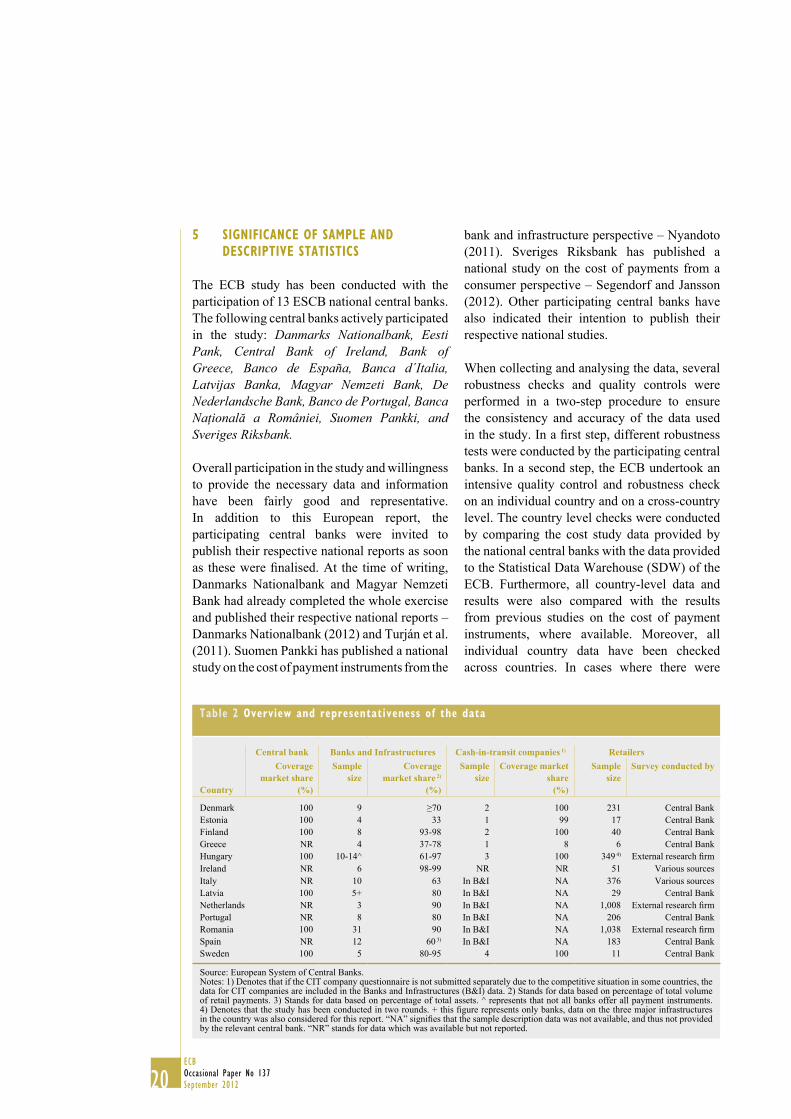
5 Significance of Sample and deScriptive StatiSticS
The ECB study has been conducted with the participation of 13 ESCB national central banks. The following central banks actively participated in the study: Danmarks Nationalbank, Eesti Pank, Central Bank of Ireland, Bank of Greece, Banco de España, Banca d´Italia, Latvijas Banka, Magyar Nemzeti Bank, De Nederlandsche Bank, Banco de Portugal, Banca Naţională a României, Suomen Pankki, and Sveriges Riksbank.
Overall participation in the study and willingness to provide the necessary data and information have been fairly good and representative. In addition to this European report, the participating central banks were invited to publish their respective national reports as soon as these were finalised. At the time of writing, Danmarks Nationalbank and Magyar Nemzeti Bank had already completed the whole exercise and published their respective national reports – Danmarks Nationalbank (2012) and Turján et al. (2011). Suomen Pankki has published a national study on the cost of payment instruments from the
bank and infrastructure perspective – Nyandoto (2011). Sveriges Riksbank has published a national study on the cost of payments from a consumer perspective – Segendorf and Jansson (2012). Other participating central banks have also indicated their intention to publish their respective national studies.
When collecting and analysing the data, several robustness checks and quality controls were performed in a two-step procedure to ensure the consistency and accuracy of the data used in the study. In a first step, different robustness tests were conducted by the participating central banks. In a second step, the ECB undertook an intensive quality control and robustness check on an individual country and on a cross-country level. The country level checks were conducted by comparing the cost study data provided by the national central banks with the data provided to the Statistical Data Warehouse (SDW) of the ECB. Furthermore, all country-level data and results were also compared with the results from previous studies on the cost of payment instruments, where available. Moreover, all individual country data have been checked across countries. In cases where there were
table 2 overview and representativeness of the data
Central bank Banks and Infrastructures Cash-in-transit companies 1) Retailers
Country
Coverage market share
(%)
Sample size
Coverage market share 2)
(%)
Sample size
Coverage market share
(%)
Sample size
Survey conducted by
Denmark 100 9 ≥70 2 100 231 Central BankEstonia 100 4 33 1 99 17 Central BankFinland 100 8 93-98 2 100 40 Central BankGreece NR 4 37-78 1 8 6 Central BankHungary 100 10-14^ 61-97 3 100 349 4) External research firmIreland NR 6 98-99 NR NR 51 Various sourcesItaly NR 10 63 In B&I NA 376 Various sourcesLatvia 100 5+ 80 In B&I NA 29 Central BankNetherlands NR 3 90 In B&I NA 1,008 External research firmPortugal NR 8 80 In B&I NA 206 Central BankRomania 100 31 90 In B&I NA 1,038 External research firmSpain NR 12 60 3) In B&I NA 183 Central BankSweden 100 5 80-95 4 100 11 Central Bank
Source: European System of Central Banks.Notes: 1) Denotes that if the CIT company questionnaire is not submitted separately due to the competitive situation in some countries, the data for CIT companies are included in the Banks and Infrastructures (B&I) data. 2) Stands for data based on percentage of total volume of retail payments. 3) Stands for data based on percentage of total assets. ^ represents that not all banks offer all payment instruments. 4) Denotes that the study has been conducted in two rounds. + this figure represents only banks, data on the three major infrastructures in the country was also considered for this report. “NA” signifies that the sample description data was not available, and thus not provided by the relevant central bank. “NR” stands for data which was available but not reported.
21ECB
Occasional Paper No 137
September 2012
5 S IGNIF ICANCE OF
SAMPLE AND
DESCRIPT IVE
STAT IST ICS
unjustifi ed discrepancies or inconsistencies,
data were reviewed, clarifi ed and corrected in
close bilateral cooperation with the participating
central banks.
Overall, each participating central bank was
asked to report the necessary and relevant
data on the basis of the commonly developed
methodology using the different questionnaires
for each stakeholder. Table 2 provides a
summary of the country-specifi c replies to the
central bank, bank and infrastructure, cash-in-
transit companies and retailers questionnaires.
As depicted in Table 2, the participation in
the exercise and the market coverage of the
participants in the payment chain demonstrates
the keen interest in and support of the study by
the various stakeholders. In particular, some
countries reported full participation by banks and
infrastructures and cash-in-transit companies.
Substantial efforts have also been undertaken
to ensure a relatively fair representation of
retailers. With regard to central banks, it should
be noted that costs related to euro banknotes are
excluded from the study on the social costs of
retail payment instruments. Cash data based on
a common banknote cost methodology might
be gathered at a later stage. However, some
euro area and non-euro area central banks
decided to share central bank-related costs for
the purpose of this study based on the identifi ed
methodology.
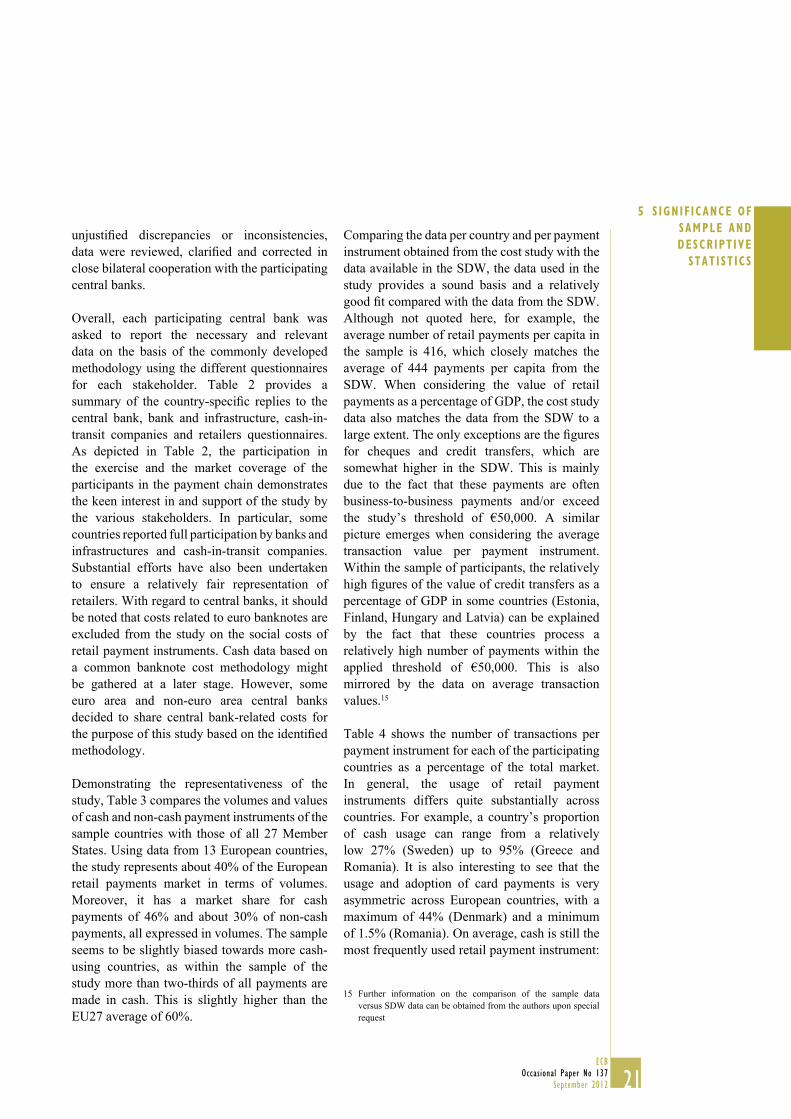
Demonstrating the representativeness of the
study, Table 3 compares the volumes and values
of cash and non-cash payment instruments of the
sample countries with those of all 27 Member
States. Using data from 13 European countries,
the study represents about 40% of the European
retail payments market in terms of volumes.
Moreover, it has a market share for cash
payments of 46% and about 30% of non-cash
payments, all expressed in volumes. The sample
seems to be slightly biased towards more cash-
using countries, as within the sample of the
study more than two-thirds of all payments are
made in cash. This is slightly higher than the
EU27 average of 60%.
Comparing the data per country and per payment
instrument obtained from the cost study with the
data available in the SDW, the data used in the
study provides a sound basis and a relatively
good fi t compared with the data from the SDW.
Although not quoted here, for example, the
average number of retail payments per capita in
the sample is 416, which closely matches the
average of 444 payments per capita from the
SDW. When considering the value of retail
payments as a percentage of GDP, the cost study
data also matches the data from the SDW to a
large extent. The only exceptions are the fi gures
for cheques and credit transfers, which are
somewhat higher in the SDW. This is mainly
due to the fact that these payments are often
business-to-business payments and/or exceed
the study’s threshold of €50,000. A similar
picture emerges when considering the average
transaction value per payment instrument.
Within the sample of participants, the relatively
high fi gures of the value of credit transfers as a
percentage of GDP in some countries (Estonia,
Finland, Hungary and Latvia) can be explained
by the fact that these countries process a
relatively high number of payments within the
applied threshold of €50,000. This is also
mirrored by the data on average transaction
values.15
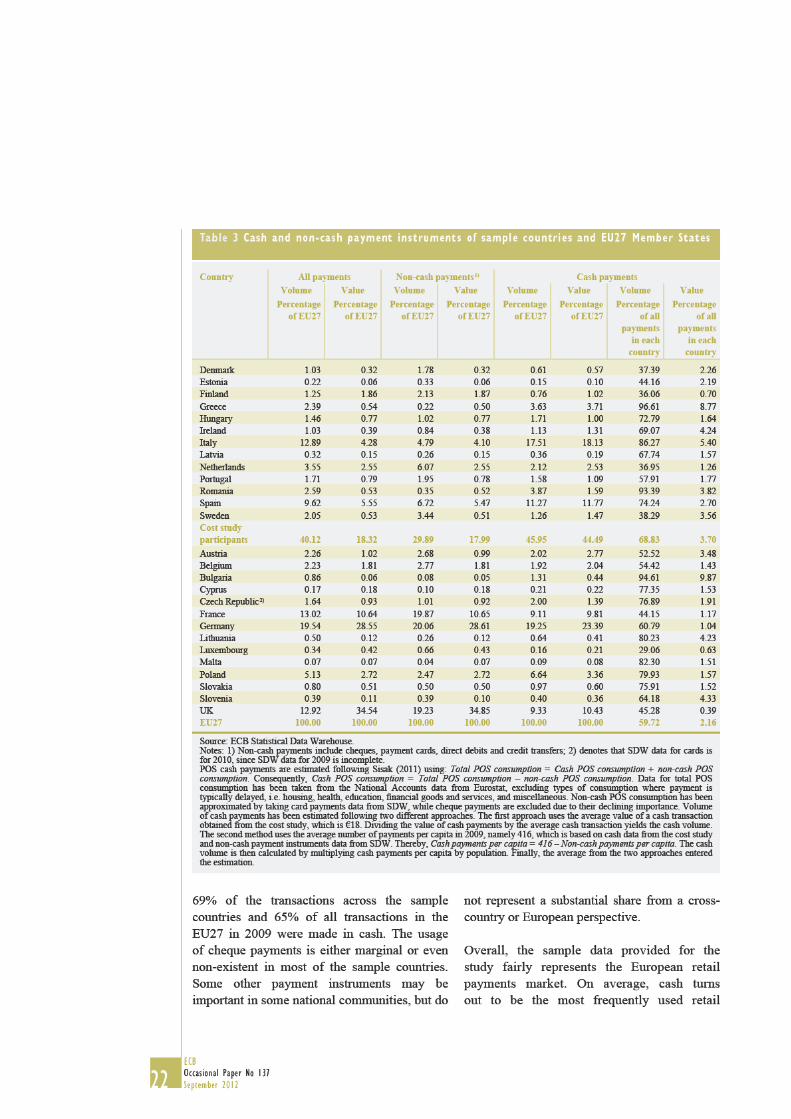
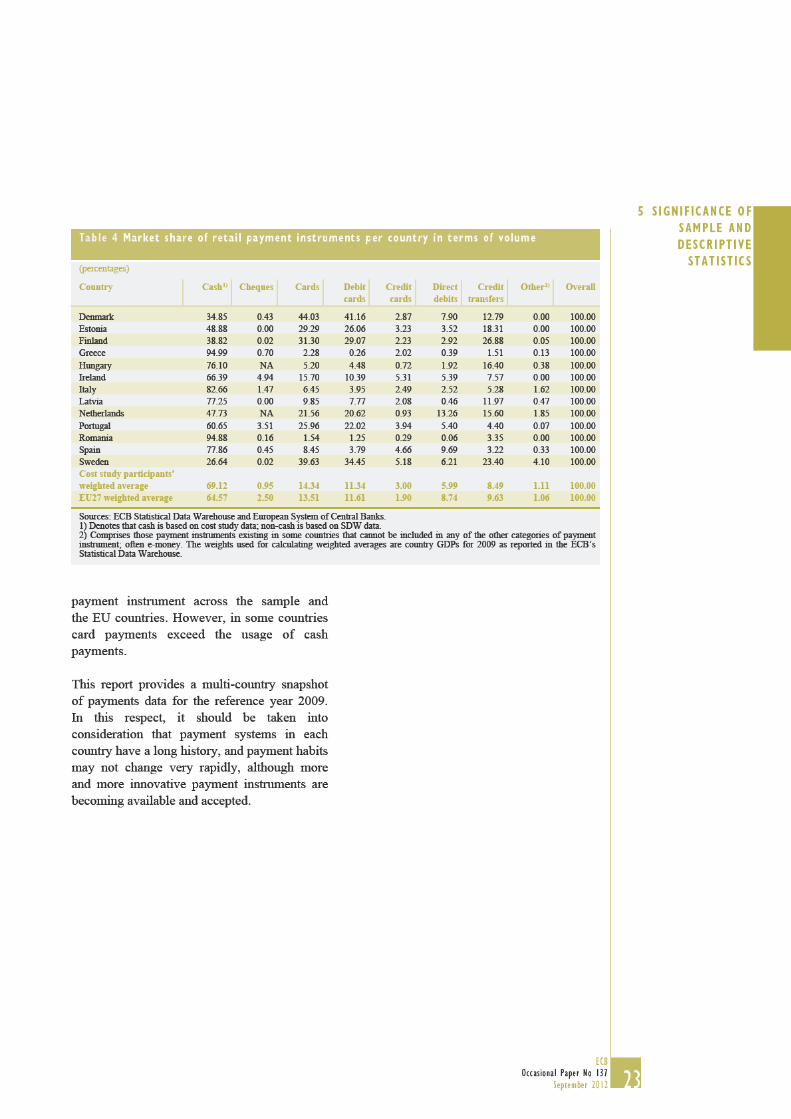
Table 4 shows the number of transactions per
payment instrument for each of the participating
countries as a percentage of the total market.
In general, the usage of retail payment
instruments differs quite substantially across
countries. For example, a country’s proportion
of cash usage can range from a relatively
low 27% (Sweden) up to 95% (Greece and
Romania). It is also interesting to see that the
usage and adoption of card payments is very
asymmetric across European countries, with a
maximum of 44% (Denmark) and a minimum
of 1.5% (Romania). On average, cash is still the
most frequently used retail payment instrument:
Further information on the comparison of the sample data 15
versus SDW data can be obtained from the authors upon special
request

25ECB
Occasional Paper No 137
September 2012
6 COSTS OF
RETAIL PAYMENT
INSTRUMENTS6 COSTS OF RETAIL PAYMENT INSTRUMENTS
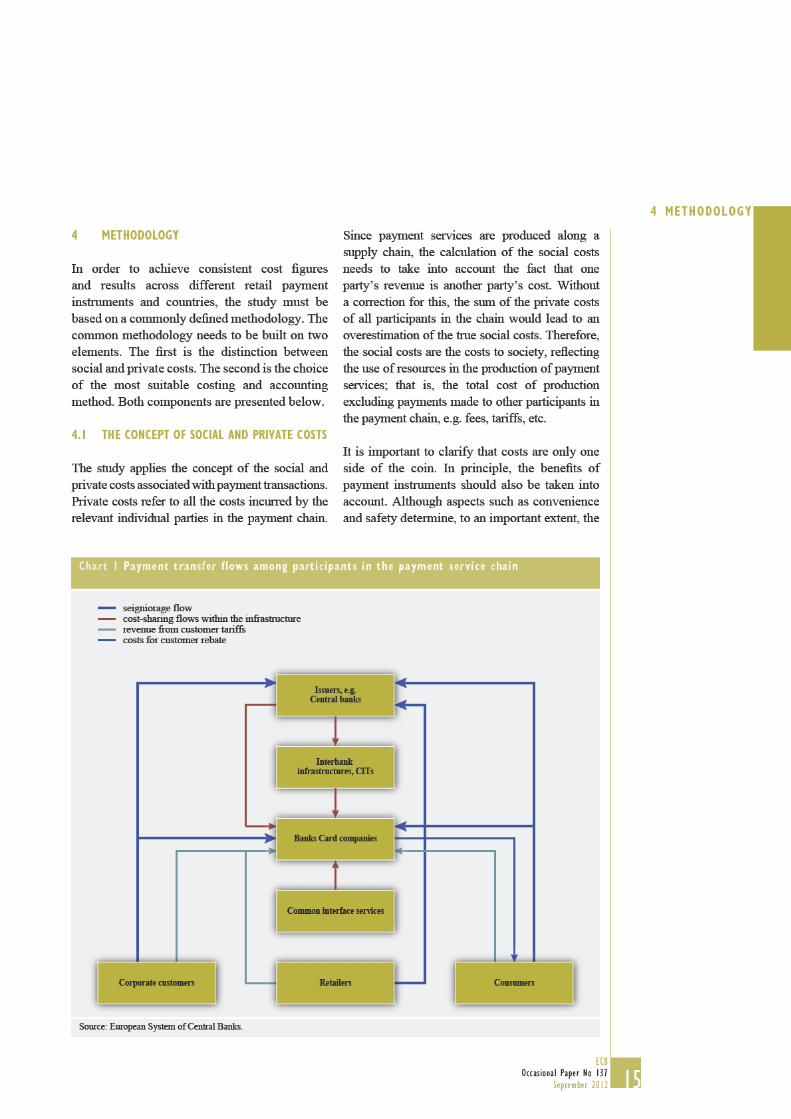
6.1 AGGREGATED SOCIAL AND PRIVATE COSTS
The study considers the private and social costs
per payment instrument and participant along
the payment transaction chain as explained in
Section 4.1. Private costs are the costs incurred
by the relevant individual participants in the
payment chain. They equal the sum of the
internal and external costs. Social costs are the
sum of all internal costs incurred by the relevant
participants in the payment chain in order to
carry out POS and remote payments.16
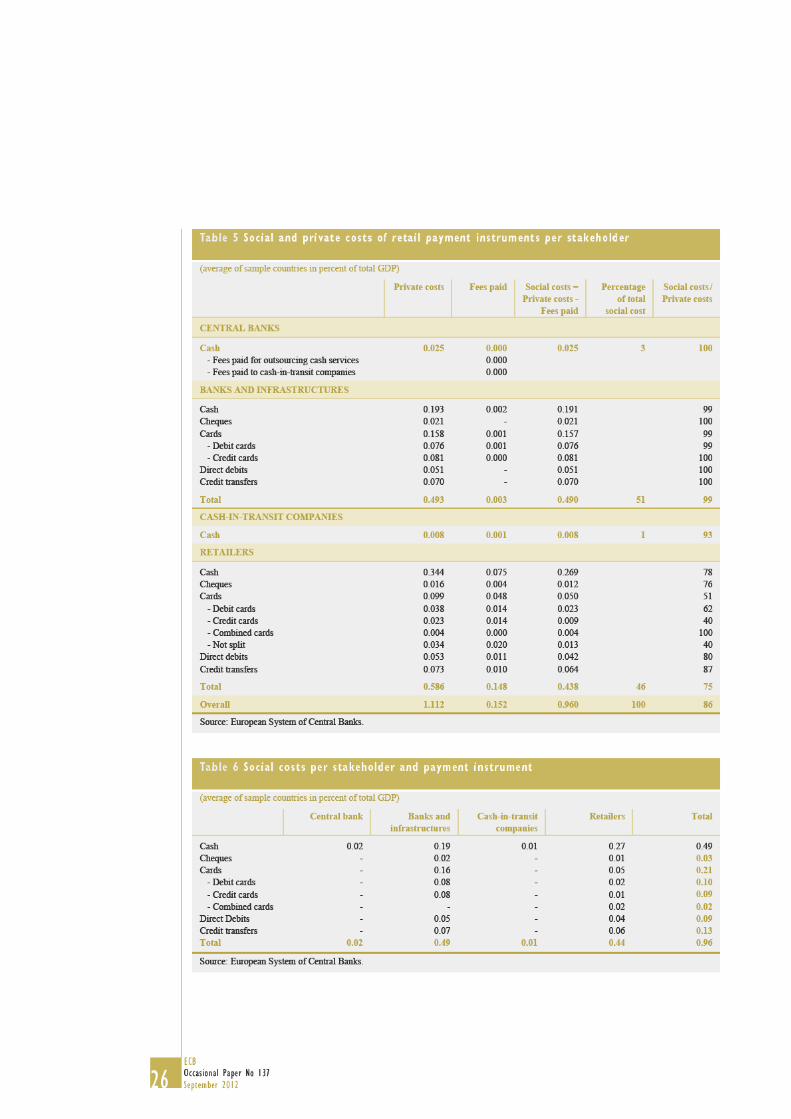
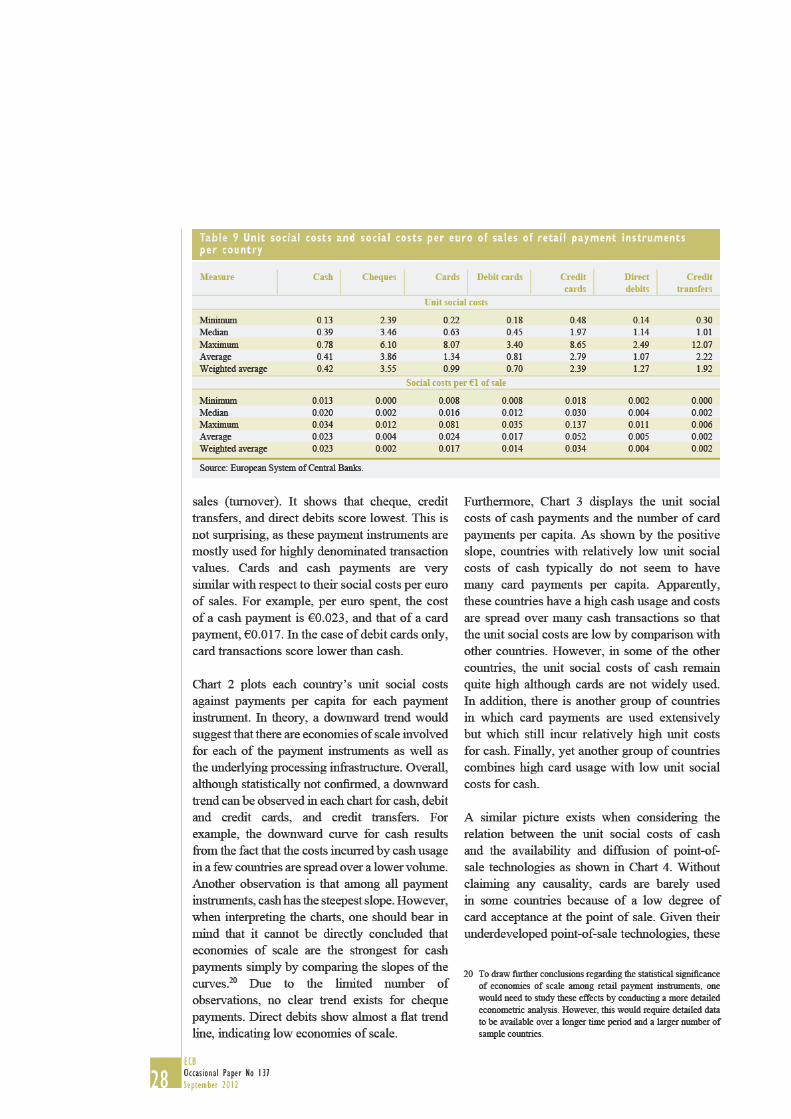
Using actual sample data for the 13 EU countries,
Table 5 presents the social and private costs
for each participant in the transaction payment
chain and for all six retail payment instruments
considered in the study. Overall, the social costs
of retail payment instruments add up to 0.96% of
GDP. Considering the composition of the social
costs, it is estimated that about 51% of the social
costs of retail payment services are incurred by
banks and infrastructures, and 46% by retailers.
The estimated social costs incurred by central
banks and cash-in-transit companies are 3% and
1% respectively. It can also be shown that banks
incur slightly higher costs for cash than for card
payments. Among card payments, credit cards
seem to be, to some extent, more costly compared
with debit cards in terms of absolute social costs.
Retailers incur the most costs on accepting and
using cash. More than 60% of the social costs by
retailers are made up by cash payments.17
On average, retailers have higher private costs
than banks and infrastructures, at 0.587% and
0.493% of GDP respectively. In other words,
fees and tariffs paid by retailers to third parties
apparently represent a considerable part of their
costs (about 0.15% of GDP on average). At the
country level, this is the case in the majority
of the countries. This is chiefl y due to the fact
that retailers incur high external costs to be paid
to other payment chain participants. Retailers’
overall social-to-private cost ratio is about
75%. This means that about one-quarter of the
retailers’ private costs are made up by tariffs
and fees paid to other participants. For banks
and infrastructures, central banks and cash-in-
transit companies, this ratio is (almost) 100%,
as they incur almost no external costs.18 Table 6
summarizes the fi ndings on the social costs per
payment instrument and per stakeholder.
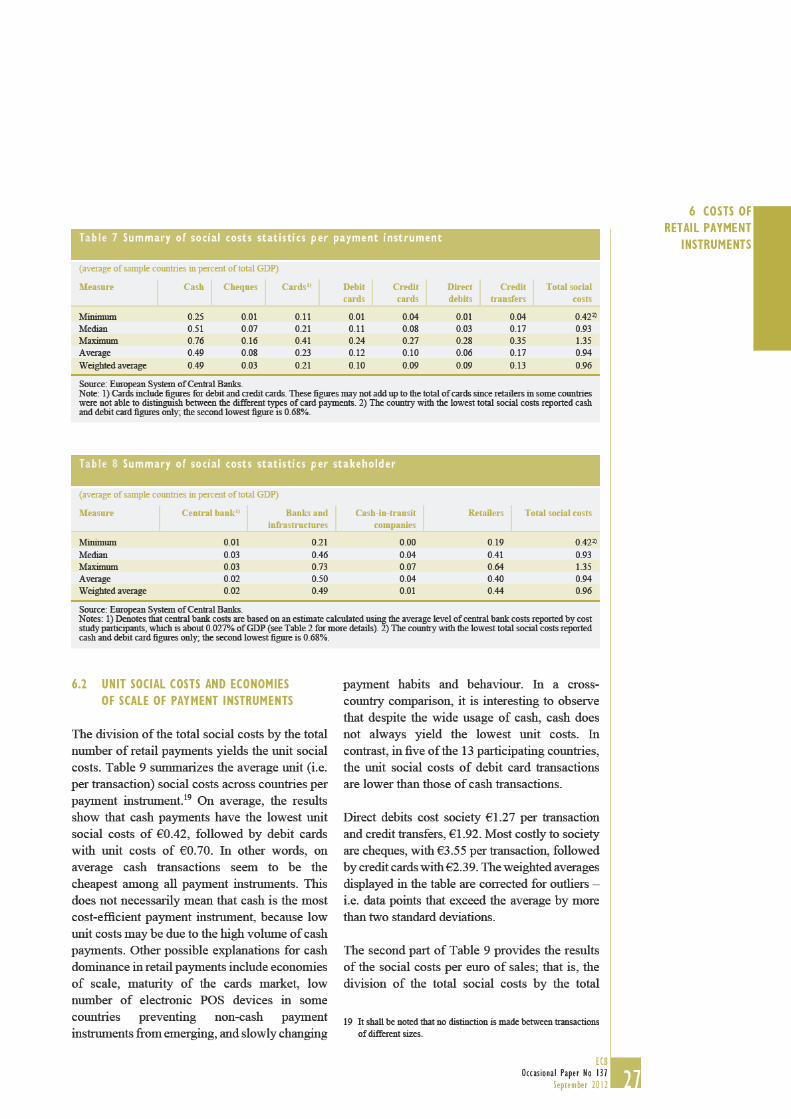
Table 7 presents a split of social costs by payment
instrument. As mentioned, the total social costs
are calculated to be close to 1% of the total GDP,
including the costs for all payment instruments
and stakeholders. On average, the social costs
of cash are nearly half of the total social costs.
Across countries, the total social costs can vary
from as low as 0.42% and 0.68% of GDP up
to 1.35% of GDP. On average, it remains that
cash represents the largest component of the
social costs of all payment instruments. Overall,
retailers incur higher social (and private) costs
for cash, but lower social (and private) costs
for all non-cash payment instruments, when
compared with banks and infrastructures.
Table 8 makes it apparent that the social costs for
banks and infrastructures are slightly higher than
those incurred by retailers. Even considering
the breakdown of costs by stakeholder, Table 8
shows that banks and infrastructures’ social
costs are somewhat higher than in the case
of retailers. However, the level of costs for
banks can differ substantially across countries.
Compared with banks and retailers, the social
costs incurred by central banks and cash-in-
transit companies are only marginal, and range
between 0.01% and 0.03% of GDP.
In Tables 5-8, all costs for the 13 countries measured in 16
percentage of total GDP of the 13 countries The weights used
for calculating weighted averages are country GDPs for 2009 as
reported in ECB’s Statistical Data Warehouse Information on
fees and tariffs is reported optionally, so it cannot be excluded
that the private costs and the fees paid are underestimated The
social costs of CIT companies are assumed to be zero if the CIT
data is reported together with the banks and infrastructures data
Therefore, the weighted average is an underestimation of the
actual CIT company social costs It is important to note that there
might be big differences from country to country depending on
the role of the national central bank in the national cash cycle
This analysis does not consider the volume of payments for 17
each payment instrument Therefore, it does not allow for direct
effi ciency comparisons among payment instruments
In this case, the majority of the tariffs and fees are paid intra-18
sector, and they are therefore not computed here
38ECB
Occasional Paper No 137
September 2012
inferences about the differences in the fi gures
from the national studies and those from the
ECB’s cost study, one needs to consider the
differences in the methodology and scope, as
well as in the timing of data collection. Since
payment habits change over time, it is likely that
social costs may also change due to a shift from
paper-based to electronic payment instruments.
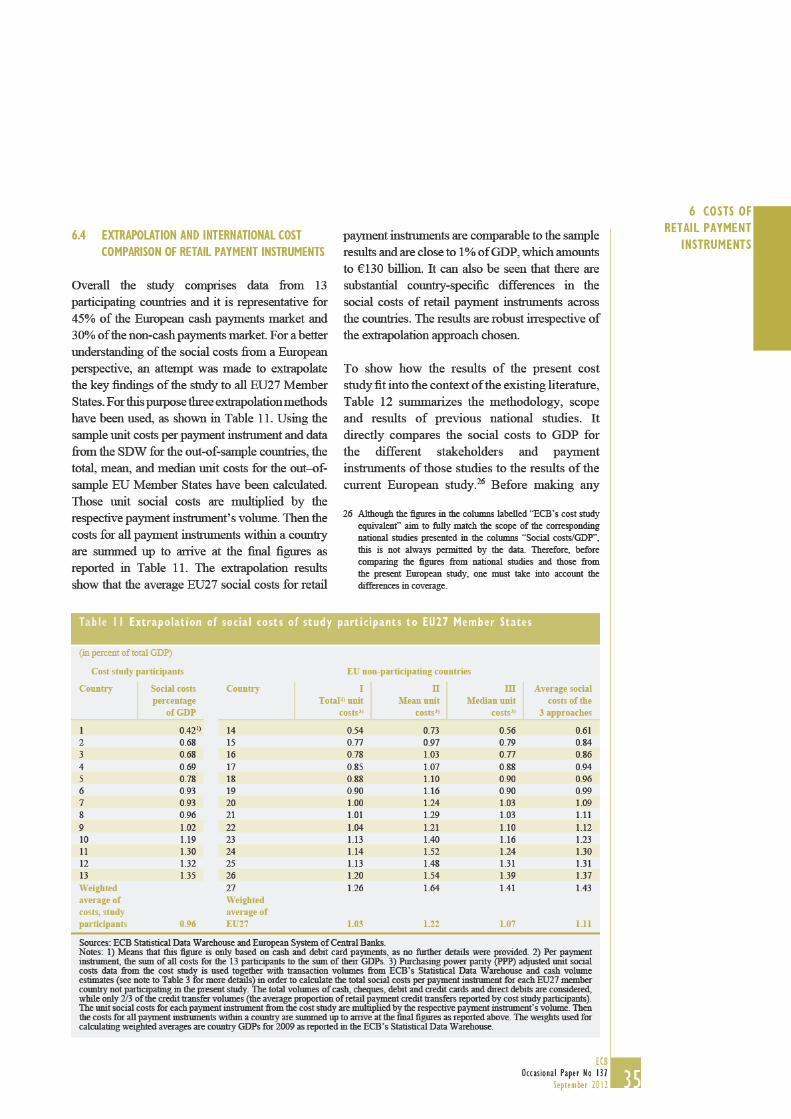
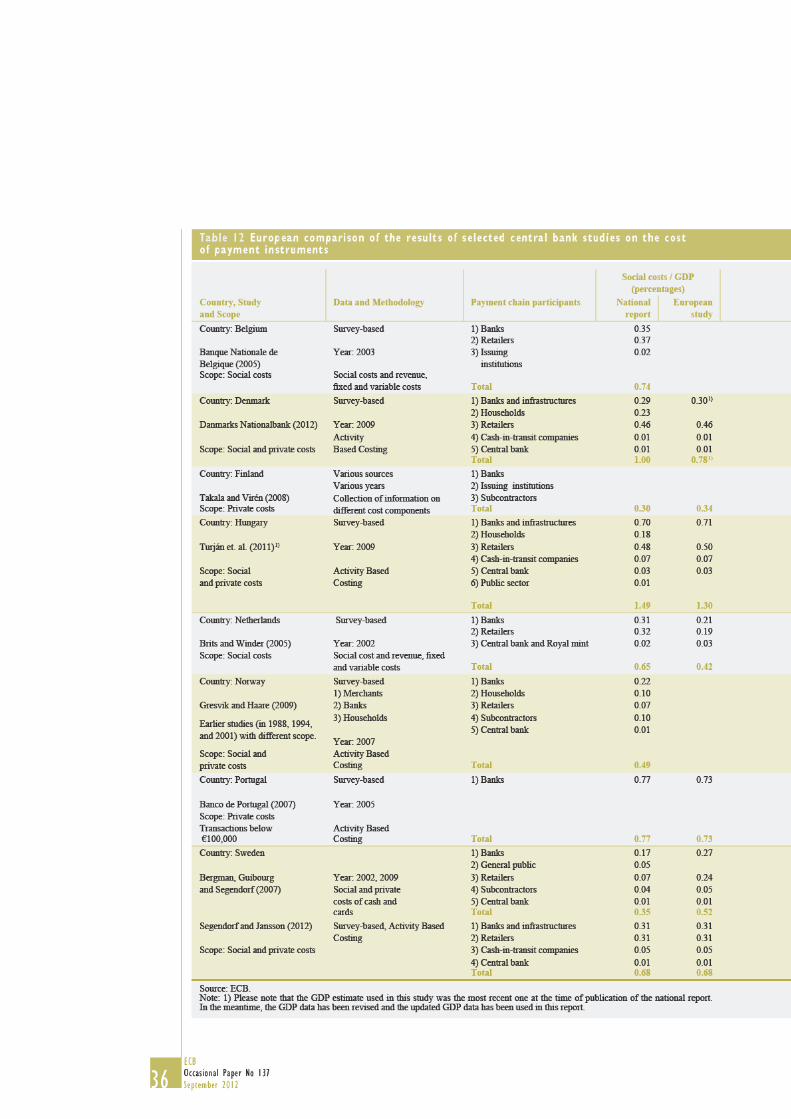
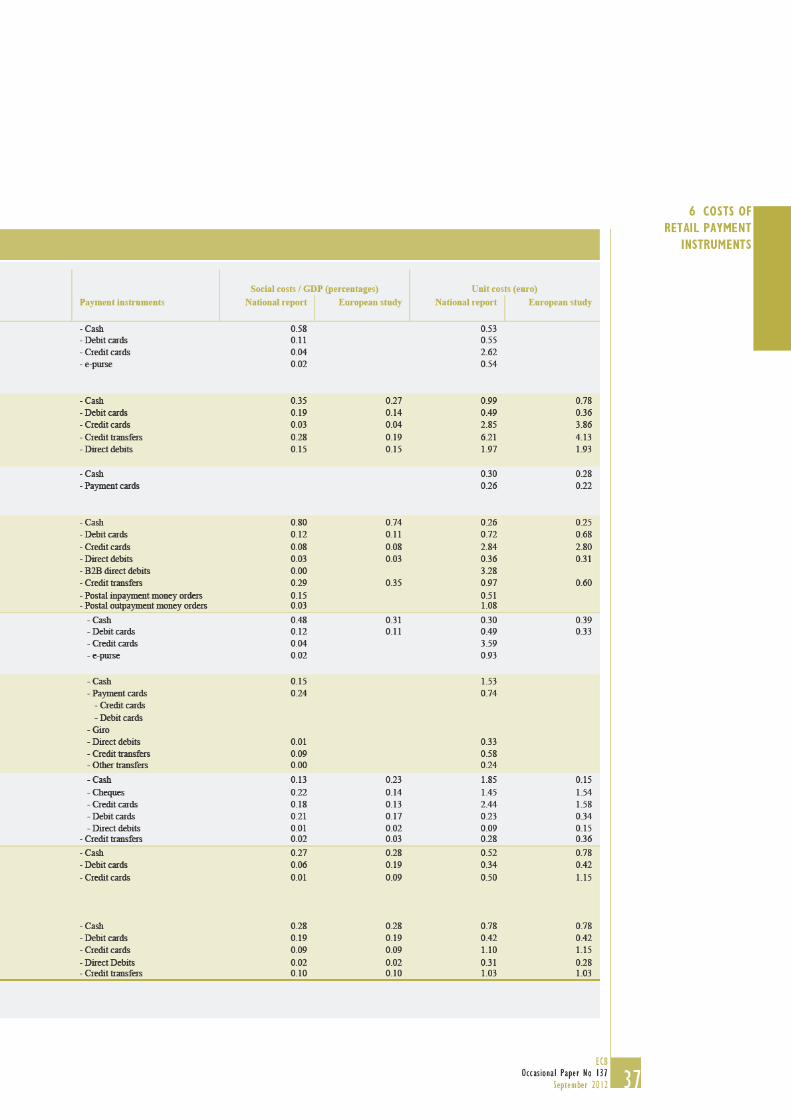
When comparing the results of the present European
study with those of previous national studies, a
number of observations are worth mentioning. In
the case of Portugal 27, the social costs of payment
instruments to banks slightly decreased, from 0.77%
in 2005 to 0.73% of GDP in 2009. In Sweden 28, the
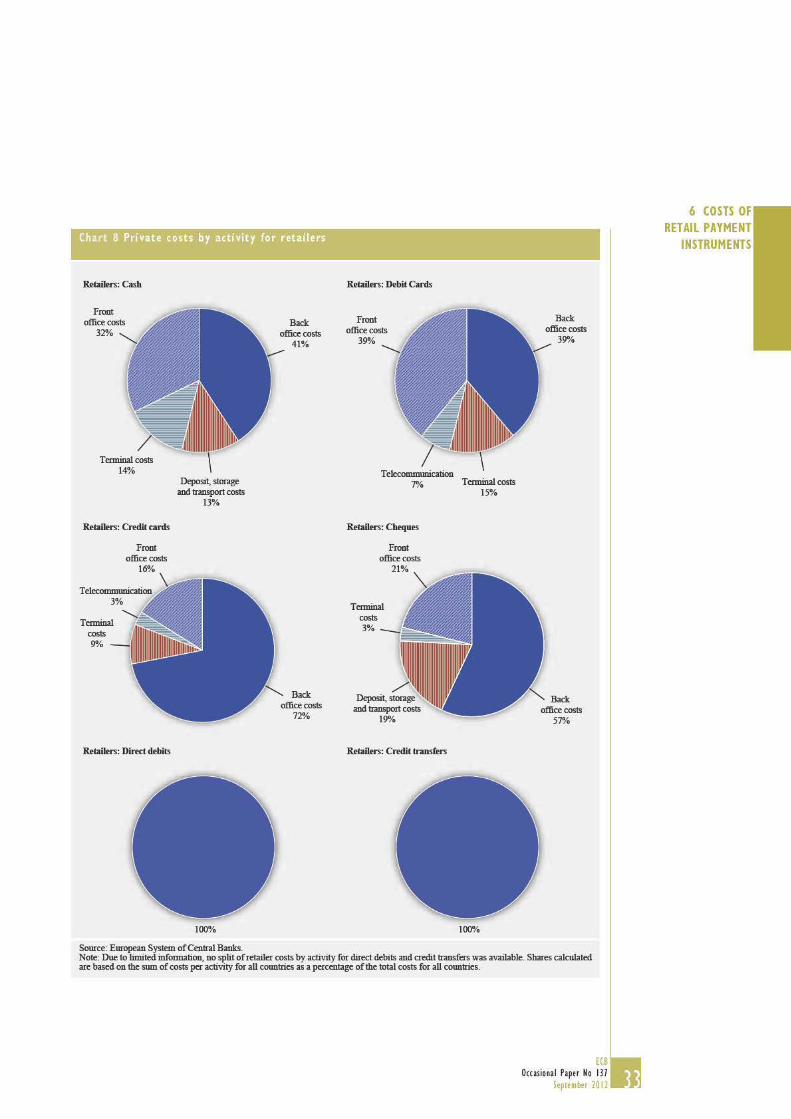
social costs for cash and cards increased from 0.35%
in 2002 to 0.52% of GDP 29 in 2009. Considering
the timespan between the examined periods, it is
common to observe a change in payment habits and
cost structures over time. The social costs of cash
have not changed signifi cantly. However, a larger
proportion of these costs are presently incurred by
retailers. On the other hand, the social costs of cards
have more than tripled, refl ecting the trend towards
higher card usage.
The social costs of cash in the Netherlands 30
have decreased since 2002 (from 0.48% to 0.31%
of GDP), while those of debit cards have only
slightly changed (from 0.12% of GDP in 2002 to
0.11% of GDP in 2009). Therefore, the sum of the
social costs of cash and debit cards has slightly
decreased, indicating higher effi ciency overall.
Similarly, the costs of cash have increased from
€0.30 to €0.39 per transaction. At the same time,
the costs of debit cards have decreased from
€0.49 to €0.33 per transaction, possibly due to
economies of scale. The decrease in the total
costs of cash is mainly due to the fact that cash
usage decreased considerably between 2002 and
2009 31, resulting in a considerable reduction in
costs, especially for merchants. It is impossible
to compare the social costs of credit cards and
e-purses in 2002 and 2009, since current data for
those two payment instruments is unavailable.
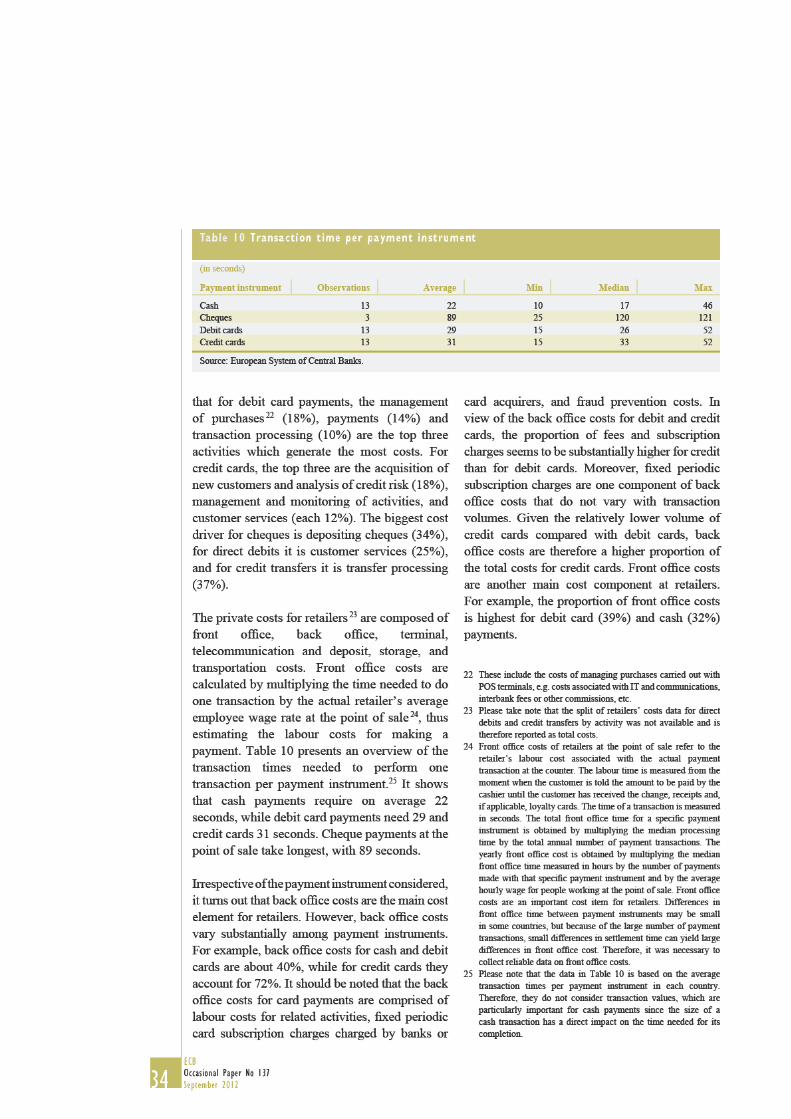
In Finland 32, the social costs of cash and
payment cards over an extended period of time
are estimated to be about 0.30% of GDP. This
result is similar to the 0.34% of GDP seen in
2009, based on the data collected for the present
European study. In addition, the unit costs of cash
for banks, issuing institutions and subcontractors
in Finland have decreased from €0.30 to €0.28
per transaction. Those of cards have decreased as
well, from €0.26 to €0.22 per transaction.
The Hungarian 33, Danish 34, and Swedish 35 studies
in Table 12 are based on the methodology and the
data collected for the European social costs of
payment instruments study initiated by the ECB.
The differences in the results between these studies
and the present one are due to the fact that the two
national studies explore the social costs of
households for making payments, which are out of
the scope of the European study. In addition, there
are two payment instruments in Hungary, business-
to-business (B2B) direct debits and postal
outpayment money orders, which account for less
than 5% of the volume of payments in the country
and are, therefore, out of the scope of the present
study. Finally, postal inpayment money orders,
which are a major means of payment in Hungary,
are treated as credit transfers in the European
study – a classifi cation also used by the ECB’s
Statistical Data Warehouse.
6.5 SIMILARITIES, DISTANCES AND CLUSTERS
OF RETAIL PAYMENT MARKETS
So far, it is apparent that all cost study-participating
countries, as well as each EU27 Member State,
have unique retail payment markets and feature
their own market characteristics. Even though
this holds for all countries, it appears that some
payment markets are more similar or closer to
each other than to other payment markets. In
See Banco de Portugal (2007) for more details27
See Bergman et al (2007) for more details28
This fi gure does not include the social costs to the general public, 29
which were estimated to be about 0 05% of GDP in 2002
See Brits and Winder (2005) for more details30
From about 7 billion payments in 2002 to about 4 6 billion in 31
2009
See Takala and Viren (2008) for more details32
See Turján et al (2011) for more details33
34 See Danmarks Nationalbank (2012) for more details The 34
Danish study presents the total social costs with and without
household costs
35 See Segendorf and Jansson (2012) for more details35
41ECB
Occasional Paper No 137
September 2012
6 COSTS OF
RETAIL PAYMENT
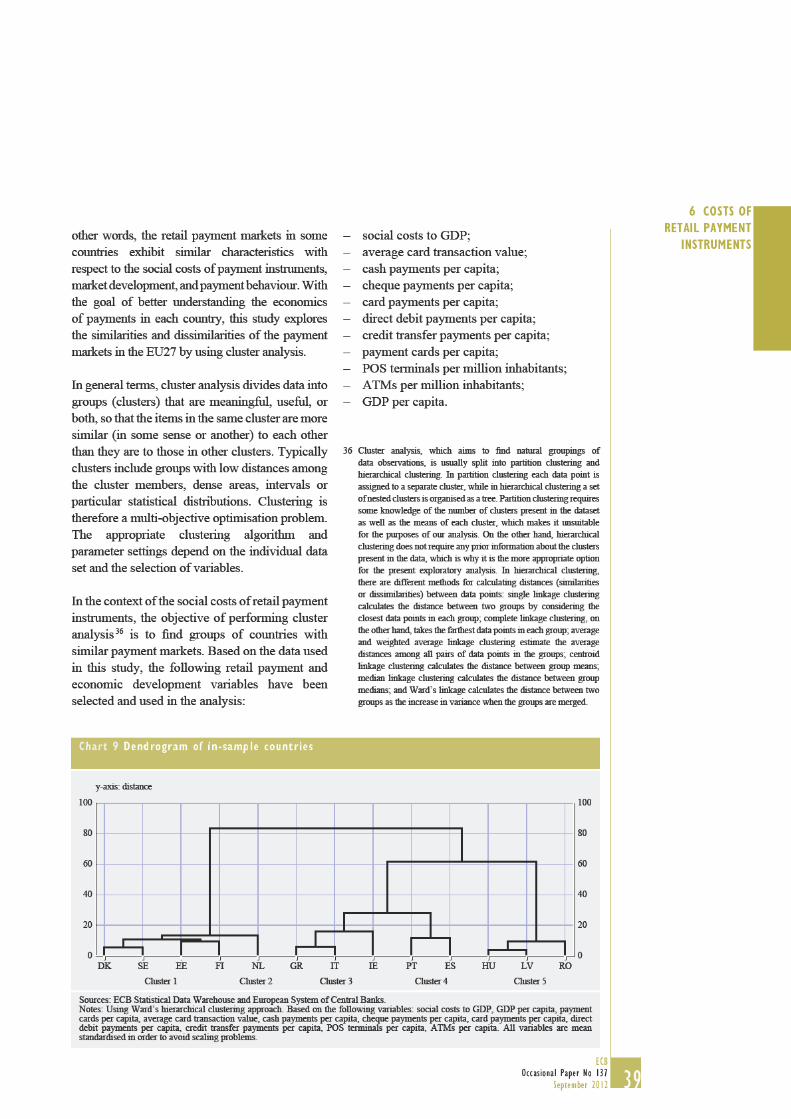
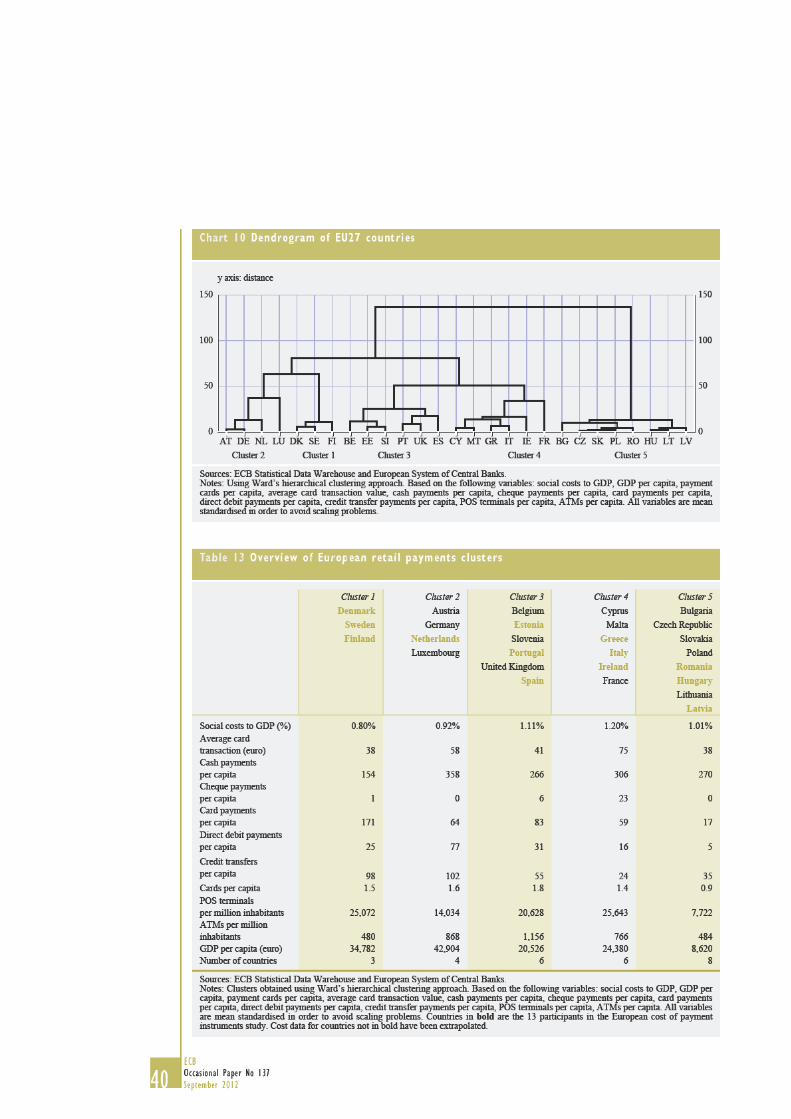
INSTRUMENTSAll variables are mean standardised to avoid
scaling problems. Ward’s linkage 37 hierarchical
cluster analysis is performed on the standardised
measures. Charts 9 and 10 present the
dendrograms 38 resulting from the above analysis
considering the 13 cost study participants and all
EU27 Member States respectively. A three- or a
fi ve-cluster solution results from the analysis.39
The countries that belong to each group of the
fi ve-cluster solution are listed in Table 13. In the
three-cluster solution, clusters 1 and 2 and
clusters 3 and 4 are merged. In short, the countries
in the fi ve clusters can be described as follows:
Cluster 1 countries have relatively low social •
costs of payment instruments, a low number
of cash transactions per capita, low or no
cheque usage, average direct debit payments
per capita and high card and credit transfer
payments per capita. They have a high
number of POS terminals and a low number
of ATMs. The number of cards per capita
is about average, while the average card
transaction is low. This group has relatively
high GDP per capita.
Cluster 2 countries show relatively low •
social costs of payment instruments,
a comparatively high number of cash
payments per capita coupled with an average
number of card payments per capita, high
remote payments per capita, and low (or no)
cheque usage. The cards per capita are high,
while the POS terminals and ATMs per
capita, as well as the average size of a card
transaction, are about average. This group
has a relatively high GDP per capita.
Cluster 3 countries have medium social •
costs of payment instruments, an average
number of cash transactions per capita, a
high number of cheque payments per capita,
and an average number of card and remote
payments per capita. They have a high
number of cards per capita, POS terminals
and ATMs, while the value of an average
card transaction is relatively low. This group
has about average GDP per capita.
Cluster 4 countries have high social costs of •
payment instruments, a high number of cash
and cheque transactions per capita, and an
average number of card and remote payments
per capita. They have a high number of POS
terminals and a roughly average number of
ATMs and cards per capita. The average
card transaction is high. This group has
average GDP per capita.
Cluster 5 countries have about average social •
costs of payment instruments, an average
number of cash transactions per capita, low
or no cheque usage, and low card and remote
payments per capita. They have a low number
of POS terminals, ATMs, and cards per
capita. The average card transaction value is
low. This group represents the countries with
relatively low GDP per capita.
6.6 HOUSEHOLD SURVEY
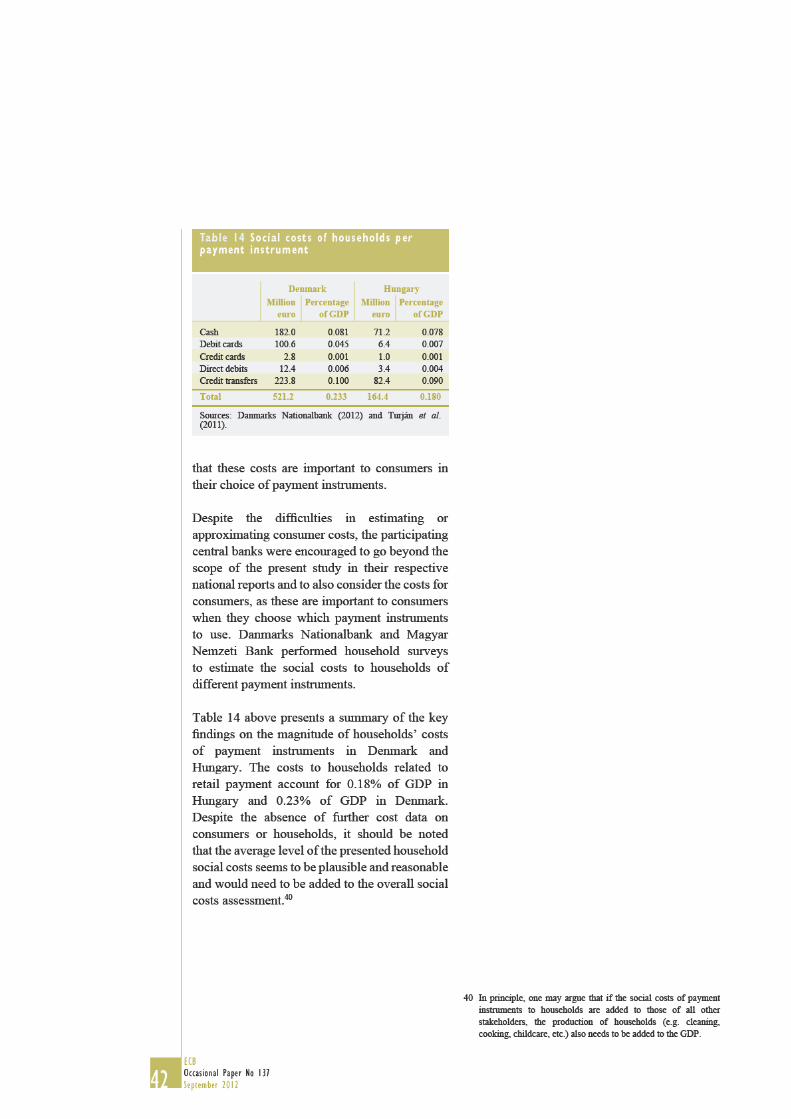
It is important to clarify that consumers and
households incur costs when using retail
payment instruments. Important cost elements
for consumers and households include the
cost of time spent on payment transactions;
the losses on and risks of holding the payment
instruments; and fees paid to payment service
providers, for example on withdrawing cash,
making credit transfers, accepting direct debits,
holding payment cards and account keeping.
These costs are not negligible from a social
perspective. However, as these costs are diffi cult
to quantify and reliable data is not readily
available, it was decided for the purpose of this
study to exclude these costs for consumers and
households. As shown in the previous section,
costs for consumers are typically not included in
different studies. However, it is acknowledged
The distance between clusters is based on a minimum variance 37
linkage
A dendrogram is a tree-like graph which depicts the results of 38
hierarchical cluster analysis It displays the links within and
between groups The distance between data points or groups is
measured by the difference in tree-branch lengths
It should be acknowledged that the results of cluster analysis are 39
exploratory in nature and do not allow for drawing conclusions
on their statistical signifi cance
43ECB
Occasional Paper No 137
September 2012
7 CONCLUS ION
7 CONCLUSION
The European Central Bank (ECB) carried out a
study on the social and private costs of different
payment instruments with the participation of
13 ESCB national central banks. The overall
objective of the study is to enhance the general
understanding of the cost of different payment
instruments from a European perspective, with
the aim of helping policy-makers, banks and
retailers in promoting effi cient payment services.
In particular, the retail payments considered in
the study are cash, cheque, debit and credit card,
direct debit and credit transfers. Furthermore,
this study explores the costs to central banks,
banks and infrastructures, cash-in-transit
companies and retailers; however, the costs to
consumers and households are not considered.
The study provides a snapshot of the social and
private cost situation in 2009. This represents a
fi rst step towards a more dynamic approach to
analysing the rapidly moving European retail
payment market.
The existing literature shows that, in spite
of recent efforts, there is still only limited
knowledge and information available for
making valid comparisons across European
countries of the costs of making payments.
This study provides a comprehensive analysis
and empirical evidence at the European level.
The results of the study show that social costs
of retail payment instruments from a European
perspective are substantial and amount to
€45 billion in total, i.e. on average 0.96%
of GDP considering the 13 participating
countries. When extrapolating the sample
results from the participating countries to all
EU27 Member States, the social costs of retail
payment instruments are comparable to those of
the sample countries and close to 1% of GDP
(€130 billion) irrespective of the estimation
method used. Half of the social costs are incurred
by banks and infrastructures, while retailers
incur 46% of all costs. However, retailers incur
higher private costs than do banks, as they face
higher external costs to be paid to other payment
chain participants. The share of social costs
incurred by central banks and cash-in-transit
companies account for 3% and 1% respectively.
Due to relatively high usage, the cost of cash
is nearly half of the total social costs. On
average, cash payments show the lowest unit
costs, followed closely by debit card payments.
However, in some countries, cash does not
always yield the lowest unit costs. In fact, in
more than one-third of the sample countries,
debit card transactions have lower unit costs
than do cash transactions.
Overall, economies of scale seem to be present
in the provision of retail payment services for
almost all payment instruments. Moreover, the
retail payment industry is characterised by a
relatively high proportion of indirect costs, in
particular for non-cash payment instruments.
Limited country-level data suggest that
households’ costs associated with retail payments
amount to about 0.2% of GDP. Although each
country features its own unique retail payment
market, in a cross-country comparison, the
European market for retail payments can be
grouped into fi ve distinct clusters with similar
payment characteristics.
With these fi ndings, the study intends to provide
a sound basis and a comprehensive framework
for further policy making and conclusions in
relation to the execution and promotion of
cost-effi cient retail payments for society.
Therefore, the results may trigger a fruitful
and constructive debate about suitable policy
measures and payment instruments for
improving social welfare and realising potential
cost savings along the transaction value chain.
44ECB
Occasional Paper No 137
September 2012
ANNEX
METHODS FOR ESTIMATING CASH PAYMENTS
This Annex provides an overview of alternative
methods that were used to estimate the
extent of cash usage at the country level, and
discusses their strengths and weaknesses. This
overview served as a background guide for the
participating central banks to help them select
and apply the method which seemed most
suitable for this study and their national context.
The following seven potential methods have
been discerned:
A consumer survey, enabling the estimation 1.
of both the volumes and values of cash
payments from a sample;
The “cash withdrawal data” approach, 2.
to obtain just the total values of cash
payments;
A retailer survey, enabling the estimation 3.
of both the volumes and values of cash
payments from a sample;
The “cash register statistics” method, to 4.
obtain both the volume and values of cash
payments from a sample;
The “merchant deposit statistics” method, to 5.
obtain just the total values of cash payments;
The “consumption residual” method, 6.
enabling the estimation of just the total
values of cash payments; and
The “circulation residual” method, enabling 7.
the estimation of just the total values of cash
payments.
The fi rst two methods, listed above and
discussed in more detail below, focus on
(reported) consumer behaviour; methods 3 to
5 attempt to exploit statistics collected on the
retailer side; and the fi nal two methods use
high-level aggregates as their starting point.
In the following pages, it is argued that
methods 1, 2, 4 and 5 seem the most promising.
The preferred approaches are methods 2 and
5 for obtaining fi gures for the total values
of cash payments, and methods 1 and 4 for
estimating the total volumes and average size
of cash payments. The volumes and values of
person-to-person payments can only be
estimated using method 1.
1 A CONSUMER SURVEY
The most straightforward way of quantifying
the use of cash in a given country seems to be
conducting a survey among a representative
sample of consumers over a certain period. This
was the approach followed in the studies by
the central banks in Belgium, the Netherlands
and Norway. In such a survey, respondents are
typically asked, by telephone and every evening
for a specifi c period (usually a week or month),
to list all of the payments that they made during
the previous day. They are also asked to provide
details as to the payment instruments used, the
payment amounts, etc. An alternative is to ask
respondents to keep a “payments diary”.
Gresvik and Haare (2008, p. 10) argue that the
consumer survey approach should yield “the
‘correct’ level of use of cash and other instruments
at point of sale”. However, quite apart from the
cost involved, this method is not without its
shortcomings. First, only households are covered,
and respondents may knowingly omit certain
“sensitive” payments. Second, care must be taken
with the representativeness of the consumer
panel. In the study by the central bank in the
Netherlands, this was a source of concern. The
survey was a computer survey and the results were
signifi cantly biased towards electronic payments
(De Nederlandsche Bank, 2004, pp. 35–38). As a
result, the Dutch study relied on the results of a
retailer survey. However, in a later study, Jonker
and Kosse (2009) show that the use of a computer
survey among Dutch consumers does not have
to yield biased results. Third, when considering
the timing of the survey, seasonal fl uctuations
in the use of cash should be kept in mind.
The survey should be conducted during a “normal”
45ECB
Occasional Paper No 137
September 2012
ANNEX
month. Gresvik and Haare (2008), Jonker and
Kosse (2009), and (more recently) Jonker et
al. (2012) collected data in September. Using
information on cash withdrawals and card usage
may be helpful in determining “representative”
months with regard to POS payments. Fourthly,
there are certain parts of the economy in which
payments are made to a large extent in cash,
but infrequently and by a skewed population,
such as buying and selling cars and antiquities,
making purchases at auctions, etc. Fifthly, in
some countries, tourist cash fl ows represent a
large proportion of the cash usage. Finally, and
perhaps most importantly, experience shows that,
even in a well-conducted survey, small-value
(cash) payments may be underreported because
respondents forget about them. Jonker and Kosse
(2009) show that the design of the survey has an
impact on the quality of the results, especially
where small-value payments are concerned. The
use of diaries in which people can record their
payments proves helpful when it comes to them
registering their payments. Also, the period in
which people must register their payments should
be limited, otherwise people tend to forget to
register some of them. Jonker and Kosse (2009)
compare their estimates of the volume and value
of cash payments with information supplied by
retailers. They show that, when consumers are
asked to report one day’s payments in a self-
reported transaction diary, their estimates do not
differ signifi cantly from the information provided
by retailers on cash payments. They consider
seven different methodologies for collecting
data. They show that respondents who are asked
to report in a telephone interview the payments
that they made in the previous day and those
who have to keep a diary for an entire week
report signifi cantly fewer cash payments than the
retailers. They especially underreport small-value
cash payments.
2 THE “CASH-WITHDRAWAL DATA” APPROACH
A second possible approach lies in making
use of data on cash withdrawals from bank
accounts. Data on ATM withdrawals should
be readily available for all countries, but the
same might not be true for OTC withdrawals.
In countries where cashback is given at POS,
data on this, based on available statistics and/or
estimations or samples, should be included. This
approach should yield a reasonably accurate
fi gure for the total value of cash payments;
however, ascertaining a fi gure for the volume
of cash payments would require information on
the average size of POS and person-to-person
cash payments. In some countries, where there
is an imbalance between cash imports and
exports, corrective estimates will be necessary.
The fi gures on cash withdrawals would also
need to be corrected to account for withdrawals
for hoarding purposes: excluding all withdrawals
of €200 and €500 notes, and in some countries
also €100 notes, could be a practical solution
to this. In countries where salaries are to some
extent paid in cash, additional estimates will
again be necessary.
3 A RETAILER SURVEY
A third possible method consists in adding
questions as to the number of payments received,
for example in the course of one month, to the
retailer and company survey. Norges Bank is
one central bank to have adopted this method
and, as Gresvik and Haare (2008, p. 25) point
out, this “could have provided a good basis
for estimating payments at point of sale”.
Unfortunately, the response rate to Norges
Bank’s survey was very low – a hazard that
participating central banks should keep in mind.
The experience of other central banks suggests
that retailers’ answers are of a better quality
than those of consumers, especially if retailers
have hard data on POS payments, i.e. they
register each purchase electronically, including
information on the payment instrument used. In
order to gain an indication of the accuracy of the
information provided by the retailers, they could
be asked what kind of information they are
basing their estimate of cash usage on. However,
it is not easy to cover all relevant “points of
payment”. Also, given the heterogeneity of the
population, scaling up the results of a retailer
survey will always be somewhat more diffi cult
46ECB
Occasional Paper No 137
September 2012
than conducting a consumer survey. Moreover,
this approach might be practical for small
retailers, but the use of the “cash-register
statistics” method detailed below seems more
applicable to supermarkets and other large
retailers who register purchases electronically.
Finally, person-to-person payments are not
covered by this method. In any case, the fi gure
obtained from a retailer survey can be used to
check the fi gure for the volume of cash payments
derived from a consumer survey. In the case
of the Belgian study, the two fi gures proved
to be very close to one another, at 2,909 and
2,866 million, respectively (Banque Nationale
de Belgique, 2005, p. 24).
4 THE “CASH-REGISTER STATISTICS” METHOD
As far as we know, this method has only partly
been applied by EIM (2007), which collected
statistics from the cash registers of some large
retail chains; but in principle, it is feasible to
analyse the data on payments from a sample of
cash registers to see how many cash payments
have been made, what the average amount is, etc.
Unlike the previous retailer-focused method, this
approach would yield hard data. But, just like
the previous method, the reliability of the results
would depend on the use of adequate strata.
The fact that not all retailers in all countries
will have unit-level data on payments, because
they do not have electronic cash registers,
raises issues as to the representativeness of
this method. However, in several countries, the
bulk of payments to merchants (80–90%) are
registered in cash registers.
5 THE “MERCHANT-DEPOSIT STATISTICS”
METHOD
This novel method proposed by Gresvik and
Haare (2008, p. 25) relied on statistics on the
cash deposited by commercial banks at Norges
Bank and at private depots operated by cash-
in-transit companies. If a “single-use cycle” is
assumed (i.e. if it is assumed that, during each
full cycle of the circulation, a banknote or coin
is used in only one transaction), then statistics
on deposits provide an indication of the value of
the cash used in society. As Gresvik and Haare
stress, this should be viewed as a lower-bound
estimate. Indeed, notes and coins can make
“loops” among consumers or between consumers
and merchants at several stages in the cycle.
Cashback at POS represents one such loop.
In countries where cashback at POS is prevalent,
the fi gures on deposits should be corrected on
the basis of statistics on and/or estimations
of the cashback given. When effi cient cash
logistics are in place, merchants will deposit the
whole end-of-day cash balance, but withdraw in
the morning a fi xed cash start-up balance, which
should be subtracted from the deposit fi gures.
Note also that the viability of this method
may differ between countries, as the way in
which cash handling is organised will probably
affect the availability and representativeness
of the statistics on deposits. However,
employing this method could, together with the
“cash-withdrawal data” method, help to estimate
the level of hoarding and the imbalances
between cash imports and exports.
6 THE “CONSUMPTION RESIDUAL” METHOD
A sixth possibility – at least as far as estimating
the value of cash payments is concerned – is to
apply a method developed by Humphrey et al.
(2000 and 2004) and Snellman et al. (2001).
In this method, the value of the cash used at POS
is calculated as a residual. The starting point is
the value of household consumption as it appears
in the national accounts. From this, the value of
goods and services commonly paid for by means
of credit transfers is subtracted in order to obtain
the value of consumption at POS. Subtracting,
in turn, the value of POS transactions made by
cards and cheques – for which reliable statistics
are available – eventually yields an estimate of
the value of POS cash payments. Gresvik and
Haare (2008, p. 16) point out two limitations
of this method. First, household consumption
is underestimated because of the existence of
the underground economy. Second, goods and
services are sold at several stages in the value
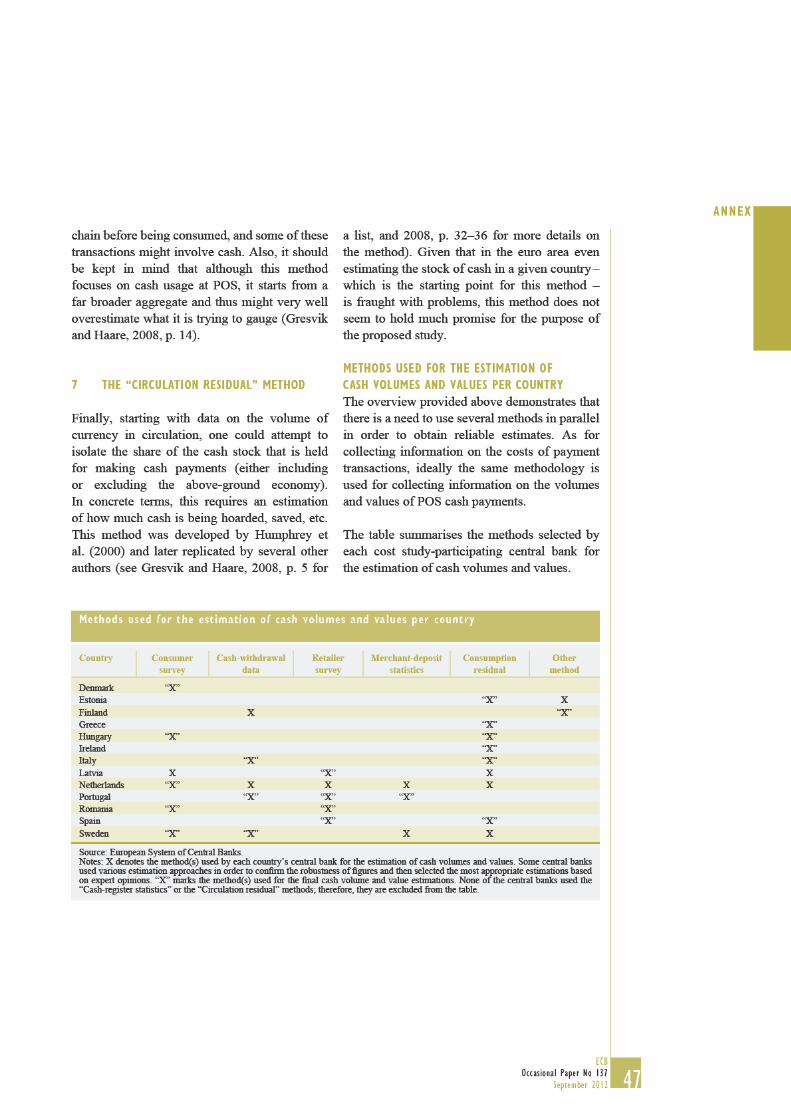
48ECB
Occasional Paper No 137
September 2012
REFERENCES
Banco de Portugal (2007) “Retail Payment Instruments in Portugal: Costs and Benefi ts”.
Banque Nationale de Belgique (2005) “Coûts, avantages et inconvénients des différents moyens
de paiement”.
Bergman, M., Guibourg, G., and B. Segendorf (2007) “The Costs of Paying – Private and Social
Costs of Cash and Card Payments”, Sveriges Riksbank Working Paper Series, No. 212.
Brits, H. and C. Winder (2005) “Payments are no free lunch”, De Nederlandsche Bank Occasional
Studies, Vol. 3, No. 2.
Danmarks Nationalbank (2012) “Costs of Payments in Denmark”.
De Nederlandsche Bank (2004) “Betalen kost geld – Rapport kostenonderzoek
toonbankbetaalproducten” (The Costs of Payments – Survey on the Costs involved in POS Payment
Products), Werkgroep kostenonderzoek toonbankbetaalproducten, Maatschappelijk Overleg
Betalingsverkeer. Available at: <http://www.dnb nl/>.
EIM (2007) “Het toonbankbetalingsverkeer in Nederland. Kosten en opbrengsten van
toonbankinstellingen in kaart gebracht” (Point-of-Sale Payments in the Netherlands: Costs and
Revenues of Merchants), fi nal report, Zoetermeer.
Gresvik, O. and G. Øwre (2003) “Costs and Income in the Norwegian Payment System 2001.
An application of the Activity Based Costing framework”, Norges Bank Working Papers,
No. 2003/8.
Gresvik, O. and H. Haare (2008) “Payment habits at point of sale”, Norges Bank Staff Memo,
No. 6.
Humphrey, D., Willesson, M., Lindblom, T. and G. Bergendahl (2003) “What Does it Cost to Make
a Payment?”, Review of Network Economics, Vol. 2, Issue 2, pp. 159–174.
Humphrey, D., Kaloudis, A. and G. Øwre (2000) “Forecasting Cash Use in Legal and Illegal
Activities”, Norges Bank Working Papers, No. 2000/14.
Humphrey, D., Kaloudis, A. and G. Øwre (2004) “The future of cash: falling legal use and
implications for government policy”, Journal of International Financial Markets, Institutions and Money, Vol. 14, Issue 3, pp. 221–233.
International Bureau of Fiscal Documentation (2006) “VAT Survey Financial Services”.
Jonker, N. and A. Kosse (2009) “The impact of survey design on research outcomes: A case study
of seven pilots measuring cash usage in the Netherlands”, De Nederlandsche Bank Working Papers,
No 221.
Jonker, N., Kosse, A. and L. Hernández (2012) “Cash usage in the Netherlands: How much, where,
when, who and whenever one wants?”, DNB Occasional Studies, Vol. 10, No. 2.
49ECB
Occasional Paper No 137
September 2012
REFERENCES
Kippers, J. (1999) “Over de Toonbank” (Over the counter), De Nederlandsche Bank
Working Paper, Amsterdam, 25 January 1999.
Koivuniemi, E. and K. Kemppainen (2007) “On Costs of Payment Methods: A Survey of Recent
Studies”, Suomen Pankki – Finlands Bank Working Paper Series, No. 6.
Leinonen, H. (2008) “Payment habits and trends in the changing e-landscape 2010+”,
Suomen Pankki – Finlands Bank Expository Studies, A:111.
Nyandoto, E. (2011) “Vähittäismaksamisen kustannukset pankeille” (Costs of Retail Payment
Instruments for Finnish Banks), BoF Online.
Reserve Bank of Australia (2007) “Payment Costs in Australia: A study of the costs of payment
methods”.
Schmiedel, H. (2007) “The economic impact of the Single Euro Payments Area”,
European Central Bank Occasional Paper Series, No. 71.
Segendorf, B. and T. Jansson (2012) “The Cost of Consumer Payments in Sweden”,
Sveriges Riksbank Working Paper Series 262.
Snellman, J., Vesala, J. and D. Humphrey (2001) “Substitution of Noncash Payment Instruments
for Cash in Europe”, Journal of Financial Services Research, Vol. 19, Nos. 2–3, pp. 131–145.
Takala, K. and M. Viren, (2008) “Effi ciency and costs of payments: some new evidence from
Finland”, Suomen Pankki – Finlands Bank Research Discussion Papers, No. 11.
Turján, A., Divéki, É., Keszy-Harmath, É., Kóczán, G. and K. Takács (2011) “Nothing is Free:
A Survey of the Social Costs of the Main Payment Instruments in Hungary”, MNB Occasional
Papers No. 93.
Carbó-Valverde, S., Humphrey, D. B., Liñares-Zegarra, J. M. and F. R. Fernandez (2008)
“A Cost-Benefi t Analysis of a Two-Sided Card Market”, Fundacion de las Cajas de Ahorros,
Working Paper No. 383.