Embed Size (px)
Citation preview

Forthcoming in Organization Science (March/April, 2000)
The Social Capitalof French and AmericanManagers
July, 1999
© Ronald S. BurtUniversity of Chicago and European Institute of Business Administration (INSEAD)773-702-0848; fax 773-702-9919; [email protected]
Robin M. HogarthUniversity of Chicago
Claude MichaudCentre Européen d’Education Permanente (CEDEP) and European Institute ofBusiness Administration (INSEAD)
Authors’ Note — This paper can be downloaded fromhttp://gsbwww.uchicago.edu/fac/ronald.burt/research. The research was supported primarily by theCentre Européen d’Education Permanente, with subsequent support from the European Institute ofBusiness Administration (INSEAD). We are grateful to Professor Emmanuel Lazega for translatingthe survey network questionnaire into French. Joanne Dufour was invaluable as project director;contacting survey respondents and assembling background data from the company records. Forhelpful comments, we are grateful to Ken Frank, Martin Garguilo, Mauro Guillén, Bruce Kogut,Edward Laumann, Arie Lewin, Emmanuel Lazega, Holly Raider, and the Organization Science reviewers (who pushed us deeper into the French literature).

Le capital social des cadres, July 1999, Page 2
The Social Capitalof French and AmericanManagers
Accumulating empirical evidence on American managers shows that socialcapital effects on performance are a function of the information and controlbenefits of bridging structural holes — the disconnections betweennonredundant contacts in a network. Is that network form of social capitalunique to Americans? France seemed to us a productive site forcomparative research because the image from past research is that Frenchmanagers are more regulated than Americans; more regulated bybureaucratic authority and more regulated by peer pressure, with bothamplified by the greater reliance in France on internal labor markets.People comfortable with knowing their place in a chain of bureaucraticcontrol could be uncomfortable with the negotiated control exercised bynetwork entrepreneurs, so the positive association between structural holesand performance in the United States could be negligible or even reversedfor French managers.
We use network and performance data on two study populations ofsenior managers, one in France and one in the United States, to describesocial capital similarities and differences between the populations. J Thenetwork form of social capital is similar in the two populations: Moresuccessful French managers, like Americans, tend to have networks rich instructural holes. The French and American managers make similardistinctions between kinds of relationships. Relations that bridge structuralholes are similarly detached from routine work activities for the French andthe Americans. J The interesting difference is that social capital developsdifferently in the two populations. The French managers operate with a lessporous social boundary around their firm and associate negative emotionswith bridge relations. Reinforcing Aix-en-Provence observations on thesignificance of adult education for Franco-German differences inorganization, we find that exposure to peers in other firms via executiveeducation is for our French managers the only factor positively associatedwith the social capital of bridge relationships.
The brokerage principle in network theory says that there is a competitive
advantage to building bridge relationships. Resources flow disproportionately to
people who provide indirect connections between otherwise disconnected groups.
Brokerage is the principle underlying the structural hole theory of social capital,
and the competitive advantage the theory predicts for entrepreneurial managers
(Burt, 1992). The theory draws on lines of network argument that emerged in
sociology during the 1970s (most notably Granovetter, 1973, on the strength of
weak ties; Freeman, 1977, on betweenness centrality; Cook and Emerson, 1978,

Le capital social des cadres, July 1999, Page 3
on the benefits of having exclusive exchange partners; and Burt, 1980, on the
structural autonomy created by network complexity). More generally, sociological
ideas elaborated by Simmel (1922) and Merton (1957), on the autonomy
generated by conflicting affiliations, are mixed in hole theory with traditional
economic ideas of monopoly power and oligopoly, to produce network models of
competitive advantage.
This is the gist of the argument: The division of labor drives production
specialization such that people and organizations focus on their immediate tasks
to the exclusion of adjacent tasks. With people and organizations focused on their
immediate production tasks, holes emerge in the social organization of production;
functional groups lose track of other functions and the external environment. The
result is multiple rates of return to exchange relations because disconnections
between individuals (in other words, holes in the structure of the market), leave
some people unaware of the benefits they could offer one another. A structural
hole between two groups need not mean that people in each group are unaware of
the other. It simply means they are focused on their own activities such that they
have little time to attend to activities in other groups.
Individuals connected to separate groups are more likely to see the value of
work that coordinates production across certain groups, and to know which
individuals from the groups need to be involved in the project. These managers,
termed “entrepreneurs” in the structural hole argument after the original meaning
of the term, are rich in the social capital of information and control benefits
associated with relations that bridge structural holes. They monitor information
more effectively than bureaucratic control. They move information faster, and to
more people, than memos. Entrepreneurial managers know the parameters of
organization problems early. They are more mobile than a bureaucracy, easily
shifting network time and energy from one solution to another. More in control of
their immediate surroundings, entrepreneurial managers tailor solutions to the
specific individuals being coordinated, replacing the boiler-plate solutions of formal
bureaucracy. To these benefits of faster, better solutions, add cost reductions;

Le capital social des cadres, July 1999, Page 4
entrepreneurial managers offer coordination less expensive than the bureaucratic
alternative.
In sum, managers with networks rich in structural holes operate somewhere
between the force of corporate authority and the dexterity of markets, building
bridges between disconnected parts of the firm where it is valuable to do so.
Empirical evidence is consistent with the social capital prediction (see Burt, 1999,
for review): Individuals with networks rich in structural holes receive more positive
evaluations (Burt, Jannotta, and Mahoney, 1998; Mizruchi and Sterns, 1998;
Mehra and Kilduff, 1999; cf., Krackhardt and Stern, 1988; and Rosenthal, 1996, on
teamwork), earlier promotions (Burt, 1992; Sparrowe and Popielarz, 1995;
Gabbay, 1997; Podolny and Baron, 1997), and higher compensation (Burt, 1997a;
Erickson, 1998; Bielby and Bielby, 1999).
SOCIAL CAPITAL OUTSIDE THE US
Our research question for this paper is whether the structural-hole phenomenon is
peculiar to Americans. The image of network entrepreneurs negotiating for
advantage has a market flavor associated with the American economy, and the
available evidence of social-capital effects on manager performance is limited to
American managers. Given social capital as any network form that creates
competitive advantage, it is reasonable to ask whether social capital in other
societies has the same network form observed in the United States.
FRANCE IN PARTICULAR
We will be reporting results on the social capital of managers in a French firm,
results obtained using the same instruments and methods that have been used to
study the social capital of American managers. France seemed to us an
interesting site for comparative research on social capital because the image of
French organizations thrust upon us by past research is an image of social
boundaries between insiders and outsiders, and coordination by bureaucratic
authority — precisely the lines of demarcation that typically define the structural
holes across which network entrepreneurs broker communication.

Le capital social des cadres, July 1999, Page 5
The popular image of French business is one of dense elite networks
organized around state planning agencies, state-owned firms, and graduation from
the “right” schools ( grande écoles such as the Ecole Polytechnique, discussed as
X because of the crossed belts on the chest of the school’s military uniform, and
the Ecole Nationale d’Administration, discussed by its initials simply as ENA; e.g.,
Barsoux and Lawrence, 1990; Boltanski, 1990; Orrù, 1996; Schmidt, 1996; Szarka,
1992; with Schmidt providing a detailed account of the national government’s
productive intervention in the economy during the 1980s). Anecdotes abound on
interpersonal ties among the elite, but systematic data are virtually non-existent.
Kadushin (1995) provides an exceptional glimpse into the cohesion of an inner-
circle of the French financial elite (28 people selected from a broader network of
125), showing that the strongest predictor of a friendship between two people is
them having both graduated from ENA (the other strong predictor is having the
same political preference). Frank and Yasumoto (1998) provide a still closer look
at Kadushin’s data, revealing systematic avoidance of hostile acts between
members of cohesive subgroups within the inner circle. The important qualification
here is that people at the very top of almost all social systems appear to outsiders
to be a cohesive elite (e.g., see Domhoff, 1967; Moore, 1978; Useem, 1984, for
network images of an American elite similar to Kadushin’s center-periphery
network image of the French financial elite; cf. Mizruchi, 1992:chap. 4).
In this paper, we are less interested in the managers discussed in
newspapers than the managers who do the work. There is an army of senior
French managers below the level of CEO, or the top 28 people in finance. Like the
top people, senior managers below the top tend to be graduates of a grande école ,
but less often one of the top schools in Paris. To understand what social capital
means to this vast majority of French managers, one has to get inside the
organizations behind the mass media headlines.
Much of what we know about French organization per se can be traced to
Crozier’s (1964) study of two government enterprises in the late 1950s: the
manufacturing plants of the government tobacco monopoly, and a large (4,500
person) agency within the postal system. Crozier’s (1964:107-108) central

Le capital social des cadres, July 1999, Page 6
observation concerns the bureaucratic form of the organizations, here describing
the tobacco establishments:
The ideal of bureaucracy is a world where people are bound byimpersonal rules and not by personal influence and arbitrarycommand. The organizational system of the Monopoly has gone along way toward realizing this ideal. It is primarily characterized bythe extent of impersonal ruling. People at the posts of command donot have much leeway. Their response to most eventualities hasbeen fixed in advance; their subordinates know this and can,therefore, act accordingly.
Crozier’s primary inference from his observations is that control by bureaucratic
authority is integral to French organization, not peculiar to his two case studies,
because bureaucratic authority resolves an emotional tension fundamental in
French culture. The French are deeply committed to individual liberty at the same
time that they take it for granted that authority, indeed the absolute authority of bon
plaisir giving unfettered control to the ruler, is needed for co-operation within an
organization. Bureaucratic rules relieve the tension between these contradictory
commitments because when you obey your boss, you obey the rules, not the
individual. Crozier (1964:222-223) summarizes:
. . .the French bureaucratic system of organization is the perfectsolution to the basic dilemma of Frenchmen about authority. Theycannot bear the omnipotent authority which they feel is indispensableif any kind of co-operative activity is to succeed. . . . A bureaucraticsystem of organization of the French type makes it possible to retainsomething of the independence of another time within the frameworkof modern organization. One always obeys the rules, but one neednot submit to other men’s whims.
Personal relationships that cut across lines of bureaucratic control — the very
substance of social capita — would amplify the tension, and are therefore avoided.
Crozier (1964:214-215) notes in the postal agency:
They reported that they very rarely had friends in the agency. Theyreiterated that they preferred having their friends outside. Evenamong those who had friends, the friendships seemed never todevelop into articulate groups. There were very few associations ofany sort — no cultural, educational, or leisure joint activities worthmentioning. . . .More friendships were reported in the IndustrialMonopoly, but they did not develop into cliques or even into stableinformal groups. Cliques were viewed with great disfavor, and groupsthat could cut across several categories were inconceivable. . .

Le capital social des cadres, July 1999, Page 7
.Cliques that cut across categories are especially objectionable, sincethey inevitably foster favoritism, the system’s cardinal sin.
Using personal relations to work around lines of bureaucratic control is an
invitation to exclusion (Crozier, 1964:223): “To compromise, to make deals, to
adjust to other people’s claims is frowned upon; it is considered better to restrict
oneself and to remain free within the narrower limits one has fixed or even those
one has had to accept.” In fact, speaking as if directly to the issue of networks that
span structural holes, Crozier (1964:52) speculates:
Our division head might make better decisions if he tried to establishfor himself some special channel of information, or if he were readyto trust one or several of his subordinates. But if he did either, hewould probably have to combat accusations of favoritism and to facethe possibility of a serious deterioration of the climate, whatever thesoundness of the end result. . . .Routine remains the safest way forhim, whatever his own feelings. One may wonder more about the(very infrequent) innovating decisions than about the reiteration ofroutinized behavior.
More succinct in summary, Crozier (1964:220) writes; “If a group member shows
initiative, he risks being deserted by his fellows and being deeply humiliated.”
FRANCE RELATIVE TO ELSEWHERE
Subsequent research has enriched Crozier’s image of the French. It has enriched
the image with a deeper understanding of the connection between French culture
and bureaucracy, but a particularly useful quality of subsequent research has been
its comparative content.
Case Studies
Noteworthy in this regard is the research collaboration between sociologists and
economists at Aix-en-Provence describing metalworking and petrochemical
operations in matched French and German organizations (Maurice, Sellier and
Silvestre, 1982; Rose, 1985), and d’Iribarne’s (1989, 1991, 1994) description of a
French aluminum smelter relative to aluminum smelters in eight other countries.
Like Crozier before them, the Aix scholars emphasize the bureaucratic form
of French organizations, but give it a more subtle rationale. The French and
German study organizations perform similarly with the same technology, but true

Le capital social des cadres, July 1999, Page 8
to Crozier’s image, there is more bureaucracy in the French ones. There are more
supervisory job categories in the French organizations, and a larger proportion of
the workforce hold such jobs, especially middle management jobs (e.g., Maurice et
al., 1982:61-65). The more elaborate bureaucracy is traced to the French
educational system. Crozier (1964:238-244) saw the education system as an
important factor in that growing up under autocratic teachers, studying an abstract
curriculum, with fierce peer competition was preparation for later life in the same
conditions under French bureaucratic control. However, Crozier proposed no
mechanism to link the educational and economic systems other than their
similarity in organizational form. French culture was held to shape both systems.
With observations across industries and cultures, the Aix scholars offer a more
precise image of external forces shaping the organization. The German
educational system sorts students into distinct curriculum tracks leading to
occupation-related educational credentials. Graduates have a professional identity
above and beyond their employer. Skill within a profession is the principal criterion
for promotion and compensation. The French educational system sorts students
primarily by abstract reasoning. Sorted by general ability rather than occupation-
related skills, graduates have an identity less defined by a profession than by a
sense of their relative (high or low) position in society. French firms more than
German firms have to provide occupation-related training, but there is no incentive
to provide the German training that prepares people to work in a profession
regardless of employer. Rather, company-sponsored training emphasizes
company-specific concepts and methods which creates dependence on internal
labor markets within French companies.1 The result is that promotion and
compensation is determined more by seniority in France than in Germany, and
French managers are notably less mobile than their German counterparts
(Maurice et al., 1982:Chaps. 1-2). Thus, the Aix research corroborates Crozier’s
1With their focus on societal forces shaping organizations, the Aix scholars explicitly reject
the concept of an internal labor market with its focus on processes within the firm (Maurice et al.,1982:197-212). Nevertheless, the Aix research shows French firms relying more on promotionfrom within, and it is in that specific sense that we mean the research shows the French moredependent on internal labor markets.

Le capital social des cadres, July 1999, Page 9
image of bureaucracy in French organizations, but grounds it in a more precise
mechanism by which external societal conditions, most notably the educational
system, are responsible for the French reliance on bureaucratic authority.
In contrast to Crozier’s cultural determinism (d’Iribarne, 1994), and to the Aix
emphasis on societal factors (d’Iribarne, 1991), d’Iribarne’s (1989) close
observation of employees in a French aluminum plant relative to similar plants in
the United States and elsewhere led him to focus on peer pressure within status
categories. He reports frequent negotiations over control in the French plants
(d’Iribarne, 1994:83-84; cf. Berry, 1995:111; Maurice et al., 1982:Chap. 3), guided
by peer pressure, discussed as an honor principle, in which employees are
motivated to do their duty (d’Iribarne, 1994:85):
The sense of duty that emerged from the interviews conducted in thefactory had its roots neither in respect for contracts or the law nor inany search for consensus. It was based rather on the dedicatedfulfillment of obligations that traditionally fall to the particularoccupational category to which each individual belongs. Manyexpressions such as ‘doing one’s job’, ‘doing one’s work properly’, ‘Ido my job as normal’, ‘a supervisor has to do that’ and ‘that’s part ofmy function as a technician’ reflected this form of the sense of duty.Such a notion of duty is accompanied by vigorous resistance tosituations of dependency, as far as the design and execution of workare concerned, on people (management, other departments) outsidethe occupational group to which one belongs.
With respect to social capital, the difference between Crozier and d’Iribarne is a
matter of emphasis more than contradiction. While Crozier emphasizes the central
role of bureaucratic rules, he too notes instances of his bureaucrats negotiating
over application of the rules (see d’Iribarne, 1994:86-88, for page references).
Scholars familiar with network theory should recognize in d’Iribarne’s honor
principle the network mechanism of peer pressure created by competition among
structurally equivalent peers (e.g., Burt, 1987; Mizruchi, 1992; Marsden and
Friedkin, 1994), and note that although d’Iribarne’s Frenchmen differ from
Crozier’s in the source of regulation over their behavior — d’Iribarne’s regulated by
peer pressure, Crozier’s regulated by bureaucratic authority — both scholars
describe employees operating under tight controls within their organizations. Even

Le capital social des cadres, July 1999, Page 10
the difference in emphasis should not be overstated. Crozier (1964:191) too notes
control by peer pressure:
. . .where there can be no cliques that unite people of different strata,the peer group — i.e., the group of equal members of the samestratum — becomes the only force that stands between the individualand the organization. . . .Deviant impulses will be severelysanctioned, and the discipline imposed by the peer group will be oneof the main forces, apart from the rules, which regulate behavior. . ..The importance of the peer group was marked in our two casestudies, and especially in the Industrial Monopoly, by the remarkableconcordance of answers among members of the same group for allrelevant matters, and also by the discrepancy between privateopinion, which could be deviant, and publicly expressed opinion,which had to follow the official line.
Chains of command in the corporate hierarchy define a person’s status group —
clear chains of command means clearly defined status groups — and peer
pressure aligns people within status groups. The case studies thus present
French employees regulated twice over, first by bureaucratic authority outside the
job category, then by peer pressure within the category. It is this regulation,
whether by bureaucratic authority or peer pressure, that contradicts the idea of
social capital created by a network that cuts across the chains of command
defining structural holes in an organization.2
Survey Research
Survey research generalizes the felt reality of the case studies in supporting
Crozier’s image of French organizations. Even convenience samples of managers
show a more bureaucratic perspective in France. For example, Laurent (1983)
reports opinion polls of 817 managers from the United States and nine European
countries in executive education programs. French managers were more likely
than managers from any of the other nine countries to agree with the opinion that
organizations were primarily an authority system (Laurent, 1983:82; cf. Hofstede,
2More bureaucracy should not be read as a competitive disadvantage. Ziegler (1995)
describes how France moved more effectively than Germany to introduce digital switching devicesin their telecommunication industry because the task required technological consensus acrossorganizations, which was better provided by a state-sponsored technical elite. On the other hand,Germany moved more effectively than France to convert the machine tools industry to computer-aided manufacturing because the task involved diffusing new technology to many small machine-tool companies, and that task was better performed by decentralized professional groups.

Le capital social des cadres, July 1999, Page 11
1991:140-142, for a similar result comparing M.B.A. students from Britain, France,
and Germany). Lubatkin et al. (1998) offer a more controlled inference to the
same end. To learn about national variation in acquisition management, they
surveyed 753 top managers in 275 British and French firms recently acquired by
British or French firms. Consistent with Crozier’s image of the French, they find
that the French firms were more likely to control key strategic questions in an
acquired firm, and were more likely to exercise control by using their own
managers to staff key positions in an acquired firm (as in the pantouflage
movement of senior civil servants to senior positions in state-owned business
enterprises to ensure enterprise coordination with government policy, e.g.,
Schmidt, 1996). Thus, Lubatkin et al. (1998:673-674) confirmed their initial
expectation: “. . .that French firms, more than British firms, will exercise tighter,
more direct managerial control . . . when establishing headquarters-subsidiary
linkages.”
The most ambitious effort continues to be Hofstede’s (1980) surveys
conducted between 1967 and 1973 with tens of thousands of IBM employees in 40
countries.3 Although IBM had a strong, conservative organization culture at the
time (in fact, competitors still judged the IBM culture in the late 1970s to be the
strongest in the industry, Kotter and Heskett, 1992:155-165), opinion differences
between country offices were expected because employees were (Hofstede,
1980:40): “almost exclusively nationals of the country, except in the first years of
the creation of new subsidiaries. This applied all the way through the level of
country general manager with few exceptions.” Hofstede’s study continues to be
widely cited (e.g., the Social Science Citation Index reports 212 citations to the
study in 1998 alone) and has been a template for subsequent studies of business
values (e.g., McGrath, Macmillan, and Scheinberg, 1992). We use the study to
3Survey instruments evolved over the course of the study, involving more than 40 countries
and repeated interviews with some respondents (Hofstede, 1980:46): “With 65 countries (66including the U.S.) and about 88,000 different respondents on about 117,000 questionnaires, theHERMES data bank represents probably the largest body of survey data ever collected with oneinstrument up to that time.” The comparative work across countries, however, was based on asubset of the data — from employees in marketing and service within 40 of the 66 countries(Hofstede, 1980:41). The 1980 edition is no longer in print. Our page references are to the 1984abridged edition available in 1999. Scores on the four culture dimensions for the 40 countries,excluded from the abridged edition, are listed on page 315 of the 1980 edition.

Le capital social des cadres, July 1999, Page 12
show that it’s broad survey results are consistent with case studies showing
employees more regulated within French organizations, and to put our Franco-
American comparison into broader perspective.
——— Figure 1 About Here ———
Figure 1 is a summary of the international differences in Hofstede’s study.
With a judicious blend of factor analyses, intuition, controls for occupational
differences between countries, and comparisons to country-specific studies,
Hofstede concluded that there were four dimensions to business culture. The 40
countries studied are listed in Figure 1 with coordinates on the horizontal (X) and
vertical (Y) axes of the spatial map in the figure. To the right of the coordinates
are each country’s standardized scores on Hofstede’s four dimensions. The
spatial map in Figure 1 is a multidimensional scaling in which two countries are
close together to the extent that they have the same scores on the four dimensions
of business culture. For example, Great Britain and the United States are close to
one another in the spatial map because they have similar business cultures. Look
at their respective scores on the four dimensions to see that the two countries are
similarly below average on Power Distance, have the highest scores on
Individualism, are similarly below average on Uncertainty Avoidance, and similarly
above average on Masculinity.4 Reducing the business culture of a country to four
numbers involves heroic simplification. Bear in mind that Hofstede’s study is a
survey so it is less useful for the description it provides of any one culture than it is
4We obtained the spatial map in Figure 1 by computing the Euclidean distance between
business cultures in each pair of countries: (dij) 2 = (PDi - PDj)2 + (UAi-UAj) 2 + (Ii-Ij) 2 + (Mi-Mj) 2,where dij is the distance between countries i and j, and PDi is country i’s z-score on the PowerDistance dimension of business culture. We then applied Kruskal’s (1964) nonlinearmultidimensional scaling algorithm to the (40,40) matrix of distances to obtain the X-Y coordinatesthat best preserved relative distances between the countries. The two-dimensional solution is agood summary of international differences. Input distances are correlated .92 with distances inFigure 1(.16 stress coefficient). Adding a third dimension improves the map’s descriptive accuracy(.05 stress coefficient). However, we present the two-dimensional solution because three-dimensional maps are difficult to read, and the third dimension primarily distinguishes countries onMasculinity, which is not central to our Franco-American comparison. Two principal componentsdescribe 89% of the variance in Power Distance, Individualism, and Uncertainty Avoidance. Wepresent z-scores on the culture dimensions in Figure 1 because raw scores only have meaningrelative to one another, so the mean and standard deviation are an informative frame of referencefor judging a country high or low on a culture dimension. Each z-score is a country’s raw score,minus the average for all 40 countries, quantity divided by the standard deviation of scores acrossthe 40 countries. The spatial map in Figure 1 is virtually identical if based on Euclidean distancescomputed from raw scores on the four culture dimensions (.99 canonical correlation betweencoordinates for the raw-scores and coordinates for the z-scores).

Le capital social des cadres, July 1999, Page 13
useful as a frame of reference for discussing relative magnitudes of difference
between cultures. Britain and the United States have similar business cultures in
Figure 1, but closer inspection reveals very different views of management
(Guillén, 1994:266-278).
Franco-American differences on each of Hofstede’s culture dimensions are
consistent with the image of employees more regulated within French
organizations. For example, IBM’s French employees were more comfortable with
power differences between levels of their organization. Power Distance refers to
employee comfort with superiors having more power than subordinates. The
questions combined to measure Power Distance (Hofstede, 1980:65): “. . .deal
with the perceptions of the superior’s style of decision-making and of colleagues’
fear to disagree with superiors, and with the type of decision-making which
subordinates prefer in their boss.” The higher score for France is consistent with
the image of more regulation within French organizations (at the bottom-right in
Figure 1, Power Distance in France is 1.4 standard deviations higher than the
score for the United States).
IBM’s French employees were more comfortable with rules and rituals.
Uncertainty Avoidance concerns the extent to which employees cling to rules and
rituals to give them a sense of control over the future. The questions combined to
measure Uncertainty Avoidance concern rule orientation, employment stability,
and stress (Hofstede, 1980:110). The higher score for France is consistent with
the image of more regulation within French organizations (score for France is 1.7
standard deviations higher than the score for the United States).
IBM’s French employees were less comfortable with individual initiative.
Individualism concerns the extent to which employees prefer independence,
Tönnies’ Gesellschaft over Gemeinschaft . Employees high on Individualism opine
that they want a job that leaves time for their personal life, involves challenging
work, and in which they have the freedom to devise their own approach to the job
(Hofstede, 1980:148, 156). The lower score for France is consistent with the
image of more regulation within French organizations (United States score is the
higher than for any other country, French score is .8 standard deviations lower).
Le capital social des cadres, July 1999, Page 14
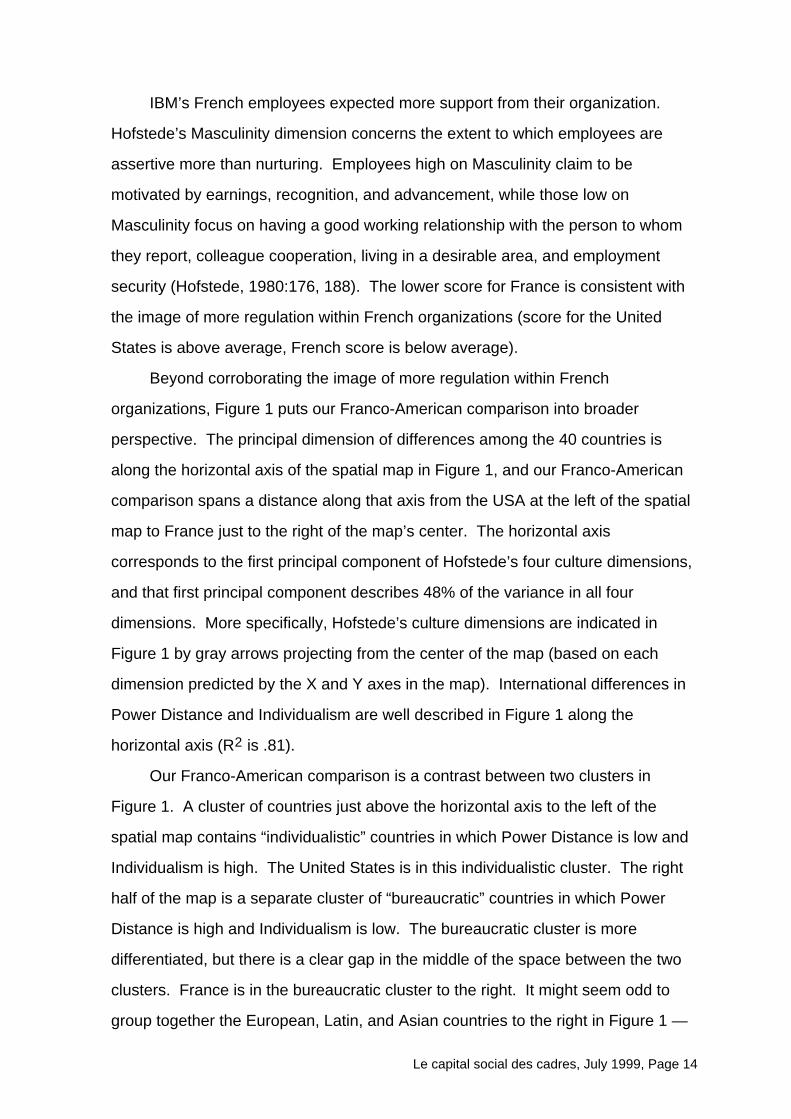
IBM’s French employees expected more support from their organization.
Hofstede’s Masculinity dimension concerns the extent to which employees are
assertive more than nurturing. Employees high on Masculinity claim to be
motivated by earnings, recognition, and advancement, while those low on
Masculinity focus on having a good working relationship with the person to whom
they report, colleague cooperation, living in a desirable area, and employment
security (Hofstede, 1980:176, 188). The lower score for France is consistent with
the image of more regulation within French organizations (score for the United
States is above average, French score is below average).
Beyond corroborating the image of more regulation within French
organizations, Figure 1 puts our Franco-American comparison into broader
perspective. The principal dimension of differences among the 40 countries is
along the horizontal axis of the spatial map in Figure 1, and our Franco-American
comparison spans a distance along that axis from the USA at the left of the spatial
map to France just to the right of the map’s center. The horizontal axis
corresponds to the first principal component of Hofstede’s four culture dimensions,
and that first principal component describes 48% of the variance in all four
dimensions. More specifically, Hofstede’s culture dimensions are indicated in
Figure 1 by gray arrows projecting from the center of the map (based on each
dimension predicted by the X and Y axes in the map). International differences in
Power Distance and Individualism are well described in Figure 1 along the
horizontal axis (R2 is .81).
Our Franco-American comparison is a contrast between two clusters in
Figure 1. A cluster of countries just above the horizontal axis to the left of the
spatial map contains “individualistic” countries in which Power Distance is low and
Individualism is high. The United States is in this individualistic cluster. The right
half of the map is a separate cluster of “bureaucratic” countries in which Power
Distance is high and Individualism is low. The bureaucratic cluster is more
differentiated, but there is a clear gap in the middle of the space between the two
clusters. France is in the bureaucratic cluster to the right. It might seem odd to
group together the European, Latin, and Asian countries to the right in Figure 1 —

Le capital social des cadres, July 1999, Page 15
until one thinks about the importance of status in societies ordered by bureaucratic
authority, whereupon there is similarity between d’Iribarne’s (1989) emphasis on
the peer pressure associated with doing one’s duty in France, and claims that
Asian managers are motivated to preserve “face” (e.g., Kim and Nam, 1998).
In other words, our comparison of French with American managers should
resemble a comparison of French with German managers (Maurice et al., 1982;
Ziegler, 1995), or French with British managers (Calori et al., 1997; Lubatkin et al.,
1998). All three comparisons involve managers under more regulation within their
organizations compared to managers under less regulation. Other comparisons
could be expected to replicate our Franco-American comparison. French
managers could be compared to managers in individualistic countries other than
the United States, countries adjacent to the United States in Figure 1 such as
Australia, Canada, or Ireland. Or, Americans could be compared to managers in
bureaucratic countries other than France, countries such as Brazil, Spain, or the
Philippines.
In sum, of the many ways that cultures differ in Hofstede’s study, our Franco-
American comparison, like the research we discussed comparing France with
Germany and Britain, lies along the principal dimension of international differences
— the difference between individualistic and bureaucratic cultures distinguished on
the horizontal axis in Figure 1.
IMPLICATIONS FOR SOCIAL CAPITAL
France could be a productive site for comparative research on social capital
because French managers are more regulated than Americans; more regulated by
bureaucratic authority and more regulated by peer pressure, with both amplified by
the greater reliance in France on internal labor markets. More regulation could
have any or all of the following implications for social capital: fewer personal
relationships across structural holes, less comfort with such relationships when
they do occur, and less productive use of such relationships. People comfortable
with knowing their place in a chain of bureaucratic control could be uncomfortable
with the negotiated control exercised by network entrepreneurs — ça c’est

Le capital social des cadres, July 1999, Page 16
déclassé, or worse: The positive association between structural holes and
performance in the United States could be negligible or even reversed for French
managers .
Still, the network form of French social capital remains an empirical question.
The influential observations by Crozier, the Aix scholars, and d’Iribarne that so
define how we view French organizations describe conditions decades past. The
seven years for which the Aix scholars observed their study firms notwithstanding,
French firms today operate in a more global economy and reflect the general
corporate trend toward more decentralized, flexible authority structures in which
the social capital of structural holes is so valuable. 5 French managers, especially
middle managers, have an increasing autonomy and span of control (Schmidt,
1996: 393ff.). This is not to say that a French preference for authority rather than
negotiation has disappeared (e.g., Crozier, 1989), or that the transition away from
bureaucratic hierarchy won’t be more difficult in France (than in countries further to
the left in Figure 1 such as Germany, Britain, or the United States, e.g., Rose,
1985:80ff). The point is only that decentralization has created opportunities for
autonomy, which could allow network entrepreneurs to add value with
relationships that span the structural holes in their organization. In fact, Jean-
René Fourtou, CEO of Rhône-Poulenc, one of the largest French corporations,
emphasizes the importance of what we have been discussing as structural holes.
Quoted in the business magazine Fortune , Fourtou emphasizes the importance of
le vide , referring to the empty space between groups (November 25, 1996, p. 165);
“ Le vide has a huge function in organizations. . . . Shock comes when different
5Moreover, there are more and less bureaucratic organizations in every country, even within
a single company. Within the United States, for example, staff officers in a financial company workunder more bureaucratic control than do the company’s investment bankers, but both kinds ofmanagers show higher performance when they have a network that spans structural holes (Burt,1999:Figure 3). The military is an familiar extreme-case of bureaucratic control, yet observers longago saw the American military shifting from bureaucratic to negotiated control (Janowitiz,1957:108): “Although military formations are still organized on the basis of discipline, militarycommand involves an extensive shift from domination to manipulation as a basis of authority.Manipulation implies persuasion, negotiation, and explanation of the ends of the organization. . ..the professional soldier is required more and more to acquire skills and orientations common tocivilian administrators and even political leaders. . . .Not only must the professional soldier developnew skills necessary for internal management; he must develop a ‘public relations’ aptitude, inorder to relate his formation to other military formations and to civilian organizations.”

Le capital social des cadres, July 1999, Page 17
things meet. It’s the interface that’s interesting. . . . If you don’t leave le vide , you
have no unexpected things, no creation. There are two types of management.
You can try to design for everything, or you can leave le vide and say, ‘I don’t
know either; what do you think?’”
RESEARCH DESIGN
Our research design relies on the studies of American social capital as a baseline.
These studies support the hypothesis that performance is higher for managers
with a network that spans structural holes (see Burt, 1999, for review). The design
for this study was to obtain performance and network data on senior managers in
a French firm and ask if their social capital differs in any systematic ways from the
social capital of comparable American managers. This is not a research design
that would allow us to draw inferences about all French managers, any more than
the usual research results on managers in an American firm would be sufficient
foundation for drawing inferences about all American managers. The best we can
do is to reject the hypothesis that the network form of social capital observed
among American managers is unique to Americans. It will be clear from our
results that social capital has the same network form in at least one study
population of French managers.6
DATA
We have data on two study populations of managers at the top of organizations
that are global market leaders, one in the United States, the other in France. Our
6Luthans and his colleagues used a similar research design. Luthans, Hodgetts and
Rosenkrantz (1988) report a network effect on performance for American managers drawn fromseveral firms. Luthans, Welsh and Rosenkrantz (1993) then used the Luthans et al. (1988) studyas a frame of reference for research showing a similar association in a sample of managers in aRussian textile factory. Performance was measured in these two studies by the ratio of amanager’s rank to his or her years with the firm (which, presuming an internal labor market,measures the speed with which a manager has been promoted across ranks), and networks weremeasured with an observer’s count of the frequency with which a manager was seen (Luthans etal., 1988: Chap. 1; Luthans et al., 1993:751): “interacting with outsiders and socializing/politickingduring working hours.” In both studies, managers were most often observed performing thetraditional functions of planning, solving problems, monitoring performance, exchanging routineinformation and processing paperwork, but network activity was the variable most associated withperformance. Ours is a similar point with respect to French managers, but advances in networkanalysis allow us to make more precise statements about network structure and its effects.

Le capital social des cadres, July 1999, Page 18
data on the Americans come from another project and are described in detail
elsewhere (Burt, 1992, 1995, 1997a). We use these Americans as a frame of
reference in studying the French managers because they are similar to the French
managers in several ways, and we have nearly identical network data on the two
study populations.
The two populations are similar in three ways. The most obvious is
organization size. Both study populations come from organizations that are global
market leaders with tens of thousands of employees. The American firm is a
leading electronic components and computer company. The French firm is a
leading chemical and pharmaceutical company.
Research and development is a central focus in both firms. Their products
define the leading edge of technology in markets where the leading edge is
lucrative and moves quickly. Managers in both firms discuss and evaluate
colleagues in terms of their familiarity with the latest technology. Research and
development is not everywhere characteristic of the French firm, but it is certainly
characteristic of the division to which we had access — 97% of the study
population managers have graduate degrees of some kind, 37% of which are
doctorates or the French equivalent.
Third, both populations are composed of senior managers. From the
American firm, we have a probability sample of 170 men in the three ranks
beneath vice-president. Putting aside the few employees at higher rank (on whom
we do not have data), and the few women in the study-population ranks (Burt,
1998), the 170 men represent the top three percent of their firm’s employees. Our
background and performance data on each manager come from the company‘s
personnel files (Burt, 1992:118-131). The managers represent diverse corporate
functions; sales and service (32%), marketing (16%), engineering and production
(25%), and the usual administrative functions such as information systems,
finance, and human resources (27%). They vary in age from their early thirties to
mid-sixties (43.2 mean) and have been with the firm for one to thirty years (11.5
mean).
From the French firm, we have data on 60 managers who are a
representative sample of the 85 managers in the three ranks beneath the most

Le capital social des cadres, July 1999, Page 19
senior people (ranks beneath Directeur Général ) in a division which, at the end of
1996, contained 9% of the firm's employees and contributed 23% of its operating
income. Again, our background and performance data on each manager come
from the company’s personnel records. The managers vary in rank from function
heads ( Etat Major ) down to heads of product groups ( Chef , or Cadre ), and work in
diverse functions; sales and service (12%), engineering and production (20%),
marketing (22%), research and development (20%), as well as the usual
administrative functions such as information systems, finance, human resources
(26%). They vary in age from their mid-thirties to late fifties (48.9 mean), and have
been with the firm for one to thirty-five years (20.8 mean). A large portion of the
study population returned completed questionnaires (71%), and those who did are
a representative sample of the population: There are no statistically significant
differences between respondents and non-respondents on salary (0.9 t-test, P =
.36) or any other of the population variables used below in Table 1 to predict
salary.
PERFORMANCE
We remove the effects of demographic and human capital factors from manager
performance to see how each person is doing relative to his peers (a generic use
of the method of residues, e.g., Coleman, 1964: 469ff).
Early Promotion in the American Company
Compensation is an obvious performance measure, but salary in the American
firm was too closely tied to job rank to make it an interesting performance variable
for the corporate officers requesting the research. The interesting performance
variable was how early a manager reached his current senior rank. Whether
promoted internally or hired from the outside, people promoted to senior rank in
large organizations have several years of experience preceding their promotion. A
period of time is expected to pass before people are ready for senior rank (see
Merton, 1984, on socially expected durations; Burt, 1992: 196-197, for application
to these data). How much time is an empirical question. Some are promoted
earlier than others.

Le capital social des cadres, July 1999, Page 20
Our performance variable in the American study population, early promotion ,
is based on the difference between when a manager was promoted to his current
rank and a baseline model predicting the age at which peers had been promoted
to the rank: E(age) - age. To define expected age, E(age), regress age-at-
promotion-to-current-rank across background variables for manager education,
race, gender, seniority in the firm, rank, function, and plant location (see Burt,
1992: 126-131, for details on the variables and the prediction). The prediction
describes twelve percent of the variance in age-at-promotion-to-current-rank, and
residuals have an attractive normal distribution (see Burt, 1995:610, for
histogram). Early promotion is the residual from the prediction. A manager
promoted to his current rank at a younger age than peers was promoted early
(E(age)-age > 0).
To compare performance in the two study populations, we standardized early
promotion across all 547 sample managers from the American study population (of
whom we are here analyzing the 170 senior men who returned completed
questionnaires) to zero mean (managers promoted to current rank at the age at
which peers on average are promoted to the rank) and unit variance (so a score of
1.5, for example, means that the manager was promoted to his current rank early;
one and a half standard deviations earlier than people like him were typically
promoted to the rank).
Relative Salary in the French Company
We computed an early promotion variable for the French managers, but it was a
poor indicator of performance because the managers are so similar in their age at
promotion to rank.7 They were, however, differentiated by compensation. Model I
in Table 1 shows that a large portion of variance in annual salary (72%) can be
7Age and rank are more closely associated in the French firm than in the American.
Expected age at promotion is 12% of the age variance in the American firm, and managers varysubstantially around the average; from one manager promoted 15 years early to another promoted13 years late. In the French firm, 91% of the age-at-promotion-to-current-rank variance can bepredicted from rank, and managers are closer to the prediction; varying from one managerpromoted four years early to another promoted three years late. More critically, early promotionhas no correlation in the study population with relative salary (r = -.08) nor in the sample with thenetwork constraint measure of social capital (r = .05). There appears to be a system matchingranks to age in the French firm such that being promoted to senior rank a few years early or late isa matter of chance.

Le capital social des cadres, July 1999, Page 21
predicted from a manager’s rank (dummy variables distinguishing job ranks) and
age (statistical tests for age-rank interaction effects on salary are not significant).
The residual 28% of salary variance is our performance variable, relative salary . A
manager’s relative salary is the extent by which his salary was higher than the
average salary expected for someone in his rank at his age: salary - E(salary),
where Model I in Table 1 is the age-rank baseline that defines expected salary
(salary amounts in French francs are standardized to z-scores in Table 1 to
preserve confidentiality). To compare performance in the two study populations,
we standardized relative salary across managers in the study population to zero
mean (manager receives a salary typical for someone his age at his rank) and unit
variance (so a score of 1.5, for example, means that the manager‘s salary is one
and a half standard deviations higher than the salary typically paid to people in his
rank at his age). Relative salary is the dependent variable in Model IV. Age and
rank have no association with relative salary because the sample is representative
of the study population and relative salary is raw salary adjusted across managers
in the study population for age and rank.
——— Table 1 About Here ———
We do not have extensive background data on the French managers, but
what we have reveals no background factors beyond age and rank that define
expected salary. Model II in Table 1 predicts salary across all managers in the
study population. Models III and IV describe only the sample managers (the two
network variables at the bottom of the table are discussed in the next section).
There is a representative distribution of managers across functional and
geographic areas such that there are no significant salary differences on average
between areas before or after age and rank are held constant. Managers are
sorted into three functional areas in Table 1 by two dummy variables: production
(research and manufacturing), and corporate (such as finance, human resources,
general management), which together distinguish field managers as a third
category (sales and distribution). The ”core location” variable in Table 1
distinguishes managers who work in the city where the firm has its largest
concentration of employees (75% of this study population) from managers who
work in other cities (all in France).

Le capital social des cadres, July 1999, Page 22
Seniority is a compensation factor, but its direct association with salary
disappears when age is held constant. If salary is regressed across rank and
seniority, measured by the years for which a manager has worked for the firm,
then managers with more seniority receive higher salaries (4.1 t-test, P < .001).
However, the company is primarily an internal labor market in which managers
tend to stay with the firm, so seniority is closely correlated with age (r = .72).
Some managers did enter at high rank so salary is more directly associated with
age (r = .43) than with seniority (r = .13). The result is that the salary association
with seniority disappears when age is held constant as in Table 1 (cf. Bayet and
Demailly‘s, 1996, analysis of French salaries tracing a seniority effect to cohort-
specific retirement dates and employment contracts). Time in rank is similarly
irrelevant (0.3 t-test for years-in-rank added as a predictor to Model II in Table 1).
There are some factors irrelevant because of homogeneity within the study
population. For example, gender can be a performance factor related to social
capital (Burt, 1998; 1999), but there is only one woman in this study population so
gender is irrelevant (allowing for its significance to the one female manager). In
fact, the overwhelming majority of these managers are married Frenchmen. The
dummy variable “minority” in Table 1 distinguishes sample managers who were
female, unmarried, or not a French citizen; which is a combined total of three
people. The minority managers were paid lower salaries on average than their
French-married-male peers, but the amount is not statistically significant.
Education is similarly a negligible factor, even though education credentials
are widely discussed as a significant career variable in France. In this population,
however, everyone is from a grande école , so education credentials do not explain
salary differences between the managers.8 In fact, we have already noted that
8More specifically, these are graduates from the second-tier of grande écoles ; most often
from regional centers outside Paris, not from the top Parisian institutions such as the EcolePolytechnique or Ecole Nationale d’Administration (though graduates from these schools do holdpositions elsewhere and higher in this company). This is a study population primarily composed ofwell-educated chemists and engineers who have been promoted into senior management. Wehave no systematic data on job histories, however, given their technical backgrounds, thesemanagers are unlikely to have been career civil servants transferred to the company to ensureconsistency with government policy ( pantouflage ). Further, given the internal labor market and theseparation between the firm’s French and American operations, these managers are unlikely tohave held full-time positions in the United States, though we were told by the senior human-

Le capital social des cadres, July 1999, Page 23
most (97%) of the managers have graduate degrees of some kind, of which one in
three (37%) is a doctorate or the French equivalent. Education credentials were
perhaps significant for gaining entry to senior management, but competition is now
on other criteria. The “advanced degree” variable in Table 1 distinguishes
managers with a doctorate or the French equivalent ( troisième cycle , see Lewis,
1985: 102ff.). Managers with advanced degrees were paid higher salaries on
average, but the amount is not statistically significant. Graduation from the
company’s “executive M.B.A.” program also has no association with salary. The
firm owns with several others an educational facility to which it sends promising
managers (see Hogarth, 1979, for details on the creation and operation of the
facility). Managers complete a course of study analogous in content and duration
to a Masters of Business Administration.9 More than half of the people in the
study population (59%) had graduated from the program at the time of the survey
(graduates were no more likely to return completed questionnaires, 0.03 chi-
square, 1 d.f.) and we will later show that graduation is associated with the kind of
network a manager builds, but graduation has no direct association in Table 1 with
salary.
NETWORK DATA
Each manager received a network questionnaire asking about his key contacts
within and beyond the firm. Contacts were identified with questions on diverse
kinds of relations such as informal discussion and socializing, political support,
critical sources of buy-in for projects, authority relations with supervisor and
promising subordinates, and so on. The eight core name generators are listed in
Table 2 with the minimum, mean, and maximum number of contacts each question
elicited per French and American manager. The French questionnaire was a
replication of the American questionnaire (cf. Table 2 with Burt, 1992:123; Burt,
resources officer that he would be surprised if managers at this level of the organization had not allvisited American plants to observe their operations.
9The facility also offers short programs analogous to executive education programs inAmerican business schools, but participation in the short programs is not associated with salary orthe network variables to be discussed, so graduation here means graduating from the full M.B.A.program.

Le capital social des cadres, July 1999, Page 24
1997b:359). The questionnaire was translated into French by a French
sociologist, then checked for consistency with the American version by two
business professors fluent in French and English (a Frenchman working in France,
and a British citizen working in the United States). In addition to the eight core
name generators, OTHER at the bottom of the table refers to contacts named in
response to (a) a ninth work-related question limited to a single name that was
different on the French and American questionnaires, or (b) a final question asking
managers after they had assembled the list of key contacts if the list was missing
anyone significant. Finally, managers were asked to describe the connection
between each pair of contacts as especially close, distant, or something
intermediate. The American managers named 12.7 contacts on average, of whom
2.0 were outside the firm. The French named 13.9 contacts, of whom 3.0 were
outside the firm.
——— Table 2 About Here ———
NETWORK MEASURE OF SOCIAL CAPITAL
Network constraint increases with the extent to which a manager’s network is
directly or indirectly concentrated in a single contact. A network concentrated in
one contact means fewer structural holes, and so less social capital. The
constraint index C varies with three conditions (see Burt, 1992: 50ff., 1995, 1998,
for details): network size (larger networks are less constraining), density (networks
of more strongly interconnected contacts are more constraining), and hierarchy
(networks in which all contacts are exclusively tied to a single contact are more
constraining). The index begins with the extent to which all of manager i’s network
is directly or indirectly invested in his or her relationship with contact j: cij = (pij +
∑qpiqpqj)2, for q ≠ i,j, where pij is the proportion of i’s relations invested in contact
j, and the total in parentheses is the proportion of i’s relations that are directly or
indirectly invested in the connection with contact j. Sum the cij across contacts j to
get the network constraint index C for each manager. We multiply scores by 100
to discuss social capital effects per point of constraint. Constraint is distributed
similarly in the two study populations; from a minimum of 17 to a maximum of 43

Le capital social des cadres, July 1999, Page 25
around a mean of 28 across the French managers and from 18 to 48 around a
mean of 29 across the American managers (0.9 t-test, P = .35).
RESULT 1: PERFORMANCE
Figure 2 contains the essential replication evidence. The horizontal axis is the
network constraint index C. The vertical axis is z-score relative performance. The
American results are discussed elsewhere (Burt, 1997a:348): American managers
with less constrained networks are promoted to senior rank earlier than is typical
for people like them at their rank in their division, while the managers with more
constrained networks reach senior rank later than is typical. The French results
replicate the American: French managers with less constrained networks (left side
of the graph) receive salaries higher than is typical for people their age in their
rank, while the managers with more constrained networks (right side of the graph)
receive salaries lower than their peers. In short, there is a positive association for
both the French and American managers between performance and the social
capital of a network that spans structural holes.
CAUSAL ORDER
Causal order cannot be determined from these data. The structural hole argument
gives a causal role to social structure, and the negative associations in Figure 2
between network constraint and performance are consistent with the argument.
But the network data describe a point in time after the performance data, so the
associations in Figure 2 are also consistent with a story about networks around
low-performance managers collapsing to a small, dense core of friends.
——— Figure 2 and Table 1 About Here ———
Three mitigating factors alleviate concerns about causal order. First, in these
study populations, relationships with key colleagues precede the performance
data. Performance is measured with respect to most recent promotion and salary.
The senior managers have known their key contacts in the firm for considerably
longer than that (nine years for the average French respondent, 13 for the average
American). Moreover, the average years for which individual managers have
known their key contacts is a negligible addition to predicting relative performance

Le capital social des cadres, July 1999, Page 26
in Figure 2 (-0.9 t-test for the French, -1.5 for the Americans). Second, much of
the cumulative processes leading to performance (and so preceding the network
data) are held constant when we hold constant manager position and background
to define performance relative to peers (and recall that rank and age account for
the greater part, 72%, of study-population performance variance for the French
managers). Third, there is evidence for the argument that network structure
affects performance. Constrained networks around investment bankers are
associated with subsequent poor performance (Burt, 1997a:349-351), and a
careful reading of the evidence on the American managers can be used to argue
for networks affecting promotion rather than vice-versa (Burt, 1992:173-180).
These mitigating factors notwithstanding, we cannot infer causal order from
our data and so must put the issue aside for resolution elsewhere. To simplify the
discussion, we follow the structural hole argument in assuming the primacy of
social structure, but stay within the limits of our cross-sectional data by focusing on
the strength of association between network structure and performance rather than
trying to resolve which caused the other.
OTHER FACTORS
Models III and IV in Table 1 add network constraint to the baseline model
predicting salary for the French managers. Compensation is significantly lower for
managers with more constrained networks, holding constant the many other
compensation factors in Table 1. No other factors matter except the age and rank
variables used to define the age-rank baseline model. In sum, compensation
factors for the managers in this study population are age, rank, and social capital.
RESULT 2: NETWORK CONTENT
We shift now from theory-testing to exploration. Given similarly positive
performance effects of social capital among the French and Americans, we shift to
the task of exploring the data to see how deep the similarity runs. Similarity
continues on several dimensions, but we also find a striking and consequential
difference.
Le capital social des cadres, July 1999, Page 27
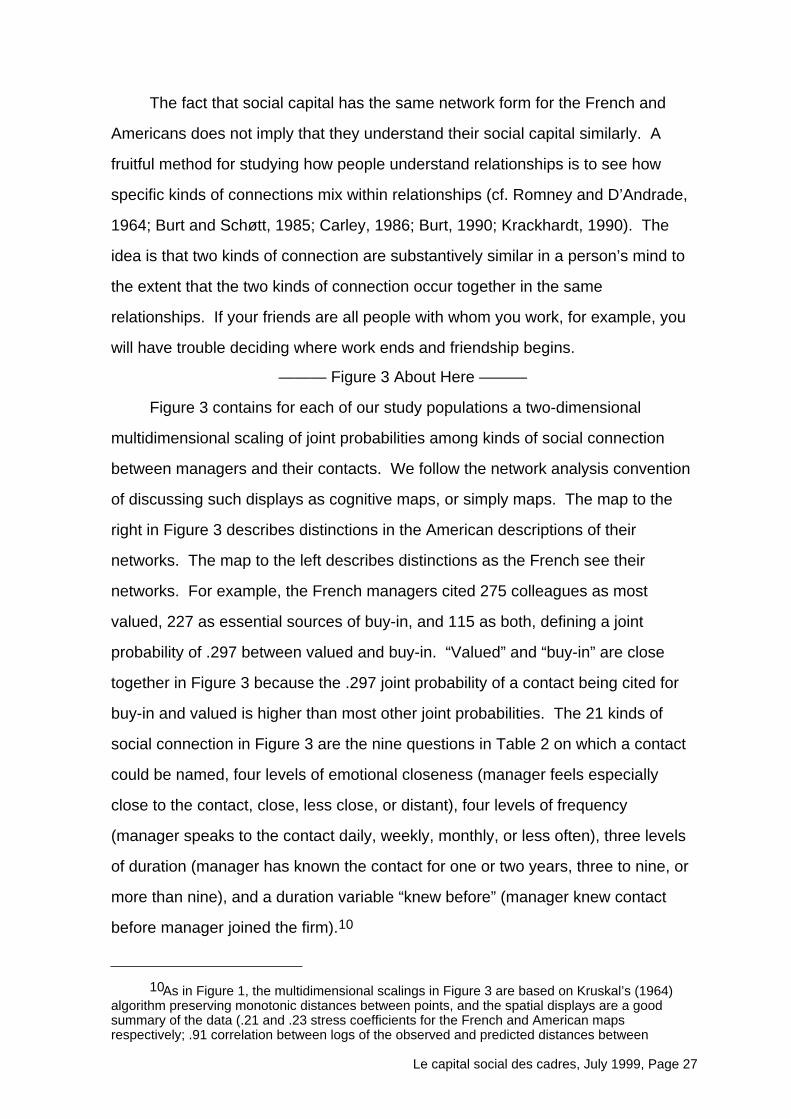
The fact that social capital has the same network form for the French and
Americans does not imply that they understand their social capital similarly. A
fruitful method for studying how people understand relationships is to see how
specific kinds of connections mix within relationships (cf. Romney and D’Andrade,
1964; Burt and Schøtt, 1985; Carley, 1986; Burt, 1990; Krackhardt, 1990). The
idea is that two kinds of connection are substantively similar in a person’s mind to
the extent that the two kinds of connection occur together in the same
relationships. If your friends are all people with whom you work, for example, you
will have trouble deciding where work ends and friendship begins.
——— Figure 3 About Here ———
Figure 3 contains for each of our study populations a two-dimensional
multidimensional scaling of joint probabilities among kinds of social connection
between managers and their contacts. We follow the network analysis convention
of discussing such displays as cognitive maps, or simply maps. The map to the
right in Figure 3 describes distinctions in the American descriptions of their
networks. The map to the left describes distinctions as the French see their
networks. For example, the French managers cited 275 colleagues as most
valued, 227 as essential sources of buy-in, and 115 as both, defining a joint
probability of .297 between valued and buy-in. “Valued” and “buy-in” are close
together in Figure 3 because the .297 joint probability of a contact being cited for
buy-in and valued is higher than most other joint probabilities. The 21 kinds of
social connection in Figure 3 are the nine questions in Table 2 on which a contact
could be named, four levels of emotional closeness (manager feels especially
close to the contact, close, less close, or distant), four levels of frequency
(manager speaks to the contact daily, weekly, monthly, or less often), three levels
of duration (manager has known the contact for one or two years, three to nine, or
more than nine), and a duration variable “knew before” (manager knew contact
before manager joined the firm).10
10As in Figure 1, the multidimensional scalings in Figure 3 are based on Kruskal’s (1964)
algorithm preserving monotonic distances between points, and the spatial displays are a goodsummary of the data (.21 and .23 stress coefficients for the French and American mapsrespectively; .91 correlation between logs of the observed and predicted distances between

Le capital social des cadres, July 1999, Page 28
KINDS OF RELATIONSHIPS
The French and American managers have strikingly similar cognitive maps of their
networks. Relationships are ordered from positive to negative going east to west
in each map, and positioned in each map with respect to three broad categories;
positive personal relationships, positive work relationships, and negative
relationships. Personal relations (in the southeast of each map) are to people with
whom the manager socializes and discusses personal matters such as leaving for
a job with another firm. These are people to whom the manager feels especially
close and with whom he speaks daily. Work relations (in the northeast of each
map) are to people the manager cites as his most valued contacts at work and
essential sources of buy-in for initiatives coming out of his office. These are
people to whom the manager feels close, but not especially close, and with whom
he speaks once a week or so. The supervisor is in the work region of both
cognitive maps, but clearly apart from the contacts cited as essential sources of
support. Recall that our French and American managers operate in network
organizations where support from your boss can be taken for granted — relative to
the essential support managers have to negotiate with senior people in other
functional areas. Negative relations (to the west of each map) are with people to
whom the managers feels emotionally distant, or people cited for having most
made it difficult for the manager to carry out his job responsibilities.
FREQUENCY
There is also a similar tempo to their relationships. There are no significant
differences between the French and Americans in their tendencies to speak daily
(-0.2 t-test) or at least weekly with their key contacts (1.5 t-test), and they are
equally likely to have key contacts with whom they speak monthly or less (-0.1 t-
test). Connections with kinds of relations are apparent in Figure 3. Daily contact
is associated with personal relations, weekly contact is on the personal side of
elements in the French map, .90 for the American map). We began by circling three kinds ofrelations distinct in each map; personal discussion relations, support relations at work, andnegative relations. We then rotated one map 180˚ to align the relative positions of the three kindsof relations in each map (which has no effect on distances between points in the map).

Le capital social des cadres, July 1999, Page 29
work support relations, monthly is on the negative side of work support relations,
and less than monthly is closest to negative relationships. Daily and weekly
contacts are rarely cited by the French or Americans as negative (7% of daily and
weekly contacts cited as negative by the French and 6% by the Americans, versus
13% of monthly or less contacts for the French and 19% for the Americans).
DURATION
The French and Americans are sharply distinct in the content of their oldest
relationships. The French are anchored in long-standing personal relationships to
which they add recent acquaintances from work. The Americans are anchored in
long-standing work relations to which they add personal relations with recent
acquaintances.
This point comes in two parts. First, the French and Americans make similar
duration distinctions in their colleague relationships. Log-linear association models
of duration in years tabulated across the nine name generators in Table 2 show
that managers in both study populations make three broad distinctions in duration;
recent acquaintances known for one or two years, established relations with
colleagues known for three to nine years, and old relationships with colleagues
known for a decade or more. Relations one or two years old are cited on name
generators different from those on which more established relations are cited, and
relations a decade or more in age are cited on still other name generators. That is
the second point. Figure 3 shows the French citing personal relationships as their
oldest (10+ years known). Newer relationships come from the job. Americans cite
support relations at work as their oldest relationships. Personal relations are with
recent acquaintances.11
11The reversed duration correlates for the French and Americans explains the reversed
positions of “other” and “subordinate” in the two Figure 3 cognitive maps. Promising subordinatesand people added as an after-thought to the network questionnaire tend to be recentacquaintances. Thus, “subordinate” and “other” appear at the top of the French map with peopleknown for one or two years, and at the bottom of the American map, again with people known forone or two years.

Le capital social des cadres, July 1999, Page 30
SOCIAL BOUNDARY AROUND THE FIRM
The duration difference has implications for how managers understand the social
boundary around their firm. Each dot in Figure 4 is a relationship with a colleague
at the time of the survey. Relations are distinguished on the horizontal axis by the
respondent manager’s years at the firm and on the vertical axis by his years of
acquaintance with the colleague. In other words, dots above the diagonal line in
each graph are colleagues known before the manager entered the firm.
——— Figure 4 About Here ———
The point immediately apparent from the graphs is that the French managers
knew far fewer of their current colleagues before joining the firm. The area above
the diagonal line in the French graph is empty in comparison to the same area in
the American graph. The table beneath the graphs shows the duration difference
separating out the effect of seniority. French and Americans with more than 20
years seniority have small percentages of colleagues known before they joined the
firm (5% and 6% respectively). Much of their working life has been spent in the
firm, so it is not surprising that most of their colleague relationships originated after
they joined the firm. The duration difference is more apparent for more recent
arrivals. The slightly higher 6% percent of American colleagues known before
joining the firm increases to 42% for managers with 11 to 20 years seniority
(versus the French 15%), and then to 81% for managers with less seniority (versus
the French 26%). This point is also visible in Figure 3. Contacts known before
entering the firm (“knew before”) are in the personal region of the French cognitive
map (southeast) but the work region of the American map (northeast).
RESULT 3: ETIOLOGY
The results on network content imply that social capital accumulates in different
ways for the French and American managers. Managers came to the French firm
knowing few of the colleagues with whom they would have to establish
relationships. Their long-standing relationships are personal, begun after they
entered the firm. Friendships seem to be the foundation for social capital, but the
foundation is employer-specific. The social boundary around the American firm
was more porous to relationships and, by implication, to the flow of ideas and

Le capital social des cadres, July 1999, Page 31
innovations (Raider and Burt, 1996, on social capital; Arthur and Rousseau, 1996,
for more diverse perspectives), so managers could be expected to be less
dependent on third parties such as executive headhunters to broker connections to
other firms (Finlay and Coverdill, 1999). Just as senior professors come to new
university positions already knowing many colleagues from past professional
activities, managers came to the American firm with relationships already
established to key contacts inside the firm. Their long-standing relationships are
work-related, begun before they entered the firm. Worthy colleagues seem to be
the foundation for social capital, and the foundation is portable from one employer
to another.
BRIDGES ACROSS STRUCTURAL HOLES
However, the more porous social boundary around the American firm need not
indicate social capital. It could indicate merely a density of connections higher
among people in the American computer industry than in French pharmaceuticals,
or a density of connections higher among senior people in the technological region
in which the American firm was located. If the people a manager knew before
entering turn out to be people now in his immediate work group, then pre-existing
contacts are not the foundation for his social capital, they are just people he knew
before joining the firm. Social capital is a function of relationships that bridge
structural holes. If the pre-existing relations are with people not routinely involved
in the manager’s immediate work then the pre-existing relations would be a
foundation for social capital in the sense of bridging structural holes in the firm.
Informal conversations with old friends in other parts of the firm would give the
manager a competitive advantage in shaping and taking advantage of information
in the firm.
To understand the social capital associated with pre-existing relationships,
we studied individual relations for the extent to which they were bridges. A
colleague relationship is a bridge when a manager has no alternative, indirect,
connection to the colleague through mutual acquaintances (e.g., Harary, Norman
and Cartwright, 1965:198-206; Granovetter, 1973: 1065; Burt, 1992:26-30;
Wasserman and Faust, 1994: 114-115). In the Appendix, we explain how we

Le capital social des cadres, July 1999, Page 32
defined a quantitative variable and a qualitative variable to distinguish bridge
relationships. The quantitative variable measures the extent to which a
relationship is nonredundant with a manager’s other relationships. The qualitative
variable is a dichotomy between relationships that are bridges and those which are
not.
CORRELATES OF BRIDGE RELATIONSHIPS
Regression results in Table 3 identify the correlates of bridge relationships. No
causal order is implied. We use regression merely to identify the correlates most
associated with bridge relationships. The first column for each study population is
a regression model predicting the quantitative measure of nonredundancy; a
positive coefficient shows that an increase in the row variable is associated with
less redundant relationships. The second column is a logit model predicting the
qualitative distinction between bridges and other relations; a positive coefficient
shows that an increase in the row variable increases the probability of a
relationship being a bridge.12
Correlates are listed in the rows. The first seven are relationship variables in
Figure 3; kinds of relations (cited for personal discussion, support at work, the
boss), emotional closeness, contact frequency, and years known. The new
relationship variable (discussed below) is “executive M.B.A.,” which distinguishes
people who have participated in the French firm’s executive education program.
——— Table 3 About Here ———
The remaining rows are controls for the manager’s situation. Certain
managers are more likely to be involved in bridge relations and we want to study
the correlates of bridges net of manager differences.13 The most significant
12This analysis is productive because it reveals the different emotions that the French and
Americans associate with bridge relationships, but there is more direct evidence that knowingcolleagues before entry is not an advantage after entry. We know from Table 1 that relative salaryfor the French managers is independent of knowing any of their current key colleagues beforejoining the firm (0.8 t-test). We get the same result predicting early promotion for the Americans (-0.1 t-test). With so many of the Americans knowing colleagues before entry, we also looked at theproportion of key colleagues known before entry. This too has a negligible association with earlypromotion (-1.2 t-test).
13It would be natural to create homophily variables from the manager data. Bridges will beless likely, for example, between managers in the same location or within the same functional area.Unfortunately, many managers were reluctant to name their contacts beyond first names or initials,

Le capital social des cadres, July 1999, Page 33
control is manager performance, which has a significant association with bridge
relationships in all four equations. This result connects the dyadic analysis in
Table 3 with the aggregate analysis in Figure 2. Managers receiving higher
compensation or promoted earlier than their peers tend to be involved in bridge
relations. The other controls show that bridge relations are slightly less likely for
managers in the most senior of the study population jobs, more likely for managers
in corporate functions such as finance, legal, information systems, and human
resources (versus field or production functions), negligibly less likely for managers
in their firm’s core location (which contains many of the corporate function
managers), slightly more likely for managers who have been with the firm longer,
and slightly more likely for managers with advanced degrees.
Bridges Independent of Duration
There is clearly no social capital content — in the sense of bridging structural
holes — to the colleague relationships that managers had before entering the firm
(also see footnote 12). Holding constant a manager’s years with the firm (since
more recent hires are so much more likely to have known colleagues before
joining the firm), there is no significant tendency among the French or the
Americans for bridges to be with people the manager knew before he joined the
firm (seventh row of Table 3), or people the manager has known a long time (the
sixth row of Table 3 is the three categories in Figure 3 of 1-2 years, 3-9 years, and
10 or more years).
Bridges Independent of Routine Work Activities
It is also clear that bridge relationships are not intrinsic to work. Colleagues cited
as a manager’s most valued contacts, or essential sources of buy-in, tend not to
be bridge relationships (second row of Table 3). The manager’s immediate
supervisor (boss) has no tendency to be a bridge (third row). The colleagues with
whom a manager speaks frequently tend not to be bridge relationships (fifth row).
so we cannot identify contacts to match them with the company personnel records to createhomophily variables. We do the next best thing of holding constant the bridge-relevantcharacteristics of the respondent manager’s situation.

Le capital social des cadres, July 1999, Page 34
Emotional Content of Bridge Relationships
The French and Americans differ sharply in the emotional content of their bridge
relationships, negative for the French, positive for Americans. The French tend
not to cite bridge relationships for personal discussion (first row of Table 3) and the
association with emotional closeness is negative (fourth row of Table 3).
The opposite is true of the Americans. The fourth row of Table 3 shows that
their bridge relations have a positive emotional content. Closer study shows that
the relations are less associated with extreme positive emotion than they are
associated with a lack of negative emotion. The probability of a relationship being
a bridge does not change with the intensity of an American’s positive emotion
toward a colleague (33% bridges to “especially close” colleagues, 33% to “close”
colleagues, and 34% to “less than close” colleagues). The change happens when
the manager feels “distant” from the colleague, whereupon the odds of the
manager sustaining a bridge relationship with the colleague drops to 1%. In other
words, the Americans invest in colleagues with whom they are emotionally
comfortable even if the person works in a distant part of the firm. How they
discover these bridge contacts we do not know. There must be social processes
we have not measured that expose the Americans broadly to people outside their
immediate work group — as illustrated by their broader range of contacts inside
the study population long before they enter the firm. When they discover a person
outside their work group who is useful to know, and with whom they are
emotionally comfortable, a bridge relationship is established which is then an
element in the manager’s social capital.
Executive M.B.A. and Bridge Relationships
So where do the French bridges come from? There is nothing in the emotional
preferences of the French managers, nor the substance of their work, associated
with bridge relations. Their relative compensation is correlated in Figure 2 and
Table 1 with the social capital benefits of bridge relations, but the content,
closeness, frequency, and duration variables in Table 3 all have for the French
negligible or negative associations with bridge relations.

Le capital social des cadres, July 1999, Page 35
The positive correlate for the French is executive training. The variable in the
eighth row of Table 3, “executive M.B.A.,” is a dummy variable equal to 1 for a
relationship if either the manager or the colleague graduated from the company-
sponsored M.B.A. program that we discussed in association with Table 1.
Graduating from the program is the only variable in Table 3 — other than the
control for manager performance — that has a positive association with bridge
relationships for the French managers.
We can rule out certain explanations for the program effect. The effect must
be more than education alone since advanced degrees have a negligible
association with bridges (bottom row of Table 3), and program graduates cite
technical expertise as the single item least promoted by the program (Hogarth,
1979:224). Also, the program effect does not result from the manager and
colleague developing their relationship while attending the program. From the
network questionnaire, we know only whether a cited colleague graduated from
the program, not when s/he graduated, so we do not know which managers and
colleagues attended the program together. However, we can make three
inferences from the available data to support the conclusion that the program
effect is not due to managers and colleagues developing relations while in the
program. First, the effect does not depend on manager and colleague both
graduating from the program.14 Second, it is unlikely that managers and cited
colleagues developed their relationship while attending the program because so
few colleagues attend together.15 Third, there is no empirical evidence of
14The “executive M.B.A.” variable in Table 3 distinguishes relations in which the manager or
the cited colleague graduated from the program. If we break the variable into two variables, one forthe manager graduating and the other for the colleague graduating, both variables significantlyincrease the odds of a bridge between manager and colleague (3.9 and 6.3 t-tests fornonredundancy, 3.6 and 4.1 t-tests for the logit equation predicting bridges). However, negativecoefficients for the product of the two variables show that manager and colleague graduating fromthe program does not increase (beyond the effect of either person graduating from the program)the probability of their relationship being a bridge.
15The program is intended to expose managers to peers in other firms so the client firms arediscouraged from sending too many colleagues to be in the same program cohort. Of the 85managers in the study population, 50 were program graduates. The 50 graduates were spreadacross 19 separate cohorts; 8 graduates were the only person from the study population in theircohort, 6 were in a cohort with one other person from the study population, 3 were in a cohort withtwo other people from the study population, 16 were in a cohort with three colleagues, 5 were in acohort with four colleagues, and 12 were in cohorts with five other people from the studypopulation. If every manager developed a relationship with every colleague attending the program,then the program would be responsible for 70 relationships — which is only 6% of the 1,225relations possible among the 50 program graduates. Therefore, to the extent we can generalize to

Le capital social des cadres, July 1999, Page 36
graduates preferring one another as cited colleagues (though graduates report a
larger program effect when their boss and other colleagues are also graduates,
Hogarth, 1979: 237-239).16
We are left with the interpretation that participating in the company-
sponsored program has its effect by lowering manager suspicions of bridge
relationships. Managers come to the program suspicious of bridge relationships
(negative association with closeness and personal discussion in Table 3) from jobs
that do not require them to build bridges (negative association with work support
and frequent contact in Table 3). The program forces managers to break out of
their routine frame of reference by forcing them to discuss cases and course
concepts in teams with peer managers from other companies. This is evident in
the qualities that graduates report to be most promoted by the program (Hogarth,
1979:224): rising above immediate concerns to see the generalist outlook,
improved communication skills with people different from yourself — especially
listening, dealing with the ambiguity and uncertainty of complex social
environments. The program, in other words, is a training ground for bridge
relations. The results in Table 3 show that the experience is associated with
building bridge relationships within the firm. The results in Figure 2 show that it is
the managers more successful in building such relationships who are recognized
with disproportionate compensation for adding more value to the firm.
CONCLUSION
The analysis offers a point of integration between universal and culture-specific
explanations of organizational behavior. For the universal, our first empirical result
is that the network form of social capital is the same for French and American
the cited colleagues from the study population of managers, it seems unlikely that the programeffect is due to managers and cited colleagues developing a relationship while attending theprogram together.
16Most of the managers worked for a boss who graduated from the program (78%), butmanagers are no more likely to be a graduate if their boss is a graduate (0.05 chi-square, 1 d.f.).The respondent managers all cited at least one key contact who had graduated from the program,but the proportion of their cited colleagues who were graduates is independent of the managerbeing a graduate (0.6 t-test). Of cited colleagues around a manager, 64% are program graduatesaround the managers not attending the program and 67% are program graduates around themanagers who did graduate from the program.

Le capital social des cadres, July 1999, Page 37
managers. Accumulating empirical evidence on American managers shows that
social capital effects on performance are a function of the information and control
benefits of bridging structural holes. France seemed to us a productive site for
comparative research because the image from past research is that French
managers are more regulated than Americans; more regulated by bureaucratic
authority and more regulated by peer pressure, with both amplified by the greater
reliance in France on internal labor markets. People comfortable with knowing
their place in a chain of bureaucratic control could be expected to be
uncomfortable with the negotiated control exercised by network entrepreneurs.
Nevertheless, we found that successful French managers, like successful
Americans, tend to have networks rich in structural holes. The universal here is
the brokerage principle in network theory, which says that there is a competitive
advantage to building bridge relationships. Whether in the United States or
France, resources flow disproportionately to people who provide indirect
connections between otherwise disconnected groups.
Social capital’s etiology, however, seems to be a culture-specific story. Our
second and third empirical results show that the French managers build
relationships in a way distinct from the Americans, a way completely consistent
with the image of French organization portrayed in past research. There are
similarities. The French and American managers make similar distinctions
between kinds of relationships, and the colleague relations that bridge structural
holes are similarly detached from the routine work activities of the French and the
Americans. The key differences are the broader range of American contacts, and
the positive emotions Americans associate with their bridge relationships. The
French managers operate with a less porous social boundary around their firm and
associate negative emotions with bridge relationships. The less porous social
boundary around their firm is as described by the Aix-en-Provence research on
internal labor markets. The negative emotions associated with bridge relationships
is consistent with Crozier and d’Iribarne observing French reluctance to coordinate
with people outside the chain of command. As quoted at the beginning of the
paper, Crozier (1964:52) sees for the manager who builds bridge relationships
“accusations of favoritism and . . . serious deterioration of the climate, whatever

Le capital social des cadres, July 1999, Page 38
the soundness of the end result,” and d’Iribarne (1994:85) sees “vigorous
resistance to situations of dependency . . . on people (management, other
departments) outside the occupational group to which one belongs.”
For the French managers we studied, graduating from the executive M.B.A.
program jointly sponsored by their company and a handful of others is the only
factor positively associated with the social capital of bridge relationships. It seems
inelegantly empirical to attribute a manager quality as consequential as social
capital to an experience as mundane as executive education, but it is not without
precedent. The Aix-en-Provence scholars with their several years of observations
draw a related conclusion (Maurice et al., 1982:119):
The rate of social reproduction of management personnel thereforeseems to be higher in France than in Germany. But above all thecriteria of selection, the filters, are different in the two countries. InGermany adult education is particularly important. In the firms westudied, nearly half of all managers . . . received their highest-levelprofessional credential after entering the work force. In France thecomparable figure is only 10 to 18 percent. Summarizing theseresults, then, we find, that French management tends to recruit fromwithin the managerial group, while German management is moreopen.
Similarly, but with detailed network data, we find that those French managers who
get out of their organization to participate in adult education are more likely to have
the bridge relationships that constitute the social capital associated with high
performance.
Replication is an immediate task for future research. Bearing in mind the
contingent value of social capital in organizations (Burt, 1997a), is the positive
association between performance and structural holes replicated in other French
and American firms? More generally, as discussed with respect to Figure 1, is the
performance effect of structural holes replicated when managers in individualistic
countries other than the United States are compared to managers in bureaucratic
countries other than France? These would be comparisons between countries to
the left in Figure 1 (e.g., Australia, Britain, or Germany) versus countries at the
right (e.g., Brazil, Spain, or the Philippines).

Le capital social des cadres, July 1999, Page 39
There are also second and third tasks for future research. Network
entrepreneurs taking advantage of bridge relationships across structural holes cut
across chains of command in an organization, but they also live with higher
uncertainty in that they are proposing new lines of coordination (else they would be
doing what people already do). These are separate dimensions of business
culture. Our Franco-American comparison is primarily concerned with the intensity
of regulation within an organization — individualistic versus bureaucratic cultures
distinguished along the horizontal axis in Figure 1 — which is only moderately
correlated with Hofstede’s Uncertainty Avoidance dimension, which measures the
“clinging to rules and ritual” associated with bureaucracy.17 It is possible that the
aspect of regulation which denies managers the benefit of social capital is not the
intensity with which they are regulated but is instead their clinging to rules and
ritual. A second task for future comparative research is see whether the results of
our Franco-American comparison can be replicated with comparisons between
bureaucratic countries in which managers cling to rules and ritual such as Greece
or Portugal (the two countries with the highest Uncertainty Avoidance scores in
Figure 1, respectively 2.00 and 1.67 standard deviations above average) versus
bureaucratic countries such as Singapore or Hong Kong in which there is (or was
at the time of Hofstede’s surveys) low preference for rules and ritual (Singapore
has the lowest score on Uncertainty Avoidance, 2.38 standard deviations below
average in Figure 1).
A third task is to explore Scandinavia. Five countries stand apart in the
lower-left of Figure 1; Denmark, Finland, the Netherlands, Norway, and Sweden.
Like the countries above them in the individualistic cluster around the United
17France is higher than the United States on both dimensions, but more differentiated on the
first. In Figure 1, there is a 1.09 difference between them on the horizontal axis (relative to a .13standard error of the mean), versus a .15 difference between them on the vertical axis (relative to a.10 standard error of the mean), so they can be said to be 5.6 times more differentiated on thehorizontal axis. The horizontal axis is a contrast between individualistic and bureaucratic businesscultures; i.e., a contrast in the extent to which employees are regulated within their organization(horizontal axis is correlated .88 with Power Distance scores in Figure 1, -.85 with Individualismscores). Uncertainty Avoidance is less correlated with the horizontal axis (.59) and more correlatedwith the vertical axis (.43 versus -.18 and .30 for Power Distance and Individualism respectively),as illustrated by the gray arrow for Uncertainty Avoidance in Figure 1 increasing through the upper-right quadrant of the spatial map.

Le capital social des cadres, July 1999, Page 40
States, the Scandinavian countries are low in Power Distance and high in
Individualism. However, employees in the five countries stand apart in expecting
organizations to serve a social welfare function, which puts them at the bottom of
Hofstede’s Masculinity dimension (mean score for the five countries is 2.07
standard deviations below the average in Figure 1, -5.9 t-test, P < .001). It is not
obvious that a concern for social welfare should interfere with managers using
social capital, but the prevalence of such a concern would certainly affect the
stories managers used to explain their use of it.
To be sure, the similarity we observe in the social capital of senior French
and American managers has alternative interpretations. One is methodology. Our
data on the two study populations were obtained with the same survey instrument.
Organization context offers a second interpretation. Our French and American
managers work at the top of large, global bureaucracies. It is certainly possible
that the rigors of life at the top of such organizations overwhelms regional
differences. Social capital differences between French and American managers
could be more apparent in comparisons between smaller organizations in the two
countries. Network theory offers a third interpretation. The social capital of
networks rich in structural holes is integral to adding value in any context —
French or American.
We cannot disentangle these alternatives with our data. Nor can we draw
inferences about all French managers from our data, any more than the usual
research results on managers in an American firm would be sufficient foundation
for drawing inferences about all American managers. However, our data and
results are sufficient to reject the null hypothesis that the network form of social
capital observed among American managers is unique to Americans. Our results
show that social capital emerges in different ways for the French and Americans,
but its network form is similar in both study populations — contact networks rich in
structural holes.

Le capital social des cadres, July 1999, Page 41
APPENDIX: DISTINGUISHING BRIDGE RELATIONSHIPS
We used two variables, one quantitative, the other qualitative, to distinguish bridge
relations from other relationships. The quantitative variable, nonredundancy ,
measures the extent to which a relationship does not overlap with a manager’s
other relationships, and comes from the network constraint measure of social
capital in Figure 2. A manager is constrained in his relationship with a colleague
(cij high) to the extent that the relationship consumes a large proportion of the
manager’s network time and energy (direct = pij) and the manager’s other relations
are with people who are themselves invested in the colleague (indirect = ∑qpiqpqj,
q ≠ i,j). The indirect term measures the extent to which the relationship with
colleague j is redundant with the manager’s other relations (where redundancy is
less to the extent that the manager spreads his network time and energy across
many other colleagues who themselves have little investment in colleague j).
To measure nonredundancy, we subtracted the indirect term from its
maximum and multiplied by 100 to discuss points of nonredundancy (indirect
varies from .000 to .323 in our data, so our nonredundancy measure is: 33 -
100*indirect). Less indirect connection between a manager and a colleague
means that their relationship is more of a bridge. We can correlate the measure
with other aspects of a relationship to discover aspects associated with bridges.
For example, nonredundancy is on average 25.85 across the 60 relations between
the French managers and their immediate supervisors (boss). The average
increases to 27.56 for their 596 cited relations with other colleagues. The -1.71
difference between 27.56 and 25.85 generates a -4.92 routine t-test showing that
relations with the boss tend to be more redundant than relations with other
colleagues (which makes sense since a manager and boss are likely to have one
or more key contacts in common).
There remains a qualitative distinction between bridges and other
relationships. Given a quantitative measure of indirect connection between two
managers, what is the criterion that qualifies their relationship as a bridge? The
extreme case is clear: A relationship is a bridge if there are no alternatives to it
(the indirect component in constraint equals zero). Anything less than the extreme
case is not so clear. The level of “negligible” indirect connection that distinguishes
bridge relationships from non-bridges is necessarily a matter of judgment.
We made that judgment by counting the structural holes and mutual friends
adjacent to a relationship. We counted structural holes as the number of the

Le capital social des cadres, July 1999, Page 42
manager’s close contacts who are distant or strangers to the colleague. For
example, the sociogram in the graph at the bottom of Figure 5 shows a manager
and colleague surrounded by four other people cited by the manager as “close” or
“especially close” contacts (the parentheses indicate manager response options).
Two of the other people in the sociogram (the solid dots) are reported by the
manager to be “especially close” to the colleague. The solid dots are mutual
friends. The more mutual friends between a manager and colleague, the lower the
probability that the colleague relationship is a bridge. The two remaining people in
the sociogram (white dots) are reported by the manager to be “distant” from the
colleague, indicating a structural hole between each person and the colleague.
The more structural holes adjacent to a relationship, the higher the probability that
the relationship is a bridge. The more mutual friends, the lower the probability.
——— Figure 5 About Here ———
The vertical axes in Figure 5 our counts of holes and mutuals. Colleague
relations are ranked on the horizontal axes of each graph in order of increasing
redundancy, least redundant to the left and most redundant to the right. The solid
line in the graphs shows the moving average number of holes adjacent to each
relationship (averaging across the 10 relations preceding a relationship in the rank
order and the 10 following it). The dashed line in each graph shows the moving
average number of mutual friends.
The relationships most like bridges are at the left in Figure 5. These are the
relations with the least indirect connection between manager and colleague. The
solid line is at its maximum, showing that these relations frequently bridge
structural holes. The dashed line is at its minimum, showing that manager and
colleague in these relationships rarely have mutual friends.
The relations least like bridges are at the right in Figure 5. These are the
relations with the most extensive indirect connection between manager and
colleague. The solid line is low, showing that these relationships rarely cross
structural holes. The dashed line is high, showing that these are the relationships
in which manager and colleague have several mutual friends.
We created a bridge variable by drawing a vertical line in the horizontal rank
order at a level of “negligible” redundancy so as to distinguish bridges to the left of
the line from non-bridges to the right of the line. As indicated at the top of Figure
5, we made the distinction at the 30th percentile of the horizontal axis because that
is where the solid and dashed lines meet. The solid line in each graph is higher
Le capital social des cadres, July 1999, Page 43
than the dashed line for relationships to the left of the 30th percentile, which
means that the structural holes adjacent to a relationship outnumber mutual
friends. The solid and dashed lines in Figure 5 are indistinguishable beyond the
30th percentile, which means that holes and mutual friends are equally present.
A further qualitative distinction can be made between bridges, quasi-bridges,
and redundant relations. We made such a distinction with the 25% least
redundant relations coded as bridges, the next 25% of relations coded as quasi-
bridges (not quite bridges, but less redundant than most relationships), and the
remaining 50% of relations coded as redundant. We also made a three-category
distinction with the 10% least redundant relations coded as bridges (solid and
dashed lines in Figure 5 are furthest apart to the left of the 10th percentile), the
next 20% of relations coded as quasi-bridges (because the solid and dashed lines
in Figure 5 are much closer together for the Americans in this interval suggesting
that these relations are less obviously bridges than the relations in the first decile),
and the remaining 70% of relations coded as redundant (as in the text). Ordered
logit models predicting these three-category bridge variables yield results midway
between the results reported for the models predicting nonredundancy and the
dichotomous bridge variable in Table 3 so we only report the results in Table 3.
Figure 5 illustrates the substantive value of a qualitative distinction between
bridges and non-bridges. Recall the average nonredundancy scores for French
relations with the boss (25.85) versus relations with other cited colleagues (27.56).
The difference is statistically significant in the sense that relations with the boss
are more redundant, but both averages lie at the center of the data distribution —
at about the 50th percentile on the horizontal axis of the graph at the top of Figure
5 (median nonredundancy is 27.51) — well within the qualitative category of non-
bridge relationships. In other words, boss relations are merely non-bridge
relations that are less redundant than non-bridge relations with other cited
colleagues. The results in Table 3 show that boss relations for the French are less
redundant than other relationships, but no more or less likely to be a bridge. Using
quantitative and qualitative criteria to distinguish bridges, rather than using one or
the other, gives us a more robust method of distinguishing the relational qualities
of bridges, and so social capital.

Le capital social des cadres, July 1999, Page 44
REFERENCESArthur, Michael B., and Denise M. Rousseau (eds., 1996) The Boundaryless
Career . New York: Oxford University Press.
Barsoux, Jean-Louis, and Peter Lawrence (1990) Management in France . New
York: Cassell Academic.
Bayet, Alain, and Dominique Demailly (1996) “La hiérarchie des salaires,” Insee
Première , 487: September.
Berry, Michel (1995) “Research and the practice of management: a French view.”
Organization Science , 6: 104-116.
Bielby, William T., and Denise D. Bielby (1999) “Organizational mediation of
project-based labor markets: talent agencies and the careers of
screenwriters.” American Sociological Review 64: 64-85.
Boltanski, Luc (1990) "Visions of American management in postwar France," In
Sharon Zukin and Paul DiMaggio (eds.), Structures of Capital : 343-372.
New York: Cambridge University Press.
Burt, Ronald S. (1980) “Autonomy in a social topology.” American Journal of
Sociology , 85: 892-925.
Burt, Ronald S. (1987) “Social contagion and innovation, cohesion versus
structural equivalence.” American Journal of Sociology , 92:1287-1335.
Burt, Ronald S. (1990) "Kinds of relations in American discussion networks," In
Craig Calhoun, Marshall W. Meyerand W. Richard Scott (eds.), Structures
of Power and Constraint : 411-451. New York: Cambridge University Press.
Burt, Ronald S. (1992) Structural Holes . Cambridge, MA: Harvard University
Press.
Burt, Ronald S. (1995) “Le capital social, les trous structuraux, et l’entrepreneur.”
Trans. by Emmanuel Lazega. Revue Française de Sociologie , 36: 599-628.
Burt, Ronald S. (1997a) “The contingent value of social capital.” Administrative
Science Quarterly , 42: 339-365.
Burt, Ronald S. (1997b) “A note on social capital and network content.” Social
Networks , 19: 355-373.
Burt, Ronald S. (1998) “The gender of social capital.” Rationality and Society , 10:
5-46.
Burt, Ronald S. (1999) “The network structure of social capital.” Graduate School
of Business, University of Chicago.

Le capital social des cadres, July 1999, Page 45
Burt, Ronald S., Joseph Jannotta and Thomas Mahoney (1998) “Personality
correlates of structural holes.” Social Networks , 20: 63-87.
Burt, Ronald S., and Thomas Schøtt (1985) "Relation contents in multiple
networks." Social Science Research , 14:287-308.
Calori, Roland, Michael Lubatkin, Philippe Very and John F. Veiga (1997)
“Modelling the origins of nationally-bound administrative heritages: a
historical institutional analysis of French and British firms.” Organization
Science , 8: 681-696.
Carley, Kathleen M. (1986) "An approach for relating social structure to cognitive
structure." Journal of Mathematical Sociology , 12: 137-189.
Coleman, James S. (1964) Introduction to Mathematical Sociology . New York:
Free Press.
Cook, Karen S., and Richard M. Emerson (1978) “Power, equity and commitment
in exchange networks.” American Sociological Review , 43: 712-739.
Crozier, Michel (1964) The Bureaucatic Phenomenon . Chicago, IL: University of
Chicago Press.
Crozier, Michel (1989) L’Enterprise à L’Écoute . Paris: Interéditions.
Domhoff, William G. (1967) Who Rules America? Englewood Cliffs, NJ: Prentice-
Hall.
Erickson, Bonnie H. (1998) “Social capital and its profits, local and global.”
Department of Sociology, University of Toronto.
Finlay, William, and James E. Coverdill (1999) “The search game: organizational
conflicts and the use of headhunters.” Sociological Quarterly , 40:11-30.
Frank, Kenneth A., and Jeffrey Y. Yasumoto (1998) “Linking action to social
structure within a system: social capital within and between subgroups.”
American Journal of Sociology , 104: 642-686.
Freeman, Linton C. (1977) “A set of measures of centrality based on
betweenness.” Sociometry , 40: 35-40.
Gabbay, Shaul M. (1997) Social Capital in the Creation of Financial Capital .
Champaign, IL: Stipes.
Granovetter, Mark S. (1973) “The strength of weak ties.” American Journal of
Sociology , 78: 1360-1380.
Guillén, Mauro F. (1994) Models of Management . Chicago: University of Chicago
Press.

Le capital social des cadres, July 1999, Page 46
Harary, Frank, R. Z. Norman and Dorian Cartwright (1965) Structural Models . New
York: John Wiley.
Hofstede, Geert ([1980] 1984) Culture’s Consequences . Newbury Park, CA:
Sage.
Hofstede, Geert (1991) Cultures and Organizations . New York: McGraw-Hill.
Hogarth, Robin (1979) Evaluating Management Education . New York: Wiley-
Interscience.
Iribarne (d’), Philippe (1989) La Logique de L’Honnour . Paris: Seuil.
Iribarne (d’), Philippe (1991) “Culture et ‘effet sociétal’.” Revue Française de
Sociologie , 32: 599-614.
Iribarne (d’), Philippe (1994) “The honour principle in the ‘Bureaucratic
Phenomenon.’” Trans. by Andrew Wilson. Organization Studies , 15:81-97.
Janowitz, Morris ([1957] 1991) “Professionalization of military elites.” In James
Burk (ed.), On Social Organization and Social Control : 99-112. Chicago, IL:
University of Chicago Press.
Kadushin, Charles (1995) “Friendship among the French financial elite,” American
Sociological Review , 60: 202-221.
Kim, Joo Yup, and Sang Hoon Nam (1998) “The concept and dynamics of face:
implications for organizational behavior in Asia.” Organization Science , 9:
522-534.
Kotter, John P., and James L. Heskett (1992) Corporate Culture and Performance .
New York: Free Press.
Krackhardt, David (1990) “Assessing the political landscape: structure, cognition,
and power in organizations.” Administrative Science Quarterly , 35: 342-369.
Krackhardt, David, and Robert N. Stern (1988) “Informal networks and
organizational crisis: An experimental simulation.” Social Psychology
Quarterly , 51: 123-140.
Kruskal, Joseph B. (1964) “Multidimensional scaling by optimizing goodness of fit
to a nonmetric hypothesis.” Psychometrika , 29: 1-27.
Laurent, André (1983) “The cultural diversity of Western conceptions of
management,” International Studies of Management and Organization ,
13:75-96.
Lewis, Howard D. (1985) The French Education System . New York: St. Martin’s
Press.

Le capital social des cadres, July 1999, Page 47
Lubatkin, Michael, Roland Calori, Philippe Very and John F. Veiga (1998)
“Managing mergers across borders: a two-nation exploration of a nationally
bound administrative heritage.” Organization Science , 9:670-684.
Luthans, Fred, Richard M. Hodgetts and Stuart A. Rosenkrantz (1988) Real
Managers . Cambridge, MA: Ballinger.
Luthans, Fred, Dianne H. B. Welsh and Stuart A. Rosenkrantz (1993) “What do
Russian managers really do? an observational study with comparisons to U.
S. managers.” Journal of International Business Studies , 24: 741-761.
Marsden, Peter V., and Noah E. Friedkin (1994) “Network studies of social
influence.” In Stanley Wasserman and Joseph Galaskiewicz (eds.),
Advances in Social Network Analysis : 3-25. Thousand Oaks, CA: Sage.
Maurice, Marc, François Sellier and Jean-Jacques Silvestre ([1982] 1986) The
Social Foundations of Industrial Power . Trans. by Authur Goldhammer.
Cambridge, MA: MIT Press.
McGrath, Rita Gunther, Ian C. MacMillan and Sari Scheinberg (1992) “Elitists, risk-
takers, and rugged individualists? An exploratory analysis of cultural
differences between entrepreneurs and non-entrepreneurs.” Journal of
Business Venturing , 7: 115-135.
Mehra, Ajay, and Martin Kilduff (1999) “Self-monitoring, social networks, and
performance.” Paper presented at the annual meetings of the Academy of
Management.
Merton, Robert K. ([1957] 1968) “Continuities in the theory of reference group
behavior.” In Robert K. Merton, Social Theory and Social Structure : 335-
440. New York: Free Press.
Merton, Robert K. (1984) “Socially expected durations: A case study of concept
formation in sociology.” In Walter W. Powell and Richard Robbins (eds.),
Conflict and Consensus : 262-283. New York: Free Press.
Mizruchi, Mark S. (1992) The Structure of Corporate Political Action . Cambridge,
MA: Harvard University Press.
Mizruchi, Mark S., and Linda B. Sterns (1998) “Getting deals done: the use of
social networks in bank decision making.” Paper presented at the annual
meetings of the American Sociological Association.
Moore, Gwen (1978) “The structure of a national elite network.” American
Sociological Review , 44: 673-692.
Le capital social des cadres, July 1999, Page 48
Orrù, Marco (1996) “Dirigiste capitalism in France and South Korea.” In Marco
Orrù, Nicole Biggart and Gary Hamilton (eds.), The Economic Organization
of East Asian Capitalism : 368-382. Thousand Oaks, CA: Sage.
Podolny, Joel M., and James N. Baron (1997) “Relationships and resources:
Social networks and mobility in the workplace.” American Sociological
Review , 62: 673-693.
Raider, Holly J., and Ronald S. Burt (1996) “Boundaryless careers and social
capital,” In Michael B. Arthur and Denise M. Rousseau, The Boundaryless
Career : 187-200. New York: Oxford University Press.
Romney, A. Kimball, and Roy G. D’Andrade (1964) “Cognitive aspects of English
kin terms.” American Anthropologist , 566: 146-170.
Rose, Michael (1985) “Universalism, culturalism and the Aix group: promise and
problems of a societal approach to economic institutions.” European
Sociological Review , 1:65-83.
Rosenthal, Elizabeth A. (1996) “Social networks and team performance.”
Unpublished Ph.D. dissertation, University of Chicago.
Schmidt, Vivien A. (1996) From State to Market? New York: Cambridge University
Press.
Simmel, Georg ([1922] 1955) Conflict and the Web of Group Affiliations . Trans. by
Kurt H. Wolff and Reinhard Bendix. New York: Free Press.
Sparrowe, Raymond T., and Pamela A. Popielarz (1995) “Weak ties and structural
holes: The effects of network structure on careers.” Paper presented at the
annual meetings of the Academy of Management.
Szarka, Joseph (1992) Business in France . London: Pitman.
Useem, Michael (1984) The Inner Circle . New York: Oxford University Press.
Wasserman, Stanley and Katherine Faust (1994) Social Network Analysis . New
York: Cambridge University Press.
Ziegler, J. Nicholas (1995) “Institutions, elites, and technological-change in France
and Germany.” World Politics , 47:341-372.

12
3
4
7
8
9
10
11
1213
14
15
1617
18
20
21
22
23 24
2627
29
30
31
33
34
35 36
38
39
40
ID. C
ount
ry
1. A
rgen
tina
2
. Aus
tral
ia
3. A
ustr
ia
4
. Bel
gium
5. B
razi
l
6
. Can
ada
7. C
hile
8
. Col
ombi
a
9. D
enm
ark
10. F
inla
nd
11
. Fra
nce
12. G
reat
Brit
ain
13. G
erm
any
(F.R
.)14
. Gre
ece
15. H
ong
Kon
g
16. I
ndia
17
. Ira
n
18. I
rela
nd
19
. Isr
ael
20. I
taly
21
. Jap
an
22. M
exic
o
23
. Net
herla
nds
24. N
orw
ay
25
. New
Zea
land
26
. Pak
ista
n
27. P
eru
28
. Phi
lippi
nes
29. P
ortu
gal
30
. Sou
th A
fric
a31
. Sin
gapo
re
32. S
pain
33
. Sw
eden
34. S
witz
erla
nd
35. T
aiw
an
36
. Tha
iland
37. T
urke
y
38
. US
A
39. V
enez
uela
40
. Yug
osla
via
F
ranc
o-A
mer
ican
diff
eren
ce =
X a
xis
0.24
-0.8
9-0
.68
0.25
0.51
-0.7
30.
790.
98-1
.59
-0.6
30.
17-1
.13
-0.4
20.
870.
260.
120.
12-0
.97
-0.8
1-0
.20
0.53
0.99
-0.9
9-1
.01
-1.0
50.
600.
851.
361.
03-0
.36
0.32
0.25
-1.3
1-0
.53
0.58
0.55
0.56
-0.9
21.
300.
97
Y a
xis
0.34
0.45
1.19
0.68
0.02
0.18
-0.5
00.
19-0
.75
-0.4
20.
300.
520.
490.
65-0
.91
-0.5
3-0
.20
0.54
-0.0
10.
691.
240.
37-0
.68
-0.8
80.
30-0
.22
-0.2
2-0
.04
-0.3
90.
25-1
.52
0.09
-1.0
50.
55-0
.28
-0.5
00.
020.
440.
32-0
.68
519
2837
US
A
Sin
gapo
re
Japa
nA
ustr
ia
Den
mar
k
Sw
eden
Phi
lippi
nes
Yug
osla
via
Hon
g K
ong
Indi
a
Nor
way
Net
herla
nds
Fin
land
Por
tuga
l
Ven
ezue
la
Gre
ece
Gre
atB
ritai
n
Col
ombi
a
Mex
ico
Bel
gium
Italy
Ger
man
y
Sw
itzer
land
Arg
entin
a
Spa
inB
razi
l Tur
key
Per
u
Can
ada
Tha
iland
Tai
wan
Iran
Sou
th A
fric
a
Isra
el
Chi
le
New
Zea
land
Irel
and
-
0.1
-0.
8
-
2.0
0.
6
0.8
-0.
6
0.6
0.
7
-
1.7
-0.
9
0.8
-0.
8
-
0.8
0.
4
0.8
1.
2
0.3
-1.
2
-
1.9
-0.
1
0.1
1.
4
-
0.7
-1.
0
-
1.5
0.
2
0.6
2.
1
0.6
-0.
1
1.1
0.
3
-
1.0
-0.
9
0.3
0.
6
0.7
-0.
6
1.4
1.
2
1.4PowerDistance
0.9
-0.
6
0.2
1.
2
0.5
-0.
7
0.9
0.
7
-
1.7
-0.
2
0.9
-1.
2
0.0
2.
0
-
1.5
-1.
0
-
0.2
-1.
2
0.7
0.
4
1.2
0.
7
-
0.5
-0.
6
-
0.7
0.
2
0.9
-0.
9
1.7
-0.
7
-
2.4
0.
9
-
1.5
-0.
3
0.2
-0.
0
0.9
-0.
8
0.5
1.
0
1.7UncertaintyAvoidance
Sco
res
on H
ofst
ede'
s fo
ur d
imen
sion
s of
bus
ines
s cu
lture
are
list
ed a
s z-
scor
es a
t the
ext
rem
e rig
ht.
Tw
o co
untr
ies
are
clos
e in
the
mul
tidim
ensi
onal
sca
ling
abov
e to
the
exte
nt th
at th
ey h
ave
the
sam
epr
ofile
of s
core
s on
the
four
cul
ture
dim
ensi
ons
(cou
ntrie
s ca
n be
loca
ted
by th
e X
and
Y c
oord
inat
eslis
ted
to th
e rig
ht).
Max
imum
and
min
imum
sco
res
on e
ach
dim
ensi
on a
re h
ighl
ight
ed.
Fra
nce
32
25
6
-0.
2
1.6
0.
2
1.0
-0.
5
1.2
-1.
1
-
1.5
1.
0
0.5
0.
8
1.6
0.
7
-
0.6
-1.
0
-
0.1
-0.
4
0.8
0.
2
1.0
-0.
2
-
0.8
1.
2
0.8
1.
2
-
1.5
-1.
4
-
0.7
-0.
9
0.6
-1.
2
0.0
0.
8
0.7
-1.
3
-
1.2
-0.
5
1.6
-1.
5
-
0.9
-0.8
0.3
0.
6
1.5
0.
2
-
0.0
0.
1
-
1.1
0.
7
-
1.7
-1.
2
-
0.3
0.
8
0.8
0.
4
0.4
0.
3
-
0.3
0.
9
-
0.1
1.
0
2.3
1.
0
-
1.8
-2.
1
0.4
0.
0
-
0.4
0.
7
-
0.9
0.
7
-
0.1
-0.
4
-
2.3
1.
0
-
0.2
-0.
8
-
0.2
0.
6
1.2
-1.
4
-1.0
IndividualismMasculinity
Indi
vidu
alis
m(R
2 =
.81)
Pow
erD
ista
nce
(R2
= .8
1)
Unc
erta
inty
Avo
idan
ce(R
2 =
.53)
Mas
culin
ity(R
2 =
.65)
Fig
ure
1. N
atio
nal V
aria
tion
s in
Bus
ines
s C
ultu
re
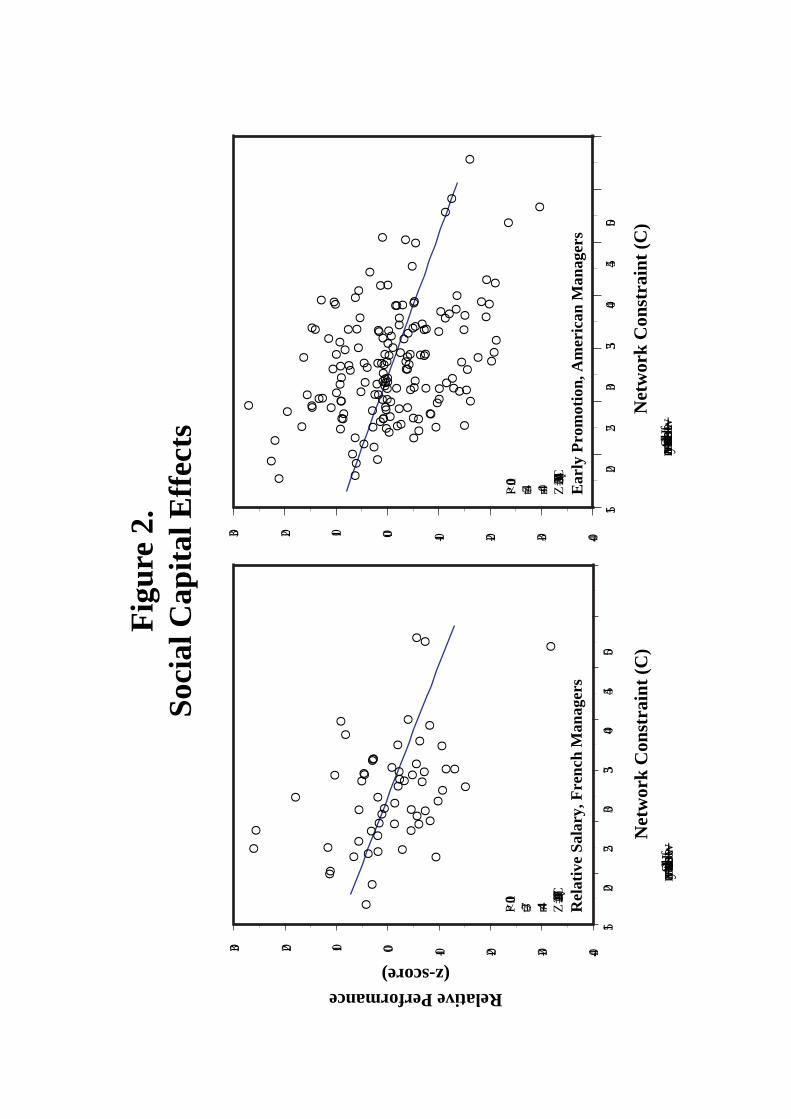
E
E
E
E
E
E
E
EE
E
E
E
EE
E
E
E
E
E
EEE
E
EE
E
E
E
EE
EE
E
E
E
E
E
E
EE
E
E
EE
E
E
E
E
E
E
E
E
E
E
E
EE
E E
EE
E
EE
E
E
E
E
E
EE
E
E
E
EE
E E
E
E E
EE
E
E
E
E
E
E
EE
E
EE
E
E
E
E
E
E
E
EE
E
E
E
E
E
E
E
E
E
E
E
E
E
E
E
E E
E
E
E
E
E
E
E
EE
E
E
EE
E
E
E
E
E
EE
E
E
EE
EEE
E
E
E
E
E
EE
E
E
E
E
E E
E
E
E
E
E
E
E
E
E
E
1520
2530
3540
4550
E
E
EE
EE
EE
E
EE
E
E
EE
E
E E
E
E
E
E
E
EE
E
E
E
E
E
EE
E
E
E
E
E
E
EE
E
E
E
E
EE
E
E
E
E
E
E
EE
E
E
E
E
E E
1520
2530
3540
4550
Net
wor
k C
onst
rain
t (C
)many ———
Structural Holes ——— few
3.0 2.0 1.0 0.0 -1.0 -2.0 -3.0 -4.0
P < .001
t = -5.4 r = -.40 Z = 2.035 - .074
(C)
Ear
ly P
rom
otio
n, A
mer
ican
Man
ager
s
Net
wor
k C
onst
rain
t (C
)many ———
Structural Holes ——— few
3.0 2.0 1.0 0.0 -1.0 -2.0 -3.0 -4.0
P < .001
t = -3.7 r = -.44 Z = 2.102 - .077
(C)
Rel
ativ
e Sa
lary
, Fre
nch
Man
ager
s
Relative Performance(z-score)
Fig
ure
2.So
cial
Cap
ital
Eff
ects

Fig
ure
3.M
anag
er D
isti
ncti
ons
Bet
wee
n K
inds
of
Rel
atio
ns( r
e la t
i on s
cl o
s e t o
g et h
e r r
e ac h
t he
s am
e c o
n ta c
t s)
J
J
J
J
J
J
J
J
J
J
JJ
J
J
J
J
J
J
J
J
J
J
J
J
JJ
J
J
J
J
J
JJ
J
J
J
diffi
cult
dist
ant
soci
aliz
edi
scus
sex
it
disc
uss
pers
onal
daily
esp
clos
e10+
less
than
mon
thly
mon
thly
subo
rdin
ate
supe
rvis
or
1-2
less
clos
e
buy-
in
wee
kly
clos
e
valu
ed3-
9
diffi
cult
dist
ant
soci
aliz
e
disc
uss
exit
disc
uss
pers
onal
daily
esp
clos
e
10+
less
than
mon
thly
subo
rdin
ate
supe
rvis
or
1-2
less
clos
e
wee
kly
clos
e
3-9
Am
eric
anM
anag
ers
Fre
nch
Man
ager
s
J
othe
r
J
othe
rJ
knew
befo
re
Jkn
ewbe
fore
mon
thly
J
J
buy-
invalu
ed

Figure 4.Colleague Relationships
Predating Entry into the Firm
X
X
X
XX
XX
XX
X
X
XX
X
X
X
X
XX
X
X
XXXX
X
XXX
XX
X
X
X
X
X
X
X
X
X
XX
XX
X
X
X
X
XXX
X
X
X
X
X
X
X
X
X
X
XX
X
X
X
X
X
X
X
X
X
X
X
X
X
XX
XX
X
X
XXX
X
X
XX
X
X
X
X
X
X
X
X
X
X
X
X
X
XX
X
X
X
X
X
XXX
X
XX
X X
X
X
X
X
X
X
X
X
X
X
X
X
X
X
XXX
XX
X
X
X
XX
X
X
X
XXX
X
X
X
X
X
X
X
X
X
X
X
X
X
X
X
X
X
X
X
X
X
XX
X
X
X
X
X
X
X
X
XX
X
X
X
X
X
X
X
XXX
X
X
X
X
X
X
X
X
X
X
X
XX
X
X
X
X
X
X
X
X
X
X
X
X
XX
X
X
X
X
X
X
X
X
X
X
X
X
X
X
X
X
X
X
X
X
XX
X
X
X
X
X
X
X
X
X
XX
X
X
X
X
XX
X
X
X
X
XX
X
X
X
X
XX
X
X
X
XX
X
X
XXX
X
X
X
X
X
X
X
X
X
X
X
X
X
X
X
X
X
X
X
XX
X
X
X
X
X
X
X
X
X
X
X
XX
X
X
X
X
X
X
X
X
X
X
XX
X
XX
XX
X
XX
X
X
X
X
X
XX
X
X
X
X
X
X
XX
X
X
XXX
X
XX
X
X
X
X
X
X
XX
X
X
X
X
X
XXX
X
X
X
X
X
X
X
X
XX
X
XX
X
X
X
X
X
X
X
X
X
X
X
XXX
X
XXXXX
X
XX
X
XX
XXX
X
X
X
X
X
X
X
X
X
X
X
X
X
X
X
X
X
X
XX
X
X
X
X
X
X
X
XX
X
XX
X
XXXXXX
XXX
X
XXX
X
X
XXX
XX
X
XX
XXX
X
X
X
XX
X
X
X
X
X
X
X
X
X
X
X
XX
X
X
XX
X
X
X
X
XXXX
X
XX
X
XX
X
X
X
X
X
X
X
X
X
X
XX
X
X
X
X
X
X
X
X
X
X
X
X
X
X
X
X
X
X
X
X
X
X
X
X
X
X
X
X
X
X
X
X
X
X
X
X
X
XX
XX
X
XX
X
X
X
X
X
X
X
X
X
XX
X
X
X
X
X
X
XXXXX
X
X
XX
XX
X
X
X
X
X
X
XX
X
X
X
X
XX
X
X
X
X
X
X
X
X
X
X
X
X
X
XX
X
X
X
X
X
X
X
X
X
X
X
X
X
X
X
X
X
X
X
X
X
X
X
X
XXXXXXXXXXX
XX
X
X
X
X
X
X
X
X
X
X
X
X
X
X
X
X
X
X
X
X
XXXX
X
X
X
X
X
X
X
X
X
X
XX
X
X
X
X
XX
X
XX
X
X
X
XX
X
X
X
X
X
X
X
X
X
X
X
X
X
X
X
X
XX
X
X
X
X
X
X
X
X
X
X
X
X
XX
X
X
X
X
X
X
X
X
X
XX
X
X
X
X
X
X
X
X
X
X
X
X
XX
X
X
X
X
X
X
X
X
X
X
X
X
X
XXXXX
XX
XX
XX
X
X
X
XX
X
X
X
X
X X
XX
XX
X
XX
X
X
X
X
X
X
X
XX
XX
XX
X
X
X
X
X
X
X
X
X
X
XX
X
X
X
X
X
X
X
X
X
X
X
X
X
X
X
X
X
X
X
X
X
X
X
X
X
X
X
X
X
X
X
X
X
X
X XX
X
X
X
X
X
X
X
X
X
X
X
X
XXX
XX
X
X
X
XX
X
X
X
X
X
X
X
XX
X
X
X
X
X
XX
X
X
XX
X
XX
X
X
X
X
X
X
XXX
X
XX
X
X
X
X
X
XX
X
X
X
XXX
X
X
X
X
X
X
XX
X
X
X
X
X
X
XX
X
X
XX
X
X
XX
X
X
X
X
X
X
X
X
X
X
X
X
X
X
X
X
X
X
X
X
X
X
X
X
X
X
X
X
X
X
X
X
X
X
X
X
X
X
X
XX
X
XXX
X
XXX
X
X
X
X
X
X
X
X
X
X
X
X
X
X
X
X
X
X
X
X
X
X
X
X
XX
X
X
X
X
X
X
X
X
X
X
X
X
X
XX
X
X
X
X
XX
X
X
X
X
X
XXXX
X
X
X
X
X
X
X
X
X
X
X
X
X
X
X
X
X
X
X
X
X
X
X
X
X
X
X
X
X
X
X
X
XX
X
X
X
X
X
X
X
X
X
X
X
X
X
X
X
X
X
X
X
X
X
X
X
X
X
X
X
XX
X X
X
X
X
X
X
X
X
X
X
X
X
X
X
X
X
X
X
X
X
X
X
X
X
X
X X
X
X
X
X
X
X
X
X
X
X
X
X
XX
X
X
X
X
X
X
X
X
X
X
X
X
X
XX
X
XXX
X
X
XX
X
X
X
X
X
X
X
X
X
XX
X
X
X
XX
X
X
XXX
X
X
X
X
X
X
X
X
X
XX
X
X
X
X
X
X
X
X
X
XX
XX
X
X
X
XX
X
X
X
X
X
X
X
X
X
X
X
X
X
X
X
X
X
X
X
X
X
X
X
X
X
X
XXXX
XX
X
X
X
X
X
XX
X
X
X
X
X
X
XX
XXXX
X
X
X
X
X
X
X
X
X
X
X
X
X
X
X
X
X
X
XX
X
X
X
X
X
X
X
X
X
X
X
X
X
X
XXXXX
X
X
X
X
X
X
X
X
X
X
X
X
X
X
X
X
X
X
XX
X
X
X
XX
X
X
X
X
X
X
X
X
X
XX
X
X
X
X
X
X
X
X
X
X
X
X
X
X
X
X
X
X
X
X
X
X
X
X
X
XX
X
X
X
X
X
X
X
XX
X
XX
X
X
XX
X
X
X
X
X
X
X
X
X
X
X
X
X
X
X
X
X
X
X
XX
X
X
X
X
X
XXX
XX
X
X
X
XX
X
X
X
X
X
XX
X
X
X
X
X
X
X
X
X
X
X
X
X
X
X
X
X
X
X
X
X
X
X
X
XXX
X
X
X
X
X
X
X
X
X
X
X
X
XX
X
X
X
X
X
X
XX
X
X
X
X
X
X
X
X
X
X
X
X
X
X
X
X
X
X
X
X
X
X
X
X
X
X
X
X
X
X
X
X
X
X
X
X
X
XX
X
X
XX
X
X
X
X
X
X
X
X
X
X
X
X
X
XX
X
X
X
X
X
X
X
X
X
X
X
X
X
X
X
X
X
X
X
X
X
X
XX
XX
XX
X
X
X
X
X
X
X
X
X X
XX
X
X
X
X
X
X
X
X
X
X
X
XX
X
XX
X
X
X
X
X
X
X
X
X
X
X
X
X
X
X
X
X
X
X
X
X
X
X
X
X
X
X
X
X
X
XX
X
X
X
X
X
X
X
X
X
X
XXX
X
X
X
X
X
XX
X
X
X
X
X
XX
X
X
X
X
X
X
X
X
X
X
X
X
X
X
XXX
X
X
X
X
X
X
X
X
X
X
X
X
X
X
X
X
X
XX
X
X
X
X
XX
XX
X
X
X
X
X
X
X
X
X
X
XX
X
X
X
X
X
X
X
X
X
X
X
X
X
X
X
X
X
X
X
X
X
XX
X
X
X
X
XX
X
X
X
X
X
XX X
X
X
X
XX
X
X
X
X
X
X
X
X
X
X
X
X
X
X
X
X
X
X
X
X
X
X
X
X
X
X
X
X
X
XX
X
X
X
X
X
X
X
X
X
X
X
X
X
X
X
X
XX
X
X
XX
X
X
X
XXX
X
X
X
X
X
X
X
X
X
X
X
X
X
X
X
X
X
X
X
X
X
X
X
X
XX
X
X
XXX
X
XXXX
XX
XX
X
XX
X
X
X
X
X
X
X
X
X
X
X
X
X
XX
XX
X
X
X
X
X
X
X
X
X
X
X
X
X
X
X
X
X
X
X
X
X
X
X
X
X
X
X
X
X
X
X
X
XX
XXXXX
X
X
X
X
X
X
X
XX
X
X
X
X
X
X
X
X
XX
X
X
X
X
X
X
X
X
X
X
X
X
X
X
XX
X
X
X
X
X
X
XXX
XX
X
XX
X
X
X
XX
X
XX
X
X
X
X
X
X
X
X
X
X
X
X
X
X
X
X
X
X
X
X
X
X
X
X
X
X
X
X
X
X
X
XX
X
X
X
X
XX
X
X
X
X
X
X
X
X
X
X
X
X
X
XX
X
X
X
X
X
X
X
X
X
X
X
XX
X
X
XXX
X
X
X
X
X
X
X
X
X
X
X
X
X
X
X
X
X
X
X
X
X
X
X
X
X
X
X
X
X
X
X
X
X
X
X
X
X
X
X
X
X
X
X
XXX
X
X
X
X
X
X
X
X
X
X
X
X
X
X
X
X
XX
X
X
X
X
X
X
XX
X
X
X
XX
X
X
X
X
X
X
X
X
X
X
X
X
X
X
X
XX
X
X
X
X
X
X
X
X
X
X
X
X
XX
XX
X
X
X
XX
X
XXX
X
XX
X
X
X
X
X
X
X
X
X
X
X
X
X
X
X
X
X
X
X
X
X
X
X
X
X
X
X
X
X
X
X
XX
X
XXX
XX
XX
X
X
X
X
X
X
X
X
X
X
X
X
X
X
X
X
X
X
X
X
X
X
X
X
X
X
X
X
X
X
X
X
X
X
X
X
X
X
X
XX
X
X
X
X
X
XX
X
X
X
X
X
X
X
X
X
X
X
X
X
X
X
X
X
X
X
X
X
X
X
X
X
X
X
X
XX
X
X
X
X
XX
XX
X
XX
X
X
X
X
X
X
XX
X
X
X
X
X
X
X
X
X
X
X
X
X
X
X
X
X
X
X
X
X
X
X
X
X
X
3 01 0 2 52 01 550
French Manager Years in the Firm
3 01 0 2 52 01 550
American Manager Years in the Firm
Yea
rs A
cqu
ain
ted
wit
h C
on
tact
3 0
1 0
2 5
2 0
1 5
5
0
3 0
1 0
2 5
2 0
1 5
5
0
Y e a r s i nt h e F i r m
0 t o 1 0
1 1 t o 2 0
O v e r 2 0
T o t a l
N u m b e rC o l l e a g u e s
1 0 5
1 6 0
3 9 1
6 5 6
F r e n c h M a n a g e r s
% K n o w nB e f o r e F i r m
2 6 %
1 5 %
5 %
1 1 %
M e a n Y e a r sK n o w n
5 . 2
8 . 2
1 0 . 3
9 . 0
N u m b e rC o l l e a g u e s
6 9 1
8 7 5
1 2 9
1 6 9 5
A m e r i c a n M a n a g e r s
% K n o w nB e f o r e F i r m
8 1 %
4 2 %
6 %
5 5 %
M e a n Y e a r sK n o w n
1 2 . 6
1 3 . 5
1 4 . 9
1 3 . 0

Figure 5.Distinguishing Bridge Relationships
1 0
9
8
7
6
5
4
3
2
1
0
Ave
rag
e N
um
ber
Ad
jace
nt
Rel
atio
nsh
ips
1 0
9
8
7
6
5
4
3
2
1
0
Ave
rag
e N
um
ber
Ad
jace
nt
Rel
atio
nsh
ips
1 0 % 3 0 % 5 0 % 7 0 % 9 0 %
Redundancy of Colleague Relationship( p e r c e n t i l e , r e l a t i o n s i n r a n k o r d e r o f i n c r e a s i n g i n d i r e c t c o n n e c t i o n )
1 0 % 3 0 % 5 0 % 7 0 % 9 0 %
A m e r i c a n R e l a t i o n s w i t h C o l l e a g u e s( 1 , 8 2 2 r e l a t i o n s h i p s )
H o l e s
M u t u a l s
F r e n c h R e l a t i o n s w i t h C o l l e a g u e s( 6 5 6 r e l a t i o n s h i p s )
H o l e s
M u t u a l s
Manager Colleague
B r i d g e s N o t B r i d g e s

Table 1. Compensation Factors
H i g h e s t R a n k
N e x t H i g h e s t R a n k
A g e ( i n y e a r s )
P r o d u c t i o n F u n c t i o n
C o r p o r a t e F u n c t i o n
C o r e L o c a t i o n
S e n i o r i t y ( i n y e a r s )
M i n o r i t y
A d v a n c e d D e g r e e
E x e c u t i v e M . B . A .
N e t w o r k C o n s t r a i n t
K n e w O n e o r M o r e C u r r e n t K e yC o n t a c t s B e f o r e J o i n i n g F i r m
C o n s t a n tM a n a g e r sP r e d i c t e d V a r i a n c e
N O T E — T h e s e a r e o r d i n a r y l e a s t - s q u a r e s r e g r e s s i o n s , M o d e l s I a n d I I f o r t h e w h o l e s t u d y p o p u l a t i o n , M o d e l s I I I a n dI V f o r t h e s a m p l e m a n a g e r s . R a w s a l a r y i n F r e n c h f r a n c s w a s c o n v e r t e d t o a z - s c o r e w i t h i n t h e p o p u l a t i o n t o p r e s e r v ec o n f i d e n t i a l i t y . M e t r i c c o e f f i c i e n t s a r e p r e s e n t e d w i t h r o u t i n e t - t e s t s i n p a r e n t h e s e s ( * f o r t w o - t a i l n u l l h y p o t h e s i sr e j e c t e d a t a . 0 5 l e v e l o f c o n f i d e n c e , * * f o r a . 0 1 l e v e l o f c o n f i d e n c e ) .
I I I . R a wS a l a r y
1 . 7 9 8( 8 . 8 )
1 . 0 4 7( 6 . 8 )
. 0 5 9( 3 . 2 )
. 0 0 9( 0 . 1 )
- . 1 4 3( - 1 . 0 )
- . 1 1 9( - 0 . 7 )
- . 0 1 1( - 0 . 9 )
- . 3 1 1( - 1 . 0 )
. 1 0 8( 0 . 7 )
. 0 5 8( 0 . 4 )
- . 0 4 4( - 3 . 6 )
. 1 1 1( 0 . 8 )
- 1 . 8 8 2n = 6 0
R 2 = . 8 3
**
**
**
**
I V . R e l a t i v eS a l a r y
- . 0 7 3( - 0 . 2 )
. 0 0 5( 0 . 0 )
- . 0 1 4( - 0 . 4 )
. 1 5 8( 0 . 5 )
- . 2 4 6( - 0 . 9 )
- . 2 3 7( - 0 . 7 )
- . 0 0 9( - 0 . 3 )
- . 3 4 8( - 0 . 6 )
. 1 9 0( 0 . 6 )
. 2 6 1( 1 . 0 )
- . 0 8 5( - 3 . 6 )
. 2 2 0( 0 . 8 )
3 . 0 8 9n = 6 0
R 2 = . 3 1
**
I I . R a wS a l a r y
1 . 7 4 8( 1 0 . 1 )
. 9 1 0( 6 . 1 )
. 0 5 7( 3 . 4 )
. 2 1 0( 1 . 1 )
- . 1 0 3( - 0 . 5 )
. 0 3 0( 0 . 3 )
- . 0 0 7( - 0 . 6 )
- . 3 4 7( - 1 . 8 )
. 0 2 7( 0 . 2 )
- . 0 0 1( - 0 . 7 )
——
——
- 3 . 1 6 6n = 8 5
R 2 = . 7 6
**
**
**
I . R a wS a l a r y
1 . 8 1 9( 1 1 . 8 )
. 9 8 9( 6 . 8 )
. 0 6 0( 5 . 8 )
——
——
——
——
——
——
——
——
——
- 3 . 5 0 8n = 8 5
R 2 = . 7 2
**
**
**

Table 2. Name Generators
DISCUSS PERSONAL: S t a r t w i t h a g e n e r a l q u e s t i o n . F r o m t i m e t o t i m e , m o s t p e o p l e d i s c u s si m p o r t a n t m a t t e r s w i t h o t h e r p e o p l e , p e o p l e t h e y t r u s t . T h e r a n g e o f i m p o r t a n t m a t t e r s v a r i e s f r o mp e r s o n t o p e r s o n a c r o s s w o r k , l e i s u r e , f a m i l y , p o l i t i c s , w h a t e v e r . T h e r a n g e o f r e l a t i o n s v a r i e s a c r o s sw o r k , f a m i l y , f r i e n d s , a n d a d v i s o r s . I f y o u l o o k b a c k o v e r t h e l a s t s i x m o n t h s , w h o a r e t h e t h r e e o rf o u r p e o p l e w i t h w h o m y o u d i s c u s s e d m a t t e r s i m p o r t a n t t o y o u ? [ 1 - 3 . 8 - 7 F r e n c h ; 2 - 4 . 9 - 1 1A m e r i c a n ]
SOCIALIZE: C o n s i d e r t h e p e o p l e w i t h w h o m y o u l i k e t o s p e n d y o u r f r e e t i m e . O v e r t h e l a s t s i xm o n t h s , w h o a r e t h e t h r e e p e o p l e y o u h a v e b e e n w i t h m o s t o f t e n f o r i n f o r m a l s o c i a l a c t i v i t i e s s u c ha s g o i n g o u t t o l u n c h , d i n n e r , d r i n k s , f i l m s , v i s i t i n g o n e a n o t h e r ’ s h o m e s , a n d s o o n ? [ 0 - 2 . 8 - 3F r e n c h ; 0 - 2 . 9 - 4 A m e r i c a n ]
SUPERVISOR: W h o w o u l d b e c o n s i d e r e d t o b e y o u r i m m e d i a t e s u p e r v i s o r ? [ 1 - 1 . 0 - 1 F r e n c h ;0 - 1 . 0 - 2 A m e r i c a n ]
SUBORDINATE: W h o i s t h e m o s t p r o m i s i n g o f t h e m a n a g e r s y o u s u p e r v i s e ? [ 0 - 0 . 6 - 2 F r e n c h ;0 - 0 . 7 - 4 A m e r i c a n ]
VALUED: O f a l l y o u r p e r s o n a l c o n t a c t s w i t h i n t h e F I R M , w h o a r e y o u r m o s t v a l u e d i n t h e s e n s et h a t t h e y h a v e b e e n t h e m o s t i m p o r t a n t t o y o u r a c c o m p l i s h m e n t s ? [ 1 - 4 . 6 - 1 1 F r e n c h ; 0 - 4 . 2 - 6A m e r i c a n ]
DIFFICULT: A t t h e o t h e r e x t r e m e , w h o a m o n g t h e p e o p l e w o r k i n g f o r t h e F I R M h a s m a d e i t t h em o s t d i f f i c u l t f o r y o u t o c a r r y o u t y o u r j o b r e s p o n s i b i l i t i e s ? [ 0 - 0 . 9 - 1 F r e n c h ; 0 - 0 . 9 - 2 A m e r i c a n ]
BUY-IN: C r a f t i n g a n d i m p l e m e n t i n g b u s i n e s s p o l i c y o f a n y c o n s e q u e n c e r e q u i r e s b u y - i n f r o md i v e r s e p e o p l e . S u p p o s e y o u w e r e m o v i n g t o a n e w j o b a n d w a n t e d t o l e a v e b e h i n d t h e b e s t n e t w o r ka d v i c e y o u c o u l d f o r t h e p e r s o n m o v i n g i n t o y o u r c u r r e n t j o b . W h o a r e t h e t h r e e o r f o u r p e o p l e y o uw o u l d n a m e t o y o u r r e p l a c e m e n t a s e s s e n t i a l s o u r c e s o f b u y - i n f o r i n i t i a t i v e s c o m i n g o u t o f y o u ro f f i c e ? [ 2 - 3 . 8 - 7 F r e n c h ; 1 - 3 . 6 - 6 A m e r i c a n ]
DISCUSS EXIT: I f y o u d e c i d e d t o f i n d a j o b w i t h a n o t h e r f i r m , w h o a r e t h e t w o o r t h r e e p e o p l e w i t hw h o m y o u w o u l d m o s t l i k e l y d i s c u s s a n d e v a l u a t e y o u r j o b o p t i o n s ? T h e s e c o u l d b e p e o p l e i n s i d et h e F I R M , o r o u t s i d e r s s u c h a s f a m i l y , f r i e n d s , o r p e o p l e w h o w o r k a t o t h e r f i r m s . [ 0 - 2 . 7 - 5 F r e n c h ;0 - 2 . 8 - 5 A m e r i c a n ]
OTHER: [ 0 - 1 . 5 - 6 F r e n c h ; 0 - 1 . 2 - 5 A m e r i c a n ]
N o t e — T h e F I R M i s t h e f i r m ’ s n a m e i n t h e s u r v e y n e t w o r k q u e s t i o n n a i r e . T h e n u m b e r s i n b r a c k e t s a t t h e e n d o f e a c hq u e s t i o n a r e t h e m i n i m u m - m e a n - m a x i m u m n u m b e r o f n a m e s g e n e r a t e d p e r s e n i o r m a n a g e r .
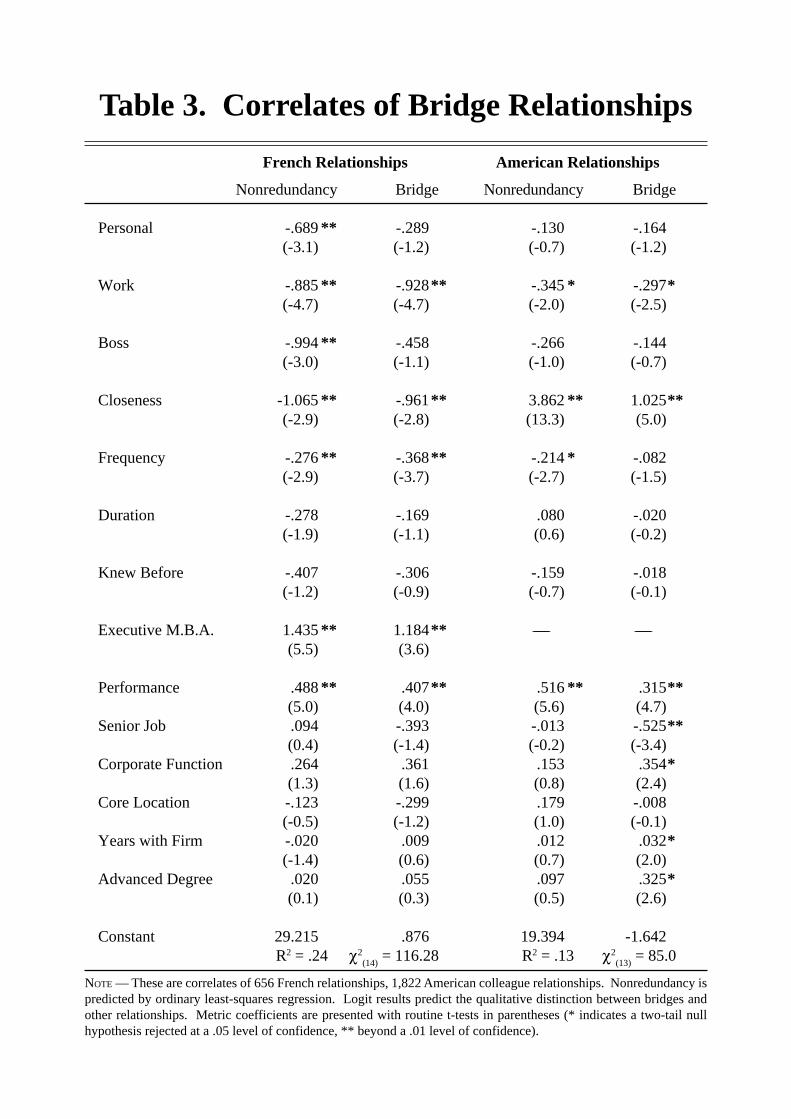
Table 3. Correlates of Bridge Relationships
P e r s o n a l
W o r k
B o s s
C l o s e n e s s
F r e q u e n c y
D u r a t i o n
K n e w B e f o r e
E x e c u t i v e M . B . A .
P e r f o r m a n c e
S e n i o r J o b
C o r p o r a t e F u n c t i o n
C o r e L o c a t i o n
Y e a r s w i t h F i r m
A d v a n c e d D e g r e e
C o n s t a n t
N O T E — T h e s e a r e c o r r e l a t e s o f 6 5 6 F r e n c h r e l a t i o n s h i p s , 1 , 8 2 2 A m e r i c a n c o l l e a g u e r e l a t i o n s h i p s . N o n r e d u n d a n c y i sp r e d i c t e d b y o r d i n a r y l e a s t - s q u a r e s r e g r e s s i o n . L o g i t r e s u l t s p r e d i c t t h e q u a l i t a t i v e d i s t i n c t i o n b e t w e e n b r i d g e s a n do t h e r r e l a t i o n s h i p s . M e t r i c c o e f f i c i e n t s a r e p r e s e n t e d w i t h r o u t i n e t - t e s t s i n p a r e n t h e s e s ( * i n d i c a t e s a t w o - t a i l n u l lh y p o t h e s i s r e j e c t e d a t a . 0 5 l e v e l o f c o n f i d e n c e , * * b e y o n d a . 0 1 l e v e l o f c o n f i d e n c e ) .
N o n r e d u n d a n c y
- . 1 3 0( - 0 . 7 )
- . 3 4 5( - 2 . 0 )
- . 2 6 6( - 1 . 0 )
3 . 8 6 2( 1 3 . 3 )
- . 2 1 4( - 2 . 7 )
. 0 8 0( 0 . 6 )
- . 1 5 9( - 0 . 7 )
——
. 5 1 6( 5 . 6 )
- . 0 1 3( - 0 . 2 )
. 1 5 3( 0 . 8 )
. 1 7 9( 1 . 0 )
. 0 1 2( 0 . 7 )
. 0 9 7( 0 . 5 )
1 9 . 3 9 4R 2 = . 1 3
*
**
*
**
B r i d g e
- . 1 6 4( - 1 . 2 )
- . 2 9 7( - 2 . 5 )
- . 1 4 4( - 0 . 7 )
1 . 0 2 5( 5 . 0 )
- . 0 8 2( - 1 . 5 )
- . 0 2 0( - 0 . 2 )
- . 0 1 8( - 0 . 1 )
——
. 3 1 5( 4 . 7 )
- . 5 2 5( - 3 . 4 )
. 3 5 4( 2 . 4 )
- . 0 0 8( - 0 . 1 )
. 0 3 2( 2 . 0 )
. 3 2 5( 2 . 6 )
- 1 . 6 4 2χ2
( 1 3 ) = 8 5 . 0
*
**
**
**
*
*
*
N o n r e d u n d a n c y
- . 6 8 9( - 3 . 1 )
- . 8 8 5( - 4 . 7 )
- . 9 9 4( - 3 . 0 )
- 1 . 0 6 5( - 2 . 9 )
- . 2 7 6( - 2 . 9 )
- . 2 7 8( - 1 . 9 )
- . 4 0 7( - 1 . 2 )
1 . 4 3 5( 5 . 5 )
. 4 8 8( 5 . 0 )
. 0 9 4( 0 . 4 )
. 2 6 4( 1 . 3 )
- . 1 2 3( - 0 . 5 )
- . 0 2 0( - 1 . 4 )
. 0 2 0( 0 . 1 )
2 9 . 2 1 5R 2 = . 2 4
**
**
**
**
**
**
**
B r i d g e
- . 2 8 9( - 1 . 2 )
- . 9 2 8( - 4 . 7 )
- . 4 5 8( - 1 . 1 )
- . 9 6 1( - 2 . 8 )
- . 3 6 8( - 3 . 7 )
- . 1 6 9( - 1 . 1 )
- . 3 0 6( - 0 . 9 )
1 . 1 8 4( 3 . 6 )
. 4 0 7( 4 . 0 )
- . 3 9 3( - 1 . 4 )
. 3 6 1( 1 . 6 )
- . 2 9 9( - 1 . 2 )
. 0 0 9( 0 . 6 )
. 0 5 5( 0 . 3 )
. 8 7 6χ2
( 1 4 ) = 1 1 6 . 2 8
**
**
**
**
**
American RelationshipsFrench Relationships