Embed Size (px)
Citation preview
The Social Cost of Open Enrollment as a
School Choice Policy
Cory Koedel
University of Missouri
Julian R. Betts
University of California, San Diego and NBER
Lorien A. Rice
Mills College
Andrew C. Zau*
University of California, San Diego
April 2010
We evaluate the integrating and segregating effects of school choice in a
large, urban U.S. school district. Our findings suggest that open enrollment,
a school-choice program without explicit integrative objectives which does
not provide busing, segregates students along three socioeconomic
dimensions – race/ethnicity, student achievement and parental-education
status. Using information on expenditures to promote integration at the
district, we back out estimates of the social cost of open enrollment realized
in terms of student segregation. Our estimates vary widely depending on
several assumptions, but a social-cost estimate of roughly 10 million dollars
per year is on the high end of our range of estimates for this single district.
Although this number represents a sizeable portion of the district’s
integrative-busing budget, it is a small fraction of the district’s total budget
(≈1.4 billion dollars). Further, we note that this cost may be offset by
benefits not related to integration.
* We thank Karen Bachofer, Alan Bersin, Sandra Robles, Patricia Trandal, Peter Bell, Jeff
Jones, Susie Millet, and Charles Rynerson for many helpful conversations and access to and help
with data. We also thank Eric Brunner and Lori Taylor, and participants at the 2009 APPAM
and 2010 AEFA conferences for useful comments and suggestions. We thank reviewers of an
earlier version of this work, Jaime Calleja Alderete, Ken Hall, Paul Hill, Christopher Jepsen, and
Mark Schneider, as well. The underlying project that provided the data for this study has been
funded by a number of organizations including The William and Flora Hewlett Foundation, the
Public Policy Institute of California, The Bill and Melinda Gates Foundation, the Atlantic
Philanthropies and the Girard Foundation. None of these entities has funded the specific
research described here, but we warmly acknowledge their contributions to the work needed to
create the database underlying the research.
1
While much of the recent attention devoted to school choice in the United States has
focused on the achievement-based benefits to student movers (e.g., Cullen, Jacob and Levitt,
2006; Angrist et al., 2002; Levin 1998), the historical roots of school choice lie in integrative
reforms dating back to the civil rights movement.1 Today, the persistence of residential
segregation across the country suggests that school choice continues to be important as an
integrative tool.
There are many reasons to expect society to value the integration of school-aged children.
For one, it may reduce market inefficiencies resulting from discriminatory behavior later in life,
particularly in diverse societies such as the United States.2 Integration will also improve equity
because there are large differences in school quality across segregated neighborhoods. However,
despite these potential benefits, there is some argument as to whether anyone actually values
integration, with research showing that both blacks and whites have a taste for segregation (for
example, see King and Mieszkowsk, 1973). But the bulk of the empirical evidence indicates that
segregation is driven predominantly by white preferences, not black preferences (see, for
example, Yinger, 1978; Cutler et al., 1999; Ihlanfeldt and Scafidi, 2002). This suggests that
disadvantaged groups may be segregated unwillingly, at least to some degree, indicating a
modern role for integrative school-choice policy.
Many school districts operate school-choice programs with explicit integrating
objectives, or at the least, with operating structures designed to elicit integrative student
movement. And while many of these programs originated from court orders to desegregate, they
are often voluntarily continued by districts, at their own expense, even after court supervision is
1 For recent studies looking at integration reform around the desegregation era, see Guryan (2004) and Cascio et al.
(2008). 2 There is considerable evidence that discriminatory behavior continues to persist in the modern economy. See, for
example Antonovics and Knight (2009) and Holzer and Ihlanfeldt (1998).
2
lifted. This is the case in the San Diego Unified School District (SDUSD), where two integrative
school-choice programs, the Voluntary Ethnic Enrollment Program (VEEP) and the magnet
program, continue to operate to this day despite the fact that court supervision ended in San
Diego in the late 1990s.3
The VEEP program was originally designed with the goal of mixing students to make
within-school student populations more representative of the district’s overall racial diversity.4 It
originated as part of the district’s response to the 1977 Carlin v. Board of Education decision,
where the California Supreme Court determined that 23 San Diego schools were racially
segregated and ordered the district to integrate them. After California passed Proposition 209 in
1996, it became illegal to provide programs that gave racial preferences. The VEEP program
continued, but took a broader view of integration, focusing on economic disadvantage. District-
provided busing is available to students who participate in the VEEP program, and the busing
pattern is designed to move students between less affluent and more affluent neighborhoods.
Schools in less affluent areas are matched to schools in more affluent, predominantly white
areas, in what are called allied patterns. Although any student of any race can apply to attend
any school in the VEEP busing pattern, the pattern is such that student-movement through the
VEEP program should have an integrating effect on the district.
The magnet program was also part of the district’s response to the 1977 court decision,
and it was also designed with integration as an explicit objective. At its inception, the magnet
program typically sought to attract students from primarily white to primarily non-white areas by
offering specialized curricula and additional resources. A few magnets were established in
relatively affluent areas in the hope of attracting students from less affluent areas. Similarly to
3 Since that time the VEEP program has been renamed to the Voluntary Enrollment Exchange Program.
4 For more details on each program, see Zau and Betts (2005).
3
VEEP, transportation is provided by the district for magnet students. Again, while any student
can apply to any magnet school, the design of the magnet program is such that it should also
integrate the district.
In addition to these two integrative programs, SDUSD also participates in the statewide
open-enrollment program (referred to as “Choice” in California), which began in the 1990s. The
open-enrollment program places no restrictions on student movement, conditional on space
availability, and like other open-enrollment programs nationwide, students are responsible for
their own transportation.5 The expected effect of the open-enrollment program on district-wide
integration is unclear ex ante. On the one hand, participants in this program may be more likely
to come from families whose residential-location options are limited financially. Students from
these families could use the open-enrollment program to attend more desirable schools. To the
extent that this is the case, it should increase integration district-wide as disadvantaged students
relocate to schools in more advantaged neighborhoods. However, participation in the open-
enrollment program may be constrained by transportation costs and time costs for some families
because the program does not provide busing. If these costs deter disadvantaged families from
participating and only students from relatively advantaged families change schools using the
open-enrollment program, it could segregate the district.
We consider the effects of these three school choice programs on integration by race,
student achievement and parental education levels.6 Race is often the focal point of integration-
5 The lack of structure to these programs generally makes large-scale busing infeasible, and most open-enrollment
programs do not provide busing. One notable exception is Seattle Public Schools, which offers a limited form of
open-enrollment with busing. 6 Another dimension of integration relevant to San Diego is English-Learner status. However, our social cost
estimates are more likely to be externally valid if we do not factor in the integration of English Learners, who make
up a much larger share of the San Diego student population than is seen in most other school districts.
4
based school choice policy, but the latter two measures also inform the integration debate.7 For
example, if the provision of equity in education is an objective of school choice policy, student
mixing along non-race dimensions will provide important information about whether school
choice programs are successful in this way.
One overarching theme in our analysis is that students use all three choice programs to
attend schools that are more socioeconomically advantaged than their local schools. Therefore,
participation by minority and disadvantaged students exerts integrating pressure on the district,
and participation by advantaged students, who are also seeking to improve the socioeconomic
status of their peers, exerts segregating pressure. Not surprisingly, the VEEP and magnet
programs integrate SDUSD by race. They also integrate the district by student achievement and
parental-education status. Alternatively, the open-enrollment program segregates students across
all three dimensions of integration that we consider.8
The open-enrollment program is generally viewed as costless because it does not provide
busing, which means that accounting costs are near zero. However, the segregating effects of
open enrollment imply a social cost as evidenced by district expenditures to promote integration.
The simultaneous presence of the two integrating programs, and the segregating open-enrollment
program, provides a unique opportunity to estimate this social cost. To do this, we first construct
ratios of the segregating effects of the open enrollment program to the integrating effects of the
VEEP and magnet programs. These ratios measure how much of the integration generated by
the VEEP and magnet programs is “undone” by open enrollment. We then multiply these ratios
by district expenditures on busing for the integrative programs, deemed “integration”
7 For example, Reback (2008) shows that test-score performance has non-negligible effects on the demand for
school choice across districts and Jacob and Lefgren (2007) show that low-income parents strongly value student
achievement when making requests for individual teachers in elementary schools. 8 Bifulco, Ladd and Ross (2009) provide similar evidence from Durham, North Carolina, showing that advantaged
students use open-enrollment programs to segregate themselves from disadvantaged students.
5
expenditures in the district budget, to attach a dollar cost to the segregating effects of open
enrollment (busing is the dominant accounting cost associated with the VEEP and magnet
programs).
Depending on the relative weights placed on the different aspects of integration, our
social-cost estimates range from $387,000 to $10.45 million per year, or between 2.4 and 65.3
percent of the annual budget allocated to integration-based transportation at SDUSD (all
estimates are in 1999-2000 dollars). The wide range of estimates is the result of uncertainty over
the valuations assigned to the different dimensions of integration. However, even at the high
end, our estimate is small compared to the district’s overall budget, which was roughly 1.4
billion dollars during the 1999-2000 school year.
We acknowledge several limitations in interpreting our social-cost estimates. First, our
estimates are contextual. In addition to depending on the urban environment in San Diego, we
also cannot observe the integrating or segregating effects of any of the school-choice programs in
isolation. Thus, our estimates will be most relevant for open-enrollment programs in urban
districts that operate in conjunction with other, integrative programs.
A second limitation is that we cannot observe why the SDUSD school board, which is
democratically elected, continues to voluntarily operate the VEEP and magnet programs. Taking
the district budget at face value, where the transportation expenditures associated with the VEEP
and magnet programs are specifically referred to as “integration” expenditures, the integrative
effects of the programs seem important. However, the VEEP and magnet programs may also
offer other benefits, such as providing opportunities to students regardless of any integrative
gains. Our social-cost estimates are most straightforward to interpret if the programs are
operated entirely because of their integrative benefits, in which case the expenditures on VEEP
6
and magnet can be interpreted as a measure of societal willingness-to-pay for integration. If the
VEEP and magnet programs are funded in part because they offer other benefits, our social-cost
estimates will be overstated. We consider this possibility briefly when we present our results.9
Finally, we are unable to observe students’ entire choice sets. From our data we observe
students’ choice sets within the public system given their current residential locations – that is,
we observe each student’s assigned local school, and his or her public school choice options.
However, we cannot observe the portions of students’ choice sets that involve Tiebout choice or
public-private choice. In our analysis, we measure the integrative effects of the school choice
programs by comparing the existing levels of integration in the district to the levels of integration
that would occur if all students were returned to their assigned local schools. Clearly, students’
local-school assignments are an imperfect indication of where they would go in the absence of
the school choice programs. Nonetheless, the local-school assignments should provide a
reasonable approximation if students participate in Tiebout and public-private choice much less
than in the district-provided choice programs, which is plausible given that it is considerably
more expensive to participate in Tiebout and public-private choice.10
I. Data and Program Mechanics
The data are based on applications to the three school choice programs at SDUSD for fall
2001, submitted to the district during the 2000-2001 school year. Across the district, roughly
one in five students participates in one of these three programs. Our dataset includes basic
demographic information about each student, including information on race, gender, parental
education and English-learner status; as well as test-score achievement (from the Stanford 9
9 Another possibility is that the VEEP and magnet programs are maintained partly because of political inertia – that
is, despite court supervision being lifted, they simply persist. We note that the inertia would have to be quite strong
if this explanation were correct given that court supervision was lifted in the late 1990s and the programs still
persist. 10
Brunner and Imazeki (2008) and Ferreyra (2007) provide recent evidence suggesting that Tiebout choice may be
important, but it is difficult to infer how much Tiebout choice might substitute for the choice programs in our study.
7
exam, when available) and student-level information on activity in the choice programs.
Specifically, we know how each student acted on each available option in each school choice
program. We also have detailed data from each school in the district which we use to assemble
information on their student-body compositions. This facilitates comparisons between each
student’s local school and choice options. It also allows us to evaluate the integrative effects of
school choice relative to the counterfactual where the school-choice programs did not result in
any student movement, and all students instead attended their local public schools.
In each school-choice program, students’ applications to relocate to option schools are
accepted based on space availability. If a school receives more applications than it has spaces
available in a given grade, administrators hold a lottery to allocate the school-choice slots. These
lotteries are based on random-number assignments conditional on priority groups. Priority
groups depend on whether the student has a sibling who already attends the option school, the
time of year in which the application was made (before or after the deadline), and whether the
student is transferring from another school within SDUSD or (rarely) from outside. The magnet
program also gives preference to “continuity” applications (i.e., the student is making the
transition from elementary to middle or from middle to high school, and was already attending a
magnet school with a similar curricular theme). In addition to the above priority groups, the
magnet program uses geographic clusters to determine program admittance. The district is
divided into four clusters that differ by socioeconomic makeup. The clusters are ranked from
one to four for each magnet such that top priority is given to the cluster that least resembles that
magnet. For some magnet schools, applications are processed in strict order by cluster and then,
within-cluster, by priority group. For others, fixed percentages of admittees must be accepted
8
from each cluster.11
We omit continuity applications and applications made from outside of the
district in our analysis. Student movement resulting from the former can be attributed to prior
choice-program activities, and out-of-district applications are given such low priority that almost
none are accepted.
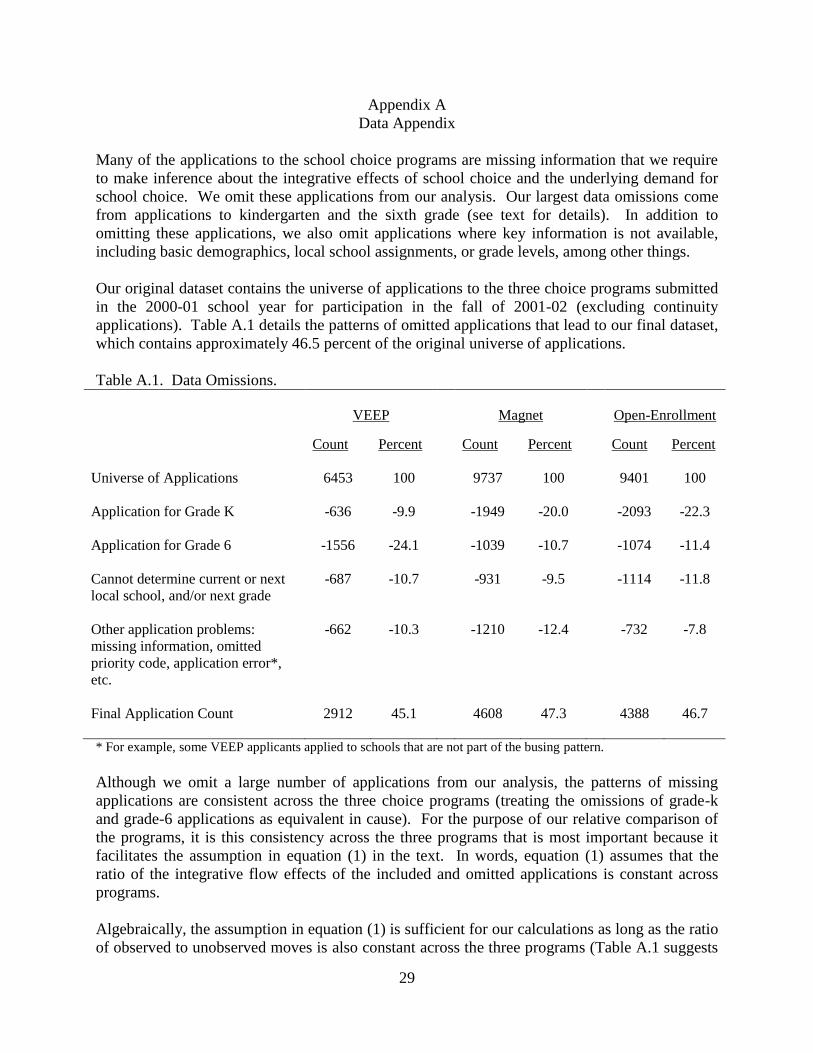
Appendix A describes the initial universe of choice applications and our final dataset.
We exclude applications from our final dataset for several reasons in addition to those discussed
above. First, we omit applications for kindergarten because we do not have demographic data
for these students. We also exclude applications to the sixth grade because the choice set is
extremely complex for these students, with some attending K-6 elementary schools and most
attending K-5 schools. Unlike students in any other grade, students entering the sixth grade are
unique in that they can use school choice to alter their schooling structures. Additionally, we do
not use some applications because they are missing basic demographic or application data. We
ultimately use about half of the total number of applications for each program in our analysis. Of
the omitted applications, roughly three in five are omitted because they are for kindergarten or
the sixth grade, and two in five for other reasons. The proportions of dropped applications for
kindergarten versus the sixth grade are roughly reversed in VEEP relative to the magnet and
open-enrollment programs. However, beyond this difference, Appendix Table A.1 shows that
the patterns of missing applications across the three programs are very similar.
Clearly, our data represent a non-random subsample of the universe of applications.
However, because our analysis is entirely comparative, we only require that the integrative
effects implied by the missing applications in each program are proportional to what we observe
in the data. Formally, defining obs
xINT and unobs
xINT as the integrative effects implied by the
11
Note, however, that within any given school all applicants are treated equally regardless of race or ethnicity.
Priority depends on cluster-wide differences between the local and magnet schools.
9
observed and unobserved student movers in each program, where x = VEEP, magnet or open
enrollment, we assume:
(1)
obs obsobsmagnet open enrollmentVEEP
unobs unobs unobs
VEEP magnet open enrollment
INT INTINT
INT INT INT
In the appendix we show that given (1), our data subsample is sufficient for our comparative
social-cost calculations.
II. The Demand for School Choice
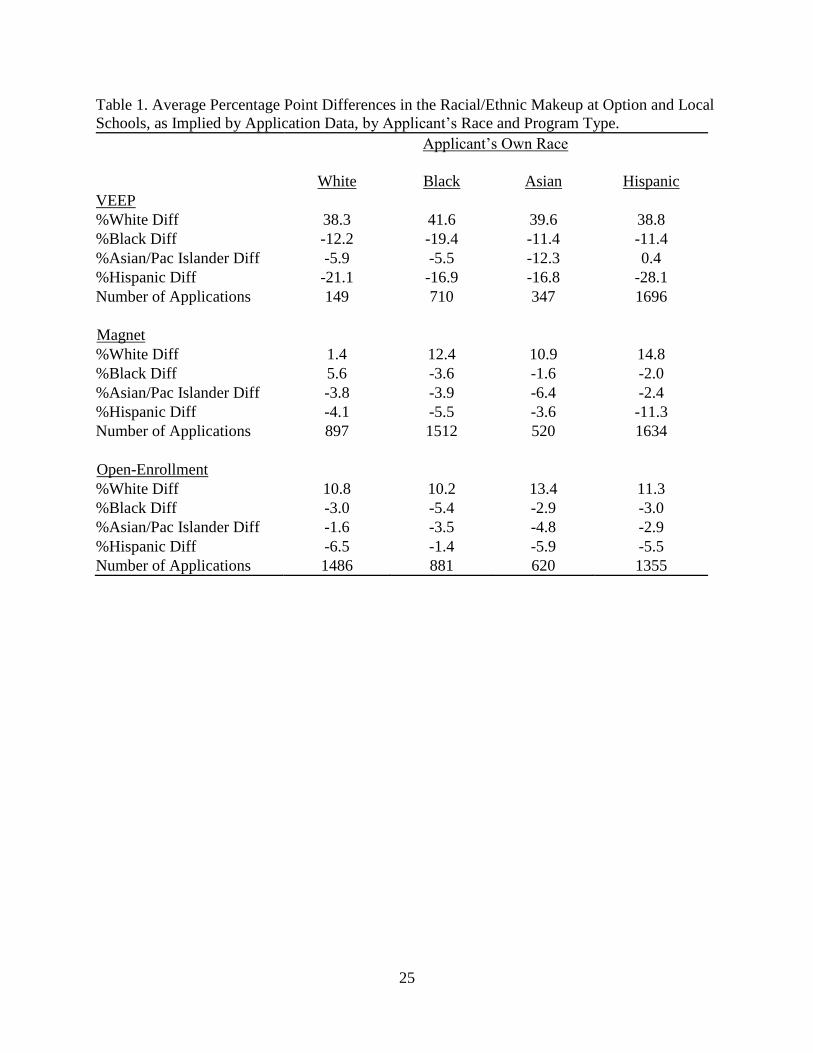
Table 1 shows the mean percentage-point difference in the racial/ethnic makeup between
the schools that are applied to and the local schools of applicants for all applications, by race.
For instance, the first row in the second column of the table shows the average difference in the
percentage of white students between the choice and local schools of black applicants to the
VEEP program. The extent to which choice programs have the potential to integrate the district
depends on the degree to which the diagonal entries of a given panel are negative and the off-
diagonal entries are positive. The table clearly shows that all students use the choice programs to
apply to schools where a higher percentage of students are white.
School-choice participants similarly use the choice programs to improve the
socioeconomic status of their peers as measured by student achievement and parental education.
For our student-achievement analysis, we identify students as either above- or below-median
performers based on their combined math and reading scores from the Stanford 9 exam, and
evaluate student mixing among these two groups. For the parental-education analysis there is a
large population of students for whom we do not have parental-education information.12
We
designate parental education as “high” if at least one parent attended some college, “low” if no
parent has attended any college and “unknown” if the data are unavailable. We measure
12
One reason is that parental education is not input into the data system until students are tested, which does not
occur until the second grade. However, this does not explain all of the missing data.
10
integration among all three groups but focus on the integration of students whose parents are
designated as having “high” and “low” parental education levels. Integration by student
achievement and parental education may be of particular importance given the 2007 Supreme
Court rejection of race-based preferences in school assignment decisions in Seattle and
Louisville. In this case, Justice Anthony M. Kennedy suggested that districts may want to place
greater emphasis on promoting integration along socioeconomic rather than racial lines.
Across all three dimensions of integration, students use the choice programs to attend
schools at which students are more socioeconomically advantaged.13
As mentioned above, this
means that participation by disadvantaged students should increase integration across the district
but participation by advantaged students will further segregate students.
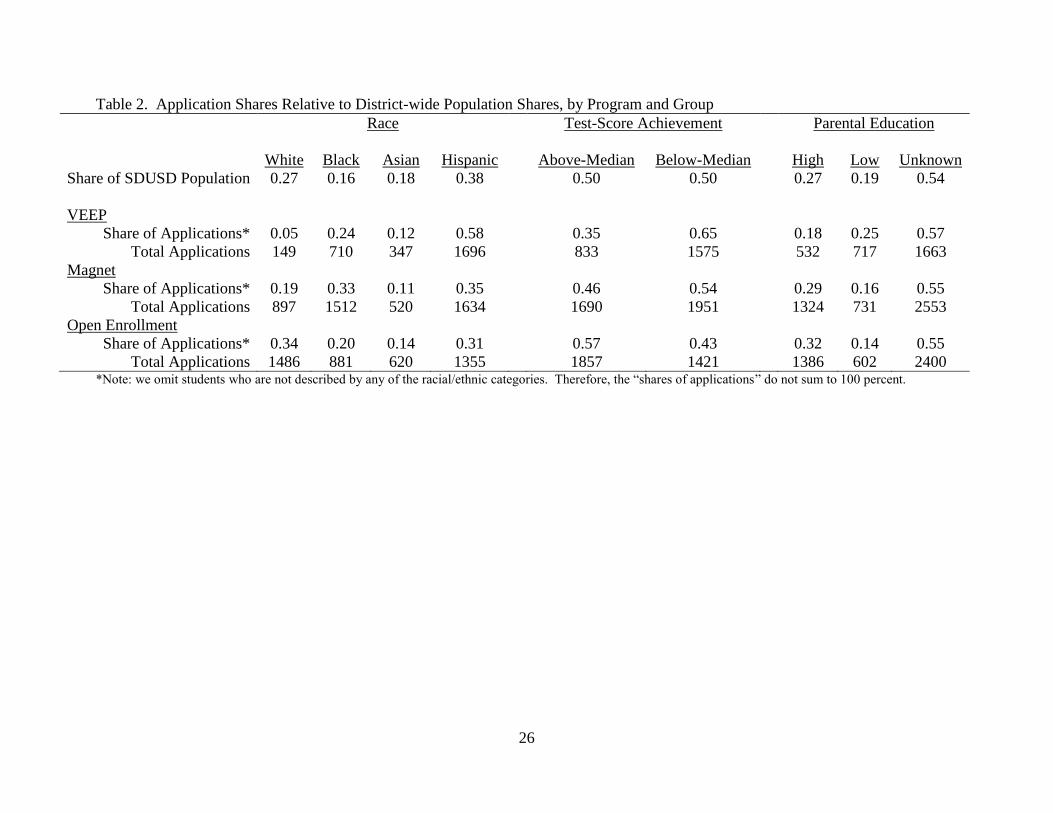
Participation by minority and disadvantaged students is much higher in the VEEP and
magnet programs than in the open-enrollment program. We highlight these participation
differences by comparing the shares of students participating in the choice programs to the shares
of students in the district for each relevant group in Table 2. Minority and disadvantaged
students are consistently over-represented in VEEP, (roughly) fairly-represented in magnet, and
under-represented in open enrollment. This under-representation is interesting because
disadvantaged students should be more likely to participate in school choice based on the
evidence presented here that students use choice programs to improve the socioeconomic
standing of their peers. Put differently, advantaged students are more likely to come from
families that participate in the “primary” school-choice market – the housing market.
13
Tables analogous to Table 1 broken down by student achievement and parental education are available from the
authors upon request. We do not have test-score data for all students. We use just the fraction of our student sample
for whom we have test scores in this portion of our analysis.
11
Conversely, disadvantaged students should depend more heavily on the “secondary market”,
operating through the district provided school-choice programs.14
III. Effects of School Choice on Integration
We measure the integrative effects of the choice programs using exposure indices. As an
example, consider the exposure of black to white students in the district. An exposure index
reports, for the typical black student in the district, the proportion of students in his or her school
who are white. The formula for such an index is:
(2) *J
j j
j j
x y
X t
In (2), jx is the number of black students at school j, X is the total number of black students in
the district, jy is the number of white students at school j and jt is the total population at school
j. Thus, the exposure index is a weighted average of the proportion of students who are white at
each school with the schools’ shares of the overall black population serving as the weights.
We compare the actual district-wide exposure indices to counterfactual indices that we
calculate by “undoing” all of the student movement associated with the 2000-2001 applicants to
the school choice programs, and returning these students to their local public schools. We
interpret the differences between actual student integration and our counterfactuals as the single-
year effects of the school-choice programs, again noting that we cannot observe Tiebout or
public-private choice.15
14
Supply constraints in the school choice programs also affect participation. See Koedel et al. (2009) for more
information. 15
As discussed in Section I and Appendix A, our exposure-index calculations are based on a subsample of the total
application pool. The omitted applications should not be problematic for comparisons across programs; however,
they will result in an understatement of the net single-year effects of the school choice programs.
12
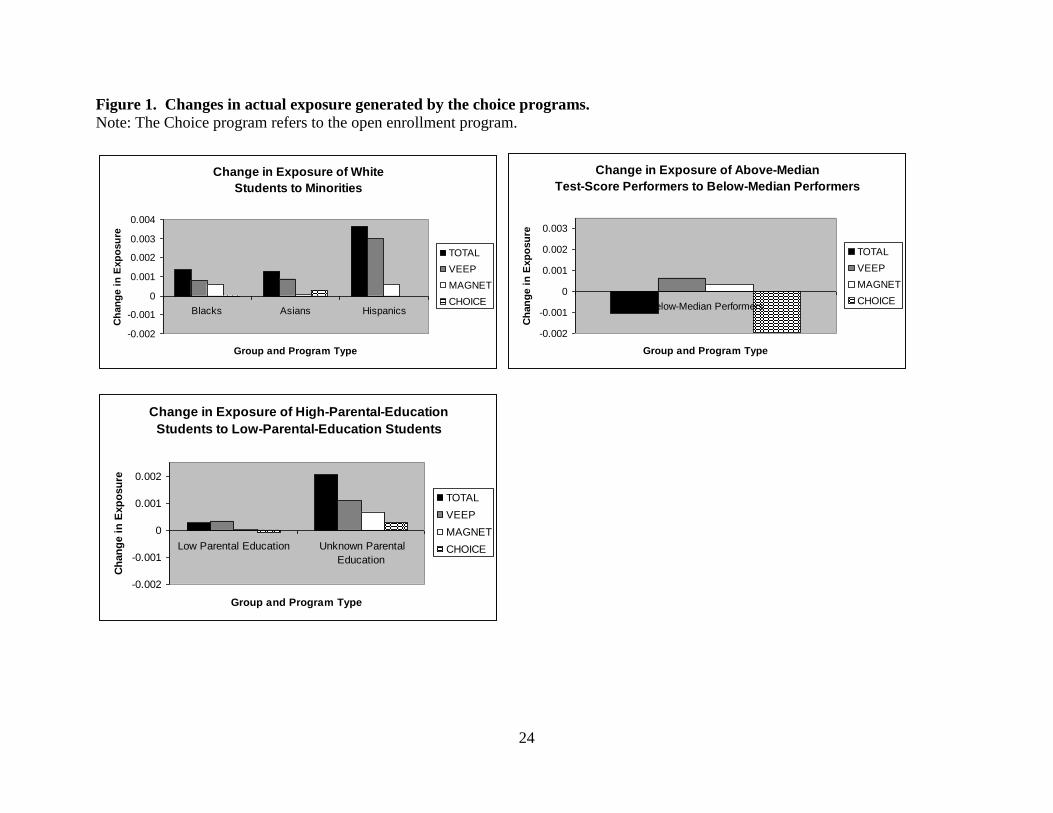
Figure 1 shows results from our exposure-index calculations along each dimension of
integration. In each case we show the net change in exposure resulting from the combination of
all programs and the change in exposure attributable to each program individually. Figure 1
focuses on exposure to the group that is the most sought after in each case – the most
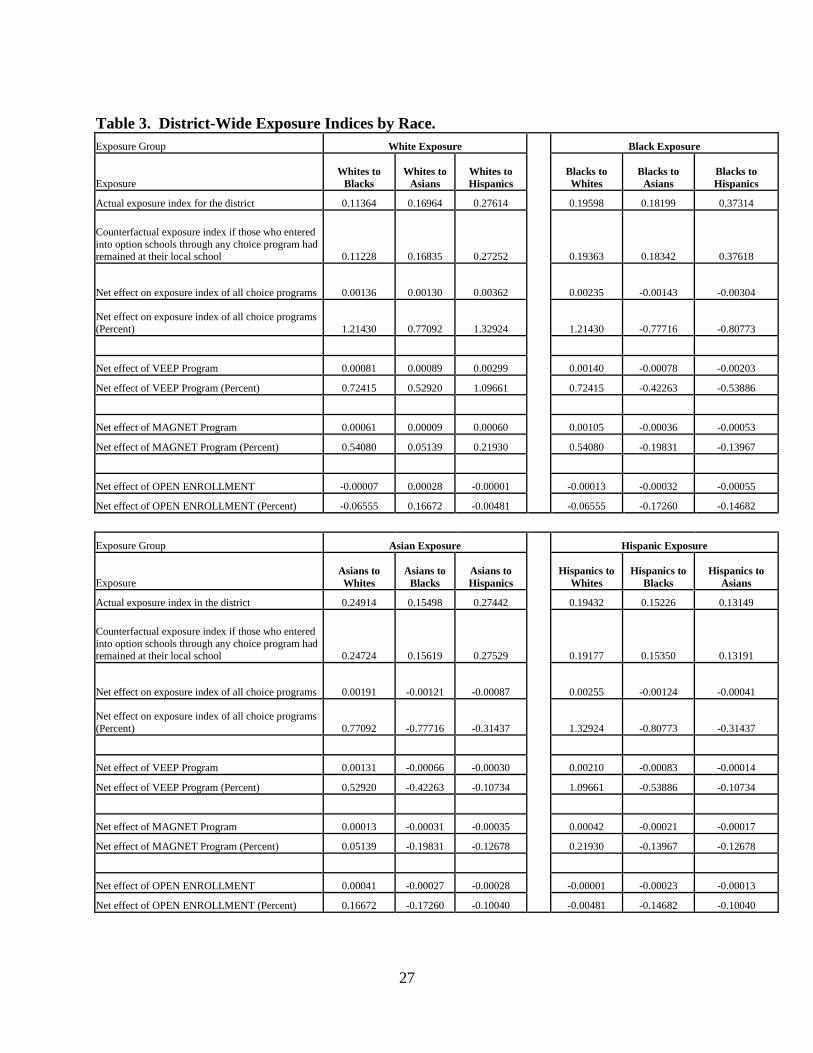
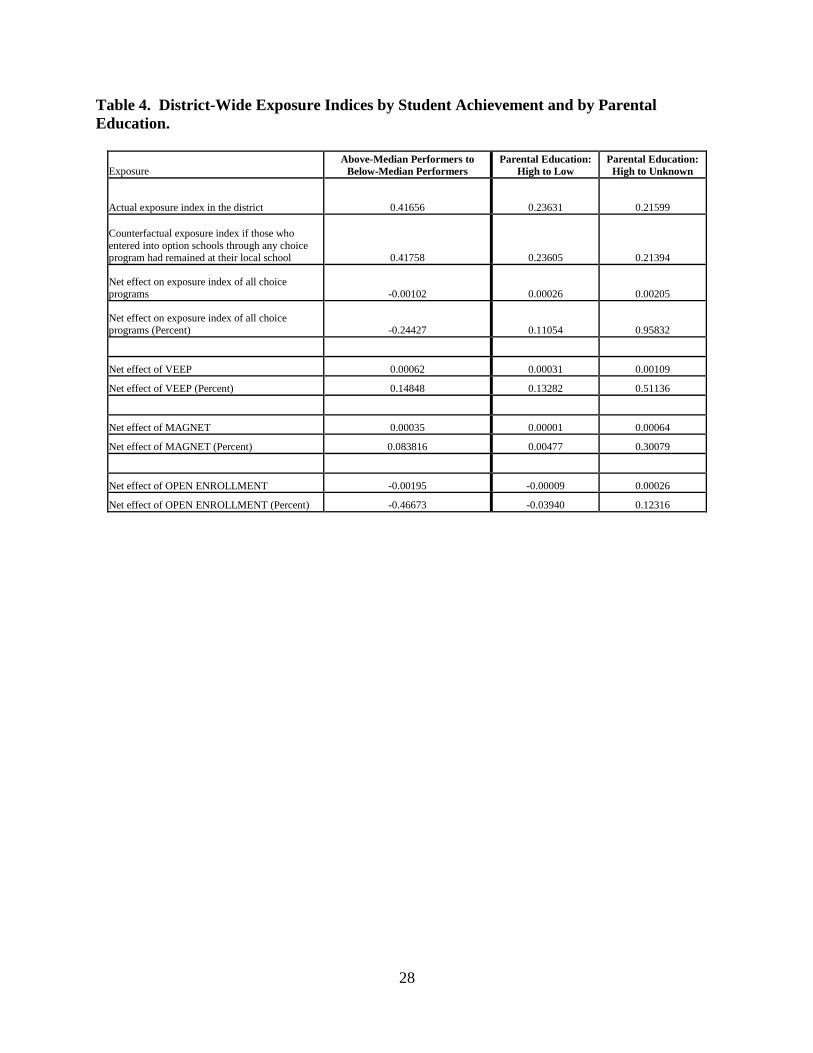
socioeconomically advantaged. Tables 3 and 4 provide the numerical details for all of our
exposure-index calculations.
The first panel of Figure 1 shows that the VEEP and magnet programs increase the
exposure of whites to non-whites, and vice-versa. (We can sum the exposure of whites across
racial groups to infer changes in exposure of whites to non-whites.) The open-enrollment
program increases the exposure of whites to Asians but segregates whites from blacks and
Hispanics. Notably, Asian students at SDUSD are much less likely to be disadvantaged than
other non-white groups. While the VEEP and magnet programs integrate disadvantaged
minorities with advantaged groups, the open-enrollment program is counterproductive in this
sense.
The second panel of Figure 1 shows district-wide changes in exposure based on student
achievement. Again, the VEEP and magnet programs apply integrating pressure along this
dimension and the open-enrollment program segregates above- and below-median performers.
Dominated by the negative effect of the open-enrollment program, the overall effect of all three
programs on integration by student achievement is negative.
The third panel of the figure shows integration by parental-education levels, with the
integrating and segregating effects of the three programs mirroring those found in the race and
student-achievement analyses. The parental-education exposure indices are somewhat clouded
by the ambiguity surrounding the “unknown” parental education group. Figure 1 shows that
13
integration between parental-education groups consists mostly of integration between students
designated as having high parental education and students whose parental-education status is
unknown. Looking specifically at the change in exposure between students from high and low
parental education families, the effects of the choice programs seem fairly mild and again, the
open-enrollment program applies segregating pressure.
IV. The Social Cost of Open Enrollment
Figure 1, and the corresponding Tables 3 and 4, imply a social cost of open enrollment.
Namely, the open-enrollment program segregates advantaged and disadvantaged students.
Interpreting the voluntary and continued funding of the VEEP and magnet programs as an
indication of society’s willingness-to-pay for integration, we use district expenditures on these
programs to estimate the social cost, in dollars, of the segregation generated by open enrollment
in San Diego.
Our calculations require that we estimate the quantity of integration purchased by the
district for the price observed in the budget. Our exposure-index calculations from the previous
section are helpful here, but imperfect because they are based on a single-year snapshot of the
effects of the three programs. That is, they measure integration flows whereas district
expenditures on VEEP and magnet are used to purchase integration stocks. In order for our flow-
based integrative measures to be useful, it must be the case that the integrative effects of the
VEEP, magnet and open-enrollment programs, measured in flows, are proportional to their
respective effects on integration stocks. It is these stocks of integration that the district is
purchasing through its operation of the VEEP and magnet programs.
The key assumption that we require in our analysis is detailed in equation (3). Namely,
the ratio of the segregating effect of the open-enrollment program to the integrating effects of the
14
VEEP and magnet programs, measured in flows, must be approximately equal to the ratio of the
effects of these programs on integration stocks. That is:
(3)
F S
o o
F F S S
v m v m
INT INT
INT INT INT INT
The subscripts on each term in (3) indicate the choice program (VEEP, magnet or open-
enrollment). The superscript “F” denotes a flow effect and the superscript “S” denotes a stock
effect, where by flow we mean the one-year change in integration driven by our cohort of study
and by stock we mean the net integration in a given year that has resulted from all of the student
movement from this and previous cohorts in each program. For example, F
oINT is the integrating
effect of the open-enrollment program along some dimension, such as the change in black-white
exposure, measured as a “flow”, calculated using the exposure-index change generated by
movements from one year of applications. This flow will be negative when the program
segregates students.
Intuitively, the approximate equality in (3) will hold if relative student movement across
the school-choice programs in our cohort is similar to that of prior cohorts. This requires that
two conditions be met. First, our observed cohort must be similar to other cohorts in
demographics and school-choice preferences. Given the size of each cohort at SDUSD, where
the student population exceeds 140,000, this seems reasonable. Second, student movement via
the school-choice programs in our observed cohort must be supply-side constrained similarly to
other cohorts. There are two issues to consider here. First, the relative magnitudes of flows
across the three programs for the cohort for which we have data should reflect the respective
program sizes in the district, which we address below (see Equation (4)). Second, the
distribution of available choice slots within each program faced by our cohort of applicants
15
should roughly mirror the district-wide distribution of active slots within each program. This
condition would be violated if, for example, previous cohorts assumed the most desirable school-
choice slots prior to program entry for our observed cohort. In this case, our observed cohort
would only be active in the choice programs along the fringes of what was left over by previous
cohorts, and there would be a disconnect between the ratio of integration-flow effects and the
corresponding ratio of integration-stock effects.
Although we do not have the data to empirically investigate this possibility, it seems
unlikely for three reasons.16
First, because the schooling process is finite, even if some of the
early entrants into the school-choice programs took the most desirable slots, these students would
not retain these slots indefinitely – they would graduate, and/or move on from elementary to
middle school, or from middle school to high school. Given a perpetual line of exiting school-
choice participants, particularly desirable slots that were absorbed by previous cohorts should
continually become available. Second, heterogeneity in preferences among students and parents
over choice schools as documented by Betts et al. (2006) and Glazerman (1997) calls into
question the existence of a set of “clearly preferred” school-choice slots. Third, because the
three choice programs have existed for several decades, the system is roughly in equilibrium,
meaning that there has not been a radical departure from typical enrollment patterns in recent
years.
If we can plausibly rule out differential supply-side constraints in the within-program
distributions of available slots, it is straightforward to adjust equation (3) to ensure that our
relative flow magnitudes are representative of the relative stock magnitudes for each of the three
choice programs. Zau and Betts (2005) report that roughly 6.4, 6.2 and 6.6 percent of the
16
In principle we could investigate the distribution of available slots in our cohort and compare it to the distribution
of slots among all current participants. However, because we do not have reliable data on students’ local schools
outside of our cohort of study we cannot determine what options were available to these students.
16
SDUSD population was actively participating in the VEEP, magnet and open-enrollment
programs in the fall of 2001, respectively. We denote these participation stock percentages by
, , and S S S
V M OP P P . We convert these to the total numbers of participants, or stocks, in each of
the three programs by multiplying each by T/100 where T is the total enrollment in the district.
We adjust our flow-effect estimates for the VEEP, magnet and open-enrollment programs to
equate them in relative magnitudes with observed stocks in (4):
(4)
( /100)
( /100) ( /100)
SF O
o F SO o
S SS SF F v mV M
v mF F
V M
P TINT
N INT
INT INTP T P TINT INT
N N
Here, F
xN , where x=O, V, M, represents the numbers of observed movers in each of the three
choice programs in our data for this single cohort. In words, the left-hand side of (4) scales up
each integration-flow effect by the ratio of total participation in the given program to observed
movers into the given program in our data (for VEEP, magnet and open-enrollment, the
respective scaling factors in equation (4) are approximately 17.15, 11.69 and 14.55). The
assumption implicit in this weighting formula is that students who joined the choice programs in
prior years proportionally affected integration in the same way as those entering in the fall of
2001.
The social cost of open-enrollment measured along any dimension of integration can be
estimated by multiplying the ratio on the left-hand side by the district’s combined expenditures
on the VEEP and magnet programs. If the ratio is negative, it suggests a social cost and if it is
positive (which does not occur here), it suggests a benefit in the sense that the open-enrollment
program is providing “free” integration to the district.
17
Our estimate of VEEP and magnet expenditures comes from SDUSD’s Information
Report for Student Transportation Services for the 1999-2000 school year, presented to the board
of education in June of 2001. The report indicates that the district spent $16 million on
transportation for the VEEP and magnet programs in 1999-2000.17
That is, the cost of
maintaining the integration stocks supported by the VEEP and magnet programs is roughly $16
million per year, measured in 1999-2000 dollars. We combine our estimates of equation (4) with
this cost information to calculate the social cost of open enrollment.
Our initial calculations assume that the district is only interested in racial integration, and
in particular, the integration of whites with black and Hispanic students. This assumption
follows most directly from the original integrative objectives of the VEEP and magnet programs.
We assume the district is equally interested in integrating whites with blacks and Hispanics,
meaning that we assign equal weight to white-black and white-Hispanic integration in the
district. An alternative would be to re-assign black and Hispanic students as “disadvantaged
minorities” and calculate new exposure indices; however, in this case the integrative effects for
the much larger Hispanic population at SDUSD would dominate the integrative effects for black
students.
Equation (5) illustrates our cost calculation based only on racial-integration effects. The
flow-effect estimates are obtained from the upper-left panel of Table 3:
(5) 1 0.00007*(14.55) 1 0.00001*(14.55)
[ *($16 )*( ) *($16 )*( )]2 0.00081*(17.15) 0.00061*(11.69) 2 0.00299*(17.15) 0.00060*(11.69)
C mil mil
1 1
[ *($16 )*(0.046) *($16 )*(0.003)]2 2
mil mil
17
Expenditure data specific to the VEEP and magnet programs could only be obtained from operations for the 1999-
2000 school year. As long as the approximate equality in (3) holds across years, any year of expenditure data will
be sufficient to calculate social cost. It is helpful that this estimate is from a year very close to the year from which
we obtain our integration-flow measures (applications for fall 2001).
18
$387,000
The first term in (5) represents the social cost of open enrollment in terms of segregating
black and white students, approximately $364,000, and the second term the social cost in terms
of segregating Hispanic and white students, approximately $23,000.18
This implies a total cost
of roughly $387,000 per year, or 2.4 percent of the transportation budget allocated to promote
integration at SDUSD.
Our cost estimate skyrockets if we assume that the district also cares about integration
based on other socioeconomic characteristics, primarily because the segregating effects of the
open-enrollment program are much larger along the other dimensions. For simplicity, consider
the case where the district equally values integration by race, student-achievement, and parental
education.19
If we assign weights of one-sixth each for white-black and white-Hispanic
integration (for a one-third total weight on racial integration) and one-third each to integration by
student achievement and parental-education status, the costs of the open-enrollment program
calculated analogously to equation (5) are $129,000 for racial segregation, $9.16 million for
student-achievement segregation and $1.16 million for parental-education segregation. That is, a
total cost of approximately $10.45 million dollars.
The appropriate social cost measure probably lies somewhere in between the estimates of
$387,000 and $10.45 million. On the one hand, it is unlikely that the district cares only about
racial integration as race is often used as a proxy measure for social disadvantage more
generally. On the other, given that the VEEP and magnet programs were specifically designed
in the spirit of racial integration, it is also unlikely that equal value should be placed on all three
18
For illustrative purposes we show equation (4) using the flow-effect estimates as reported in Table 3; however, the
entries in Table 3 are rounded such that equation (4) does not exactly produce our cost estimate of $387,000, which
we obtain using the unrounded flow-effect estimates. 19
We evaluate integration only between students designated as having high and low parental-education in these
calculations.
19
integrative measures. Note that even small weights on the non-race measures of integration
quickly amplify the implied social cost of the open-enrollment program. However, even at the
high end, our social-cost estimates represent only a small fraction of the district’s total budget,
which was roughly 1.4 billion dollars for the 1999-2000 school year.
Finally, recall from the introduction that there are two reasons our estimates may
overstate the social costs of open enrollment. First, district expenditures on VEEP and magnet
may over-estimate society’s willingness-to-pay for integration. This would be the case if these
programs were maintained for non-integrative reasons like providing opportunities for
disadvantaged students, or if they persist simply because of political inertia. Although we do not
have the data to make strong claims about the plausibility of these alternative scenarios, it would
be straightforward to deflate our estimates to be consistent with a world in which these factors
are partly responsible for SDUSD’s continued support of the VEEP and magnet programs. For
example, if only half of the “integration” expenditures in the budget are truly indicative of a
willingness-to-pay for integration, our cost estimates could be cut in half.
The second issue that could lead us to overstate social costs is that we do not observe
alternate forms of school choice like Tiebout Choice or choice on the public-private margin.
Here it is less clear how to adjust our estimates. Ultimately, while we are probably slightly
overstating the segregating effects of open enrollment because of our inability to observe these
alternate forms of school choice, we expect our counterfactual assignments of individuals to their
local public schools to be fairly accurate.20
20
Our use of an observed payment as a measure of willingness-to-pay could also lead us to understate social costs.
As an analogy, consider a consumer’s purchase of good X for $Y. By observing the purchase, we know the
consumer was willing to pay at least $Y, but we generally expect the consumer’s true valuation to exceed $Y. It is
possible that the integrative benefits generated by the VEEP and magnet programs are worth more to the district
than the required expenditures.
20
V. Conclusion
Students (and their families) use school choice programs to improve the socioeconomic
standing of their peers. We observe that applicants use the choice programs to attend schools
that have a higher proportion of white students, above-median test score performers and more
students with highly educated parents. Because all participants use school choice programs to
attend schools with more socioeconomically advantaged peers, participation by disadvantaged
students tends to increase integration while participation by advantaged students applies
segregating pressure.
Of the three school-choice programs in place in San Diego, the open-enrollment program
is the only one that segregates the school district. Direct expenditures by SDUSD aimed at
increasing integration suggest a social cost of open enrollment, realized in terms of student
segregation. We provide estimates of this cost that depend on the relative valuations of
integration along the three dimensions that we consider. Our most conservative estimate, which
focuses solely on the segregating effects as measured by race/ethnicity and ignores the
segregating effects as measured by student achievement and parental education status, implies
that the open-enrollment program in San Diego has a social cost of $387,000. At the high end,
our analysis suggests a social cost of approximately $10.45 million. Even this figure is fairly
small when compared to the overall district budget. We also note that our treatment of school
choice as a mechanism to promote integration ignores other issues, and benefits, that would merit
attention in any careful cost-benefit analysis.21
21
The evidence on the benefits of school choice is mixed. Betts et al. (2006) find no consistent evidence of
achievement gains for school-choice lottery winners in San Diego, with the exception of positive math effects at
magnet high schools. Cullen, Jacob and Levitt (2006) also find little evidence that choice participants benefit from
school changes and find that in some ways these students perform worse. Alternatively, Angrist et al. (2002) find
positive school-choice effects. Despite the ambiguity in the literature, the queues of families lining up to participate
in school-choice programs across the country suggest that there are benefits even if they have not been consistently
identified by the research community.
21
Finally, we conclude by reminding the reader that the estimates presented here are
contextual. We cannot tell whether the open-enrollment program would segregate the district in
the absence of the VEEP and magnet programs, because we do not observe student behavior in
the absence of these other programs. However, it is certainly possible, and even likely, that if the
VEEP and magnet programs were discontinued some participants in these programs would
choose to participate in open-enrollment. Depending on which types of students would use
open-enrollment, this could increase or decrease the program’s segregating effects. Perhaps this
analysis is best viewed within the context of a multi-pronged school-choice system that includes
busing programs. It seems clear that under these circumstances, open-enrollment will undo some
of the integration created by these busing programs and in this way its true costs will exceed its
simple accounting costs.
22
References Angrist, Joshua D., Eric Bettinger, Erik Bloom, Elizabeth King and Michael Kremer, “Vouchers
for Private Schooling in Colombia: Evidence from a Randomized Natural Experiment,”
American Economic Review, 92, 2002.
Antonovics, Kate and Brian Knight, “A New Look at Racial Profiling: Evidence from the Boston
Police Department,” Review of Economics and Statistics, 91, 2009.
Betts, Julian R., Lorien A. Rice, Andrew C. Zau, Y. Emily Tang and Cory R. Koedel, Does
School Choice Work? Effects on Integration and Achievement, San Francisco, Public Policy
Institute of California, 2006.
Bifulco, Robert, Helen Ladd and Stephen Ross, “Public School Choice and Integration: Evidence
from Durham, North Carolina,” Social Science Research, 38, 2009.
Brunner, Eric and Jennifer Imazeki, “Tiebout Choice and Universal School Vouchers,” Journal
of Urban Economics, 63, 2008.
Cascio, Elizabeth, Nora Gordon, Ethan Lewis and Sarah Reber, “From Brown to Busing,”
Journal of Urban Economics, 64(2), 2008.
Cullen, Julie, Brian Jacob and Steven Levitt, “The Effect of School Choice on Participants:
Evidence from Randomized Lotteries,” Econometrica, 74, 2006.
Cutler, David M., Edward L. Glaeser, and Jacob L. Vigdor, “The Rise and Decline of the
American Ghetto,” Journal of Political Economy, 107, 1999.
Ferreyra, Maria M., “Estimating the Effects of Private School Vouchers in Multidistrict
Economies,” American Economic Review, 97, 2007.
Glazerman, Steven M., “Determinants and Consequences of Parental School Choice,” Harris
School of Public Policy, University of Chicago, Mimeo, 1997.
Guryan, Jonathan, “Desegregation and Black Dropout Rates,” American Economic Review
94(4), 2004.
Holzer, Harry and Keith R. Ihlanfeldt. “Customer Discrimination and Employment Outcomes for
Minority Workers.” The Quarterly Journal of Economics, 113, 1998.
Keith R. Ihlanfeldt, Keith R., and Benjamin Scafidi, “Black Self-Segregation as a Cause of
Housing Segregation: Evidence from the Multi-City Study of Urban Inequality,” Journal of
Urban Economics, 51, 2002.
Jacob, Brian and Lars Lefgren, “What Do Parents Value in Education? An Empirical
Investigation of Parents’ Revealed Preferences for Teachers,” Quarterly Journal of Economics,
vol 122, no. 4, 2007.

23
King, Thomas A., and Peter Mieszkowski, “Racial Discrimination, Segregation, and the Price of
Housing,” Journal of Political Economy, 81, 1973.
Koedel, Cory, Julian R. Betts, Lorien A. Rice and Andrew C. Zau, "The Integrating and
Segregating Effects of School Choice", Peabody Journal of Education, 84, 2009.
Levin, Henry, “Educational Vouchers: Effectiveness, Choice, and Costs,” Journal of Policy
Analysis and Management, 17, 1998.
Reback, Randall, “Demand (and Supply) in an Inter-District Public School Choice Program,”
Economics of Education Review, 27, 2008.
Yinger, John, “The Black-White Price Differential in Housing: Some Further Evidence,” Land
Economics, 54, 1978.
Zau, Andrew and Julian Betts, “The Evolution of School Choice,” in Frederick M. Hess, ed.,
Urban School Reform: Lessons from San Diego, Harvard Education Press, Cambridge, MA,
2005.
24
Figure 1. Changes in actual exposure generated by the choice programs.
Note: The Choice program refers to the open enrollment program.
Change in Exposure of White
Students to Minorities
-0.002
-0.001
0
0.001
0.002
0.003
0.004
Blacks Asians Hispanics
Group and Program Type
Ch
an
ge i
n E
xp
osu
re
TOTAL
VEEP
MAGNET
CHOICE
Change in Exposure of Above-Median
Test-Score Performers to Below-Median Performers
-0.002
-0.001
0
0.001
0.002
0.003
Below-Median Performers
Group and Program Type
Ch
an
ge i
n E
xp
osu
re
TOTAL
VEEP
MAGNET
CHOICE
Change in Exposure of High-Parental-Education
Students to Low-Parental-Education Students
-0.002
-0.001
0
0.001
0.002
Low Parental Education Unknown Parental
Education
Group and Program Type
Ch
an
ge i
n E
xp
osu
re
TOTAL
VEEP
MAGNET
CHOICE
25
Table 1. Average Percentage Point Differences in the Racial/Ethnic Makeup at Option and Local
Schools, as Implied by Application Data, by Applicant’s Race and Program Type.
Applicant’s Own Race
White Black Asian Hispanic
VEEP
%White Diff 38.3 41.6 39.6 38.8
%Black Diff -12.2 -19.4 -11.4 -11.4
%Asian/Pac Islander Diff -5.9 -5.5 -12.3 0.4
%Hispanic Diff -21.1 -16.9 -16.8 -28.1
Number of Applications 149 710 347 1696
Magnet
%White Diff 1.4 12.4 10.9 14.8
%Black Diff 5.6 -3.6 -1.6 -2.0
%Asian/Pac Islander Diff -3.8 -3.9 -6.4 -2.4
%Hispanic Diff -4.1 -5.5 -3.6 -11.3
Number of Applications 897 1512 520 1634
Open-Enrollment
%White Diff 10.8 10.2 13.4 11.3
%Black Diff -3.0 -5.4 -2.9 -3.0
%Asian/Pac Islander Diff -1.6 -3.5 -4.8 -2.9
%Hispanic Diff -6.5 -1.4 -5.9 -5.5
Number of Applications 1486 881 620 1355
26
Table 2. Application Shares Relative to District-wide Population Shares, by Program and Group
Race
Test-Score Achievement Parental Education
White Black Asian Hispanic
Above-Median Below-Median High Low Unknown
Share of SDUSD Population 0.27 0.16 0.18 0.38
0.50 0.50 0.27 0.19 0.54
VEEP
Share of Applications* 0.05 0.24 0.12 0.58
0.35 0.65 0.18 0.25 0.57
Total Applications 149 710 347 1696
833 1575 532 717 1663
Magnet
Share of Applications* 0.19 0.33 0.11 0.35
0.46 0.54 0.29 0.16 0.55
Total Applications 897 1512 520 1634
1690 1951 1324 731 2553
Open Enrollment
Share of Applications* 0.34 0.20 0.14 0.31
0.57 0.43 0.32 0.14 0.55
Total Applications 1486 881 620 1355
1857 1421 1386 602 2400 *Note: we omit students who are not described by any of the racial/ethnic categories. Therefore, the “shares of applications” do not sum to 100 percent.
27
Table 3. District-Wide Exposure Indices by Race.
Exposure Group White Exposure Black Exposure
Exposure Whites to
Blacks
Whites to
Asians
Whites to
Hispanics
Blacks to
Whites
Blacks to
Asians
Blacks to
Hispanics
Actual exposure index for the district 0.11364 0.16964 0.27614 0.19598 0.18199 0.37314
Counterfactual exposure index if those who entered
into option schools through any choice program had remained at their local school 0.11228 0.16835 0.27252 0.19363 0.18342 0.37618
Net effect on exposure index of all choice programs 0.00136 0.00130 0.00362 0.00235 -0.00143 -0.00304
Net effect on exposure index of all choice programs
(Percent) 1.21430 0.77092 1.32924 1.21430 -0.77716 -0.80773
Net effect of VEEP Program 0.00081 0.00089 0.00299 0.00140 -0.00078 -0.00203
Net effect of VEEP Program (Percent) 0.72415 0.52920 1.09661 0.72415 -0.42263 -0.53886
Net effect of MAGNET Program 0.00061 0.00009 0.00060 0.00105 -0.00036 -0.00053
Net effect of MAGNET Program (Percent) 0.54080 0.05139 0.21930 0.54080 -0.19831 -0.13967
Net effect of OPEN ENROLLMENT -0.00007 0.00028 -0.00001 -0.00013 -0.00032 -0.00055
Net effect of OPEN ENROLLMENT (Percent) -0.06555 0.16672 -0.00481 -0.06555 -0.17260 -0.14682
Exposure Group Asian Exposure Hispanic Exposure
Exposure
Asians to
Whites
Asians to
Blacks
Asians to
Hispanics
Hispanics to
Whites
Hispanics to
Blacks
Hispanics to
Asians
Actual exposure index in the district 0.24914 0.15498 0.27442 0.19432 0.15226 0.13149
Counterfactual exposure index if those who entered
into option schools through any choice program had remained at their local school 0.24724 0.15619 0.27529 0.19177 0.15350 0.13191
Net effect on exposure index of all choice programs 0.00191 -0.00121 -0.00087 0.00255 -0.00124 -0.00041
Net effect on exposure index of all choice programs
(Percent) 0.77092 -0.77716 -0.31437 1.32924 -0.80773 -0.31437
Net effect of VEEP Program 0.00131 -0.00066 -0.00030 0.00210 -0.00083 -0.00014
Net effect of VEEP Program (Percent) 0.52920 -0.42263 -0.10734 1.09661 -0.53886 -0.10734
Net effect of MAGNET Program 0.00013 -0.00031 -0.00035 0.00042 -0.00021 -0.00017
Net effect of MAGNET Program (Percent) 0.05139 -0.19831 -0.12678 0.21930 -0.13967 -0.12678
Net effect of OPEN ENROLLMENT 0.00041 -0.00027 -0.00028 -0.00001 -0.00023 -0.00013
Net effect of OPEN ENROLLMENT (Percent) 0.16672 -0.17260 -0.10040 -0.00481 -0.14682 -0.10040
28
Table 4. District-Wide Exposure Indices by Student Achievement and by Parental
Education.
Exposure Above-Median Performers to
Below-Median Performers
Parental Education:
High to Low
Parental Education:
High to Unknown
Actual exposure index in the district 0.41656 0.23631 0.21599
Counterfactual exposure index if those who
entered into option schools through any choice program had remained at their local school 0.41758 0.23605 0.21394
Net effect on exposure index of all choice programs -0.00102 0.00026 0.00205
Net effect on exposure index of all choice programs (Percent) -0.24427 0.11054 0.95832
Net effect of VEEP 0.00062 0.00031 0.00109
Net effect of VEEP (Percent) 0.14848 0.13282 0.51136
Net effect of MAGNET 0.00035 0.00001 0.00064
Net effect of MAGNET (Percent) 0.083816 0.00477 0.30079
Net effect of OPEN ENROLLMENT -0.00195 -0.00009 0.00026
Net effect of OPEN ENROLLMENT (Percent) -0.46673 -0.03940 0.12316
29
Appendix A
Data Appendix
Many of the applications to the school choice programs are missing information that we require
to make inference about the integrative effects of school choice and the underlying demand for
school choice. We omit these applications from our analysis. Our largest data omissions come
from applications to kindergarten and the sixth grade (see text for details). In addition to
omitting these applications, we also omit applications where key information is not available,
including basic demographics, local school assignments, or grade levels, among other things.
Our original dataset contains the universe of applications to the three choice programs submitted
in the 2000-01 school year for participation in the fall of 2001-02 (excluding continuity
applications). Table A.1 details the patterns of omitted applications that lead to our final dataset,
which contains approximately 46.5 percent of the original universe of applications.
Table A.1. Data Omissions.
VEEP
Magnet
Open-Enrollment
Count Percent Count Percent Count Percent
Universe of Applications 6453 100 9737 100 9401 100
Application for Grade K
-636 -9.9 -1949 -20.0 -2093 -22.3
Application for Grade 6
-1556 -24.1 -1039 -10.7 -1074 -11.4
Cannot determine current or next
local school, and/or next grade
-687 -10.7 -931 -9.5 -1114 -11.8
Other application problems:
missing information, omitted
priority code, application error*,
etc.
-662 -10.3 -1210 -12.4 -732 -7.8
Final Application Count 2912 45.1 4608 47.3 4388 46.7
* For example, some VEEP applicants applied to schools that are not part of the busing pattern.
Although we omit a large number of applications from our analysis, the patterns of missing
applications are consistent across the three choice programs (treating the omissions of grade-k
and grade-6 applications as equivalent in cause). For the purpose of our relative comparison of
the programs, it is this consistency across the three programs that is most important because it
facilitates the assumption in equation (1) in the text. In words, equation (1) assumes that the
ratio of the integrative flow effects of the included and omitted applications is constant across
programs.
Algebraically, the assumption in equation (1) is sufficient for our calculations as long as the ratio
of observed to unobserved moves is also constant across the three programs (Table A.1 suggests
30
that this is roughly the case).22
Returning to equation (4) from Section IV, we use our
integration-flow estimates to calculate social costs based on the following ratio:
(A.1)
( /100)
( /100) ( /100)
SF O
o F
O
S SF FV M
v mF F
V M
P TINT
N
P T P TINT INT
N N
Theoretically, we can incorporate the integrative effects of the unobserved applications into this
equation, and do so in equation (A.2). The underlined integrative flow effects correspond to
those from the unobserved applications, and we re-define the scaling factors (which will
mechanically adjust with the inclusion of the unobserved applications) as θo, θv and θm, for open
enrollment, VEEP and magnet, respectively.
(A.2)
( )*
( )* ( )*
FF
oo o
F FF F
v mv v m m
INT INT
INT INT INT INT
The assumption in equation (1) can be written to conform to the notation in (A.2) as:
(A.3) F F F
v m o
F F F
v m o
INT INT INT
INT INT INT
Multiplying each term in (A.2) by yields:
(A.4)
( * * ) ( * * )
[( * * ) ( * * )] [( * * ) ( * * )]
F FFF o ooo o oF F
o o
F F F FF FF Fv v m mv mv v v m m mF F F F
v v m m
INT INTINT INT
INT INT
INT INT INT INTINT INT INT INT
INT INT INT INT
Equation (A.4) can be simplified to the following expression, which is equivalent to the ratio that
we use in our calculations:
(A.5) * *( 1)
* *( 1) * *( 1)
F
o o
F F
v v m m
INT
INT INT
22
If is unknown and not equal to one, the assumption in (A.3) is not sufficient by itself for our calculations. It
must also be the case that the ratio of observed to unobserved moves is constant across programs (this is required to
ensure proper scaling). Fortunately, Table A.1 suggests that the ratios of observed to unobserved moves in each
program are similar.
![The Effects of Compulsory Military Service Exemption on ... · veterans has diminished quickly over time [Angrist and Chen (2011), Angrist, Chen, and Song (2011)]. Angrist and Krueger](https://img.pdfslide.net/doc/110x75/60c1dec32f107f6d86766956/the-eiects-of-compulsory-military-service-exemption-on-veterans-has-diminished.jpg)