Embed Size (px)
Citation preview

THE SOCIAL, PSYCHOLOGICAL AND ECONOMIC IMPACT OF FLOODING IN GA-MOTLA AND GA-MOEKA COMMUNITIES OF MORETELE DISTRICT
IN NORTH WEST PROVINCE, SOUTH AFRICA
By
R.T. Rabalao
2006108977
Submitted in partial fulfilment of the requirements for the degree
Master’s in Disaster Management
Disaster Management Training and Education Centre for Africa
At the
UNIVERSITY OF THE FREE STATE
BLOEMFONTEIN
Study Leader: Mr A. J. Jordaan
2010

ii
DECLARATION
I …………………………………………………………………………… declare that the social,
psychological and economic impact of flooding in Ga-Motla and Ga-Moeka communities of
Moretele district in North West Province, South Africa, is my own work and that all the
sources that I have used or quoted have been indicated and acknowledged by means of
complete references.
Signature: …………………………………………………….....
Date: ……………………………………………………………..

iii
ACKNOWLEDGEMENT
This thesis was completed with the assistance and support of a number of people; my
heartfelt thanks and appreciation for the following:
¶ Mr Andries Jordaan, my supervisor, who guided me and provided direction to the
thesis.
¶ Dr Steve Olorunju, for the analysis part and guidance in other areas of the thesis.
You were a God-sent.
¶ Mr Jerry Madiba, my former manager, for the coaching and influence and for
believing in me.
¶ The men, women and families who agreed to be interviewed for this thesis.
¶ The Department of Science and Technology for making it possible to pursue my
Master’s degree.
¶ My family; my husband Danny, my children Loago and Tshepang who had to stay
with Aunty Paulina for weeks when I went to Bloemfontein for my studies.
¶ Magdeline Mmusi, my mother, and my younger sister, Neo, who have been there for
me throughout all my studies.
¶ Mavis, my colleague, for referring me to Dr Steve Olorunju.

iv
ABSTRACT
The purpose of this study was to investigate why the Ga-Moeka and Ga-Motle villages
in the Moretele Local Municipality were victims of floods after heavy rains. Another aim
was to determine how the communities in those villages were affected socially,
economically and psychologically by floods.
The methodology section was divided into three major subsections, namely the
research instruments, data and analysis. Questionnaires were used and they were
completed by random sampling from Ga-Moeka and Ga-Motle communities. Fifty
questionnaires were sent out to community members of the two villages, which were
divided into four parts to elicit personal information, social, economic and
psychological impact information of the respondents.
The results of the questionnaire revealed a high level of concern within the two
communities. According to the social impact, most people felt badly affected as most
of them did not receive assistance. A small percentage managed to get help from their
municipality. In terms of the economic impact, it was large in terms of replacing
property that had been destroyed by floods; medical expenses as many of them
received little income; most of those who were working, earned between R500 and
R2000. Regarding the psychological impact, a large percentage suffered shock and
experienced trauma for less than a week although a very small percentage suffered
trauma for a year at least.
It is recommended that there must be upgrading of the infrastructure in the area in
terms of building of a new dam or recapacitation of the existing dam, roads and the
drainage system; that there must be a relocation plan, compulsory insurance, early
warning systems, and that there must be good communication in the communities
during floods.

v
TABLE OF CONTENTS
1.1 INTRODUCTION ................................................................................................................................. 1
1.2 BACKGROUND INFORMATION ........................................................................................................... 1
1.3 POPULATION ..................................................................................................................................... 4
1.4 PROBLEM STATEMENT ..................................................................................................................... 6
1.5 RESEARCH OBJECTIVES .................................................................................................................. 6
1.6 CRITICAL RESEARCH QUESTIONS ................................................................................................... 7
1.7 RESEARCH METHODOLOGY ............................................................................................................. 8
1.8 RESEARCH DESIGN .......................................................................................................................... 8
1.9 METHODOLOGY ................................................................................................................................ 9
1.9.1 Research Instruments (description and justification) .............................................................. 9 1.9.2 Data (population and sample: strength, weaknesses).......................................................... 10 1.9.3 Analysis (techniques and justification) .................................................................................... 10
1.10 LIMITATIONS ................................................................................................................................... 11
1.11 ETHICAL CONSIDERATION .............................................................................................................. 12
1.12 CONCLUSION .................................................................................................................................. 12
2.2 INTRODUCTION .................................................................................................................................. 13
2.3 TYPES OF FLOODS ............................................................................................................................ 13
2.4 FLOODING .......................................................................................................................................... 14
2.5 FLOOD RISK ....................................................................................................................................... 18
2.6 CAUSES OF FLOODS ......................................................................................................................... 18
2.7 ELEMENTS AT RISK DURING FLOODS ................................................................................................ 19
2.7.1 Schools at risk during floods ......................................................................................................... 19 2.7.2 Children at risk during floods ........................................................................................................ 20 2.7.3 Gender at risk during floods .......................................................................................................... 21 2.7.4 Infrastructure at risk during floods ................................................................................................ 22
2.8 SHELTERS ACCOMMODATING VICTIMS OF FLOODS ......................................................................... 23
2.9 EFFECTS OF FLOODING ..................................................................................................................... 23
2.10 COPING MECHANISMS FOR FLOODS .............................................................................................. 25
2.11 FLOOD FORECASTING AND WARNING ............................................................................................ 25
2.12 THE USE OF GEOGRAPHICAL INFORMATION SYSTEMS (GIS) AND REMOTE SENSING FOR FLOOD
DISASTER MANAGEMENT ........................................................................................................................ 26
2.13 COMMUNICATION DURING FLOODS ................................................................................................. 27
2.14 FLOOD MITIGATION ......................................................................................................................... 28
2.15 CAPACITY BUILDING IN DISASTER MANAGEMENT ......................................................................... 29
2.16 INTEGRATED FLOOD MANAGEMENT ............................................................................................... 29
2.17 THE SOCIAL, PSYCHOLOGICAL AND ECONOMIC IMPACTS OF FLOODS .......................................... 30
2.17.1 The social impact ......................................................................................................................... 30 2.17.2 Psychological impact .................................................................................................................. 31 2.17.3 Economic aspects ........................................................................................................................ 33

vi
3.1 INTRODUCTION ................................................................................................................................ 35
3.2 BACKGROUND OF RESPONDENTS .................................................................................................... 35
3.2.1 Employment .................................................................................................................................... 36 3.2.2 School going children ..................................................................................................................... 38
3.3 SUMMARY .................................................................................................................................... 38
4.1INTRODUCTION ............................................................................................................................ 40
4.2 SOCIAL IMPACT OF FLOODS IN THE AREA ......................................................................... 40
4.2.2 REASONS FOR BEING PRONE TO FLOODS ..................................................................... 43
1.12.1 Summary of the social impact of floods in the Ga-Moeka and Ga-Motle communities
44
4.3 ECONOMIC IMPACT.................................................................................................................... 45
4.4 PSYCHOLOGICAL IMPACT SECTION ..................................................................................... 49
4.5 SUMMARY .......................................................................................................................................... 54
5.1INTRODUCTION ................................................................................................................................... 56
5.1.1Specific objectives and its findings ............................................................................................... 56 5.2 CONCLUSIONS AND RECOMMENDATIONS ......................................................................................... 57
5.3SUGGESTIONS BY RESPONDENTS ON THE SOLUTIONS OF FLOODING IN GA_MOEKA AND GA_MOTLE
VILLAGES ................................................................................................................................................. 59
1.12.2 ......................................................................................................................................................... 71 1.12.3 ......................................................................................................................................................... 71 1.12.4 ......................................................................................................................................................... 71 1.12.5 ......................................................................................................................................................... 71 1.12.6 ......................................................................................................................................................... 71 1.12.7 ......................................................................................................................................................... 71 1.12.8 ......................................................................................................................................................... 72 1.12.9 ......................................................................................................................................................... 72 1.12.10 ....................................................................................................................................................... 72 1.12.11 ....................................................................................................................................................... 72 1.12.12 ....................................................................................................................................................... 72 1.12.13 ....................................................................................................................................................... 72 1.12.14 ....................................................................................................................................................... 72 1.12.15 ....................................................................................................................................................... 72 1.12.16 ....................................................................................................................................................... 73 1.12.17 ....................................................................................................................................................... 73 1.12.18 ....................................................................................................................................................... 73 1.12.19 ....................................................................................................................................................... 73 1.12.20 ....................................................................................................................................................... 73 1.12.21 ....................................................................................................................................................... 73 1.12.22 ....................................................................................................................................................... 73 1.12.23 ....................................................................................................................................................... 73 1.12.24 ....................................................................................................................................................... 73 1.12.25 ....................................................................................................................................................... 73 1.12.26 ....................................................................................................................................................... 73 1.12.27 ....................................................................................................................................................... 73 1.12.28 ....................................................................................................................................................... 73

vii
1.12.29 ....................................................................................................................................................... 74 1.12.30 ....................................................................................................................................................... 74 1.12.31 ....................................................................................................................................................... 74 1.12.32 ....................................................................................................................................................... 74 1.12.33 ....................................................................................................................................................... 74 1.12.34 ....................................................................................................................................................... 74 1.12.35 ....................................................................................................................................................... 74 1.12.36 ....................................................................................................................................................... 74 1.12.37 ....................................................................................................................................................... 74 1.12.38 ....................................................................................................................................................... 74 1.12.39 ....................................................................................................................................................... 74 1.12.40 ....................................................................................................................................................... 74 1.12.41 ....................................................................................................................................................... 74 1.12.42 ....................................................................................................................................................... 75 1.12.43 ....................................................................................................................................................... 75 1.12.44 ....................................................................................................................................................... 75 1.12.45 ....................................................................................................................................................... 75 1.12.46 ....................................................................................................................................................... 75 1.12.47 ....................................................................................................................................................... 75 1.12.48 ....................................................................................................................................................... 75 1.12.49 ....................................................................................................................................................... 75 1.12.50 ....................................................................................................................................................... 75 1.12.51 ....................................................................................................................................................... 75 1.12.52 ....................................................................................................................................................... 75 1.12.53 ....................................................................................................................................................... 75 1.12.54 ....................................................................................................................................................... 76 1.12.55 ....................................................................................................................................................... 76 1.12.56 ....................................................................................................................................................... 76 1.12.57 ....................................................................................................................................................... 76 1.12.58 ....................................................................................................................................................... 77 1.12.59 ....................................................................................................................................................... 77 1.12.60 ....................................................................................................................................................... 77 1.12.61 ....................................................................................................................................................... 77 1.12.62 ....................................................................................................................................................... 77 1.12.63 ....................................................................................................................................................... 77 1.12.64 ....................................................................................................................................................... 77 1.12.65 ....................................................................................................................................................... 77 1.12.66 ....................................................................................................................................................... 77 1.12.67 ....................................................................................................................................................... 77 1.12.68 ....................................................................................................................................................... 78 1.12.69 ....................................................................................................................................................... 78 1.12.70 ....................................................................................................................................................... 78 1.12.71 ....................................................................................................................................................... 78 1.12.72 ....................................................................................................................................................... 78 1.12.73 ....................................................................................................................................................... 78 1.12.74 ....................................................................................................................................................... 78 1.12.75 ....................................................................................................................................................... 78 1.12.76 ....................................................................................................................................................... 78 1.12.77 ....................................................................................................................................................... 78 1.12.78 ....................................................................................................................................................... 78 1.12.79 ....................................................................................................................................................... 79 1.12.80 ....................................................................................................................................................... 79 1.12.81 ....................................................................................................................................................... 79 1.12.82 ....................................................................................................................................................... 79 1.12.83 ....................................................................................................................................................... 79 1.12.84 ....................................................................................................................................................... 79 1.12.85 ....................................................................................................................................................... 79

viii
1.12.86 ....................................................................................................................................................... 79 1.12.87 ....................................................................................................................................................... 79 1.12.88 ....................................................................................................................................................... 79 1.12.89 ....................................................................................................................................................... 79 1.12.90 ....................................................................................................................................................... 79 1.12.91 ....................................................................................................................................................... 79 1.12.92 ....................................................................................................................................................... 80 1.12.93 ....................................................................................................................................................... 80 1.12.94 ....................................................................................................................................................... 80 1.12.95 ....................................................................................................................................................... 80 1.12.96 ....................................................................................................................................................... 80 1.12.97 ....................................................................................................................................................... 80 1.12.98 ....................................................................................................................................................... 80 1.12.99 ....................................................................................................................................................... 80 1.12.100 ..................................................................................................................................................... 80 1.12.101 ..................................................................................................................................................... 80 1.12.102 ..................................................................................................................................................... 80 1.12.103 ..................................................................................................................................................... 81 1.12.104 ..................................................................................................................................................... 81 1.12.105 ..................................................................................................................................................... 81 1.12.106 ..................................................................................................................................................... 81 1.12.107 ..................................................................................................................................................... 81 1.12.108 ..................................................................................................................................................... 81 1.12.109 ..................................................................................................................................................... 81 1.12.110 ..................................................................................................................................................... 81 1.12.111 ..................................................................................................................................................... 81 1.12.112 ..................................................................................................................................................... 81 1.12.113 ..................................................................................................................................................... 81 1.12.114 ..................................................................................................................................................... 82 1.12.115 ..................................................................................................................................................... 82 1.12.116 ..................................................................................................................................................... 82 1.12.117 ..................................................................................................................................................... 82 1.12.118 ..................................................................................................................................................... 82 1.12.119 ..................................................................................................................................................... 82 1.12.120 ..................................................................................................................................................... 82 1.12.121 ..................................................................................................................................................... 82 1.12.122 ..................................................................................................................................................... 82 1.12.123 ..................................................................................................................................................... 82 1.12.124 ..................................................................................................................................................... 83 1.12.125 ..................................................................................................................................................... 83 1.12.126 ..................................................................................................................................................... 83 1.12.127 ..................................................................................................................................................... 83 1.12.128 ..................................................................................................................................................... 83 1.12.129 ..................................................................................................................................................... 83 1.12.130 ..................................................................................................................................................... 83 1.12.131 ..................................................................................................................................................... 83 1.12.132 ..................................................................................................................................................... 83 1.12.133 ..................................................................................................................................................... 83 1.12.134 ..................................................................................................................................................... 84 1.12.135 ..................................................................................................................................................... 84 1.12.136 ..................................................................................................................................................... 84 1.12.137 ..................................................................................................................................................... 84 1.12.138 ..................................................................................................................................................... 84 1.12.139 ..................................................................................................................................................... 84 1.12.140 ..................................................................................................................................................... 84 1.12.141 ..................................................................................................................................................... 84 1.12.142 ..................................................................................................................................................... 84

ix
1.12.143 ..................................................................................................................................................... 84 1.12.144 ..................................................................................................................................................... 85 1.12.145 ..................................................................................................................................................... 85 1.12.146 ..................................................................................................................................................... 85 1.12.147 ..................................................................................................................................................... 85 1.12.148 ..................................................................................................................................................... 85 1.12.149 ..................................................................................................................................................... 85 1.12.150 ..................................................................................................................................................... 85 1.12.151 ..................................................................................................................................................... 85 1.12.152 ..................................................................................................................................................... 85 1.12.153 ..................................................................................................................................................... 85 1.12.154 ..................................................................................................................................................... 86 1.12.155 ..................................................................................................................................................... 86 1.12.156 ..................................................................................................................................................... 86 1.12.157 ..................................................................................................................................................... 86 1.12.158 ..................................................................................................................................................... 86 1.12.159 ..................................................................................................................................................... 86 1.12.160 ..................................................................................................................................................... 86 1.12.161 ..................................................................................................................................................... 86 1.12.162 ..................................................................................................................................................... 86 1.12.163 ..................................................................................................................................................... 86 1.12.164 ..................................................................................................................................................... 86 1.12.165 ..................................................................................................................................................... 86 1.12.166 ..................................................................................................................................................... 87 1.12.167 ..................................................................................................................................................... 87 1.12.168 ..................................................................................................................................................... 87 1.12.169 ..................................................................................................................................................... 87 1.12.170 ..................................................................................................................................................... 87 1.12.171 ..................................................................................................................................................... 87 1.12.172 ..................................................................................................................................................... 87 1.12.173 ..................................................................................................................................................... 87 1.12.174 ..................................................................................................................................................... 87 1.12.175 ..................................................................................................................................................... 87 1.12.176 ..................................................................................................................................................... 87 1.12.177 ..................................................................................................................................................... 88 1.12.178 ..................................................................................................................................................... 88 1.12.179 ..................................................................................................................................................... 88 1.12.180 ..................................................................................................................................................... 88 1.12.181 ..................................................................................................................................................... 88 1.12.182 ..................................................................................................................................................... 88 1.12.183 ..................................................................................................................................................... 88 1.12.184 ..................................................................................................................................................... 88 1.12.185 ..................................................................................................................................................... 88

x
LIST OF TABLES
1.1 Students attending school 05
1.2 Me household income 05
1.2 Respondents’ profile: education 11
1.3 Respondents’ profile: employment 11
1.4 Respondents’ profile: marital status 11
2.1 Sudan floods 2008 emergency plan 28
3.1 Gender distribution of people interviewed 35
3.2 Number of household working 37
3.3 Number of household members 38
3.4 Number of schoolchildren 38
4.1 Profile of incidence of flooding 41
4.2 Causes of floods 41
4.3 Prompts to stay in Ga-Moeka and ga-Motle 41
4.4 Impact of flooding 42
4.5 Assistance during floods 42
4.6 Places of assistance 43
4.7 Managing every day chores during flooding 43
4.8 Reasons for flooding 43
4.9 Period living in area 44
4.10 Pre-warned against area 44
4.11 Estimated time before moving 44
4.12 Mode of transport in area 45
4.13 Medical aid 46
4.14 Costs of water-borne diseases 46
4.15 Loss of belongings during floods 46
4.16 Costs per flooding event 47

xi
4.17 Insurance of belongings 47
4.18 Insurance premium 47
4.19 Types of building material for houses 48
4.20 Wishing to sell house 48
4.21 Financial assistance 48
4.22 Suicidal feelings after floods 49
4.23 Coping with feelings of suicide 50
4.24 Relationships with family members 51
4.25 Relationships with neighbours and friends 52
4.26 Recovery period after floods 52
4.27 Types of diseases 54

xii
LIST OF FIGURES
1.1 South African provinces 02
1.2 North West province with Moretele municipality 03
1.3 Ga-Motle and Ga-Moeka with Moretele municipality 04
1.4 Moretele local municipality with nearby roads, rivers and dams 07
3.1 Marital state of respondents 36
3.2 Educational information of respondents 36
3.3 Salary ranges per month 37
4.1 Emotional experiences during floods 49
4.2 Feelings about area 50
4.3 Duration of trauma 51
4.4 Coping strategies during floods 53
4.5 Contraction of diseases during floods 53
4.6 Loss of life in households 54

xiii
LIST OF ACRONYMS
AIDS Acquired immune deficiency syndrome
ALNAP Active Learning Network for Accountability and Performance
EEA European Economic Area
EU European Union
FEMA Federal Emergency Management Agency
FFDWRS Flood Forecasting, Warning and Response System
GIS Geographic Information Systems
HIV Human immunodeficiency virus
IOM International Organisation for Migration
OCHA Office for the Coordination of Humanitarian Affairs
PAFRICS Participatory Flood Risk Communication Support System
STATSSA Statistics South Africa
STI Sexually Transmitted Infection
UNICEF United Nations Children’s Fund
USAID United States Agency for International Development
WHO World Health Organization
ZVAC Zambia Vulnerability Assessment Committee

1
CHAPTER 1 INTRODUCTION
1.1 Introduction
Flooding world-wide is accompanied by losses and related human health impacts. This was
argued by Penning-Rowell, Tapsell and Wilson (2005:1). Being the most common type of
disaster worldwide, flooding is divided into three major types which are categorised as the
river floods, flash floods and coastal floods (Smith 1999:9).
Kent (2001: 137-138) suggests in his article that there has to be standards established
based on human rights when dealing with disaster protection and development. He further
alludes that governments ultimately have an obligation to provide protection and the human
right to disaster protection which means there are some services to which people are
entitled. He suggests appropriate institutional arrangements with disaster mitigation and
relief agencies in place before having agreements with domestic and international agencies.
The report by Pirbhat Women Development Society, Shahdadkot Sindh (s.a.: 2-5), confirms
that rains caused great disasters in Sindh and Balochitan provinces of Pakistan. The flood
water from major rivers damaged and destroyed a large number of human habitations,
agriculture and livestock. During the disaster, hundreds of people were left homeless and
were living along roads and banks of watercourses because houses, schools and mosques
had collapsed.
1.2 Background Information
Ga-Motla and Ga-Moeka are villages next to each other in the geographical area of
Moretele, North West, South Africa. Their geographical coordinates are 25 degrees 20’0”
South, 28 degrees 3’0” East for Ga-Moeka and its geographical coordinates are 25° 21' 0"
South, 28° 4' 0" East for Ga-Motla according to the maplandia website.com accessed on
8 April 2009.

2
Fig. 1.1: South African Provinces
According to the poster presentation of Rudolph, Dlamini and Hlungwani (s.a.:s.p.) Moeka
has 2 500 households, three schools including an adult education centre for 1 200 learners.
Unemployment is extremely high in this village with prevalence of childhood diarrhoea,
teenage pregnancy, STIs and HIV/AIDS. One public health clinic is six kilometres away
and the Jubilee hospital 20km away.
It was mentioned by the Moretele Local Municipality Disaster Manager (24 July 2009) that
Ga-Motla and Ga-Moeka were next to the Tswaing Crater Museum and the water from the
streams in Soshanguve, Mabopane and Winterveldt were flowing to the Soutpanspruit when
there were floods. She reported that according to the Technical Engineer of Tswaing
Hydrometer Logical Crater Museum, the water runs off at 58,78m3 per second and the size
of the catchment area is 7, 250ha.

3
The map in Figure 1.2 from Statistics South Africa depicts the Moretele Local Municipality in
the North West.
Fig. 1.2: North West Province with Moretele Local Municipality
According to a resident of one of the villages in the area, Moeka has accommodated people
from the surrounding areas of Hammanskraal-Moretele District as well as those coming from
far, for example Limpopo and Mpumalanga to find employment in the city. The people living
in Moeka are of different cultures. It is a place of the Tswana people from the former
Bophuthatswana homeland during the Dr Mangope regime. After the 1994 democracy, more
people of different cultures came to live in the village. Currently we find Zulu, Venda, Pedi,
Shangaan and Ndebele-speaking people in the village (Community member 24 July 2009).
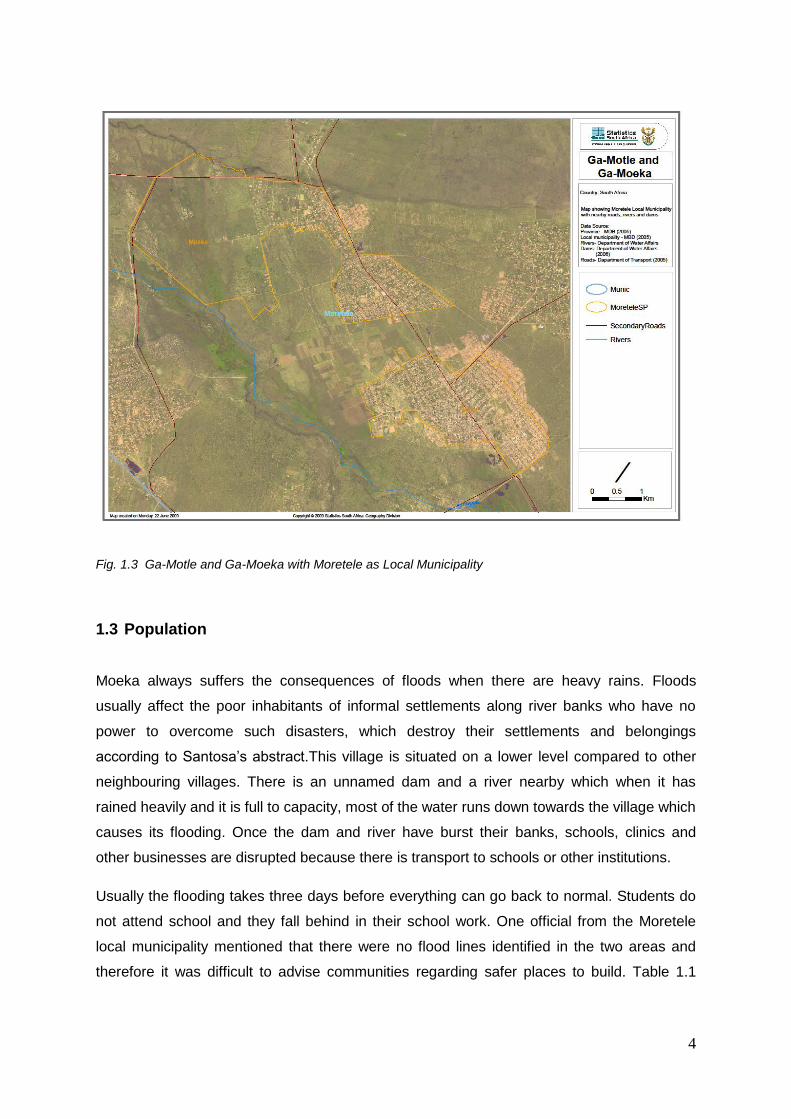
The map in Figure 1.3 shows the two villages with rivers and dams nearby which exacerbate
flooding during heavy rains when they filled to capacity.
4
Fig. 1.3 Ga-Motle and Ga-Moeka with Moretele as Local Municipality
1.3 Population
Moeka always suffers the consequences of floods when there are heavy rains. Floods
usually affect the poor inhabitants of informal settlements along river banks who have no
power to overcome such disasters, which destroy their settlements and belongings
according to Santosa’s abstract.This village is situated on a lower level compared to other
neighbouring villages. There is an unnamed dam and a river nearby which when it has
rained heavily and it is full to capacity, most of the water runs down towards the village which
causes its flooding. Once the dam and river have burst their banks, schools, clinics and
other businesses are disrupted because there is transport to schools or other institutions.
Usually the flooding takes three days before everything can go back to normal. Students do
not attend school and they fall behind in their school work. One official from the Moretele
local municipality mentioned that there were no flood lines identified in the two areas and
therefore it was difficult to advise communities regarding safer places to build. Table 1.1

5
shows the number of school going children and adults, who miss school because of flooding
in the area (Statistics South Africa 2001: s.p.).
TABLE 1.1: STUDENTS ATTENDING SCHOOL (INSTITUTION)
Moeka Motle
None 3861 7250
Pre-school 139 340
School 1927 3568
College 14 35
Technikon 15 30
University 16 32
Adult education centre 9 39
Other 3 3
People need to replace and restore whatever has been damaged by the floods, for example
houses have to be rebuilt, furniture has to be replaced and other new items have to be
bought. It is always difficult to do that because most families are not well off and cannot
afford to pay for all that. Those who can afford insurance are the ones who are able to
rebuild and buy new furniture. The Ga-Moeka and Ga-Motle communities are one of
communities with more people without an income. According to Statistics South Africa
(2001), households amounting to 1 489 in Moeka and 1 863 in Motle do not have income
every month according to Table 1.2 below. They are more than the households that have
income every month. From the data it can be deduced that Moeka and Motle are poverty-
stricken communities, who cannot afford to put back houses in their original form like before
they were damaged by floods.
TABLE 1.2: MOEKA HOUSEHOLD INCOME (STATSSA)
Moeka Motle
No income 1489 1853
R1 - R4 800 391 1030
R4 801 - R 9 600 1135 2232
R9 601 - R 19 200 1360 2573
R19 201 - R 38 400 1149 2467
R38 401 - R 76 800 304 885
R76 801 - R153 600 86 132
R153 601 - R307 200 16 62
R307 201 - R614 400 - 39
R614 401 - R1 228 800 - -
R1 228 801 - R2 457 600 56 24
R2 457 601 and more - -
Not applicable (institutions)
- -

6
1.4 Problem Statement
Ga-Moeka and Ga-Motle are village portions in the Moretele Local Municipality. The villages
face problems due to flooding after heavy rains. There is great concern that during flooding
there is significant increase in the vulnerability of the people living there due to the
uncontrollable water which may cause health hazards and deaths. There is also a concern
that the property gets damaged due to long lasting floods.
According to (Dutta & Tingsanchali 2003 cited by Sagala 2006: 2) around the world, most
countries do not have any methodology of estimation of loss due to a natural disaster. It is
argued by (Smith & Ward 1998 cited by Sagala 2006: 2) that information on loss estimation
that is caused by floods of different magnitudes and its loss return period are very crucial in
developing policies for rational flood alleviation of an area.
(Ward 1978: s.p.) points out that the encroachment of settlements on to floodplains
continues to grow, in ignorance of the flood hazard. The settlements continue sometimes
with full cognizance of the flood hazard in the belief or hope that society will come to aid
either in the form of improved flood protection or, after the event, government or
organizations will come with financial assistance. Ga-Motla and Ga-Moeka villages have
experienced the same move where people end up with negative social and economic
impacts caused by floods (Wards 1978: s.p.), continue to say floods become hazards when
they impinge unfavourably upon human activity and therefore flood hazard must be
considered not simply as a physical but also as a socio-economic and psychological
phenomenon.
This research aims to contribute to the analysis of the impact and losses due to floods
socially, psychologically and economically.
1.5 Research Objectives
The purpose of this study is to understand how severe the flooding impact is on the social,
psychological and economic levels of Ga-Motla and Ga-Moeka communities in the North
West Province, Moretele District. Figure 1.4 shows clearly how the two places of interest,
Ga-Motla and Ga-Moeka are close to each other. The specific objectives are:
To determine how the Ga–Moeka and Ga-Motle communities are affected socially by
floods.

7
To determine how the Ga–Moeka and Ga-Motle communities are affected
economically by floods.
To determine how the Ga–Moeka and Ga-Motle communities are affected
psychologically by floods.
To determine why Ga-Moeka and Ga-Motle are being flooded.
Fig. 1.4 Moretele Local Municipality with nearby roads, rivers and dams
1.6 Critical Research Questions
The social, psychological and economic impact of flooding in Ga-Moeka and Ga-Motle
communities in Moretele municipality require formulation of critical research questions,which
are essential for the development and guidance of the research proposal (VOCE 2004: 1).
Sub-objective one:
How are the Ga–Moeka and Ga-Motle communities socially affected by
floods?

8
Sub-objective two:
How are the Ga–Moeka and Ga-Motle communities economically affected by floods?
Sub-objective three:
How are the Ga–Moeka and Ga-Motle communities psychologically affected by
floods?
Sub-objective four:
Why are the villages of Ga-Moeka and Ga-Motle being flooded more than other
neighbouring areas?
1.7 Research Methodology
The purpose of research methodology is to depict how the Moeka and Ga-Motle
communities have been affected economically, socially and psychologically by the floods in
their area during heavy rains. The results obtained from the questionnaires ascertained the
extent of how they had been affected in the above areas. The outcomes suggest how the
local municipality will have to address the consequences of the impact which will help in
terms of planning and budgeting.
1.8 Research Design
According to Barbie and Mouton (2006: 72, 74), research design addresses the planning of
scientific enquiry, where one designs a strategy for finding out something. It is a blueprint or
plan of how one intends conducting a research. It is divided into two major aspects and they
are: to first specify clearly what it is that you want to find out and secondly to determine the
best way to do it. Terre Blanche & Durrheim define it as a “strategic framework for action that
serves as a bridge between research questions and the execution or implementation of the
research” (1999:29).
In this project, the first aspect of specifying clearly what it is that one wants to find out is to
find out the social, economic and psychological impact of floods on Ga-Moeka and Ga-Motle
communities in the Moretele Local Municipality of North West Province. The second aspect
is to determine the best way to do it.

9
The communities of Ga-Moeka and Ga-Motle were studied by collecting their data using a
structured questionnaire. It was drafted and distributed to a sample of members of the two
communities to complete. In using a questionnaire, the aim was to try and get valid, reliable
and unbiased information from the respondents. The types of information that are usually
gathered in a questionnaire are attributes, behaviour, events, beliefs and attitudes or
opinions. More than 80% of the questions were closed questions and 20% were open-ended
questions. Closed questions can be answered by one word or a phrase and they are easy
and quick to answer and give facts. It further enables the researcher to keep control of the
conversation whereas with open-ended questions the respondent is given the opportunity to
view his opinions and feelings, to think and reflect and lastly to control the conversation.
The questions were completed in the absence of the researcher. This technique is low cost
and the data can be collected simultaneously from a large number of respondents. Late
submittance can be experienced which is a disadvantage, but can be controlled by follow-
ups. The fact that respondents completed the questionnaires on their own, causes the
researcher to have no control over the order in which respondents answer their questions or
whether respondents consult each other or not during the completion period (Health
Technology Assessment 2001:37).
1.9 Methodology
The methodology section is divided into three major subsections, namely the research
instruments, data and analysis. Questions were used and they were completed by samples
from Ga-Moeka and Ga-Motle communities.
1.9.1 Research Instruments (description and justification)
In this research, a survey was used as a technique to collect data from Ga-Moeka and Ga-
Motle communities. In a survey, conclusions are drawn from one transitory collection of data.
Questions are posed to willing participants; their responses are summarized with
percentages, and in the end inferences drawn about a particular community (Dim 601 2007:
196). When planning a survey, it is important to consider the following aspects:
Response rate which is measured relatively to the size of the sampling
Cost of obtaining data
Timelines which include contact, response and follow up modes

10
Sources of error which may affect the results of the survey
Data quality which is the extent to which nonrespondents would have responded
differently than respondents (Background on the survey process: s.a.: 9 – 17).
The questionnaire was divided into four parts and was supposed to elicit personal
information, social, economic and psychological impact information of the respondents.
1.9.2 Data (population and sample: strength, weaknesses)
“Data are empirical representations of concepts, and measurement links data to concepts”
according to Neuman (2006:181). A quantitative research was used in this research.
Identifying the characteristics of an observed phenomenon or exploring possible correlations
among more than one phenomenon relates to the quantitative research. The situation is
examined as it is (Dim 601 2007: 191). In this quantitative research, data was produced in
the form of numbers. A structured questionnaire was distributed to the sample of the
community.
Under this section, information on age, gender, marital status, respondent’s addresses was
gathered. Other types of information collected were based on their income, schooling, daily
activities, households, residence, transport, sicknesses, relationships and causes of floods in
terms of how they relate to the flood impact. The aim was to gain more understanding of the
characteristics of the respondents.
1.9.3 Analysis (techniques and justification)
The sample consisted of 40% of scholar respondents and 60% of non-scholar respondents.
The aim of distributing percentages like this was because non-scholars were older than
sixteen years and might have experienced more of the flooding in this area than scholars.
Sampling is when units are selected randomly to represent the population. The sampling
depends on how homogenous or heterogeneous the population is – if the population is
heterogeneous, a larger sample is needed and if the sample is homogenous, a smaller
sample is needed (DIM 601 2007: 220 – 221).
Most of the questionnaires were distributed at schools, homes and other local places like
shops and clinics. The 40% of scholar respondents was needed in order to represent the
extent of a number of students losing classes during floods and the 60% of respondents who

11
were a combination of respondents who were working, not working and who were middle
aged and older.
This combination shows how working people are disturbed by the floods as they end up not
going to work and those who stay at home, but are unable to do their daily chores because
of the floods. The samples in Table 1.3, 1.4 and 1.5 were randomly selected where each
group is representative of the community. They represent the stratified random sampling
where all the groups are distinctively different – scholars, non-scholars, employed,
unemployed and married (DIM 601 2007: 215).
TABLE 1.3 RESPONDENTS’ PROFILE: EDUCATION
Respondents as per unique group Number Percentage
Scholars 6 12%
Non-Scholars 42 84%
Others 2 4%
TABLE 1.4 RESPONDENTS’ PROFILE: EMPLOYMENT
Respondents as per unique group Number Percentage
Employed 17 34%
Unemployed 33 66%
1.5 RESPONDENTS’ PROFILE: MARITAL STATUS
Respondents as per unique group Number Percentage
Married 10 20%
Single 36 72%
Other 4 8%
1.10 Limitations
Each and every research or study has limitations according to Thomas & Nelson (1996).
These are possible shortcomings that may influence the results of the research or they
cannot be controlled. A researcher can also impose delimitations in his research by choice in
order to effect a workable research problem.
In administering a questionnaire, total honesty by participants may not be gained.
Participants may not answer all questions or may give a socially correct answer. A solution
to this problem is to give an easy questionnaire and explain to respondents why the research

12
is important. Be courteous, thank them for their help and offer to share the report with them
(Goddard & Melville: 2001, 48).
This research will also not include the people of Ga-Ratsiepane. The water manages to
reach nearby areas, but not as badly as the Ga-Motla and Ga-Moeka areas. The two villages
are looked at because they are so close to each other that one may be unable to distinguish
where one village starts and the other one ends. The other limitation is that interviews and
questionnaires will be done with people aged 15 years and up to make more sense of the
research.
1.11 Ethical Consideration
In administering a questionnaire, ethical concerns were taken into consideration. A careful
approach of not harming people by disregarding their privacy, not respecting them as
individuals or subjecting them to unnecessary research was considered. Collected data from
community members was kept confidential by not identifying them when giving a report,
(Goddard & Melville 2001: 49).
1.12 Conclusion
This chapter created an understanding of how the research was structured. It also provided
information on the methods that were used in conducting the research, which consisted of
the research instruments, data and analysis. A brief explanation of ethical considerations
and limitations of the research was also given.

13
CHAPTER 2 LITERATURE REVIEW
2.1 Background
Literature review is a discussion of related literature about a topic of interest to assist in
discovering a fact, the truth or a point of light. It has the function of sharing what others have
done in similar areas. The literature review, to name but a few benefits provides new ideas
and approaches, reveals sources of data, gives confidence in the topic, help in interpreting
and making sense of findings (Research Methodology 2007: 70 ). Terre Blanche and
Durrheim (1999 :18-19) also state that literature review puts the research project into context
by showing how it fits into a particular field; also to assist researchers to focus on important
issues and variables that have a bearing on the research question.
2.2 Introduction
Floods are one of the most common hazards which cause death, injuries, property damage,
and contamination of drinking water and disruption of electrical services. The neighbourhood
and the regional communities are affected, sometimes for over a period of days (Emergency
Survival Programme 2008: 1). In Europe, Pistrika and Tsakiris (2007:2) allude that the scale
and frequency of floods are likely to increase in the future because of climate change,
inappropriate river management and infrastructure development in the areas where they are
always flooded. Climate change causes new developments on flood plains, which increase
pressures on the urban system. This leaves less potential water storage space when there is
an event of flooding (Gill 2004: 17).
2.3 Types of Floods
There are different types of floods which become disasters when they have destructive
effects on human settlements. The river floods or seasonal floods are caused by seasonal
precipitation over large catchment areas, melting of snow or a combination of these. Flash
floods or tropical storm floods are accompanied by heavy rainfalls which become too much

14
for the streams and rivers to handle, and they overflow and produce floods. Lastly, the
coastal floods where storms, winds and other events cause ocean water to overflow and
lead to onshore flooding (United Nations Educational, Scientific and Cultural Organization:
United Nations Environment Programme 2004: 2).
Smith (1999: 9) believes that floods are the most common type of disaster worldwide and he
also mentions the three major types being categorized as river floods, flash floods and
coastal floods. The majority of Australians are located along the coastal areas where
flooding is the most common disaster scenario. Ward (1978: 16 – 27) argues the types of
floods in this fashion:
i) Flash floods which are associated with violent, convectional storms which are of
the short duration, and is measured in minutes not hours. These types of floods
occur everywhere in the world.
ii) There are also single event floods which have a substantially longer duration than
flash floods and result from a variety of rainfall conditions in which widespread
rains of several hours or days can move over a drainage basin. Those are
commonly associated with cyclonic storms.
iii) Multiple event floods happen when successive flood peaks follow closely on each
other because of complex weather situations. Flooding of this type may last for a
period of several weeks or months and can be the disastrous one of all flood
occurrences.
iv) Seasonal floods – flooding can recur annually in a wet season on a massive
scale for several months and can bring either great benefit or catastrophe. The
Nile river flooding assures adequate crop yields, but in India flooding causes
great distress and loss of life.
2.4 Flooding
Wisner et al. (2007: 201) say that flooding has shown a remarkable impact internationally
and locally, the damage which has been costly to even developed countries like Australia
and Europe. The disasters caused by floods affect not only individuals but also
governments, planners and insurers. They cause more economic losses than any other
hazards. Floods are known risks and that is why there are always both self and social
protection measures. Dams are used as flood controls but because some are not built or

15
maintained as required, especially in terms of capacity, when a dam is overflowing water is
released to avoid dam damage or overspill and that turns into downstream flooding.
Flooding is taken as the second largest meteorological disaster in China, and has
detrimental effects on people’s lives. They further cause economic loss, the environment
becomes destroyed and the local society also experiences long-term effects (Maosong, et al.
2008: 78).
EurAqua (1996: 4) is the European Network of Fresh Water Research Organizations and
includes 15 publicly funded Research Organizations from 15 EU and EEA countries. The
countries have put papers in place on floods, drought and institutional aspects which were
presented during three different workshops. They all showed how floods were emphasized
by different participants, and also determined by their country’s individual geographic
characteristics. Belgium for instance raised different aspects of flood protection science and
policy like the ability to predict floods, their frequency and intensity, coordination of actions
before, during and after the flood event, the socio-economic impact of floods and flood
protection, technical possibilities of flood prevention and risk reduction and hydrological
effects of potential global warming.
In the study of the Water Research Commission on National Flood Nowcasting System,
(Author 2007: 4), the aims of the project which were built on previous research and
development were;
To put in place a national flood forecasting system.
To use the system routinely, to use the system to alert vulnerable people, industry
and disaster managers.
To have recent information from satellites, radars and gauge estimation of rainfall,
To provide flood nowcasts or forecasts to sensitive regions in as much detail as
required,
To interact and work with local Disaster Managers and local authorities
To convert flows to inundation levels and
To provide training initiatives for local disaster managers.
These will give warning of floods and the necessary steps can be taken to mitigate flood
disasters.

16
Miller (1997), People at Risk and Strategies for Prevention report that floods are the most
common natural disaster which causes large numbers of deaths. The study shows that
floods are caused by different issues and this study indicates how floods can be mitigated
and how citizens can be better informed. It will also help decision-makers to make mitigation
policies in designing and implementing flood protection and alleviation measures.
People keep on developing land that is on the floodplain because of the soil being fertile
there despite the risk of losing property and life. Flood plain management is instituted in this
kind of situations in order to control floods. This is done by water resources, living resources
and cultural resources, for instance keeping other plant and animal species which are of
economic value like reed beds which provide material for traditional types of housing. In
most cases dams fail to keep water and this overwhelms communities that are below the
valley, sometimes with little warning. This can be prevented by dam safety regulations
governing the design, construction and maintenance of dams. Existing dams should be
checked against modern safety criteria.
Smith and Viljoen (2001: 35) denote that the degree to which a specific reach in a river is
prone to flood damage will be determined among other things by the occupational pattern,
topographical, geological and hydrological characteristics of the reaches. This means for the
occupational pattern of flood plains, it is clear that the occurrence of floods could make
progressively higher demands on aspects such as planning and control of both the floods
and the utilization patterns in these flood plains. There are different factors which determine
the damage potential of floods:
The rainfall in the catchment area, which causes a specific land phase flood.
The volume of water per second that will reach the river.
The specific volume of water in a specific reach in a river, which determines the
nature, extent and quality of the flood in the reach.
The characteristics of a river.
A specific flood in a reach can result in flood damage depending on the position of human
activities in the flood plain, the type of human activities in the flood plain and the structural
and non-structural flood control. There is what we call primary flood damages and they are
categorized into direct and indirect losses. The direct losses include municipal property and
public lands, residential and other buildings in urban areas, moveable equipment in buildings
in urban areas, property of other public authorities, agricultural land, crops and harvest,

17
livestock and other animals, fixed improvements and other equipment on farms. The indirect
losses are in productive manpower, returns from resources like agricultural land and delays
in transportation and other services.
According to Smith and Boardman (1989 s.p.), flood events leave visual evidence to be used
in attempting to reconstruct flood history. Observation as a method can be used relating to
destruction of artefacts such as walls and bridges. These can provide evidence in the short
term, but probability of repair and problems of dating make them unsuitable over longer time
scales. Tree-growth rings may also be useful in the short to medium term for evidence, but
can be difficult to interpret where a change in land-use is a possibility. Lichens can be used
as evidence over periods of up to and in excess of 100 years.
Disasters may be political or economical events which influence the hierarchical organization
upsetting economics balances. They cause social disruption, disorganization and massive
migration as social events. They may produce trauma, fear, stress and shock as
psychological events according to Van den Bos and Bryant (1987: 11).
People are drowned and lots of deaths cases are reported as helpless human beings are
swallowed by choking waters. Livestock and crops upon which nations depend become
obliterated by floods. The level of damage by floods tends to increase with an increase of
flood depth and also flood duration (Elliot & Leggett 2002: 29).
Flooding causes peril, but also have benefits for people. People use flood plains for
agriculture which flourishes on rich alluvial soil that has been washed down by the flooding
rivers, of which, one third of the world’s population still depend for their food (Champ 1983:
19).
Man has always devised methods of fending off threatening waters by building dams that
would divert or regulate floods, diversion channels to share the burden of a flood with the
main river and levees or embankments to contain rising water. The people of Barotseland in
Zambia always move to higher ground and wait for the floods to subside. This is unthinkable
for urban dwellers that are always rescued by timely warnings accurately predicted.
Nowadays sophisticated technology of radar equipment, satellites, computers and automatic
stream-level and precipitation sensors are used by meteorologists and hydrologists. The
early warning systems produce important information which is useful for drawing
contingency plans and defining immediate actions to respond to floods (ALNAP 2008: 4).

18
Malele (2009: 29) argues that poor urban governance often make urban dwellers, their
properties and the environment more vulnerable to the impacts of a number of hazards like
flooding, diseases, fires and pollution.
2.5 Flood Risk
Flood risk is the likelihood of a flood event to cause damage to human health and life, the
environment and economic activity. In quantifying the flood risk, the results are either in
monetary units or loss of life units if the losses are measurable or are in qualitative terms in
the case of intangible damages which are social, environmental or cultural (Pistrika &
Tsakiris 2007 : 5).
2.6 Causes of Floods
There are two key elements that cause floods – rainfall intensity and duration. The rate of
rainfall explains the intensity, and the duration is how long the rain continues. Flash floods
take a few minutes or hours to develop after an intense rainfall or failure of a dam or levee,
or sudden release of water held by ice or debris jam. These floods can catch people
unprepared (Master’s in Disaster 2007: 1-2).
Flooding can be caused by eruptions of water that are let loose by the bursting of man-made
dams. Dams are subjected to pressure and the volume of water impounded behind them is
enormous. Because water itself is extremely heavy, a well-designed, properly located and
soundly constructed dam may only remain safe for hundreds of years and could not forever
withstand wear, exposure and hydrostatic pressures that build up within the reservoir. To
avoid disasters, dams must regularly be inspected and repaired. Floods can cause
calamities and be taken as agents of death and destruction, but they also bring measureless
bounties of blessings (Champ 1983: 20).
During a state of flooding, people in India and Pakistan sought refuge in tree tops and they
lost their lives as they were bitten by venomous snakes. Rats are also driven out by floods
and they spread diseases. Even the floodwaters themselves often cause diseases like
cholera and typhoid which can kill a huge number of people (Champ 1983: 19).
Flooding is caused climatologically which may be in the form of excessively prolonged
rainfall or melting ice. Some of the floods are not directly caused by climatology, for example

19
from excessive high tides associated with storm-surge effects caused by a combination of
very low barometer pressure and high wind speeds; others are caused by earthquakes,
landslides or failure of dams and other control works (Ward 1978: 6).
Barredo (2009: 101) in his article argues that there is evidence that societal change and
economic development are the principal factors responsible for the increasing losses from
natural disaster to date. He assessed normalized flood losses in Europe from 1970 to 2006.
In his discussion after using relevant data, he says there is no evidence of a clear positive
trend in normalized flood losses in Europe. Again based on a hypothetical scenario without
climate change, he says flood losses would continue to increase as a consequence of
societal and economic factors.
2.7 Elements at Risk during Floods
There are different elements that are involved and affected during a flood hazard. These
elements are divided into physical, economic, societal and environmental aspects. Under the
physical, infrastructure, critical facilities like schools and clinics, utilities like power supply
and water supply, transport, communication and government services are affected.
The economic element includes business and trade activities, access to work and impact on
the workforce that are affected. The societal elements which are affected are vulnerable age
categories, low income group and gender. The last element which is the environmental
aspect includes loss of biodiversity, damaged landscape, physical and chemical changes in
the surroundings (Westen 2005: 23.)
2.7.1 Schools at risk during floods
Schools are vulnerable to floods. Damage to schools because of floods may include site
damage, structural and non-structural building damage, destruction of service equipment,
loss of contents and health and safety threats due to contaminated flood water. Flooded
schools are usually closed while cleanup and repairs are undertaken. The severity of the
damage and lingering health hazards determine the length of closure. There are schools that
are already located in flood hazard areas and they may proactively undertake risk reduction
measures. Schools are regularly identified to serve as short-term or long-term shelters. This

20
is because they have kitchen and restroom facilities, gymnasiums, cafeterias and wide
corridors (FEMA 2004: 36, 46 & 59)
Schools do have plans in place to protect students and staff during a disaster. They also
practise common emergency actions like evacuation, lockdowns and shelter-in-place during
an emergency (Yale Centre for Public Health Preparedness 2008: 1-2). Sydney High School
students have installed, monitored and collected data from a network of rain and river
gauges, and linked it to a computer system in their school. This provides the Sydney
community with advanced warning time in the event of future flooding (Sydney High School
2008: 1).
2.7.2 Children at risk during floods
Records by Tinh (Flood Kindergarten: Community Need to Community Solution) for Viet
Nam showed that children comprised a majority of casualties during their previous floods.
Children are separated from their parents, get lost in crowds or are swept away in the floods
during crisis moments. During the 2002 disaster, no child died, but those who died were in
their homes or on their way to school. The Vietnamese government has considered flood
safety training and swimming lessons for children, also adding that to their curriculum.
The literature review of the Emergency Sector in Vietnam (2003: 5-6) argues that children
continue to drown every year in the Mekong Delta despite the efforts of giving swimming
lessons, distribution of life jackets and raising of awareness.
It was found by Brett (2001:1) that children find natural disasters terrifying because their
entire world is disrupted and they are likely to feel fearful or angry. Some become clingy and
dependent, refuse to go to school or childcare. It was also found that they might regress and
become babyish with signs of withdrawal into inappropriate quietness or depression, others
become disobedient.
According to Shile, s.a. children’s future and psyche in North Karnataka was interrupted by
floods in the year 2009 -10. The highest number of students dropped out of school and
others who were in the flood affected areas did not enrol. Children undergo trauma during
floods and the memories of that event haunt them. Some of them are relocated and they feel
alienated and did not get nutritious food because of displacement from their villages. This
leads to serious implications for their growth.
During the Kosi Floods, Bihar in India in 2008 there was measles vaccination in relief camps.
There was also a provision of supplementary measles dose to all eligible children of six

21
months to 14 years in areas of congregation like camps, embankments and roadsides. Extra
effort was put in to ensure that all beneficiaries in the 9 - 59 months age range received
measles vaccine and were given vitamin A supplementation. This prevented high mortality.
Children with diarrhoea were treated with low osmolar ORS sachets and a 10-day course of
zinc (Varkey et al. 2009).
Children are highly vulnerable to climate change and disaster impacts. They are impacted
both in the immediate and longer term as documented by a number of recent reports. Those
of them who live in marginal environments and situations of poverty are more vulnerable. It
was evident following the 2004 Indian Ocean Tsunami that the high mortality and morbidity
rates were women and children under the age of fifteen. It is projected that climate change
will increase the numbers of children affected by disasters, from an estimated 66.5 million
per year in the late 1990s, to about 175 million per year in the coming ten years (Back,
Cameron & Tanner 2009: 8).
It was reported in a Humanitarian Aid Decision (2006: 2) that in El Salvador, children under
11 years who were affected by Hurricane Stan work as street vendors, and this places great
burden on their ability to attend school. Children over 12 years of age are often poorly
educated.
2.7.3 Gender at risk during floods
According to Walker (1994: 4 – 5) women are affected by disasters, not just in their
reproductive roles, but also in their roles as producers in their economy and providers of
their families. They always lose earning capacity during a disaster and they worry about
unemployment and lack of income. They have particular difficulties in managing their
households without male support. Their supportive social networks are likely to be impaired
in times of disaster and social dislocation.
Women are always afraid during a disaster. They have a feeling of insecurity and uncertainty
and cannot concentrate on any work. Women also experience health problems because of
tensions and psychological problems, which result in menstrual periods problems. Because
camps do not have bathrooms and latrines, they always feel uncomfortable when they
cannot bathe for days and if they do, they do it in a limited space in front or behind their
shelter before day-break. They suffer most because of scarcity of water and children do not
bathe because of lack of water.
Women are always uncertain about the future of their children during a condition of a
disaster and they worry about children’s schooling. They become afraid that their children
22
will turn into beggars if they do not go to school. Most of the women in shelters are
unemployed and their shelters are always provided without doors, which renders them
unable to leave their houses to seek employment (Walker 1994: 37 – 38).
Enarson and Scanlon (1999) conducted a study in Canada’s Red River Valley focusing on
gender patterns in flood evacuation. They found that the early gender-focused studies in
cases of women caring for children, parents’ spouses and kin is a highly significant aspect of
disaster impact and that gender differences appear throughout the disaster cycle. Men came
out to be one-dimensional “rescuers” and women appeared needy and rescued by men,
expressed normative emotions and worked in stereotypical roles.
They concluded that women and the evacuation men experienced before, during and after
were more the same than different and those were shaped by local flood subculture and by
the ties of social class, life stage, ethnicity and family history. Fordham and Ketteridge
(1996) say men dominate emergency management; they are responsible for the provision of
basic necessities such as food and water at the designated centres whereas women take
senior management positions in the care-providing areas such as social work, counselling
and home help.
The Huaiau Commission did research on women’s views from the frontline and found that
women reported that they were excluded from emergency preparedness and response
programmes.
2.7.4 Infrastructure at risk during floods
River systems happen to alter their course as a response to floods which lead to disruption
in transport, agriculture and urban land-use (Bryantm 1991: 138).During flooding, the floods
are accompanied by fire because power lines become broken and main switches are
ruptured. Other systems like communication and transport are disrupted, bridges become
washed down, rail tracks and highways also become affected by being torn apart (Champ
1983: 19).
In the North Western, Northern and Central Provinces of Zambia in Lusaka, some bridges,
particularly those that were constructed by communities were easily damaged by floods due
to poor workmanship; even schools that were built by communities collapsed because they
were built out of pole and mud (The Zambia Vulnerability Assessment Committee (ZVAC)
2007: 14).

23
According to Kunreuther and Linnerooth-Bayer (1999: 10), if there is a delay in infrastructure
repair because of unavailability of recovery funds, the length of time of household disruption
and business interruptions will increase. In terms of the damage to health infrastructure,
some facilities become inaccessible for several days because of damage to buildings and
equipment. Non-structural systems like electrical, mechanical and medical components may
render the services inoperable (Few, Matthies & Kovats 2004: 75).
2.8 Shelters Accommodating Victims of Floods
Security issues in camps are a problem during floods. Women and children are harassed by
unknown people in camps as a result of migration of a large number of communities from
flooded villages to camps in the cities. Families stay together under one shelter and women
urge for security especially at night and noontime (Pirbhat Women Development Society
s.a.)
Mali experienced heavy rainfalls which caused flooding where displaced families sought
shelter in schools for several weeks and this caused Malian Government officials to
postpone the start of the school year countrywide. Mali signed the grant agreement with the
United States Government through the United States Agency for International development
(USAID) for assistance to flood victims by rehabilitating schools, decontaminating school
toilets and distributing food to affected families (USAID 2007: 1).
People in the rural areas of Lusaka were integrated within communities when it flooded,
again in tents, churches, rural health and community centres. In the Central Copper belt
Province, the urban people found shelter at unused structures like bars and taverns (ZVAC
2007: 13)
2.9 Effects of Flooding
There are effects of flooding which can be divided into primary, secondary and tertiary of
long-term effects. The primary effects can be in the form of physical damage to any type of
structure like buildings, bridges, roads, cars and sewer systems. The other form is of
casualties where people and livestock die because of drowning. Secondary effects are water
supplies which can be contaminated, water-borne diseases, crops and food supplies
shortage and other species of trees which are non-tolerant can die from suffocation. Tertiary
24
or long-term effects are of an economic nature – there is a decline in tourism, rebuilding
costs, food shortage which normally leads to price increases, etc.
World Health Organization (WHO) (2002: 2-3) supports the effects of floods by saying there
are direct and indirect health effects caused by floods. Direct effects are mortality from
drowning, heart attacks and injuries and indirect health effects include infectious diseases,
poisoning and post traumatic stress disorders.
In Ward’s (1978: 2) preface he says floods are regarded as the most dramatic interaction
between man and his environment; it articulates the sheer force of natural events and man
being unable or having inadequate efforts to control them. He goes on to argue that the flood
disasters are man-made because man has put himself at risk by settling and developing in
flood plains. He says agriculture, industry, roads, bridges and railway lines are put in
floodable positions.
Branswell et al. (1996: 1-3) argue that in Canada, Quebec, the torrential rain left chaos in its
wake and the only thing that was left was to rebuild shattered lives. The results of the rainfall
were catastrophic with many rivers overflowing and the floodwaters ripping through roads,
damaging bridges, destroying hundreds of homes and sweeping some away. It was also
argued that the disaster forced cancellation of festivals and celebrations which affected
tourists, with their hotels and other accommodations lacking power, roads, tracks and
bridges washed out.
Another argument of torrential rains was stated by (Stojaspal et al. 2002: 2) that the same
downpours sent floodwaters raging from the Baltic to the Black Sea, killing at least 100
people and damaging building, infrastructure and crops.
It was mentioned by Charles (2004: 50) that the people of Lozi (Barotse) of the upper
Zambezi wetlands in Western Zambia shifted from the flooded plains around March and April
of every year to upland homes for them to escape the hazardous floods which threaten their
lives and property.
In Buffalo Creek in 1972, one hundred and twenty five people died in the floods and
thousands lost their homes; the community was crowded into trailer homes. That resulted in
a collective trauma which lasted longer than the individual trauma. After a year and a half of
the event, 570 survivors still suffered emotional disturbance (Gruntfest 1995).
It was reported by OCHA (2010: 1) that in one of the Ugandan districts, floods submerged
crop fields and vital infrastructure like roads, schools and houses. That affected about 33
305 people largely through the loss of crops. Southern (1979: 175) argues that the impact of

25
floods is dependent on the mode of life and economies of the affected communities, the
frequency and magnitude of the rainfall, and the willingness, capacity an understanding of
the dangers involved by communities at risk.
2.10 Coping Mechanisms for Floods
Communities have concepts of coping mechanisms and they are:
Communities do not do anything about floods but learn how to live with them.
The usage of non-structural measures like flood insurance
The usage of intensive and extensive structural technologies, for example floods
levees, terracing of land and soil conservation.
Joint usage of non-structural measures and structural technologies which are
believed to be the best alternative (Dewi 2007: 15).
In the case study of floods in the Bagmati and Rohini basins in Nepal, families tend to use
coping mechanisms and strategies for floods as follows: saving themselves and valuables,
saving food and supplies, saving animals and their fodder and in cases where there is
severe flooding, families release their livestock and move to safer places (Case Studies:
Adaptive Capacity and Livelihood Resilience s.l.: 127).
ALNAP (2008: 3) argues that coping with recurrent flooding, reciprocal support among
neighbours, immediate family members and wider kinship networks is a vital safety.
2.11 Flood Forecasting and Warning
There are benefits to flood forecasting and warning. The flood forecasting provides a basis
for warning and for people to make informed decisions to reduce losses by floods. The
warnings should be communicated to those at risk. The recipients of warnings must be
capable of acting and responding effectively to reduce potential losses of people and
property within the available time window. Reduction of the adverse impact of flooding
depends on the three elements, which are the nature of the flood event, the development of

26
effective flood forecasting, warning and response system (FFWRS) and the characteristics
of the flood as indicated by Parker, Tunstall and Wilson (2005: 1).
Silverstein (1992: 171) advises that in trying to prevent and reduce damage of disaster,
science and technology have produced electronic disaster intelligence-gathering systems
like satellite sensors, atmospheric weather sensors, earthbound detectors and oceanic
monitors, search and rescue and rubble examination and emergency medical and
environmental remedies and all these are done or applied to save lives and property.
In a study done by Krasovskaia et al. (2007: 387) focusing on perception of flood hazards in
countries of the North Sea region of Europe, they said extreme floods were rare events, and
they still came as a surprise to inhabitants of the floodplain. These people are often lulled
into a false sense of security by the technical protective measures undertaken. When
assessing the flood risk, it includes the perception of risk by the general public and
decisions-makers, on top of the meteorological events, hydrological regimes, flood hazard
mapping and technical means.
In trying to get the perception of flood hazard, laymen were asked questions directly instead
of studying their behaviour in a flood situation. It was found that there were more similarities
than differences between countries in the way people perceived flood hazards. Some of the
findings are that there was limited interest in flood hazard, poor involvement in flood issues
and sentimental rather than logical reasoning for living in areas at risk of flooding among
other things. He concluded that public perception and common sense cannot replace
science and policy but they can certainly provide the impetus for the decision-making
process.
2.12 The Use of Geographical Information Systems (GIS) and Remote Sensing for Flood Disaster Management
Geographic Information Systems (GIS) is software which assists with the procedure to
collect and analyze spatial data for hazard and risk assessment for various natural and man-
induced hazards (6th Regional Training Course: 2010:1). There is an approach for flow
routing of floods in a GIS based model. This approach determines the rainfall runoff
response and flood routing through catchment. The flow velocity depends on the location
and on the local slope, roughness and hydraulic radius (Li, et al. 2003: 91).
A remote sensing and a GIS-based flood vulnerability assessment of human settlements
were used in a case study of Gangetic West Bengal in India. India has a problem of river

27
flooding. From September to October 2000, 22.1 million people were inundated by floods
and the administration of the country was caught unprepared for the condition. Remote
sensing and GIS assisted in the creation of national level flood hazard maps. Data on
population density and other socio-economic factors had been integrated with hydrological
information in order to identify and prioritize zones for implementing measures for anti-flood.
The satellite imageries created by remote sensing and GIS enables one to obtain detailed
classification results which help in formulating planning measures. This also enhances the
capability of the spatial database to estimate vulnerability of settlements to an extreme flood
event (Sanyal & Lu 2005: 3699 – 3700).
Emphasis on non-structural measures of flood management and control are greater than
structural measures. The non-structural measures are flood forecasting, flood-inundation
mapping and flood plain zoning. Remote sensing is an indispensable tool in the study of
floods because it has the capacity to provide near real-time data, enables preparation of
maps of inundated areas and capacity to assess damages (Kale s.a.: 42).
2.13 Communication during Floods
In Bangladesh, a public awareness programme was launched to communicate benefits of
flood preparedness so that the communities could become safer. The awareness project
was to change the existing perception and attitude to motivate behavioural change. An
example is taken of one of Bangladesh municipalities where people use the cheapest
common transport which is called rickshaw jams. Placards are placed in these jams which
carry messages to promote benefits of house raising, tree planting or food storage as flood
preparedness actions. Commuters have one in 200 chances of being exposed to these
placards. Other methods used are billboards, posters, movie houses, municipal official
letterheads, drama and folklore songs (Asian Disaster Preparedness Centre 2004: 1, 2, 4).
Sudan floods (2008: 1) developed an emergency communication plan. In the plan, all the
emergency stages, communication objectives, infrastructure, audience and communication
products were tabled. An example of the emergency communication plan is provided in
Table 2.1.

28
TABLE2.1 SUDAN FLOODS 2008 EMERGENCY COMMUNICATION PLAN
Emergency Stages
Communication Objectives
Infrastructure Audience Communication
Products
Pre-emergency
To encourage community and
individual preparedness
Flood Task force Public Email messages
Risk communication is necessary between residents, local communities and government
agencies. Risk communication is used to prevent flood disasters. A new system called
Participatory Flood Risk Communication Support System (Pafrics) was developed by the
Research on Social Systems Resilient to a natural Disaster Project Team. The system uses
three support functions, namely learning support for flood risk literacy, making a choice of
flood disaster mitigation measures and the holding of workshops (Takouchi & Suzuki 2006:
213).
2.14 Flood Mitigation
Flood mitigation measures have to be considered at the early strategic stages in order to
reduce and manage the flood risks, especially those associated with development. The
drainage system should also be part of the strategic approach to flood management (Entec
2006: 29).
Marikina City in the Philippines has succeeded with their flood mitigation programme which
has dramatically decreased the exposure of floods to residences, businesses and critical
facilities. This was achieved by the city’s priority projects to concrete roads, construction and
rehabilitation, massive dredging operations, demolition of obstruction caused by illegal
settlers and the continued improvement to existing diversion channels and interceptors
(Metropolitan Manila s.a.: 2, 3).
Tumbare (2000: 6) also agrees to flood mitigation which includes emergency preparedness
plans, river catchment management and the comprehensive international agreements to
reduce atmospheric pollution.

29
2.15 Capacity Building in Disaster Management
Capacity building could help to close the gap in disaster management by sharing and
transferring of knowledge, recognition of the role of each stakeholder, increase in awareness
among agencies and public, bringing of specific solutions for the country, development of
coordination among main stakeholders and reduction of duplication of activities
(Samarakoon s.a. 9).
WHO (2008: 1) emphasized the importance of undertaking training and capacity building
initiatives for emergencies in Bangladesh. The Department for Environment Food and Rural
Affairs (2010: 3) agrees in its draft strategy for skills and capacity building in local authorities
for local flood risk management that local authorities are the best placed bodies to take
responsibility by improving knowledge and skills of existing staff members.
According to Gwimbi (2009: 71), capacity building in rural communities against negative
flood impact has to be done through livelihood resilience building and resilience strategies.
2.16 Integrated Flood Management
Integrated flood management embraces principles embedded in integrated water resource
management and those of risk management. This integration embraces land and water
resources development in a river basin, use of floodplains and the reduction of loss of life
due to flooding. There is a combination of policy, regulatory, financial and physical measures
in trying to cope with floods, and at the same time recognize that floods cannot be fully
controlled (Water Meteorological Organization & Global Water Partnership 2008: 29).
According to Green (2002: 3), integrated flood management involves integration across the
catchment between land and water management, and between different uses and functions
of water management. The effectiveness of integrated flood management needs increased
cooperation and collaboration across sectors and public participation. From the start, there
should be greater mobilization and rallying for greater stakeholder participation. Greater
stakeholder participation in flood policy development is vital because it enables inhabitants
of flood-prone regions to choose their risk level of readiness. Participation at local and
national levels of government agencies, technical specialists and local residents is critical in
carrying out risk assessment of the area (Water Meteorological Organization & Global Water
Partnership 2006: 31).

30
2.17 The Social, Psychological and Economic Impacts of Floods
2.17.1 The social impact
The social impact has the consequences of altering the way in which people live, work, play,
relate to one another, organizing to meet their needs and generally cope as members of a
society according to Provention Consortium Secretariat (2007: 1). Floods cause social
disruption which can seriously undermine the quality of life of individuals and affected
communities (Werrity et al. 2007: 16).
The social aspects of vulnerability to floods can be used as tools to develop policies that can
minimize risk and maximize the ability of communities to anticipate and adapt to the flood
hazard. Investigations into the past floods impact will characterize the social aspects of
vulnerability of individuals and communities. It is difficult to generalize the relationship
between the scale of the event and the actual or the potential hardships suffered because
the same event may have different effects on the adjacent households. If communities have
to adapt to the flood hazard, there is a long-term increase in coping capacity which can arise
from combined changes in individual behaviour, resources, infrastructure and functions of
individuals and their communities (Werritty 2007: 8 – 9).
There are health effects in terms of the consequences of flooding and they are categorized
into those happening during or immediately after the flooding, those that develop in the days
or early weeks after the flood and the longer effects which appear after or would last for
months or years (WHO 2002: 2).
IOM (2008:1) reported that heavy rains had once affected Zimbabwe, Zambia and
Mozambique and that there was an increase in reported diseases ranging from malaria,
diarrhea and skin diseases due to bad sanitation and stagnant water. People had been
unable to seek medical assistance due to bridges having been washed away and clinics
being far. Access to many communities was not there. People lost their belongings.
Survival of a hazard depends on an individual, family or community in that they have a
choice to heed the warning of a hazard, if not, they bear the brunt of losing property, suffer
injury, loss of friends or relatives or death. Before the event, there are warnings for
evacuation. Because people have a sense of home in a particular area, that over-rides the
common sense about the threat of a disaster, they continue living in that very dangerous
31
area. This is because home is familiar with people that one knows even at a personal level.
Also that it is difficult to give up the historic identity with the area, maintaining links with the
past or with ancestors and to sustain one’s roots. No threat will make them leave the place,
and they always rationalize the threat to minimize the occurrence. It is also true that if the
place is attractive in its own way, it is likely to grow in population despite any calamity
(Bryant 1991: 259-260).
Foster (1980: 247) is of the view that communities exhibit a high degree of solidarity during
the emergency phase of a disaster because there is an intense desire to help each other
without expecting reward or compensation. He says that this community spirit is as a result
of sharing common problems and participation in collective attempts to tackle them; and
further says conscious efforts should be made to enhance and nurture the community
morale.
The poor living conditions of very large numbers of people add to the dimensions of a
disaster. A disaster often causes greater degrees of social exclusions. Poverty causes
disasters and disasters worsen poverty which then gives rise to feelings of vulnerability and
fatalism (Beristain 2006: 9 – 11). The people who live in flood plain areas are often poor
people because they cannot buy legal land and they end up occupying vacant land along the
riverside. It is also found out that many planned settlements are also built on landfills in the
lowland areas (Sagala 2006: 2).
2.17.2 Psychological impact
One of the effects of a disaster is that tens of thousands lose their lives, and those that
survive suffer pain and disability according to Ehrenreich (2001:5). The obvious short-term
effect is emotional, and grief may also be long term. There can be longer-term responses
that are interpersonal, societal and economic in nature. The psychological effects of a
disaster are created by direct social and economic effects.
In the wake of a disaster, people grieve for their loved ones, treasured personal
memorabilia, lost documents and lost familiar neighbourhoods. Following a disaster, a wide
variety of emotional disturbances occur with chronic grief, depression, anxiety or guilt. After it
has happened, some people have difficulty in controlling anger, suspiciousness, irritability
and hostility and others get withdrawn or avoid people. Disturbed sleeps by nightmares and
flashbacks of disasters may occur in other people. Some of these feelings lead people to
drug abuse or alcohol.
32
There is what is called secondary traumatisation. This is when “secondary victims”, who are
families of those affected, onlookers and observers, relief workers, medical and mental
workers, all experience serious emotional effects. Other people that can be traumatised are
journalists, human rights workers and relief workers that do need assessment. For people to
have emotional trauma after a disaster has struck, might be called a “second disaster” which
is the effect of the response to a disaster.
There are victims that are forced to take refuge in a shelter after a disaster has happened.
They are confronted by personal and material losses, loss of privacy, community,
independence, familiarity of the environment and certainty with respect to the future. Very
often or always family roles and ordinary work roles are disrupted. In addition to the above,
poor sanitation, inadequate shelter, contaminated water and food may produce epidemics
which spread illnesses that result in death. In most cases women are raped and assaulted.
All these bring distress to the victims of a disaster. Victims may show psychological effects in
the hours immediately following a disaster, over weeks or even a year or two after the event.
Other people show unexpected reappearance of symptoms during anniversaries of a
disaster. Reactions of a disaster have to be resolved so that they are not the source of
distress and dysfunction for individuals, families and society (Ehrenreich 2001:1-13).
Bland et al. (1996: 18,23) report that disaster have been found to be associated with
increased prevalence of severe psychiatric symptomatology, post traumatic stress disorder,
anxiety, depression, somatic complains and nightmares and sometimes a delayed onset of
some of the symptoms are experienced. Some disaster associated distresses are not simply
a function of exposure to a disaster, but rather are dependent on consequences such as
resulting in evacuation or financial loss. People deal with death and grief; they overcome the
problem of fatalities following a disaster by having a funeral service of those who died, which
is the worst outcome of a disaster. Destruction of property leaves longer scars.
Usually after the scene of a disaster and evacuation, people want to go back to resettle in
the same place they were living before the disaster. This happens because of a number of
reasons; some of them are that people do not have an alternative place to live or an
alternative job to undertake, to protect their property which show that humans are territorial
and it is not easy for them to surrender their property.
A psychological benefit is that going back to resettle at the same place and rebuild as fast as
possible, makes people forget the actual event, because they are kept busy by something
they are familiar with, and because their minds are kept off the disaster; they build up self-
esteem and overcome feeling of hopelessness. Rebuilding is also a sign of loyalty to friends
or relatives who have been called by a disaster and show respect of ancestral links, not to

33
mention religious beliefs. Some people believe that modern-day technology can prevent
destruction in future disasters, for instance building on rubber bungs to prevent destruction
by earthquakes (Bryant 1991: 264 – 267).
Bush (1979: 31 – 36) states that a disaster is an intrusion into the total life of an individual –
emotionally, physically and spiritually. Individuals undergo sub-stages which are a period of
denial, when he does not admit the threat and a period when he acknowledges the threat.
People tend to believe in personal immunity where they say a disaster cannot happen where
they live and when it does happen, it cannot happen to them. The consequences of denial
lead people to placing themselves and their property in grave danger by refusing to heed the
warnings, the consequence of anticipation, of admitting that the treat leads to advanced
precautionary measures and people become intensely alert to indications of the threat.
It was found out by Penning-Rowell et al. (2005:1) that adults who experienced floods had a
four-fold higher risk of psychological distress compared with the non-flooded. During the
flood situation in Vietnam, affected people were struggling to cope amid the loss of family
members, destruction of homes, property, crops, livestock and lack of clean water
(Emergency Appeal 2008:1).
2.17.3 Economic aspects
Wards (1978:173-175) alludes that floods cause considerable damage, but can have
beneficial effects like deposition of an agricultural land and the recharge of soil moisture. He
further says there are tangible and intangible damages. Quantification of intangible usually
poses major problems; these include fear, anxiety, annoyance, distress, insecurity, ill health
and ultimately loss of life. The loss of human life and homes during floods is tragic and has
sudden impact according to Schneidergruber et al. (2004).
The tangible damages can be divided into a further subdivision of direct and indirect
categories. When referring to direct damages, he says they result from direct physical
contact of damageable property with flood water which is assumed to be the cost of
restoration of that property to its pre-flood condition. Examples of direct damages include
physical damage to buildings and their contents, bridges, roads, railways, agricultural land
and loss of agricultural crops.
Damage to public infrastructure such as roads, electricity, energy supply system, buildings,
industrial facilities and private property are the most immediate evident effects of flooding as
stated again by Schneidergruber et al. (2004). In explaining the indirect damages, they are
losses resulting from the breakdown of certain physical or economic linkages and its

34
examples are loss of production, loss of income and business and delays in transportation of
goods.
In his article, Vlachos (1995: 1-2) says floods is a “sociological” phenomenon which extends
beyond hydrological conditions and which encompasses consequences regarding the well-
being of human communities. The social environment is always changing because of the
urbanization, sprawl, increasing densities or industrialization and these in turn may affect
vulnerability to floods of the population. The geographical distribution of river valleys and low
lying coasts attract humans for their settlement. Urbanization and deforestation increase the
magnitude, the frequency and the intensity of floods.
As Bryant (1991: 260) mentions, a decision to evacuate to a safer place represents an
economic decision because it costs money. It is a loss of income also for people who do
business in the area. Direct financial loss by most community members initiate monetary
problems that are related to inflation in the prices of available housing and business
premises, increases in land values and the cost of rebuilding. There is always pressure for
compensation or special fiscal assistance to cover private property losses (Foster 1980:
248).
According to Grossi and Kunreuther (2005: 38 -39) there are certain challenges for
insurance in terms of natural disasters as they involve potentially high losses that are
extremely uncertain. These can cause huge economic damages and loss of many lives. One
factor that influences that is that natural disasters involve spatially correlated losses from a
single event.
Banerjee (2007) mentions that agricultural wages decline sharply in districts that experience
severe flooding in Bangladesh. They experience long periods of continuous inundating and
deep flooding which pose a severe threat to the economy of Bangladesh. The agricultural
workers are affected by abnormal floods regarding their wages and these workers constitute
almost 40% of the total rural population. These workers are poor and landless and they have
their wages as their principal sources of livelihood. What happens is that in the early
monsoon months, the severe and prolonged flooding will destroy crops and disrupt normal
production activities in the submerged fields. When this is happening, the demand for
agricultural workers for land preparation crop plantation, harvesting and post-harvesting
processing decline, which adversely affect the yield. Usually the decline in demand for
agricultural labour in flood months continues even in post flood periods in the regions that
experience the most severe inundation.

35
CHAPTER 3 A SOCIO-ECONOMIC PROFILE OF RESPONDENTS
3.1 Introduction
This chapter provides a descriptive profile of respondents in terms of socio-economic
characteristics such as gender, marital status, education, employment and their salary
ranges. It covers fifty respondents used in this survey who were from Ga-Moeka and Ga-
Motle villages in the Moretele Municipality. One hundred and fifty questionnaires were given
out, but only fifty of them were returned. One of the reasons for the low response could be
that uneducated people fear to commit themselves on paper as they were asking numerous
questions about the questionnaire. They seemed not to be free to participate.
3.2 Background of Respondents
The majority of respondents, 60% were female and the males were 40%. The high
percentage of female respondents could be attributed to a number of factors and one of
them was that men were generally involved in migratory labour practices whereas women
normally remained at home.
TABLE 3.1: GENDER DISTRIBUTION OF PEOPLE INTERVIEWED
Gender distribution Percentage Frequency
Male 40 20
Female 60 30
In terms of the marital status of respondents, in Figure 3.1, it was found that 72% of people
interviewed were single, 20% married, four percent separated, two percent divorced and two
percent widowed. This finding showed that the two villages were full of single people who
were vulnerable when flooding occurred because they did not have a partner to look up to
for help.

36
Fig. 3.1Marital Status of respondents
When one looks at the educational information of respondents, most of them were non
scholars. The reason could be that higher percentages who were interviewed were adults.
Out of all respondents, only 12% were scholars, 84% were non scholars and four percent did
not indicate their educational status. This question was only seeking to identify problems of
scholars and non scholars during flooding. Scholars in most cases were unable to go to
school because of floods. The graph in Figure 3.2 indicates their educational range.
Fig. 3.2 Educational Information of respondents
3.2.1 Employment
Most of the families had only one person working. In Table 3.2 the findings show that 48%
was the highest from respondents compared with only two percent of people not working in a
household. If only one member was working, it does not necessarily mean he/she was
earning a better salary, but it could be the one who earned between R500 and R2 000. If
Marital Status
0
10
20
30
40
50
60
70
80
1
Perc
en
tag
es
Single
Married
Separated
Divorced
Widowed
Educational Information
0
10
20
30
40
50
60
70
80
90
Scholar Non-Scholar No Response

37
there were diseases contracted at times of floods, most of them were unable to afford to
seek medical help. Deaths could occur because of that situation. It again showed that people
living in the area were dependent on government support.
TABLE 3.2: NUMBER OF PEOPLE WORKING IN A HOUSEHOLD
Number of household members working
Percentage Frequency
One 48 24
Two 24 12
Three 4 2
Four 2 1
None 22 11
The depiction of the graph in Figure 3.3 shows that many people, at 60%, did not show their
salary ranges because there was a high percentage of unemployed people in the area.
Fig. 3.3 Salary Ranges per Month
Figure 3.3 regarding the salary ranges depicts the socio-economic problems that the
community had in the area. The problem of affordability of activities related to losses
because of floods would be experienced by many people.
A high percentage of 56% of households consisted of three to five members. That was a
depiction of average families residing in the area, and they could manage if those families
Salary ranges per month
0
10
20
30
40
50
60
70
R500-R2000 R2000-R5000 R5000-R8000 Above R8000 No Response
%

38
received average salaries. Table 3.3 indicates how the number of members in a family
varies.
TABLE 3.3: NUMBER OF HOUSEHOLD MEMBERS
Number of household members
Percentage Frequency
Alone 4 2
0 - 2 2 1
3 - 5 56 28
6 - 8 30 15
Above 8 6 3
No response 2 1
3.2.2 School going children
The survey revealed as shown in Table 3.4 that 28% of households indicated that they did
not have school going children, 48% had one or two going to school, 16% had three to four
while six percent had five to six children going to school. Two percent did not respond. In
total, 70% of children were going to school. This depiction shows that most of the school
going children are affected when the area experiences floods.
TABLE 3.4 NUMBER OF SCHOOL GOING CHILDREN
Number of school going children
Percentage Frequency
0 28 14
1 - 2 48 24
3 - 4 16 8
5 - 6 6 3
No response 2 1
3.3 Summary
This chapter provided a profile of respondents studied in terms of various factors. Some of
the factors discussed had a marked impact on how people behaved after flooding had
occurred in their area and therefore provided a deeper insight into how such communities
could be assisted.

39
The information gathered showed that Ga-Moeka and Ga-Motle communities were affected
by floods. Sixty percent of them (fig. 3.3) did not show their salary range which indicated a
high percentage of unemployed people in the area, and therefore they could not afford to
replace their belongings if they had been damaged by the floods. Most of them were not
educated. A high percentage of 84%, indicated in Figure 3.2, were non scholars and four
percent did not indicate their educational status, therefore could not get decent jobs which
could pay for their needs, for example going to the doctor if they contracted diseases caused
by floods or attend psychological sessions if they were psychologically affected by the
floods.
Of the people interviewed, 72% as can be seen in Figure 3.1, were single, 20% married,
four percent separated, two percent divorced and two percent widowed. This large
percentage of singles showed that they did not have the support of a partner during distress
therefore stress levels might rise. The majority of respondents at 60% evident in Table 3.1,
were female and the males at a low of 40%. Women are believed to be more vulnerable, and
floods increase their vulnerability and the risks of their livelihood (Fordham 1998: 127).

40
CHAPTER 4 SOCIAL, ECONOMIC AND PSYCHOLOGICAL IMPACTS OF FLOODS
4.1Introduction
The purpose of this chapter is to describe the impact of flooding on Ga-Moeka and Ga-Motle
communities and to highlight social, economic and psychological factors affecting the
impact. The chapter also aims to determine whether the factors stated in the discussion had
any influence on how flooding impacted in their area. The analysis reported in this chapter is
based on the data gathered through questionnaires.
4.2 Social Impact of Floods in the Area
The social impact section deals with how communities in Ga-Moeka and Ga-Motle
experience flooding, its frequency, the causes, members of families affected, school going
children, reasons for staying in affected areas, how scholars are affected, assistance during
flooding, reasons for flooding, warnings and their future plans.
In the analysis 96% (48) indicated incidence of flooding in the environment whereas four
percent (two) did not. This high rate of people experiencing floods is a confirmation of floods
in the area.
The frequency of the floods in the area is determined by how many times during the year the
communities experienced floods. There were members of the community who experienced
floods once, twice or thrice a year,- very frequently - then there were those who did not
experience it at all. It was established that the most frequent flooding was twice a year
indicating how many times a year the people had to suffer the consequences of floods. For
the people in Ga-Moeka and Ga-Motle twice a year was too much since their profile showed
that a high percentage of them were not working to be able to cover the costs during and
after the floods. In Table 4.1 the frequency of the floods in indicated.

41
TABLE 4.1 PROFILE OF INCIDENCE OF FLOODING
Incidence of flooding in a year
Percentage Frequency
Once 14 7
Twice 56 28
Thrice 16 8
Very frequently 12 6
No Flooding 2 1
The respondents in the survey area had to pinpoint the cause of flooding whether it was from
heavy rains, bursting of a dam, overflowing river or building in the floodplains. The results of
the survey can be seen in Table 4.2.
TABLE 4.2 CAUSES OF FLOODS
Causes of flooding Yes No
Heavy rains 45% (90) 10% (5)
Bursting of dam 60% (30) 40% (20)
Overflowing river 6% (3) 94% (47)
Building in the floodplain 2% (1) 98% (49)
The analysis shows that more people believed that flooding was caused by bursting of a
dam nearby and the second highest believed it was because of heavy rains. After heavy
rains or a dam bursting, the whole area was covered in water.
Respondents had to give reasons why they went to live in the Ga-Moeka and Ga-Motle
areas. They responded that it was next to where they worked, close to relatives and friends,
a cheaper place to stay, owning places and having nowhere to go. The highest percentage
of 50 found the place to be cheaper. The lowest percentage of six decided to have their own
places and did not stay with their parents. The issue of flooding did not deter them from
seeking a place to live in the two areas.
TABLE 4.3 PROMPTS TO STAY IN GA- MOEKA AND GA-MOTLE
Prompts to stay in Ga- Moeka and Ga-Motle
Yes No No response
To be next to school or work 26% (13) 72% (36) 2% (1)
To be next to relative or friends
10% (5) 88% (44) 2% (1)
It is cheaper to stay there 50% (25) 48% (24) 2% (1)
To have own place to stay and not stay with parents
6% (3) 92% (46) 2% (1)
Had nowhere to go 14% (7) 82% (41) 4% (2)

42
Of the respondents, 70% did not respond to this question because many of those
interviewed were single women. The impact of flooding on schooling was not bad as only
10% were absent only for one day, four percent were absent for two weeks, eight percent
were absent for the whole week and eight percent had never been absent. Table 4.4 shows
if flooding caused absenteeism.
TABLE 4.4 IMPACT OF FLOODING ON SCHOOLING
Impact of Flooding on Schooling
Absent for one day 10%
Absent for two days 4%
Absent for the whole week 8%
Not absent at all 8%
No response 70%
The analysis showed that there was no correlation between flooding and schooling. In Ga-
Moeka and Ga-Motle flooding did not cause too much disruption at schools because most of
the residents did not go to school, only a total of 22% were affected by floods during school
time.
4.2.1Aid received during floods
Of the respondents 66% indicated that they did not receive any help from any source during
floods as compared to 34% who did as shown in Table 4.5.
TABLE 4.5 ASSISTANCE DURING FLOODS
Getting help during floods Percentage Frequency
Yes 34 17
No 66 33
Respondents had to answer where they were getting help from during floods in their area
and this is made clear in Table 4.6. The analysis indicated that the people in the area
received a little help from neighbours (20%), relatives (16%), friends (4%), municipality (6%)
or NGOs (2%). This was a disturbing position because the municipality was expected to take
the lead in assisting victims of floods and in Ga-Moeka and Ga-Moeka it showed that the
municipality was not involved and that there was lack of awareness regarding the plight of
the people. The people themselves were not aware of the kind of help they could get from
the municipality, because if help was not coming they should be in a position to initiate in
asking for what they rightfully deserved.
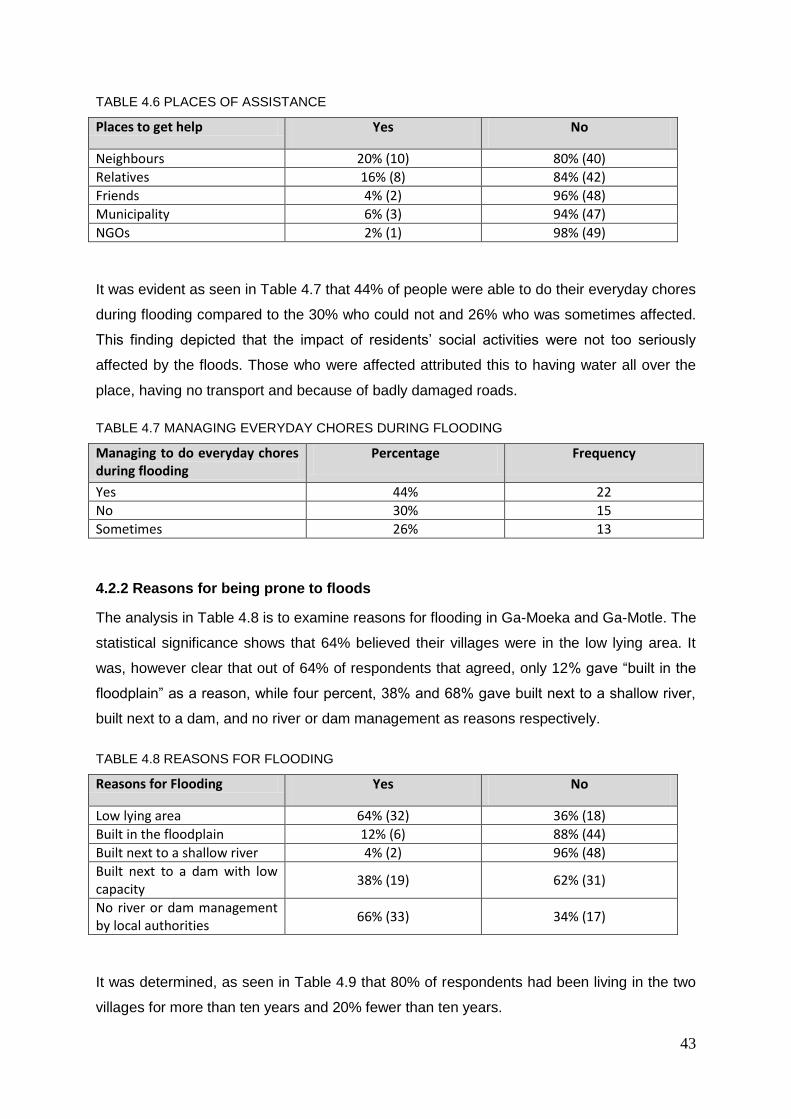
43
TABLE 4.6 PLACES OF ASSISTANCE
Places to get help Yes No
Neighbours 20% (10) 80% (40)
Relatives 16% (8) 84% (42)
Friends 4% (2) 96% (48)
Municipality 6% (3) 94% (47)
NGOs 2% (1) 98% (49)
It was evident as seen in Table 4.7 that 44% of people were able to do their everyday chores
during flooding compared to the 30% who could not and 26% who was sometimes affected.
This finding depicted that the impact of residents’ social activities were not too seriously
affected by the floods. Those who were affected attributed this to having water all over the
place, having no transport and because of badly damaged roads.
TABLE 4.7 MANAGING EVERYDAY CHORES DURING FLOODING
Managing to do everyday chores during flooding
Percentage Frequency
Yes 44% 22
No 30% 15
Sometimes 26% 13
4.2.2 Reasons for being prone to floods
The analysis in Table 4.8 is to examine reasons for flooding in Ga-Moeka and Ga-Motle. The
statistical significance shows that 64% believed their villages were in the low lying area. It
was, however clear that out of 64% of respondents that agreed, only 12% gave “built in the
floodplain” as a reason, while four percent, 38% and 68% gave built next to a shallow river,
built next to a dam, and no river or dam management as reasons respectively.
TABLE 4.8 REASONS FOR FLOODING
Reasons for Flooding Yes No
Low lying area 64% (32) 36% (18)
Built in the floodplain 12% (6) 88% (44)
Built next to a shallow river 4% (2) 96% (48)
Built next to a dam with low capacity
38% (19) 62% (31)
No river or dam management by local authorities
66% (33) 34% (17)
It was determined, as seen in Table 4.9 that 80% of respondents had been living in the two
villages for more than ten years and 20% fewer than ten years.

44
TABLE 4.9 PERIOD LIVING IN THE AREA
Period living in the area Percentage Frequency
Less than ten years 20 10
More than ten years 80 40
Table 4.10 shows that 88% of interviewed people had not been warned beforehand that the
area was prone to flooding compared to the other 12% that were warned.
TABLE 4.10 PREWARNED AGAINST AREA
Warned of the area before Percentage Frequency
Yes 12 6
No 88 44
According to Table 4.11, 58% of the respondents were not planning on leaving the area
anytime soon. Ultimately 86% would move away compared to only 14% of them who wanted
to leave immediately for a safe area.
TABLE 4.11 ESTIMATED TIME BEFORE MOVING
Estimated time before moving Percentage Frequency
Not planning to leave the place 58 29
Will ultimately move 28 14
Immediately 14 7
The depiction is that even if the area was flooded, more people were afraid to go and look
for safer places because they would be too expensive for them. People would rather suffer
the short term of the impact of floods than go away and live forever in an unaffordable place.
This decision by the people to withstand the impact of floods should take the municipality to
task to provide basic services to their people. Extensive public awareness had to be done to
reduce the effects of floods in the area. The profile of respondents in terms of schooling,
gender and marital status was not looked at.
1.12.1 Summary of the social impact of floods in the Ga-Moeka and Ga-Motle communities
The findings show that the communities have learned coping mechanisms during flooding in
their area as discussed in section 2.9 because they were not willing to relocate. The
municipality had taken a back seat since their assistance to the community was not visible.
Since the communities benefit from the cheaper place to live, it was the responsibility of the
municipality to come up with programmes that would assist them. According to the

45
municipality disaster manager, they were planning to have a catchment to ease the burden
of residents when it was flooding.
4.3 Economic Impact
The section on the economic impact looks at how many people work in the household, mode
of transport they use to travel, their income, their expenses and their properties. All the
above-mentioned items are costing the community a certain percentage of their income
when their area is flooded.
A high number of people interviewed prefer taxis and buses; 34% preferred taxis and 28%
buses illustrated in Table 4.12. Of the respondents 14% used their own cars. It is not
surprising as most of villagers do not own cars and they earn low salaries or government
pensions. Eight percent travelled by train and only four percent walked to work. The
relevance of transport for this research was to determine which mode of transport was
affected most and what percentage was of those forced to be absent from work. Because
flooding affect infrastructure, all the modes of transport would be affected by floods and
many people might not report for work during floods in the area. Berning, Du Plessis and
Viljoen (2001: 1) say that the damage to infrastructure is determined by the size of the flood
in terms of the volume of water that flows through the flood-plain and the length of the roads
and other structures within the boundaries of the flood line that might be affected.
TABLE 4.12 MODE OF TRANSPORT IN THE AREA
Mode of transport in the area Yes No
Use taxi 34% (17) 66% (33)
Use bus 28% (14) 72% (36)
Use train 8% (4) 92% (46)
Use own car 14% (7) 86% (43)
Walk to work 4% (2) 96% (48)
According to Table 4.13, 82% of respondents did not have medical aid as compared to only
18% who had. It is a bleak situation considering the fact that 94% of them are victims of
floods. Undoubtedly there will be a percentage who are affected by water-borne diseases
and have to get medication. According to respondents, 80% experienced water-borne
diseases such as cholera and measles during the flooding season compared to 20% who did
not.

46
TABLE 4.13 MEDICAL AID
Medical Aid Percentage Frequency
Yes 18 9
No 82 41
Of the 82% who did not have medical aid, water-borne diseases cost them between R200
and R300. Those who spent between R400 and R500 were the minority at four percent. No
one spent more than a R1 000.00 or more on water-borne diseases. Based on the salaries
these people get, the amounts specified are too high for them to be experiencing these
diseases; the highest percentages of peoples earnings was between R500 and R2 000 per
month. In addition there are other daily expenses , for example transport and electricity. This
analysis as shown in Table 4.14 means that people would try to save the money they had
and not go to health facilities for treatment.
TABLE 4.14 COSTS OF WATER-BORNE DISEASES DURING FLOODS
Costs of water-borne diseases per month during the flooding season
Less than R200. 00 20%
Between R200. 00 and R300. 00 62%
Between R300. 00 and R400. 00 4%
Between R400. 00 and R500. 00 4%
R1000. 00 and above None
In Table 4.15 is an indication of losses suffered during floods as 92% of respondents lost
belongings compared to eight percent who claimed they had not lost anything. This is a high
percentage considering that they needed to be replaced. In most cases the replacement
values are much higher. This is not a good reflection of the people’s financial status.
TABLE 4.15 LOSS OF BELONGINGS DURING FLOODS
Loss of belongings during floods
Percentage Frequency
Yes 92 46
No 8 4
It emerged that 88% of respondents lost between R500 and R5 000 after the flooding event.
As indicated in Table 4.16. Only 12% lost between R5 000and R50 000. The analysis shows
that the people do not own expensive belongings as can be expected with the income they
receive shown in Figure 3.2. These results show that the government has to assist people
because they cannot afford to replace their belongings.
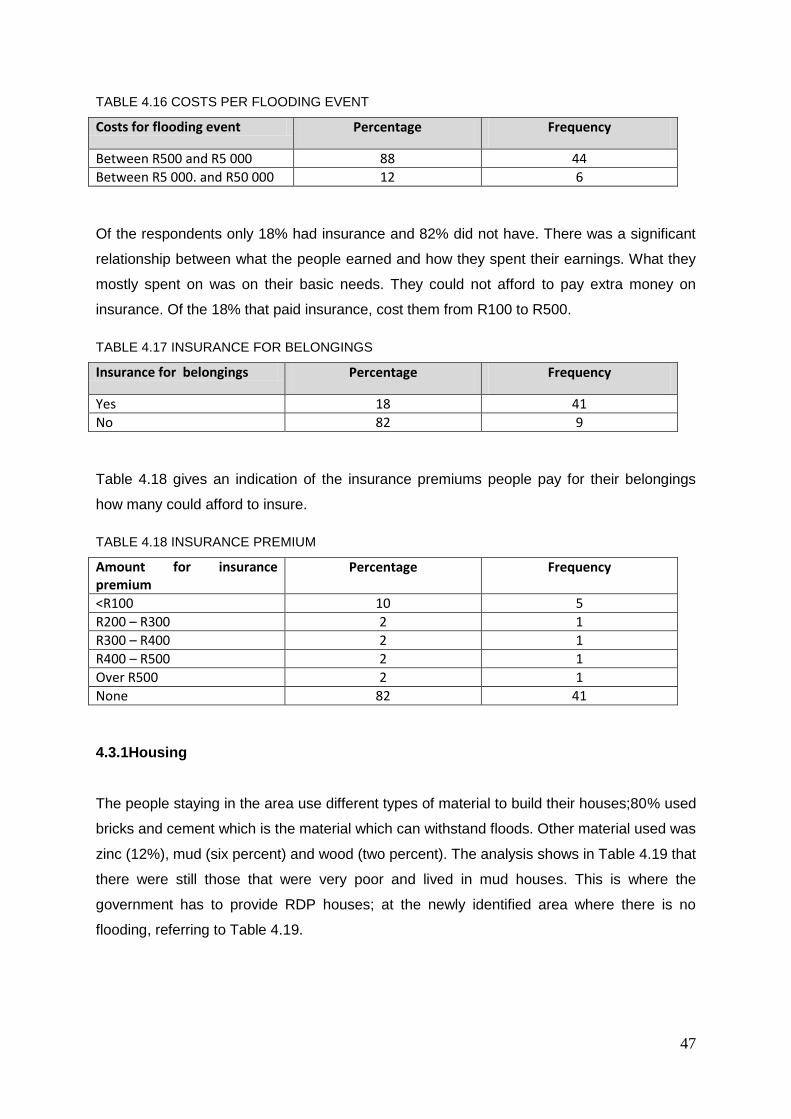
47
TABLE 4.16 COSTS PER FLOODING EVENT
Costs for flooding event Percentage Frequency
Between R500 and R5 000 88 44
Between R5 000. and R50 000 12 6
Of the respondents only 18% had insurance and 82% did not have. There was a significant
relationship between what the people earned and how they spent their earnings. What they
mostly spent on was on their basic needs. They could not afford to pay extra money on
insurance. Of the 18% that paid insurance, cost them from R100 to R500.
TABLE 4.17 INSURANCE FOR BELONGINGS
Insurance for belongings Percentage Frequency
Yes 18 41
No 82 9
Table 4.18 gives an indication of the insurance premiums people pay for their belongings
how many could afford to insure.
TABLE 4.18 INSURANCE PREMIUM
Amount for insurance premium
Percentage Frequency
<R100 10 5
R200 – R300 2 1
R300 – R400 2 1
R400 – R500 2 1
Over R500 2 1
None 82 41
4.3.1Housing
The people staying in the area use different types of material to build their houses;80% used
bricks and cement which is the material which can withstand floods. Other material used was
zinc (12%), mud (six percent) and wood (two percent). The analysis shows in Table 4.19 that
there were still those that were very poor and lived in mud houses. This is where the
government has to provide RDP houses; at the newly identified area where there is no
flooding, referring to Table 4.19.

48
TABLE 4.19 TYPES OF BUILDING MATERIAL FOR HOUSES
Type of material for houses Percentage Frequency
Mud 6 3
Brick/ Cement 80 40
Wood 2 1
Zinc 12 6
Forty six of the respondents, according to Table 4.20, wanted to sell their houses and
relocate and 54% wanted to stay put. It is clear that those who did not want to sell were
either satisfied with their conditions or the uncertainty of relocating was too much for them..
Relocation affects different aspects of people’s lives and therefore needs thorough planning
so that they did not end up being worse off than before.
TABLE 4.20 WISHING TO SELL THE HOUSE
Wishing to sell the house Percentage Frequency
Yes 23 46
No 27 54
4.3.2 Financial assistance from government or other sources
Damages from floods are rising because of dense population concentration and vulnerable
assets in high risk zones. The recovery process of disaster victims is placed primarily in the
hands of government (Kunreuther & Linnerooth-Bayer 1999: 3). It emerged that only 12% of
respondents received financial assistance from the government and other sources compared
to 86% who did not get any help at all. The significance here is that the government or the
local municipality is not doing enough to help the community. The findings in the Table 4.21
and Table 5.6 depict almost the same low results regarding assistance coming from
government/ municipality and other sources. This also reveals that many people will have to
be subjected to their current conditions for a longer period or even for the rest of their lives.
TABLE 4.21 FINANCIAL ASSISTANCE FROM GOVERNMENT OR OTHER SOURCES
Financial assistance from government or other sources
Percentage Frequency
Yes 8 4
No 88 44
Sometimes 4 2

49
4.4 Psychological Impact Section
Twigger-Ross (2005: 27) states in his report that flooding has the potential of bringing
immediate, medium and/or long-term effects to communities. The long-term effects are
mostly psychological. The study on the psychological impact of respondents looked at what
happened to them emotionally when they experienced floods, for example suicidal emotions,
coping strategies, trauma, relationships during floods, illnesses and recovery as depicted in
Figure 4.1 When respondents experienced floods, 46% of them shared the shock with their
friends and relatives, four percent became angry and another four percent did not feel
anything. Twelve percent of the respondents experienced trauma. There was no one who
had felt like committing suicide. However, there is significant indication that people become
very emotional during floods.
Fig. 4.1 Emotional experiences during floods
When looking at whether people felt suicidal during the floods, 88% never felt like that. Only
two percent had felt suicidal, four percent said that sometimes felt like it and two percent
always had the feeling when the floods came. There is no marked difference between the
two groups of two percent as can be seen in Table 4.22.
TABLE 4.22 SUICIDAL FEELING AFTER FLOODS
Suicidal feeling after the floods
Percentage Frequency
Yes 2 1
Never 88 44
Sometimes 4 2
always 2 1
It depends on the situation 4 2
46
4 4
12
0
10
20
30
40
50
%
Emotional Experience during Floods
Shock
Anger
Nothing
Trauma

50
Of the fifty people who responded to the questionnaire, it emerged that seven talked to
friends and relatives when they felt suicidal, four went to church and only one person went
for counselling as indicated in Table 4.23. The relationship between suicide and the impact
of floods is minimal and this is an indication that people were able to handle the impact. The
fact that not many people felt suicidal after the floods, corresponded with what they did when
they felt like it; most of them did not do anything.
TABLE 4.23 COPING WITH FEELINGS OF SUICIDE AFTER FLOODS
What people do when having suicidal feeling after the floods
Percentage Frequency
Go to church 8 4
Talk to friends 14 7
Go for counselling 2 1
Cry 0 0
Not applicable 6 3
This section’s analysis is based on emotional feelings of the people living in the area. Living
in Ga-Moeka and Ga-Motle provokes different feelings from different people. Some (22%)
felt like relocating, some like staying. Others felt like living elsewhere (26%), 10% were
uncertain and six percent did not feel anything. The highest percentage of people 26%, did
not feel like relocating ever as is evident in Figure 4.2.
Fig. 4.2 Feelings about the area
0
10
20
30
RelocateNever relocate
Not sureLiving elsewhere
Feel nothing
Pe
rce
nta
ges
Feelings about the area

51
When trauma is experienced, according to respondents it varies. Sometimes it lasts for less
than a week, two weeks, three weeks, a month or a year. Figure 4.3 indicates that 18%
experienced trauma for less than a week, two percent for two weeks, four percent for three
weeks, four percent for a month and two percent for a whole year. The relationship between
the duration of trauma and the impact of floods is minimal.
Hoedspruit’s victim support unit (s.a.:1) explains trauma as an emotional shock which follows
a stressful event and can manifest in various ways, like screaming, crying, withdrawing,
complete calmness, emotional numbness and confusion or disorientation depending on the
different personalities. It is illustrated in Figure 4.3.
Fig. 4.3 Duration of trauma
In Table 4.24 it is clear that the 64% of respondents had normal relationships with family
members after the flood, 12% were tense, six percent were happy even after the floods, ten
percent had mixed feeling and eight percent did not comment. The normal relationships
were positive signs which showed that there was not much harm done to families as such.
TABLE 4.24 RELATIONSHIPS WITH FAMILY MEMBERS
Relationship with family members
Percentage Frequency
Normal 64 32
Tense 12 6
Happy 6 3
Mixed feelings 10 5
No response 8 4
Looking at Table 4.25, it is evident that compared to relationships with neighbours after the
floods, it looked a bit different with; 20% normal, tense at 42%, happy at 14%, hatred at 14%
and 10% breaking up their relationships. The cause of a highly tense situation could be that
18
2
4 4
2
0
2
4
6
8
10
12
14
16
18
Duration of Trauma
Less than a week
Two weeks
Three weeks
A month
The whole year

52
they were worried about replacing their losses because most people were not working in the
area as seen in Figure 3.3 showing the salaries that people earned.
TABLE 4.25 RELATIONSHIPS WITH NEIGHBOURS AND FRIENDS
Relationship with neighbours and friends
Percentage Frequency
Normal 20 10
Tense 42 21
Happy 14 7
Hatred 14 7
Broke 10 5
The longest recovery period for the families after the floods was a year at 12% compared to
the shortest of one week at 14%. For 28% it took two weeks, for 38% three weeks and for
eight percent a month, as indicated in Table 4.26 Three weeks is an understandable
average time to recover from the impact of floods. The analysis shows the highest
percentage 38%, taking an average time to recover from the bad experiences they had
during thee floods which resulted in loss of belongings and costs incurred to replace the
losses.
TABLE 4.26 RECOVERY PERIOD AFTER FLOODS
Period for family to recover after the floods
Percentage Frequency
A week 14 7
Two weeks 28 14
Three weeks 38 19
A month 8 4
A year 12 6
Spirituality has proven to be the highest coping strategy preferred after the floods and its
impact according to the response of 48% in Figure 4.4. Some 36%, coped by talking to
friends and relatives, two percent went for counselling, another two percent cried and 24%
did nothing about it. Floods bring about emotional disturbances and losses and many people
resort to their different ways of spirituality. Dewi (2007: 47) claims that there are different
types of coping mechanisms which are economic, structural or social. The economic coping
mechanisms are others like repairing minor damages to appliances, repairing damages to
the house, constructing houses with reinforced materials, fixing things, purchasing cheaper
food, continuing to go to work and saving money. The people in these two villages have to
use those economic coping mechanisms.

53
Fig.4.4 Coping strategies during flood
4.4.1Sicknesses/ diseases during floods
There were 86% of people contracting sicknesses/diseases during the floods compared to
the 14% who did not contract any sicknesses/diseases. There is a high relationship between
sicknesses/diseases and floods because a high percentage according to Figure 4.5
indicated that they had contracted sicknesses/ diseases during floods.
Fig.4.5 Contraction of diseases during floods
Floods cause various types of diseases/ sicknesses among the people. Some of them are
dangerous and some are manageable. It depends on whether a person receives assistance
to curb the disease/sickness to avoid its severity. According to Table 4.27, diseases and
86
14
0
20
40
60
80
100
%
Contraction of Diseases during Floods
Diseases
No Diseases
36
2 2
24
0 5
10 15 20 25 30 35 40
%
Coping Strategies during Floods
Talking to friends and relatives
Crying
Counselling
Nothing

54
sicknesses that are experienced during the floods are malaria at ten percent, the flu at 88%,
diarrhoea at 14% and stress disorder at 16%. There was no indication of an experience of
malnutrition. People visited clinics where they were diagnosed with these diseases. Since
there was only one health centre serving Ga-Moeka and Ga-Motle, the centre was inundated
by patients during the flood period. Mostly children were affected by diseases.
TABLE 4.27 TYPES OF DISEASES
Type of diseases Percentage Frequency
Malaria 10 5
Flu 88 44
Diarrhoea 14 7
Stress disorder 16 8
Malnutrition 0 0
As indicated by Figure 4.6, many families did not suffer loss of lives during the floods,
namely 84% and only 16% experienced loss of life. Of them 24% lost fewer than five people
over a period of ten years. Respondents were not asked the gender or age of the people
they lost because of floods.
Fig. 4.6 Loss of life in households
4.5 Summary
This chapter has shown that when floods occurred, it influenced the social, economic and
psychological factors of the community. It became clear that the floods definitely had an
impact on the social activities of the people although the impact on school going children
84
16
0
20
40
60
80
100
%
Loss of Life in Households
No loss of life
Loss of life

55
was not very bad, because they managed to go to school after only a few days. Most people
felt badly impacted as most of them did not get assistance and only a very small percentage
managed to get help from their municipality.
The negative impact on the economy of the community has also been discovered. The
impact was huge in terms of replacing property that had been destroyed by floods; medical
expenses as many of them received little income; most of those who were working, earn
from R500 to R2 000. They also lost on their salaries because they were absent from work
because of the unavailability of transport during floods, which negatively affected the families
they supported.
Psychological functioning of the people had been affected by the floods. A large percentage
suffered from shock and experienced trauma for about a week afterwards and a very small
percentage gets trauma that lasts for a year. Fortunately many people still had normal
relationships even after the floods had subsided. A large number, however, contracted
diseases which caused ill health.

56
CHAPTER 5 SUMMARY AND CONCLUSIONS
5.1Introduction
This chapter provides a summary of the study and presents its conclusion, as well as
recommendations in terms of further research. In the summary, the objectives of the study
are questioned to determine whether they have been achieved. In case of the non-
achievement of specific objectives, reasons are provided.
5.1.1Specific objectives and its findings
The specific objectives of the study and its findings are summarized as follows:
To determine how the Ga–Moeka and Ga-Motle communities were affected
socially by floods
The descriptive data provided by the study confirmed that the communities of Ga-
Moeka and Ga-Motle were socially affected by flood events. This was particularly
shown by the frequency of the floods in the areas which caused people not to be able
to carry on with their daily responsibilities because of water that was everywhere,
damage to roads and other infrastructure in and around the areas. The situation also
influenced relationships with relatives, neighbours and friends either positively or
negatively.
To determine how the Ga–Moeka and Ga-Motle communities were affected
economically by floods
The data collected confirmed that the communities of Ga-Moeka and Ga-Motle were
negatively affected, economically after the flood evenst. The reasons for the negative
effects were that floods caused damage to their property and that needed to be
replaced or insured. During floods people contracted water-borne diseases and
sicknesses and they needed health care which was very expensive for them. Most of

57
the people of the two villages were not educated therefore they either earned very
little or they did not work at all. That put a strain on their small income.
To determine how the Ga–Moeka and Ga-Motle communities were affected
psychologically by floods
In terms of the psychological impact of floods, the study has shown that the
communities suffered psychologically after the floods. People were shocked, tense,
angry, suicidal or full of hatred. Many used coping strategies like talking to relatives,
neighbours, friends, resorted to spirituality, counselling or doing nothing at all. Some
took a short time to recover whereas others took longer.. They also contracted
diseases and sicknesses which could be deadly and sometimes they lost lives
because of flooding.
To determine why Ga-Moeka and Ga-Motle are being flooded
The study has shown that there were different factors which caused Ga-Moeka and
Ga-Motle to flood according to the respondents’ perceptions. It was found that
respondents attributed that to heavy rains, bursting of a nearby dam, overflowing of a
river, the areas are on the floodplain and there was no dam or river management in
the areas. It was also found that the municipality was not taking enough care of
infrastructure in their area, for example there were no bridges, the roads were poor
and dams did not have the capacity to carry the water when they were full.
5.2 Conclusions and Recommendations
In conclusion the issues outlined in the objectives identified at the start of the study have
been examined and some insight has also been provided into the social, economical and
psychological impacts on communities after the flood events in Ga-Moeka and Ga-Motle in
the Moretele Local Municipality. The recommendations that are cited hereunder will assist
the communities to receive assistance from municipalities in order to alleviate the impact of
floods when they occur. They will also assist municipalities to know exactly where to put
more strength in alleviating community’s problems:

58
Upgrading the infrastructure in the area in terms of building of a new dam or
recapacitation of the existing dam, roads and the drainage system
It has emerged from the data gathered that one of the causes of flooding in Ga-Moeka
and Ga-Motle is because of a dam which cannot withstand water during heavy rains
and poor roads. Upgrading of the infrastructure systems can be a solution which will
either reduce flooding or eliminate it completely. The local municipality must come up
with a proposal to upgrade infrastructure, and an implementation plan with timelines to
deliver on them.
Low lying areas and relocation plan
The gathered data through respondents has shown that the two villages are in the low
lying areas and they flood badly after heavy rains. It is recommended that there should
be a strict location plan that is used by the municipality to place people in proper
areas. People should not be allowed to build in an area where it is flooding. People
who force their way to build in such an area have to be fined heavily or it can be used
as a farming area. People who have already built can be moved to other safe areas.
The local municipality must come up with a farming project where families can use
their current land to plant and start farming businesses. The municipality must also
come up with a system to reduce the water flow in the area by putting in proper
drainage systems as part of floodplain management. People have to be moved to new
RDP houses or be compensated for moving out of their current place to a newly found
area for them. The project has to have strict timelines.
Compulsory insurance
From the data gathered, it emerged that families do not have insurance for their
properties because of the little income they earn. The recommendation here is that
there should be compulsory insurance for families who do not want to relocate to
compensate for their losses during floods. The study has shown that most of them do
not want to relocate. The suggestion is that every family that does not relocate should
contribute an average amount which will be calculated by an insurance company and
there should also be another percentage that is contributed by the government
towards that insurance. There should be a treasury request to implement this initiative.
Kunreuther & Linnerooth-Bayer (1999: 10) say that in funding the disaster recovery,
government has the option of using small amounts of private insurance, government

59
reserves and international assistance. According to Gill (2004: 54), most natural perils
are insured under individual policies in the United Kingdom.
Early warning system
Geographic Information Systems has been proven to assist with the procedures to
collect and analyze spatial data for hazard and risk assessment. Maps can be created
by the software which shows levels of flood hazards. These maps can be used for
planning and prioritization measures for anti-flood.
Communication during floods
Communication is very good during floods. It starts with awareness campaigns done
with communities about their hazards. An example of Bangladesh municipality is a
good one where messages of behavioural change are put up all over the place to
remind people of what is proper behaviour to avoid flood disasters. Municipalities must
have emergency communication plans where all stakeholders are involved.
5.3Suggestions by Respondents on the Solutions of Flooding in Ga- Moeka
and Ga- Motle Villages
Respondents have given some suggestions to providing solutions for flooding in the area
and they are:
Building of bridges by municipality/ government
The bridge will help in directing the water away from the villages and avoid more
water from coming down and causing floods.
Building of dams with large capacities by municipality/ government
Dams with large capacities will help with keeping the water inside. The water can
also be purified and be used for drinking purposes.

60
Dam management systems by the municipality/ government
Dam management will help the municipality and government to do proper
planning in terms of funding the maintenance and renovations after a certain
period after floods have occurred.
Building of better houses with strong foundations by municipality/ government
If people have to be moved to other higher places, municipality and government
must use good materials for building. Thorough research must be done so that no
new disaster is created in the new place, for example where there is no water
and the area remains dry for a long time, but which may now cause fire disasters.
Building of better roads by municipality/ government
Ga-Moeka and Ga-Moeka roads are not well maintained; there are a lot of
potholes which are caused by floods. Better and stronger roads are needed.
Building of drainage systems by municipality/ government
The drainage system will help to direct the water to nearest rivers.
Communities working together with municipalities
The people of Ga-Moeka and Ga-Motle feel they are not involved or consulted in
the planning of their villages.
Proper civil engineering projects
Respondents believe that if roads and other infrastructure are planned and built
properly, flooding will be less in their area.

61
REFERENCES
1. ALNAP. 2008. Flood Disasters: Learning from Previous Relief and Recovery Operation.
Prevention Consortium.
2. Asian Disaster Preparedness Centre. 2004. Channels of Communication – a Challenge:
Public Awareness for Flood Preparedness in Bangladesh
3. Babbie, E. & Mouton, J. 2006. The Practice of Social Research. , Cape Town: Oxford
University Press Southern Africa.
4. Back, E., Cameron, C. & Tanner, T. 2009. Children and Disaster Risk Reduction: Taking
stock and moving forward. Research Report. Institute of Development Studies: UNICEF.
5. Banerjee, L. 2007. Flood Disasters and Agricultural Wages in Bangladesh. Oxford:
Blackwell Publishing.
6. Barredo, J. I. 2009. Normalised Flood Losses in Europe: 1970 – 2006. Italy: European
commission Joint Research Centre: Institute for Environment and Sustainability.
7. Berning, C., Du Plessis, L. A. & Viljoen, M. F. 2001. [Abstract of: Loss Functions for
Structural Flood Mitigation Measures: 35. [Online]. Available from: www.wrc.org.za
Accessed: (2010 February 13)
8. Beven, K. & Carling, P. (Eds.) 1989. Floods: Hydrological, Sedimontological and
Geomorphological. Great Britain: Bath Press.
9. Bland, S. H., O’Leary, E. S. Farinaro, E., Jossa, F. & Trevisan, M. 1996. Long-Term
Psychological Effects of Natural Disasters: Psychomatic Medicine. New York: State
University of New York.
10. Branswell, B.,, Fisher, L. & Macleans. 1996. Floodwaters on rampage, 109: 1-5.
Available from UFS: Database: Academic Search Complete.
11. Brett, D. 2001. Coping with Floods (or other natural disasters) Victoria, Australia [Online].
Retrieved from: http://www.familyinfoserv.com Accessed: (2010 August 12).

62
12. Bryant, C. D. & Peck, D. L. (Eds). 21st Century Sociology: A Reference Handbook (Vol
2): SAGE Publications: Thousand Oaks. London. New Delhi.
13. Bryant, E. 1991. Natural Hazards. New York: Cambridge University Press.
14. Bush, J. C. 1979. Disaster Response: A Handbook for Church Action. Canada: Herald
Press.
15. Case Studies: Adaptive Capacity and Livelihood Resilience.
16. Centre for International Forestry Research. 2005. Forests Perspective 2: Forests and
Floods: Drowning in Fiction or Thriving on Facts. RAP Publication.
17. Charles, M .N. 2004. Environmental Education Association of Southern Africa, 21: 50 –
60.
18. Champ, P. (Ed.) 1983. Planet Earth Flood. USA, Amsterdam: Time-Life Books.
19. Community Member 24 July 2009.
20. Department for Environment, Food and Rural Affairs. 2010. Draft Strategy for Skills and
Capacity Building in Local Authorities for Local Flood Risk Management. United
Kingdom.
21. Dewi, A. 2007. Community-Based Analysis of Coping with Urban Flooding: a Case Study
in Semarang, Indonesia. International Institute for Geo-Information Science and Earth
Observation. Enshede. The Netherlands.
22. Ehrenreich, J. H. (Ed.) 2001. Coping with Disaster: A Guidebook to Psychological
Intervention. New York: State University.
23. Elliot, C. R. N. & Leggett, D. J. 2002. Reducing the Impacts of Flooding – Extemporary
Measures. London: Department of Environment, Food & Rural Affairs.

63
24. Enarson, E. & Scanlon, J. 1999. Gender Patterns in Flood Evacuation: A Case Study in
Canada’s Red River Valley. (7). 103 – 124. Canada: Elsevier Science Inc.
25. EurAqua – Third Technical Review. 1997. Management and Prevention of Crisis
Situations: Floods, Droughts and Institutional Aspects. Germany: Fuck Druck.
26. FEMA. 2004. Making Schools Safe against Floods.
27. Few, R., Ahern, M., Matthies, F. & Kovats, S. 2004. Floods, Health and Climate Change:
A Strategic Review. Tyndall Centre for Climate Change research. United Kingdom.
28. Fordham, M.1998 “Making Women Visible in Disasters: Problematising the Private
Domain.” Disasters 22(2): 126 -143.
29. Fordham, M. & Ketteridge, A. M. (1996). Men must work and women must weep:
Examining gender stereotypes in disaster, paper presented at the Natural Hazards
Research & Applications Information Centre Workshop, Denver, CO.
30. Foster, H. D. 1980. Disaster Planning: The Preservation of Life and Property. United
States of America: Springer-Verlag New York Inc.
31. Gill, S. 2004. Literature Review: Impacts of Climate Change on Urban Environments.
Draft Copy.
32. Goddard, W. & Melville, S. 2001. 2nd edition, Research Methodology: An Introduction.
Lansdowne: Juta & Co. Ltd.
33. Green, C. 2002. Flood Risk Management in the context of Integratetd Water Resource
Management (IWRM). Middlesex University. United Kingdom.
34. Grossi, P. & Kunreuther, H. (Eds). 2005. Catastrophe Modeling: A New Approach to
managing Risk. United States of America: Springer Science + Business Media.
35. Gruntfest, E. 1995. Long-Term Social and Economic Impact of Extreme Floods. Italy pp.
1 – 14.

64
36. Guidance Note 11. Tools for Mainstreaming Disaster Risk Reduction: Social Impact
Assessment.
37. Gwimbi, P. 2009. Linking rural community livelihoods to resilience building in
flood risk reduction in Zimbabwe. Journal of Disaster Risk Studies, Vol 2, No.1, 71 - 79.
38. Happy Santosa, Department of Architecture – Institut Teknologi Sepuluh Nopember
(ITS) Campus ITS, Sukolilo, Surabaya 60111 – Indonesia and Human Settlements
Services (Dinas Permukiman) – East Java Province JI. Gayung Kebonsari 169.
39. Health Technology Assessment. 2002. Vol.5: No. 31
40. Heathcoat, R. L. & Thom, B. G. 1979. Natural Hazards in Australia. Canberra: Australian
Academy of Science
41. Hoedspruit Victim’s Support Unit. s.a. What Is Trauma? Hoedspruit. Retrieved from:
http://www.hoedspruit.co.za/ Accessed on: (2011, Jan. 13)
42. http://assets.panda.org/ Accessed on: (2010 July 15)
43. http://changingminds.org Accessed on: (2010 July 15)
44. http://iadr.confex.com Accessed on: (2010 July 15)
45. http://en.wikipedia.org/ . Accessed on: (2009, September. 24).
46. http://en.wikipedia.org/ Accessed on: (2010, March 03).
47. http://writing.colostate.edu/ Accessed 24 September 2009]
48. Huairou Commission. Women’s Views from the Frontline
49. Humanitarian Aid Decision. 2006. Humanitarian Aid for the victims of floods and disaster
events in El Salvador. European Commission.

65
50. IOM. 2008. IOM Zimbabwe Flood Response: 19 December 2007 to 10 January 2008.
IOM Zimbabwe
51. Kent, G. 2001. Human Right to Disaster Mitigation and Relief. Environmental Hazards,
Vol. 3, pp. 137 – 138. USA
52. Krasovskaia, I., Gottschalk, L., Skiple Ibrekk, A. & Berg, H. 2007. Perception of flood
hazard in Countries of the North Sea region of Europe. Norway: 387 – 397. Department
of GeoSciences, University of Oslo.
53. Kunreuther, H. C. & Linnerooth-Bayer J. 1999. The Financial Management of
Catastrophic Flood Risks in Emerging Economy Countries (Proceedings of the 1999
Conference on Global Change and Catastrophic Risk management held at Laxenburg,
Austria in June 6- 9).
54. Literature Review of the Emergency Sector in Vietnam from 2001 – 2003. 1st Draft 22/
07/ 03.
55. Liu, Y. B., Gebremeskel, S., De Smedt, F. Hoffmann, L. & Pfister, L. 2003. A Diffusive
Transport Approach for Flow Routing in GIS-based Flood Modelling. Belgium. Pp. 91-
106.
56. Malele, B. F. 2009. JAMBA: Journal of Disaster Risk Studies. Vol 2. No. 1, March 2009.
North West University. South Africa.
57. Maosong, L., Jiqing, S., Wenbo, B., Yongfeng, W., Buchun, L., Chunyan, W. & Xiufen,
W. 2008. Risk Wise. Ministry of Agriculture.
58. Metropolitan Manila, Sound Practice N0.5. Marikina City Flood Mitigation
Countermeasure Programme.[Online}. Maplandia.com Accessed on: (8 April 2009).
59. Masters of Disaster. 2007. Floods, Background. The American National Red Cross.
60. Moretele Local Municipality Official: 24 July 2009

66
61. Neuman, W. L. 2006. Social Research Methods: Qualitative and Quantitative
Approaches. 6th edition. Pearson Education, Inc. United States of America.
62. Parker, D., Tunstall, S. & Wilson, T. 2005. Socio-Economic Benefits of Flood Forecasting
and Warning. Flood Hazard Research Centre. Middlesex University: United Kingdom.
63. Pegram, G. et al. 2007. Water Research Commission Report No. 1429/1/06, National
Flood Nowcasting System: Towards an Integrated Mitigation Strategy. University of Kwa-
Zulu Natal
64. Penning-Rowsell, E., Tapsell, S. & Wilson, T. 2005. Key Policy Implications of the
Health Effects of Floods. Berlin.
65. Pirbhat Women Development Society. Rapid Assessment of Disastrous Rains and Flood
Effect, District Qamber-Shahdadkot, Sindh.
66. Pistrika, A. & Tsakiris, G. 2007. Flood Risk Assessment: A Methodological Framework.
National University of Athens. Greece.
67. Provention Consortium Secretariat. 2007. Tool for Mainstreaming Disaster Risk
Reduction: Social Impact Assessment [Guidance Note 11]. Switzerland.
68. Rudolph, M., Dlamini, S. & Hlungwani, M. s.a. A model Healthy Village Project. [Poster
Presentation] University of Witwatersrand. Johannesburg.
69. Sagala, S. A. H. 2006. Analysis of Flood Physical Vulnerability in Residential Areas:
Case Study: Naga City, the Phillipines. International Institute for Geo-Information
Science and Earth Observation Enschede. The Netherlands.
70. Samarakoon, L. & JAXA (Visiting Scientist) s.a. RS/ GIS Capacity Building for Disaster
Management in Asia – Pacific, Asian Institute of Technology, Thailand.
71. Sanyal, J. & Lu, X. X. 2005. Remote Sensing and GIS-Based Flood Vulnerability
Assessment of Human Settlement: A case study of Gangetic West Bengal, India.
National University of Singapore. Singapore pp. 3699 -3716.

67
72. Shile, S. Floods interrupt children’s future in North Karnataka. Retrieved from:
http://www.deccanherald.com. Accessed on: (2010 August 12)
73. Silverstein, M. E. 1992. Disasters: Your Right to Survive. United States: MacMillan
Publishing Co.
74. Smith, G. J. 1999. Floods. An Environmental Health Practitioner’s Emergency
Management Guide. Department of Human Services. Australia.
75. Smith R. F. & Boardman, J. (Eds). 1989. The Use of Soil Information in the Assessment
of Incidence and Magnitude of Historical Flood Events in Upland Britain. Great Britain:
Bath Press.
76. Southern, R. L. 1979. The Global Socio-Economic Impact of Tropical Cyclone. Perth:
Regional Office: Bureau of Meteorology.
77. South Africa . Statistics, 2001. Census.2001
78. Stojaspal, J., Gunther, U., Wosnitza, R., Porter, H., Quinn-Judge, P., Zarakhovich, &
Yuri. 2002. Raging Waters, 160: 1-7. Time Europe. Available from UFS: Database:
Academic Search Complete.
79. Sudan Floods. 2008. Emergency Communication Plan [Revised 8 June 2008].
80. Sydney High School Advanced Flooding Warning. 2008. SUTRON
81. Synthesis Report on the Event Analysis: the Floods of 2005 in Switzerland. Swiss
Confederation
82. Takeuchi, Y. & Suzuki, I. 2006. Flood Risk Communication with Pafrics. [A better
integrated management of disaster risks: Towards resilient society to emerging disaster
risks in mega-cities. S. Ikeda, T. Fukuzono & T. Sato, (Eds). pp213 – 224].
83. Terre Blanche, M. & Durrheim, K. 1999. Research in Practice: Applied Methods for the
Social Science. Cape Town: University of Cape Town Press.
84. Thailand. GIS for Disaster Risk Management Level II 2010. 6th Regional Training Course.

68
85. The Zambia Vulnerability Assessment Committee (ZVAC) Lusaka. 2007. Rapid Flood
Impact Assessment Report. Zambia.
86. Thomas, J. R. & Nelson, J. K. 1996. Research Methods in Physical Activity. Human
Kinetics. United States of America
87. Tinh, D. Q. s.p. Flood Kindergarten: Community Need to Community Solution
[Online]. Retrieved from: http://www.unisdr.org _ Accessed on: (2010, Aug. 12)..
88. Tumbare, M. J. 2000. Mitigating Floods in Southern Africa. Harare, Zimbabwe
89. Twigger-Ross, C. 2005. The impact of flooding on urban and rural communities.
Environment Agency. Bristol.
90. United Nations Office for the Coordination of Humanitarian Affairs. 2010. Eastern
Uganda Landslides and Flood situation. Report # 3. Uganda.
91. United Nations Education, Scientific and Cultural Organization: United Nations
Environment Programme. 2004. APELL and Floods. A communists – based approach for
disaster reduction.
92. University of Free State. Disaster management Training and Education Centre for Africa.
2007. Research Methodology: Study Guide for DIM 601. Bloemfontein.
93. USAID. 2007. USAID Provides Flood Assistance to Mali. Press Release s.a. October
2007
94. Van den Bos, G .R. & Bryant, B. K. (Eds.) 1987. Cataclysms, Crises, and Catastrophes:
Psychology in Action. Washington: American Psychological Association.
95. Van Westen, C. 2005. United Nations University – Introduction to Risk Assessment,
Refresher Course on Geo-Information for Natural Disaster Reduction in Eastern Africa,
Department of Geography, Makerere University.
96. Varkey, S., Krishna*, G., Pradhan, N., Gupta, S. K., Caravotta, J., Hombergh, H. V.,
Hoekstra, E., Askari, S. & Kansal, O. 2009. Measles Vaccination Response During Kosi
Floods, Bihar, India 2008. Indian Paediatrics: 997-1002 [V 46] [2009, Nov. 17].

69
97. Vlanchos, E. 1995. Hydrometeorology, Impacts and Management of Extreme Floods,
U.S.- Italy Research Workshop: Perugia
98. Voce, A. 2004. Handout for Qualitative Research Module.
99. Ward, R. 1978. Floods: Focal Problems in Geography: A geographical perspective.
London: The Macmillan Press Ltd.
100. Werrity, A., Houston, D., Ball, T., Tavendale, A. & Black, A. 2007. Exploring the
Social Impacts of Flood Risk and Flooding in Scotland. University of Dundee. Edinburgh.
101. Westen, Van C. 2005. Introduction to Risk Assessment. Refresher Course on Geo-
information for Natural Disaster Reduction in Eastern Africa Department of Geography.
S.l. Makerere University.
102. Wisner, B. et al 2007. At Risk, Second Edition, Natural Hazards, People’s
Vulnerability and Disasters. New York: Routledge
103. World Health Organization. 2002. Flooding: Health Effects and Preventive Measures.
Europe. Fact Sheet 05/ 02
104. World Health Organization. 2008. Emergency and Humanitarian Action: Regional
Office for South-East Asia. News Update July/ August 2008
105. World Meteorological Organization & Global Water Partnership. 2006. Urban Flood
Risk Management – A tool for Integrated Flood Management [APFM Technical
Document No. 4, Flood Management Tools Series]
106. World Meteorological Organization & Global Water Partnership. 2008. Urban Flood
Risk Management – A tool for Integrated Flood Management [APFM Technical
Document No. 11, Flood Management Tools Series]
107. Yale Centre for Public Health Preparedness. 2008. September 2008. Vol. 3, Issue 9

70
108. Zambia Vulnerability Assessment Committee (ZVAC). 2007. Rapid Flood Impact
Assessment Report. Zambia

71
ANNEXURE: A
QUESTIONNAIRE
Please answer the following questions by marking with an X where applicable.
1. PERSONAL INFORMATION:
1.1 Name 1.12.2
1.2 Age 1.12.3
1.3 Gender
Male
Female
1.12.4
1.4 Marital Status
Single
Married
Separated
Divorced
Widowed
1.12.5
1.5 Street Address 1.12.6
1.6 Schooling
Scholar
Non-Scholar
1.12.7

72
1.7 Employment
Employed
Unemployed
1.12.8
1.8 Salary range
Less than R5 000
Between R5 000 – R10 000
Between R10 000 – R15 000
Between R15 000 – R20 000
R20 000 and above
1.12.9
RESEARCH QUESTIONS
SOCIAL IMPACT SECTION
2. Do you experience flooding in your area?
2.1 Yes 1.12.10
2.2 No 1.12.11
3. How frequent is flooding in your area?
3.1 Once a year 1.12.12
3.2 Twice a year 1.12.13
3.3 Thrice a year 1.12.14
3.4 Very frequent 1.12.15

73
3.5 No flooding 1.12.16
4. What causes floods in your area?
4.1 Heavy rains 1.12.17
4.2 Bursting of a dam 1.12.18
4.3 Overflowing river 1.12.19
4.4 Built on floodplain 1.12.20
4.5 Don’t know 1.12.21
5. How many members are in your household?
5.1 Alone 1.12.22
5.2 Between 0 and 2 1.12.23
5.3 Between 3 and 5 1.12.24
5.4 Between 6 and 8 1.12.25
5.5 More than 8 1.12.26
6. Age of your household members and mention how many in that age group
6.1 < 2 1.12.27
6.2 Between 2 and 15 1.12.28

74
6.3 Between 15 and 25 1.12.29
6.4 Between 25 and 35 1.12.30
6.5 > 35 1.12.31
7. How many school going children in the family?
7.1 Between 0 and 2 1.12.32
7.2 Between 3 and 5 1.12.33
7.3 Between 6 and 8 1.12.34
7.4 8 and above 1.12.35
7.5 None is going to school 1.12.36
8. What prompted you to come and stay in this particular area?
8.1 To be next to work and school 1.12.37
8.2 To be next to relatives and friends 1.12.38
8.3 It is cheaper to stay here 1.12.39
8.4 To have my own place and not stay with
parents 1.12.40
8.5 I had nowhere to go 1.12.41

75
9. If you are a scholar, how does flooding affect your schooling?
9.1 Absent for 1 day in a week 1.12.42
9.2 Absent for 2 days in a week 1.12.43
9.3 Absent for 3 days in week 1.12.44
9.4 Absent for the whole week 1.12.45
9.5 Not absent at all 1.12.46
10. Do you get help during floods in your area?
10.1 Yes 1.12.47
10.2 No 1.12.48
11. If Yes, who do you get help from?
11.1 Neighbours 1.12.49
11.2 Relatives 1.12.50
11.3 Friends 1.12.51
11.4 Local Municipality 1.12.52
11.5 NGOs 1.12.53

76
12. Do you manage to do your everyday chores during floods?
12.1 Yes 1.12.54
12.2 No 1.12.55
13. Give reasons for your answer in 14.
14. Do you manage to go to shops, clinics, schools during flooding days?
14.1 Yes 1.12.56
14.2 No 1.12.57
15. Give reasons for your answer in 16

77
16. What do you think is the reason for the area to flood than other neighbouring areas?
16.1 Low lying area
16.2 Built in a floodplain 1.12.58
16.3 Built next to a shallow river 1.12.59
16.4 Built next to a dam with low capacity 1.12.60
16.5 No river and dam management by local
authorities 1.12.61
17. How long have you stayed in this area?
17.1 Less than 1 year
17.2 Two years 1.12.62
17.3 Five years 1.12.63
17.4 10 Years 1.12.64
17.5 More than 10 years 1.12.65
18. Were you warned that the area gets flooded before by the municipality?
18.1 Yes 1.12.66
18.2 No 1.12.67

78
19. Are you planning to move to a non-flooding area?
19.1 Yes 1.12.68
19.2 No 1.12.69
20. If you are planning to move, when can that be?
20.1 In less than a year
20.2 In two years time 1.12.70
20.3 In three years time 1.12.71
20.4 In four years time 1.12.72
20.5 Immediately 1.12.73
ECONOMIC IMPACT SECTION
21. How many people are working in your household?
21.1 1 member 1.12.74
21.2 2 members 1.12.75
21.3 3 members 1.12.76
21.4 4 members 1.12.77
21.5 None is working 1.12.78

79
22. What mode of transport does family members use to go to work?
22.1 Taxi 1.12.79
22.2 Bus 1.12.80
22.3 Train 1.12.81
22.4 Own car 1.12.82
22.5 Walk 1.12.83
23. What is the average income for the household per month?
23.1 Less than R1 000. 00 1.12.84
23.2 Between R1 000.00 and R5 000.00 1.12.85
23.3 Between R5 000.00 and R10 000.00 1.12.86
23.4 Between R10 000.00 and R20 000.00 1.12.87
23.5 R20 000.00 and above 1.12.88
24. What is the average expenditure for the household per month?
24.1 Less than R1 000. 00 1.12.89
24.2 Between R1 000.00 and R5 000.00 1.12.90
24.3 Between R5 000.00 and R10 000.00 1.12.91

80
24.4 Between R10 000.00 and R15 000.00 1.12.92
24.5 Above R15 000.00 1.12.93
25. Do you pay for a medical aid?
25.1 Yes 1.12.94
25.2 No 1.12.95
26. Do you experience any waterborne diseases?
25.1 Yes 1.12.96
25.2 No 1.12.97
27. What is the cost of outbreaks of waterborne diseases per flood event?
26.1 Less than R200. 00 1.12.98
26.2 Between R200.00 and R300.00 1.12.99
26.3 Between R300.00 and R400.00 1.12.100
26.4 Between R400.00 and R500.00 1.12.101
26.5 R1 000.00 and above 1.12.102

81
28. Do you lose belongings during the floods?
27.1 Yes 1.12.103
27.2 No 1.12.104
29. If yes, estimate the costs per flooding event?
28.1 Between R500, 00 and R1000, 00 1.12.105
28.2 Between R2000, 00 and R5000, 00 1.12.106
28.3 Between R5000, 00 and R50 000, 00 1.12.107
28.4 R50 000, 00 and R100 000, 00 1.12.108
28.5 R100 000, 00 and over 1.12.109
30. How much have you lost already since you started staying in the area?
29.1 Less than R10 000, 00
29.2 Between R20 000, 00 and R30 000, 00 1.12.110
29.3 Between R30 000, 00 and R40 000, 00 1.12.111
29.4 Between R40 000, 00 and R50 000, 00 1.12.112
29.5 Above R50 000, 00 1.12.113

82
31. What is the replacement value of your belongings after the floods?
30.1 Less than R10 000, 00
30.2 Between R20 000, 00 and R30 000, 00 1.12.114
30.3 Between R30 000, 00 and R40 000, 00 1.12.115
30.4 Between R40 000, 00 and R50 000, 00 1.12.116
30.5 Above R50 000, 00 1.12.117
32. Do you pay any insurance for your property?
25.1 Yes 1.12.118
25.2 No 1.12.119
33. How much insurance do you pay for your belongings (house, car etc)?
31.1 Less than R100, 00
31.2 Between R200, 00 and R300, 00 1.12.120
31.3 Between R300, 00 and R400, 00 1.12.121
31.4 Between R400, 00 and R500, 00 1.12.122
31.5 Above R500, 00 1.12.123
34. What type of material is used for building your house?
32.1 Mud house

83
32.2 Brick & cement house 1.12.124
32.3 Wood house 1.12.125
32.4 Zinc house 1.12.126
32.5 Other material 1.12.127
35. Do you wish to sell your house and stay somewhere else?
33.1 Yes 1.12.128
33.2 No 1.12.129
36. Do you receive any financial assistance from government or other sources after the
flood event?
34.1 Yes 1.12.130
34.2 No 1.12.131
37. Is there any money left for monthly saving in the household?
35.1 Yes 1.12.132
35.2 No 1.12.133

84
PSYCHOLOGICAL IMPACT SECTION
38. What happens to you when you experience floods in your area?
36.1 Get angry
36.2 Share the shock with friends and relatives 1.12.134
36.3 Feel like committing suicide 1.12.135
36.4 Experience trauma 1.12.136
36.5 Don’t feel anything 1.12.137
39. Do you feel suicidal after the floods?
37.1 Yes
37.2 Never 1.12.138
37.3 Sometimes 1.12.139
37.4 Always 1.12.140
37.5 It depends on the situation 1.12.141
40. What do you do when you feel suicidal?
38.1 Go to church
38.2 Talk to friends and relatives 1.12.142
38.3 Go for counselling 1.12.143

85
38.4 Cry 1.12.144
38.5 No applicable 1.12.145
41. What is your feeling about this area you live in?
39.1 feel like relocating
39.2 Will never relocate 1.12.146
39.3 Not sure about my feelings about the area 1.12.147
39.4 I wish I was living somewhere else 1.12.148
39.5 Not feeling anything 1.12.149
42. If you experience trauma during floods, how long does it last?
40.1 Less than a week
40.2 Two weeks 1.12.150
40.3 Three weeks 1.12.151
40.4 A month 1.12.152
40.5 The whole year 1.12.153
43. How is your relationship with your family members after the flood?
41.1 Relationship broke down

86
41.2 Was normal 1.12.154
41.3 Tense 1.12.155
41.4 Happy 1.12.156
41.5 Mixed feelings 1.12.157
44. How is your relationship with neighbours and friends after the flood event?
42.1 Relationship broke down
42.2 Was normal 1.12.158
42.3 Tense 1.12.159
42.4 Happy 1.12.160
42.5 Hatred 1.12.161
45. How long did it take your family to recover from flood disruption?
43.1 A week
43.2 Two weeks 1.12.162
43.3 Three weeks 1.12.163
43.4 A month 1.12.164
43.5 A year 1.12.165

87
46. What are your coping strategies during the flood?
44.1 Sleep
44.2 Talk to friends and relatives 1.12.166
44.3 Go for counselling 1.12.167
44.4 Cry 1.12.168
44.5 Does nothing 1.12.169
47. Do you get sicknesses diseases during floods in your area?
45.1 Yes 1.12.170
45.2 No 1.12.171
48. If yes, what type of sicknesses are those
46.1 Malaria 1.12.172
46.2 Flu 1.12.173
46.3 Diarrhoea 1.12.174
46.4 Stress disorder 1.12.175
46.5 Malnutrition 1.12.176

88
49. Have you experienced any loss of life during floods?
47.1 Yes 1.12.177
47.2 No 1.12.178
50. If yes, how many in ten years time?
48.1 > 5 1.12.179
48.2 Between 5 and 10 1.12.180
48.3 Between 10 and 15 1.12.181
48.4 Between 15 and 20 1.12.182
48.5 < 20 1.12.183
51. Do you normally attend counselling after the flooding has happened?
49.1 Yes 1.12.184
49.2 No 1.12.185
52. Can you explain why if you do?

89