Embed Size (px)
Citation preview
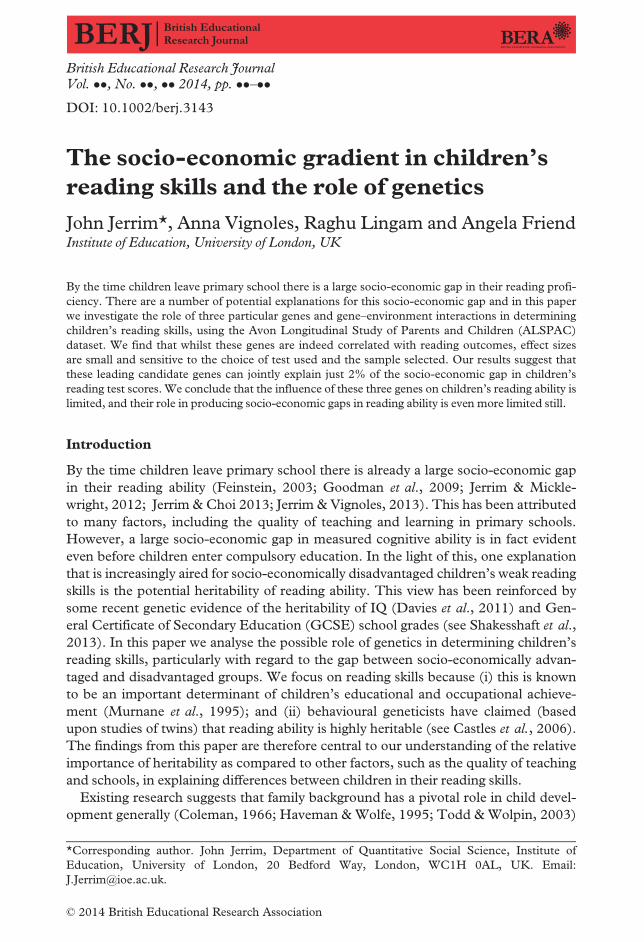
The socio-economic gradient in children’s
reading skills and the role of genetics
John Jerrim*, Anna Vignoles, Raghu Lingam and Angela FriendInstitute of Education, University of London, UK
By the time children leave primary school there is a large socio-economic gap in their reading profi-
ciency. There are a number of potential explanations for this socio-economic gap and in this paper
we investigate the role of three particular genes and gene–environment interactions in determining
children’s reading skills, using the Avon Longitudinal Study of Parents and Children (ALSPAC)
dataset. We find that whilst these genes are indeed correlated with reading outcomes, effect sizes
are small and sensitive to the choice of test used and the sample selected. Our results suggest that
these leading candidate genes can jointly explain just 2% of the socio-economic gap in children’s
reading test scores. We conclude that the influence of these three genes on children’s reading ability is
limited, and their role in producing socio-economic gaps in reading ability is even more limited still.
Introduction
By the time children leave primary school there is already a large socio-economic gap
in their reading ability (Feinstein, 2003; Goodman et al., 2009; Jerrim & Mickle-
wright, 2012; Jerrim & Choi 2013; Jerrim & Vignoles, 2013). This has been attributed
to many factors, including the quality of teaching and learning in primary schools.
However, a large socio-economic gap in measured cognitive ability is in fact evident
even before children enter compulsory education. In the light of this, one explanation
that is increasingly aired for socio-economically disadvantaged children’s weak reading
skills is the potential heritability of reading ability. This view has been reinforced by
some recent genetic evidence of the heritability of IQ (Davies et al., 2011) and Gen-
eral Certificate of Secondary Education (GCSE) school grades (see Shakesshaft et al.,
2013). In this paper we analyse the possible role of genetics in determining children’s
reading skills, particularly with regard to the gap between socio-economically advan-
taged and disadvantaged groups. We focus on reading skills because (i) this is known
to be an important determinant of children’s educational and occupational achieve-
ment (Murnane et al., 1995); and (ii) behavioural geneticists have claimed (based
upon studies of twins) that reading ability is highly heritable (see Castles et al., 2006).
The findings from this paper are therefore central to our understanding of the relative
importance of heritability as compared to other factors, such as the quality of teaching
and schools, in explaining differences between children in their reading skills.
Existing research suggests that family background has a pivotal role in child devel-
opment generally (Coleman, 1966; Haveman &Wolfe, 1995; Todd &Wolpin, 2003)
*Corresponding author. John Jerrim, Department of Quantitative Social Science, Institute of
Education, University of London, 20 Bedford Way, London, WC1H 0AL, UK. Email:
© 2014 British Educational Research Association
British Educational Research JournalVol. ��, No. ��, �� 2014, pp. ��–��DOI: 10.1002/berj.3143
with certain mediating factors, such as parental education and aspirations, being par-
ticularly important (Behrman & Rosenzweig, 2002; Black et al., 2005; Cunha &
Heckman, 2008; Goodman et al., 2009). The mechanisms by which family back-
ground and low socio-economic status impact on child development are myriad,
complex and involve the interaction of the social and the biological (see a recent
review on the contribution of neuroscience to our understanding of socio-economic
differences by Hackman et al., 2010). Yet there is much about the role of family back-
ground that we still do not understand (Haveman &Wolfe, 1995). There is an expec-
tation that genetic factors, and particularly their interaction with the environment,
will shed new light on this important issue (Pluess & Belsky, 2011; Ellis et al., 2011;
Mitchell et al., 2011). In this paper we make a contribution to this emerging field by
investigating the association between family background, three suspected genetic risk
factors (DCDC2, KIAA0319 and CMIP) and children’s reading test scores.
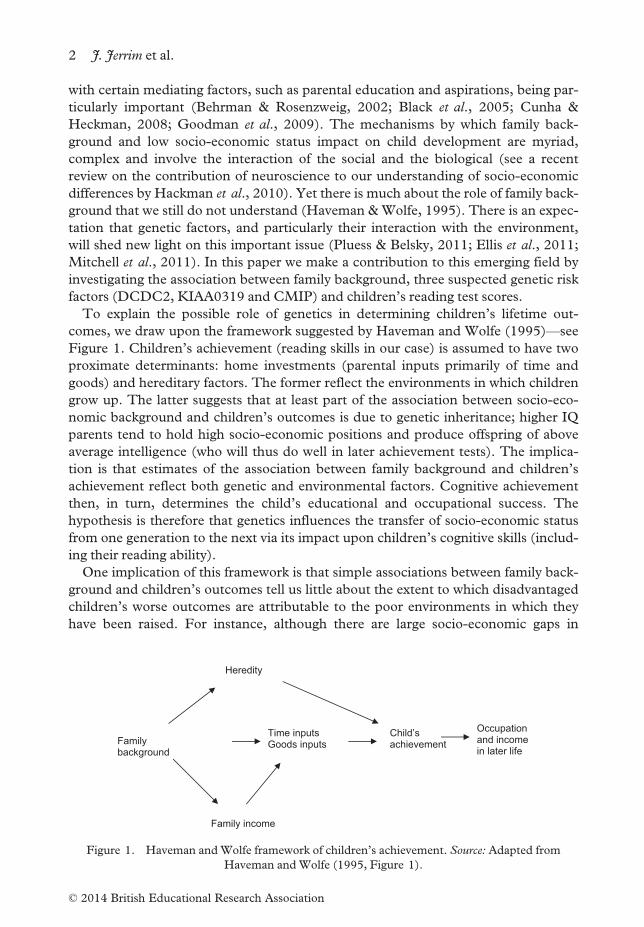
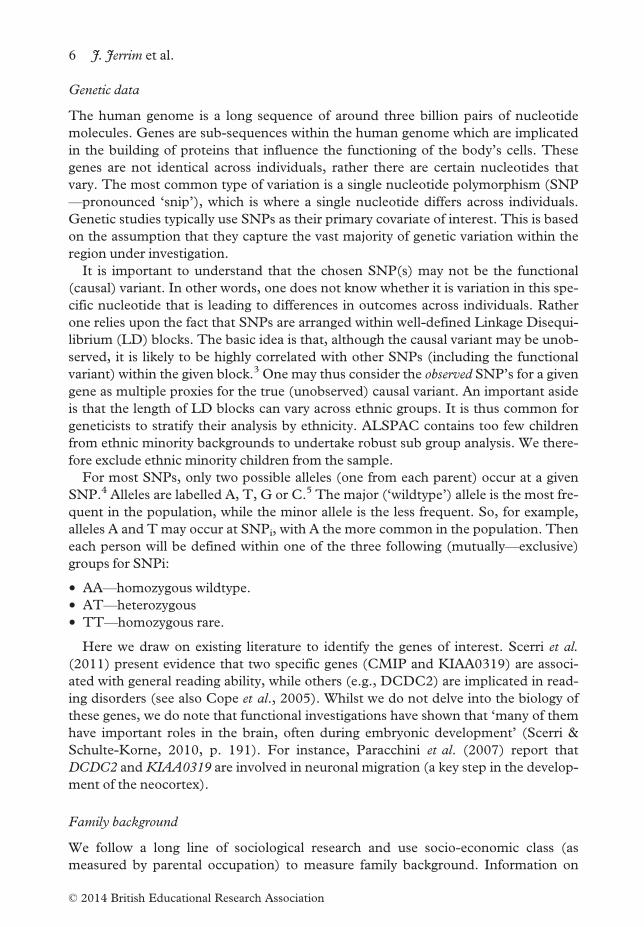
To explain the possible role of genetics in determining children’s lifetime out-
comes, we draw upon the framework suggested by Haveman and Wolfe (1995)—see
Figure 1. Children’s achievement (reading skills in our case) is assumed to have two
proximate determinants: home investments (parental inputs primarily of time and
goods) and hereditary factors. The former reflect the environments in which children
grow up. The latter suggests that at least part of the association between socio-eco-
nomic background and children’s outcomes is due to genetic inheritance; higher IQ
parents tend to hold high socio-economic positions and produce offspring of above
average intelligence (who will thus do well in later achievement tests). The implica-
tion is that estimates of the association between family background and children’s
achievement reflect both genetic and environmental factors. Cognitive achievement
then, in turn, determines the child’s educational and occupational success. The
hypothesis is therefore that genetics influences the transfer of socio-economic status
from one generation to the next via its impact upon children’s cognitive skills (includ-
ing their reading ability).
One implication of this framework is that simple associations between family back-
ground and children’s outcomes tell us little about the extent to which disadvantaged
children’s worse outcomes are attributable to the poor environments in which they
have been raised. For instance, although there are large socio-economic gaps in
Family background
Time inputs Goods inputs
Child’s achievement
Family income
Heredity
Occupationand incomein later life
Figure 1. Haveman andWolfe framework of children’s achievement. Source: Adapted from
Haveman andWolfe (1995, Figure 1).
2 J. Jerrim et al.
© 2014 British Educational Research Association
children’s cognitive skills at an early age (Feinstein, 2003; Goodman et al., 2009;
Jerrim & Vignoles, 2013), little work has considered the extent to which this is due to
genetic (G) influences, or their interaction with the environment (G*E). Conse-
quently, by ignoring the possible role of genetics, potentially important variables are
missing frommost empirical models of social stratification research.
Yet the role of genetics in the intergenerational transmission process has a contro-
versial past in social science. In The bell curve—the infamous book written by Herrn-
stein and Murray (1994)—it was claimed that intergenerational worklessness is (to a
large extent) genetically determined: ‘the tendency to be unemployed may run in the
genes of a family about as certainly as bad teeth do now’.
Others have claimed that intelligence has a genetic basis (Saunders, 2010):
If people entering middle class jobs tend to be more intelligent, and if they select more
intelligent partners, then (assuming that intelligence has some genetic basis) it must be the
case that the children they produce will tend to be relatively intelligent as well.
And it is this that drives social mobility (Nielsen & Roos, 2011): ‘Sons and daughters
from more prestigious origins may disproportionately end up in more prestigious des-
tinations simply because they are more likely than offspring from less prestigious ori-
gins to inherit genes that allow entry into more prestigious destinations’. Although
these views may be unpopular, they have been a recurring theme within social science
research for over 50 years (see, for instance, Jensen 1968).
Such arguments have drawn heavily upon research comparing outcomes for identi-
cal (monozygotic—MZ) and non-identical (dizygotic—DZ) twins. As the former
(MZ) share all their genes in common, while the later (DZ) share just 50%, one is
able (under certain assumptions) to estimate the extent to which a given outcome is
determined by ‘nature’ (heredity) or ‘nurture’ (environment). With regard to chil-
dren’s reading skills, twin-studies have typically found heritability to be high (Scerri
& Schulte-Korne, 2010). Light et al. (1998) suggested that 40% of the variance in
developmental dyslexia could be accounted for by genetic variation. Petrill et al.
(2006) report a similar figure, while Gayan and Olson (2001) and Davies et al.
(2001) both suggest heritability is above 50%. Attempts have also been made to
investigate heritability of general reading ability (as distinct from reading disorders).
Harlarr et al. (2005) report that genetic factors account for 75% of the variance in
reading skills, while Gayan and Olson (2003) suggest it is even higher (85%). In other
words, genetics is the dominant factor.
However, it is important to recognise the significant limitations of twin studies
(and others with similar designs). Firstly, genetic effects are not directly observed.
Rather any difference in outcomes between MZ and DZ twins is only inferred to be
due to genetics. This invokes the ‘equal environments’ assumption—that environ-
mental factors co-vary equally for identical and non-identical twins. This may not
hold if, for instance, MZ twins experience more similar environments than their DZ
counterparts (e.g., parents are more likely to treat identical twins the same way than
non-identical twins). Secondly, twin studies do not reveal which genes or which envi-
ronments lead to the differences that we observe. As a consequence, academics and
policymakers are left with little insight as to how to intervene. Indeed, various authors
(Goldberger, 1979; Manski, 2011) have argued that the concept of heritability
Socio-economics and genetics in children’s reading skills 3
© 2014 British Educational Research Association
actually has little policy relevance as a consequence of this. Thirdly, Benjamin et al.
(2012, page 11) note that estimates of heritability from twin studies assume that
genes have a linear and additive influence on outcomes, and that there is no assorta-
tive mating amongst parents on genetic factors. Clearly, these are strong assumptions
that seem unlikely to hold.
Finally, perhaps the greatest scepticism surrounds the idea that nature can be sepa-
rated from nurture. Such views are based on a deterministic view whereby, since
DNA is largely fixed, so too must be the impact of genes on children’s outcomes. But
recent advances in genetic research have suggested that gene expression is actually
influenced by the environment to which it is exposed. In other words, the two interact
(Jaenisch & Bird, 2003; Hackman et al., 2010).1 Social scientists have started to
acknowledge the potential importance of gene-environment interactions (Heckman,
2007), and that models assuming genes and environment have independent effects
(as in the Haveman and Wolfe framework—Figure 1) may be inadequate. Further,
the recent addition of genetic information to major cohort studies (e.g., AD-
HEALTH, Understanding Society, Life Study, ALSPAC) offers researchers the
opportunity to look at gene environment interaction and overcome some of the prob-
lems that arise with twin studies. Hence the influence of genetics on outcomes need
no longer be inferred, rather these effects can be directly estimated. With observable
genetic data, one can directly examine the bio-molecular evidence for gene-by-envi-
ronment interactions, as we do in this paper.
Our analysis proceeds as follows. Firstly, we re-examine the link between particular
genes identified in the genetic literature and children’s reading skills. This extends
the existing literature by considering the sensitivity of findings to (i) the use of differ-
ent reading tests; and (ii) different sample selections. Secondly, we shall examine
whether the leading candidate genes are indeed unevenly distributed across social
classes. This conditionmust hold if these genetic factors are to explain (by themselves)
the socio-economic gradient in children’s reading skills (i.e., without interacting with
the environment that surrounds them). Thirdly, we estimate a simple linear regres-
sion model of children’s reading ability, with and without controlling for these three
genes. Our interest is in the extent to which the socio-economic achievement gap is
reduced when these potential explanatory factors are included in the model. Finally,
we explore the possibility of gene-by-environment (G*E) interactions. Previous workin this area has distinguished between two competing models of G*E—the diathesis–stress model and the bio-ecological model (Pennington et al., 2009). The former sug-
gests that genetic vulnerability coupled with environmental stress will lead to
increased risk of a disorder (e.g., dyslexia). The bio-ecological model, on the other
hand, suggests that it is only enriched environments that allow genetic differences to
be realised (and hence heritability of a disorder will actually be higher in enriched
environments).2 We shall consider which (if any) of these models holds in our appli-
cation.
Our results suggest that:
• Despite the growing number of studies showing a genetic basis to children’s read-
ing skill, the effect sizes from the leading candidate genes we examine tend to be
very small and sensitive to the choice of test used and the sample selected.
4 J. Jerrim et al.
© 2014 British Educational Research Association
• Even if these specific genes do influence children’s reading skills, there is little evi-
dence that they are distributed unevenly across socio-economic groups.
• We found little evidence of gene-by-environment interactions.
• Consequently, the leading candidate genes can jointly explain just 2% of the socio-
economic gap in children’s reading skills.
Of course, one cannot generalise from this to conclude that genetics factors (in gen-
eral) have little importance in the development of reading ability and indeed many
other studies have found that individual genes explain very little variation in specific
outcomes (Davies et al., 2011); considering the cumulative effect of a wider range of
genes might lead to a different conclusion. However, the evidence presented in this
paper suggests that a wider range of genes will need to be considered before we can
advance the view that genetics plays a major role in this particular aspect of child
development.
The second section now introduces the ALSPAC dataset. Results are presented in
the third section, with conclusions following in the fourth section.
Data andmethods
Sample selection and missing data
Between April 1991 and December 1992 all pregnant women in the Avon district of
England were asked to participate in a longitudinal birth cohort, The Avon Study of
Parents and Children (ALSPAC). 14,541 mothers were recruited into the study.
They and their children have been re-interviewed at regular intervals (Boyd et al.,
2012). A large number of participating children were invited to special clinic sessions,
where a series of diagnostic tests were performed (including general intelligence tests
and reading skills assessments). Genotypic information has also been collected. We
describe the sample design, issues of sample selection, measurement of family back-
ground, reading tests and empirical methodology in the sub-sections below.
The ALSPAC dataset contains information on children within one particular
district of England. Although it cannot be considered representative of the national
population, its demographic composition is broadly similar to that of the country as a
whole. There were roughly 20,000 conceptions during the study period. 14,541
mothers took part and provided information in at least one survey wave (Boyd et al.,
2012). Genetic information is available for 10,678 respondents. This leaves a sample
of 10,269 children who form the core of our analysis.
A limitation of ALSPAC is that some respondents are missing pieces of key infor-
mation. For instance, the special clinic sessions described above were only attended
by a non-random selection of the population (e.g., of the 10,269 children in our core
sample, only 6104 took part in both the age 7 and age 8 clinics). Analysis (not pre-
sented for brevity) suggests that clinic participants came from more advantageous
family backgrounds and had higher than average levels of school achievement. We
discuss this issue further, when reviewing the existing literature on the link between
reading test scores and the three candidate genes.
Socio-economics and genetics in children’s reading skills 5
© 2014 British Educational Research Association
Genetic data
The human genome is a long sequence of around three billion pairs of nucleotide
molecules. Genes are sub-sequences within the human genome which are implicated
in the building of proteins that influence the functioning of the body’s cells. These
genes are not identical across individuals, rather there are certain nucleotides that
vary. The most common type of variation is a single nucleotide polymorphism (SNP
—pronounced ‘snip’), which is where a single nucleotide differs across individuals.
Genetic studies typically use SNPs as their primary covariate of interest. This is based
on the assumption that they capture the vast majority of genetic variation within the
region under investigation.
It is important to understand that the chosen SNP(s) may not be the functional
(causal) variant. In other words, one does not know whether it is variation in this spe-
cific nucleotide that is leading to differences in outcomes across individuals. Rather
one relies upon the fact that SNPs are arranged within well-defined Linkage Disequi-
librium (LD) blocks. The basic idea is that, although the causal variant may be unob-
served, it is likely to be highly correlated with other SNPs (including the functional
variant) within the given block.3 One may thus consider the observed SNP’s for a given
gene as multiple proxies for the true (unobserved) causal variant. An important aside
is that the length of LD blocks can vary across ethnic groups. It is thus common for
geneticists to stratify their analysis by ethnicity. ALSPAC contains too few children
from ethnic minority backgrounds to undertake robust sub group analysis. We there-
fore exclude ethnic minority children from the sample.
For most SNPs, only two possible alleles (one from each parent) occur at a given
SNP.4 Alleles are labelled A, T, G or C.5 The major (‘wildtype’) allele is the most fre-
quent in the population, while the minor allele is the less frequent. So, for example,
alleles A and Tmay occur at SNPi, with A the more common in the population. Then
each person will be defined within one of the three following (mutually—exclusive)
groups for SNPi:
• AA—homozygous wildtype.
• AT—heterozygous
• TT—homozygous rare.
Here we draw on existing literature to identify the genes of interest. Scerri et al.
(2011) present evidence that two specific genes (CMIP and KIAA0319) are associ-
ated with general reading ability, while others (e.g., DCDC2) are implicated in read-
ing disorders (see also Cope et al., 2005). Whilst we do not delve into the biology of
these genes, we do note that functional investigations have shown that ‘many of them
have important roles in the brain, often during embryonic development’ (Scerri &
Schulte-Korne, 2010, p. 191). For instance, Paracchini et al. (2007) report that
DCDC2 andKIAA0319 are involved in neuronal migration (a key step in the develop-
ment of the neocortex).
Family background
We follow a long line of sociological research and use socio-economic class (as
measured by parental occupation) to measure family background. Information on
6 J. Jerrim et al.
© 2014 British Educational Research Association
parental occupation was reported by children’s mothers, placing both mothers and
fathers into one of five social class groups (professional, managerial/technical, skilled,
semi-skilled, unskilled). We use the higher of the mother’s and father’s occupation to
measure family background throughout our analysis. This strategy is commonly
used in social stratification research (Jackson et al., 2007; Jerrim, 2012). A series of
robustness tests have been undertaken to assess the sensitivity of results to the choice
of family background measure. The substantive conclusions drawn are robust to
various alternatives.6
Reading tests
There are two broad types of reading test contained within ALSPAC—those that
were part of the specially organised clinic sessions, and those that children sat as part
of national examinations at ages 7 and 11.7 Both have their strengths and limitations.
The clinic reading tests were undertaken in a one-to-one session with a trained asses-
sor and they may be more reliable than school exams (where ‘teaching to the test’,
large group distractions and exam technique may be confounding issues). Moreover,
as these clinics had an emphasis on medical diagnosis, the reading tests typically
focused upon specific aspects of reading ability (e.g., single word reading, reading
speed, comprehension) rather than reading as a broadly defined skill. A major diffi-
culty with the clinic data is, however, the large amount of missing information; of the
10,269 children in our sample, 2910 (28%) are missing information on age 7 clinic
test scores.
In contrast, the reading test score information available from national exams at ages
7 and 11 provide a broader measure of overall reading ability. Moreover, as children’s
performance in national exams at age 7 and age 11 has been linked into ALSPAC
from administrative records, missing data is not a significant problem for all state
school pupils. One could also argue that these tests are actually more relevant for
understanding social mobility, since demonstrating achievement in general reading
ability at school may well be more important for disadvantaged children’s prospects
in later life than any specific reading skill. Finally, school exam scores may be more
accurate as (a) the amount of assessment time is likely to have been greater than in
the ASLPAC clinic; (b) test results have been standardised across children; and (c)
national exams are likely to be higher stakes (i.e., children and their parents consider
them important) so children may put in more effort to reveal their true ability.
Investigating the link between the candidate genes and a range of different reading
test scores (and sensitivity to the resulting sample selections) is therefore an important
first step in our analysis. Previous studies (see Scerri et al., 2011) were only able to
test for associations between the genes considered in this paper and specific reading
test scores (e.g., age 7 single WORD reading). One of the contributions of this paper
is in investigating whether associations between genotype (SNPs) and phenotype
(reading ability) holds across the following range of tests:
• Single WORD reading test at age 7.
• Key Stage 1 (national examination) reading test score at age 7.
• NEALE words per minute (speed) at age 9.
Socio-economics and genetics in children’s reading skills 7
© 2014 British Educational Research Association
• NEALE comprehension at age 9.
• NEALE accuracy score at age 9.
• Key Stage 2 (national examination) reading test score at age 11.
Throughout our analysis we standardise each measure to have a mean of 0 and
standard deviation of 1.
Empirical methodology
Firstly, we model the link between each of the candidate genes and children’s reading
ability. Our strategy is to estimate a simple bivariate OLS regression model, following
standard practice in the genetics literature. This is specified:
Yi ¼ aþ b � SNPi þ eð1Þ
Where:
Yi= Reading test score of individual i.
SNPi = The SNP under consideration for individual i.
We also follow convention by entering SNPs into the model as a continuous, linear
term. The value assigned to an individual for a given SNP depends upon the number
of suspected risk alleles they have at that location (i.e., the alleles that are associated
with lower test scores).8 This is known in the genetics literature as the allelic trend
model, with the estimated b coefficient representing the change in reading test score
per one allele change in genotype. Geneticists typically estimate a model of this form
for each SNP under investigation.9 Although we recognise that there may be other
ways to use these data (e.g., to combine information from multiple SNP’s within the
same LD block to proxy the unobserved functional genetic factor), we continue with
the single SNP approach for consistency with the existing literature. Recall that in
undertaking this preliminary analysis our concern is whether the relationship between
the candidate genes and children’s reading ability holds across different reading tests
and sample selections.
We then consider the extent to which the three candidate genes can explain socio-
economic achievement gaps. We consider the distribution of alleles within each of the
SNPs, and whether this varies across social class groups. In other words, is there an
association between social class and these particular observable genetic factors? If we
find no association this cannot refute the claims of some social scientists of a link
between observable genetic factors and socio-economic status (see Nielsen & Roos,
2011)—but it does cast some doubt on such claims in the context of reading at least.
This hypothesis is tested by simply conducting a chi-squared test for independence
between each SNP and socio-economic status.
This is then followed by the estimation of two regression models:
Yi ¼ aþ c1 � SESi þ eð2ÞYi ¼ aþ c2 � SESi þ dSNPi þ eð3Þ
8 J. Jerrim et al.
© 2014 British Educational Research Association
Where:
• SES = A vector of four dummy variables representing socio-economic group (Ref:
professional occupation)
• SNP = A vector of all SNP’s available to us from the three candidate genes.
Estimates from the first model (c1) reveal the total association between socio-eco-
nomic status and reading test scores—via all possible mechanisms by which such
associations may occur (including both nature and nurture). The estimates for the
SES parameters from the second model (c2) then reveal the extent to which socio-
economic status influences reading test scores through all mechanisms other than via
the three candidate genes. Note that in these models we control for all the SNPs for
each of the candidate genes together.10 Thus our primary interest is in the quantityc1�c2c1
, namely the proportion of the socio-economic achievement gap that these three
genes explain.
Lastly, we have already recognised that genes and family environment may interact.
Thus our final model is specified:
Yi ¼ aþ c3 � SESi þ dSNPi þ u � SESi � SNPi þ eð4Þ
For consistency with the existing literature on gene-by-environment interactions,
each SNP is tested one at a time. Our primary interest is in whether the diathesis
stress or bio-ecological model of interaction holds, as described in the introduction.
The former would imply that / > 0 such that the genetic vulnerability (more risk
alleles) will have an additional negative impact on reading scores in home environ-
ments with more environmental stress (lower SES). The bio-ecological hypothesis,
on the other hand, would suggest that the negative impact of the SNP on reading will
only be observed in enriched home environments - where genetic factors will domi-
nate over environment (thus / > 0).
Results
In this section we present summary findings for ease of interpretation. A full set of
parameter estimates for all genes and SNPs under investigation are available on
request.
Re-examining the link between the candidate genes and children’s reading test scores
Table 1 presents some of the results from Scerri et al. (2011) and our replication of
their findings. The main focus of most quantitative genetic studies is whether the
association between genotype (SNPs) and phenotype (reading test scores) is statisti-
cally significant at the 5% level. There is clear evidence that this holds for most of
these SNPs. However, it is also worth noting that effect sizes are relatively small—a
one allele change on a given SNP is typically associated with a 0.05 to a 0.10 standard
deviation change in reading test scores. As a rule of thumb, an effect size of 0.20 is
considered to be a magnitude likely to be of policy importance in the education litera-
ture. Hence these are modest differences. The columns on the right hand side of
Socio-economics and genetics in children’s reading skills 9
© 2014 British Educational Research Association
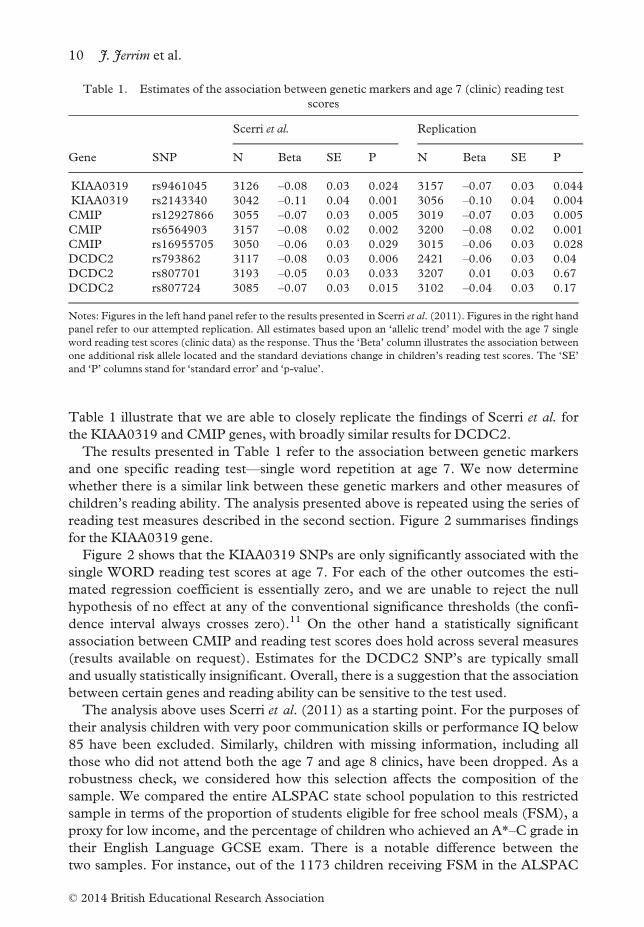
Table 1 illustrate that we are able to closely replicate the findings of Scerri et al. for
the KIAA0319 and CMIP genes, with broadly similar results for DCDC2.
The results presented in Table 1 refer to the association between genetic markers
and one specific reading test—single word repetition at age 7. We now determine
whether there is a similar link between these genetic markers and other measures of
children’s reading ability. The analysis presented above is repeated using the series of
reading test measures described in the second section. Figure 2 summarises findings
for the KIAA0319 gene.
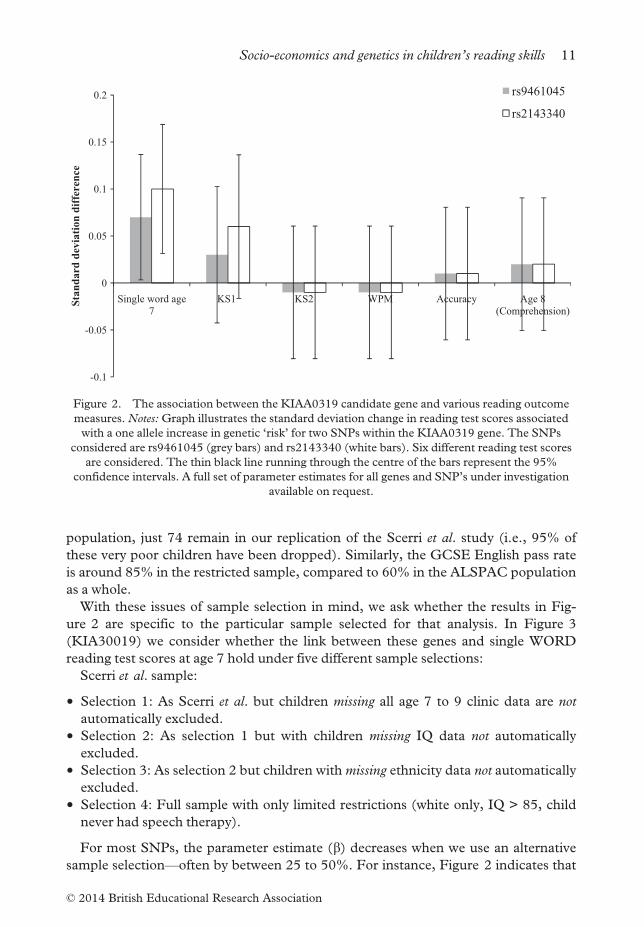
Figure 2 shows that the KIAA0319 SNPs are only significantly associated with the
single WORD reading test scores at age 7. For each of the other outcomes the esti-
mated regression coefficient is essentially zero, and we are unable to reject the null
hypothesis of no effect at any of the conventional significance thresholds (the confi-
dence interval always crosses zero).11 On the other hand a statistically significant
association between CMIP and reading test scores does hold across several measures
(results available on request). Estimates for the DCDC2 SNP’s are typically small
and usually statistically insignificant. Overall, there is a suggestion that the association
between certain genes and reading ability can be sensitive to the test used.
The analysis above uses Scerri et al. (2011) as a starting point. For the purposes of
their analysis children with very poor communication skills or performance IQ below
85 have been excluded. Similarly, children with missing information, including all
those who did not attend both the age 7 and age 8 clinics, have been dropped. As a
robustness check, we considered how this selection affects the composition of the
sample. We compared the entire ALSPAC state school population to this restricted
sample in terms of the proportion of students eligible for free school meals (FSM), a
proxy for low income, and the percentage of children who achieved an A*–C grade in
their English Language GCSE exam. There is a notable difference between the
two samples. For instance, out of the 1173 children receiving FSM in the ALSPAC
Table 1. Estimates of the association between genetic markers and age 7 (clinic) reading test
scores
Gene SNP
Scerri et al. Replication
N Beta SE P N Beta SE P
KIAA0319 rs9461045 3126 –0.08 0.03 0.024 3157 –0.07 0.03 0.044
KIAA0319 rs2143340 3042 –0.11 0.04 0.001 3056 –0.10 0.04 0.004
CMIP rs12927866 3055 –0.07 0.03 0.005 3019 –0.07 0.03 0.005
CMIP rs6564903 3157 –0.08 0.02 0.002 3200 –0.08 0.02 0.001
CMIP rs16955705 3050 –0.06 0.03 0.029 3015 –0.06 0.03 0.028
DCDC2 rs793862 3117 –0.08 0.03 0.006 2421 –0.06 0.03 0.04
DCDC2 rs807701 3193 –0.05 0.03 0.033 3207 0.01 0.03 0.67
DCDC2 rs807724 3085 –0.07 0.03 0.015 3102 –0.04 0.03 0.17
Notes: Figures in the left hand panel refer to the results presented in Scerri et al. (2011). Figures in the right hand
panel refer to our attempted replication. All estimates based upon an ‘allelic trend’ model with the age 7 single
word reading test scores (clinic data) as the response. Thus the ‘Beta’ column illustrates the association between
one additional risk allele located and the standard deviations change in children’s reading test scores. The ‘SE’
and ‘P’ columns stand for ‘standard error’ and ‘p-value’.
10 J. Jerrim et al.
© 2014 British Educational Research Association
population, just 74 remain in our replication of the Scerri et al. study (i.e., 95% of
these very poor children have been dropped). Similarly, the GCSE English pass rate
is around 85% in the restricted sample, compared to 60% in the ALSPAC population
as a whole.
With these issues of sample selection in mind, we ask whether the results in Fig-
ure 2 are specific to the particular sample selected for that analysis. In Figure 3
(KIA30019) we consider whether the link between these genes and single WORD
reading test scores at age 7 hold under five different sample selections:
Scerri et al. sample:
• Selection 1: As Scerri et al. but children missing all age 7 to 9 clinic data are not
automatically excluded.
• Selection 2: As selection 1 but with children missing IQ data not automatically
excluded.
• Selection 3: As selection 2 but children withmissing ethnicity data not automatically
excluded.
• Selection 4: Full sample with only limited restrictions (white only, IQ > 85, child
never had speech therapy).
For most SNPs, the parameter estimate (b) decreases when we use an alternative
sample selection—often by between 25 to 50%. For instance, Figure 2 indicates that
-0.1
-0.05
0
0.05
0.1
0.15
0.2
Single word age 7
KS1 KS2 WPM Accuracy Age 8 (Comprehension)
Stan
dard
dev
iatio
n di
ffere
nce
rs9461045
rs2143340
Figure 2. The association between the KIAA0319 candidate gene and various reading outcome
measures.Notes:Graph illustrates the standard deviation change in reading test scores associated
with a one allele increase in genetic ‘risk’ for two SNPs within the KIAA0319 gene. The SNPs
considered are rs9461045 (grey bars) and rs2143340 (white bars). Six different reading test scores
are considered. The thin black line running through the centre of the bars represent the 95%
confidence intervals. A full set of parameter estimates for all genes and SNP’s under investigation
available on request.
Socio-economics and genetics in children’s reading skills 11
© 2014 British Educational Research Association
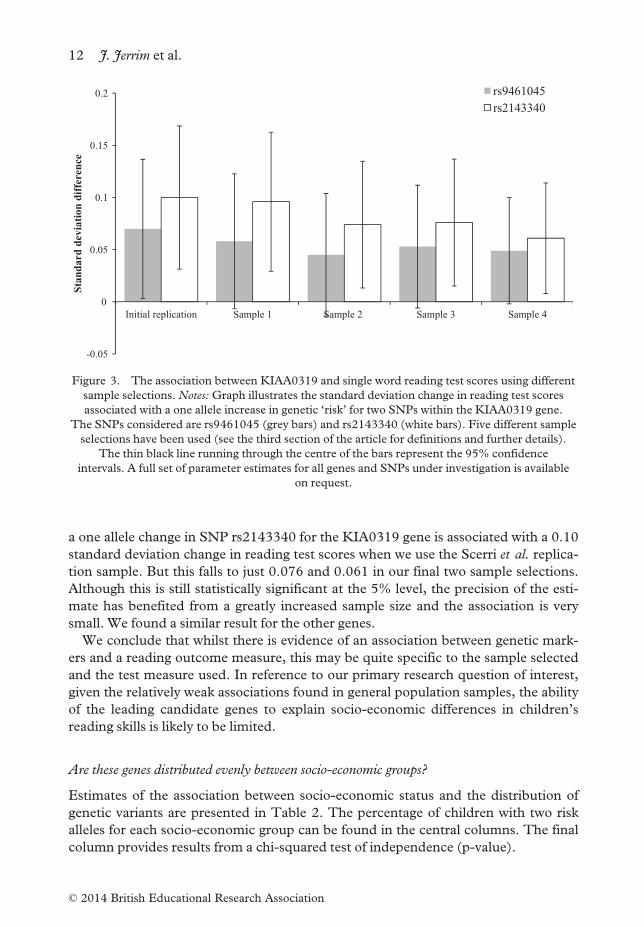
a one allele change in SNP rs2143340 for the KIA0319 gene is associated with a 0.10
standard deviation change in reading test scores when we use the Scerri et al. replica-
tion sample. But this falls to just 0.076 and 0.061 in our final two sample selections.
Although this is still statistically significant at the 5% level, the precision of the esti-
mate has benefited from a greatly increased sample size and the association is very
small. We found a similar result for the other genes.
We conclude that whilst there is evidence of an association between genetic mark-
ers and a reading outcome measure, this may be quite specific to the sample selected
and the test measure used. In reference to our primary research question of interest,
given the relatively weak associations found in general population samples, the ability
of the leading candidate genes to explain socio-economic differences in children’s
reading skills is likely to be limited.
Are these genes distributed evenly between socio-economic groups?
Estimates of the association between socio-economic status and the distribution of
genetic variants are presented in Table 2. The percentage of children with two risk
alleles for each socio-economic group can be found in the central columns. The final
column provides results from a chi-squared test of independence (p-value).
-0.05
0
0.05
0.1
0.15
0.2
Initial replication Sample 1 Sample 2 Sample 3 Sample 4
Stan
dard
dev
iatio
n di
ffere
nce
rs9461045rs2143340
Figure 3. The association between KIAA0319 and single word reading test scores using different
sample selections.Notes:Graph illustrates the standard deviation change in reading test scores
associated with a one allele increase in genetic ‘risk’ for two SNPs within the KIAA0319 gene.
The SNPs considered are rs9461045 (grey bars) and rs2143340 (white bars). Five different sample
selections have been used (see the third section of the article for definitions and further details).
The thin black line running through the centre of the bars represent the 95% confidence
intervals. A full set of parameter estimates for all genes and SNPs under investigation is available
on request.
12 J. Jerrim et al.
© 2014 British Educational Research Association
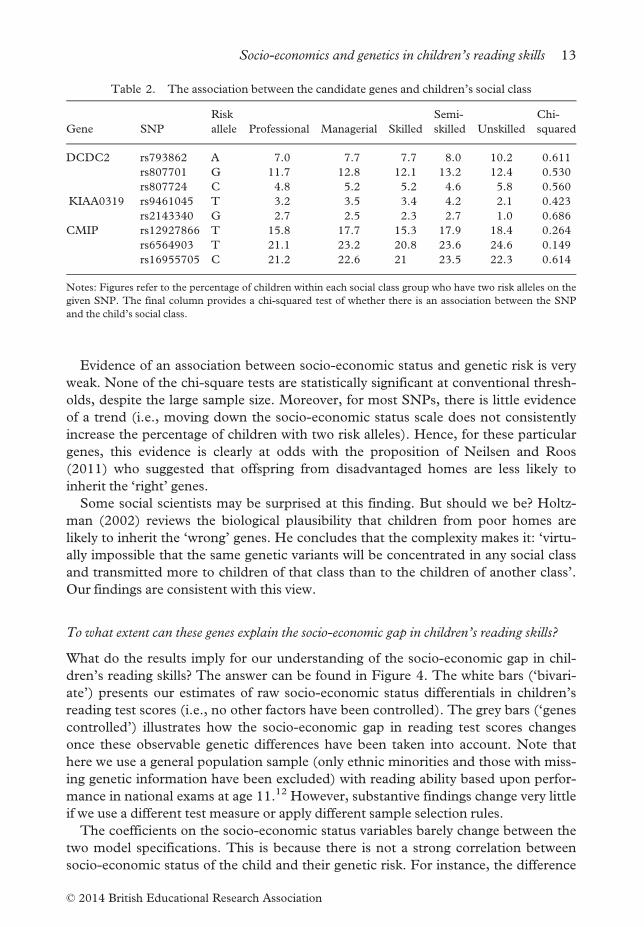
Evidence of an association between socio-economic status and genetic risk is very
weak. None of the chi-square tests are statistically significant at conventional thresh-
olds, despite the large sample size. Moreover, for most SNPs, there is little evidence
of a trend (i.e., moving down the socio-economic status scale does not consistently
increase the percentage of children with two risk alleles). Hence, for these particular
genes, this evidence is clearly at odds with the proposition of Neilsen and Roos
(2011) who suggested that offspring from disadvantaged homes are less likely to
inherit the ‘right’ genes.
Some social scientists may be surprised at this finding. But should we be? Holtz-
man (2002) reviews the biological plausibility that children from poor homes are
likely to inherit the ‘wrong’ genes. He concludes that the complexity makes it: ‘virtu-
ally impossible that the same genetic variants will be concentrated in any social class
and transmitted more to children of that class than to the children of another class’.
Our findings are consistent with this view.
To what extent can these genes explain the socio-economic gap in children’s reading skills?
What do the results imply for our understanding of the socio-economic gap in chil-
dren’s reading skills? The answer can be found in Figure 4. The white bars (‘bivari-
ate’) presents our estimates of raw socio-economic status differentials in children’s
reading test scores (i.e., no other factors have been controlled). The grey bars (‘genes
controlled’) illustrates how the socio-economic gap in reading test scores changes
once these observable genetic differences have been taken into account. Note that
here we use a general population sample (only ethnic minorities and those with miss-
ing genetic information have been excluded) with reading ability based upon perfor-
mance in national exams at age 11.12 However, substantive findings change very little
if we use a different test measure or apply different sample selection rules.
The coefficients on the socio-economic status variables barely change between the
two model specifications. This is because there is not a strong correlation between
socio-economic status of the child and their genetic risk. For instance, the difference
Table 2. The association between the candidate genes and children’s social class
Gene SNP
Risk
allele Professional Managerial Skilled
Semi-
skilled Unskilled
Chi-
squared
DCDC2 rs793862 A 7.0 7.7 7.7 8.0 10.2 0.611
rs807701 G 11.7 12.8 12.1 13.2 12.4 0.530
rs807724 C 4.8 5.2 5.2 4.6 5.8 0.560
KIAA0319 rs9461045 T 3.2 3.5 3.4 4.2 2.1 0.423
rs2143340 G 2.7 2.5 2.3 2.7 1.0 0.686
CMIP rs12927866 T 15.8 17.7 15.3 17.9 18.4 0.264
rs6564903 T 21.1 23.2 20.8 23.6 24.6 0.149
rs16955705 C 21.2 22.6 21 23.5 22.3 0.614
Notes: Figures refer to the percentage of children within each social class group who have two risk alleles on the
given SNP. The final column provides a chi-squared test of whether there is an association between the SNP
and the child’s social class.
Socio-economics and genetics in children’s reading skills 13
© 2014 British Educational Research Association
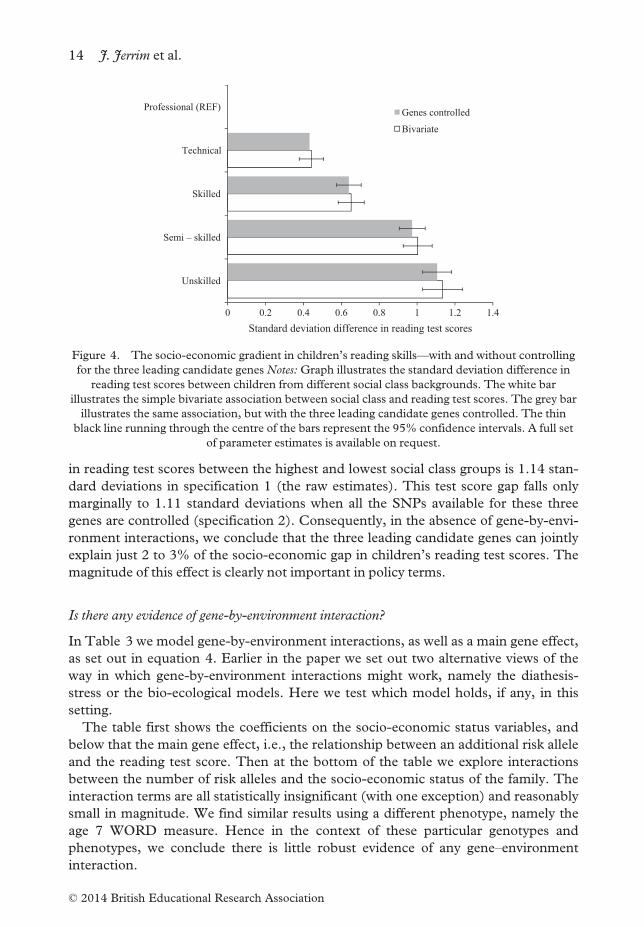
in reading test scores between the highest and lowest social class groups is 1.14 stan-
dard deviations in specification 1 (the raw estimates). This test score gap falls only
marginally to 1.11 standard deviations when all the SNPs available for these three
genes are controlled (specification 2). Consequently, in the absence of gene-by-envi-
ronment interactions, we conclude that the three leading candidate genes can jointly
explain just 2 to 3% of the socio-economic gap in children’s reading test scores. The
magnitude of this effect is clearly not important in policy terms.
Is there any evidence of gene-by-environment interaction?
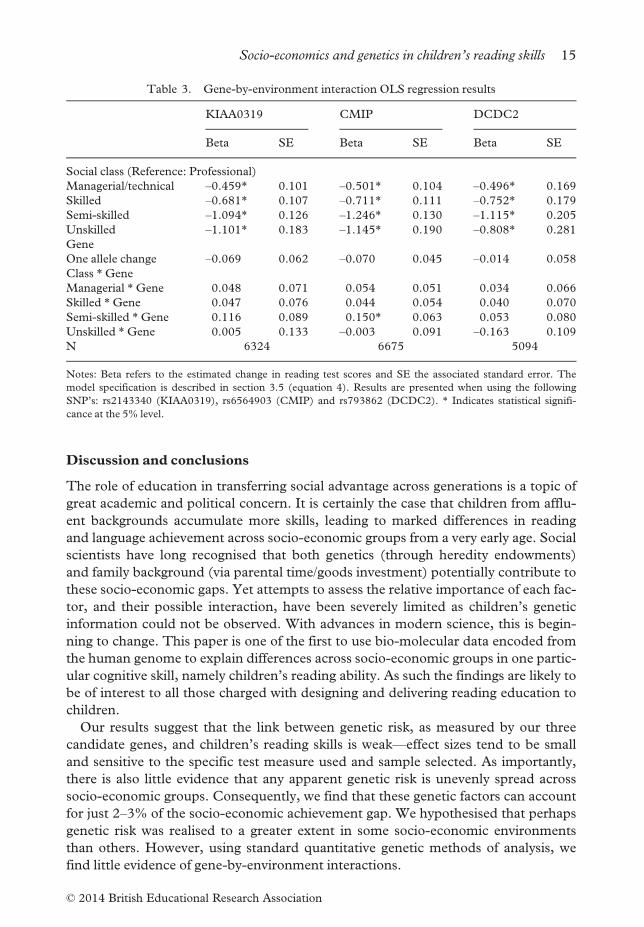
In Table 3 we model gene-by-environment interactions, as well as a main gene effect,
as set out in equation 4. Earlier in the paper we set out two alternative views of the
way in which gene-by-environment interactions might work, namely the diathesis-
stress or the bio-ecological models. Here we test which model holds, if any, in this
setting.
The table first shows the coefficients on the socio-economic status variables, and
below that the main gene effect, i.e., the relationship between an additional risk allele
and the reading test score. Then at the bottom of the table we explore interactions
between the number of risk alleles and the socio-economic status of the family. The
interaction terms are all statistically insignificant (with one exception) and reasonably
small in magnitude. We find similar results using a different phenotype, namely the
age 7 WORD measure. Hence in the context of these particular genotypes and
phenotypes, we conclude there is little robust evidence of any gene–environment
interaction.
0 0.2 0.4 0.6 0.8 1 1.2 1.4
Unskilled
Semi – skilled
Skilled
Technical
Professional (REF)
Standard deviation difference in reading test scores
Genes controlled
Bivariate
Figure 4. The socio-economic gradient in children’s reading skills—with and without controlling
for the three leading candidate genesNotes:Graph illustrates the standard deviation difference in
reading test scores between children from different social class backgrounds. The white bar
illustrates the simple bivariate association between social class and reading test scores. The grey bar
illustrates the same association, but with the three leading candidate genes controlled. The thin
black line running through the centre of the bars represent the 95% confidence intervals. A full set
of parameter estimates is available on request.
14 J. Jerrim et al.
© 2014 British Educational Research Association
Discussion and conclusions
The role of education in transferring social advantage across generations is a topic of
great academic and political concern. It is certainly the case that children from afflu-
ent backgrounds accumulate more skills, leading to marked differences in reading
and language achievement across socio-economic groups from a very early age. Social
scientists have long recognised that both genetics (through heredity endowments)
and family background (via parental time/goods investment) potentially contribute to
these socio-economic gaps. Yet attempts to assess the relative importance of each fac-
tor, and their possible interaction, have been severely limited as children’s genetic
information could not be observed. With advances in modern science, this is begin-
ning to change. This paper is one of the first to use bio-molecular data encoded from
the human genome to explain differences across socio-economic groups in one partic-
ular cognitive skill, namely children’s reading ability. As such the findings are likely to
be of interest to all those charged with designing and delivering reading education to
children.
Our results suggest that the link between genetic risk, as measured by our three
candidate genes, and children’s reading skills is weak—effect sizes tend to be small
and sensitive to the specific test measure used and sample selected. As importantly,
there is also little evidence that any apparent genetic risk is unevenly spread across
socio-economic groups. Consequently, we find that these genetic factors can account
for just 2–3% of the socio-economic achievement gap. We hypothesised that perhaps
genetic risk was realised to a greater extent in some socio-economic environments
than others. However, using standard quantitative genetic methods of analysis, we
find little evidence of gene-by-environment interactions.
Table 3. Gene-by-environment interaction OLS regression results
KIAA0319 CMIP DCDC2
Beta SE Beta SE Beta SE
Social class (Reference: Professional)
Managerial/technical –0.459* 0.101 –0.501* 0.104 –0.496* 0.169
Skilled –0.681* 0.107 –0.711* 0.111 –0.752* 0.179
Semi-skilled –1.094* 0.126 –1.246* 0.130 –1.115* 0.205
Unskilled –1.101* 0.183 –1.145* 0.190 –0.808* 0.281
Gene
One allele change –0.069 0.062 –0.070 0.045 –0.014 0.058
Class *Gene
Managerial *Gene 0.048 0.071 0.054 0.051 0.034 0.066
Skilled *Gene 0.047 0.076 0.044 0.054 0.040 0.070
Semi-skilled *Gene 0.116 0.089 0.150* 0.063 0.053 0.080
Unskilled *Gene 0.005 0.133 –0.003 0.091 –0.163 0.109
N 6324 6675 5094
Notes: Beta refers to the estimated change in reading test scores and SE the associated standard error. The
model specification is described in section 3.5 (equation 4). Results are presented when using the following
SNP’s: rs2143340 (KIAA0319), rs6564903 (CMIP) and rs793862 (DCDC2). * Indicates statistical signifi-
cance at the 5% level.
Socio-economics and genetics in children’s reading skills 15
© 2014 British Educational Research Association
These findings may seem puzzling, given the high rates of heritability that have
been found in previous work (based largely upon the study of twins). Yet our results
are far from unique. The problem of ‘missing heritability’ has been well documented
in the genetics literature and is a topic of hot debate (Purcell et al., 2009; Davies
et al., 2011). This controversy arises from the fact that many researchers are finding
that the variance of an outcome explained by known and observable genetic variants
is a lot lower than heritability estimates of twin studies imply. For instance, Benjamin
et al. (2012) note that twin studies suggest that 80% of the variability in height is due
to genetic factors, yet the total predictive power from a large number of genomes (and
180 SNP’s) is only 10% (Lango-Allen et al., 2010). It is clearly important for
researchers to understand the reasons for this. Possible explanations include a lack of
statistical power to identify all the small and cumulative effects that may be coming
from several genes. Further, we currently have limited prior knowledge of which
genes should be included in the analysis. Yet another plausible explanation is that the
assumptions made in twin studies may not hold, and that perhaps heritability of cer-
tain traits is not as high as many previously thought.
Given these methodological issues, our findings do not imply that one can dismiss
the role of genetics in the development of children’s reading skills and, more gener-
ally, socio-economic differences in later lifetime outcomes. Here we have only investi-
gated the impact of a small set of quite specific genes. As the literature on missing
heritability suggests, many more genes may be implicated in the reading process—possibly hundreds, each with small, independent effects. What social scientists, and
specifically those working in education, need to understand is that this field is very
much in its infancy—sequencing of the entire human genome is barely ten years old
and is only now becoming affordable on a large scale. Thus geneticists are still trying
to work out the function of different genes and how one can incorporate their many
different independent influences into statistical analyses. Genetic data is observa-
tional and thus establishing causality for any one particular gene is likely to be diffi-
cult, particularly given additional problems (e.g., very small effect sizes). The
implication for educational research, and studies into social stratification, is that the
availability of genotypic data is unlikely to have a significant impact on our under-
standing of the major factors influencing socio-economic differences in children’s
outcomes in the short term. Thus, for all the interest that social scientists have shown
in this field (Cunha et al., 2006; Heckman, 2007; Lundborg & Stenberg, 2009), the
reality is that the evidence base remains very limited.
In summary, in this study we are unable to provide evidence of a major role for
genes in determining children’s reading ability. More work is needed before academ-
ics and policymakers can accept the conventional wisdom that genes are of major
importance to key educational and other social science outcomes, in this case read-
ing.
Acknowledgements
This project has been funded by the ESRC ALSPAC large grant programme. We
would also like to thank Silvia Paracchini for her advice on genetic data
16 J. Jerrim et al.
© 2014 British Educational Research Association
NOTES
1 Epigenomics refers to the study of genomic modifications that alter gene expression, loosely meaning thestudy of gene-environment interactions. See Carey (2012) for the origins of epigenomics.
2 Interestingly, Pennington et al. (2009) note that most existing studies of gene-by-environment interactionhave found that the bio-ecological model is more likely to hold in the case of cognitive skills
3 This is because groups of SNP’s within LD blocks are likely to be transmitted from parents to childrentogether.
4 Also note that allele frequencies can vary across ethnic groups. This is another reason why genetic analysis isoften stratified across ethnicity
5 These stand for the DNA bases adenine (A), thymine (T), guanine (G) and cytosine (C)6 As discussed in the second section, the existing literature suggests there are a number of different aspects tothe family environment that impact on the child’s reading, such as how often the parent reads to the child orthe number of books in the home. Potentially, each of these more specific environmental factors might inter-act with individuals’ genes. However, as these individual factors explain much less of the variation in childreading scores as compared to socio-economic status, initially one would want to establish whether the rela-tionship between the major predictor, i.e., socio-economic status, and reading test scores is affected by includ-ing information on specific SNPs and equally whether there appears to be a gene-environment interaction.
7 Although these national exams examined children’s ability in English generally, here we focus just upon thereading component
8 Say, for example, an SNP is made up of the C or G alleles, where G is the risk. A person with an SNP com-prised of CC is assigned a value of 0, CG as a value of 1 and GG as a value of 2 (and thus an assumption oflinearity is imposed)
9 When a very large number of SNP’s are used, it is common for analysts to make a Bonferroni correction formultiple testing
10 An alternative would be to include one SNP from each gene in the model (rather than all SNPs available).Results are largely unchanged under this alternative approach.
11 One may note that sample sizes do change between the various estimates as the extent of missing data for thedifferent test scores varies. However, we find no evidence that it is this which is driving the result (i.e., similarsubstantive findings still hold when restricting samples to exactly the same group of children)
12 We focus on national exam scores here (rather than the clinic data) due to its relative completeness and hencegreater sample sizes.
References
Behrman, J. & Rosenzweig, M. (2002) Does increasing women’s schooling raise the schooling of
the next generation?, American Economic Review, 92(1), 323–334.Black, S., Devereux, P. & Salvanes, K. (2005) From the cradle of the labour market? The effect of
birth weight on adult outcomes?, The Quarterly Journal of Economics, 122(1), 409–439.Benjamin, D., Cesarini, D., Chabris, C., Glaeser, E., Laibson, D., Guðnason, V., Harris, T., Lau-
ner, L., Purcell, S., Smith, A., Johannesson, M., Beauchamp, J., Christakis, N., Atwood, C.,
Herbert, B., Freese, J., Hauser, R., Hauser, T., Magnusson, P., Grankvist, A., Hultman, C. &
Lichtenstein, P. (2012) The promises and pitfalls of genoeconomics, Annual Review of Econom-
ics, 4(1), 627–662.Boyd, A., Golding, J., Macleod, J., Lawlor, D., Fraser, A., Henderson, J., Molloy, L., Ness, A.,
Ring, S. & Davey-Smith, G. (2012) Cohort profile: The children of the 90—the index offspring
of the Avon Longitudinal Study of Parents and Children, International Journal of Epidemiology,
doi:10.1093/ije/dys064.
Carey, N. (2012) The epigenetics revolution: How modern biology is rewriting our understanding of genet-
ics, disease, and inheritance (New York, Columbia University Press).
Castles, A., Bates, T., Colheart, M., Luciano, M. & Martin, N. (2006) Cognitive modelling and
the behaviour genetics of reading, Journal of Research in Reading, 29(1), 92–103.Coleman, J.S. (1966) Equality of educational opportunity (Washington, DC, Government Printing
Office).
Cope, N., et al. (2005) Strong evidence that KIAA0319 on Chromosome 6p is a susceptibility gene
for developmental dyslexia, The American Journal of Human Genetics, 76(4), 581–591.Cunha, F., Heckman, J. & Lochner, L. (2006) Interpreting the evidence on life cycle skill forma-
tion, in: E. Hanushek & F. Welch (Eds) Handbook of the economics of education (Amsterdam,
Holland North), 697–812.
Socio-economics and genetics in children’s reading skills 17
© 2014 British Educational Research Association
Davies, G., et al. (2011) Genome-wide association studies establish that human intelligence is
highly heritable and polygenic,MoI Psychiatry, 16(10), 996–1005.Ellis, B., Boyce, W., Belsky, J., Bakermans-Kranenburg, M. & Van Ijzendoorn, M. (2011) Differen-
tial susceptibility to the environment: An evolutionary–neurodevelopmental theory, Develop-
ment and Psychopathology, 23(1), 7–28.Feinstein, L. (2003) Inequality in the early cognitive development of British children in the 1970
cohort, Economica, 70(1), 73–97.Gayan, J. & Olson, R. (2001) Genetic and environmental influences on orthographic and phonolog-
ical skills in children with reading disabilities, Developmental Neuropsychology, 20(2), 483–507.Gayan, J. & Olson, R. (2003) Genetic and environmental influences on individual differences in
printed word recognition, Journal of Experimental Child Psychology, 84(2), 97–123.Goldberger, A. (1979) Heritability, Economica, 46(184), 327–347.Goodman, A., Sibieta, L. &Washbook, E. (2009) Inequalities in educational outcomes among chil-
dren aged 3 to 16. Final report for the National Equality Panel, Institute for Fiscal Studies,
London. Available online at: http://sta.geo.useconnect.co.uk/pdf/Inequalities%20in%20educa-
tion%20outcomes%20among%20children.pdf (accessed 30 November 2012).
Hackman, D., Farah, M. & Meaney, M. (2010) Socioeconomic status and the brain: Mechanistic
insights from human and animal research,Nature Reviews Neuroscience, 11(9), 651–659.Haveman, R. & Wolfe, B. (1995) The determinants of children’s attainments: A review of methods
and findings, Journal of Economic Literature, 33(4), 1829–1878.Heckman, J. (2007) The economics, technology, and neuroscience of human capability formation,
Proceedings of the National Academy of Sciences, 104(3), 13,250–13,255.Herrnstein, R. & Murray, C. (1994) The bell curve: Intelligence and class structure in American life
(New York, The Free Press).
Holtzman, N. (2002) Genetics and social class, Journal of Epidemiology and Community Health, 56
(7), 529–535.Jackson, M., Erikson, R., Goldthorpe, J. & Yaish, M. (2007) Primary and secondary effects in class
differentials in educational attainment: The transition to A-level courses in England andWales,
Acta Sociologica, 50(3), 211–229.Jaenisch, R. & Bird, A. (2003) Epigenetic regulation of gene expression: How the genome integrates
intrinsic and environmental signals,Nature Genetics Supplement, 33, 245–254.Jensen, A. (1968) Social class, race, and genetics: Implications for education, American Educational
Research Journal, 5(1), 1–42.Jerrim, J. (2012) The socio-economic gradient in teenagers’ literacy skills: how does England com-
pare to other countries?, Fiscal Studies, 33(2), 159–184.Jerrim, J. & Choi, A. (2013) The mathematics skills of school children: how does the UK compare
to the high performing East Asian nations?, Journal of Education Policy, doi:10.1080/02680939.
2013.831950.
Jerrim, J. & Micklewright, J. (2012) Parental socio-economic status and children’s cognitive
achievement at ages 9 and 15: how do the links vary across countries?, in: J. Ermisch, M. Jantti
& R. Erikson (Eds) Inequality from childhood to adulthood: A cross-national perspective on the trans-
mission of advantage (New York, Russell Sage Foundation).
Jerrim, J. & Vignoles, A. (2013) Social mobility, regression to the mean and the cognitive develop-
ment of high ability children from disadvantaged homes, Journal of the Royal Statistical Society
Series A, doi:10.1111/j.1467-985X.2012.01072.x.
Lango-Allen, H., et al. (2010) Hundreds of variants clustered in genomic loci and biological path-
ways affect human height,Nature, 467(7317), 832–838.Light, J., Pennington, B., Gilger, J. & DeFries, J. (1998) Reading-disability and hyperactivity disor-
der—evidence for a common genetic etiology,Developmental Neuropsychology, 11(3), 323–335.Lundborg, P. & Stenberg, A. (2009) Nature, nurture and egalitarian policy: What can we learn
from molecular genetics. IZA discussion paper number 4584. Available online at: http://ftp.iza.
org/dp4585.pdf (accessed 30 November 2012).
Manski, C. (2011) Genes, eyeglasses, and social policy, Journal of Economic Perspectives, 25(4),
83–94.
18 J. Jerrim et al.
© 2014 British Educational Research Association
Mitchell, C., Notterman, D., Brooks-Gunn, J., Hobcraft, J., Garfinkel, I., Kotenko, I., Jaeger, K. &
McLanahan, S. (2011) The role of mother’s genes and environment on postpartum depres-
sion, Proceedings of the National Academy of Sciences, 108(20), 8189–8193.Murnane, R., Willet, J. & Levy, F. (1995) The growing importance of cognitive skills in wage deter-
mination, Review of Economics and Statistics, 77(2), 251–266.Nielsen, F. & Roos, J. (2011) Genetics of educational attainment and the persistence of privilege at
the turn of the twenty-first century. Paper presented at the 2012 Southern Sociological Society,
New Orleans, Louisiana, March 21–24. Available online at: http://www.unc.edu/~nielsen/spe-
cial/s8/Nielsen_Roos_2010_draft3.pdf (accessed 27 November 2012).
Paracchini, S., Scerri, T. & Monaco, A. (2007) The genetic lexicon of dyslexia, Annual Review of
Genomics Human Genetics, 8, 57–79.Pennington, B., McGrath, L., Rosenberg, J., Barnard, H., Smith, S., Willcutt, E., Friend, A., De-
Fries, J. & Olson, R. (2009) Gene 9 environment interactions in reading disability and atten-
tion-deficit/hyperactivity disorder,Developmental Psychology, 45(1), 77–89.Petrill, S., Deater-Deckard, K., Thompson, L., DeThorne, L. & Schatschneider, C. (2006) Read-
ing skills in early readers: Genetic and shared environmental influences, Journal of Learning Dis-
abilities, 39(1), 48–55.Pluess, M. & Belsky, J. (2011) Prenatal programming of postnatal plasticity?, Development and Psy-
chopathology, 23(1), 29–38.Purcell, S., Wray, N., Stone, J., Visscher, P., O’Donovan, M., Sullivan, P. & Sklar, P. (2009) Com-
mon polygenic variation contributes to risk of schizophrenia and bipolor disorder, Nature, 460
(6), 748–752.Saunders, P. (2010) Social mobility myths (London, Civitas).
Scerri, T. & Schulte-Korne, G. (2010) Genetics of developmental dyslexia, European Child and
Adolescent Psychiatry, 19(3), 179–197.Scerri, T., Morris, A., Buckingham, L., Newbury, D., Miller, L., Monaco, A., Bishop, D. & Parac-
chini, S. (2011) DCDC2, KIAA0319 and CMIP are associated with reading related traits, Bio-
logical Psychiatry, 70(3), 237–245.Shakeshaft, N.G., Trzaskowski, M., McMillan, A., Rimfeld, K., Krapohl, E., Haworth, C.M.,
Dale, P.S. & Plomin, R. (2013) Strong Genetic Influence on a UK Nationwide Test of Educa-
tional Achievement at the End of Compulsory Education at Age 16, PLoS One, 8(12), e80341.
Todd, P. & Wolpin, K. (2003) On the specification and estimation of the production function for
cognitive achievement, The Economic Journal, 113(485), F3–F33.
Socio-economics and genetics in children’s reading skills 19
© 2014 British Educational Research Association
Appendix 1
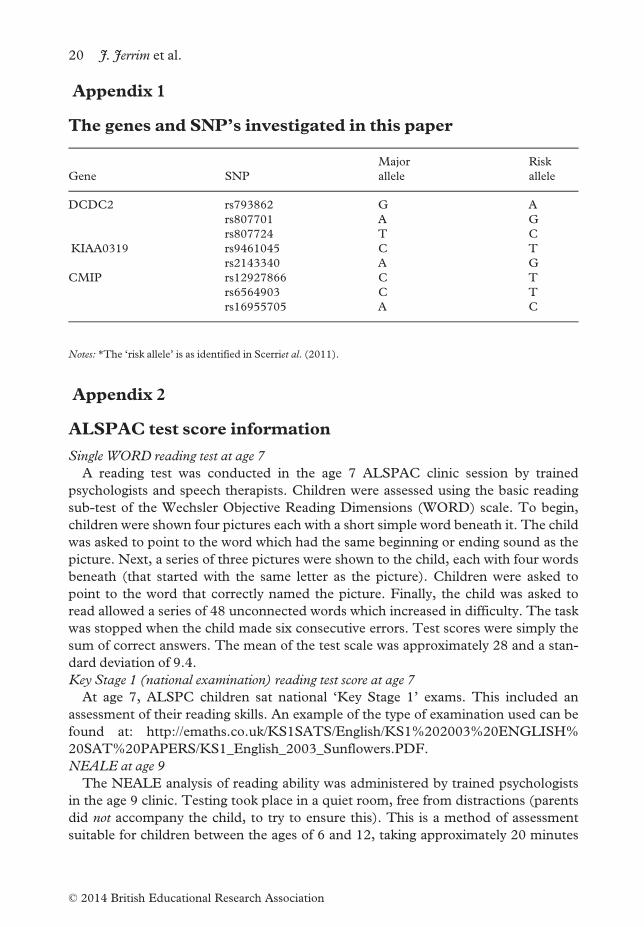
The genes and SNP’s investigated in this paper
Gene SNP
Major
allele
Risk
allele
DCDC2 rs793862 G A
rs807701 A G
rs807724 T C
KIAA0319 rs9461045 C T
rs2143340 A G
CMIP rs12927866 C T
rs6564903 C T
rs16955705 A C
Notes: *The ‘risk allele’ is as identified in Scerriet al. (2011).
Appendix 2
ALSPAC test score information
Single WORD reading test at age 7
A reading test was conducted in the age 7 ALSPAC clinic session by trained
psychologists and speech therapists. Children were assessed using the basic reading
sub-test of the Wechsler Objective Reading Dimensions (WORD) scale. To begin,
children were shown four pictures each with a short simple word beneath it. The child
was asked to point to the word which had the same beginning or ending sound as the
picture. Next, a series of three pictures were shown to the child, each with four words
beneath (that started with the same letter as the picture). Children were asked to
point to the word that correctly named the picture. Finally, the child was asked to
read allowed a series of 48 unconnected words which increased in difficulty. The task
was stopped when the child made six consecutive errors. Test scores were simply the
sum of correct answers. The mean of the test scale was approximately 28 and a stan-
dard deviation of 9.4.
Key Stage 1 (national examination) reading test score at age 7
At age 7, ALSPC children sat national ‘Key Stage 1’ exams. This included an
assessment of their reading skills. An example of the type of examination used can be
found at: http://emaths.co.uk/KS1SATS/English/KS1%202003%20ENGLISH%
20SAT%20PAPERS/KS1_English_2003_Sunflowers.PDF.
NEALE at age 9
The NEALE analysis of reading ability was administered by trained psychologists
in the age 9 clinic. Testing took place in a quiet room, free from distractions (parents
did not accompany the child, to try to ensure this). This is a method of assessment
suitable for children between the ages of 6 and 12, taking approximately 20 minutes
20 J. Jerrim et al.
© 2014 British Educational Research Association
in total for the following three components (i) words spoken per minute, (ii) compre-
hension, and (iii) accuracy.
Children were given a booklet and asked to read a series of (illustrated) passages
that increased in difficulty. The testers recorded the time that children took to read
the passage, and noted any errors that they made. They were then asked a series of
questions about the content of the story they had just read. The total number of
words read divided by the total time taken provides the ‘words per minute’ raw score
(mean 81, standard deviation 28). The total number of mistakes made across all pas-
sages read is the NEALE ‘accuracy’ raw score (mean 66, standard deviation 21). Raw
comprehension scores were obtained by simply summing the number of correct
answers the child gave to the comprehension questions. All raw scores were then age
standardised.
Key Stage 2 (national examination) reading test score at age 11
At the end of primary school (age 10/11), children in England sit important
national exams in English, maths and science. These exams are often considered
to be ‘high stakes’, as results are made publicly available at the school level (and
used to create school ‘league tables’). Reading is examined as part of the English
test (along with writing and spelling). Scripts are marked externally and standar-
dised across pupils. We use the reading component only in our analysis. Exam-
ples of the examination text, answer booklet and marking scheme can be found
below.
Examination reading text: http://emaths.co.uk/SAT%20PAPERS/KS2%20SAT%
20Papers/KS2%20English/English%20KS2%20SAT%202003/KS2%20SAT%202
003%20Englsih%20Reading%20Booklet.pdf.
Example answer book: http://emaths.co.uk/SAT%20PAPERS/KS2%20SAT%20
Papers/KS2%20English /English%20KS2%20SAT%202003/KS2%20SAT%20200
3%20English%20Readin g%20Answer%20Booklet.pdf.
Example mark scheme: http://emaths.co.uk/SAT%20PAPERS/KS2%20SAT%20
Papers/KS2%20English /English%20KS2%20SAT%202003/KS2%20SAT%20200
3%20English%20Mark Schemes.pdf.
Appendix 3
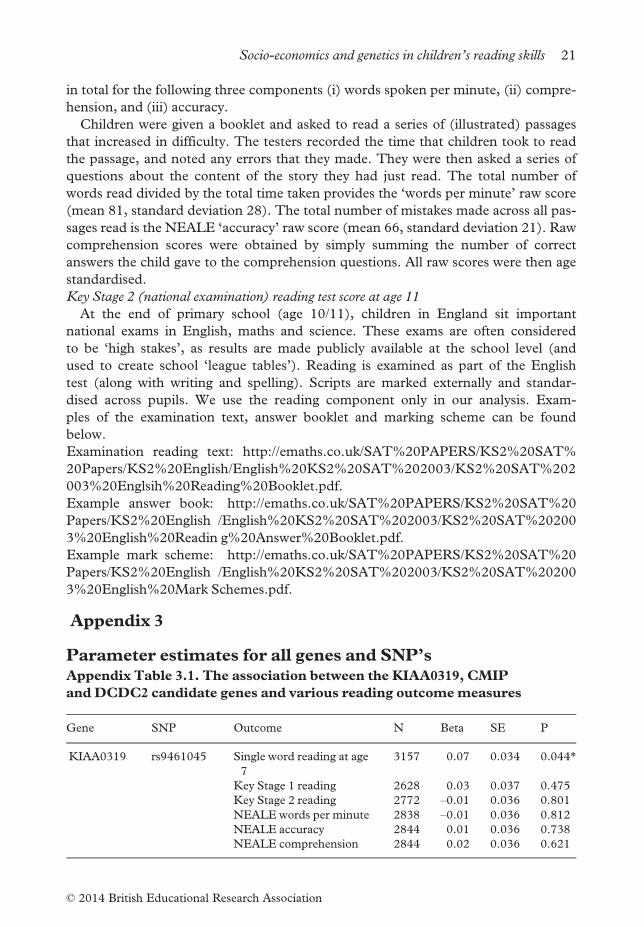
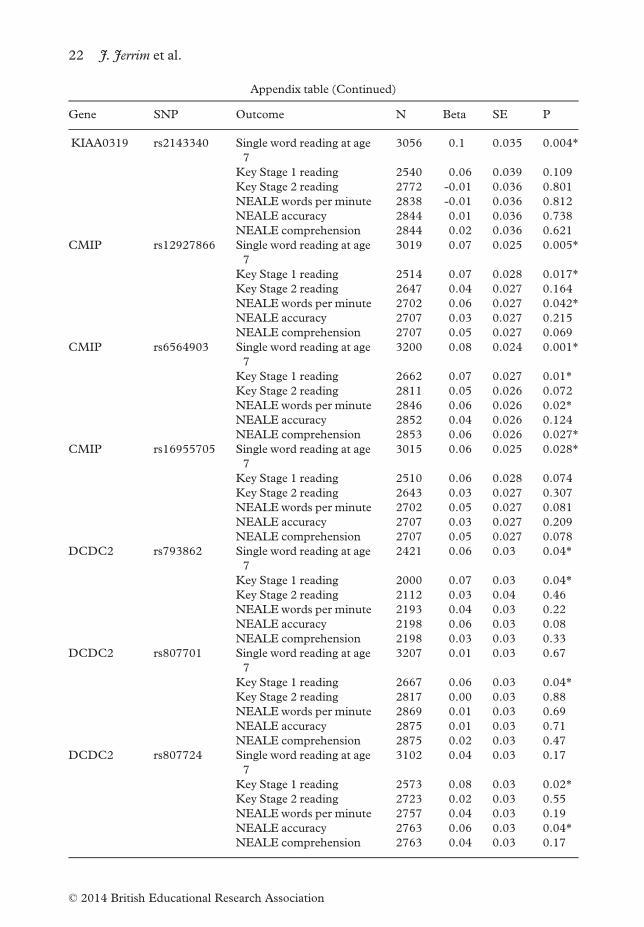
Parameter estimates for all genes and SNP’sAppendix Table 3.1. The association between the KIAA0319, CMIP
and DCDC2 candidate genes and various reading outcomemeasures
Gene SNP Outcome N Beta SE P
KIAA0319 rs9461045 Single word reading at age
7
3157 0.07 0.034 0.044*
Key Stage 1 reading 2628 0.03 0.037 0.475
Key Stage 2 reading 2772 –0.01 0.036 0.801
NEALE words per minute 2838 –0.01 0.036 0.812
NEALE accuracy 2844 0.01 0.036 0.738
NEALE comprehension 2844 0.02 0.036 0.621
Socio-economics and genetics in children’s reading skills 21
© 2014 British Educational Research Association
Appendix table (Continued)
Gene SNP Outcome N Beta SE P
KIAA0319 rs2143340 Single word reading at age
7
3056 0.1 0.035 0.004*
Key Stage 1 reading 2540 0.06 0.039 0.109
Key Stage 2 reading 2772 -0.01 0.036 0.801
NEALE words per minute 2838 -0.01 0.036 0.812
NEALE accuracy 2844 0.01 0.036 0.738
NEALE comprehension 2844 0.02 0.036 0.621
CMIP rs12927866 Single word reading at age
7
3019 0.07 0.025 0.005*
Key Stage 1 reading 2514 0.07 0.028 0.017*Key Stage 2 reading 2647 0.04 0.027 0.164
NEALE words per minute 2702 0.06 0.027 0.042*NEALE accuracy 2707 0.03 0.027 0.215
NEALE comprehension 2707 0.05 0.027 0.069
CMIP rs6564903 Single word reading at age
7
3200 0.08 0.024 0.001*
Key Stage 1 reading 2662 0.07 0.027 0.01*Key Stage 2 reading 2811 0.05 0.026 0.072
NEALE words per minute 2846 0.06 0.026 0.02*NEALE accuracy 2852 0.04 0.026 0.124
NEALE comprehension 2853 0.06 0.026 0.027*CMIP rs16955705 Single word reading at age
7
3015 0.06 0.025 0.028*
Key Stage 1 reading 2510 0.06 0.028 0.074
Key Stage 2 reading 2643 0.03 0.027 0.307
NEALE words per minute 2702 0.05 0.027 0.081
NEALE accuracy 2707 0.03 0.027 0.209
NEALE comprehension 2707 0.05 0.027 0.078
DCDC2 rs793862 Single word reading at age
7
2421 0.06 0.03 0.04*
Key Stage 1 reading 2000 0.07 0.03 0.04*Key Stage 2 reading 2112 0.03 0.04 0.46
NEALE words per minute 2193 0.04 0.03 0.22
NEALE accuracy 2198 0.06 0.03 0.08
NEALE comprehension 2198 0.03 0.03 0.33
DCDC2 rs807701 Single word reading at age
7
3207 0.01 0.03 0.67
Key Stage 1 reading 2667 0.06 0.03 0.04*Key Stage 2 reading 2817 0.00 0.03 0.88
NEALE words per minute 2869 0.01 0.03 0.69
NEALE accuracy 2875 0.01 0.03 0.71
NEALE comprehension 2875 0.02 0.03 0.47
DCDC2 rs807724 Single word reading at age
7
3102 0.04 0.03 0.17
Key Stage 1 reading 2573 0.08 0.03 0.02*Key Stage 2 reading 2723 0.02 0.03 0.55
NEALE words per minute 2757 0.04 0.03 0.19
NEALE accuracy 2763 0.06 0.03 0.04*NEALE comprehension 2763 0.04 0.03 0.17
22 J. Jerrim et al.
© 2014 British Educational Research Association
Notes: See notes to Table 1. Results based upon allelic trend model when using a different (standardised) testscore as the response. * indicates statistical significance at the 5% level.
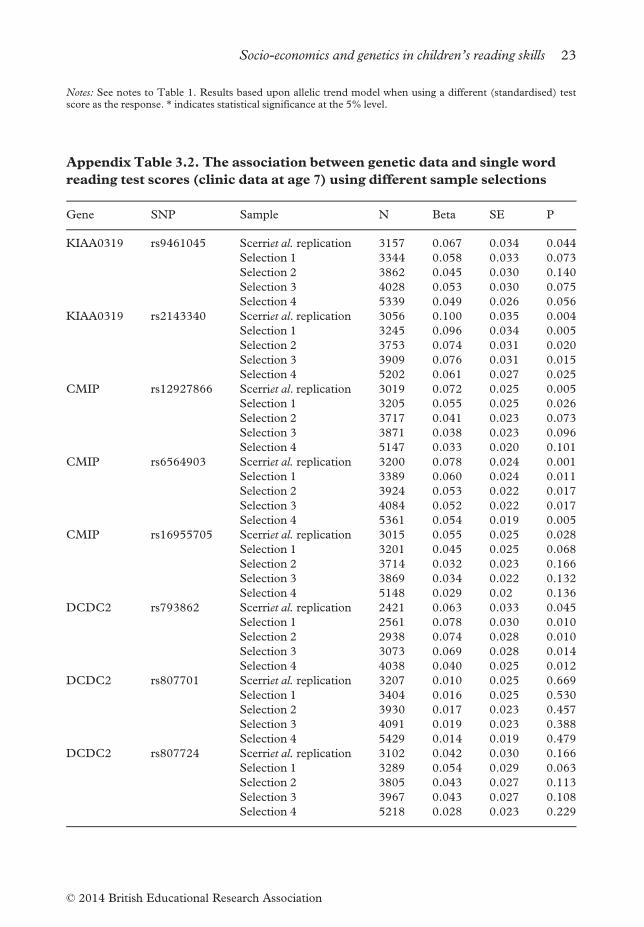
Appendix Table 3.2. The association between genetic data and single word
reading test scores (clinic data at age 7) using different sample selections
Gene SNP Sample N Beta SE P
KIAA0319 rs9461045 Scerriet al. replication 3157 0.067 0.034 0.044
Selection 1 3344 0.058 0.033 0.073
Selection 2 3862 0.045 0.030 0.140
Selection 3 4028 0.053 0.030 0.075
Selection 4 5339 0.049 0.026 0.056
KIAA0319 rs2143340 Scerriet al. replication 3056 0.100 0.035 0.004
Selection 1 3245 0.096 0.034 0.005
Selection 2 3753 0.074 0.031 0.020
Selection 3 3909 0.076 0.031 0.015
Selection 4 5202 0.061 0.027 0.025
CMIP rs12927866 Scerriet al. replication 3019 0.072 0.025 0.005
Selection 1 3205 0.055 0.025 0.026
Selection 2 3717 0.041 0.023 0.073
Selection 3 3871 0.038 0.023 0.096
Selection 4 5147 0.033 0.020 0.101
CMIP rs6564903 Scerriet al. replication 3200 0.078 0.024 0.001
Selection 1 3389 0.060 0.024 0.011
Selection 2 3924 0.053 0.022 0.017
Selection 3 4084 0.052 0.022 0.017
Selection 4 5361 0.054 0.019 0.005
CMIP rs16955705 Scerriet al. replication 3015 0.055 0.025 0.028
Selection 1 3201 0.045 0.025 0.068
Selection 2 3714 0.032 0.023 0.166
Selection 3 3869 0.034 0.022 0.132
Selection 4 5148 0.029 0.02 0.136
DCDC2 rs793862 Scerriet al. replication 2421 0.063 0.033 0.045
Selection 1 2561 0.078 0.030 0.010
Selection 2 2938 0.074 0.028 0.010
Selection 3 3073 0.069 0.028 0.014
Selection 4 4038 0.040 0.025 0.012
DCDC2 rs807701 Scerriet al. replication 3207 0.010 0.025 0.669
Selection 1 3404 0.016 0.025 0.530
Selection 2 3930 0.017 0.023 0.457
Selection 3 4091 0.019 0.023 0.388
Selection 4 5429 0.014 0.019 0.479
DCDC2 rs807724 Scerriet al. replication 3102 0.042 0.030 0.166
Selection 1 3289 0.054 0.029 0.063
Selection 2 3805 0.043 0.027 0.113
Selection 3 3967 0.043 0.027 0.108
Selection 4 5218 0.028 0.023 0.229
Socio-economics and genetics in children’s reading skills 23
© 2014 British Educational Research Association
Notes: See notes to Table 1. ‘Scerriet al. sample’ refers to our attempted replication of Scerri (2011). The rowslabelled ‘selection’ present estimates when using various different sample selections (see the third section of thearticle for definitions).
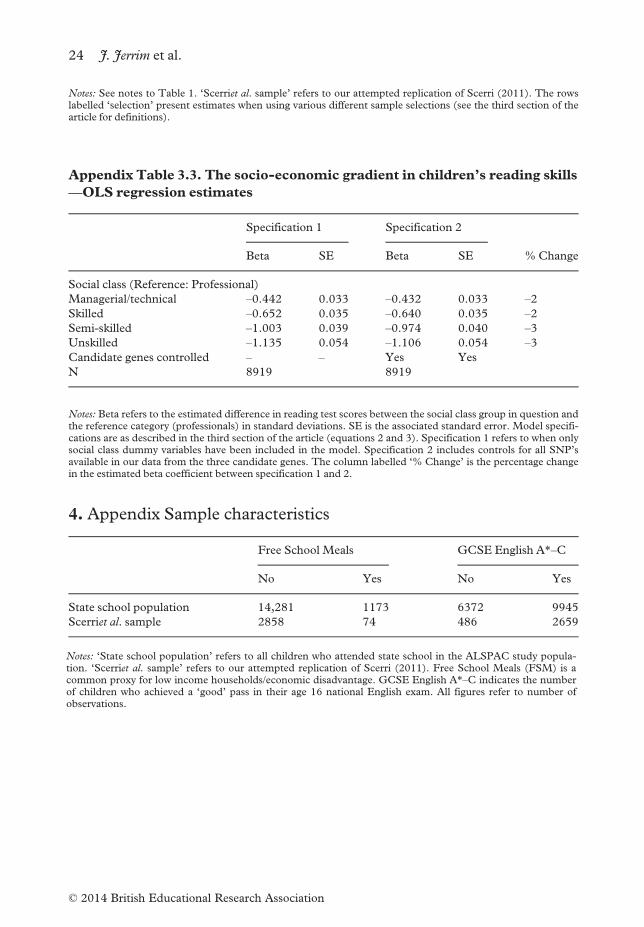
Appendix Table 3.3. The socio-economic gradient in children’s reading skills
—OLS regression estimates
Specification 1 Specification 2
Beta SE Beta SE %Change
Social class (Reference: Professional)
Managerial/technical –0.442 0.033 –0.432 0.033 –2Skilled –0.652 0.035 –0.640 0.035 –2Semi-skilled –1.003 0.039 –0.974 0.040 –3Unskilled –1.135 0.054 –1.106 0.054 –3Candidate genes controlled – – Yes Yes
N 8919 8919
Notes: Beta refers to the estimated difference in reading test scores between the social class group in question andthe reference category (professionals) in standard deviations. SE is the associated standard error. Model specifi-cations are as described in the third section of the article (equations 2 and 3). Specification 1 refers to when onlysocial class dummy variables have been included in the model. Specification 2 includes controls for all SNP’savailable in our data from the three candidate genes. The column labelled ‘% Change’ is the percentage changein the estimated beta coefficient between specification 1 and 2.
4. Appendix Sample characteristics
Free School Meals GCSE English A*–C
No Yes No Yes
State school population 14,281 1173 6372 9945
Scerriet al. sample 2858 74 486 2659
Notes: ‘State school population’ refers to all children who attended state school in the ALSPAC study popula-tion. ‘Scerriet al. sample’ refers to our attempted replication of Scerri (2011). Free School Meals (FSM) is acommon proxy for low income households/economic disadvantage. GCSE English A*–C indicates the numberof children who achieved a ‘good’ pass in their age 16 national English exam. All figures refer to number ofobservations.
24 J. Jerrim et al.
© 2014 British Educational Research Association