Embed Size (px)
Citation preview
The Socio-Economic Impacts of the 2015/16 EL Niño Induced Drought in Swaziland
Prepared by:
Swaziland Economic Policy Analysis and Research Centre Email: [email protected]
Website: www.separc.co.sz APP: SEPARC INSIGHTS
Tel: +268 2404 3033 / 2823
Prepared For: NATIONAL DISASTER MANAGEMENT AGENCY (NDMA)
30th JUNE 2017
Table of Contents
1.1. Background ...................................................................................................................... 1
1.2. Contextualising El Niño Induced Droughts in Swaziland ................................................ 3
1.3. Socioeconomic Impacts of Drought ................................................................................. 4
1.4. Framework for Assessing Socioeconomic Impacts of Drought ........................................ 5
1.5. Prior Studies and Mitigation Activities in Swaziland ....................................................... 6
2.1. Research Design and Methods ......................................................................................... 8
2.2. Survey Data Collection ..................................................................................................... 9
2.2.1. Piloting ............................................................................................................................. 9
2.2.2. Data Collection ............................................................................................................... 10
2.3. Data Quality Assurance .................................................................................................. 10
2.4. Data Analysis .................................................................................................................. 10
3.1. Profile of Sampled Households ...................................................................................... 12
3.2. Asset Mapping and Assessment of Risk to Poverty ........................................................ 13
3.3. Household Expenditure and Income Availability .......................................................... 17
3.4. Availability of Potable Water .......................................................................................... 18
3.5. Drought Impacts and Significance ................................................................................. 19
3.5.1. Direct and Indirect (direct and indirect loss or costs) of the 2015/16 drought on
households ...................................................................................................................... 19
3.5.2. Impact Significance ........................................................................................................ 25
3.5.3. Household’s Responses and Coping Strategies to Drought Impacts ............................. 44
4.1. Introduction ................................................................................................................... 48
4.2. Understanding the Impacts of Drought ......................................................................... 49
4.3. Composition of the Economy in Swaziland .................................................................... 51
4.4. Sectorial Impacts ............................................................................................................ 53
4.4.1. Water Sector ................................................................................................................... 53
4.4.2. Agriculture Sector ........................................................................................................... 55
4.4.3. Energy – Electricity Production Sector .......................................................................... 61
4.4.4. Natural Environment & Ecosystem Productivity Sector ................................................ 63
4.4.5. Tourism Sector ............................................................................................................... 65
4.4.6. Urban Development ....................................................................................................... 66
4.5. Early Warning System .................................................................................................... 67
ii
4.6. Monetary Cost Estimation of the 2015/16 Drought on Swaziland’s Economy ..............68
5.1. Policy Objectives ............................................................................................................. 77
5.2. Instruments for Drought Disaster Management ........................................................... 77
5.3. Implications of the 2015/16 Drought on NDS, SDGs and AU 2063 Agenda ................. 82
6.1. Conclusion ...................................................................................................................... 84
6.2. Recommendations ..........................................................................................................86
6.2.1. Further Research ........................................................................................................... 88
iii
ACKNOWLEDGEMENTS
The study would not have been possible without the contributions from households across
Swaziland, and stakeholders from the Government of Swaziland, Public Enterprises, and
Business who responded to the questionnaires.

iv
ACRONYMS & ABBREVEATIONS
ACAT Africa Cooperative Agricultural Trust AIDS Acquired Immune Deficiency Syndrome AU African Union CBS Central Bank of Swaziland DPMO Deputy Prime Minister’s Office EA (Census) Enumeration Areas EDF European Union Development Fund ENSO El Niño Southern Oscillation EU European Union EUR EURO FFP Food for Peace GAIN Global Agricultural Information Network GDP Gross Domestic Product GoS Government of Swaziland HIV Human Immunodeficiency Virus ID Identification Document IPCC International Panel on Climate Change KOBWA Komati Basin Water Authority NOAA National Oceanic and Atmospheric Administration NAMBOARD National Marketing Board NATCOM National Commissioner of Police NDMA National Disaster Management Agency NDS National Development Strategy (2010) NERMAP National Emergency Response, Mitigation, and Adaptation Plan -2016-2022 NERCHA National Emergency Response Council on HIV/AIDS NMC National Maize Corporation OCHA Office for the Coordination of Humanitarian Affairs RSPS Royal Swaziland Police Service SBIS Swaziland Broadcasting and Information Service SEC Swaziland Electricity Company SERA Swaziland Energy Regulatory Authority SDGs Sustainable Development Goals SHIES Swaziland Household Income and Expenditure Survey STA Swaziland Tourism Authority SWSC Swaziland Water Services Corporation UN United Nations UNICEF United Nations Children’s Fund USAID United States Agency for International Development VAC Vulnerability Assessment Committee WASH Water Sanitation and Hygiene

v
EXECUTIVE SUMMARY
Report Summary
his report provides detailed findings of an investigation into the socioeconomic impacts
of the 2015/16 El Niño drought in Swaziland. It records the direct and indirect effects of
the drought on the economy of Swaziland and documents how it has affected
households, businesses, and the environment. The economic evaluation of drought
impacts is essential in order to define efficient and sustainable management and mitigation
strategies. The study documents the effects of the 2015/16 drought on the economy of
Swaziland, extrapolates how it may have affected the implementation of the country’s
developmental mandate, and deduces the suitability of the country’s disaster risk
management policy to respond to natural disasters like droughts. The study concludes by
quantifying the economic costs and overall effects, in monetary terms, of the drought to
Swaziland.
Background
The Government of Swaziland declared the drought a natural disaster in February 18, 2016.
Immediately after that, the country launched the National Emergency Response, Mitigation,
and Adaptation Plan (NERMAP) (2016-2017) and rerouted funds to drought relief. The
government further invited the International Community, local organisations, and
businesses to assist in curbing the adverse effects of the drought. A question of strategic
national importance relates to how the drought affected households, businesses, and the
environment in Swaziland. Similarly, policymakers are interested to know the coping
strategies employed by households, businesses, and organisations involved in the
management of the environment to lessen the effects of the drought on wellbeing,
profitability, and environmental resilience, respectively. The study, conducted at the request
of the National Disaster Management Agency (NDMA), received financial support from the
NDMA, the United Nations Development Programme (UNDP) in Swaziland and the
Government of Swaziland through its annual Parliamentary Grant given to the Swaziland
Economic Policy Analysis and Research Centre (SEPARC).
Methods
The study followed established methodologies for conducting studies on the socioeconomic
impacts of droughts. First, the study conducted a detailed household survey covering 2,958
households in all the 55 constituencies of Swaziland. Using the 2007 Household and
Housing Characteristics Census’ Enumeration Areas (EA), 10 households were randomly
selected from each EA and from each household, a respondent 18 years or older (ideally a
breadwinner or anyone involved in food preparation or decision-making at the household)
was selected to answer the questionnaire. The household surveys focussed on both rural and
urban households and sought to solicit information on how the drought (may or may have
not) affected Swazi households. The study supplemented the household surveys with
structured interviews with business and government stakeholders who included the
Municipal Council of Mbabane, Matsapha Town Board, the Swaziland Sugar Association
(SSA), Swaziland Meat Industries, and the Swaziland Energy Regulatory Authority (SERA).
The list of interviewed stakeholders also includes the National Maize Corporation (NMC),
the Swaziland Electricity Company (SEC), the Komati Downstream Development Project
(KDDP), Swaziland Water Services Corporation (SWSC), and Swaziland Environmental
Authority (SEA). Among government ministries, the study interviewed the Deputy Prime
Minister’s Office (DPMO), Ministry of Education, Ministry of Natural Resources, Ministry of
Tourism and Environment, Ministry of Finance, Ministry of Agriculture, and Royal
Swaziland Police Services (RSPS). Others include the Central Bank of Swaziland (CBS), the
T
vi
NDMA, the American Embassy, Delegation of the European Union to Swaziland, and private
businesses such as Swazi Trails.
The study used a detailed questionnaire to collect data focusing on how the drought affected
each stakeholder. Computer assisted personal interviewing was used to collect data at the
household level. In addition to the survey data, the study requested extra information from
stakeholders via emails and in some instances through personal communications (Pers.
Comm.) with targeted stakeholders. Secondary data, obtained from the CBS and Central
Statistical Office, was used to make economy wide inferences. The information collected
from the household survey was used to quantify the economic costs of the drought on
households, while the data collected from businesses was used to quantify the economic
costs of the drought on business. The effects of the drought on household consumption and
its effects on the economy were summed up to come up with a cost estimate for the overall
effects of the 2015/16 drought on the economy of Swaziland.
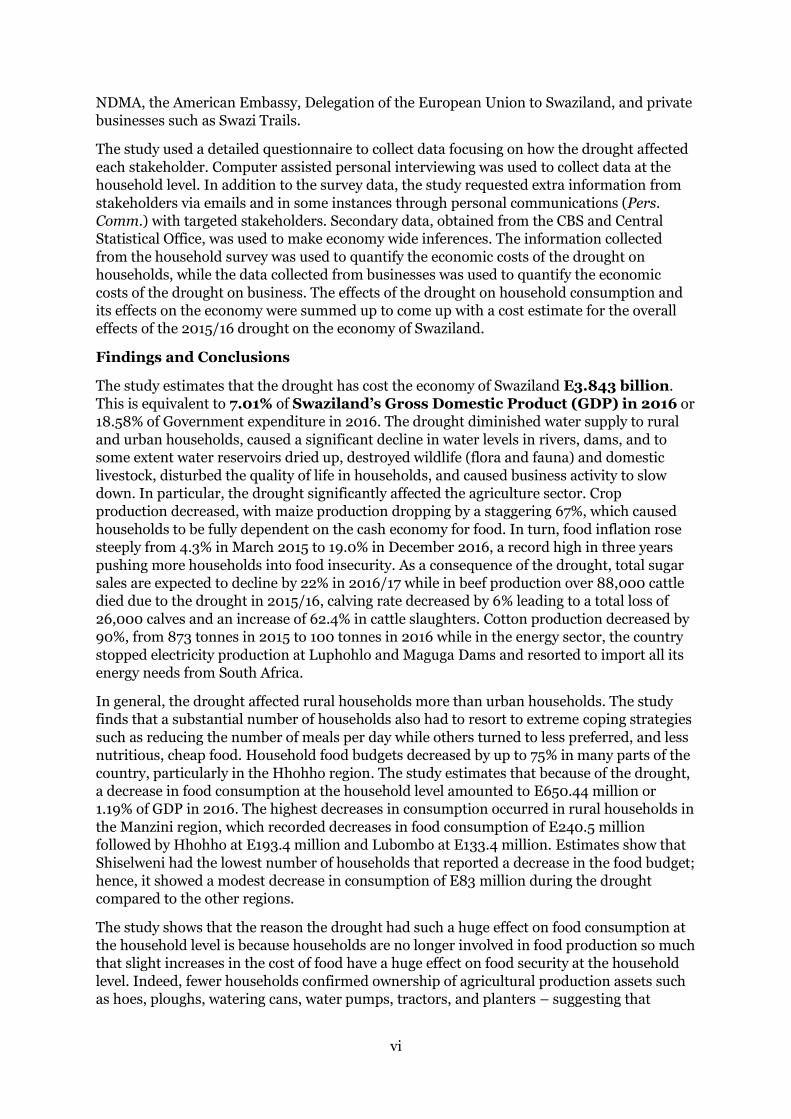
Findings and Conclusions
The study estimates that the drought has cost the economy of Swaziland E3.843 billion.
This is equivalent to 7.01% of Swaziland’s Gross Domestic Product (GDP) in 2016 or
18.58% of Government expenditure in 2016. The drought diminished water supply to rural
and urban households, caused a significant decline in water levels in rivers, dams, and to
some extent water reservoirs dried up, destroyed wildlife (flora and fauna) and domestic
livestock, disturbed the quality of life in households, and caused business activity to slow
down. In particular, the drought significantly affected the agriculture sector. Crop
production decreased, with maize production dropping by a staggering 67%, which caused
households to be fully dependent on the cash economy for food. In turn, food inflation rose
steeply from 4.3% in March 2015 to 19.0% in December 2016, a record high in three years
pushing more households into food insecurity. As a consequence of the drought, total sugar
sales are expected to decline by 22% in 2016/17 while in beef production over 88,000 cattle
died due to the drought in 2015/16, calving rate decreased by 6% leading to a total loss of
26,000 calves and an increase of 62.4% in cattle slaughters. Cotton production decreased by
90%, from 873 tonnes in 2015 to 100 tonnes in 2016 while in the energy sector, the country
stopped electricity production at Luphohlo and Maguga Dams and resorted to import all its
energy needs from South Africa.
In general, the drought affected rural households more than urban households. The study
finds that a substantial number of households also had to resort to extreme coping strategies
such as reducing the number of meals per day while others turned to less preferred, and less
nutritious, cheap food. Household food budgets decreased by up to 75% in many parts of the
country, particularly in the Hhohho region. The study estimates that because of the drought,
a decrease in food consumption at the household level amounted to E650.44 million or
1.19% of GDP in 2016. The highest decreases in consumption occurred in rural households in
the Manzini region, which recorded decreases in food consumption of E240.5 million
followed by Hhohho at E193.4 million and Lubombo at E133.4 million. Estimates show that
Shiselweni had the lowest number of households that reported a decrease in the food budget;
hence, it showed a modest decrease in consumption of E83 million during the drought
compared to the other regions.
The study shows that the reason the drought had such a huge effect on food consumption at
the household level is because households are no longer involved in food production so much
that slight increases in the cost of food have a huge effect on food security at the household
level. Indeed, fewer households confirmed ownership of agricultural production assets such
as hoes, ploughs, watering cans, water pumps, tractors, and planters – suggesting that

vii
households are no longer involved in food production. The data shows that only 27.9% of the
surveyed households in Shiselweni, which happened to be the highest, owned assets used in
agricultural production, followed by Manzini (27.0%), Hhohho (25.2%), and Lubombo at
21.0%. Households employed different strategies to cope with the effects of the drought. A
large number of households had to seek financial assistance from their friends and families
in urban areas just to buy food.
The study finds that the drought affected women-headed households more than male-
headed households. Women-headed households had, on average, the highest number of
dependants than male-headed households did, and so experienced more food shortages than
the male-headed households. Women also suffered in terms of energy and time spent finding
alternative sources of wood fuel and water: women had to travel long distances to collect
water from rivers and wood fuel for cooking, and for other household needs. Children
suffered from drinking poor quality (dirty) water, leading to diarrhoea and other stomach
illnesses. Furthermore, in rural households, children remained vulnerable as their parents
and guardians migrated to urban areas in search of jobs to sustain their families. However,
the results were not as envisaged, as the Royal Swaziland Police Service (RSPS) reported an
increase in the number of rapes and attempted rapes in rural households. Besides the
impacts on children, there was a significant rise in key populations around the Mbabane and
Manzini corridor. This suggests that because of the lack of food induced by the drought, as
well as the intrinsic and rampant unemployment and poverty in rural and urban households
in Swaziland, some people resorted to sex work as a practical option to sustain their
livelihoods during the drought.
In the 2016/17 Budget, the government of Swaziland gave considerable priority to drought
relief and mitigation measures. At the onset of the drought, before it was declared a disaster,
the government had already committed E45 million to assist 158,000 people with food
assistance. An additional E200 million was allocated for drought mitigation in 2016/17,
which went into food and water distribution to the most vulnerable communities, drilling of
boreholes, dredging of Hawane Reservoir, and provision of supplementary feed for livestock
and importation of power from South Africa. Development partners also followed suit and
redirected development assistance toward providing drought relief. Subsequently, the study
shows that because of resource redirection, the country has deflected the implementation of
key development strategies and the economic consequences will linger long after the
drought. By redirecting around E350 million into a supplementary budget for drought
mitigation and response, government’s planned activities had to take second priority. In
2015, the government put the salary review for civil servants on hold while it had to defer
some ongoing capital projects. As well, the government did not pay its suppliers on time,
which increased pressure on arrears. The effects of deferring payment of suppliers
compromised the ability of these suppliers to pay their taxes on time. By December 2016,
approximately 41% of the required (US$96,400,000) funding had been made available for
the NERMAP implementation by the government, UN agencies and other partners, with
government only releasing about 39% of her share of the budget. Therefore, as of December
2016, NERMAP had used about E533,698,510.80 or US$39,098,792 to assist 413,553
beneficiaries based on food and cash distribution statistics against an initial target of
350,000 beneficiaries.
An analysis of the economic impacts of the drought across the sectors of the economy shows
that the energy, the environment, and water sector suffered major impacts following the
agriculture sector. The country imported millions of Emalangeni worth of electricity from
South Africa. If there was ever a time the importance of diversifying the energy sector in
Swaziland became a pressing issue, the 2015/16 became that time as the drought made it
clear that a hydro-based power sector cannot keep the country lit in times of extreme

viii
drought. The drought compromised the country’s flora and fauna to great limits such that
rangelands completely collapsed and Swaziland had to import pasture from South Africa.
Although the study was unable to assess the extent of the drought’s impacts on the country’s
ecological infrastructure, one thing is clear: from an environmental management
perspective, implications of these findings are important to develop effective mitigation
strategies to reduce drought risk exposure in Swaziland.
Beyond hindrances on general development, the study finds that the drought tested the
ability of the country’s water harvesting and storage infrastructure, and provision of water to
rural households, major towns, and agricultural estates – leading to enormous economic
consequences. Normally when there is no drought, 40% of households have access to potable
Swaziland Water Services Corporation (SWSC) water including public taps whilst 35% still
rely on rivers, streams, lakes, and protected and unprotected springs as their primary source
of drinking or cooking water. About 15% of households use boreholes as their major source
of drinking water. During the 2015/16 drought, SWSC and public tap water usage dropped
from 40% to 33%, and there was a slight drop (about 3%) in the number of households that
used rivers for their main source of drinking water. Hhohho and Lubombo regions
significantly reduced water consumption while Manzini and Shiselweni regions used more or
less the same amount before and during the drought.
Conclusions
An important finding of the study from Swazi households is that they have been experiencing
drought-like conditions since the 1980s, with impacts intensifying in the last decade. As a
result, the 2015/16 drought negatively affected almost all (well over 80%) households in
Swaziland. Urban areas, particularly Mbabane, were for the first time without water. Even
though the GoS dedicated a significant budget (E350 million) to address the impact of the
drought, more resources are still needed to address issues of agriculture and food security,
education, urban water and sanitation, rural water and sanitation, health and nutrition,
social protection, environment and energy, storm damages, and coordination in Swaziland.
Households feel that their primary responsibility in preparation for, and during drought, is
to save water and grow enough food to feed themselves. They believe that government
should provide water and food, especially during droughts. However, the surveyed
households establish that the level of involvement in food production in Swaziland is very
low, at 25.3%. A bigger role that government can play in assisting food production at the
household level is through the provision of farm inputs, and distribution of food parcels to
the most vulnerable citizens.
Similarly, Disaster Management Policy needs to influence asset priorities in households with
emphasis on establishing alternative means to extract, store, and access reliable and clean
water, as well as increase household participation in agriculture, especially in the Lubombo
region. The assessment found that the impact of the drought was severe especially on
agriculture and availability of food at the household level. The study found that because of
high unemployment (50%) among rural households and dependency of rural households on
urban households for remittances, the drought exacerbated the capacity of households to
sustain their livelihoods. Households had to rely on food donations from the Government,
business, and development partners to ensure that they had something to eat each day
during the drought.
Although the country’s Disaster Risk Management Policy is comprehensive, drought-
proofing Swaziland is still a question of time and investment in the programmes stipulated in
the policy. Essentially, drought-proofing the country should focus on rehabilitating and
strengthening the country’s food production system so that it is not too dependent on direct

ix
rainfall. This will require the inculcation of a sense of shared responsibility in establishing
mechanisms that will eliminate adverse exposure to drought impacts. In order to eliminate
systemic vulnerabilities and exposure to the adverse impacts of droughts, encouraging
employment and income generating activities across the country, particularly in agriculture
is necessary.
Recommendations
The study recommends that the Government of Swaziland should consider revising and
integrating all aspects of disaster mitigation to all policies in Swaziland. The NDMA is
advised to consider advocating for increased water harvesting, and storage capacities within
households and at the national level. In addition, the NDMA should focus on implementing
the programmes stipulated in the DRM Policy (2010) to address the endemic risks to
drought in the country for improvements in preparedness, mitigation, adaptation and
resilience at the household level and in all sectors of the economy. Lastly, since the NDMA’s
mandate is to make sure that every citizen in the country, regardless of income status,
receives adequate protection in the event of a disaster, the study recommends the
development of a sustainable Disaster Management Budget and Funding Model in
Swaziland.

1
INTRODUCTION
1.1. Background
he 2015/2016 El Niño induced drought had massive impacts on the rural economy in
Swaziland, affecting especially agriculture - forcing the government to redirect
resources intended to fund the implementation of development projects and
programmes to drought relief. According to the Swaziland Vulnerability Assessment
Committee Report (VAC) (2016), the drought left at least 308,059 people in dire need of
humanitarian assistance. The National Disaster Management Agency (NDMA) estimates that
638,251 people (or about 50% of the population of Swaziland) were affected by the drought,
which caused crop failures, destroyed livestock, and induced an unending hunger-spiral
prompting the government to declare it a national disaster on February 18, 2016.
Consequent to government’s categorisation of the drought as a national emergency, the
country launched the NERMAP (2016-2022). The government further invited the
international community, local organisations, and businesses to assist in curbing the adverse
effects of the drought.
A question of strategic national importance relates to how the drought has affected
households and businesses in Swaziland. Similarly, policymakers are interested to know the
strategies used by households and businesses to lessen the effects of the drought on
wellbeing and profitability, respectively. In this study, the socioeconomic impacts of the
2015/16 El Niño induced drought in Swaziland are investigated. The study recognises that,
while a wealth of knowledge exists on the economic and environmental impacts of droughts
(see for example Ding, Hayes, and Widham (2010) for a comprehensive review of recent
studies on droughts), there is very little information on the impacts of droughts on
households and the associated welfare implications in Swaziland. This is in spite of the fact
that the economy of Swaziland is heavily reliant on water. As argued by Gil, Garrido, and
Hernández-Mora (2013: 2679), “water-dependent activities such as agricultural production,
agri-food industry, and agricultural employment are severely impacted by a reduction in
water availability.” Moreover, droughts also weaken the ability of households to produce
food, which in turn affects household livelihood security.
In Swaziland, the Vulnerability Assessment and Analysis Report (2014:17) defines household
livelihood security as “adequate and sustainable access to income and resources, meeting
basic needs including adequate access to food, potable water, health facilities, education
opportunities, housing, and the time for community participation and social integration.”
The implication is that livelihoods can differ between households, depending on the
household’s capacity to earn income or engage in income generating activities. It also
depends on the household’s ability to secure ownership or access to resources and assets in
order to shirk risks, ease shocks, and meet livelihood contingencies. Therefore, the impacts
of droughts can vary significantly between constituencies and regions. The determining
factors are the socioeconomic conditions of the households before such shocks hit. Given
that in reality, each drought is unique and presents different sets of impacts in varying
intensity to an economy and households (Donald and Svoboda, 2007); the capacity of
households and the economy at large to mitigate and respond to its impacts varies according
to the structures created by disaster risk management policy in a country (Donal and
Svoboda, 2007). In that regard, this study focuses on the socioeconomic conditions of
households across the 55 constituencies in Swaziland. It investigates the fundamental
socioeconomic conditions that are most likely to increase or decrease household
vulnerability to drought and other climate-induced disasters as the country enters the last
five years of its development vision: Vision 2022.
T
2
Conducting this investigation is crucial for numerous reasons. First, evidence is conclusive
that droughts negatively influence agricultural production, which leads to unstable
agricultural incomes against rising food prices that tend to intensify the incidence of poverty
and vulnerability of the poor (Desai et al., 1979 and Chen, 1991). As this study shows,
women, people living with disabilities, and children in rural areas became the first causalities
of the drought. The drought imposed modifications in the economic position of women,
distressed their economic performance, and affected their productivity. In turn, this affected
the performance and integrity of the rural economy. Furthermore, at the household level,
women are responsible for the overall survival strategy of the family through their role in
household food processing and by default, food provision (Tichagwa, 1994). Confounding the
situation in Swaziland is that the Swaziland Household Income and Expenditure Survey
(SHIES) (2010) reports that on average, women-headed households were poorer than male-
headed households in 2010. The household drought assessment contained in this report
provides a detailed assessment of the effects of the 2015/16 El Niño drought on the rural
sector with a special focus on agriculture, and the welfare of women and children. This is
important because if Swaziland is to end poverty and hunger, and achieve good health and
wellbeing of all citizens, as per the National Development Strategy (NDS) of 1997 and the
Sustainable Development Goals (SDGs), the economic performance of women should be
protected at all times.
Second, studying the role of some of the recent interventions geared towards making
Swaziland drought proof provides a window of opportunity to assess the extent to which
such strategies are yielding the desired benefits. For example, the Poverty Reduction
Strategy and Action Plan (PRSAP) prioritises poverty reduction in the NDS where the
government outlines its plan of action to ensure minimal disturbances in the agricultural
sector due to sporadic weather. Indeed, since the drought of 1992, the country has made
great investments in improving water-harvesting infrastructure. However, the drought
tested the ability of this infrastructure to store and provide water to rural households, major
towns, and agricultural estates. The results have been disappointing, leading to enormous
economic consequences, raising questions such as; how adequate is Swaziland’s water
harvesting and storage infrastructure?
Third, as the impact of climate change worsens, the International Panel on Climate Change
(IPCC) has warned that droughts will occur more frequently. The IPCC projects that for some
countries in Africa, yields from rain-fed agriculture could fall by up to 50% by 2020,
threatening the survival of large populations who rely on subsistence farming (IPCC, 2007;
IPCC, 2016). Similarly, the current drought is a manifestation of a long and prolonged
drought that has persisted in southern Africa since 2002 (Maish et al., 2014). A question of
policy interest therefore is: How drought proof is the Kingdom of Swaziland? Alternatively,
to what extent are the country’s disaster management policies capable of ensuring adequate
protection of vulnerable communities during natural disasters like droughts?
Fourth, the focus on the impact of droughts tends to concentrate on their short-term
economic effects on agriculture and the rural economy. Yet the impacts tend to last longer.
As has been seen with the drought in Swaziland, governments have to reprioritise
development strategies and respond to the disasters. In Swaziland, the Government has had
to reroute funds to provide relief support to affected communities and households. Likewise,
development partners have also redirected development assistance towards providing
drought relief in a bid to ensure that the country does not regress from the development
gains achieved in the last 20 years or since the last major drought, and to prevent a
humanitarian crisis. Resource redirection has deflected the implementation of key
development strategies and the economic consequences will linger long after the drought.

3
Lastly, while the NDS is clear on where Swaziland should be by 2022, the study analyses how
the drought has imposed uncertainties on the country’s ability to meet the aspirations of the
NDS. For example, the NDS views agriculture as holding the potential to reduce poverty and
inequality, and achieving inclusive growth. A recent study conducted by the World Bank
(2016) concludes that there is room for optimism as investor sentiments and export market
trends suggest that agriculture has a potential of driving economic growth in Swaziland.
However, for agriculture to contribute to growth there must be growth in agricultural
productivity (Pardey and Craig, 1989). Water availability is an important ingredient in
raising agricultural productivity. Moreover, farmers also require resources to access
improved agricultural technologies including various inputs, tractors, and agricultural
insurance. Given that the drought has wiped-out the savings of rural households (see DPMO,
2016) and that the country has a large number of smallholder farmers, information is
required on the kind of support structures that the government could provide to farmers to
ensure that they bounce back to farming when the rains return.
Against this backdrop, a detailed assessment of the socioeconomic impacts of the 2015/16 El
Niño drought in Swaziland was undertaken, focusing on impacts at the household level, on
business, and on the entire economy. A key contribution of this study is in documenting the
coping capacity of households during natural disasters. As a socioeconomic impact
assessment, the study documents the drought dynamics at the household level and highlights
the coping strategies employed to address the multiple dimensions of the drought.
Furthermore, the study also includes interviews with select business, government, and non-
government stakeholders to make sense of the impact of the drought on the economy using a
multi-sectorial approach. In conclusion, the study attaches a monetary value to the economic
impacts of the drought. Knowledge gained from this assessment also serves as a foundation
to prepare the nation for future disasters to minimise economic and environmental losses,
and social disturbances.
1.2. Contextualising El Niño Induced Droughts in Swaziland
The US National Oceanic and Atmospheric Administration (NOAA) describes the El Niño
phenomenon as a large-scale ocean atmospheric climate condition associated with periodic
warming of the sea surface temperatures. This happens across the central and east central
Equatorial Pacific affecting atmospheric circulation across the world (2016). To detect the
presence of El Niño, climate scientists use the Ocean Nino Index (ONI). When ONI is +0.5 or
higher, it indicates a presence of El Niño conditions meaning that the east central tropical
pacific is significantly warmer than usual (NOAA, 2016). ENSO is a term used to define the
El Niño/Southern Oscillation, an interaction between the atmosphere and ocean in the
tropical Pacific Ocean that results in a periodic variation between below-normal and above-
normal sea surface temperatures, and dry and wet conditions over the course of a few years
(NOAA, 2016). Every two to seven years, the ocean currents and winds shift, causing water
temperatures to warm and displace cold water (NOAA, 2016).
The 2015/16 drought in Swaziland was an El Niño induced drought driven by the warming
up of the Pacific Ocean in one the strongest El Niño events ever observed (African Climate
and Development Initiative, 2016). Historically, the worst El Niño event to hit Swaziland was
in 1991/92, which was characterised by the most severe impacts of drought, denting livestock
by 20% and leaving irremediable damage to crops. In fact, during the 2015/16 drought, rains
in Swaziland decreased drastically to reach their lowest levels in more than ten years (CBS,
2016; State of Environment Report, 2001). Monthly average rainfall in each region also
shows a significant dip in precipitation. In all regions, average rainfall dropped considerably
in 2015 and 2016, with the driest months experienced from April to September each year. In
the heat of the drought in 2016, Hhohho performed much better than all the regions, with an

4
annual average total of 987mm. Manzini also performed somewhat better with annual
rainfall of 559mm, given the drought situation. Lubombo and Shiselweni performed much
worse, recording meagre annual precipitation of 523mm and 487mm, respectively (see
Figure 1.2.2 below).
Figure 1.2.2 Average Monthly Rainfall (2014-2016)
Source: Author’s own representation of Swaziland Meteorological Services Data (2016)
Notes: Figure 3.1.2 below shows average rainfall each month in the four regions in
Swaziland from 2014 to 2016.
1.3. Socioeconomic Impacts of Drought
Natural disasters, prompted by weather and climate, are not preventable. Swaziland is prone
to climate related disasters such as droughts, cyclones, flash floods, and windstorms. Of all
the disasters, the highest mortality in Swaziland occurs during droughts (NDMA, 2016; also
see National Disaster Management Policy 2010). Droughts pose serious threats in sustaining
human life, natural ecosystems, and livelihoods. Indeed, without proper protection of human
life and the ecological infrastructure that make Swaziland the country it is, renders all the
developmental aspirations of the country futile. Drought as a climate phenomenon has
several proportions: meteorological, hydrological, agricultural, ecological, and
socioeconomic. When people talk of drought, they often refer to a meteorological or
hydrological drought.
A meteorological drought is about the degree of dryness and the duration of the dry period
over a given time. In effect, it entails the overall problematic and persistent dry weather
patterns (Botterill and Chapman, 2002). Closely related to the meteorological drought, is a
0
50
100
150
200
250
300
RA
INF
AL
L (
MM
)
Manzini Average Rainfall
(2014-2016)
2014 2015 2016
0
50
100
150
200
250
300
RA
INF
AL
L (
MM
)
Hhohho Average Rainfall
(2014-2016)
2014 2015 2016
0
50
100
150
200
250
RA
INF
AL
L (
MM
)
Shiselweni Average Rainfall
(2014-2016)
2014 2015 2016
0.0
50.0
100.0
150.0
200.0
Jan
Feb
Ma
r
Ap
r
Ma
y
Jun
Jul
Au
g
Sep
Oct
No
v
De
c
RA
INFA
LL (
MM
)
Lubombo Average Rainfall (2014-2016)
2014 2015 2016
5
hydrological drought. A hydrological drought is about the lack of rain (due to precipitation,
infiltration and evaporation) (Botterill and Chapman, 2002), such that the amount of water
available both in river catchments and ground water falls below the average levels. The
hydrology of an area depicts the distribution of surface water after precipitation. The reason
people easily identify with hydrological drought is that they get a first-hand experience of its
indicators through a reduction in stream flows and diminishing water levels in dams and
rivers.
An agricultural drought, on the other hand, is much subtler. It involves low commodity
production emanating from persistent high soil moisture deficiencies that impede crop
growth (Anil and Indira, 2007; Botterill and Chapman, 2002). Farmers are more likely to be
in tune with this kind of drought as they monitor their crops over growing seasons. The
problem with an agricultural drought is that the water demanded by crops far exceeds the
water available in the natural ecosystem.
Droughts have an impact on the sustainability of natural ecosystems, and hence, the
classification of an ecological drought. Over time, the tenacious dry conditions start to be a
limiting factor on the health and productivity of the environment, and thus, an ecological
drought describes the reduction of the productive capacity of natural ecosystems due to
insufficient precipitation (Anil and Indira, 2007).
The aggregate effects of meteorological, hydrological, agricultural, and ecological droughts
define a socioeconomic drought. Much of human livelihoods and economic activities depend
on the climate and its interactions with the natural ecosystem on the planet. Therefore, a
socioeconomic drought integrates aspects of all the types of droughts discussed above to
portray a situation where precipitation is not sufficient to meet human livelihood needs (Anil
and Indira, 2007). The curious consideration of disaster risk reduction, or more closely,
drought policy is that it attempts to address the socioeconomic effects of droughts on human
activities or livelihoods and resultant mitigation strategies needed in order to reduce their
combined impacts by identifying appropriate interventions (Botteril and Chapman, 2002).
Drought policy, and its accompanying drought mitigation programmes, offer countries the
opportunity to establish appropriate strategies necessary to reduce the adverse impact of
droughts on human and natural ecosystem well-being.
1.4. Framework for Assessing Socioeconomic Impacts of Drought
Considerations in disaster economics examine disasters in terms of the positive or negative
net effects on macroeconomic indicators such as GDP, employment, inflation, etc., and the
changes in the short and long-term (Baade et al. 2005). Benson and Clay (2003) argue that
in the short-term, disasters like the 2015/16 drought negatively affect income generation,
investment, consumption, production, employment, and financial flows.
Economists use the decline in macroeconomic indicators such as a fall in GDP or rise in
unemployment to capture the negative impacts of droughts. Likewise, economists use the
value of resources used or destroyed at efficient market prices (Rose and Lim, 2002) to
capture changes in welfare losses due to droughts. Unlike the economic costs, which are
straightforward to capture, the social costs of droughts are difficult to capture and are not
quantifiable through changes in GDP and other macroeconomic indicators. Dore and Etkin
(2000) explain that the social costs of disasters represent the total burden imposed by a
disaster. In actual value, it is the loss to society, whether tangible or intangible, including the
opportunity cost of resources deployed for reconstruction and relief.
Intangible losses are also important. They include disaster impacts related to lifestyle,
health, social tension and disruption, social capital accumulation, and environmental health
(Alston and Kent, 2004). Usually, the purpose of conducting a holistic socioeconomic

6
assessment is to shine light on the intangible, often ignored, impacts of drought. The reason
is that, when compared to other disasters, droughts do not cause structural damages (e.g.,
damage to property) (Mysiak, 2010). To be clear, droughts cause non-structural damages
such as declines in land value and agriculture yield failure. Moreover, the indirect losses of
drought such as decline in investment and increase in food imports can be much more severe
and spread over a long period of time. Therefore, an effective drought impact assessment
exercise needs to incorporate both the tangible and non-tangible effects, as well as spell out
the distributional effects of drought losses.
Disaster is not borne equally across individuals, households, and communities. A
socioeconomic impact assessment examines the positive and negative effects of a process or
development that introduces an element of change on people’s normal way of life. In that
sense, a drought is a meteorological process that has the potential to induce significant
changes that pose serious threats on human livelihoods. A socioeconomic impact assessment
provides a set of lens for scrutinising the whole process of drought and its effects on the day-
to-day human activities to assess the drought experience through the cultural, psychological,
and economic meanings people attach to the changes that develop from the drought
experience (see Lockie et al., 1999). It does not only focus on how individuals experience the
change; it also encompasses the likely responses of the people impacted by the change as
they try to maintain some form of normalcy in their lives. The assessment of how individuals
and families within their communities experience and respond to change creates an
appropriate background to design effective impact mitigation strategies that minimise
negative impacts of the change while maximising the positive impacts of that change. At a
broad level, such studies allow for effective planning and coordination of efforts. It is,
therefore, vital to determine not only the full range of impacts, such as changes to levels of
income and employment, access to services, and quality of life, but also the implications of
the impacts on sustaining livelihoods and the developmental goals of a country.
For the purposes of this study, an integrated socioeconomic assessment approach is
preferred to provide a holistic picture on the economic impacts and the dominant social
values attached to the drought dynamics that inform the attitudes and responses to the
2015/16 drought experience in Swaziland. The study follows an assessment process adapted
from Taylor, Bryan, and Goodrick (1995):
Scoping – defining the nature and boundaries of the drought impact
assessment on households.
Profiling – establishing the baseline livelihoods affected and the changes
induced by the drought on the different livelihood activities.
o Determine baseline impacts: what happened, who was affected, when,
where and how?
o Determine the extent and scale of livelihood activities affected and the
ranges of attitudes and values attached to the affected activities.
o Make considerations on the historical, regulatory, and other
socioeconomic factors distressing the key livelihoods affected.
o Mitigation and management of impacts.
Evaluation of impacts versus management of impacts through the analysis of
the overall implications of the drought on the country’s development goals
and disaster management policy.
1.5. Prior Studies and Mitigation Activities in Swaziland
Following the declaration of the drought disaster in February 2016, the Deputy Prime
Minister’s Office (DPMO) produced a drought Rapid Multi-Sectorial Assessment Report:
2015/16 Season, to ascertain the effects of the extreme drought impacts on the different

7
sectors of the economy in Swaziland. Primarily, the multi-sector rapid assessment focused
on levels of chronic food insecurity, water and sanitation, nutrition, health, livelihoods
vulnerability in rural and urban households across the four regions in Swaziland. In addition
to the rapid drought assessment, the NDMA also released a Swaziland National Drought
Response Issue No.1, which documents sector needs, responses, gaps and constraints
pertaining to the 2015/16 drought situation. The rapid assessment provides a snapshot of the
adverse effects of the drought in order to inform evidence based multi-sector preparedness
and response planning under the NDMA’s disaster management mandate. This
socioeconomic impact report builds on the rapid assessment report, to provide more
localised and much detailed assessment of the impacts of the drought. The report paints a
more detailed picture on the levels of household vulnerability, resilience and recommends
responses suitable for the most vulnerable groups in both rural and urban communities.
Since the drought phenomenon is mostly concerned with the mechanics of water supply and
demand in the natural hydrological system for food production and general economic
consumption, the drought rapid assessment provides expedient background information on
the rainfall performance over the 2015/16 season. Therefore, for a complete analysis of the
rainfall water situation for the 2015/16 drought, characterised by a 50% reduction in normal
rainfall due to the effects of the El Niño Southern Oscillation (ENSO), the rapid assessment
report is a recommended preamble to this socio-economic impact assessment report. The
key themes discussed in the drought rapid assessment report include rainfall performance
2015/16 season; water, sanitation situation and the environment; crop production and food
security; livestock; agribusiness; energy and the environment; health and nutrition;
protection; access to information and services; and education.
On the other hand, The Swaziland National Drought Response Issue No.1 provides a
detailed overview of the drought impacts at the national level, and the interventions
implemented by the NDMA and development partners. It provides excellent information on
the number of people affected and budget needed to respond to the impacts under the key
programme areas: health & nutrition; education; water sanitation and hygiene (WASH);
agriculture & food security; protection; and coordination. The report is an arm of the
NERMAP (2016 – 2022), which documents the immediate actions and planned long-term
interventions that the Government of Swaziland has been able to implement in light of the
2015/16 drought.
The assessments contained in this study support findings of both the rapid 2016 Rapid
Multi-Sectorial Assessment Report and the Swaziland National Drought Response Issue No.
1. Essentially, the idea behind this report is to expand on the drought rapid assessment and
drought response reports by zooming in on the drought mechanics at the household level in
Swaziland. By doing so, this report generates more evidence that documents the drought
impacts and responses, and fills in the necessary household research gaps that will enhance
policy and drought/disaster response programmes.
8
RESEARCH METHODS
2.1. Research Design and Methods n order to assess the socioeconomic impact of the 2015/16 drought in the country at the
household level, the study conducted a detailed Socioeconomic Drought Assessment
Survey for the first time in Swaziland in November/December 2016, using a household
questionnaire designed to examine:
Household Demographics;
Asset Mapping and Risk to Poverty;
Potable Water Availability;
Income Availability;
Drought Impacts and Coping Mechanisms;
Drought Impact Significance;
Household Networks/Social Involvement, and
Drought Mitigation Measures and Response Behaviours.
The survey used a sample of 2,958 households. The sample was drawn by taking the smallest
geographic units called Census Enumeration Areas (EAs) in Swaziland and stratifying all EAs
across the country into regions and geographical areas (urban/rural). Two hundred and
ninety-six (296) EAs (see Figure 2.1.1) were randomly sampled using the probability
proportionate to its size (PPS) in the overall population as per the 2007 Swaziland
Population and Housing Census. The sampling strategy randomly selected ten households
within each EA. From each household, a respondent 18 years of age or older was selected to
answer the questionnaire. The respondent had to be the breadwinner or an adult related to
the breadwinner and be involved in decision-making in the household.
In addition to the survey, the study also interviewed select government, non-governmental
organisations, and businesses to establish the intensity and constraint the drought has had
on water dependent business activities, including implications on social welfare and
developmental targets during the period 2015/16. The study made an effort to interview all
relevant stakeholders. However, not all stakeholders were available (or agreed) for
interviews. The following stakeholders agreed to be interviewed:
Ministry of Natural Resources and Energy, Swaziland Electricity Company,
Swaziland Energy Regulatory Authority;
Department of Water Affairs, Swaziland Water Services Corporation, Swaziland National Meteorological Department;
Ministry of Agriculture, National Maize Corporation, Swaziland Meat Industries, Swaziland Sugar Association, Komati Basin Water Authority
(KOBWA);
Municipal Council of Mbabane, Matsapha Town Council, Royal Swaziland
Police Service;
Swaziland Environmental Authority, Swaziland Tourism Authority, Swazi
Trails;
Ministry of Education, Mbabane Regional Education Officer;
Ministry of Health, EU, American Embassy, DPMO – Social Welfare
Department, Central Bank of Swaziland.
I

9
Figure 2.1.1 Swaziland EA Map
Source: SEPARC’s own representation of Survey Data (2016)
2.2. Survey Data Collection
The study collected data using a questionnaire, attached in the appendices, developed in line
with the thematic areas of socioeconomic assessments of drought. The NDMA was consulted
to approve the appropriateness of the questionnaire.
2.2.1. Piloting
Piloting activities were conducted in Enumeration Areas (EAs) in Ezulwini for eighty (80)
practice interviews. The piloting exercise was undertaken in both urban and rural areas,
including formal and informal settlements. Each fieldworker conducted two practice
interviews: one with an English version and another interview using a SiSwati version of the
questionnaire. The instruments were pretested for language used, comprehension, and
effectiveness of the questionnaire to collect the data required for the socioeconomic analysis.
All processes and procedures with regards data collection were assessed, including:
10
Each fieldworker conducting two interviews, one with a male, and the other with a
female respondent.
Each fieldworker conducting one interview with a siSwati questionnaire and the other in English.
Fieldworkers testing the sampling methodology for starting points, household selection, and selection of respondents.
Assessing how well the questionnaire worked.
2.2.2. Data Collection
Under the leadership of the field manager, a team of two field supervisors led the field
process. Field teams constituted of one field supervisor and eight enumerators. Fieldwork
lasted a period of 33 consecutive days. For the purposes of data collection, the study
coordinator supplied each fieldworker with an ID detailing their name, and the contact
names and numbers of their supervisor and research provider. In approaching respondents,
included - but not limited to - were assurance of confidentiality, the general research purpose
for which the data would be used for, name of the research provider, and that participation
was voluntary.
2.3. Data Quality Assurance
The study maintained quality assurance through a number of quality standards and
protocols. The provision of supervision ensured field workers' adherence to, and
maintenance of quality standards, in (1) household entry procedures, (2) obtaining and
documentation of informed consent, (3) data collection (including but not limited to
completeness and accuracy of data records). Supervisors observed and recorded the field
workers' adherence to procedures throughout the interview and provided feedback to the
enumerators, as part of continued quality assurance upon leaving the household. Each team
supervisor conducted at least one back-check in every enumeration area. The supervisor
conducting the back-check informed respondents that the purpose of the post interview visit
verified that interviewers asked all questions and recorded all responses correctly. This was
done by randomly selecting and re-asking a few questions. Team supervisors alternated
between interviewers for back-checks. Even though the study randomised the data collection
process, the supervisor made sure to back-check each enumerator an equal number of times.
2.4. Data Analysis
Analysis in this study involved use of primary and secondary data. To achieve research
objectives I and II, the study used the Survey to obtain primary data on the impact of the
drought at the household level and the related coping mechanisms employed. The study
grouped and coded the responses from the Survey into the themes discussed in the rapid
drought assessment, including new themes that emerged from the data. The study used the
descriptive and statistical bulletins contained in the demographics, household wealth and
poverty indicators, potable water, and income indicators in Section 2.1 to ascertain the direct
and indirect impacts of the drought on households. To calculate the losses in household food
consumption due to the drought, the study used the reported changes in household food
expenditure from the Survey. Due to a lack of baseline information on household
consumption data prior to the drought, the study used data from the Swaziland Population
Census (2007), which provides an estimation of total households in the four regions of
Swaziland according to geographic (rural or urban) distribution. The Census data reports
that there are 212,195 households, of which Hhohho constitutes 60,725 (29%), Manzini
72,108 (34%), Shiselweni 37,066 (17%), and Lubombo 42,296 (20%) households. These
figures are used to base the estimations on consumption losses per region per household.
The household food expenditure basket, derived by categorising food consumed in the
11
households into the following major food groups: mealie-meal, rice, vegetables, meat/fish,
pulses, oil, sugar, and milk, was used to calculate average household food expenditure per
region apportioning the calculation into rural and urban households as shown in Table 4.6.1
(on page 60). The resultant expenditures are then used to calculate food consumption losses
due to the drought according to the reported food consumption losses at the household
level1, as shown in Table 4.6.1. A summation of the total losses per region and across the four
regions per month provides an estimate of the total economic losses due to reduced
consumption at the household level. These are multiplied over a period of 21 months to
estimate the entire losses due to the drought, as shown in Table 4.6.2 on page 61. The study
adopts 21 months because food inflation started increasing in March 2015 and the first rains
only started falling in late November 2016, suggesting that the critical timeframe for the
effects of the drought on food expenditure in households was from March 2015 to November
20162.
To achieve objective III, the analysis compared the experiences of households and sector
economic activity constraints to the NDMA’s disaster management legislative framework –
National Disaster Management Act and Disaster Risk Management Policy. Objective III
gauges the country’s resilience to drought disasters. It also serves to recommend strategies
necessary to ensure that the country is drought-proof both at the household and regional
level. Drought proof households have security of income and livelihood, security of food, and
security of water, fuel-wood and fodder. At the constituency or regional level, it speaks to
stable agricultural and industrial production without any disturbances in the provision of
water, as well as sustainable use of land and water without any disturbances in food and fibre
production, and integration of drought prone areas into the mainstream economy. The total
accounts of how households and business activity fared during what interview respondents
described “the most severe drought the country has ever experienced since the 1980s”,
provide a platform to deduce the implications of natural disasters on the country’s
developmental aspirations as per the last objective (IV) of the study. The study then makes
inferences on the high order implications on the dynamics, and cascading effects, of the
drought on households and the economy as a whole to establish what the country stands to
lose or gain in its developmental aspirations given drought shocks.
To attach a monetary value on the drought impacts, the study made a summation of all the
money spent in intervention programmes, including the immediate direct losses incurred in
the key sectors of the economy affected by the drought. Due to limited data, the estimation
included Government and donor intervention programmes on health and nutrition,
education, WASH, agriculture and food security, protection and coordination; the
agriculture sector focusing on maize, sugar, beef and cotton production; and energy and
water as separate sectors focusing on SEC and SWSC operations.
1 In the questionnaire, respondents were asked to estimate the change in their monthly food expenditures. A scale comprising 0%, 25%, 50%, and 75% was used. Please see questionnaire in the appendix. 2 Although increases in the cost of food (as shown by inflation) started in March 2015 and peaked in December 2016, the effects of the drought on households are not necessarily immediate. Similarly, although rains started coming back in late November 2016, changes in food costs due to the rains were also not immediate.
12
SOCIOECONOMIC
IMPACTS ON HOUSEHOLDS
3.1. Profile of Sampled Households
his section discusses the demographic profile of households sampled for the drought
socioeconomic impact study. The demographic profile includes information on
household characteristics such as respondent’s status in a household, age, marital
status, education level, and number of dependents. For ease of reading, please note
that all figures are in Appendix A: Figures and Tables.
Figure 3.1.1 (in the appendix) shows that approximately 80% of the survey respondents were
breadwinners in their households. The study defines a breadwinner as a decision-maker
responsible for overall household management including other household members and the
livelihood dynamics in a family unit. Given the high number of respondents actually in
charge of the households in the sampled households, the data provides a reliable
representation of the experiences of households during the drought and thus makes a
reliable assessment of the impacts of the drought at the household level. A further analysis of
the demographic profile of respondents shows an almost even distribution between both
male and female household breadwinners (Fig 3.1.2 in the Appendix). Similarly, single and
widowed household breadwinners were almost the same in the sample. The age distribution
(25 to 54 years) is in line with with the population pyramid in Swaziland in 2007 which
depicts that Swaziland has a young a population. However, there is also a sizeable (20%)
number of elderly people aged 65 years and older, (Fig 3.1.4 in the Appendix). The data
further show a considerable number of older people (above 65 years) who are still in charge
of providing sustenance in households, especially in rural Swaziland.
In terms of education, household dependents, and gender dynamics, the data conforms to
Swaziland’s expected situation. Of the sampled population, 81% has primary or higher level
of education with the rest of the sampled population (19%) with no formal education. For
those with some form of education, two thirds have either a primary, secondary or high
school education. The rest, constituting 13% of the sample, hold a degree or have some form
of vocational skills (Fig 3.1.5). The education data reveals that, on average, the number of
people with a primary level of education or more is greater than the number of people
without any form of education. The data further evinces that females are most likely to have
no formal education compared to males (two thirds of females compared to one third of
males).
More males for example have vocational skills and higher-level education degrees than their
female counterparts. However, there are more females with primary, secondary, and high
school education than males (Fig 3.1.5 in the Appendix). In general, most household heads
have between two (2) to five (5) dependants (defined as people they are directly responsible
for) (Fig 3.1.6 in the appendix). Worth noting is that females have a higher number of
dependents or household members they are responsible for while more than 75% of the
households with a high dependency ratio are in rural areas (Figures 3.1.7 and 3.1.8 in the
Appendix).
In summary, the household demographics demonstrate that Swaziland has a young
population (18 – 54 years) with a considerable number of elderly and widowed people who
are breadwinners. Recall that in the introduction it was argued that the extent of the drought
impacts on households depend on their socioeconomic conditions or situation of individual
T
13
households at the onset of the disaster. The combination of the household characteristics in
terms of size, dependents, education, age, and extent of a family’s exposure to social
networks, plays a crucial role in determining households’ exposure to risks from climate
shocks. It is also important for providing a nuanced understanding of how each household
positioned itself to respond appropriately to the shocks, for example, in providing answers to
the question: who among younger and elderly breadwinners is more likely to implement the
most effective or sophisticated coping mechanisms to eliminate the worst impacts of the
drought?
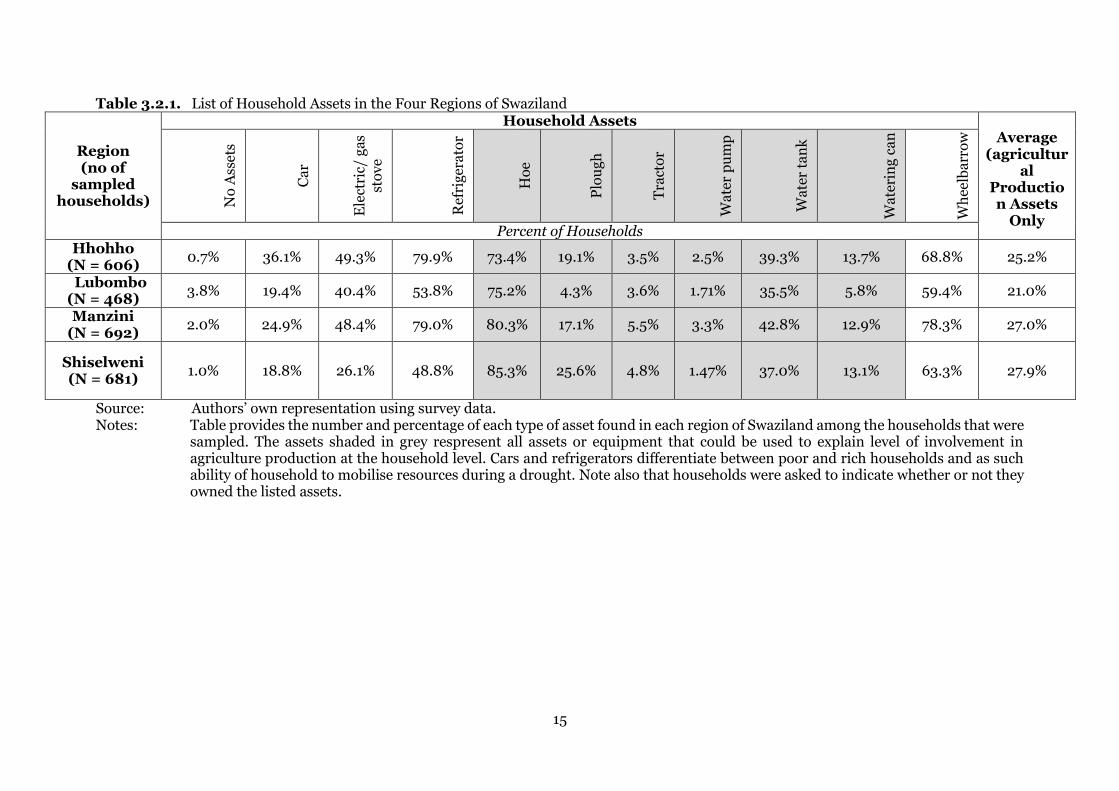
3.2. Asset Mapping and Assessment of Risk to Poverty
This section provides a description of household livelihood security based on access to
income, resources, and ownership of assets. It assesses the general level of wealth versus
poverty among the households. Households engaged in sustainable income generating
activities, in addition to having access to wealth in the form of assets, tend to be less
vulnerable to climate shocks such as drought (VAC, 2014). On the other hand, households
experiencing high levels of poverty without adequate access to resources and assets to
cushion exposure to disaster tend to be most vulnerable and as such are heavily affected by
the adverse impacts of drought. Therefore, the study is interested in understanding the
assets in households as a proxy of their socioeconomic condition at the onset of the drought.
Accordingly, Table 3.2.1 lists typical household assets and makes comparisons between the
four regions of Swaziland. Since droughts have a direct impact on the availability of water
and therefore the level of agriculture activity in households, the survey takes keen interest on
assets used in agricultural production assets such as ploughs, tractors, water pumps, water
tanks, watering cans, and wheelbarrows, among other assets. Table 3.2.1 illustrates that
households in Hhohho and Manzini possess a lot of agricultural production assests while
households in Lubombo and Shiselweni lag behind, such that the most households without
any of the typical household assets particularly used in agricultural production in rural
Swaziland are found in Lubombo (3.8%). This is consistent with findings from the SHIES
(2010), which revealed that the incidence of poverty is actually higher in the Lubombo and
Shiselweni regions (69% and 68% respectively) compared to 61% in Hhohho and 58% in the
Manzini region.
As explained in the VAC (2016), lack of asset ownership is a proxy for the likelihood of
extreme poverty within a household. It can also be used as a proxy of a lack of involvement in
agricultural production. The data shows that households living in the Lubombo region are
three times as likely to be adversely affected by the drought than households in Hhohho and
Shiselweni while Manzini households are less likely to be affected by the drought. The
distribution of typical household assets per region between rural and urban households is
also widely concentrated in the Hhohho and Manzini regions, although there are intra
regional variations in asset ownership. For example, Figure 3.2.1 in the appendix shows that
although water pumps and tanks are good assets to own for water security at the household
level, households in Shiselweni (1.47%) and Lubombo (1.71%) had the least number of water
pumps. During a drought, pumps and water tanks enable households to extract and store
water when conventional water sources run dry. Manzini (3.3%) and Hhohho (2.5%) had the
most number of water pumps (see Table 3.2.1). Still, considering that drought-like
conditions have worsened in the country in the last decade, the number of water pumps and
tanks at the household level is low.
Assets that are an indicator for agriculture activity within households (such as ploughs,
tractors, watering cans, and hoes) are most prevalent in the Shiselweni region (27.9%)
followed by Manzini (27.0%) and Hhohho (25.2%) regions, respectively. Lubombo lags
behind at 21.0%. This suggests that households in Shiselweni, Manzini, and Hhohho regions

14
are most likely to engage in agriculture as a vehicle to sustain their livelihoods. Though
households in Lubombo have these assets, they fall far below the levels in the other regions
of Swaziland – suggesting that households in the Lubombo region are to some level,
discouraged from agriculture production and thus more vulnerable to drought induced food
insecurity. Not surprisingly, the SHIES (2010) found that extreme poverty also known as
food poverty was the highest in the Lubombo region, rising from 32% in the year 2000 to
37% in 2010. In contrast, extreme poverty or food poverty in the Shiselweni region decreased
from 38% to 27% between 2000 and 2010 (SHIES, 2010). Indeed, information on household
farm or backyard garden ownership (see Figure 3.2.2 in the appendix) confirms that the
most active fields and gardens are found in Shiselweni, Manzini, and Hhohho, respectively,
while Lubombo lags behind.
15
Table 3.2.1. List of Household Assets in the Four Regions of Swaziland
Region (no of
sampled households)
Household Assets Average
(agricultural
Production Assets
Only N
o A
sse
ts
Ca
r
Ele
ctri
c/ g
as
sto
ve
Ref
rig
era
tor
Ho
e
Plo
ug
h
Tra
cto
r
Wa
ter
pu
mp
Wa
ter
tan
k
Wa
teri
ng
ca
n
Wh
eelb
arr
ow
Percent of Households Hhohho
(N = 606) 0.7% 36.1% 49.3% 79.9% 73.4% 19.1% 3.5% 2.5% 39.3% 13.7% 68.8% 25.2%
Lubombo (N = 468)
3.8% 19.4% 40.4% 53.8% 75.2% 4.3% 3.6% 1.71% 35.5% 5.8% 59.4% 21.0%
Manzini (N = 692)
2.0% 24.9% 48.4% 79.0% 80.3% 17.1% 5.5% 3.3% 42.8% 12.9% 78.3% 27.0%
Shiselweni (N = 681)
1.0% 18.8% 26.1% 48.8% 85.3% 25.6% 4.8% 1.47% 37.0% 13.1% 63.3% 27.9%
Source: Authors’ own representation using survey data. Notes: Table provides the number and percentage of each type of asset found in each region of Swaziland among the households that were
sampled. The assets shaded in grey respresent all assets or equipment that could be used to explain level of involvement in agriculture production at the household level. Cars and refrigerators differentiate between poor and rich households and as such ability of household to mobilise resources during a drought. Note also that households were asked to indicate whether or not they owned the listed assets.

16
Livestock data also paints a bleak picture on participation in agriculture to ensure food
security in the Lubombo region. Even though livestock (cattle, poultry, goats, sheep, pigs,
and ducks) is spread almost evenly across the four regions, Lubombo holds the least number
of livestock3 (both in quantity and type of livestock) (see Figure 3.2.3 in the appendix). The
data show that Swazi households have livestock assets, in decreasing order, in the form of
poultry, cattle, goats, pigs, ducks, and sheep. This is not surprising as chicken and beef form
part of the staple diet in most Swazi households, while pork has, in recent years, been
increasing in popularity. Surprisingly, there is growing popularity of goat meat4 in Swazi
diets.
Besides assets that are closely linked to agriculture and water management in the
households, there are other important household assets and indicators that determine the
overall level of livelihood security and could shield households from poverty and climate
induced shocks. A positive characteristic of Swazi homes demonstrated by the data is that
the majority of household heads own their houses or homes. The older the household head,
the more likely they are to own their house or living quarters. In urban areas, however, the
general trend is that people are renting (though there are some who own) their living
establishments (see Figure 3.2.5 in appendix). There are some households that live on free
rent or board, especially younger people being supported by their parents or family
members. Though the majority of the surveyed households consist of modest living
structures, the prevalence of stick and mud homes is very low at 21% of the total households
sampled (see Figure 3.2.7). About 80% of people live in stable concrete structures with 65%
of these homes using electricity as their main lighting energy source (see Figure 3.2.8 in the
appendix). While electrification of rural households in Swaziland has been extensive
(Swaziland electricity access index is estimated close to 70% according to SEC 2014/2015
Annual Report), 33% of households still rely on candles and oil lamps to light their
households.
Remarkably, while households choose to light their homes using electricity, they use
firewood for cooking purposes. Figure 3.2.9 in the appendix demonstrates that a significant
number of households (70%) still use firewood for cooking. An additional 4% of households
use coal or paraffin, while another 4% use natural gas (handy gas). Only 22% of households
use electricity to cook their meals. The implication is that there is widespread deforestration
that derives from the need to provide wood-fuel for cooking and heating purposes,
particularly rural households. Deforestation for fuel-wood has a negative impact on
sustaining biodiversity in natural ecosystems. What is worse is that, cutting down trees for
fuel-wood during the drought, when the forest ecosystem is already fragile, can be
detrimental to the regenerative capacities of forest ecosystems in the country. Moreover, the
burning of fuel-wood increases air pollution and makes household members prone to
respiratory diseases. Similarly, paraffin is also linked to toxic fumes and respiratory diseases
in households, while candles are a known fire hazard.
Building resilience at the household level is about making sure that households have the
resources, assets, and services that would allow them to appropriately reorganise their lives
in the event of a disaster, so that they can maintain some normalcy in their livelihoods. The
foregoing discussion demonstrates that households that are more vulnerable to droughts are
found in the Lubombo and Hhohho regions. In these households, there is limited
agricultural activity as shown by the number of agricultural assets such as water harvesting
and water storage assets, tractors and hoes, which were in small quantities relative to the
3 Livestock (goats, cattle, and sheep) almost exclusively found in rural households. 4 The rise in goat meat (chevon) consumption in Swaziland probably derives from the upsurge in Asian population, especially people from Bangladesh.

17
other regions. Moreover, the data shows that the level of involvement in agricultural
production is generally low in rural Swaziland. For instance, the number of agricultural
assets in the respective households is lower than 30%, even in Shiselweni which had the
highest number of agricultural assets. Since the study uses the number of agricultural assests
as a proxy for the level of involvement in agricultural (food) production in households, the
data shows that the level of agricultural production at the household level in rural Swaziland
is on average at 25.3% (average of total agricultural assets owned in each region). Whereas
the level of agricultural production in the country is generally very low, households in the
Shiselweni region showed a higher propensity to participate in agriculture (or food)
production than anywhere else in the country. The implication is that by simply increasing
investment into water harvesting and storage infrastructure in Shiselweni, the level of
agricultural production in the country could improve.
3.3. Household Expenditure and Income Availability
Income generating activities are the key drivers of livelihoods and maintenance (Hajdu et al.,
2011). This section discusses the general methods used by households to make money. It also
discusses how households spend such annuities to sustain their livelihoods. A sustainable
income, defined as proceeds that allows a family unit to meet all of its basic needs or
expenses while also saving for life contingencies, is a critical component of building
flexibility to cushion households against economic, lifestyle, and natural disaster shocks.
The data reveal that a large proportion of monthly incomes in Swaziland go to education
(E600), transportation (E220), savings (E230), meat/fish (E220), mealie meal (E210),
clothing (E180), rice (E150), and airtime (E100). Not including rent, education and food
expenses take up a bulk of household budgets. Even though education is free at primary level
in Swaziland, parents still have to spend money on school uniforms, bus fares, books, and
pocket money for their children. The remainder of the budget goes to savings,
transportation, and communication (see Figure 3.3.1 in the appendix). The data shows that
households in the Hhohho and Manzini regions are top savers. Modest livelihoods, in terms
of household expenses, are in the Lubombo region. The data also shows that households
spend consistently higher incomes on airtime in all the four regions, suggesting a high level
of mobile phone usage. The implication of this on Disaster Management Policy, especially
concerning sending information, is that it is possible to deliver timely information directly to
households through mobile phones.
The study examined sources of income and the levels of income between households to
determine how households earn their livelihoods in Swaziland. When asked to describe their
main source of income, households reported that they either were unemployed (50%),
employed by private sector (21%) or employed by government (13%). There is also a
relatively high number of pensioners (7%), especially in rural areas (see Figure 3.3.2 in the
appendix). Households also make income from remittances from urban to rural households,
professional employment, trading, and livestock and crop farming. However, as can be seen
on Figure 3.3.2 in the appendix, the contribution of agriculture to income generation at the
household level is very small and almost negligible. Income distribution among households
is very wide. The data show that 45% of the households earn between E1,000 to E3,000 on a
monthly basis (see Figure 3.3.2 in the appendix). Figure 3.3.2 shows that households earning
above E6,000 constitute 15% of the sampled population, with a comparable 14% of people
with no form of income. Hhohho and Manzini regions have the highest number of high-
income earners – which explains why households in these regions tend to save more than
those in Lubombo and Shiselweni, which show a high number of low-income earners in
households.

18
The implication of these findings is that in rural areas a lot more people need to be engaged
in income generating activities in order to restore dignity and independence in households so
that they can be responsible for their own livelihoods. This is especially true for rural
households, which tend to have many dependents. The interdependences between rural and
urban households are also evident and seem to be one way: even though some household
heads in rural areas do not have formal employment, they tend to be dependent on urban
households for income support. For those that are able to earn income, the amount of
disposable income they have is relatively small, leaving little room for savings or flexibility to
vary or change lifestyles for the better within each family unit. Income generating activities
in all forms, be it formal or informal, need to be encouraged, particularly in rural
households. Secure incomes and ability to save on that income becomes the first component
of insurance to shirk risks from exposure to disasters such as droughts. The majority of
Swazi people responsible for their lives, and the livelihoods of others in households across
the country, are unemployed. The SHIES (2010) reports that one in two Swazis are without
productive employment.
3.4. Availability of Potable Water
This section assesses the availability of potable water in households across the 55
constituencies in Swaziland. Figures 3.4.1 in the appendix provides an illustration of the
main sources of drinking water when there is no drought. The results show that 40% of
households have access to potable SWSC or public tap water, and 15% rely on boreholes
when there is no drought. A substantial number of households (35%) still rely on rivers,
streams, lakes, and protected and unprotected springs as their primary source of drinking or
cooking water when there is no drought. Fifteen percent (15%) of the surveyed households
use boreholes as their primary source of drinking water, particularly in Lubombo and
Shiselweni. Surprisingly, less than 4% of the surveyed households engage in rainwater
harvesting as their main source of potable water. The use of rivers, streams, and springs is
chiefly a rural phenomenon whilst most households that use tap water are mainly in urban
areas. Figure 3.4.2 in the appendix describes drinking water sources when there is drought.
The Figure shows that during the 2015/16 drought the use of SWSC and public tap water
dropped from 40% to 33%, understandably so, since there was no water in taps due to
rationing. In the same vein, rainwater harvesting also dropped to 2% during the drought
because there were no rains. On the other hand, rivers, streams, boreholes, and both
protected and unprotected springs sustained water supply to households during the drought.
There was only a slight drop (24% to 21%) for households that used rivers for their main
source of drinking water during the drought. However, rural areas saw an increase in the
number of households that used rivers for drinking water (16% when there is no drought to
22% during the drought).
Having compared drinking water sources when there is no drought to when there is a
drought, the section below demonstrates the average daily water consumption in households
before and during the drought. This is important to determine whether the drought affected
overall water consumption in households – given the extreme water shortages that were
experienced throughout the whole country – particularly in Hhohho, Lubombo, and
Shiselweni regions. Table 3.4.1 below and Figure 3.4.3 (in the appendix) demonstrate that
households in the Hhohho and Lubombo regions significantly reduced water consumption
during the drought. Manzini and Shiselweni regions used more or less the same amount of
water before and during the drought. These regions were also least affected by water
rationing. The household questionnaire also probed households on average monthly water
costs in order to compare whether the cost has an effect on the average consumption in each
household, as shown on Table 3.4.3. Shiselweni experienced the highest increase in water
costs, followed by Hhohho, Manzini, and Lubombo respectively.
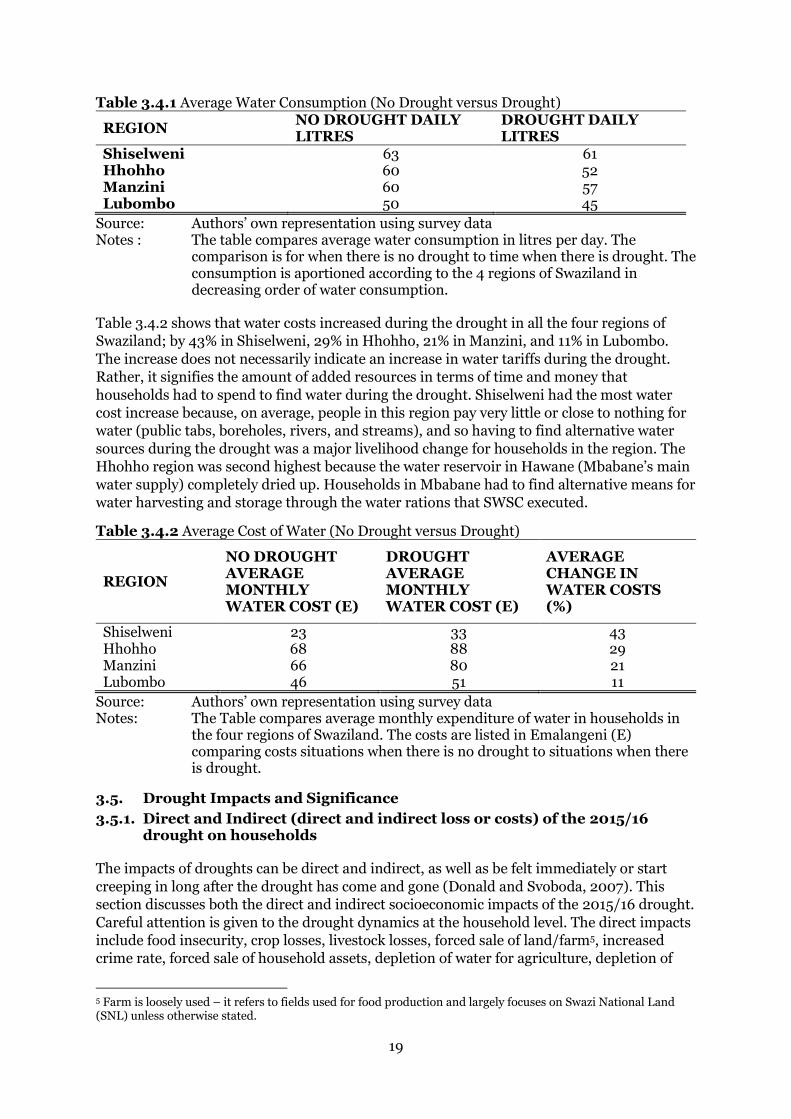
19
Table 3.4.1 Average Water Consumption (No Drought versus Drought)
REGION NO DROUGHT DAILY LITRES
DROUGHT DAILY LITRES
Shiselweni 63 61 Hhohho 60 52 Manzini 60 57 Lubombo 50 45
Source: Authors’ own representation using survey data Notes : The table compares average water consumption in litres per day. The
comparison is for when there is no drought to time when there is drought. The consumption is aportioned according to the 4 regions of Swaziland in decreasing order of water consumption.
Table 3.4.2 shows that water costs increased during the drought in all the four regions of
Swaziland; by 43% in Shiselweni, 29% in Hhohho, 21% in Manzini, and 11% in Lubombo.
The increase does not necessarily indicate an increase in water tariffs during the drought.
Rather, it signifies the amount of added resources in terms of time and money that
households had to spend to find water during the drought. Shiselweni had the most water
cost increase because, on average, people in this region pay very little or close to nothing for
water (public tabs, boreholes, rivers, and streams), and so having to find alternative water
sources during the drought was a major livelihood change for households in the region. The
Hhohho region was second highest because the water reservoir in Hawane (Mbabane’s main
water supply) completely dried up. Households in Mbabane had to find alternative means for
water harvesting and storage through the water rations that SWSC executed.
Table 3.4.2 Average Cost of Water (No Drought versus Drought)
REGION
NO DROUGHT AVERAGE MONTHLY WATER COST (E)
DROUGHT AVERAGE MONTHLY WATER COST (E)
AVERAGE CHANGE IN WATER COSTS (%)
Shiselweni 23 33 43 Hhohho 68 88 29 Manzini 66 80 21 Lubombo 46 51 11
Source: Authors’ own representation using survey data Notes: The Table compares average monthly expenditure of water in households in
the four regions of Swaziland. The costs are listed in Emalangeni (E) comparing costs situations when there is no drought to situations when there is drought.
3.5. Drought Impacts and Significance
3.5.1. Direct and Indirect (direct and indirect loss or costs) of the 2015/16 drought on households
The impacts of droughts can be direct and indirect, as well as be felt immediately or start
creeping in long after the drought has come and gone (Donald and Svoboda, 2007). This
section discusses both the direct and indirect socioeconomic impacts of the 2015/16 drought.
Careful attention is given to the drought dynamics at the household level. The direct impacts
include food insecurity, crop losses, livestock losses, forced sale of land/farm5, increased
crime rate, forced sale of household assets, depletion of water for agriculture, depletion of
5 Farm is loosely used – it refers to fields used for food production and largely focuses on Swazi National Land (SNL) unless otherwise stated.
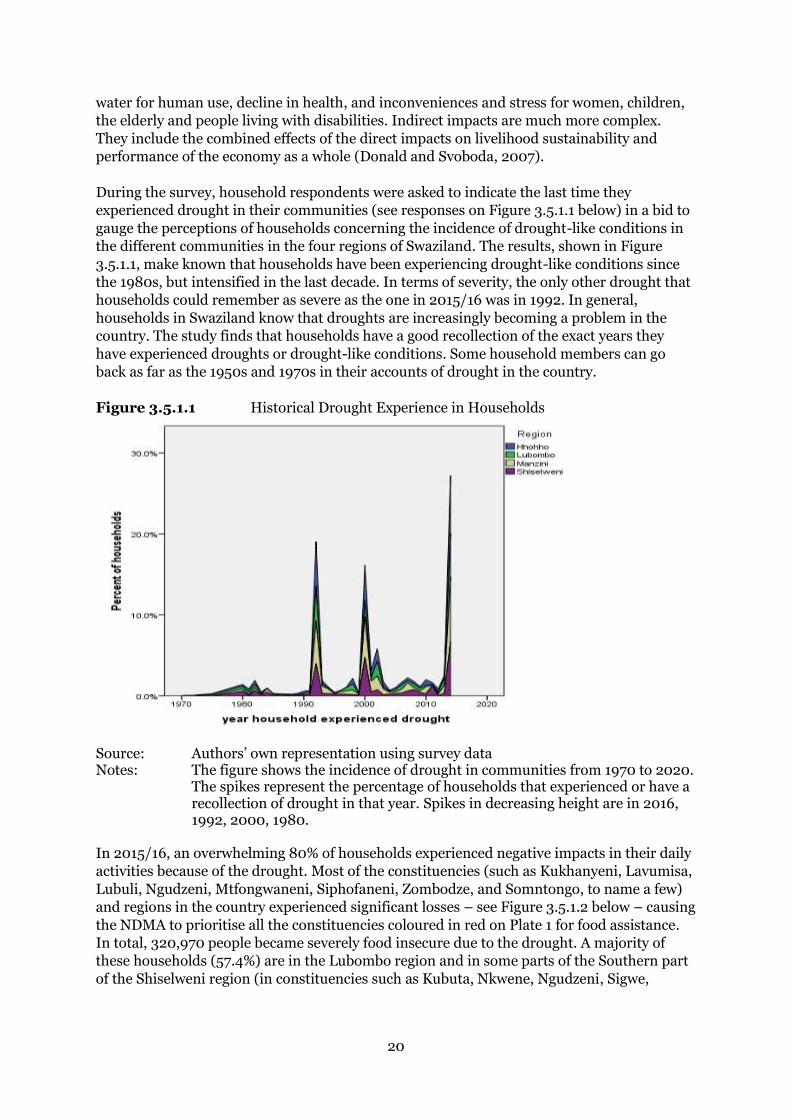
20
water for human use, decline in health, and inconveniences and stress for women, children,
the elderly and people living with disabilities. Indirect impacts are much more complex.
They include the combined effects of the direct impacts on livelihood sustainability and
performance of the economy as a whole (Donald and Svoboda, 2007).
During the survey, household respondents were asked to indicate the last time they
experienced drought in their communities (see responses on Figure 3.5.1.1 below) in a bid to
gauge the perceptions of households concerning the incidence of drought-like conditions in
the different communities in the four regions of Swaziland. The results, shown in Figure
3.5.1.1, make known that households have been experiencing drought-like conditions since
the 1980s, but intensified in the last decade. In terms of severity, the only other drought that
households could remember as severe as the one in 2015/16 was in 1992. In general,
households in Swaziland know that droughts are increasingly becoming a problem in the
country. The study finds that households have a good recollection of the exact years they
have experienced droughts or drought-like conditions. Some household members can go
back as far as the 1950s and 1970s in their accounts of drought in the country.
Figure 3.5.1.1 Historical Drought Experience in Households
Source: Authors’ own representation using survey data Notes: The figure shows the incidence of drought in communities from 1970 to 2020.
The spikes represent the percentage of households that experienced or have a recollection of drought in that year. Spikes in decreasing height are in 2016, 1992, 2000, 1980.
In 2015/16, an overwhelming 80% of households experienced negative impacts in their daily
activities because of the drought. Most of the constituencies (such as Kukhanyeni, Lavumisa,
Lubuli, Ngudzeni, Mtfongwaneni, Siphofaneni, Zombodze, and Somntongo, to name a few)
and regions in the country experienced significant losses – see Figure 3.5.1.2 below – causing
the NDMA to prioritise all the constituencies coloured in red on Plate 1 for food assistance.
In total, 320,970 people became severely food insecure due to the drought. A majority of
these households (57.4%) are in the Lubombo region and in some parts of the Southern part
of the Shiselweni region (in constituencies such as Kubuta, Nkwene, Ngudzeni, Sigwe,
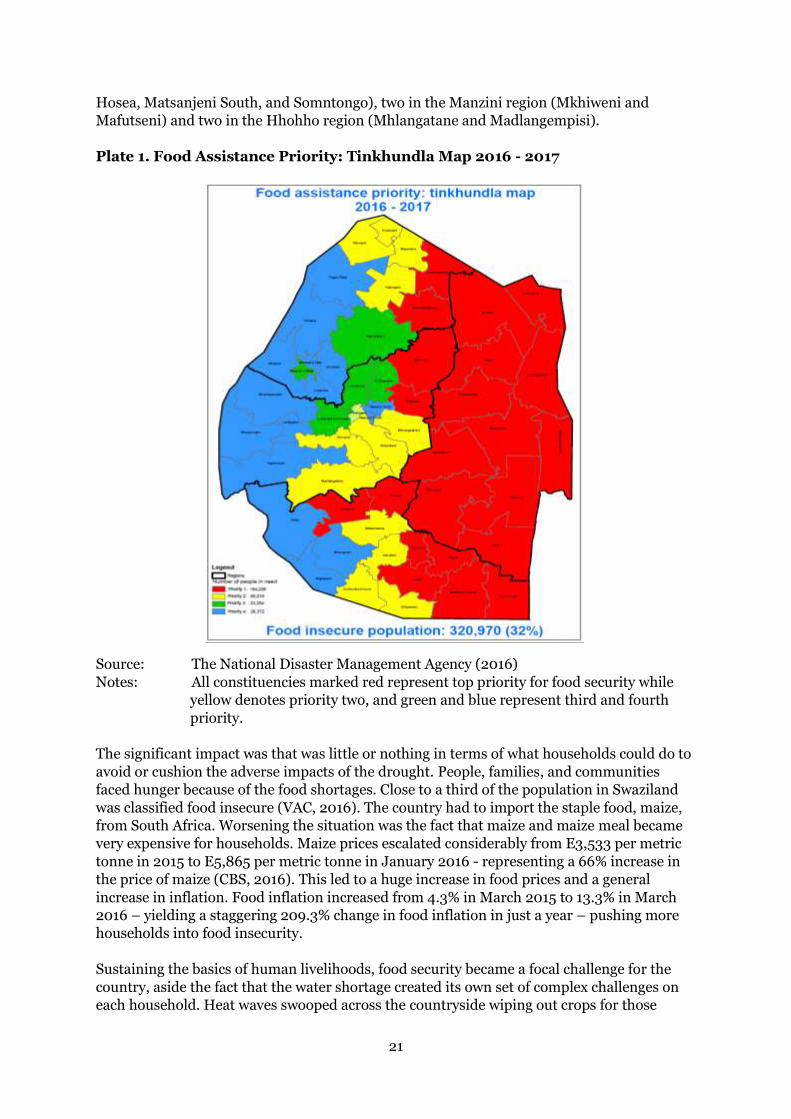
21
Hosea, Matsanjeni South, and Somntongo), two in the Manzini region (Mkhiweni and
Mafutseni) and two in the Hhohho region (Mhlangatane and Madlangempisi).
Plate 1. Food Assistance Priority: Tinkhundla Map 2016 - 2017
Source: The National Disaster Management Agency (2016)
Notes: All constituencies marked red represent top priority for food security while
yellow denotes priority two, and green and blue represent third and fourth
priority.
The significant impact was that was little or nothing in terms of what households could do to
avoid or cushion the adverse impacts of the drought. People, families, and communities
faced hunger because of the food shortages. Close to a third of the population in Swaziland
was classified food insecure (VAC, 2016). The country had to import the staple food, maize,
from South Africa. Worsening the situation was the fact that maize and maize meal became
very expensive for households. Maize prices escalated considerably from E3,533 per metric
tonne in 2015 to E5,865 per metric tonne in January 2016 - representing a 66% increase in
the price of maize (CBS, 2016). This led to a huge increase in food prices and a general
increase in inflation. Food inflation increased from 4.3% in March 2015 to 13.3% in March
2016 – yielding a staggering 209.3% change in food inflation in just a year – pushing more
households into food insecurity.
Sustaining the basics of human livelihoods, food security became a focal challenge for the
country, aside the fact that the water shortage created its own set of complex challenges on
each household. Heat waves swooped across the countryside wiping out crops for those

22
farmers who had attempted to farm in the 2015/16 growing season. Maize production
dropped by 67%, from 101,000 tonnes in 2014/2015, to 33,000 tonnes in 2015/16 (Ministry
of Agriculture, 2016; National Maize Corporation, 2016). The country lost an estimated
88,000 cattle that perished because of lack of water and fodder (Ministry of Agriculture;
VAC Report 2016-2017). The country actually lost more than the cattle stock, as cows are a
symbol of wealth and status in Swazi households and rightfully so. Consider the by-products
of the 88,000 cattle that could have sustained families through milk products, money for
sending children to school, and the calves that could have been added to increase the total
livestock in the country.
Urban areas, particularly Mbabane, were for the first time without water. Inevitably, SWSC
had to execute water rationing for four (4) days out of the seven (7) days in a week in the
capital city. Households had to be creative about sourcing, harvesting, storing, and using
water. In rural areas families had to work together to find alternative sources of water such
as rivers, streams and springs. For some households that had the financial muscle, they were
able to install water tanks in their homes. Those that could not afford to install such
infrastructure relied on public water tanks strategically placed by SWSC and the Government
(NDMA) in various locations, in addition to trucks that provided water throughout the
country.
Drought Relief
The Government of Swaziland (GoS), through the NDMA, provided E350 million for both
immediate and medium-term interventions. Before the declaration, 18th February 2017 of the
state of emergency, Government had already committed E45 million for food assistance and
water allocations to 158,000 people (NDMA, 2016). Following the Government-led Donor
Round Table 16th March 2016, Development Partners in the country like the USA, EU, and
not-for-profit organisations, and the UN sprang into action to provide support to
communities focusing on the most vulnerable groups. Households received food packs and
cash transfers among other interventions addressing health and nutrition, education, WASH,
agriculture and food security, protection and coordination.
In total, the US government provided approximately $9.6 million (E135 million) to improve
access to water, strengthen food security, protect agricultural and pastoral livelihoods, and
enhance resilience among drought-affected households in Swaziland, in 2016. Pending
approval by the U.S. Congress, an additional $2.54 million (E36 million) will be utilised to
support supplementary and therapeutic feeding for malnourished people living with HIV,
orphans and other vulnerable children (OVC). The European Union provided direct support
amounting to €2.6 million (E42 million) through the European Union Development Fund
(EDF) implemented by Red Cross and €1.6 million (E26 million) implemented by UN World
Food Programme. Further, the EU EDF11 committed around €30 million (E480 million) to
support the agriculture sector through horticulture and water harvesting to increase the
resilience and food security of the country.
Impacts on people
Some of the key issues raised include hunger because of a breakdown or collapse of subsistence agriculture. There were no harvests, and livestock died which is compounded by the high poverty levels. Since about 63% of Swazi households live under poverty, people had to rely on donations for food, and had to consume dirty ground water from rivers. Some of the responses generated from the household interviews that vividly describe the
impacts on people include:

23
“…food shortage - we did not get any harvest from the fields” “Livestock died in large numbers and food shortage”
“People quarrelled over food parcels because some felt others are not eligible to get the food parcels”
“People didn't have food such that people like me depended on food parcels” “Food shortages due to the fact that we could not farm and the weather was very hot to
farm as there was no rainfall at all” “People ended up being forced to drink dirty water”
“We starved a lot and we had to go long distances for dirty water” “We drank dirty water and starvation took place because food items became very
expensive” “River dried out resulting in water shortages and people did not farm”
“Inconveniences caused by water shortages” “Water shortage and poverty”
“Poverty!” The drought exacerbated poverty in households, leaving a majority hopeless and without
alternative means to sustain their livelihoods.
Figure 3.5.1.3 Most People Impacts Mentioned in Household Survey
Source: Authors’ own representation using survey data Notes: This Figure presents a Word Cloud of the most talked about people impacts
during the 2015/16 drought.

24
Impacts on crops
As can be seen from the Word Cloud on Figure 3.5.1.4, that the major impacts on crops could be summarised as follows: crops simply dried, withered or died due to scorching temperatures and lack of water. The opportunity for growing crops in the 2015/16 growing season was very small. Farmers who managed to plant seed got poor harvests. Overall productivity and yield suffered because of the drought. Figure 3.5.1.4 Specific Impacts on Crops
Source: Authors’ own representation using survey data Notes: This word cloud shows the specific impacts on crops using the anedotal
drought experiences from the interviews with households. Impacts on water
Table 3.5.1.1 shows the key concepts that were raised in terms of how water was affected because of the drought. The table shows that lack of water was core the challenges experienced by households during the drought causing reduced crops yields and non-producing water sources. Table 3.5.1.1 Specific Impact on Water
Source: Authors’ own representation using survey data Notes: The Table illustrates the impacts on water resources in the country.
1. WATER AVAILABILITY
The drought had a great impact on
water availability in the country.
2. WATER DRIED-UP
The levels of surface and ground water
reduced in total amounts available in
rivers, dams, lakes, and water table.
Some of the water completely dried up,
for example, the Great Usuthu River
and Hawane Reservoir in Mbabane.
Therefore, people and businesses had
to make do with limited water and
inadequate water flow rates, while in
some cases, people had none at all.
3. WATER
QUALITY
DETERIORATED
In cases where water
was still available,
the quality
deteriorated. This is
because of the silt
and concentration of
other dissolved
particulates. Some
households reported
muddy tap water,
which they had to
filter and purify
overnight.
4. WATER RATIONING
AND ALTERNATIVE
SOURCES OF WATER
The extreme water shortages
forced SWSC to execute
rationing in Mbabane in four
(4) out of the seven (7) days
in a week. Households also
had to look for alternative
water sources other than
SWSC. Alternative sources
included fetching water from
rivers, streams, dams, and
from obtaining from water
trucks and tanks strategically
stationed by SWSC and
government in different
communities across the
country.

25
Some of the responses generated from the household interviews that reiterate the severe impacts of the drought on people and their communities due the extreme shortages of water include (Survey Data, 2016);
“Nothing because I don't farm crops anymore.” “People did not even plant crops this season because it is very dry.”
“Most crops didn't grow well and the quality of the harvested crops was poor.” “Maize crop dried and sorghum also dried and died.”
“None because we don't farm crops in our community.” “Nothing grew the soil was very dry for crop production.”
“Hunger” “Food shortages”
“Shortage of water and employment.” “Hunger, shortage of water, death of livestock, and loss of jobs.”
“Community suffered of food shortage.” “People and their animals were hungry - there was also a severe shortage of water.”
3.5.2. Impact Significance
In this section, the impacts on communities are rated on a scale of no impact, minimal
impact, medium, high impact, and severe impact. Focus is on the direct impacts: food
security, crop losses, livestock losses, forced sale of land/farm, increased crime rate, forced
sale of household assets, depletion of water for agriculture, depletion of water for human use,
decline in health, and inconveniences and stress because of disabilities.
I. Food Security
The drought imposed big penalties on food security in all four regions in Swaziland,
especially in rural areas (see Figures 3.5.2.1 and 3.5.2.2). Some households primarily in
urban areas could access food through purchase, and so did not face any impacts on food
availability. To determine the level of food insecurity within each household, the study used
1-5 scale/score (1: No Impact; 2: Minimum Impact; 3: Medium Impact; 4: High Impacts; 5;
Severe Impact). The mean score on this scale determines the level of food insecurity within
the household. The higher the score the greater the negative impacts on food security due to
the drought, hence the more chances the household was food insecure as a result of the
drought. Household food insecurity stated by the households is 4.10 in Lubombo, 3.70 in
Shiselweni, 3.59 in Manzini and 3.39 in the Hhohho regions illustrated in Figure 3.5.2.1
below. The regional trend of the mean score of food insecurity at the household level is
consistent with the poverty/wealth indicators and food production statistics discussed in the
previous sections. The data reveal that Lubombo households reported to be most food
insecure followed by Shiselweni, Manzini and lastly Hhohho. Within the regions, rural
households reported a higher mean food insecurity score (3.85) compared to urban
households (2.77) as shown in Figure 3.5.2.1 below.
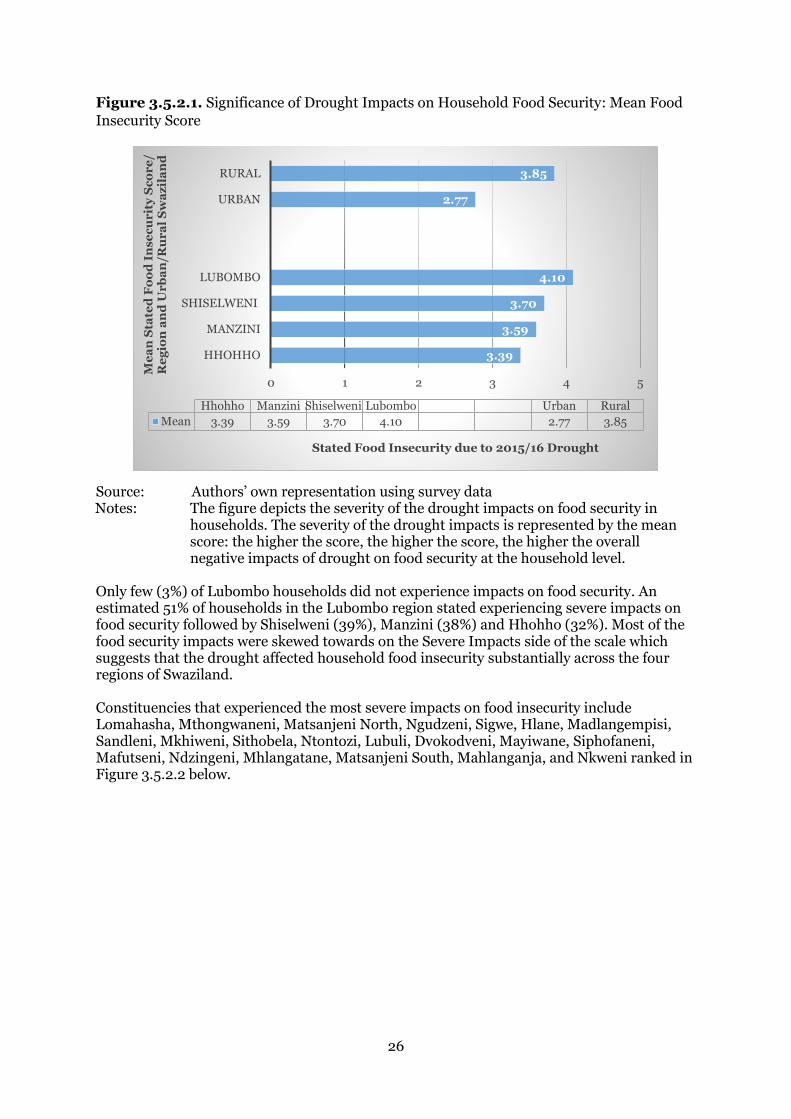
26
Figure 3.5.2.1. Significance of Drought Impacts on Household Food Security: Mean Food
Insecurity Score
Source: Authors’ own representation using survey data Notes: The figure depicts the severity of the drought impacts on food security in
households. The severity of the drought impacts is represented by the mean score: the higher the score, the higher the score, the higher the overall negative impacts of drought on food security at the household level.
Only few (3%) of Lubombo households did not experience impacts on food security. An estimated 51% of households in the Lubombo region stated experiencing severe impacts on food security followed by Shiselweni (39%), Manzini (38%) and Hhohho (32%). Most of the food security impacts were skewed towards on the Severe Impacts side of the scale which suggests that the drought affected household food insecurity substantially across the four regions of Swaziland. Constituencies that experienced the most severe impacts on food insecurity include Lomahasha, Mthongwaneni, Matsanjeni North, Ngudzeni, Sigwe, Hlane, Madlangempisi, Sandleni, Mkhiweni, Sithobela, Ntontozi, Lubuli, Dvokodveni, Mayiwane, Siphofaneni, Mafutseni, Ndzingeni, Mhlangatane, Matsanjeni South, Mahlanganja, and Nkweni ranked in Figure 3.5.2.2 below.
3.39
3.59
3.70
4.10
2.77
3.85
0 1 2 3 4 5
HHOHHO
MANZINI
SHISELWENI
LUBOMBO
URBAN
RURAL
Stated Food Insecurity due to 2015/16 Drought
Me
an
Sta
ted
Fo
od
In
se
cu
rit
y S
co
re
/ R
eg
ion
an
d U
rb
an
/Ru
ra
l S
wa
zil
an
d
Hhohho Manzini Shiselweni Lubombo Urban Rural
Mean 3.39 3.59 3.70 4.10 2.77 3.85
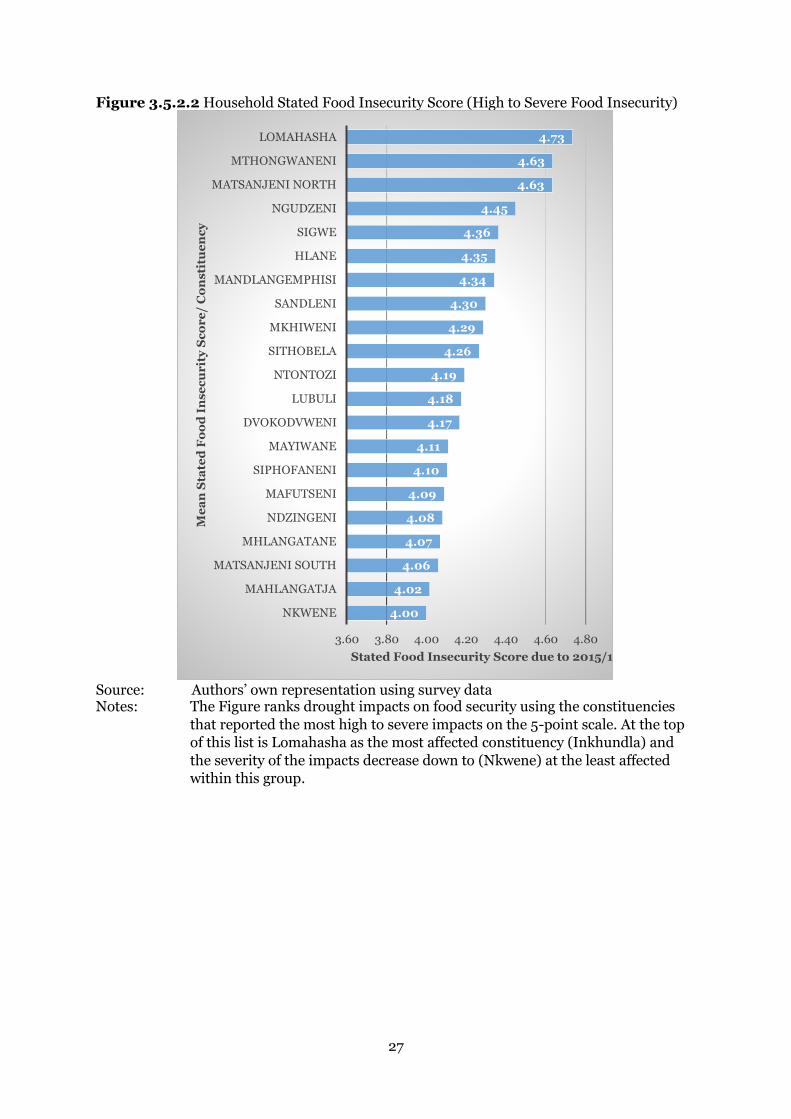
27
Figure 3.5.2.2 Household Stated Food Insecurity Score (High to Severe Food Insecurity)
Source: Authors’ own representation using survey data Notes: The Figure ranks drought impacts on food security using the constituencies
that reported the most high to severe impacts on the 5-point scale. At the top
of this list is Lomahasha as the most affected constituency (Inkhundla) and
the severity of the impacts decrease down to (Nkwene) at the least affected
within this group.
4.00
4.02
4.06
4.07
4.08
4.09
4.10
4.11
4.17
4.18
4.19
4.26
4.29
4.30
4.34
4.35
4.36
4.45
4.63
4.63
4.73
3.60 3.80 4.00 4.20 4.40 4.60 4.80
NKWENE
MAHLANGATJA
MATSANJENI SOUTH
MHLANGATANE
NDZINGENI
MAFUTSENI
SIPHOFANENI
MAYIWANE
DVOKODVWENI
LUBULI
NTONTOZI
SITHOBELA
MKHIWENI
SANDLENI
MANDLANGEMPHISI
HLANE
SIGWE
NGUDZENI
MATSANJENI NORTH
MTHONGWANENI
LOMAHASHA
Stated Food Insecurity Score due to 2015/16 Drought
Me
an
Sta
ted
Fo
od
In
se
cu
rit
y S
co
re
/ C
on
sti
tue
nc
y

28
Figure 3.5.2.3 Significance of Drought Impacts on Household Food Security – Rural versus Urban Households
Source: Authors’ own representation using survey data Notes: The figure uses the same scale as Figure 3.5.2.1 above to measure impacts on
food security in households in the four regions of Swaziland. The households
are divided into rural and urban areas, and the bars represent the proportion
of households rural:urban that fall in each level of impact severity on the
scale. The blue rural households dominate on severe impacts than do urban
households.
Figure 3.5.2.3. illustrates the impacts of the drought on food security. It shows that the
drought affected rural households more than urban households. Second, the Figure shows
that a majority of urban households felt the drought had no impact on food security at the
household level. Third, the Figure evinces that a majority of rural households experienced
severe impacts on food security as a result of the drought. Lastly, there is an equal but small
number of urban and rural households that did not face any negative impacts, food shortages
or expenses due to the drought.
Figure 3.5.2.4 shows the significance of the impacts of the droughts on male versus female-
headed households. In the introduction, the study draws from Tichagwa (1994) to make the
point that women are the engines of growth in rural areas. Because of this, the study notes
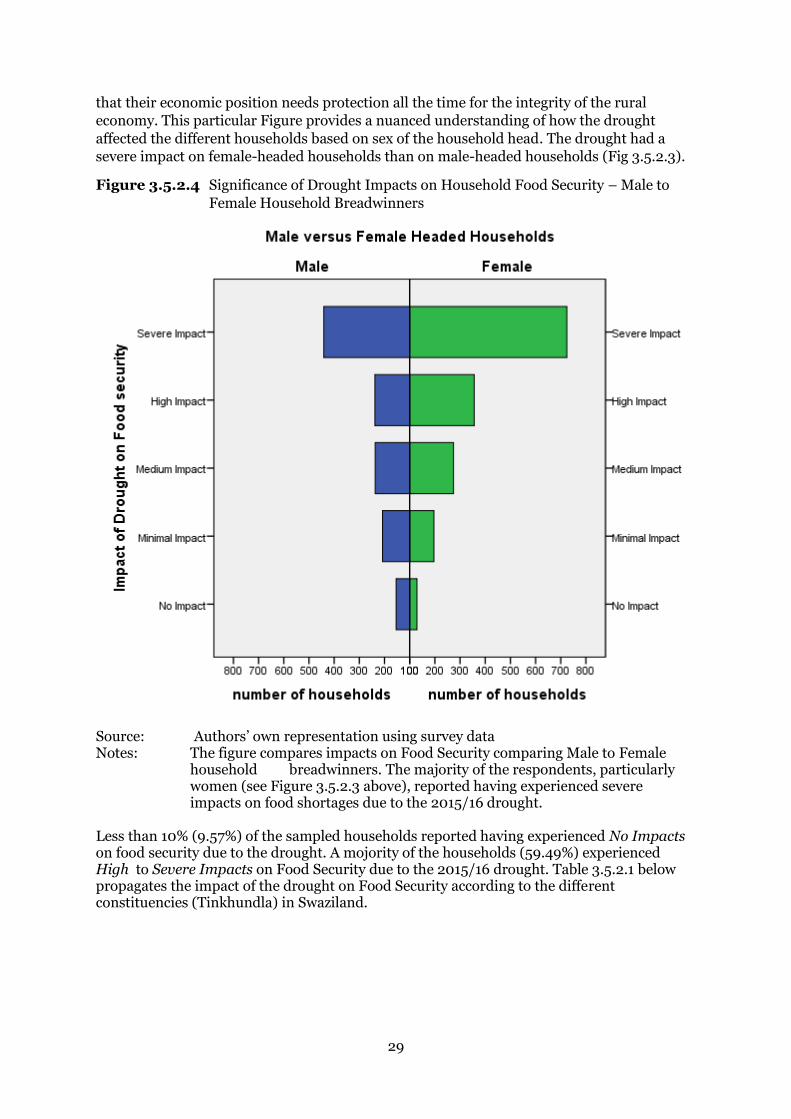
29
that their economic position needs protection all the time for the integrity of the rural
economy. This particular Figure provides a nuanced understanding of how the drought
affected the different households based on sex of the household head. The drought had a
severe impact on female-headed households than on male-headed households (Fig 3.5.2.3).
Figure 3.5.2.4 Significance of Drought Impacts on Household Food Security – Male to
Female Household Breadwinners
Source: Authors’ own representation using survey data Notes: The figure compares impacts on Food Security comparing Male to Female
household breadwinners. The majority of the respondents, particularly women (see Figure 3.5.2.3 above), reported having experienced severe impacts on food shortages due to the 2015/16 drought.
Less than 10% (9.57%) of the sampled households reported having experienced No Impacts on food security due to the drought. A mojority of the households (59.49%) experienced High to Severe Impacts on Food Security due to the 2015/16 drought. Table 3.5.2.1 below propagates the impact of the drought on Food Security according to the different constituencies (Tinkhundla) in Swaziland.

30
Table 3.5.2.1 Distribution of Food Security Impacts in Swaziland Constituencies
Source: Authors’ own representation using survey data Notes: The table compares constituencies (Tinkhundla) in Swaziland that either
reported the most number of households that experienced NO IMPACTS on Food Security, and those that reported the most SEVERE IMPACTS on Food Security due to the drought. A total of 36 of the Tinkhundlas are reported in the Table out of the 55 that were compared.
INKHUNDLA
Percent of
Households in
each
Inkhundla INKHUNDLA
Percent of
Households in each
Inkhundla
Mbabane East 49% Matsanjeni North 80%
Mbangweni 36% Lomahasha 78%
Mahlanya 33% Matsanjeni South 76%
Kwaluseni 29% Mthongwaneni 73%
LaMgabhi 27% Mkhiweni 64%
Lavumisa 25% Ntontozi 64%
Matsanjeni South 24% Hlane 63%
Manzini North 22% Sithobela 63%
Manzini South 21% Mafutseni 62%
Mhlume 20% Ndzingeni 58%
Pigg's Peak 19% Ngudzeni 57%
Lobamba 18% Dvokodvweni 56%
Mbabane West 18% Ntfonjeni 55%
Mhlambanyatsi 18% Mayiwane 54%
Nkhaba 16% Siphofaneni 54%
Mtsambama 16% Sigwe 52%
Gege 12% Sandleni 51%
Ekukhanyani 12% Mandlangemphisi 51%
Ndzingeni 11% Mhlangatane 51%
Mangcongco 11% Mangcongco 47%
Shiselweni 9% Mahlangatja 47%
Nhlambeni 8% Nkwene 43%
Maphalaleni 7% Mhlume 40%
Ntfonjeni 6% Hosea 40%
Hhukwini 6% Zombodze 39%
Maseyisini 6% Manzini South 39%
Hosea 6% Ekukhanyeni 39%
Mafutseni 4% Kubuta 38%
Mayiwane 4% Lubuli 38%
Motjane 4% Mtsambama 36%
Nkwene 4% Nkhaba 35%
Zombodze 4% Nkilongo 34%
Ngwemphisi 4% Maphalaleni 33%
Dvokodvweni 4% Maseyisini 32%
Mhlangatane 3% Nhlambeni 31%
Sithobela 3% Ngwemphisi 31%
Somtongo 3% Lugongolweni 31%
SEVERE IMPACTSNO IMPACT
FOOD SECURITY IMPACTS DUE TO 2015/16 DROUGHT
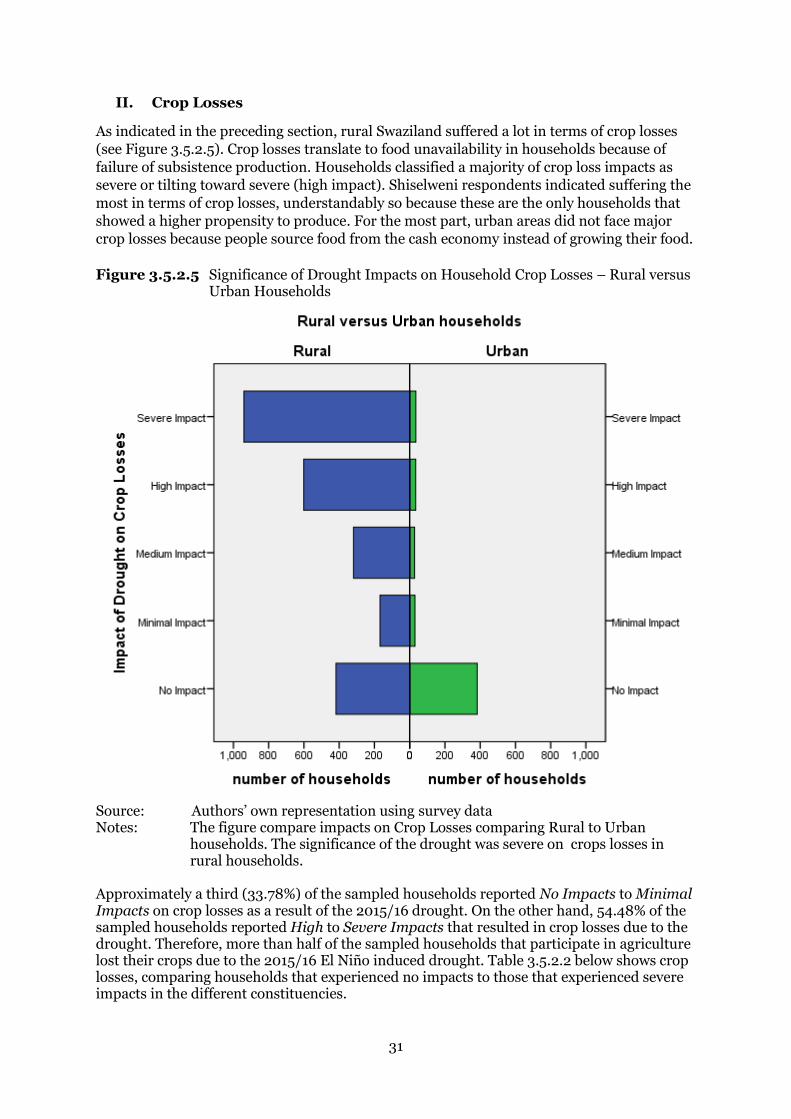
31
II. Crop Losses
As indicated in the preceding section, rural Swaziland suffered a lot in terms of crop losses
(see Figure 3.5.2.5). Crop losses translate to food unavailability in households because of
failure of subsistence production. Households classified a majority of crop loss impacts as
severe or tilting toward severe (high impact). Shiselweni respondents indicated suffering the
most in terms of crop losses, understandably so because these are the only households that
showed a higher propensity to produce. For the most part, urban areas did not face major
crop losses because people source food from the cash economy instead of growing their food.
Figure 3.5.2.5 Significance of Drought Impacts on Household Crop Losses – Rural versus Urban Households
Source: Authors’ own representation using survey data Notes: The figure compare impacts on Crop Losses comparing Rural to Urban
households. The significance of the drought was severe on crops losses in rural households.
Approximately a third (33.78%) of the sampled households reported No Impacts to Minimal Impacts on crop losses as a result of the 2015/16 drought. On the other hand, 54.48% of the sampled households reported High to Severe Impacts that resulted in crop losses due to the drought. Therefore, more than half of the sampled households that participate in agriculture lost their crops due to the 2015/16 El Niño induced drought. Table 3.5.2.2 below shows crop losses, comparing households that experienced no impacts to those that experienced severe impacts in the different constituencies.

32
Table 3.5.2.2 Distribution of Crop Losses in Swaziland Constituencies
Source: Authors’ own representation using survey data Notes: The table compares contituencies (Tinkhundla) in Swaziland that either
reported the most number of households that experienced NO IMPACTS on Crop Losses, and those that reported the most SEVERE IMPACTS on Crop Losses due to the drought.
INKHUNDLA
Percent of
Households in
each
Inkhundla INKHUNDLA
Percent of
Households in
each
Inkhundla
Mhlume 82% Ntfonjeni 80%
Mbabane West 82% Sigwe 76%
Kwaluseni 71% Matsanjeni South 71%
Nkilongo 64% Zombodze 65%
Manzini North 63% Ngudzeni 63%
Pigg's Peak 60% Hosea 61%
Mahlanya 57% Mkhiweni 61%
Manzini South 53% Sandleni 53%
Lubuli 53% Nkwene 53%
Lugongolweni 49% Mthongwaneni 51%
Lobamba 48% Hlane 49%
Mbangweni 44% Mangcongco 49%
Lomahasha 39% Mandlangemphisi 47%
Nhlambeni 38% Ngwemphisi 46%
Hhukwini 31% Ndzingeni 45%
Mpholonjeni 30% Mafutseni 44%
Motjane 29% Shiselweni 43%
Mhlambanyatsi 29% Gege 43%
Dvokodvweni 28% Matsanjeni North 39%
Mhlangatane 27% Mahlangatja 38%
Hlane 24% Ntontozi 38%
Mtsambama 24% Maseyisini 38%
Matsanjeni South 24% Nhlambeni 37%
Sithobela 24% Mtsambama 36%
LaMgabhi 22% Mayiwane 35%
Siphofaneni 21% Motjane 35%
Maseyisini 16% Nkhaba 33%
Ndzingeni 15% Lomahasha 31%
Mthongwaneni 14% Kubuta 30%
Timphisini 13% Dvokodvweni 30%
Ekukhanyeni 13% Sithobela 29%
Mayiwane 13% Manzini South 29%
Mkhiweni 13% Mhlambanyatsi 29%
Matsanjeni North 12% Ekukhanyani 26%
Somtongo 11% Lubuli 25%
CROP LOSSES DUE TO 2015/16 DROUGHT
NO IMPACT SEVERE IMPACTS

33
III. Livestock Losses
Many urban households did not incur livestock losses and so reported no impact on livestock
losses (see Figure 3.5.2.6 below). However, some rural farmers reported losses because their
livestock, specifically cattle, died. The impact was particularly severe on these farmers. The
data suggest that livestock is held within a few households in the rural areas and, not
surprisingly, little to none in urban areas. From the survey data, 48.5% (almost half) of the
sampled households reported No Impacts or no losses to livestock due to the drought. About
a quarter (25.54%) of the sampled households reported High to Severe Impacts on livestock
losses due to the drought. The households that reported Severe Impacts or the most livestock
losses as a result of the 2015/16 El Niño induced drought were 13.53% of the sampled
households.
Figure 3.5.2.6 Significance of Drought Impacts on Livestock Losses: Rural versus Urban
Households
Source: Authors’ own representation using survey data Notes: The figure compares severity of impacts on Livestock Losses in Rural to
Urban households.
Table 3.5.2.3 below shows the distribution of livestock losses between the different
constituencies in Swaziland. The table compares No Impacts and Severe Impacts on
livestock losses as a result of the drought in the different constituencies.

34
Table 3.5.2.3 Distribution of Livestock Losses in Swaziland Constituencies
Source: Authors’ own representation using survey data Notes: The table compares contituencies (Tinkhundla) in Swaziland that either
reported the most number of households that experienced NO IMPACTS on Livestock Losses, and those that reported the most SEVERE IMPACTS on Livestock Losses due to the drought.
INKHUNDLA
Percent of
Households
in each
Inkhundla INKHUNDLA
Percent of
Households
in each
Inkhundla
Mhlume 100% Mkhiweni 39%
Mbabane West 97% Dvokodvweni 37%
Mbabane East 97% Hlane 35%
Kwaluseni 88% Lubuli 33%
Lugongolweni 84% Mandlangemphisi 32%
Manzini North 83% Nhlambeni 31%
Mahlanya 82% Ntfonjeni 31%
Pigg's Peak 77% Sigwe 29%
Nkilongo 74% Mhlangatane 25%
Manzini South 67% Ngudzeni 24%
Mbangweni 62% Somtongo 23%
Lobamba 62% Mthongwaneni 22%
Motjane 60% Ndzingeni 22%
Siphofaneni 56% Nkhaba 20%
Mtsambama 56% Mafutseni 20%
Mpholonjeni 56% Mahlangatja 18%
Hhukwini 55% Shiselweni 18%
Maseyisini 54% Manzini South 18%
Matsanjeni South 53% Zombodze 18%
Mayiwane 52% Matsanjeni South 18%
Kubuta 52% Hosea 17%
Ludzeludze 50% Lomahasha 16%
Mangcongco 49% Sandleni 15%
Nhlambeni 48% Ekukhanyani 13%
Sithobela 47% Lobamba 12%
Mhlambanyatsi 47% Timphisini 11%
Maphalaleni 44% Mhlambanyatsi 11%
Gege 43% Mayiwane 11%
LaMgabhi 41% Matsanjeni North 10%
Shiselweni 41% Gege 10%
Matsanjeni North 39% Motjane 10%
Ntontozi 38% Ngwemphisi 10%
LIVESTOCK LOSSES DUE TO 2015/16 DROUGHT
NO IMPACT SEVERE IMPACT

35
IV. Forced Sale of Land
Figure 3.5.2.7 below shows that households did not have to resort to selling their land or
fields to mitigate against the impacts of the 2015/16 drought. The survey data shows that
94.32% of the sampled households reported No Impacts to Minimal Impacts on forced sale
of fields/farm/land as a coping strategy to the 2015/16 drought. At least the majority, if not
all households, still have their fields, which they can use to re-engage in food production,
when the rains return. Less than 2% of the sampled households reported High to Severe
impacts. These few instances were reported in the Mthongwaneni, Ntfonjeni, Lobamba,
Kwaluseni, Sandleni, Mandlangemphisi, Mthongwaneni, Maphalaleni, Sithobela, and
Lomahasha constituencies.
Figure 3.5.2.7 Significance of Drought Impacts leading to Forced Sale of Fields or Land in
households
Source: Authors’ own representation using survey data Notes: The figure compares impacts that led to forced sale of fields or land in
households due to the drought. It compares severity of impacts on rural to
urban households.

36
V. Increased Crime Rate
Figure 3.5.2.8 shows that criminal activities due to the drought were minimal. The survey
data reveals that 75.92% of the sampled households did not experience any impacts or
experienced minimal impacts on increased crime as a result of the 2015/16 drought.
However, some households (about 11% of the sampled households) experienced increased
crime rate both in rural and urban Swaziland. There were some reports on theft (shoplifting,
stock theft, conmen, and copper wire theft), fraud, rape, and attempted rape cases increased
significantly when compared to normal years when there is no drought (RSPS, 2016 Pers.
Comm.). The Royal Swaziland Police Service (RSPS) attributed the high crime rate to rural-
urban migration, which emanated from people leaving rural areas in search of job
opportunities in urban areas. The police reported that as the drought intensified, able-bodied
men and women left the rural areas in search of jobs in the cities, leaving the household and
household chores in the hands of children and elderly people. The police narrated that
because of this, children were exposed to rape. Young girls were left vulnerable as they
remained without proper protection. The police indicated that rural households that opted to
move children to relatives in urban households, to escape the drought, incurred socialisation
incongruities. The police noted that children from rural households tended to engage in
inappropriate childhood behaviour, viewed as taboo in urban areas, leading to cases of child
rape, etc. The RSPS also reported that once in the urban areas, some women from rural areas
became sex workers, which led to an increase in “key populations6” especially along the
Mbabane to Manzini corridor.
This suggests that as the drought deepened and noting the already fragile nature of rural
households, it forced people to resort to sex work as the most viable alternative to earn a
living. The drought destroyed ability to grow food in rural areas, which meant people had to
depend on the cash-economy to source food, which, as the name suggests, requires money.
In particular, people who moved from rural to urban areas in search of jobs succumbed into
key populations when they realised that they could not secure jobs in the city.
Overall, Dvokodveni, Lomahasha, Manzini South, Manzini North, Kwaluseni, Sandleni,
Somtongo, Ntontozi, Mthongwaneni, Mhlangatane, Matsanjeni North and Mkhiweni
constituencies reported the most severe impacts on increased crime rates resulting from the
2015/16 drought.
6 Key populations is a term used to describe female and male sex workers and have the highest risk of contracting
and transmitting HIV.
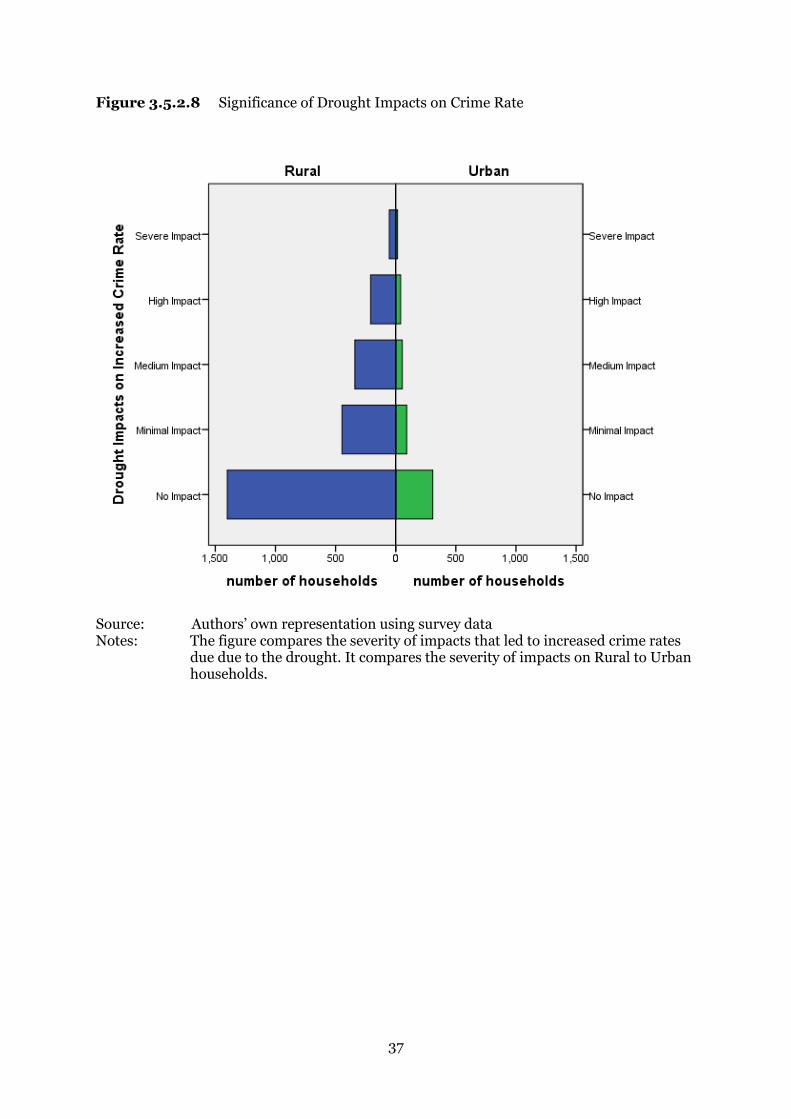
37
Figure 3.5.2.8 Significance of Drought Impacts on Crime Rate
Source: Authors’ own representation using survey data Notes: The figure compares the severity of impacts that led to increased crime rates
due due to the drought. It compares the severity of impacts on Rural to Urban households.
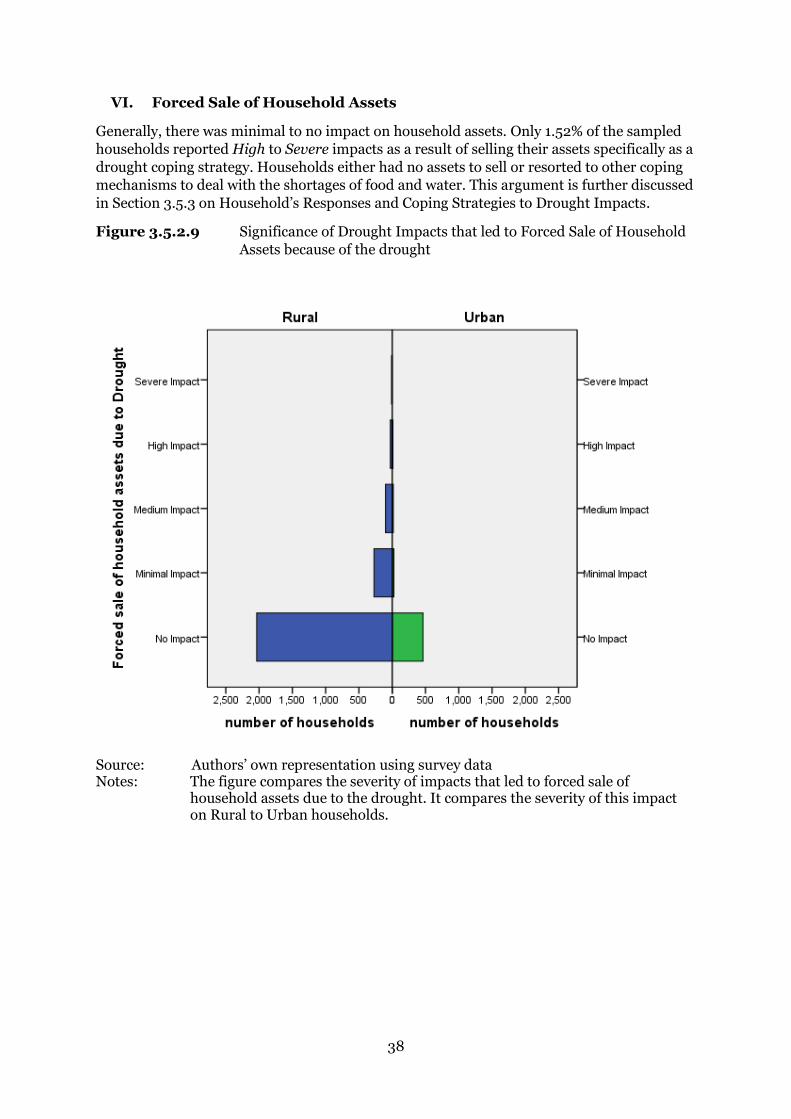
38
VI. Forced Sale of Household Assets
Generally, there was minimal to no impact on household assets. Only 1.52% of the sampled
households reported High to Severe impacts as a result of selling their assets specifically as a
drought coping strategy. Households either had no assets to sell or resorted to other coping
mechanisms to deal with the shortages of food and water. This argument is further discussed
in Section 3.5.3 on Household’s Responses and Coping Strategies to Drought Impacts.
Figure 3.5.2.9 Significance of Drought Impacts that led to Forced Sale of Household
Assets because of the drought
Source: Authors’ own representation using survey data Notes: The figure compares the severity of impacts that led to forced sale of
household assets due to the drought. It compares the severity of this impact on Rural to Urban households.
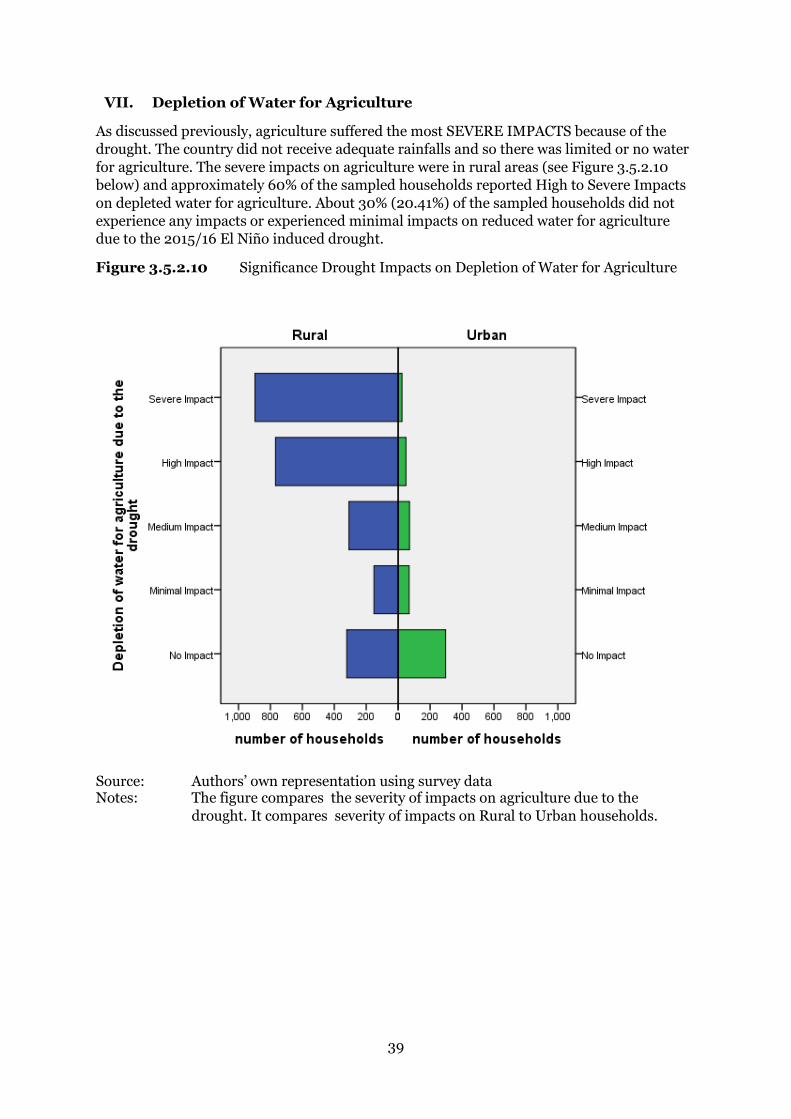
39
VII. Depletion of Water for Agriculture
As discussed previously, agriculture suffered the most SEVERE IMPACTS because of the
drought. The country did not receive adequate rainfalls and so there was limited or no water
for agriculture. The severe impacts on agriculture were in rural areas (see Figure 3.5.2.10
below) and approximately 60% of the sampled households reported High to Severe Impacts
on depleted water for agriculture. About 30% (20.41%) of the sampled households did not
experience any impacts or experienced minimal impacts on reduced water for agriculture
due to the 2015/16 El Niño induced drought.
Figure 3.5.2.10 Significance Drought Impacts on Depletion of Water for Agriculture
Source: Authors’ own representation using survey data Notes: The figure compares the severity of impacts on agriculture due to the
drought. It compares severity of impacts on Rural to Urban households.

40
Table 3.5.2.4 Depletion of Water for Agriculture in Swaziland Constituencies
Source: Authors’ own representation using survey data Notes: The table compares contituencies (Tinkhundla) in Swaziland that either
reported the most number of households that experienced NO IMPACTS on Depletion of Water for Agriculture, and those that reported the most SEVERE IMPACTS on Depletion of Water for Agriculture due to the drought.
INKHUNDLA
Percent of
Households in
each
Inkhundla INKHUNDLA
Percent of
Households
in each
Inkhundla
Mbabane West 76% Sigwe 79%
Mbabane East 66% Matsanjeni South 76%
Pigg's Peak 56% Ntfonjeni 76%
Manzini North 55% Ngudzeni 65%
Kwaluseni 53% Zombodze 61%
Lugongolweni 51% Mandlangemphisi 57%
Lavumisa 50% Sandleni 55%
Mhlume 50% Nkwene 51%
Mahlanya 49% Shiselweni 50%
Manzini South 45% Ngwemphisi 50%
Kubuta 40% Matsanjeni North 47%
Mbangweni 38% Ndzingeni 45%
Motjane 32% Hosea 43%
Lobamba 32% Mhlambanyatsi 42%
Nkilongo 29% Mahlangatja 42%
Maseyisini 26% Ekukhanyeni 42%
LaMgabhi 25% Mthongwaneni 41%
Hhukwini 24% Gege 41%
Mthongwaneni 22% Hlane 41%
Mhlambanyatsi 22% Ntontozi 40%
Ludzeludze 22% Mayiwane 39%
Mafutseni 20% Mtsambama 38%
Mtsambama 20% Somtongo 37%
Mpholonjeni 19% Mhlangatane 36%
Matsanjeni South 18% Dvokodvweni 33%
Lomahasha 16% Mkhiweni 32%
Ndzingeni 15% Mangcongco 32%
Mhlangatane 14% LaMgabhi 29%
Siphofaneni 13% Sithobela 29%
Timphisini 11% Siphofaneni 29%
Mkhiweni 11% Nhlambeni 27%
Nkhaba 10% Manzini South 25%
Nhlambeni 10% Timphisini 24%
DEPLETION OF WATER FOR AGRICULTURE DUE TO 2015/16 DROUGHT
NO IMPACT SEVERE IMPACT
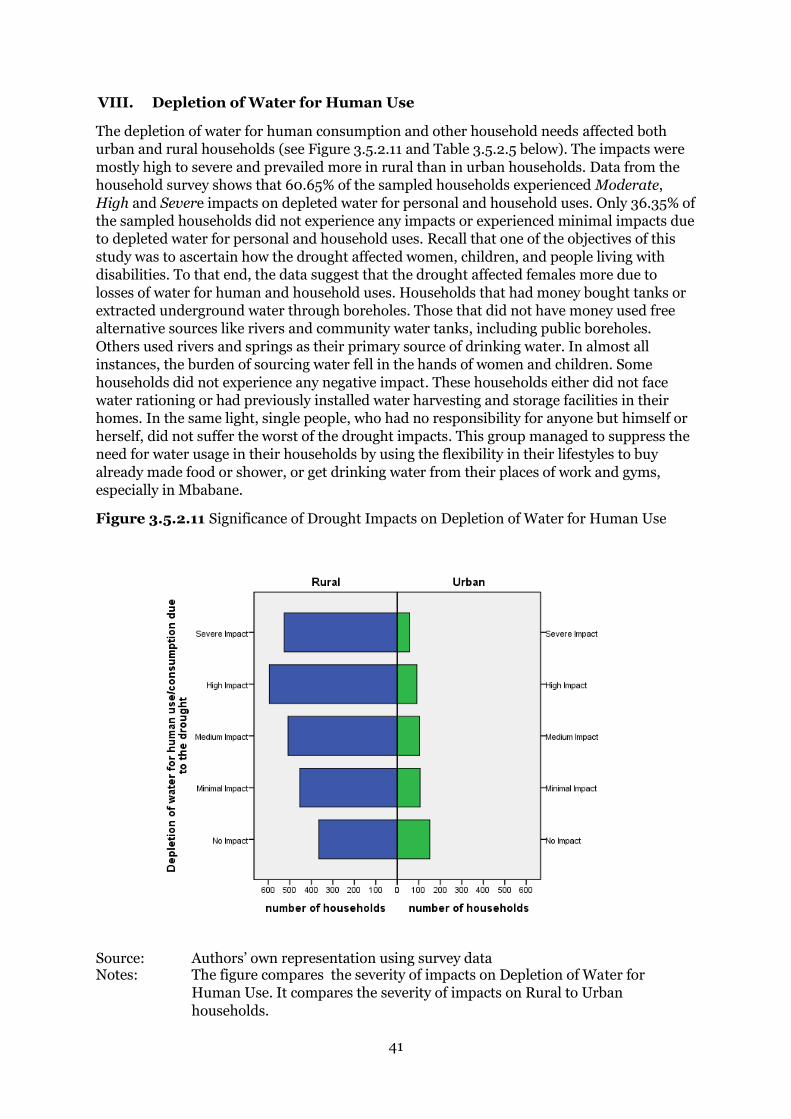
41
VIII. Depletion of Water for Human Use
The depletion of water for human consumption and other household needs affected both
urban and rural households (see Figure 3.5.2.11 and Table 3.5.2.5 below). The impacts were
mostly high to severe and prevailed more in rural than in urban households. Data from the
household survey shows that 60.65% of the sampled households experienced Moderate,
High and Severe impacts on depleted water for personal and household uses. Only 36.35% of
the sampled households did not experience any impacts or experienced minimal impacts due
to depleted water for personal and household uses. Recall that one of the objectives of this
study was to ascertain how the drought affected women, children, and people living with
disabilities. To that end, the data suggest that the drought affected females more due to
losses of water for human and household uses. Households that had money bought tanks or
extracted underground water through boreholes. Those that did not have money used free
alternative sources like rivers and community water tanks, including public boreholes.
Others used rivers and springs as their primary source of drinking water. In almost all
instances, the burden of sourcing water fell in the hands of women and children. Some
households did not experience any negative impact. These households either did not face
water rationing or had previously installed water harvesting and storage facilities in their
homes. In the same light, single people, who had no responsibility for anyone but himself or
herself, did not suffer the worst of the drought impacts. This group managed to suppress the
need for water usage in their households by using the flexibility in their lifestyles to buy
already made food or shower, or get drinking water from their places of work and gyms,
especially in Mbabane.
Figure 3.5.2.11 Significance of Drought Impacts on Depletion of Water for Human Use
Source: Authors’ own representation using survey data Notes: The figure compares the severity of impacts on Depletion of Water for
Human Use. It compares the severity of impacts on Rural to Urban
households.

42
Table 3.5.2.5 Depletion of Water for Agriculture in Swaziland Constituencies
Source: Authors’ own representation using survey data Notes: The table compares contituencies (Tinkhundla) in Swaziland that either
reported the most number of households that experienced NO IMPACTS on Depletion of Water for Human Use, and those that reported the most SEVERE IMPACTS on Depletion of Water for Human Use due to the drought.
INKHUNDLA
Percent of
Households
in each
Inkhundla INKHUNDLA
Percent of
Households in
each Inkhundla
Matsanjeni South 53% Mandlangemphisi 53%
Mangcongco 47% Matsanjeni North 53%
Manzini North 46% Hlane 47%
Mtsambama 42% Sigwe 45%
LaMgabhi 37% Dvokodvweni 43%
Manzini South 37% Ntontozi 43%
Kwaluseni 37% Ntfonjeni 41%
Shiselweni 36% Mhlangatane 37%
Mhlambanyatsi 36% Ndzingeni 35%
Pigg's Peak 35% Mkhiweni 34%
Maphalaleni 31% Sithobela 31%
Maseyisini 30% Mbabane West 30%
Ntfonjeni 29% Mafutseni 29%
Mhlume 28% Mbabane East 29%
Hosea 27% Lomahasha 29%
Lavumisa 25% Nkhaba 27%
Mbangweni 24% Mthongwaneni 25%
Mthongwaneni 24% Siphofaneni 25%
Gege 24% Mayiwane 24%
Ludzeludze 22% Sandleni 23%
Lobamba 22% Nhlambeni 23%
Motjane 21% Mahlangatja 22%
Timphisini 20% Ekukhanyani 21%
Mbabane West 20% Zombodze 20%
Ekukhanyani 19% Motjane 19%
Lugongolweni 18% Mhlambanyatsi 18%
Mayiwane 17% Mbangweni 16%
Somtongo 17% Manzini North 15%
Ngudzeni 14% Hhukwini 14%
Mahlanya 12% Nkwene 14%
Hhukwini 12% Lugongolweni 14%
DEPLETION OF WATER FOR HUMAN USE DUE TO 2015/16 DROUGHT
NO IMPACT SEVERE IMPACT

43
IX. Decline in Health
About 80% (76.63%) of the sampled households reported No Impact to Minimal Impact in
decline in health (malnutrition and water related diseases) due to the drought. However, the
health sector documented medium to severe cases of diarrhoea and other diseases of the gut
among children. These illnesses derived from the consumption of dirty water from rivers and
dams. The households that did report health related impacts tilting towards High and Severe
cases were 14.98% of the sampled households. The most severe impacts were reported in the
Ntondozi, Sandleni, Sigwe, Ntfonjeni, Matsenjeni North, Dvokodvweni, Sithobela,
Mafutseni, Zombodze, and Lugongolweni constituencies ranging from 15% to 30% of the
sampled households.
Specifically, the Swaziland Comprehensive Nutrition Health Survey Report (February, 2017)
indicated the most reported illnesses related to the drought as follows; diarrhoea (16.1%),
skin diseases (15%), upper respiratory tract disease (14.6%) and eye disease (12.2%).
According to the report, diarrhoea was prevalent in all the four regions of Swaziland with a
rage from 14.7% in Manzini to 17.6% in Hhohho. Skin diseases, on the other hand, were most
prevalent in the Manzini (17.4%) and Lubombo (17.2%) than in Shiselweni (12.7%) and
Hhohho (12.2%) regions. The Lubombo region reported the most cases of upper respiratory
track disease at 18.7% of households, and the lowest occurring in the Hhohho region (12%).
Finally, eye disease was prevalent in the Manzini region in which 18.7% of households
reported with the lowest incidence of eye disease reported in the Hhohho region (9.6%).
Table 3.5.2.6 below provides a summary of the distribution of the drought related diseases
among households in the country.
Table 3.5.2.6 Distribution of Drought Related Diseases Among Households in
Swaziland
Hhohho Manzini Shiselweni Lubombo Total Diarrhoea 17.6% 14.7% 15.0% 17.4% 16.1% Malaria 0.8% 0.7% 05% 0.6% 0.6% Eye Disease 9.6% 17.9% 12.5% 8.0% 12.2% Upper Respiratory Disease
12.0% 12.7% 15.0% 18.7% 14.6%
Skin Diseases
12.2% 17.4% 12.7% 17.2% 15.0%
Bilharzia and Worms
3.1% 1.7% 2.1% 2.4% 2.3%
No Disease 44.7% 35.1% 42.1% 35.8% 39.2% Source: Swaziland Comprehensive Health & Nutrition Survey Report (2017)
A survey of impacts on long-term/chronic diseases, the results of the Rapid Nutrition and
Health Assessment (2016) revealed a gradual increase in the overall monthly number of
cases of anaemia diagnosed in the health facilities during the drought period, including an
increase in the number of clients admitted in the Food by Prescription Programme. The
assessment revealed that adherence to anti-retroviral (ARV) among persons living with HIV
in food insecure households reduced. The assessment also revealed that ART and TB
treatment defaulter rate increased during the drought period. Besides the lack of access to
adequate and nutritious food, some of the factors that contributed to an increased defaulter
rate included limited access to health facilities as some people were unable to make the
journey to the facilities due to illness, weakness or lack of finances.
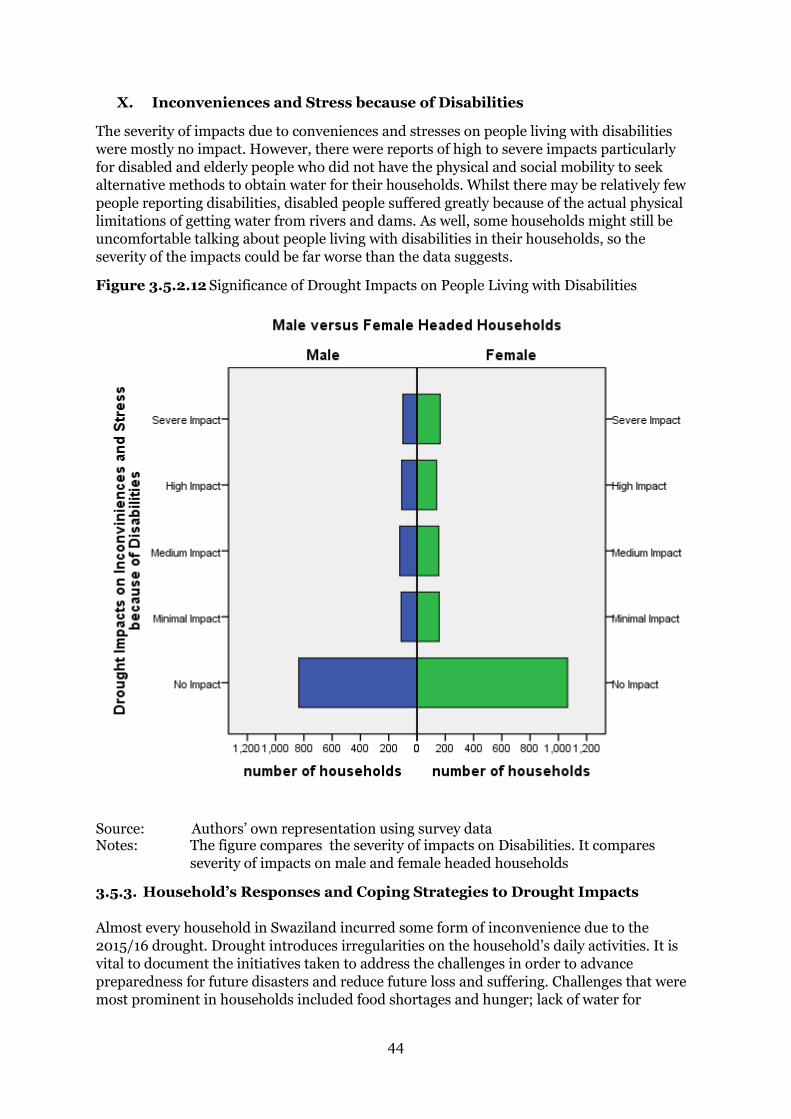
44
X. Inconveniences and Stress because of Disabilities
The severity of impacts due to conveniences and stresses on people living with disabilities
were mostly no impact. However, there were reports of high to severe impacts particularly
for disabled and elderly people who did not have the physical and social mobility to seek
alternative methods to obtain water for their households. Whilst there may be relatively few
people reporting disabilities, disabled people suffered greatly because of the actual physical
limitations of getting water from rivers and dams. As well, some households might still be
uncomfortable talking about people living with disabilities in their households, so the
severity of the impacts could be far worse than the data suggests.
Figure 3.5.2.12 Significance of Drought Impacts on People Living with Disabilities
Source: Authors’ own representation using survey data Notes: The figure compares the severity of impacts on Disabilities. It compares
severity of impacts on male and female headed households
3.5.3. Household’s Responses and Coping Strategies to Drought Impacts
Almost every household in Swaziland incurred some form of inconvenience due to the
2015/16 drought. Drought introduces irregularities on the household’s daily activities. It is
vital to document the initiatives taken to address the challenges in order to advance
preparedness for future disasters and reduce future loss and suffering. Challenges that were
most prominent in households included food shortages and hunger; lack of water for

45
agriculture and human consumption; and lack of economic or financial muscle to effectively
respond to the drought due to poverty and lack of employment or income generating
opportunities. Consequently, households had limited capacity to implement appropriate
interventions to respond to the drought. The warnings from the SWSC and Meteorological
Department were a little too late for any substantial remedial activities to be implemented at
the household level. Households had to scramble for water tanks, buckets, and other storage
containers to save water and endure living without it through water rationing. Households
had to limit their use of water and engage in water recycling. Very few households could
afford to buy water tanks, so recycling and reusing became the best alternative to save water.
Essentially, all households, despite the SWSC induced rations, had to ration themselves in
order to survive through the drought.
Second, agriculture in Swaziland is predominantly dependent on rainfall, and so when the
water vanished, households did not have alternative means to produce food. Irrigation
systems, because of the associated costs, were not a viable option for a majority of the
households that rely on subsistence production for their food and livelihood security.
Livestock farmers made efforts to move their cattle to other communities in the country that
still had grass on their grazing lands, especially in the Highveld region. Farmers faced the
quandary of managing their livestock through the limited grass and water resources or
selling their remaining stock to the Swaziland Meat Industries. Those who were able to sell
their cattle at the onset of the drought were able to reap decent returns than those who sold
their cattle later in the heat of the drought.
Consequently, a majority of people in rural Swaziland had to rely on food donations
distributed by the Government through NDMA, and development partners and
organisations such as World Vision and the UN World Food Programme. Families had to buy
maize and mealie-meal from beyond the country’s borders due to price disparities between
Swaziland and South Africa. The food parcels or hampers distributed to communities
(especially in the Lubombo and Shiselweni regions) played a pivotal role in rescuing
households from extreme food insecurity. For instance, on the onset of the drought in 2015,
some families could still afford to buy food, but by late 2016, a majority of the households
had to seek food donations from the government’s food distribution programmes. Making
the situation perverse was the failure of agricultural marketing boards in the
country to relax instruments meant to regulate the importation of food into
Swaziland. Instead, it became a tug of war between desperate Swazi families and the
agricultural marketing boards which were imposing all kinds of restrictions on food
(processed or not) imports into the country, in spite of the fact that the country had already
declared the drought a national disaster.
Figure 3.5.3.1 in the appendix shows some of the measures that households had to take in
response to the drought. These include conserving and accessing water stored in
underground aquifers. Households further reported the following strategies:
“Fetching water from the river whenever the taps were dry” “Fetching water from a neighbouring unprotected spring”
“Started fetching water from the protected spring which is far” “Fetching water from another community farther away”
“We bought water and filled our tank” “We saved water and bought it from SWSC”
“Drilling of water and buying water” “Buying water from PnP for drinking”
“We did underground water extraction” “Buying from water tanker”

46
“There was water tank provided for the community” “We use rain water which we collect by our tank”
“Nothing was done, we relied on rain water whenever it rained” To reduce the impacts stemming from water shortages, households prioritised water conservation, water collection from rivers, and underground water extraction. Some households also tried to improve productivity efficiencies on their farms through livestock management and destocking. Since the drought affected agriculture the most, Figure 3.5.3.2 in the appendix, provides a summary of the coping mechanisms that households used during the 2015/16 drought in Swaziland. About 52% of the households exited agriculture while 32% chose to reduce the size of area they farmed or cultivated. Only 11% of the sampled households changed or diversified the crops they normally cultivate. This suggests that the severity of the drought forced households, especially subsistence producers, to resort to extreme coping mechanisms such as exiting or abandoning fields before even trying mitigating strategies such as diversifying crops, trying out drought resistant crops, and improving on-farm productivity efficiencies. While some households engaged in mitigation strategies, the number is too small. On the other hand, agriculture insurance is still an uncharted territory in the country. The data reveal that less than 1% of households insured their farming activities in the 2015/16 growing season (Fig 3.5.3.2 in the appendix). Since all the impacts centred on agriculture and food security, the study also evaluated
household drought behaviours to determine what households are likely to do in the event of
drought. A large number of households sought financial assistance to buy food from their
friends and families (Fig 3.5.3.3). Other households resorted to extreme behaviours such as
reducing the number of meals per day and eating less expensive food. The drought pushed
households to make serious compromises on the amount and quality of food they ate.
Moreover, because food became too expensive, many households used informal micro
lenders and increased their household debt as recourse to mitigate against food shortages
and rising food expenses. Household savings in the form of livestock and cash also shrank.
Some households withdrew children from school to save on household expenditures while
others had to beg for help. Household vulnerability increased during the drought.
Households will require assistance when the rains are back to recover the losses in terms of
assets and resources lost due to the drought and to reduce risks on future disasters, such as
the forecasted La Nina (which could bring flash floods).
Furthermore, the study solicited the opinions of households on the primary actions taken to
reduce adverse impacts of drought disasters. Generally, households feel that their primal
responsibility during droughts and in preparation for a drought is to save water and grow
enough food to feed themselves. The implication of this is that on rainy days, water
harvesting should be encouraged by installing water tanks in every household in Swaziland.
People also realise that they have to seek employment/income generating activities to earn
and own their livelihoods and save for future disasters. Households believe that government
should provide water and food, especially during the drought disaster. A bigger role that
government can play in assisting food production at the household level is provision of farm
inputs and distribution of food parcels to the most vulnerable. Farmers require tractors for
farming and see government as possessing the muscle to provide the necessary assistance.
The government could also consider focusing on building capacity to harvest and store water
through building more community dams and drilling boreholes as per the aspirations of the
NDS. By doing so, the government will increase provision of clean and reliable water to every
household in Swaziland. Overall, households are of the view that the government could play
a big role in providing support to those households involved in food production, which could
go a long way in reducing exposure to future droughts and other common disasters in the
country. Households identified and commended the government, World Vision, Red Cross,

47
the NDMA, Africa Cooperative Agricultural Trust (ACAT), World Food Programme (WFP),
the National Emergency Response Council on HIV/AIDS (NERCHA), SWSC, and authorities
at the constituency and community level for the drought relief support during the 2015/16
drought.
The survey closed by asking households to list the most common types of disasters in their
communities, just to get a sense of the typical disasters that government and disaster
management entities in the country should look out for. Households identified windstorms,
hailstorms, thunderstorms, lightning, poverty, hunger, unemployment, and theft as the most
common types of disasters they face, as shown in Figure 3.5.3.5.
Figure 3.5.3.4 List of Relief Providers
Source: Authors’ own representation using survey data Notes: The figure is a word cloud of all the most frequent entities that provided relief
to households during the 2015/16 drought according to households. Some of the major entities that households acknowledged include the Government, World Vision, Red Cross, NDMA, ACAT, NERCHA, SWSC, Community, Constituency, among others.
Figure 3.5.3.5 Common Disasters in Swaziland according to Households
Source: Authors’ own representation using survey data Notes: The figure is a word cloud of all the most common disasters in Swaziland
according to households.

48
THE MULTI-SECTORAL
ECONOMIC IMPACTS OF THE 2015/16
DROUGHT
4.1. Introduction
he Food and Agriculture Organisation of the United Nations (FAO) states that
disasters tend to compromise agricultural production and development, and that
their impacts always have cascading negative effects on a country’s economy.
Specifically, the relationship between drought and agriculture is of utmost
importance because 84% of the damages and losses caused by droughts are usually on
agriculture (FAO, 2015). Other sectors such as health and nutrition, energy, water, and
sanitation usually constitute the remaining 16% of the drought impacts. This section explores
the effects of the drought in the agriculture sector to deduce the sector-wide economic
impact of the 2015/16 drought in Swaziland. It further presents the key impacts of the
drought on different sectors in the Swazi economy. Particular focus is on agriculture, water,
energy, environment, tourism, urban development, and meteorology forecasting and early
warnings. The study assesses the specific impacts of the drought on these sectors. However,
long-term impacts, which matter equally, are not considered.
In Section 1, drought is defined as the manifestation of prolonged water shortages due to
tenacious dry weather conditions. The results of severe drought are reduced water levels in
surface and underground water storage facilities such as rivers, lakes, dams, water tables,
underground aquifers, and other reservoirs. Water plays a crucial role in every part of
human, plant, and animal life. As a natural resource, water is an integral part of a country’s
ability to produce goods and provide services (National Drought Mitigation Centre, 2013).
For people, water is a necessary element in all forms of production, be it for food or non-
agricultural activities. People need water to drink, to clean as well as other sanitation
purposes, to grow crops, and to produce metals, among a plethora of other uses. Therefore,
water is a lubricant of the economy and undeniably a major component of the socio-
economic development in any country. When water is limited in quantity and quality, a
complex web of impacts arise that can span across many sectors of the economy and reach
well beyond the area or region experiencing the actual drought (National Drought Mitigation
Centre, 2013). Hence, severe shortages of water can have direct and indirect ramifications on
the economy as well as overall developmental milestones and aspirations of a country.
Unlike other disasters such as floods, hurricanes, and tornadoes, droughts do not exhibit the
same immediate and dramatic effects yet they carry a huge price tag. Droughts have negative
and positive net effects on macroeconomic variables such as GDP,
employment/unemployment that can vary in the short-, medium-, and long-term depending
on whether the impacts on the economy have a transitional or permanent effect (Benson and
Clay 2003; Baade et al., 2005). Essentially, a drought’s price tag or its economic cost has to
do with how the drought negatively affects income generation, investment, consumption,
production, employment, and financial flows (Clay, 2003). During a drought, the sectors of
the economy that directly use water as an input of production such as agriculture and
hydropower are likely to decrease their activities and production, make less revenue, lay-off
staff, and suspend all but critical investments (Mysiak and Markandya, 2010).
T

49
4.2. Understanding the Impacts of Drought
To understand the impact of drought on the multi-sectors of the economy, consider the
chronological progression of the drought provided below. Adapted from Maia et al. (2014), it
provides seven possible pathways that take place following the onset of drought:
I. At the onset of the drought, there is reduction in rainfall, which leads to
reduction on soil moisture.
II. The first impacts appear on the agriculture sector because of the soil moisture
deficits, which in turn inhibits crop production, reduces pastures for livestock
husbandry, and overall productivity of the ecological system (ecological
infrastructure). The extent to which crop production and environmental
productivity deteriorates, depends on;
i. Crop/vegetation patterns of the area;
ii. Crops developmental stage, in which the water shortage occurs;
iii. The existence, or lack thereof, of water to compensate moisture deficits in the
form of irrigation.
III. The reduction in water available in both surface and underground water reserves
then trickles to urban and rural water supply systems. The impacts involve
constrained supply periods due to limited water availability, water use
restrictions (for irrigation of gardens, street cleaning, car washing), and
restriction or competition for water rights between the different sectors of the
economy. Additional mitigation costs may be necessary to ensure supply of water
from alternative sources or through improvement of water treatment technics, as
was the case in Swaziland.
IV. Hydroelectric power generation also suffers. The main impact has to do with
limited amount of water available to enable effective power generation.
V. In the industry sector, the agro-food as well as pulp and paper industries are the
main subsectors affected because of the reduction and higher costs of the
available raw agro materials owing to slower development of forests vegetation.
VI. For the tourism and recreation sectors, the extent and severity of the impacts
depend on the season and area affected. For example, wildlife may be lost if its
inception period is immediately before or during the peak of the drought,
limitations on swimming pool fillings and golf course irrigation might be
initiated to save water in the tourism industry.
Hence, the discussion of economic impacts involves the losses incurred by individuals,
businesses, and the government in terms of the resources used or destroyed in the event of
the drought in addition to the costs of mitigation and adaption (Rose and Lim, 2002). Table
4.2.1 below provides a classification of drought costs categorised into direct, indirect, and
intangible costs. The Table further lists the losses related to each classification. Direct costs
relate to those costs that impinge on resource-based sectors like agriculture, and other water
dependent economic activities. Indirect costs refer to secondary costs that emanate from
losses in the resource-based sectors. Intangible costs relate to the social impacts of droughts
– these are seldom quantifiable, they are usually qualitative and tend to last longer.

50
Table 4.2.1 Classification of drought costs
Direct Costs Losses related to the biophysical impacts of droughts. These include losses in resource-based sectors.
Indirect Costs Losses induced by changes in resource-based sectors on the rest of the economy.
Intangible Costs Non-market losses associated with environmental and health effects of droughts.
Costs of drought mitigation and adaptation can be direct, indirect and intangible
Fo
rm
of
da
ma
ge
Measurement Market (tangible) Non-market (intangible)
Direct
Losses in resource based sectors like agriculture, e.g., crop failure and reduced livestock production. Reduced urban and rural water supply Reduced hydroelectric power production
Damage to wildlife and fish habitat. Loss of biodiversity, loss of wetlands. Deterioration of water and air quality Losses due to restriction of water supply in households
Indirect
Increased unemployment Changes in food prices Trade losses Reduced tax revenues Losses in sectors directly related to droughts, e.g., food processing industry
Animal diseases Reduced quality or loss of recreational sites, aesthetic impacts Increased human health costs (diseases and malnutrition) Loss of human lives.
Source: Adapted from Penning-Rowsell et al. (2003) and Logar et al. (2011)
Over 90% of government, non-government organisations, and business rated the drought as
severe. These entities described the drought as “the worst drought the country has ever
experienced since the 1980s.” Even though the 1992 drought was also severe, the level of
development in the country was not as extensive as it was in 2016. For example, in 1992 the
water grid only covered urban households, whereas in 2016, connection had spread to other
parts of the country, notably semi-urban and in some instances rural areas. Therefore, the
impacts of the 2015/16 drought affected a lot more people and businesses than the 1992
drought. The major trigger of adverse impacts on the economy, especially in the agriculture
sector, was poor access and poor absorption of drought early warning information and
fragmented coordination of mitigation mechanisms.
Generally, there is an underestimate on the value and importance of meteorological
information yet it can improve efficiencies and reduce losses not only in agriculture but also
in many other sectors of the economy such as construction and health. Even on an individual
level, meteorological information (weather forecasts) can improve planning of daily activities
and avoid potential losses/damage to inclement weather. As an example, farmers began
destocking their livestock too late and cattle either died or depreciated in value. The drought
also affected the quality of beef carcasses, causing the EU to downgrade about 33% of beef
exports to low quality, which adversely affected total export earnings from the beef
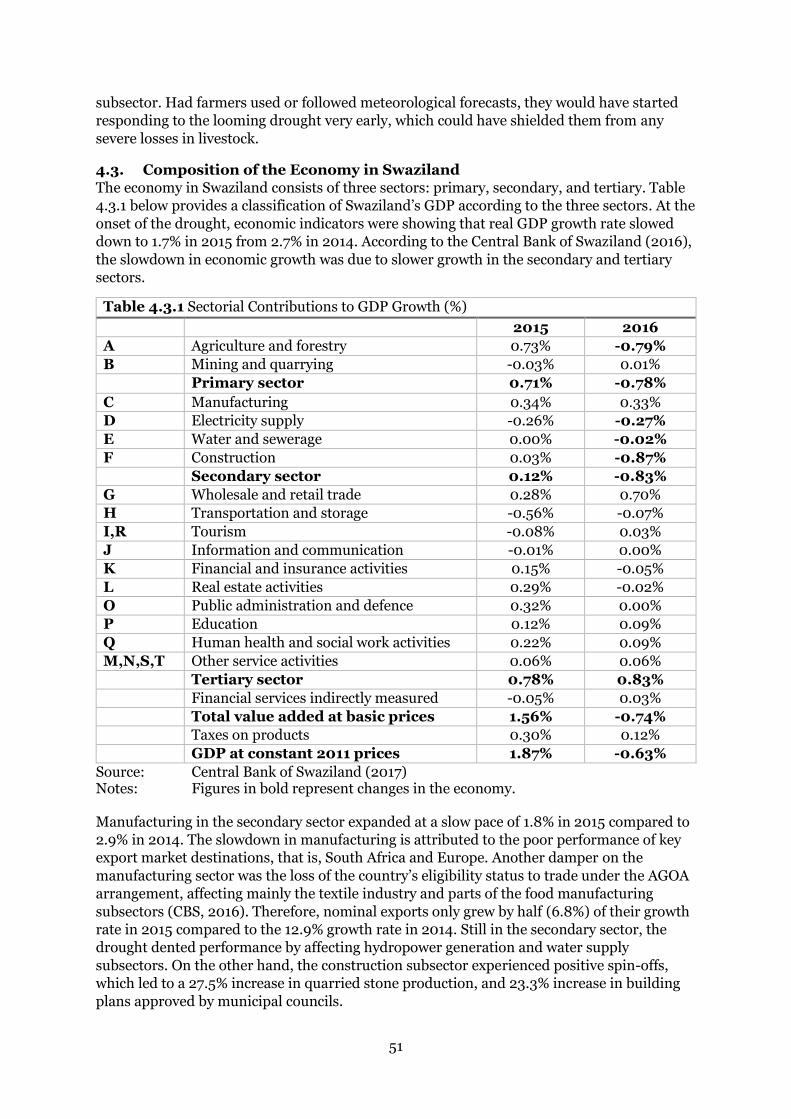
51
subsector. Had farmers used or followed meteorological forecasts, they would have started
responding to the looming drought very early, which could have shielded them from any
severe losses in livestock.
4.3. Composition of the Economy in Swaziland
The economy in Swaziland consists of three sectors: primary, secondary, and tertiary. Table
4.3.1 below provides a classification of Swaziland’s GDP according to the three sectors. At the
onset of the drought, economic indicators were showing that real GDP growth rate slowed
down to 1.7% in 2015 from 2.7% in 2014. According to the Central Bank of Swaziland (2016),
the slowdown in economic growth was due to slower growth in the secondary and tertiary
sectors.
Table 4.3.1 Sectorial Contributions to GDP Growth (%)
2015 2016
A Agriculture and forestry 0.73% -0.79%
B Mining and quarrying -0.03% 0.01% Primary sector 0.71% -0.78%
C Manufacturing 0.34% 0.33%
D Electricity supply -0.26% -0.27%
E Water and sewerage 0.00% -0.02%
F Construction 0.03% -0.87% Secondary sector 0.12% -0.83%
G Wholesale and retail trade 0.28% 0.70%
H Transportation and storage -0.56% -0.07%
I,R Tourism -0.08% 0.03%
J Information and communication -0.01% 0.00%
K Financial and insurance activities 0.15% -0.05%
L Real estate activities 0.29% -0.02%
O Public administration and defence 0.32% 0.00%
P Education 0.12% 0.09%
Q Human health and social work activities 0.22% 0.09%
M,N,S,T Other service activities 0.06% 0.06% Tertiary sector 0.78% 0.83% Financial services indirectly measured -0.05% 0.03% Total value added at basic prices 1.56% -0.74% Taxes on products 0.30% 0.12% GDP at constant 2011 prices 1.87% -0.63%
Source: Central Bank of Swaziland (2017) Notes: Figures in bold represent changes in the economy. Manufacturing in the secondary sector expanded at a slow pace of 1.8% in 2015 compared to
2.9% in 2014. The slowdown in manufacturing is attributed to the poor performance of key
export market destinations, that is, South Africa and Europe. Another damper on the
manufacturing sector was the loss of the country’s eligibility status to trade under the AGOA
arrangement, affecting mainly the textile industry and parts of the food manufacturing
subsectors (CBS, 2016). Therefore, nominal exports only grew by half (6.8%) of their growth
rate in 2015 compared to the 12.9% growth rate in 2014. Still in the secondary sector, the
drought dented performance by affecting hydropower generation and water supply
subsectors. On the other hand, the construction subsector experienced positive spin-offs,
which led to a 27.5% increase in quarried stone production, and 23.3% increase in building
plans approved by municipal councils.

52
The tertiary sector incurred marginal economic growth of 1.2% in 2015 compared to 2.4% in
2014. Transport and tourism were the most negatively affected in this sector of the economy
due to the shutdown of the iron ore mine, and introduction of strict immigration laws in
South Africa as of June 2015. Besides the major impacts on hydropower and water
subsectors, the drought had the most severe impact on the primary sector, particularly on
agriculture. Agricultural production is directly dependent on the total amount of rainfall
received among other inputs. With rainfall levels dropping by close to 60% (SMS, 2016), the
drought had the most strain on agriculture and agro-processing industries in the country.
Swaziland is especially vulnerable to drought because of its high dependency on the
agricultural sector. The agricultural sector comprises of rain-fed subsistence production
dominated by smallholder producers, and cash crops on large agricultural estates.
Smallholders constitute 70% of the population, and occupy 75% of the cropland but only
account for 11% of total agricultural outputs (GAIN, 2016). The key agriculture commodities
include sugar, cotton, maize, sorghum, peanuts, tobacco, cattle, goats, pigs, pineapples,
citrus fruits, grapefruit, and limes, with sugar being the largest single foreign exchange
earner in the country. The value of sugar derivatives accounts for 59% of the total agriculture
commodities in the country followed by beef (14%) and milk products (4%) (GAIN, 2016).
Poor performance in the different sectors of the economy affects revenue generation from
taxes on services and products produced. Based on the structure of the economy in
Swaziland, the drought did not directly affect all the sectors. To be clear, some sectors
continued with business as usual and realised growth while other sectors were negatively
affected and as such experienced negative growth. This rapid overview of the effects of the
drought on the Swazi economy indicates that it mostly affected the agriculture sector,
manufacturing industries dependent on water and agriculture, electricity and water supply,
construction, and the tourism industry. To get a sense of the likely impact in each sector of
the economy, Figure 4.3.1 below provides a classification of the sectors that are most likely to
be directly or indirectly affected by the drought as a percentage of total domestic tax revenue.
The figure shows that crop, animal production, and food processing, which are most
susceptible to the drought, account for more than 15% of the total revenue generated from
services and products in these sectors. Electricity and water supply constitute about 2% of
government tax revenue.
Figure 4.3.1. Sectorial Contribution to Government Tax Revenue
Source: Central Bank of Swaziland, 2016 Notes: The Figure shows the contribution of each sector to government tax revenue.
Most of the sectors that were affected by drought include crop and animal production, electricity supply, manufacture of food products and water supply.

53
4.4. Sectorial Impacts So what were the impacts of the drought on the different sectors of the economy?
Alternatively, how did the drought affect business activities and how did businesses respond
to the drought in the country? This section discusses the impacts per sector and highlights
the interventions initiated in each sector. Note that data and information provided were
collected from stakeholders who agreed to be interviewed.
4.4.1. Water Sector
The biggest challenge for SWSC in its mandate to supply water to urban areas is that when
the water sources shrunk, the entity still had to maintain demand. In Mbabane, the
alternative was to maintain demand by executing restriction measures, that is, water rations
for four days each week. Mbabane has a water demand of 26 mega litres daily and because of
water rationing, the demand dropped to eight mega litres per day.
In other major urban centres like Ngwenya, demand dropped from 1.5 to 2 mega litres daily.
Matsapha and Manzini, which have the highest water demand, were able to sustain 36 mega
litres daily. In these two urban centres, SWSC draws water directly from the river
(Lusushwana connected to Luphohlo Dam) and so variations in water levels create
challenges to sustain demand for SWSC. SEC owns and operates Luphohlo Dam but SEC and
SWSC eventually had to cooperate during the drought to accommodate electricity generation
and then releasing water into Lusushwana to maintain supply in Matsapha and Manzini.
Additionally, Matsapha catchment areas are also relatively huge because there are numerous
rivers connected to Lusushwana, including rivers from South Africa. In Mbabane, there is no
catchment area nor a strong river that feeds into Hawane reservoir. In the instances that it
rained in the Mbabane area, it was raining downstream of Hawane reservoir.
The biggest effects of the water rationing by the SWSC were in the form of pipe bursts and
road damages in the city. The utility provider noted that turning water on and off extensively
damaged water provision infrastructure in the capital Mbabane, which will take time to fix
optimally. The SWSC has experienced drought before but not to the extent of the one in
2015/16. For example, though the 1992 drought was full-blown, Hawane was able to cope
with water demand. The lowest point in Mbabane in previous droughts was at 30% capacity,
in 2007. During the 2015/16 drought however, Hawane Dam capacity reduced to 0%,
causing a respondent to exclaim:
“It was inconceivable, a fairy tale really, that Mbabane could
ever run out of water!”
SWSC was slow to respond to the drought. The Corporation only made its initial attempts in
November 2015 when Hawane had already reached 10% capacity. This represented the first
time that SWSC realised that the drought was taking a deeper turn and hence initiated
analysis of river systems across the country.
For Ezulwini area, Nyonyane and Mkhondvolwane Rivers dried up in April 2016. According
to SWSC, Nyonyane River has always been drying up. Therefore, Mcwembe and KalaMgabhi
became alternative water sources to supply Ezulwini area. In the long-term, SWSC plans to
link the water supply system in Mbabane with Ezulwini. In the Simunye corridor, Mbuluzi
River experienced sharp declines in water and Mnjoli Dam dropped to 7% capacity.
Mkhondvo River, which supplies Nhlangano, sustained itself because it connects from South
Africa and there was great cooperation between South Africa and Swaziland on water
management. In Pigg’s Peak, the demand for water is not as huge compared to the Mbabane
area, so the impact in the Maguga area was not as significant.
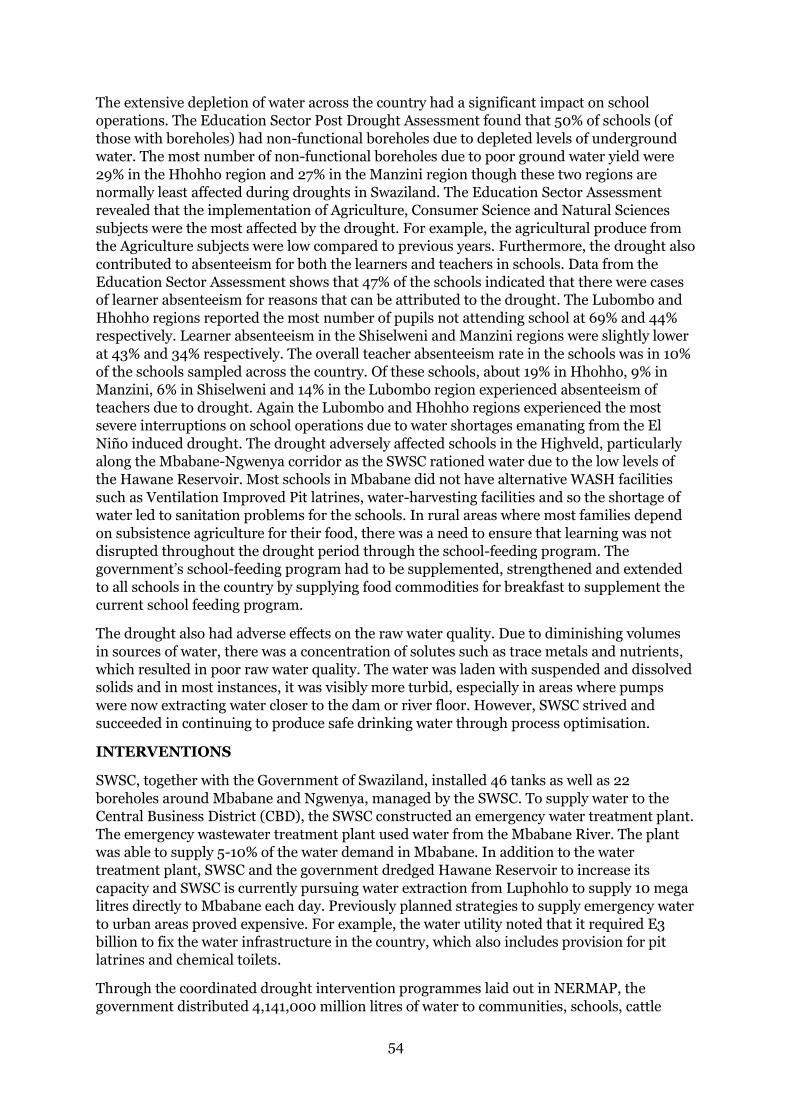
54
The extensive depletion of water across the country had a significant impact on school
operations. The Education Sector Post Drought Assessment found that 50% of schools (of
those with boreholes) had non-functional boreholes due to depleted levels of underground
water. The most number of non-functional boreholes due to poor ground water yield were
29% in the Hhohho region and 27% in the Manzini region though these two regions are
normally least affected during droughts in Swaziland. The Education Sector Assessment
revealed that the implementation of Agriculture, Consumer Science and Natural Sciences
subjects were the most affected by the drought. For example, the agricultural produce from
the Agriculture subjects were low compared to previous years. Furthermore, the drought also
contributed to absenteeism for both the learners and teachers in schools. Data from the
Education Sector Assessment shows that 47% of the schools indicated that there were cases
of learner absenteeism for reasons that can be attributed to the drought. The Lubombo and
Hhohho regions reported the most number of pupils not attending school at 69% and 44%
respectively. Learner absenteeism in the Shiselweni and Manzini regions were slightly lower
at 43% and 34% respectively. The overall teacher absenteeism rate in the schools was in 10%
of the schools sampled across the country. Of these schools, about 19% in Hhohho, 9% in
Manzini, 6% in Shiselweni and 14% in the Lubombo region experienced absenteeism of
teachers due to drought. Again the Lubombo and Hhohho regions experienced the most
severe interruptions on school operations due to water shortages emanating from the El
Niño induced drought. The drought adversely affected schools in the Highveld, particularly
along the Mbabane-Ngwenya corridor as the SWSC rationed water due to the low levels of
the Hawane Reservoir. Most schools in Mbabane did not have alternative WASH facilities
such as Ventilation Improved Pit latrines, water-harvesting facilities and so the shortage of
water led to sanitation problems for the schools. In rural areas where most families depend
on subsistence agriculture for their food, there was a need to ensure that learning was not
disrupted throughout the drought period through the school-feeding program. The
government’s school-feeding program had to be supplemented, strengthened and extended
to all schools in the country by supplying food commodities for breakfast to supplement the
current school feeding program.
The drought also had adverse effects on the raw water quality. Due to diminishing volumes
in sources of water, there was a concentration of solutes such as trace metals and nutrients,
which resulted in poor raw water quality. The water was laden with suspended and dissolved
solids and in most instances, it was visibly more turbid, especially in areas where pumps
were now extracting water closer to the dam or river floor. However, SWSC strived and
succeeded in continuing to produce safe drinking water through process optimisation.
INTERVENTIONS
SWSC, together with the Government of Swaziland, installed 46 tanks as well as 22
boreholes around Mbabane and Ngwenya, managed by the SWSC. To supply water to the
Central Business District (CBD), the SWSC constructed an emergency water treatment plant.
The emergency wastewater treatment plant used water from the Mbabane River. The plant
was able to supply 5-10% of the water demand in Mbabane. In addition to the water
treatment plant, SWSC and the government dredged Hawane Reservoir to increase its
capacity and SWSC is currently pursuing water extraction from Luphohlo to supply 10 mega
litres directly to Mbabane each day. Previously planned strategies to supply emergency water
to urban areas proved expensive. For example, the water utility noted that it required E3
billion to fix the water infrastructure in the country, which also includes provision for pit
latrines and chemical toilets.
Through the coordinated drought intervention programmes laid out in NERMAP, the
government distributed 4,141,000 million litres of water to communities, schools, cattle

55
troughs and health facilities through water tankers. Another 8.015 million litres of water
were distributed in Mbabane and Ngwenya for a total of 12.156 million litres of water
distributed during the drought. About 29 schools in the urban area providing potable water
to 19,594 learners and teachers (particularly in Mbabane-Ngwenya) benefited through the
installation of water tanks and filling with emergency water during the drought. Additionally,
10 schools in the Lubumbo and Shiselweni regions benefited from the establishment of
rainwater harvesting systems. Only 4 of the 20 boreholes drilled in Mbabane ended up being
operationalised while the remaining 16 did not meet the minimum yield requirement. In
total, the government drilled and operationalised 14 new standard boreholes of which 2 were
high yielding boreholes. Moreover, through NERMAP, the country rehabilitated 49 rural
micro water schemes and 4 macro reticulated water schemes, developed 2 unprotected
springs and cleaned up 13 vandalised boreholes. What is clear is that NERMAP enabled the
deployment of substantial resources to try to ensure water security to communities; however,
because of the extreme drought, water demand needs could not be met since SWSC had no
alternative but to execute water rationing in Mbabane, among other water shortage
incidents.
OPPORTUNITIES
Following the drought, SWSC is experienced an influx of applications for water connections
because people want clean and reliable water. In addition, the drought has put the area of
providing, and constructing infrastructure for harvesting and storing safe and reliable water
in Swaziland under the spotlight. The drought brought entities that previously did not work
together to discuss water use under the same roof. For example, SEC and SWSC ended up
working together to formulate a working relationship on electricity generation and water
supply using Luphohlo Dam.
4.4.2. Agriculture Sector
Subsistence agriculture in Swaziland is predominantly a rain-fed food and fibre production
system while, for the most part, commercial agriculture depends on irrigation. The country
relies on rainfall to produce anything and when the rains disappear, everything comes to a
standstill. The major impacts in the agriculture sector were on food, fibre production and
livestock husbandry.
IMPACTS
With respect to livestock farming, the impacts were most devastating. Since the drought
wiped out vegetation and rangelands across the country, particularly in the Lubombo and
Shiselweni regions, livestock farmers faced a grave challenge in sourcing feed for their cattle.
Livestock farming:
Death of livestock
The drought affected cattle due to lack of feed (destruction of rangeland-affected pastures)
and shortage of water. The Lowveld and lower Middleveld of Swaziland showed very poor
range conditions and in most cases grazing lands just simply dried out. In some areas in the
Lowveld and lower Middleveld, wild fires exacerbated feed shortages by destroying
rangelands. Livestock survived on available browse on enclosures with grass. Farmers also
provided hay bales to their cattle while those who could afford moving cattle to the Highveld
and upper Middleveld of the country, wasted no time in doing so. Though the Highveld and
upper Middleveld had some grass, it had unfortunately lost its nutritious value (MOAC, 2016
pers comm). An estimated 88,000 cattle died due to the drought. The 88,000 cattle that
died during the 2015/16 drought period is more than double the number of cattle that died in

56
2014 or 2013. In 2014, the Ministry of Agriculture (MOA) reported that 38,899 cattle died in
the whole country whilst in 2013 it recorded only 35,096 cattle deaths – suggesting that
signs of livestock deaths due to the drought were already evident in the two years prior to
2016. Furthermore, whereas cattle mortality was on the rise during the drought, the total
number of calve births decreased by 6% in 2016 (CBS, 2016; MOAC, 2016). Tracking calve
births from 2014 just before the drought reveals that calve births recorded in 2014 were
85,000 dropping by 32% to 58,000 in late 2015 (CBS, 2016; MOAC, 2016). Using 2014 as
the normal base year before the drought, the loss in calve births due to the drought in this
period is equivalent to 27,000 calves.
During the drought, farmers did not have the capacity or financial muscle to relocate their
entire herd to other regions of the country where grazing land was still available. Those
farmers who destocked swiftly by selling some of their cattle were able to avoid losses due to
death of cattle. For the other farmers that held on to their livestock, the cattle either died or
deteriorated in health resulting to a much depreciated value when the cattle were eventually
sold to Swaziland Meat Industries. Since most of the cattle sold to the Swaziland Meat
Industries (SMI) were of low quality, the EU and Norwegian market downgraded 33% of beef
exports to low quality beef, which robbed the country of potential earnings in foreign
currency. In 2015, the number of commercial slaughters actually increased because many
cattle livestock farmers realised that they could not sustain their stock through the drought
due to lack of feed and water. However, most of the cattle in late 2015 into 2016 had
deteriorated in health and hence fetched low prices at the commercial abattoirs. Interviews
with Swaziland Meat Industries indicated that the most affected areas (particularly Lubombo
and Shiselweni) had no choice but to sell their cattle for as little as E1,500 with a price ceiling
of E4,000 for those that had managed to feed and treat their cattle during the drought. A
healthy cow usually sells for E7,000 and so the losses to farmers were between 42% and 80%
on each cow compared to normal market prices.
Therefore, though the meat (beef) industry performed well in 2015 in light of the shear
volumes of cattle slaughtered, the value of the stock and earnings fell. As farmers disposed of
their cattle because of the persistent drought, cattle slaughters rose by 62.4% in 2015
increasing beef exports by 8.5% in 2015. Beef exports in 2015 amounted to 1,126 metric
tonnes compared to the 1,038 metric tonnes in 2014 (CBS, 2016). Boneless beef destined for
the EU market was well over 500 metric tonnes, increasing export receipts by 13.1% with a
total export value of E83.6 million (CBS, 2016). Beyond 2016, negative growth is expected in
the meat industry due to the erosion of the cattle stock that affected many farmers during the
drought. The value of the beef exports especially in 2016 will also fall due to the 33%
downgraded beef.
The poultry industry suffered as well. Heat stress, specifically for commercial farmers
without cooling systems, killed 10,600 chickens over a period of three months during the
peak months of the drought.
Overall, the drought affected subsistence farmers in that they lost their only form of savings.
Areas that reported the most severe impacts on livestock losses include Somntongo, Hluti,
Sithobela, Mliba, Malindza, Sgangeni, Ntfonjeni, Nkambeni, Ngculwini, Dwaleni, Mpaka,
Siphofaneni, Tsambomkhulu, Ka-Khuphuka, and Mlindazwe. Most of these areas
particularly, Somtongo were experiencing extreme water shortages and collapse in
rangelands.

57
INTERVENTIONS
The government and private commercial farmers sourced food supplements such as hay
bales, and water outside the country. Water intervention for livestock drinking amounted to
1,368 million litres of water distributed countrywide. The MOA provided extension services
to farmers on livestock management, providing destocking by selling to commercial abattoirs
as a viable option. The Swaziland Meat Industries also provided a similar extension service
to local farmers and smallholders on livestock management, focusing on destocking and
supplementary feed options during the drought.
Crop farming:
Swaziland’s crop production system comprises of subsistence smallholder producers who
mainly practice rain-fed agriculture, and large-scale commercial farmers who depend on
irrigation and produce mainly cash crops. Smallholder producers comprise 70% of the
country’s population in 75% of the cropland mostly found in rural areas on Swazi Nation
Land (SNL). Generally, productivity among smallholders is low, accounting for 11% of the
total agricultural outputs in the country (GAIN, 2016).
There is also a cluster of farmers in the country on SNL who are smallholders but using
irrigation and other agriculture technologies to improve production. Most of the crops under
irrigation are the cash crops such as sugar cane that contribute significantly to the country’s
GDP and export receipts. Maize and cotton production are largely a smallholder SNL system
that is almost entirely dependent on direct rainfall. Therefore, the drought had severe impact
on maize and cotton production, given their high dependency on direct rainfall. Some
significant/high impacts were also experienced by the sugar industry due to heatwaves and
low levels of water in irrigation dams in the country.
Maize
Though drought conditions were evident in the 2014/15 growing season, the total area
planted for maize increased slightly from 86,800 hectares in 2013/14 to 87,200 hectares in
2014/15 (MOAC, 2016). The stimulus in maize cultivation came as a result of the promising
rains experienced in the beginning of the 2014/15 season and Indian loan and government
subsidies on agricultural inputs (MOAC, 2016; CBS, 2016). The Indian loan increased the
fleet of tractors available to farmers on Swazi Nation Land by 100 units. Moreover, the loan
also provided subsidised farm inputs, increasing the number of participation farmers from
3,000 in 2014/15 to 14,000 in 2015/16 (MOAC, 2016). However, as the drought manifested
depriving the whole country from rainfall, the area planted fell by more than 44% resulting
in a 64% corresponding fall in production from 93,653 tonnes in 2014/15 to 33,460 tonnes
in 2015/16 (Drought Assessment Report, 2016). The drop in maize production in the
2015/16 growing season is the worst in the past 10 years, lower than the 46,604 tonnes
produced in the recent 2007 drought. Figure 4.4.2.1 below provides a historical illustration
of maize production in the country.
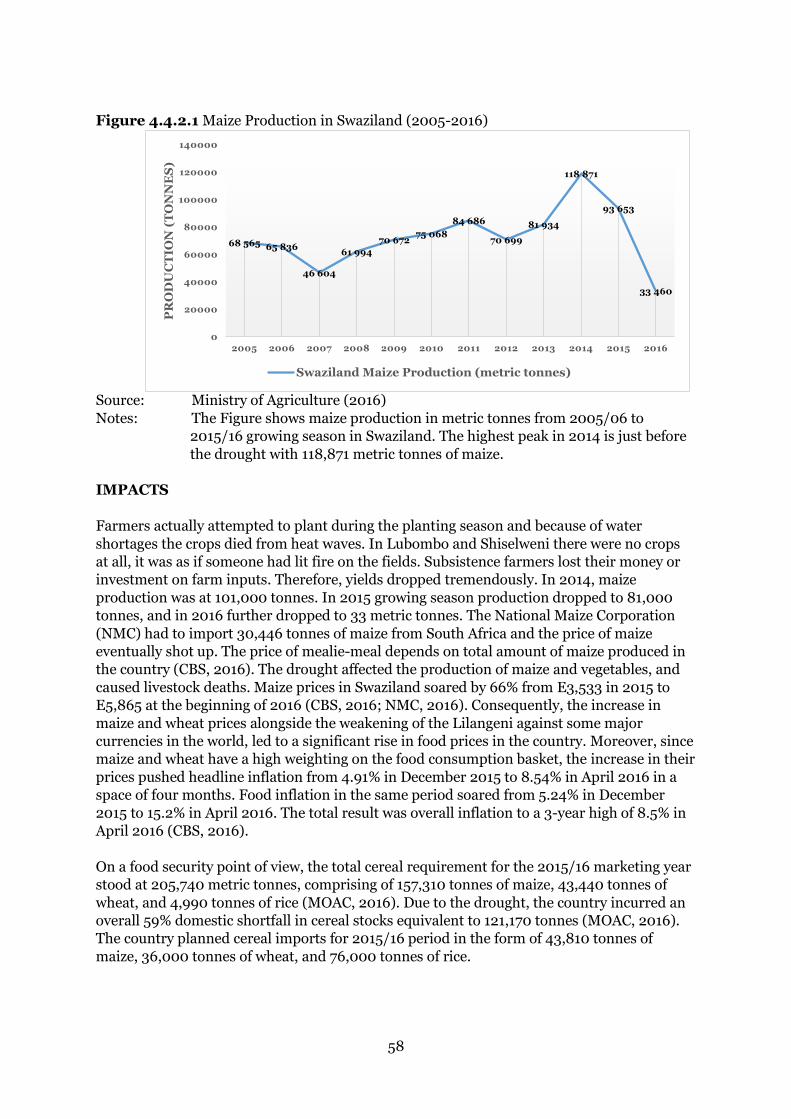
58
Figure 4.4.2.1 Maize Production in Swaziland (2005-2016)
Source: Ministry of Agriculture (2016)
Notes: The Figure shows maize production in metric tonnes from 2005/06 to
2015/16 growing season in Swaziland. The highest peak in 2014 is just before
the drought with 118,871 metric tonnes of maize.
IMPACTS
Farmers actually attempted to plant during the planting season and because of water
shortages the crops died from heat waves. In Lubombo and Shiselweni there were no crops
at all, it was as if someone had lit fire on the fields. Subsistence farmers lost their money or
investment on farm inputs. Therefore, yields dropped tremendously. In 2014, maize
production was at 101,000 tonnes. In 2015 growing season production dropped to 81,000
tonnes, and in 2016 further dropped to 33 metric tonnes. The National Maize Corporation
(NMC) had to import 30,446 tonnes of maize from South Africa and the price of maize
eventually shot up. The price of mealie-meal depends on total amount of maize produced in
the country (CBS, 2016). The drought affected the production of maize and vegetables, and
caused livestock deaths. Maize prices in Swaziland soared by 66% from E3,533 in 2015 to
E5,865 at the beginning of 2016 (CBS, 2016; NMC, 2016). Consequently, the increase in
maize and wheat prices alongside the weakening of the Lilangeni against some major
currencies in the world, led to a significant rise in food prices in the country. Moreover, since
maize and wheat have a high weighting on the food consumption basket, the increase in their
prices pushed headline inflation from 4.91% in December 2015 to 8.54% in April 2016 in a
space of four months. Food inflation in the same period soared from 5.24% in December
2015 to 15.2% in April 2016. The total result was overall inflation to a 3-year high of 8.5% in
April 2016 (CBS, 2016).
On a food security point of view, the total cereal requirement for the 2015/16 marketing year
stood at 205,740 metric tonnes, comprising of 157,310 tonnes of maize, 43,440 tonnes of
wheat, and 4,990 tonnes of rice (MOAC, 2016). Due to the drought, the country incurred an
overall 59% domestic shortfall in cereal stocks equivalent to 121,170 tonnes (MOAC, 2016).
The country planned cereal imports for 2015/16 period in the form of 43,810 tonnes of
maize, 36,000 tonnes of wheat, and 76,000 tonnes of rice.
68 565 65 836
46 604
61 994
70 67275 068
84 686
70 699
81 934
118 871
93 653
33 460
0
20000
40000
60000
80000
100000
120000
140000
2005 2006 2007 2008 2009 2010 2011 2012 2013 2014 2015 2016
PR
OD
UC
TIO
N (
TO
NN
ES
)
Swaziland Maize Production (metric tonnes)

59
INTERVENTIONS
To encourage farmers to produce maize, NMC offered a promotional price for a tonne of
E2,575 in 2014 to E2,900 in 2015 and E4,000 in 2016. The government, through the NMC
tried to ensure food security by allocating some sugarcane fields into maize fields. Food
distribution became a key contributor to try remediate the issue of food insecurity, especially
in the Lubombo and Shiselweni regions. The government, through the NDMA, started food
distribution as early as 2015 and up-scaled it after the declaration of the drought as a
disaster in February 2016. Other development partners joined forces to distribute food to
communities across the country in June 2016. By December 2016, the food distribution
programme had reached approximately 413,553 beneficiaries (over a period of 12 months)
compared to the target of 350,000 beneficiaries as planned in NERMAP. About 89,679 of the
beneficiaries received cash for food (E550 per family per month) amounting to
E40,160,200.00, (NERMAP MTR, 2017). Approximately 55.9% of households received food
assistance in the period August 2016 – January 2017 with the highest region receiving such
assistance being Lubombo (73%) and Shiselweni (71.1%) while the lowest was Hhohho
(51.8%) and Manzini (34.2%). Over 13,500 households, (about 67,500 people) were
supported with seed inputs to put more than 13,000ha of land back into production in the
current season.
Cotton
In Swaziland, cotton is the only cash crop that is completely reliant on rainfall. Due to the
erratic and limited rainfall received in the period 2014 to 2016, cotton production fell by 27%
in 2013/14 and 52% in 2014/16. For the 2015/16 growing season, the Swaziland Cotton
Board distributed only 6.1 metric tonnes of cottonseed to farmers compared to the 23.8
metric tonnes distributed in 2014/15. Cotton production dropped by nearly 90% from 873
tonnes the previous year to 100 tonnes in 2015/16. Very few farmers actually planted cotton,
and those that did could not get the seed to germinate. In total, farmers planted 612 hectares
of cotton in 2015/16, almost a third of the 1,730 hectares planted in 2014/15 (Swaziland
Cotton Board, 2016). Figure 4.2.2.2 below shows a historical overview of cotton production
in the country.
Figure 4.4.2.2 Cotton Production in Swaziland (2005-2016)
Source: Swaziland Cotton Board
Notes: The figure shows cotton production in Swaziland from 2005 to 2016. The
highest spike in 2005 is corresponds to 3168 metric tonnes of cotton delivered
at the ginnery.
3168
984
720
394
1566
23492138
1951
2485
1820
873
1000
500
1000
1500
2000
2500
3000
3500
2004 2006 2008 2010 2012 2014 2016
PR
OD
UC
TIO
N I
N T
ON
NE
S
YEARS

60
From Figure 4.4.2.2 above, it is evident that the 2015/16 drought had a devastating impact
on the cotton industry. The 100 tonnes produced in 2015/16 is the lowest recorded in 10
years. The ginnery operated at a 10% capacity resulting in job losses of about 90 seasonal
employees who depend on the industry for their livelihoods. In 2013/14, E9 million was paid
to farmers for 1,600 metric tonnes of harvested cotton and E600,000 for 10 truck owners
collecting the cotton. In 2014/15, E4.4 million was paid to farmers for 873 tonnes of cotton
at an average price of E5.15/kg (Swaziland Cotton Board, 2016). The cotton industry
supports many livelihoods in the rural areas, especially in Shiselweni and Lubombo where
maize production does not do so well. Figure 4.4.2.2 also shows that cotton production is
very dependent on rainfall. For example, the 2007/08 drought also had a debilitating impact
on the cotton industry, dropping production from 3,168 tonnes in 2005 to a measly 394
tonnes in 2008.
Sugar Cane
Approximately 24% of sugarcane grown in Swaziland relies on direct rainfall while the
remainder falls under irrigation (Swaziland Sugar Association (SSA) personal
communication, 2016). Irrigation depends on water stored in dams and from rivers. With
less rainfall, there is limited water available for irrigation to sustain the sugar crop. The sugar
industry experienced the effects of El Nino in March 2014 which became more prominent in
2015 when the dams and rivers were running very low.
IMPACTS
Low rainfall over a period of eight months affected the sugarcane crop. A total of 1,200
hectares over 60,000 hectares had to be abandoned. In addition, sugarcane producers had
short and uneven sugarcane that needed extra time and water to mature physiologically. The
industry had to suspend replanting. Experts from the SSA report that farmers have to replant
approximately 10% of the total area planted each year. Because of the drought, the industry
could not meet the 10% replanting target, which usually begins from February to April and
again from July to September. In September 2016, there was zero replanting done because
there was absolutely no water for irrigation.
Due to the drought, cane production dropped by 15.6% from 5,836,553 tonnes in 2015/16 to
4,928,110 in 2016/17 (SSA, 2016). Not surprisingly, yield also plummeted from 101.2 tonnes
of cane/area harvested in 2015/16 to 88.4 tonnes of cane/area harvested in 2016/2017.
Maybe the sucrose content will remain relatively the same at 13.9 % to 14% in 2015/16 to
2016/17 respectively because with less water, the sugar concentration per stem of cane
becomes much more concentrated. However, looking at the long-term impact, the delay in
replanting of sugarcane fields will induce yield penalties in many years to come.
Total sugar sales are projected to decline by 22% in the 2016/17 marketing season against a
record high of 700,017 metric tonnes in 2015/16. The sugar industry further expects a 15%
drop in sucrose production from 813,966 tonnes in 2015/16 to 691,777 tonnes in 2016/17
(SSA, 2016). Sales from SACU are expected to drop by 5% whilst export sales outside the
SACU market are expected to drop by 45%. The industry also reported a financial loss of
E120 million for the 2016/17 financial year. To explain the financial loss, the drought
increased the cost of production in terms of increases in electricity for irrigation, and
additional labour force and transport costs (SSA, 2016; CBS, 2016). Sugar sales improved in
2015/16 due to increased production and carried over inventories from 2014/15. The value of
export receipts outside the SACU region in 2015/16 were E1.456 billion. Within the SACU
region, sales amounted to E2.573 billion in 2015/16. Noting that sugar is a key foreign
currency earner in the country, the 5% decline in the EUROZONE market and 45% decline in

61
SACU sales are a huge dent to the industry and the entire economy. Total losses to the
industry due to the drought could amount to just under E1 billion.
INTERVENTIONS
In response to the drought, the sugar industry was able to implement Drought Management
Guidelines at a very early stage. The industry utilised water rationing as a drought mitigation
strategy. This included reducing irrigation to 30% - a minimum just enough to keep the
sugar crop alive. The mitigation measures put in place worked well for the industry despite
the intensity of the drought. Though production levels dropped due to water shortages, the
industry did not go belly-up: it is still alive and performing through the “worst drought the
country has seen since the 1980s” despite the challenges. If the drought had persisted for an
additional 6 to 12 months into 2017, the extreme water shortage, perhaps, could have
rendered the situation irrepressible. The drought created opportunities to learn and make
sure that the entire sugarcane production system is in check. The Swaziland Sugar
Association summarised the impacts as follows:
“This is the worst drought we have ever experienced as a sugar industry and because of
this we have learnt to cope under arduous conditions. We have realised that climate change
is real and it is here to stay. The drought was therefore a learning curve for us to check our
systems and make sure that we use our resources effectively.”
“The Water Act 2003 was supposed to put a levy to encourage companies to use water
sparingly but did not. Moving forward we must make sure that all the instruments that can
help us conserve water and use our resources effectively are implemented.”
4.4.3. Energy – Electricity Production Sector Electricity has become a vital part of modern societies. The use of electrical equipment in almost every aspect of life means that interruptions paralyse the daily routine. Improving electric power reliability so that more people (or customers) will have the opportunity to make use of electricity is in favour of everyone in the market. In this sense, reliable electricity can be the catalyst for the much-needed economic recovery in Swaziland. The general vulnerability to drought stems from the fact that the country is a hydro-based electricity generation system. According to SEC, the 2015/16 drought is actually a 3-year impact; SEC has been monitoring water flow rates and within the past three years, found that flow rates have been gradually decreasing in rivers. In fact, these flow rate reductions have been following an increasing trend for the past 20 years. Water flow rates and capacities have been on the decline for the past 20 years. There are gauging stations across the country (GS15 and GS2 – Matsapha). The three rivers used for the generation are Great Usuthu, Lusushwana, and Nkomati – Maguga. IMPACTS
Four months elapsed with zero power generation; however, Luphohlo Dam had water for
some time during the drought, and so could subsidise generation at peak hours, sparing the
country from load shedding. The price of electricity is very high at peak hours and so SEC
used Luphohlo Dam to generate electricity at peak hours in order to avoid importing
expensive electricity at peak times. Another redeeming factor was the slow-down of the
South African economy, which meant South African electricity consumption was also slightly
lower than usual, and so load shedding to stabilise demand did not become a necessary
mitigation strategy to save power. On the other hand, the country needs 40% capacity at
Maguga Dam to start generating electricity. During the drought, Maguga Dam was far below
this capacity. KOBWA is able to harvest water allocations not in use when there is low
62
demand because of slower development and SEC can use that harvested water to generate
electricity. However, during the drought, this water was not available. What is more is that,
Maguga presents a unique challenge in that the dam was built to support irrigation which
creates demand clashes between water demand for agriculture purposes and demand for
electricity generation.
The consequence of zero electricity generation was that SEC had to pay between E70 million
and E75 million per month to import electricity from Eskom. This is a huge sum of money
that could have been invested into Swaziland’s economy to stimulate economic activity in
capital projects within SEC. The drought has muted SEC’s mitigation strategies for managing
electricity demand and generation. The country had to import all electricity from South
Africa. At one point, the country had to pay E110 million per month during peak season.
Normal peak season cost of electricity averages E80 million per month. To import electricity,
the country uses the 400 kV line. Given that the tolling fee for importing electricity is in
United States of America (US) dollars and that at the time the drought intensified, exchange
rates also got out of control with the Lilangeni weakening against major currencies, which
added costs to SEC since the rents for using the line are calculated using spot rates.
SEC on average generates 300 GWh of power per year. However, in 2015/16 SEC was only
able to generate 120GWh of power and could not even reach half of its normal annual power
generation targets as shown in Figure 4.4.3.1 below. SEC had to cut operations to minimise
expenditures where possible. The entity stopped hiring and froze all but critical capital
projects.
Figure 4.4.3.1 Hydropower (electricity) Generation in Swaziland (2010-2016)
Source: Swaziland Electricity Company (2016) Notes: The figure shows hydro electricity generation in Swaziland from 2010 to 2016.
The drop in water levels and hence drop in hydropower generation began in 2014 dropping from 302.3 GWh (24%) in 2013/14 to 60 GWh in 2015/16 and down to 0 GWh in October 2016.
The implications of suspending capital projects will probably have long-term effects. These
projects were mandatory to keep SEC’s systems viable and competitive to serve the nation
and its developmental goals in the coming years. SEC had planned to move some
transmission and change some wood poles to steel poles. Both projects had to be suspended.
The only major project that remained running was the St Philips – KaNgcamphalala
substation construction. This project continued during the drought because of the huge
333.4
279.8
239.8
302.3
231
123.3
60
00
50
100
150
200
250
300
350
400
2010 2011 2012 2013 2014 2015 2016 2016/17
Hydropower Generation (GWh)

63
development targets around Siphofaneni area. Despite cuts in operational costs and freezing
of capital projects, the utility provider prioritised maintenance during the drought to avoid
compounding issues on SEC’s infrastructure and systems. There were minimal electricity
interruptions due to relatively weaker winds and as such, no significant interruptions on
electricity lines. However, the prevalence of veld fires was very high, exposing some
electricity poles to fires. Usually, every winter SEC hires workers to clear overgrown grass
around the electricity poles. A major impact concerning veld fires is the electricity line
connecting the sugar belt industries that must always be operational.
INTERVENTIONS
The SEC ranked the drought as severe because the company had to stop generating
electricity. The redeeming feature was that Swaziland has never missed its payments for
electricity from ESKOM. The country is connected to the 400kV (1,000MW) line
international connector which is never switched off. SEC applied for a subvention from
government to meet these costs. Within the 3-month peak season SEC needed E237 million.
Government allocated E80 million, of which only E20 million was disbursed to SEC and the
remaining E60 million was still pending at the time of the interview. A joint venture exists
between SEC and KOBWA to manage these water demand challenges. KOBWA and SEC
operations coincide so that release of water at Maguga Dam goes through turbine, which
generates electricity, and the water then flows through to support agriculture irrigation
commitments. SEC also has agreements with all the companies to manage the potential
damage on the electric line because of veld fires.
Generally, development in Swaziland, particularly in the energy- electricity sector has grown
too fast. Unfortunately, this growth is not coherent to the right kind of customers that could
adequately sustain SEC as a power generator. There is a lack of energy intensive industries.
Over the years, the country has lost all its energy intensive industries like Dvokolwako mine,
Swazi Paper Mills, Usuthu Pulp, Beral-Swaziland, to name but a few. Energy intensive
industries pay competitive tariffs that enable SEC to reinvest in new technologies, including
performing systems upgrades and expansions. These industries are also key players in
maintaining a viable electricity system in the country. SEC made a big investment in the
form of three substations at a cost of E36 million in Matsapha industrial site. With the loss of
some of these industries in Matsapha, SEC has not been able to see a return on this
investment (SEC, 2016: Pers. Comm.). Without such investments, it is impossible to supply
reliable power to industry and blackouts can have rippling effects, which can cause damage
to products, missed deadlines on exports, exit of factories from Matsapha industrial site, etc.
The lack of energy investment is a big issue in Swaziland. Even though the Head of State, and
2016 Budget Speech from the Throne encourage investment in energy, the actualisation of
the energy plans and other development plans in the country has become a systemic
problem. There is a huge gap between the developmental aspirations policy stance of the
country and the actual implementation of these developmental goals. SERA is open to the
diversification of energy generation in Swaziland as well as is keen to consider intelligent
technologies that can contribute to energy production (SERA, 2016: pers. comm.).
“Nothing works without electricity. It is as good as security for the country. This 2015/16
drought has been the worst drought in the history of SEC organisation. It put a dead stop
on electricity generation, which has never happened.”
4.4.4. Natural Environment & Ecosystem Productivity Sector The environment is a gatekeeper of the natural resource base of any country. When droughts hit, the environment suffers the first set of impacts. When the climate and weather patterns
64
change, the environment is directly affected, which in turn limits physiological and biological processes that maintain flora and fauna as well as agriculture production systems in the country. IMPACTS
The key issue, according to the Swaziland Environmental Authority (SEA), is the expansion
of areas showing signs of desertification across the country. Areas that used to be green
zones are now becoming semi-arid. Most vegetation has died and land remains bare and
vulnerable to erosion. Some key areas include Somntongo and Hlatikhulu. On the same note,
Hlatikhulu was previously producing a lot of food but during the 2015/16 drought there was
no ploughing at all in the area. The implication is that there will be no outputs from
Hlatikhulu, and in areas where they managed to plant, the crops just withered away well
before maturity time. Rainfall from the year 2000 has been gradually declining. Now
because of the drought, ecosystems are dry and are struggling, and in some cases failing to
support the biodiversity of each habitat. There is a general shift in the ecosystem in the
country due to drought and climate change: the ground is getting drier to the west of
Swaziland. Vegetation is also shifting to the west and the grasslands are shrinking
throughout the country. The grass in the country is also getting smaller in height (SEA, 2016:
Pers. Comm.).
At species level, more in-depth assessments are required to determine changes to, and to
ascertain how much the drought has cost the country in terms of the biodiversity of species
in the different natural habitats. In terms of impacts on wetlands, SEA found that the
drought did not affect protected wetlands as much because communities continued to
maintain them. The drought affected unprotected wetlands. Generally, the ground remained
bare and prone to erosion. The danger with this is that when the rains return, the country
can expect a lot of galley erosion as a secondary impact of the drought. Trees have dried up
too, leading to increases in deforestation, which in turn has decreased the rejuvenation
capacity of the natural forests to flourish when rains start to fall. Deforestation and
decreased capacity to regenerate natural forests further exacerbated biodiversity loss in the
country.
Serious causes for concern are the opportunities the drought has created for alien invasive
species. Alien invasive species are very opportunistic. They out-compete the native plant
species in water, and nutrient usage. As the country started to receive patches of rain in late
2016, the alien invasive species got a greater chance to take over entire habitats across the
country. Fire also became a critical issue during the drought. The incidence of veld fires
during the drought was very high. Losing vegetation/forests/plant species due to fires might
lead to further losses in the biodiversity of our flora in the country. Alien invasive species
might also out-compete native plants post fires when vegetation starts to grow again. Water
quality and quantity was a major concern during the drought because droughts introduce a
diluting factor into the natural water system. They also magnify the concentration of
pollutants and salts, which has an impact on the quality of water available for human use as
well as the water available to sustain the various natural ecosystems in the country.
When drought intensified, SEA increased monitoring for pollution or water quality of main
rivers and Transboundary Rivers. For the first time now because of the drought, SEA has
also included Mbabane River in its monitoring exercise. Generally, SEA is finding that water
pollution is on the rise.

65
INTERVENTIONS
In terms of conservation of wildlife biodiversity, the biggest challenge caused by disasters
such as drought is that the laws prohibit lifting and relocating wildlife species. What could be
done is to protect species by creating corridors for them to move and have the flexibility to
occupy areas that are more favourable to their survival. During the course of the last two (2)
years, SEA has been proactive in protecting eight wetlands that are a source of water for
communities. Unfortunately, the Hawane wetland ran dry. However, other wetlands have
served as a mitigation strategy for the drought by continuing to supply communities with
water for domestic and livestock consumption. A total of E1.2 million went toward wetland
protection. The SEA plans include to gradually mainstream climate issues/climate mitigation
measures as a requirement in Environmental Impact Assessments (EIAs) for the
development projects in the country. The SEA believes that EIAs can play an instrumental
role in influencing developmental decisions on climate change to enable development
projects to put the right structures in place to mitigate against climate change (SEA, 2016:
Pers. Comm.). EIAs can be a powerful tool to protect the country’s ecological infrastructure,
rivers, forests, wetlands, flora, fauna, etc.
OPPORTUNITIES
A positive spin-off that the drought has brought for the environment sector is that people are
now more interested in environmental issues following the scarcity of water in Mbabane.
Due to the drought, the public now has a listening ear on issues concerning environmental
management and stewardship. Some topical issues that have people interested now include
building and protecting water catchment areas, understanding erosion issues, especially now
that rains have begun. Turbidity and silt – Red River – issues are on the rise as rains wash
bare soil into rivers. According to SEA, the drought was SEVERE and advised that Swazis:
“Need to conserve and protect the country’s ecological infrastructure just like the country
takes care of its roads. In this 2014-2016 drought, we were more reactive rather than
proactive. We need a disaster/emergency plan and an institutional will that will make
these plans actionable. Most of our hydrological systems are fragile, even more fragile than
we thought! The rangeland system in Swaziland collapsed completely and for the first time,
there was no grass. The country had to import grass! The food production system collapsed
and we lost livestock – we lost many cattle. We need to take our plans seriously because
they are there for an important reason that can save many lives and keep our natural
environment intact.”
4.4.5. Tourism Sector IMPACTS In order to assess the impact of the drought on the tourism sector, the Swaziland Tourism
Authority (STA) approached some of the key establishments and found that the impacts
ranged from moderate to high. Manzini, Ezulwini, and Pigg’s Peak had very low impact.
There was no major water rationing in these areas and the establishments prepared for the
water situation by buying tanks and generators. Tourism establishments based in Mbabane
experienced the worst impacts. For instance, Mountain Inn Hotel had to use water from
their pool to mitigate against the shortages. However, in terms of sale of bed space, the
sector did not experience any decreases. To illustrate, visits into the country did not suffer
much because of the mitigation measures put in place. Mbabane experienced most impacts
on services; water shortages made it hard for businesses to operate because many of the
services in the hospitality industry need water. Establishments in the Lubombo region had
water generators and so water was relatively available. However, Lubombo suffered the most

66
on vegetation and animal (flora and fauna) impacts. Because of the scorching temperatures,
a lot of the vegetation in the Lubombo region died. National Parks had to buy food/feed for
the animals used to attract visitors into the country. In general, most of the tourism
establishments incurred costs in procuring the infrastructure to mitigate against the drought
– the water tanks, generators, etc. Now, moving forward they need assistance in maintaining
this vital infrastructure and perhaps assistance in feeding the fauna.
INTERVENTIONS
The industry has minimum standards for accommodation – which enabled some significant
preparedness in mitigating against the drought. There was no official communication
coming from STA to the tourism industry about the drought. However, the industry was very
proactive in establishing its own safeguards where possible, by purchasing tanks and
generators, and other drought mitigation equipment. The STA could consider playing an
advisory role to inform industry on eminent disaster or threats to the tourism industry in the
future. The challenge during the drought was getting accurate, timely, and consistent
information on its status/progress. Right now, inconsistencies from SWSC make it difficult
to determine if the situation on water shortages will deteriorate or improve. The advisory
role for STA needs strengthening because currently the organisation does not offer any
financial assistance to industry except for providing information in a timely, accurate, and
consistent manner to save the tourism industry a lot of money.
The challenges faced by the tourism industry led STA authorities to remark that the
Authority:
“Is focused on marketing the tourism industry but sort of forgot what it was marketing in
the first place. We neglected the product! We sell Swaziland as a cultural and scenic
beautiful country. Yet the drought affected the scenery aspect of Swaziland as a tourism
product. There has to be a lot of investment and commitment from STA on what the
product we are marketing really is and how we [STA] can protect it during disasters such
as drought. STA needs to look at the supply-chain and industry linkages to identify
sensitivities and produce a risk analysis for stakeholder performance for different disasters
to prioritise action plans.”
4.4.6. Urban Development When the drought hit Mbabane, disaster management structures had already been
developed and established within the Mbabane City Council in order to ensure resilience.
However, in reality, the 2015/16 drought challenged resilience. For the first time in the
history of the city, Mbabane residents felt exposed to drought - it attacked their dignity and
self-worth, and threatened business activity. Once the eminent threat of water being cut
down became a reality in Mbabane, businesses were very receptive and there was no blame
shifting. Instead, business took the issue to task to figure out what to do to remedy the
situation. Warnings to businesses about the threat of the drought went out in November
2015 - before the disaster management structures kicked in and the drought declared a
national disaster. Some of the key stakeholders involved by the city for disaster risk
reduction were the Police, MET, Big Business, Transport Association, etc. The city has an
internal risk reduction committee that has quarterly meetings: they have a disaster risk
reduction policy and operational plan and technical team of skilled people/experts in water
management issues. The Risk Advisory Committee technical team ensures adequate
implementation of plans.
67
IMPACTS
The municipality took a firm decision to stop watering city owned flora. The city could not
react accordingly to predictive mechanism for species replacements - schedule of species
replacement or rehabilitated under the annual operational plan was interrupted and
eventually frozen due to the drought. Recreational assets like the golf course suffered greatly.
Soil became very fragile/loose due to the drought and activity in the golf course had to be
restricted. Road infrastructure suffered damages due to water operations on modulating
pressure values across the city. Some walkways needed replacement (may not necessarily be
due to drought) but the city had to spend in the ballpark of E1 million in road repairs and
such during the drought. Other costs will only be determined once the drought has passed.
INTERVENTIONS
The CBD was priority for water supply and maintenance throughout the drought and this
became possible through Mbabane River, which has some adequate water flow in addition to
the SWSC Mbabane Water treatment plant. This is also an opportunity for the city to do a
comprehensive investigation of the sources for Mbabane River and its regenerative
capacities. The city isolated schools in the action plans and gave them special treatment
status because schools pose major health and sanitary risks. Zone leader meetings were held
to discuss mitigation strategies. The REO/Ministry of Education and Training (MOET) was
asked to close schools early during the worst of the drought. However, there was tension
initially between the city and the MOET stemming from coordination issues. The city also
provided water to schools. The Mbabane City Council adopted an inclusive approach in
alerting residents and businesses. Everyone was alerted on eminent drought. Huge strengths
were the coalitions that were formed especially with NDMA, which allowed the city to map
out all the schools that would need water tanks and tank filling services in the course of the
drought. The city conducted water quality tests through their internal laboratory unit, and
found that 30% of the water tested was safe for drinking.
Businesses and residents outside the CBD suffered the most from the 2015/16 drought. This
is because these businesses and residents did not have the luxury of the water treatment
plant. Moreover, residents suffered from restrictions of watering lawns, four-day general
SWSC restrictions, restrictions on public gatherings – church gatherings – Good Fridays,
revivals, etc. The CBD was the most prepared because of the water tanks, prioritisation from
SWSC, and the water treatment plant. With these mechanisms, the CBD was the least
affected by drought. In hindsight, the city was not sufficiently prepared for the drought:
“Drought phenomenon was always thought of as a rural phenomenon. It was inconceivable
that Mbabane could run out of water! Moving forward and working with NDMA, whether
you see a cloud or not, let us operate as if we are in drought.” When there is a looming
disaster, Met and NDMA play a leading role in forecasting and implementing early warning
programmes. The problem is that some people, businesses and organisations do not take
warnings seriously. A voice like NDMA becomes necessary back up to ensure that a majority
of the country takes the message seriously.
4.5. Early Warning System
The Early Warning System (EWS) in the country focuses on agriculture. While agriculture is
important on climate-induced disasters, a sector neutral EWS can be much more beneficial
to disaster preparedness and management in the country. There is a need for a general
platform that feeds properly to all parts of the economy. Met has a 3-month rolling format on
EWS. On the public domain, there is a 4-day rolling forecast. This means the closer to the
actual disaster event, the uncertainty gets smaller. Forecasting is much more accurate as the

68
actual disaster draws closer. This presents a challenge in the sense that forecasting for a
longer timeframe makes it harder for the public to interpret and use the data appropriately.
For the 2015/16 drought, indicators that the drought had started became visible by July 2015
and by September 2016, the country was experiencing a fully blown drought. Collaboration is
necessary for effective early warnings. Capacitating extension officers and other relevant
officers to disseminate information issued by Met to end-users such as farmers and
businesses could improve early actions. While the information issued by the Met should
empower farmers and smallholder producers to make informed decisions about the specific
situation of their location and type of farming, the final decision on whether to farm or not,
or when to start producing/farming rests with the farmer/producer.
4.6. Monetary Cost Estimation of the 2015/16 Drought on Swaziland’s
Economy
The foregoing discussion demonstrates that the drought negatively affected the country’s
main economic sectors. The impacts created a dip in economic activity and left a significant
dent on economic development in the period 2014 to 2016. A majority of livelihoods,
particularly rural households, depend on agriculture. The drought had a severe and crippling
effect on the economy because the economy’s backbone, agriculture, did not perform to a
normal and acceptable level (CBS, 2016). Maize, sugar, and cotton production all decreased,
and the drought eroded a substantial stock of cattle in the country. Since the economic
sectors did not perform well, revenue, including potential revenue, was lost. Crop, animal
production, and food manufacturing were the most affected by the drought. These sectors
account for more than 15% of total domestic revenue (CBS, 2016). Sugar exports account for
22% of export earnings and with a drop in sugar production, the country’s export earnings
shrunk, which in turn, had a negative effect on the country’s balance of payments.
On average, most of the cattle sold to the Swaziland Meat Industries were of low quality,
yielding low prices to domestic livestock producers in the country. Moreover, the EU and
Norwegian markets downgraded 33% of Swaziland beef exports into low quality beef (SMI,
2016: Pers. Comm.). A further decline in exports, as the full impacts of the drought on the
economy unfolds, will impose serious reductions in the country’s foreign currency earnings,
which will likely have a huge effect on the balance of payments account. The drop in maize
production exacerbated food insecurity in the country, particularly in the rural sector.
Overall, the impacts on households and across the different sectors of the economy exerted
pressure on government expenditure and revenue generation. In terms of government
expenditure, top priority went into the provision of drought relief and mitigation measures.
In the 2016/17 government budget, a supplementary budget of E105 million was allocated to
the drought. In addition, an extra E200 million was allocated for drought mitigation and
went into food and water distribution to most vulnerable communities, drilling of boreholes,
dredging of Hawane Reservoir, and provision of supplementary feed for livestock, and
importation of power from South Africa.
To estimate the monetary cost of the 2015/16 drought on the economy of Swaziland, the
study uses the immediate quantifiable impacts highlighted in each sector of the economy. As
already discussed, these effects are either due to losses in production revenues, damage to
property, and money used for intervention programmes. At the time of conducting the study,
the drought was still not over and some costs will manifest long after the timeframe of this
study. Therefore, a real cost of the drought (EI) can only be calculated once all the direct and
indirect impacts have manifested in the economy two or three years after the drought has
gone.

69
To attach a monetary value to the drought, the study uses a summation of the nominal costs
for all the direct and indirect costs as follows:
Economic Impact = direct costs + indirect costs ... 1
where direct costs represent the physical damages and indirect costs refers to the costs of
interventions. Cochrane (1997) and Rose (2004) extend the definition of direct costs to
include not only the physical damages but also the consequences such as business
interruption and unemployment. They redefine indirect costs as arising from interactions
and transactions between economic industries and sectors. Dore and Etkin (2000) explained
that the total burden imposed by the drought on the country should also include the indirect
costs, including the opportunity cost of resources allocated for relief and reconstruction.
However, for the purposes of this study and noting that data is not available on how the
drought may have affected or interrupted businesses, focus is on nominal costs of the
drought at the household level and on the economy. To calculate the monetary value of the
losses in household consumption due to the drought, the study used the methods discussed
in Section 2.4.
The first question is; how did the drought affect aggregate demand at the household level?
Table 4.6.1 below provides a summary and estimation of the 2015/16 nominal costs
according to the resources spent in immediate response to the drought at the household
level. The Table compares the sampled households in the four regions according to
geographical location. From the sampled households, urban and rural households in
Manzini spent a significant proportion of their budget on food each month (E889 and E883
respectively) compared to households in the other regions. Generally, rural households
spend a bulk of their incomes on food each month in decreasing order with Manzini
spending E883, Hhohho spending E875, Shiselweni spending E812, and Lubombo being the
lowest food spender at E639. On average, rural households in the Lubombo region are
relatively poorer than rural households in the other regions are and consume, on average,
30% less food than their counterparts in rural Manzini and Hhohho. Table 4.6.2 below
calculates the actual losses in food consumption in each region according to geographical
location of each household based on the percentage of households that reported reduction in
their food budget by 75%, 50%, and 25% during the drought.
The calculations reveal that rural households in the Hhohho region experienced a higher
proportion of households that saw a reduction in food consumption of 75%, which amounted
to E4,000,464 and constituted about 15% of the total food consumption losses in all the
regions each month (E26,576,985) (see Table 4.6.2). As well, rural households showed a
bigger reduction in food consumption during the drought than urban households. The
highest losses were seen in rural households in Manzini, which have an estimated loss of
E9,048,220, followed by rural households in the Hhohho region at E8,291,561, rural
Lubombo at E5,349,248 and rural Shiselweni reporting E3,887,954 food consumption loss
per month during the drought (see Table 4.6.2). For urban households, the biggest drop in
food expenditure budget occurred in Manzini, which reported a 27%
(E2,405,669/E9,048,220) drop in total food consumption. In the Lubombo region, urban
households accounted for 19% of the monthly food consumption losses while urban
households in the Hhohho and Shiselweni regions accounted for 11% and 1.7% of food
consumption losses, respectively (see Table 4.6.2).
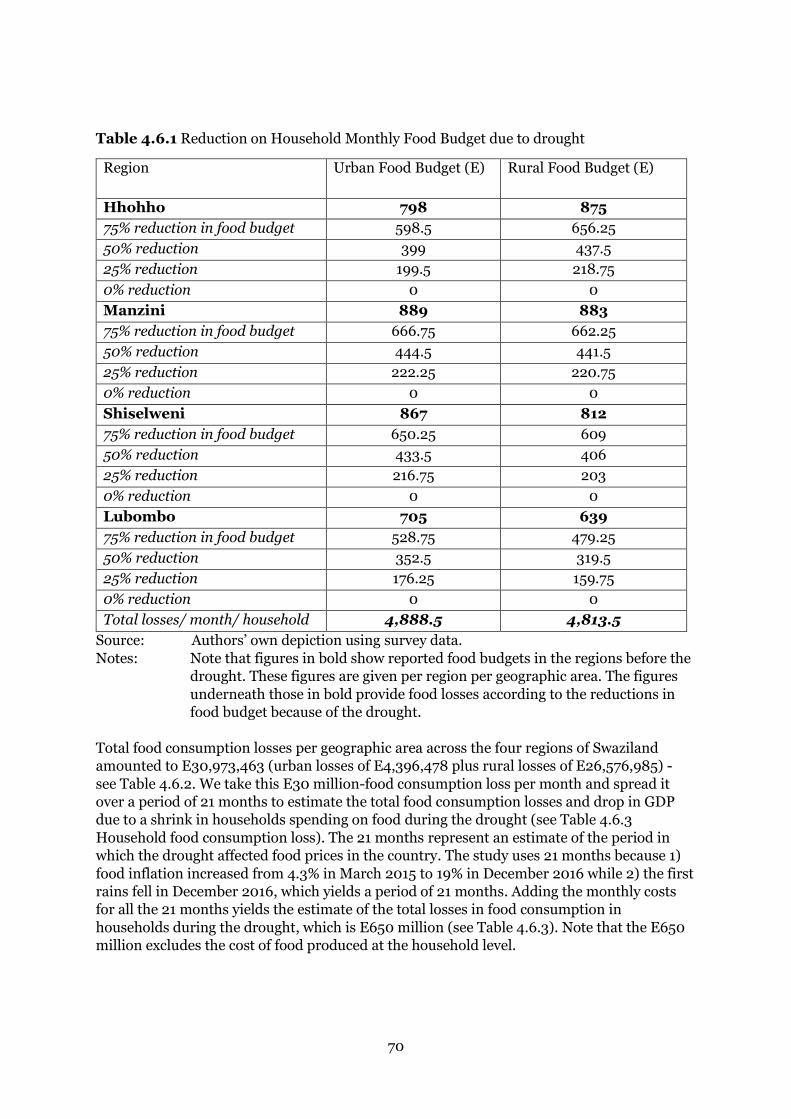
70
Table 4.6.1 Reduction on Household Monthly Food Budget due to drought
Region Urban Food Budget (E) Rural Food Budget (E)
Hhohho 798 875
75% reduction in food budget 598.5 656.25
50% reduction 399 437.5
25% reduction 199.5 218.75
0% reduction 0 0
Manzini 889 883
75% reduction in food budget 666.75 662.25
50% reduction 444.5 441.5
25% reduction 222.25 220.75
0% reduction 0 0
Shiselweni 867 812
75% reduction in food budget 650.25 609
50% reduction 433.5 406
25% reduction 216.75 203
0% reduction 0 0
Lubombo 705 639
75% reduction in food budget 528.75 479.25
50% reduction 352.5 319.5
25% reduction 176.25 159.75
0% reduction 0 0
Total losses/ month/ household 4,888.5 4,813.5
Source: Authors’ own depiction using survey data.
Notes: Note that figures in bold show reported food budgets in the regions before the
drought. These figures are given per region per geographic area. The figures
underneath those in bold provide food losses according to the reductions in
food budget because of the drought.
Total food consumption losses per geographic area across the four regions of Swaziland
amounted to E30,973,463 (urban losses of E4,396,478 plus rural losses of E26,576,985) -
see Table 4.6.2. We take this E30 million-food consumption loss per month and spread it
over a period of 21 months to estimate the total food consumption losses and drop in GDP
due to a shrink in households spending on food during the drought (see Table 4.6.3
Household food consumption loss). The 21 months represent an estimate of the period in
which the drought affected food prices in the country. The study uses 21 months because 1)
food inflation increased from 4.3% in March 2015 to 19% in December 2016 while 2) the first
rains fell in December 2016, which yields a period of 21 months. Adding the monthly costs
for all the 21 months yields the estimate of the total losses in food consumption in
households during the drought, which is E650 million (see Table 4.6.3). Note that the E650
million excludes the cost of food produced at the household level.

71
Table 4.6.2 Monthly Household Food Consumption Losses due to 2015/16 Drought
Urban Consumption Loss Rural Consumption Loss Total Consumption Loss
Hhohho
75% reduction in food budget 233,873 4 000,464 4 234,337
50% reduction 467,746 2 564,400 3 032,146
25% reduction 218,281 1 726,696 1 944,977
0% reduction - - - 919,901 8 291,561 9 211,462
Manzini
75% reduction in food budget 1 167,457 2 951,652 4 119,109
50% reduction 778,304 3 794,981 4 573,286
25% reduction 459,907 2 301,586 2 761,493
0% reduction - - - 2 405,669 9 048,220 11 453,890
Shiselweni
75% reduction in food budget 67,136 1 446,193 1 513,330
50% reduction - 1 341,396 1 341,396
25% reduction - 1 100,364 1 100,364
0% reduction - - - 67,136 3 887,954 3 955,091
Lubombo
75% reduction in food budget 80,301 873,346 953,648
50% reduction 535,344 3 056,713 3 592,057
25% reduction 388,124 1 419,188 1 807,312
0% reduction - - - E 1 003,770 E 5 349,248 E 6 353,018
Grand Total Loss E 4 396,478 E 26 576,985 E 30 973,463
Source: Authors’ own calculation using survey data Notes: The Table shows estimated consumption losses in (E) due to the drought as per the different scales. It also provides total
estimated consumption losses per geographic area per month, in each region and for all the regions.
72
Table 4.6.3 also presents estimates of the nominal costs of the drought to government and to
the economy. First, government allocated a total of E350 million in drought response and
mitigation. The money went into drought response and mitigation programmes covering
health and nutrition, education, WASH, agriculture and food security, security and
protection and coordination, as shown on Table 4.6.3. Second, the agriculture sector suffered
huge production losses in the 2015/16 drought. Cotton production dropped by a whopping
90%, losing an estimated E4 million of potential financial capital for farmers in Lubombo
and Shiselweni just on cotton farming. The sugar industry reported that during the 2015/16
season it expected a 10% drop in yields, which would result in E120 million in financial
losses without including revenue losses in export markets. The country lost an estimated
E702 million worth of livestock due to the death of cattle and low prices farmers fetched
from the sale of low quality beef, including losses in the EU and Norwegian markets for
downgraded low quality beef. Maize production dropped by 67% in the 2015/16 growing
season. NMC had to import 33,446 tonnes of maize to supply the domestic market and
increased the price of a tonne of maize by E2,332. In total, the decline in production and
importation of maize is estimated at E467 million. The amount does not consider the cost of
increased prices due to food and overall headline inflation.
Third, in the energy sector, the government together with SEC had to import E237 million
worth of electricity from South Africa because of zero hydropower generation in Swaziland.
Although the country imports a substantial portion of its energy needs, in the calculations,
the study includes the total costs for electricity to capture the short-term effects of SEC’s
decision to suspend core capital projects to deliver energy in households and businesses.
Finally, the SWSC had to construct an emergency water treatment plant in Mbabane at an
estimated cost of E10 million to supply the CBD as well as extract water directly from
Luphohlo Dam through a pipeline to Mbabane at a cost of E110 million.
In total nominal monetary terms7, the study estimates that the 2015/16 drought cost
Swaziland E3.843 billion, as shown on Table 4.6.3. This is equivalent to 7.01% (E3.843
billion/E54.828 billion) of Swaziland’s GDP in 2016 or 18.58% (3.843 billion/E20.678
billion) of government expenditure in 2015/16. This figure is on the conservative side. First,
the study could not get information from the Swaziland Dairy Board for milk production
losses, National Marketing Board (NAMBoard) for vegetable production losses, banana
estates for production losses, and citrus fruit producers. The forestry sector also suffered
greatly, with some parts experiencing wildfires that destroyed many hectares of forests that
amounted to many millions of Emalangeni. As well, the study did not assess losses to
fisheries and fish stocks, especially from the total dry up of Hawane Reservoir and the
reduction in water levels in many rivers and dams in the country. Other environmental
losses in terms of flora and fauna could not be ascertained because of lack of data on stocks,
lack of estimation on the monetary value of these wildlife stocks, and because the total
monetary value/cost were not visible at the time of conducting the study and will manifest
well beyond the timeframe of this study.
The E3.843 billion only accounts for the immediate short-term cost of the drought and omits
the long-term benefits that could have accrued to farmers and to Swaziland due to the
biological assets destroyed by the drought. It also does not account for the wildlife lost,
including the costs of biodiversity shrinkages, and its long-term effect on the general state of
the country’s ecological infrastructure. Likewise, the study does not quantify the opportunity
cost of the money diverted to drought interventions. It does not factor in the impacts of
water shortages and poor water quality during the drought given lack of reliable data to
7 2016 currency (Emalangeni) values.

73
quantify such. For example, during the drought, the mud residue accumulated in water
appliances, such as geysers, could, in the long-term, be an added cost to households because
the sludge will shorten the lifespan of household and industrial equipment. The calculation is
by far an underestimation of the impacts of the drought in Swaziland because the country
lost a lot more. To be clear, some impacts of the drought are still to manifest.
Notwithstanding the tangible benefits that may have accrued to the country due to the
drought, such as improvement in the stock knowledge on water-saving techniques both at
the household and national level, adding these would still not account for the losses incurred
from the agricultural sector. For example, some of the biggest losses relate to the fact that the
drought has wiped-off household savings, which would have long-term consequences at the
household level from a human capital development point of view. In the sugar sector,
replanting of rhizomes had to be suspended, would have a huge effect on yield in years to
come. This speaks to some of the challenges that will linger in the economy for many years to
come.
An emerging theme from the preceding discussions is that drought-like conditions are
becoming increasingly common in Swaziland, which begs the question: how adequate is the
country’s disaster management policy? The next section attempts to answer this question.
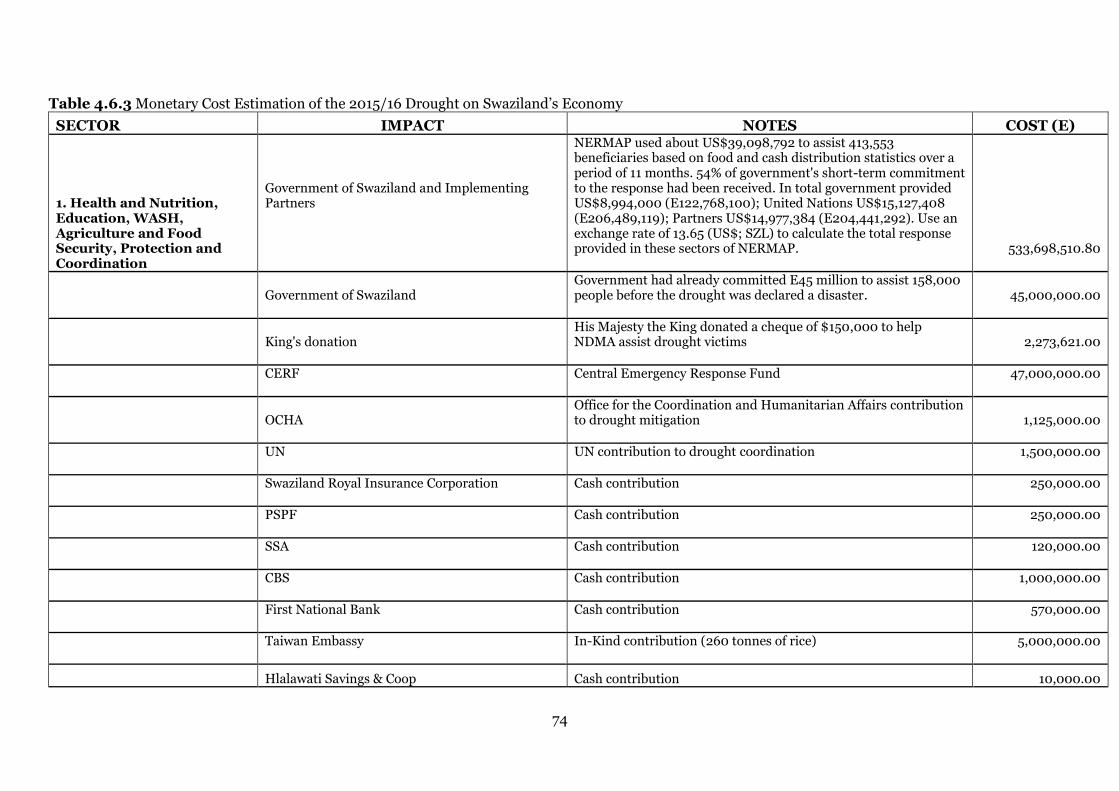
74
Table 4.6.3 Monetary Cost Estimation of the 2015/16 Drought on Swaziland’s Economy
SECTOR IMPACT NOTES COST (E)
1. Health and Nutrition, Education, WASH, Agriculture and Food Security, Protection and Coordination
Government of Swaziland and Implementing Partners
NERMAP used about US$39,098,792 to assist 413,553 beneficiaries based on food and cash distribution statistics over a period of 11 months. 54% of government's short-term commitment to the response had been received. In total government provided US$8,994,000 (E122,768,100); United Nations US$15,127,408 (E206,489,119); Partners US$14,977,384 (E204,441,292). Use an exchange rate of 13.65 (US$; SZL) to calculate the total response provided in these sectors of NERMAP.
533,698,510.80
Government of Swaziland
Government had already committed E45 million to assist 158,000 people before the drought was declared a disaster.
45,000,000.00
King's donation
His Majesty the King donated a cheque of $150,000 to help NDMA assist drought victims
2,273,621.00
CERF
Central Emergency Response Fund
47,000,000.00
OCHA
Office for the Coordination and Humanitarian Affairs contribution to drought mitigation
1,125,000.00
UN
UN contribution to drought coordination
1,500,000.00
Swaziland Royal Insurance Corporation
Cash contribution
250,000.00
PSPF
Cash contribution
250,000.00
SSA
Cash contribution
120,000.00
CBS
Cash contribution
1,000,000.00
First National Bank
Cash contribution
570,000.00
Taiwan Embassy
In-Kind contribution (260 tonnes of rice)
5,000,000.00
Hlalawati Savings & Coop Cash contribution 10,000.00

75
Motor Vehicle Accident Fund (MVA)
Cash contribution
300,000.00
Swaziland Conference of Churches
Cash contribution
111,551.91
2. Cotton Sector Cotton production in Swaziland is 100% reliant on rainfall water. Production dropped by 90% from 873 tonnes in 2015 to 100 tonnes in 2016.
In 2013/14 E9 million was paid to farmers for 1,600 metric tonnes of harvested cotton and E600,000 for 10 truck owners collecting the cotton. In 2014/15, E4.4 million was paid to farmers for 873 tonnes of cotton at an average price of E5.15/kg. Using 2015 prices the loss is 773 tonnes*E5.15*773,000kg cotton.
3,980,950.00
3. Sugar Production
Total sugar sales are projected to decline by 22 percent in 2016/17 marketing season after recording a record high of 700,017 metric tonnes in 2015/16. For the 2016/17 season, sales from SACU are expected to drop by 5% whilst export sales outside the SACU market are expected to drop by 45%. The industry also reported a financial loss of E120 million for the 2016/17 financial year.
Sugar sales improved in 2015/16 due to increased production and carried over inventories from 2014/15. The value of export receipts outside SACU in 2015/16 were valued at E1.456 billion. The value of SACU sales was E2.573 in 2015/16. Total loss directly linked to the drought equals E120million + 0.05*2.5736billion +0.45*1.456
903,850,000.00
4. Beef Production
88,000 cattle died due to the drought. Calve births decreased by 6% in 2016 for a total loss of 26,000 calves. Cattle slaughters increased by 62.4% in 2015 as farmers disposed their cattle due to the drought. Most affected areas sold cattle at E1,500 and not more than E4,000.
Assume the value of each cow that died at E5,000. Assume E7,000 for the price of a calve that was not born due to the drought. For the 33,000 slaughters during the 2015/16 period, assume the depreciated value on each cow of E2,250 (median of E1,500 and E4,000). A total of 33% of beef exports to Norway was downgraded to low quality beef. The value of beef exports to EU market to EU was E83,634,000 in 2015 with an average price of E74,275 per tonne. The Norwegian market has a 500 metric tonne quota. We can assume a 50% drop in price for downgraded beef.
702,377,687.50

76
5. Maize Production
101,000 to 33,460 tonne drop in production in the 2015/16 growing season. NMC increased price of white maize by 66% from E3,533 in 2015 to E5,865 in Jan 2016. NMC also had to import 30,446 tonnes of maize from South Africa, and in Jan 2016, the price of white maize was E4,935.
Assume E3,533/tonne for the 67,540 tonne decline in production. The increase in price of maize by NMC is equivalent to E2,332 for the 33,460 tonnes produced. For the imports on white maize, assume E4,935/tonne for 30,446 tonnes.
466 ,898,550.00
6. Water Supply
Weir Water treatment plant constructed in Mbabane to provided water to the CBD. The SWSC also began constructing a pipeline to supply water directly to Mbabane from Luphohlo dam.
The water treatment plant cost E10 million and the pipeline cost SWSC E110 million at the time of the interviews.
120,000,000.00
7. Electricity Generation
The drop in water levels at Luphohlo and Maguga dam forced SEC to stop generating power locally and import all electricity from South Africa from October 2016.
SEC had to get an E80 million subvention from the government to meet costs of imports with SEC topping up the rest meet the total cost of E237 million over a period of 3 months.
237,000,000.00
8. Household Food
Consumption
The drought affected mostly food production leading to an increase in food inflation in the country. We estimate that on average each month, household spending on food dropped by E30,973,463.73.
Spread the reduction in food consumption over a period of 21 months (April 2015 to December 2016).
650,442,739.63
TOTAL 2015/16 ECONOMIC COST OF THE DROUGHT 3,842,758,610.84

77
DISASTER MANAGEMENT POLICY IN
SWAZILAND: A REVIEW
5.1. Policy Objectives
rior to the establishment of the National Disaster Management Agency in 2008, the
National Disaster Task Force dealt with disaster on an ad hoc and reactive basis
focusing on disaster relief and response during the actual disaster event. The Disaster
Management Act of 2006, enacted by the King through Parliament, bridged the gap
by providing a framework for approaching disaster management in a manner that integrates
and co-ordinates disaster management programmes holistically. Accordingly, with the
installation of the NDMA in 2008, the government enacted the Disaster Risk Management
Policy 2010 to align disaster management in the country to focus more on prevention and
minimising exposure to disaster. The agency’s goal on disaster management in Swaziland is
to prevent and minimise the impact of disasters on vulnerable communities and groups,
develop response systems and standards, and issue timely alerts on any disaster and help
protect the country’s critical infrastructure.
The drought demonstrated that Swaziland has a powerful instrument and turnaround
approach to disaster management from ad hoc relief and reactive response to preventative
measures and reducing loss and damage on all aspects of livelihoods in the country.
However, a question that requires an answer is: if the country has powerful tools for
disaster management, what is lacking that caused suffering and economic losses from the
drought? The short and straightforward answer is that the essence of the 2010 Disaster
Management Policy is to make disaster management an integral part of the development
process in the country. The policy must focus on eliminating or reducing the inherent or
systemic risks to drought to reduce impacts on human livelihoods, and damage and loss of
property. Furthermore, the policy needs to advocate for a shared sense of awareness in the
country that is cognisant of the fact that drought is no longer a rare occurrence, and so
institutional and household responsibilities need moulding to reduce endemic risks
throughout the country. The fact that the country has already shifted disaster management
to focus on prevention is commendable, but whether or not the institutional structures are
well established and ready to eliminate or reduce risks from natural disasters is a matter of
implementation of the policy.
5.2. Instruments for Drought Disaster Management
The Government of Swaziland through the NDMA uses the DRM Policy to guide all disaster
management programmes in the country. The policy aligns well with the National
Development Strategy (1997, 2014), a guide toward Vision 2022 and national development
instruments with respect to making the country disaster proof. It offers integrated sector
plans and frameworks, development planning, programming and projects toward
eliminating adverse impacts of disaster in Swaziland. Indeed, in working towards attaining a
disaster proof country, the GoS makes clear commitment and priority to protect its citizens
and national assets by reducing the risk of losses from disaster. This involves saving lives,
livelihoods, and property by being proactive in the anticipation of disaster threats and
erecting all the necessary structures and plans of action to reduce the risk of impact before
the events occur. Furthermore, the policy recognises the unique socio-economic challenges
the country is facing in terms of extensive poverty and the high HIV pandemic that is
threatening livelihood security. It is cognisant of the fact that without addressing the
P

78
systemic challenges of debilitating poverty, food insecurity, and poor participation in
productive economic activities by rural households, disaster management will be an
ineffective endeavour.
To create a favourable socioeconomic environment that can effectively reduce or shield
households from disasters, the country needs to address and eradicate the synergistic effects
of poverty, HIV, and food insecurity, among other issues facing Swaziland. The disaster
management policy follows the SENDAI Framework (2015 – 2030) on disaster management
by tackling the underlying disaster risk drivers such as the consequences of poverty and
climate change, including the specific socioeconomic conditions that predispose households
and their communities to the worst of disaster impacts. The assessment of the impacts of the
2014 – 2016 drought shows that it exacerbated the already glaring impacts of poverty and
further deepened food insecurity at the household level on top of wiping out household
assets and savings. The drought decapitated household livelihoods, especially in rural
Swaziland where the socioeconomic conditions were already fragile and deeply vulnerable to
the additional risks created by the drought.
Even with the country’s solid DRM Policy, this study finds that Swaziland is struggling to
become drought proof. This is because, despite the experience and knowledge in drought -
the country has garnered through comparable droughts in 2009/10, 2007, 2001, and 1992 -
the country’s economic backbone rests on agriculture. Droughts attack and compromise the
natural environment, which in turn limits the productive capacity of the economy to reap
benefits from agro-industries. Therefore, on paper, the policy is solid and enshrined to the
developmental process of the country; however, practical implementation needs serious
firming up. To illustrate, Section 6.4 of the DRM Policy (2010) talks to the practical
application of the policy to reduce the underlying risk and vulnerability factors at all
institutional levels in the country. Specifically, Section 6.4.2 addresses the agriculture issue
by seeking to promote “food security, protection of public facilities, safety nets, and
partnerships in social and economic development practices.” Yet the food production system
in Swaziland is still highly dependent on rainfall. As well, many households in the rural
sector are no longer involved in food production – this study finds that the level of
involvement in food production in rural Swaziland stands at 21.9% at national level, making
the country too dependent on the international, essentially South African, market for its food
needs. Communities in Swaziland still need to organise local resources to scale up food
production and increase production under irrigation even at the household level.
The problem is not with the policy per se but an element of time and investment in the
programmes stipulated in the policy. Consistently, when droughts hit Swaziland, household
savings and traditional safety nets suffer as was evidenced by the loss of 88,000 cattle, and
67% drop in staple food (maize) production in the country. Strategies for drought-proofing
Swaziland should focus on rehabilitating and strengthening the food production system and
the general agriculture sector so that is not too dependent on direct rainfall. In addition, a
sense of shared responsibility between the government and households should be
encouraged as a foundation for establishing mechanisms that will eliminate adverse
exposure to drought impacts. In this sense, the government should continue playing a
leading role in the provision of water harvesting and storage to allow continuous production
in the agriculture sector even in times of drought. Households can work with government to
ensure that water and agriculture production infrastructure in the country allows for
irrigation of smallholder farms and diversification of crops that can ensure enough food and
fibre is produced at all times.

79
Various policy instruments and institutions support the agriculture industry in Swaziland.
Table 5.2.1 below provides a list of the institutional mechanisms that exist to strengthen and
grow the agriculture sector in Swaziland. Key players provide services such as finance,
marketing, extension, training, research, information, and humanitarian assistance. The GoS
has developed national policies and strategies under the guide of the PRSAP to eliminate
poverty and improve food security in the country. The agriculture sector is seen as a vehicle
that ensures food security in the whole country, as well as at the household level (MOA,
2016). The 2005 Comprehensive Agriculture Sector Policy (CASP) has a target of reducing
poverty by 50% by 2022 through promoting sustainable agricultural development, economic
growth, poverty alleviation, food security, and sustainable natural resource management.
The intentions of agricultural policies and strategies in the country are geared towards
rehabilitating and strengthening the food production system in Swaziland. For instance, the
MEPD through the PRSAP supports the CASP by committing to accelerate equitable
agricultural production in the country, including land security and management of the
environment. Furthermore, the MEPD recognises the potential of the agriculture sector
towards stimulating economy growth and therefore seeks to increase its contribution to
GDP.
Table 5.2.1 A Survey of the Institutional Capacity to Support Agriculture in Swaziland
ECONOMIC INSTRUMENTS ROLE 1. Ministry of Agriculture Policy legislation in the agriculture sector as
well as ensure national food security. Responsibilities of the Ministry are quite extensive and they include veterinary and livestock services, fisheries development, land use planning and development, as well as agricultural research and specialist services.
2. National Agricultural Marketing Board (NAMBOARD)
Serves an important role in marketing agricultural products and issues import and export permits for food security instruments in the country.
3. National Maize Corporation (NMC) Another important role specifically targeting the marketing and storage of maize to guarantee availability of staple food at reasonable prices throughout the year. The corporation also guarantees a market for local farmers so that they can sell all their maize produce each growing season.
4. Swaziland Dairy Board Mandate is to regulate the dairy industry to ensure that sufficient dairy products are products for food security and income generating purposes.
5. Swaziland Cotton Board Though cotton is not edible, supporting this industry ensures that farmers in the Lubombo and Shiselweni region have means for sustaining their livelihoods especially in areas where maize production does not do so well.
6. SWADE As discussed above the parastatal under the Ministry of Agriculture empowers communities and smallholder farmers on
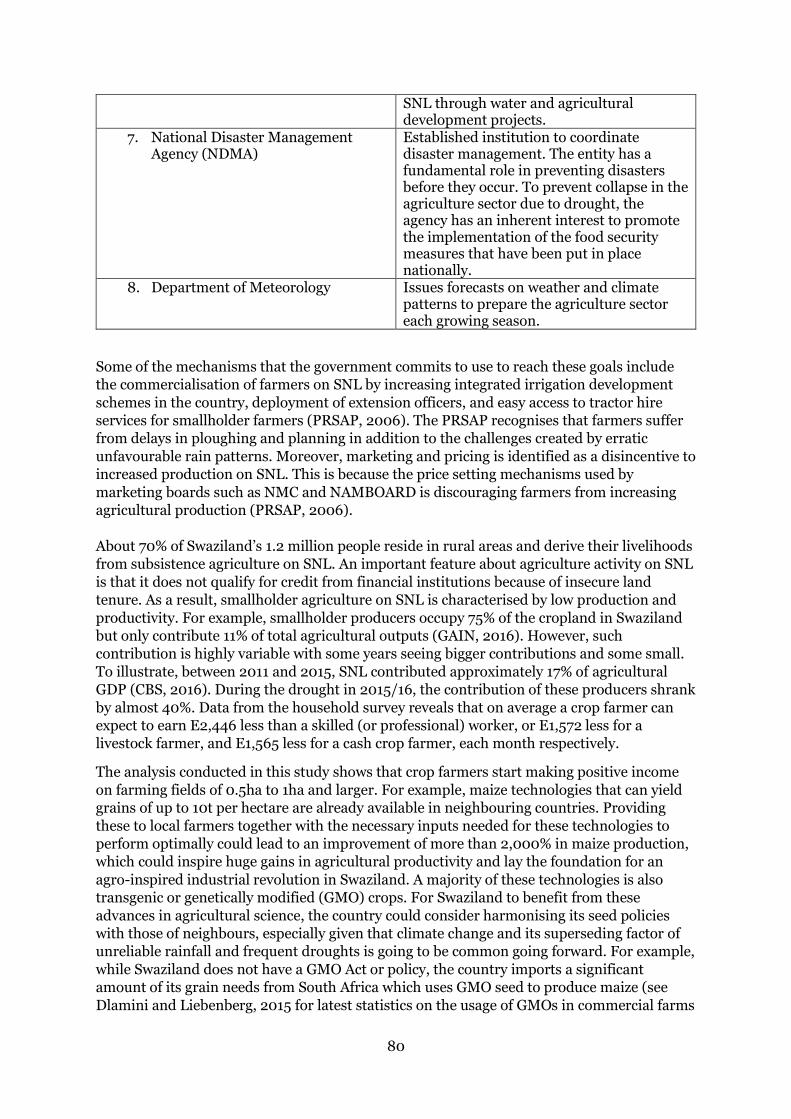
80
SNL through water and agricultural development projects.
7. National Disaster Management Agency (NDMA)
Established institution to coordinate disaster management. The entity has a fundamental role in preventing disasters before they occur. To prevent collapse in the agriculture sector due to drought, the agency has an inherent interest to promote the implementation of the food security measures that have been put in place nationally.
8. Department of Meteorology Issues forecasts on weather and climate patterns to prepare the agriculture sector each growing season.
Some of the mechanisms that the government commits to use to reach these goals include
the commercialisation of farmers on SNL by increasing integrated irrigation development
schemes in the country, deployment of extension officers, and easy access to tractor hire
services for smallholder farmers (PRSAP, 2006). The PRSAP recognises that farmers suffer
from delays in ploughing and planning in addition to the challenges created by erratic
unfavourable rain patterns. Moreover, marketing and pricing is identified as a disincentive to
increased production on SNL. This is because the price setting mechanisms used by
marketing boards such as NMC and NAMBOARD is discouraging farmers from increasing
agricultural production (PRSAP, 2006).
About 70% of Swaziland’s 1.2 million people reside in rural areas and derive their livelihoods
from subsistence agriculture on SNL. An important feature about agriculture activity on SNL
is that it does not qualify for credit from financial institutions because of insecure land
tenure. As a result, smallholder agriculture on SNL is characterised by low production and
productivity. For example, smallholder producers occupy 75% of the cropland in Swaziland
but only contribute 11% of total agricultural outputs (GAIN, 2016). However, such
contribution is highly variable with some years seeing bigger contributions and some small.
To illustrate, between 2011 and 2015, SNL contributed approximately 17% of agricultural
GDP (CBS, 2016). During the drought in 2015/16, the contribution of these producers shrank
by almost 40%. Data from the household survey reveals that on average a crop farmer can
expect to earn E2,446 less than a skilled (or professional) worker, or E1,572 less for a
livestock farmer, and E1,565 less for a cash crop farmer, each month respectively.
The analysis conducted in this study shows that crop farmers start making positive income
on farming fields of 0.5ha to 1ha and larger. For example, maize technologies that can yield
grains of up to 10t per hectare are already available in neighbouring countries. Providing
these to local farmers together with the necessary inputs needed for these technologies to
perform optimally could lead to an improvement of more than 2,000% in maize production,
which could inspire huge gains in agricultural productivity and lay the foundation for an
agro-inspired industrial revolution in Swaziland. A majority of these technologies is also
transgenic or genetically modified (GMO) crops. For Swaziland to benefit from these
advances in agricultural science, the country could consider harmonising its seed policies
with those of neighbours, especially given that climate change and its superseding factor of
unreliable rainfall and frequent droughts is going to be common going forward. For example,
while Swaziland does not have a GMO Act or policy, the country imports a significant
amount of its grain needs from South Africa which uses GMO seed to produce maize (see
Dlamini and Liebenberg, 2015 for latest statistics on the usage of GMOs in commercial farms

81
in South Africa). Similarly, harmonising seed laws could give the country access to
technologies such as the Agricultural Research Council released, Bill and Melinda Gates
Foundation funded, Tego Variety (WE1101), which is drought-resistant.
For livestock farming, there is huge potential for income generation should investment into
maize production, sunflower, and soybeans be firmed up. For example, high feed costs in
pork, beef, and poultry production reduce farmer profits. As a result, a pork farmer makes
E42 per month compared to E21 per month made by a beef farmer or E16 per month made
by goat farmers and E11 per month made by poultry farmers. Even though production and
productivity may be low on SNL, the household survey data shows that with targeted
investments supporting rural farmers, significant improvements can be made by the
agriculture sector. For example, as part of implementing the PRSAP, the Swaziland Water
and Agricultural Development Enterprise (SWADE) has helped improve the livelihoods of a
large group of farmers in Siphofaneni by assisting them establish and operate irrigated farms
that cover 6,000ha. Opportunities exist for the government to replicate the successes already
gleaned in Siphofaneni. Regions such as Shiselweni could do with the kind of assistance
given to Siphofaneni to improve agricultural production given that households in this region
demonstrate a higher affinity for agricultural production than elsewhere in the country.
With this background on the state of food production in the country, the NDMA should
continue implementing disaster management programmes under the guidance of the DRM
Policy already in place. Further, the policy is supported and implementable through the
National Emergency Response, Mitigation, and Adaptation Plan (NERMAP) from 2016 –
2022, a document that provides an action plan for responding to the 2015/16 drought
addressing both short-term and long-term needs. NERMAP is a multi-sector approach
action plan where each sector of the economy has a specific role to play in addressing
drought impacts now and in the coming future. Generally, people in Swaziland have access to
information about drought, and the Meteorology Department released numerous warnings
about the looming drought disaster. The onus is on people and their communities to absorb
the information and take smart decisions to prevent droughts from becoming a disaster that
threatens their livelihoods. The government has a role to play in building this capacity. The
country requires resources to ensure that the implementation of the DRM policy
programmes goes as planned to ensure that the country is drought proof. This is not only
government or NDMA’s responsibility, but also rather a multi-sectorial and multi-
stakeholder responsibility.
The only glaring gap in disaster management stipulated by the national policy and NERMAP
is the provision of a sustainable funding mechanism that will ensure that the country
implements - as planned and without financial challenges – all identified institutional
structures and programmes under each sector of the economy and household livelihoods.
Even though the GoS dedicated a significant budget (E350 million) to address the impact of
the drought, a lot more money is still required to address issues of agriculture and food
security, education, urban water and sanitation, rural water and sanitation, health and
nutrition, social protection, environment and energy, storm damages, and coordination. The
total budget needed to address effectively the impact of drought well in the long-term is close
to E1 billion. The core responsibility of the NDMA is to ensure the protection of every citizen
in the country, regardless of income band in the event of disaster. Hence, a sustainable
Disaster Management Budget is necessary as a fundamental aspect of protecting life and
property. Not only will it give the country the ability to cope in shock, it will provide the
necessary resources for shirking households from disaster.
Therefore, creating a practical and sustainable funding model for NDMA should become a
top priority for the country moving forward. In the 2015/16 drought, many of the households

82
that were able to come out unscathed from the serious impacts were those that had the
financial muscle to buy tanks, drill boreholes, etc., and continue to afford food despite the
increases in prices.
5.3. Implications of the 2015/16 Drought on NDS, SDGs and AU 2063 Agenda
The 2015/16 drought had a severe impact on agriculture. Agriculture is still the backbone for
inducing economic growth in Swaziland, especially since close to 70% of the country is rural,
and depends on subsistence agriculture for food and income. The implication is that a vast
majority of Swazis depend on agriculture for food security and poverty alleviation. However,
agricultural production in Swaziland is still predominantly reliant on rainfall. In addition,
agriculture insurance, as well as crop diversification beyond maize and sorghum is very
limited among subsistence smallholder producers in Swaziland. Therefore, when the drought
hit, it greatly affected the country’s two regions that are still struggling with endemic poverty,
Lubombo and Shiselweni. Producers in Lubombo are already discouraged from agriculture,
and so the drought put an additional damper in disheartening households to grow their own
food. Livestock, essentially cattle, died in serious numbers. Livestock is an important asset in
rural households, not only for social status but also for sustaining livelihoods and nutrition.
It is for this reason that the NDS emphasises investment in agriculture to incite growth,
particularly inclusive growth in rural Swaziland. Many households in rural Swaziland are
already engaged in agriculture through subsistence farming - a fundamental opportunity that
the NDS and the PRSAP is trying to leverage on. However, droughts discourage subsistence
producers who are the country’s potential commercial farmers from making further
investments into agriculture production. The 2015/16 drought destroyed the confidence that
agricultural producers have on agriculture - as a viable solution for poverty reduction in
Swaziland.
Consequently, the drought caused an impediment on the work the country has done to
increase participation and investments in agriculture. Food security and water independence
are an important component of the country’s developmental goals embedded in the NDS.
Through the drought, the country regressed in terms of the agriculture development
initiatives that were already set in motion in the Lubombo and Shiselweni region. Boosting
confidence in the food production system in Swaziland is important because agriculture can
absorb a sizeable portion of the rural population that is unemployed and food insecure in
productive economic activities. Furthermore, when households participate in the production
of their food, it reduces their exposure to food price shocks such as the inflation increases
that Swaziland experienced during the drought. While not all the food inflation is
attributable to the drought, efficient food production that is not very dependent on rainfall,
and driven by households in the rural sector, can shield the majority of the Swazi population
from falling into the cracks of food insecurity and extreme poverty.
Swaziland had to spend money and resources to intervene and prevent a humanitarian crisis
and total collapse of agriculture. A bulk of money and resources went into agriculture and
food security. Specifically, it included humanitarian food assistance to the vulnerable and
hungry population. On the other hand, the government dedicated funds towards domestic
water supply through tanks, boreholes, and the general rehabilitation and expansion of water
systems and water harvesting across the country. The energy sector also suffered immensely
with E80 million having to be immediately set aside to import electricity from South Africa,
because the water levels had fallen far below the minimum requirements for hydropower
generation in Swaziland.
The drought cost the country a lot concerning getting closer to attaining its developmental
goals, particularly Vision 2022. The drought situation came at the back of mounting cash

83
flow challenges for the government. By redirecting the E350 million into a supplementary
budget for drought mitigation and response, government’s planned activities were affected.
The curious question therefore is; how would government have used the E350 million?
Firstly, the government had to postpone the implementation of a salary review. Secondly,
even though it cannot be said that the government stopped its capital projects, activities of
the ongoing capital projects were deferred to a later date. Thirdly, the government would
have tried by all means to pay government suppliers, and as a result of that, it would have
lessened the pressure on the arrears transferred to the next financial year (Ministry of
Finance 2017: Pers. Comm.). Unfortunately, the drought pushed government further into a
crisis such that it could not adequately meet its financial commitments to its creditors.
In addition to the supplementary budget that financed the drought programmes,
Government had to request financial support from donors and development partners such as
the African Development Bank with its food assistance programme (Ministry of Finance,
2017: Pers. comm.). Therefore, the government and its development partners, business, and
households, diverted money and resources intended for development projects to address the
immediate and long-term impacts of the drought. That money and resources could have
gone into the economy to incite economic activity and hence growth and boom that people,
business, and government yearn for. While these monies played an important role in saving
lives and restoring dignity in households, that money has little spill-over effects on the
economy in igniting economic activity and wealth creation. Rather, such monies and
resources could have gone directly to implement the economic activities stipulated in the
NDS for wealth creation and inclusive growth in the country. In doing so, Swaziland would
have been able to work towards attaining the SDGs and complying with the 2063 African
Union Agenda. Empowering the NDMA to implement all the structures that need to be in
place to avoid huge losses in events of disaster should be the focus. So that by 2022, the
country will not have to divert money and abandon its developmental targets when disaster
strikes.
84
CONCLUSION AND
RECOMMENDATIONS
6.1. Conclusion
he purpose of this study was to quantify the socioeconomic impacts of the 2015/16
El Niño drought on the economy of Swaziland. It specifically analysed the impacts
of the droughts on households and on businesses, with a focus on (1) the extent to
which the 2015/16 drought has affected rural and urban households; (2) the
economic impacts of the drought across the different sectors of the economy of
Swaziland; (3) the kind of coping mechanisms employed by households in response to multi-
faceted ramifications of drought; (4) whether Swaziland’s drought and disaster management
policy allows for sufficient response to the multiple dimensions of drought; and 5) the kind
of measures necessary to shield rural households and industry from drought.
With respect to the extent to which the drought has affected rural and urban households, the
assessment found that the impact of the drought was severe especially on agriculture and
availability of food. The study found that because of high unemployment (50%) among
households and dependency of rural households on urban households for remittances, the
drought exacerbated the capacity of households to sustain their livelihoods. Employment
contributes a great deal in reducing vulnerability, poverty, as well as food insecurity.
Subsistence production suffered because of low yields and livestock died because of extreme
temperatures and lack of water. Agriculture production in Swaziland is heavily dependent on
rainfall. Moreover, the study finds that the involvement of households in agricultural
production is very low. As a result, households had to rely on food donations from the
Government, business, and development partners to ensure that they had something to eat
each day during the drought. What is worse is that the National Maize Corporation, whose
mandate is to ensure maize availability, had no option but to import from South Africa and
sell it locally. For some households that could still afford to buy food, prices soared from
4.3% in March 2015 to 19% in December 2016, further pushing more households into food
insecurity.
The study also found that the impacts of the drought affected women-headed households
more than men-headed households. Women had the most number of dependants and so
experienced more food shortages than men did. In terms of energy and time-spent finding
alternative sources of water, women also suffered the most, having to travel long distances to
collect water from rivers, to cook and for other household needs. Children were affected by
drinking poor quality (dirty) water, leading to diarrhoea and other stomach illnesses.
Furthermore, children were left unprotected in rural households as their parents and
guardians had to migrate to urban areas (which increased rural-urban migration) in search
of jobs to sustain their lives. Consequently, the RSPS reported an increase in the number of
rapes and attempted rapes in rural households. Besides the impacts on children, there was a
significant rise in key populations around the Mbabane and Manzini corridor. This suggests
that because of the lack of food induced by the drought, as well as the intrinsic and rampant
unemployment and poverty in rural and urban households in Swaziland, some people
resorted to sex work as a practical option to sustain their livelihoods.
In terms of the economic impacts of the drought across the sectors, the study found that the
greatest impacts occurred in the agriculture sector followed by the energy sector, and all
other sectors of the economy that are dependent on water, such as the environment. The
T
85
country experienced a deep decline in agricultural production due to the effects of the
drought on maize, sugar cane, citrus, and livestock production. As well, when the drought
hit, it compromised the country’s flora and fauna to great limits such that the rangelands
completely collapsed and Swaziland had to import grass from South Africa. The country had
to import millions of Emalangeni worth of electricity from South Africa, suggesting that
Swaziland is overly dependent on hydroelectricity, which is not sustainable during droughts.
The conclusion is that there is a strong need for the country to diversify its energy sources.
The 2015/16 drought made it clear that a hydro-based power sector cannot keep the country
lit in times of extreme drought.
Confounding the situation for Swaziland is that the drought came at a time the country was
still reigniting economic growth following persistent stagnation. Though the relief provided
to households was necessary and important, the country lost in terms of its developmental
targets. The funds the government and development partners had to divert into food
assistance and other humanitarian needs in the country could have further propelled
Swaziland closer to attaining Vision 2022 given that only five (5) years remain for the
country to make the necessary development changes to reach that goal. Overall, the study
finds that Swaziland has regressed in its goal to use agriculture as an engine for economic
growth and poverty reduction. Farmers and agricultural producers have lost confidence in
the benefits of investing in agriculture because of the huge losses incurred in the 2015/16
season.
Yet, in all the challenges caused by the 2015/16 drought, Swaziland has come out a better
country than it was before the 2015/16 drought. The country has garnered very important
lessons regarding the state of its water harvesting and storage infrastructure. The drought
has shown the ability of the country’s water harvesting and storage infrastructure, and the
ability of the country to respond to and manage severe disasters. The biggest lesson is that
the country needs to develop its water harvesting and storage infrastructure to make sure
that it can harvest and store enough water to see the country through any subsequent
droughts in the future. This is particularly the case given that climate change is real, and its
effects are already showing face in Swaziland. It is important that the country makes serious
investments in protecting all the developmental strides it has taken since the establishment
of the National Development Strategy in 1997 or even since independence, in 1968. Though
the drought was extreme and painful on many levels, it also presented an opportunity to take
the necessary measures to make the country resilient to climate-induced shocks and other
disasters that are frequent in Swaziland.
The country has spent a lot of time and resources formulating policies to direct development
in Swaziland. However, policy implementation has been Swaziland’s greatest weakness. To
illustrate, whereas the Disaster Risk Management Policy (2010) is robust and more than
capable of addressing the country’s vulnerability to disasters, there is clear lack of
commitment on the action plans and programmes laid out in the policy for 2016 – 2022 in
terms of financial commitments. Disaster Risk Management is yet to be included in the
country’s policies in spite of the fact that this should have been done by now. As a result, this
study estimates that the drought has cost the economy of Swaziland E3.843 billion in
monetary terms. This estimation is on the downside for so many reasons. In the rural sector,
the drought has wiped-off household savings in the form of livestock, hindered agricultural
production, and caused innumerable suffering to women, children, and people living with
disabilities that will take some time before they manifest on the economy. Livestock (cattle)
is important in human capital development (sending children to school) and in ensuring
equality of opportunities and outcomes. The drought deepened gender and income

86
inequality in Swaziland, causing women headed households to regress. These impacts are
long-term and the study did not attempt to quantify them. To avoid further losses in the
future, financial commitments should form a crucial component of disaster risk reduction
policy.
6.2. Recommendations
Given the findings, the study proposes the following set of recommendations:
Revise and integrate all aspects of disaster mitigation to all policies in Swaziland.
Encourage employment and income generating activities across the four regions
of Swaziland to enable the majority, if not all households, to earn their
livelihoods and restore dignity. Focus on increasing investments into income
generating activities, especially in agriculture, agro-processing, agri-information
communications technology (agri-ICT), and firming up the extension system.
Strengthen and expand the implementation of the Poverty Reduction Strategy
and Action Plan to other regions through supporting the development of income
generating activities among the poorest in Swaziland.
Develop plans to reduce urban poverty to deal with the myth that cities are only
for rich people.
Encourage business ownership/entrepreneurial activities among the youth in
lieu of formal office employment.
Deliberately target women in all agricultural and rural development programmes
especially in rural areas where women take care of children, people living with
disabilities, and the elderly.
Encourage commercialisation and value-addition in rural households.
Enable development of smallholder agriculture production by addressing issues
of land under-utilisation, inappropriate land use and management of rangelands.
Develop solid strategies for offloading the outputs of rural households in urban
markets, and revisit the country’s empowerment laws with a focus on pushing
local supermarkets to source agricultural produce from local producers.
Use the drought as an opportunity to learn and grow. The country could consider
taking stock of its resource-base and use it to make the appropriate adjustments
to make the best use of all available resources. Use lessons learnt from the
2015/16 drought as a springboard for further action, including revolutionalising
the food production system and fast tracking the commercialisation of
subsistence producers. Recovery should also be an important aspect of disaster
management to restore life to what it was before the drought.
Conduct a comprehensive investigation of the sources of water and their
regenerative capacities, particularly sources of water like the Mbabane River that
were able to sustain themselves throughout the drought.

87
Increase investment into a dam that will supply Mbabane with water. Such a dam
should have a water storage capacity that will enable supply for a minimum of
three years to Mbabane during a drought event. It is no longer sustainable to
supply water to a big and a growing city like Mbabane and Ezulwini using a
reservoir like Hawane. Mbabane and the rest of cities and towns in Swaziland
need sustainable water infrastructure that will efficiently harvest, store, and
distribute water in all climatic seasons. Urban and rural developers in the
country should consider exploring underground water extraction to supply water
to entire cities and towns especially in areas with abundant underground water
aquifers.
Increase water storage/harvesting between rivers and dams in Swaziland.
Re-visit existing water treaties on Transboundary Rivers and dams to encourage
water harvesting for storage purposes at the local level and to put the interests of
Swaziland first, especially in the wake of the 2015/16 drought.
Encourage water harvesting in cities and provide incentives for economic agents
who comply.
Enact legislation that encourages the creation or construction of disaster resilient
buildings.
Impose penalties on people who misuse water. Consider equipping the Water Act
of 2003 and other legal instruments that give rights to access to water resources
in the country with penalties. That at the helm of the drought some households
and businesses were using SWSC water to wash cars, and for irrigating
landscapes is an insignia that the current water policies leave it to the consumer
to police its usage.
Consider options for viable energy options/power plants that can make
Swaziland energy independent. It takes 5 – 10 years to set up cost–effective and
efficient power plants, so the time to act is now so that by 2025, when Eskom’s
contract to supply the country with electricity ends – Swaziland has the
necessary plans already set and in motion.
Form a consultative group on weather and climate forecasting at the national
level so that information on the probability of disasters is developed on time and
shared widely in the economy to reduce shocks in capital projects and operating
costs.
Emphasise and promote coordinated planning among all stakeholders in order to
enable a proactive disaster mitigation and response environment in all levels of
disaster management in the country.
Establish a consultative group on environmental (flora and fauna) management
during a drought with a focus on issues of protection, maintenance, disasters,
and state of emergencies.

88
Consider strengthening and expanding the minimum standards for
establishments operating in the tourism sector to address issues of disaster
preparedness and adaptation, especially since climate change is here to stay.
Upgrade the Meteorology Department in terms of human resources,
equipment/up-to-date software, and infra- and techno-structure. Institutional
capacity to deal with droughts, hailstorms, and floods is lacking. The
continuation of high frequency weather updates in all local media platforms,
especially on the Swaziland Broadcasting and Information Service (SBIS) are
important. In addition, system upgrades are required for a broader forecast to
strengthen developmental plans. The department needs specialised computer
infrastructure to perform this kind of work.
Develop policies that encourage the use of agricultural biotechnology and the
harmonisation of policies between Swaziland and neighbouring countries to
enable the country to have access to drought-tolerant germplasm developed
elsewhere in the region and beyond.
Capacitate Agricultural Marketing Boards on their role during state of
emergencies.
Revisit all instruments meant to regulate the importation of food with a focus on
making it clear as to what happens during national disasters like droughts,
floods, etc.
6.2.1. Further Research
It is important to conduct a study on the long-term impacts of the drought on the economy
to understand the multiple synergistic effects on the developmental aspirations of the
country. Primarily, a study that quantifies and qualifies how much of the economy and
household livelihoods in Swaziland are vulnerable to disaster shocks is necessary. This type
of study will give a clear picture to the nation on how much the country stands to lose when
disasters like droughts hit. It will help in the alignment of policies in the country to respond
appropriately to the most vulnerable sectors and households.
For the 2015/16 drought, only the short-term immediate impacts were analysed. It is also
imperative to study the long-term impact on farmer’s investments, loss of soil moisture and
decline in land productivity, low agriculture growth and low development of the country
because most of the impact of the drought will be experienced far beyond the current
2015/16 timeframe. Swaziland boasts of a very rich and vibrant tourism industry, and so it
might be worthwhile for the country to quantify and qualify the changes in the industry
linked to natural disasters. The proposed study needs to quantify and qualify the degradation
of natural ecosystems in the country due to climate-induced disasters.
The impacts of droughts are not even throughout the country and across households. It is
important to identify Swaziland’s vulnerability to frequent disasters like drought according
to the specific vulnerabilities that different groups in the population face. Droughts usually
have the greatest impact on certain groups like women, children, and people living with
disabilities. A special study that identifies the most vulnerable groups, their experiences of
disasters, and the needed responses is crucial.
89
Finally, there is a need to investigate alternative and sustainable funding models for the
NDMA as the guardian of national disaster management programmes in the country. A
viable and practical funding structure for disaster management will ensure that the country
protects life and property without losing progress on its developmental aspirations. In the
event of disaster, the country should already have savings in place to manage the impacts of
disasters instead of redirecting funds that would have been committed elsewhere.
90
REFERENCES
ALSTONE M. AND KENT J., (2004) Social impacts of drought. A report to NSW Agriculture.
Wagga Wagga, Australia: Centre for Rural Social Research, Charles Sturt University.
ANIL KUMAR ROY, INDIRA HIRWAY (2007) Policy Matter Multiple Impacts of Droughts and Assessment of Drought Policy in Major Drought Prone States in India - Published By: Planning Commission on eSS. The full report is available at http://planningcommission.nic.in/reports/sereport/ser/stdy_droght.pdf
BAADE, R. A., BAUMANN, R. & MATHESON, V. A. (2005) Predicting the Path to Recovery
from Hurricane Katrina through the Lens of Hurricane Andrew and the Rodney King
Riots. http://www.holycross.edu/departments/econo
mics/RePEc/Matheson_Katrina.pdf
BENSON C. AND CLAY E., (2003) Economic and financial impacts of natural disasters: An
assessment of their effects and options for mitigation. Synthesis Report. Overseas
Development Institute.
BOTTERILL, LINDA AND BRUCE CHAPMAN (2002) Developing Equitable and Affordable Government Responses to Drought in Australia. Paper presented to the Australasian Political Studies Association Conference, Canberra. 2-4 October.
DESAI, G.M., G. SINGH AND D.C. SAHA (1979) Impact of scarcity on farm economy and
significance of relief operations, CMA Monograph No. 84. Ahmedabad, IIM DING, YA; HAYES, MICHAEL J.; AND WIDHALM, MELISSA (2010) Measuring Economic
Impacts of Drought: A Review and Discussion. Papers in Natural Resources. Paper 196. http://digitalcommons.unl.edu/natrespapers/19
DORE M. AND ETKIN D., (2000) The importance of measuring the social costs of natural
disasters at a time of climate change. In: Australian Journal of Emergency
Management, p. 15(3): 46-51.
DPMO (Deputy Prime Minister’s Office). (2016) A drought assessment report: rapid assessment 2015/16 season. Mbabane. Swaziland. 55 pages.
DLAMINI, T.S. AND LIEBENBERG, F. (2015). The aggregate economic benefits of the
National Cultivar Trials for Maize in South Africa with specific reference to the Highveld region. Agrekon 54 (3): 43 - 61
FAO (2015) The impact of disasters on agriculture and food security, FAO, Rome:
http://www.fao.org/3/a-i5128e.pdf
GOVERNMENT OF SWAZILAND. (2010) Swaziland Household and Income Expenditure Survey (SHIES) 2009/10. Swaziland: Government of Swaziland.
GOVERNMENT OF SWAZILAND. (2014) A Development Strategy for Swaziland: Promoting
Sustainable Development and Inclusive Prosperity. Swaziland: Government of Swaziland.
HENNESSY, K., FAWCETT, R., KIRONOA, D., MPELASOKAA, F., JONES, D., BATHOLS, J.
ET AL. (2008) An assessment of the impact of climate change on the nature and frequency of exceptional climatic events.
91
IPCC (2007) Summary for Policymakers. In: Climate Change 2007: Impacts, Adaptation and
Vulnerability. Contribution of Working Group II to the Fourth Assessment Report of the Intergovernmental Panel on Climate Change, M.L. Parry, O.F. Canziani, J.P. Palutikof, P.J. van der Linden and C.E. Hanson, eds., Cambridge University Press, Cambridge, UK, 7-22.
LOGAR, I., VAN DEN BERGH, J.C.J.M. (2011) Methods for Assessment of the Costs of
Droughts. CONHAZ Report. The full report is available at: http://bit.ly/H6npTO. MANYATSI, M., THOMAS, T., S., MASARIRAMBI, M., T., HACHIGONTA, S. AND
SIBANDA, L., M. (2013) Swaziland. In Hachigonta, S., Nelson, G., C., Thomas, T., S. and Sibanda, L., M (eds). Southern African Agriculture and Climate Change: A Comprehensive Analysis. Washington: International Food Policy Research Institute.
MARKANDYA A., MYSIAK J. IN LÓPEZ-FRANCOS A. (COMP.), LÓPEZ-FRANCOS A.
(COLLAB.) (2010) Economics of drought and drought preparedness in a climate
change context Zaragoza: CIHEAM / FAO / ICARDA / GDAR / CEIGRAM / MARM
Options Méditerranéennes : Série A. Séminaires Méditerranéens; n. 95 pages 131-138
MASIH I., MASKEY S, MUSSÁ FEF, TRAMBAUER P. (2014) A review of droughts on the African continent: a geospatial and long-term perspective. Hydrol Earth Syst Sci 18:–3649. doi:10.5194/hess-3618-3635-2014
NATIONAL DISASTER MANAGEMENT AGENCY. 2015. National Emergency Response and
Mitigation Plan (NERMP). Mbabane. Swaziland. 55 Pages. PARDEY, P.G. AND B. CRAIG. (1989) Causal Relationships Between Public Sector
Agricultural Research Expenditures and Output. American Journal of Agricultural Economics, 71: 9-19.
ROSE A. AND LIM D., (2002) Business interruption losses from natural hazards:
Conceptual and methodological issues in the case of the Northridge earthquake. In:
Global Environmental Change Part B: Environmental Hazards, 4(1), p. 1.
SENDAI FRAMEWORK FOR DISASTER RISK REDUCTION 2015 - 2030:
http://www.preventionweb.net/files/43291_sendaiframeworkfordrren.pdf
TAYLOR, C.N., BRYAN, C.H. AND GOODRICH, C.G. (1995). Social Assessment: theory, process & techniques. Taylor Baines and Associates, Christchurch.
TICHAGWA, W. (1994) The effects of drought on the condition of women. Focus on Gender
2 (1): 20–25. United Nations Office of the Resident Coordinator. 2016. Country Emergency Situation Report No. 1. Available from http://reliefweb.int/sites/reliefweb.int/files/resources/Swaziland%20Drought_RC%20Situation%20Report_Feb%202016%20-RC%20Final%20%20.pdf (Accessed 7 Nov2016).
UNITED NATIONS OFFICE OF THE RESIDENT COORDINATOR. (2016) Country
Emergency Situation Report No. 1. Available from http://reliefweb.int/report/swaziland/swaziland-drought-office-resident-coordinator-situation-report-no-2-14-mar-2016. (Accessed 7 Nov 2016).
WILHITE, D.A. AND M.H. GLANTZ. 1(985) "Understanding the drought phenomenon: The
role of definitions." Water International 10: 111-120.
92
WILHITE, DONALD A.; SVOBODA, MARK D.; AND HAYES, MICHAEL J., "Understanding the Complex Impacts of Drought: A Key to Enhancing Drought Mitigation and Preparedness" (2007). Drought Mitigation Center Faculty Publications. Paper 43.
WOLRD BANK 2016. Swaziland: Reducing Poverty Through Shared Growth. Available
online: http://go.worldbank.org/NWN1F4HEY0a (accessed 8 Nov 2016).
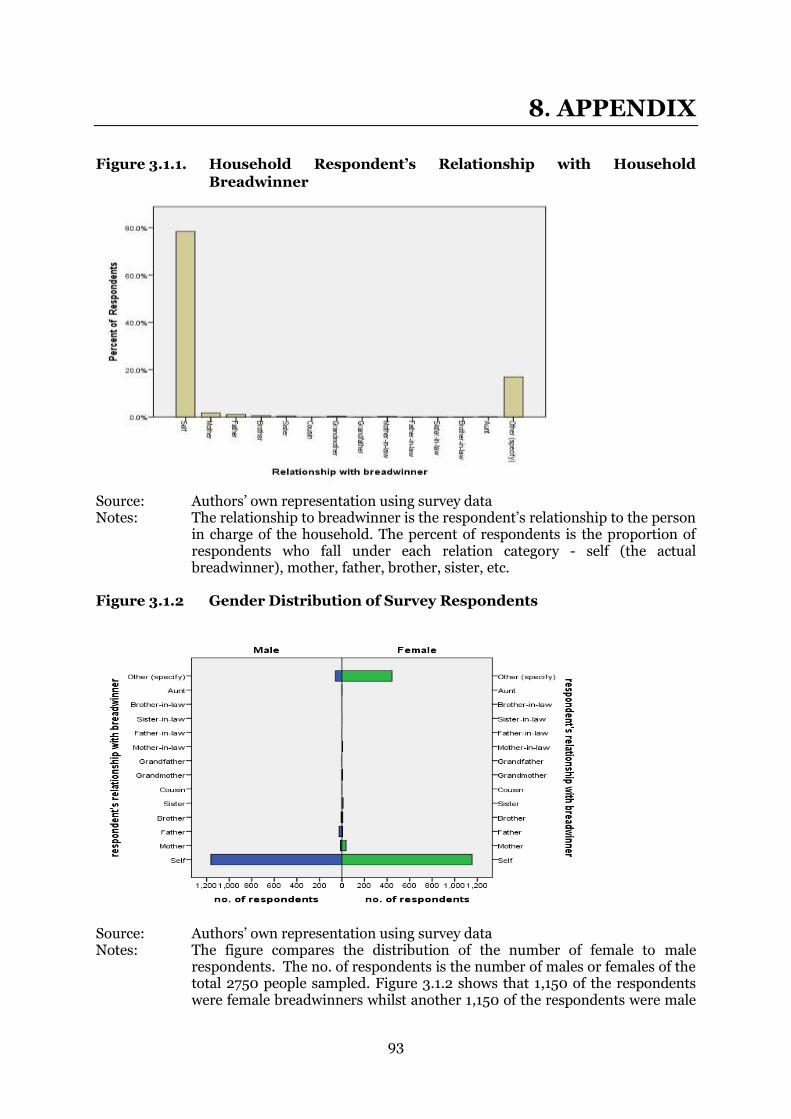
93
8. APPENDIX
Figure 3.1.1. Household Respondent’s Relationship with Household
Breadwinner
Source: Authors’ own representation using survey data Notes: The relationship to breadwinner is the respondent’s relationship to the person
in charge of the household. The percent of respondents is the proportion of respondents who fall under each relation category - self (the actual breadwinner), mother, father, brother, sister, etc.
Figure 3.1.2 Gender Distribution of Survey Respondents
Source: Authors’ own representation using survey data Notes: The figure compares the distribution of the number of female to male
respondents. The no. of respondents is the number of males or females of the total 2750 people sampled. Figure 3.1.2 shows that 1,150 of the respondents were female breadwinners whilst another 1,150 of the respondents were male
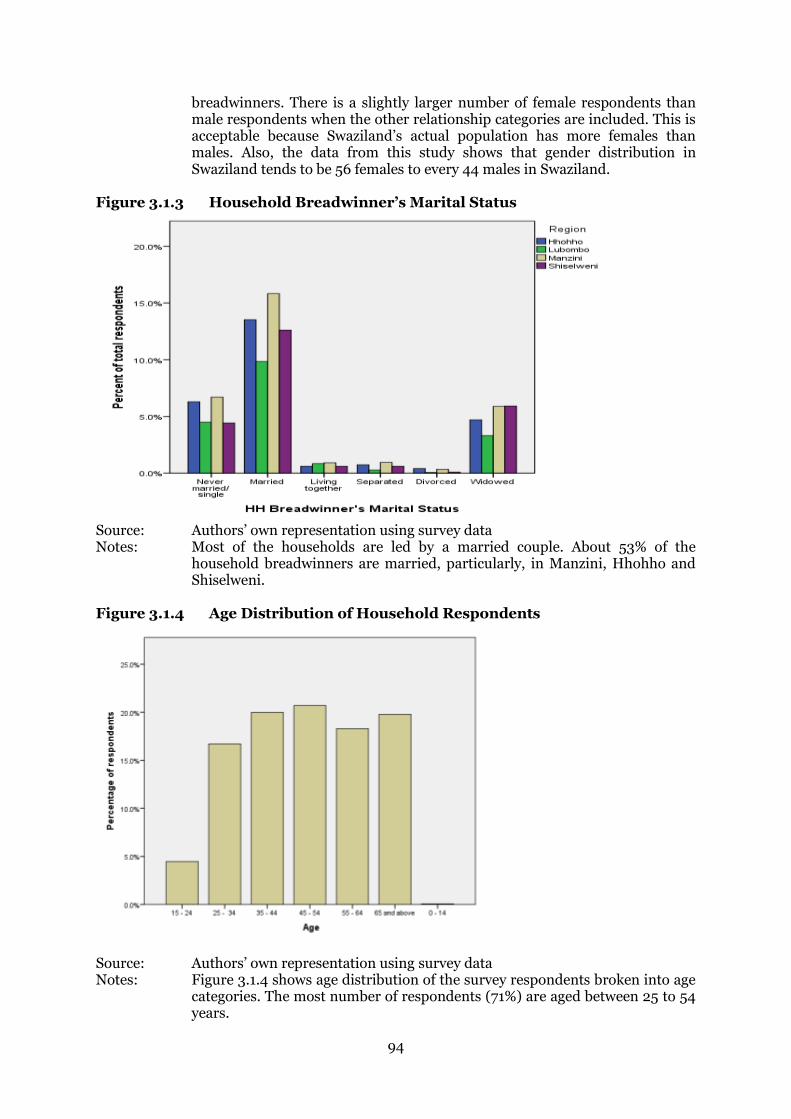
94
breadwinners. There is a slightly larger number of female respondents than male respondents when the other relationship categories are included. This is acceptable because Swaziland’s actual population has more females than males. Also, the data from this study shows that gender distribution in Swaziland tends to be 56 females to every 44 males in Swaziland.
Figure 3.1.3 Household Breadwinner’s Marital Status
Source: Authors’ own representation using survey data Notes: Most of the households are led by a married couple. About 53% of the
household breadwinners are married, particularly, in Manzini, Hhohho and Shiselweni.
Figure 3.1.4 Age Distribution of Household Respondents
Source: Authors’ own representation using survey data Notes: Figure 3.1.4 shows age distribution of the survey respondents broken into age
categories. The most number of respondents (71%) are aged between 25 to 54 years.
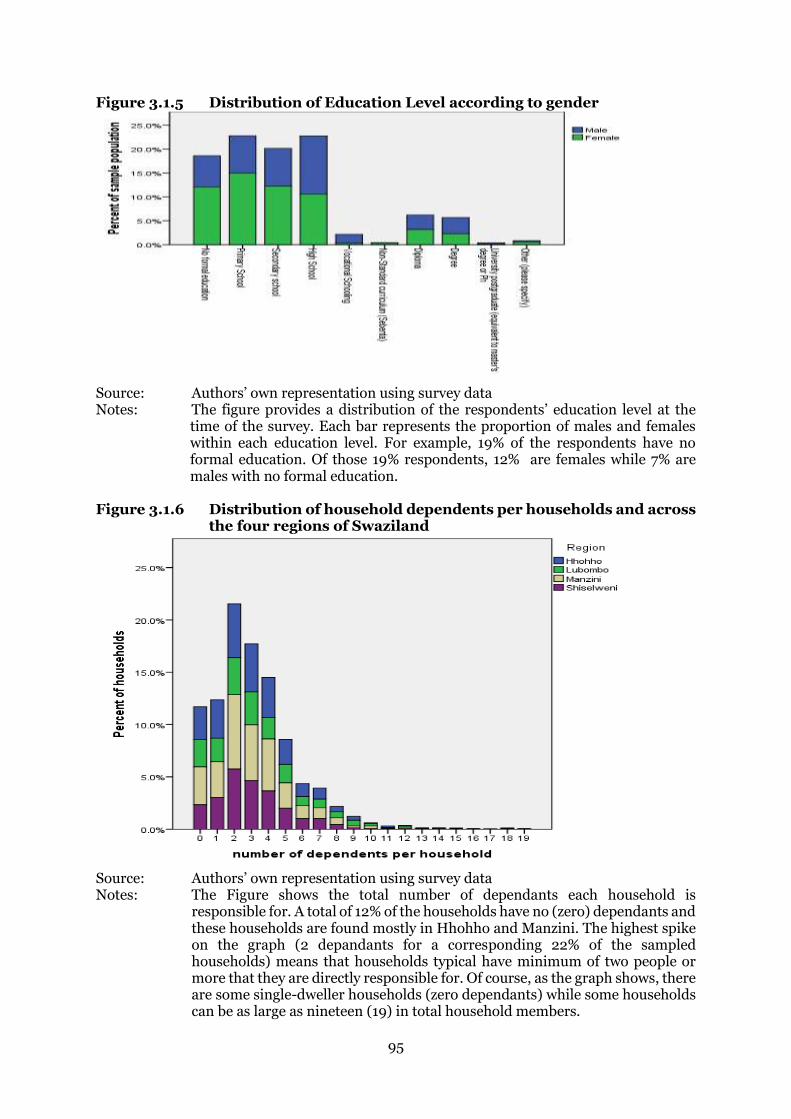
95
Figure 3.1.5 Distribution of Education Level according to gender
Source: Authors’ own representation using survey data Notes: The figure provides a distribution of the respondents’ education level at the
time of the survey. Each bar represents the proportion of males and females within each education level. For example, 19% of the respondents have no formal education. Of those 19% respondents, 12% are females while 7% are males with no formal education.
Figure 3.1.6 Distribution of household dependents per households and across
the four regions of Swaziland
Source: Authors’ own representation using survey data Notes: The Figure shows the total number of dependants each household is
responsible for. A total of 12% of the households have no (zero) dependants and these households are found mostly in Hhohho and Manzini. The highest spike on the graph (2 depandants for a corresponding 22% of the sampled households) means that households typical have minimum of two people or more that they are directly responsible for. Of course, as the graph shows, there are some single-dweller households (zero dependants) while some households can be as large as nineteen (19) in total household members.
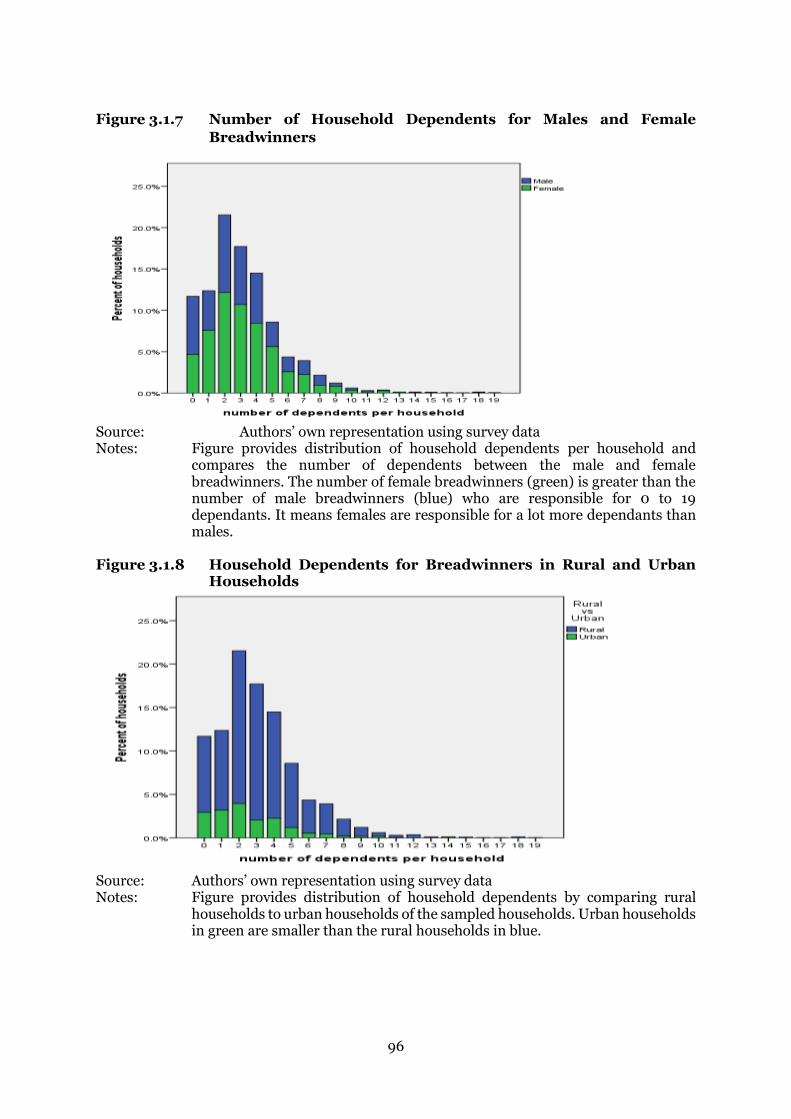
96
Figure 3.1.7 Number of Household Dependents for Males and Female
Breadwinners
Source: Authors’ own representation using survey data Notes: Figure provides distribution of household dependents per household and
compares the number of dependents between the male and female breadwinners. The number of female breadwinners (green) is greater than the number of male breadwinners (blue) who are responsible for 0 to 19 dependants. It means females are responsible for a lot more dependants than males.
Figure 3.1.8 Household Dependents for Breadwinners in Rural and Urban
Households
Source: Authors’ own representation using survey data Notes: Figure provides distribution of household dependents by comparing rural
households to urban households of the sampled households. Urban households in green are smaller than the rural households in blue.
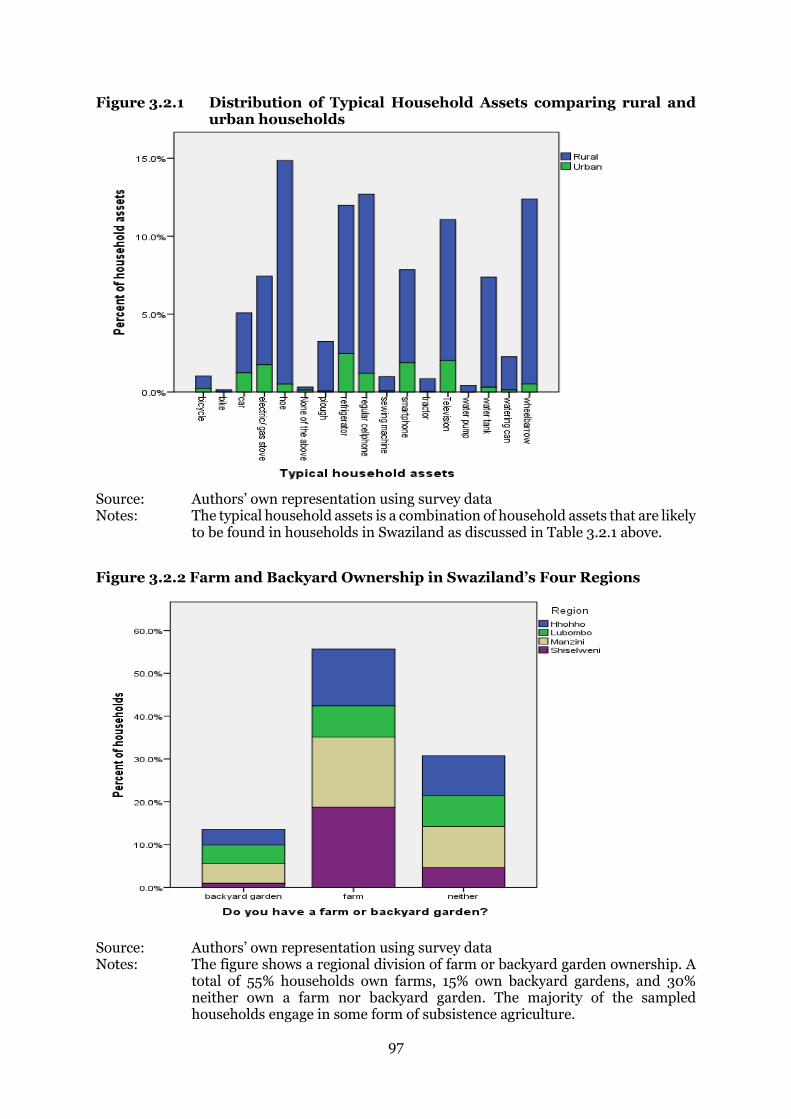
97
Figure 3.2.1 Distribution of Typical Household Assets comparing rural and urban households
Source: Authors’ own representation using survey data Notes: The typical household assets is a combination of household assets that are likely
to be found in households in Swaziland as discussed in Table 3.2.1 above.
Figure 3.2.2 Farm and Backyard Ownership in Swaziland’s Four Regions
Source: Authors’ own representation using survey data Notes: The figure shows a regional division of farm or backyard garden ownership. A
total of 55% households own farms, 15% own backyard gardens, and 30% neither own a farm nor backyard garden. The majority of the sampled households engage in some form of subsistence agriculture.
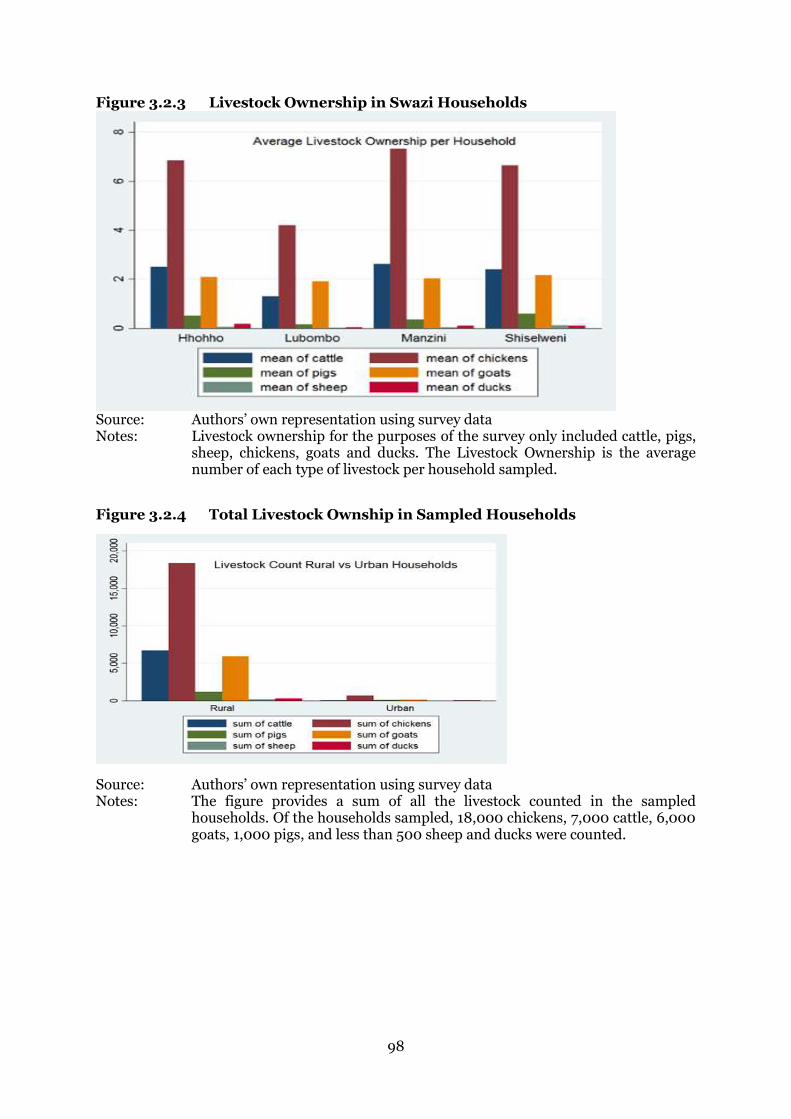
98
Figure 3.2.3 Livestock Ownership in Swazi Households
Source: Authors’ own representation using survey data Notes: Livestock ownership for the purposes of the survey only included cattle, pigs,
sheep, chickens, goats and ducks. The Livestock Ownership is the average number of each type of livestock per household sampled.
Figure 3.2.4 Total Livestock Ownship in Sampled Households
Source: Authors’ own representation using survey data Notes: The figure provides a sum of all the livestock counted in the sampled
households. Of the households sampled, 18,000 chickens, 7,000 cattle, 6,000 goats, 1,000 pigs, and less than 500 sheep and ducks were counted.

99
Figure 3.2.5 Household Ownership of Sampled Households
Source: Authors’ own representation using survey data Notes: The figure groups household ownership according to the different age groups
of household breadwinners.
Figure 3.2.6 Household Living Structure: Number of Rooms
Source: Authors’ own representation using survey data Notes: Number of rooms is the size of the household’s house in total number of rooms.
Swazi homes consist of 58% two-to-three room structures, 35% one room structures and 7% four-and-larger room structures (see Figure 3.2.6).

100
Figure 3.2.7 Prevalence of Stick and Mud houses in Sampled Households
Source: Authors’ own representation using survey data Notes: The figure gives a percentage of stick and mud houses in each region. “Stick &
mud” represents the actual stick and mud homes while ‘0’represents houses that are not stick and mud – concrete and other more stable building material.
Figure 3.2.8 Household’s Main Lighting Source
Source: Authors’ own representation using survey data Notes: The figures shows the percentage usage of the different types of lighting
mechanisms such as electricity, lamps, candles, solar, wind, and batteries.

101
Figure 3.2.9 Household’s Main Energy Cooking Source
Source: Authors’ own representation using survey data Notes: The figure provides a distribution of household cooking energy sources. On the
one hand it compared rural to urban households while on the other hand it compares female to male energy cooking sources.
Figure 3.3.1 Household Expenditure of Sampled Households
Source: Authors’ own representation using survey data Notes: The proportion of items that constitute household expenditures of the sampled
households. On the lefthand side, the figure shows the average cost and list of the items per household in Emalangeni. On the other side, the figure compares the average cost and list of items on household expenditure across the four regions of Swaziland.
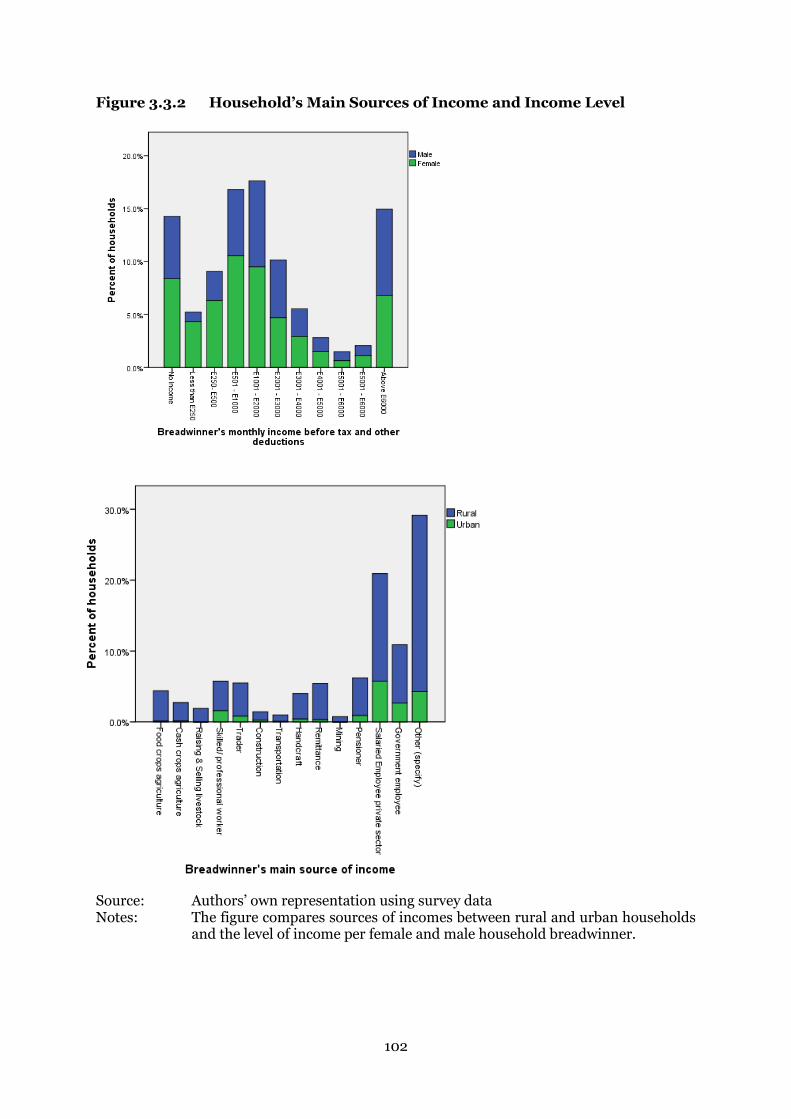
102
Figure 3.3.2 Household’s Main Sources of Income and Income Level
Source: Authors’ own representation using survey data Notes: The figure compares sources of incomes between rural and urban households
and the level of income per female and male household breadwinner.
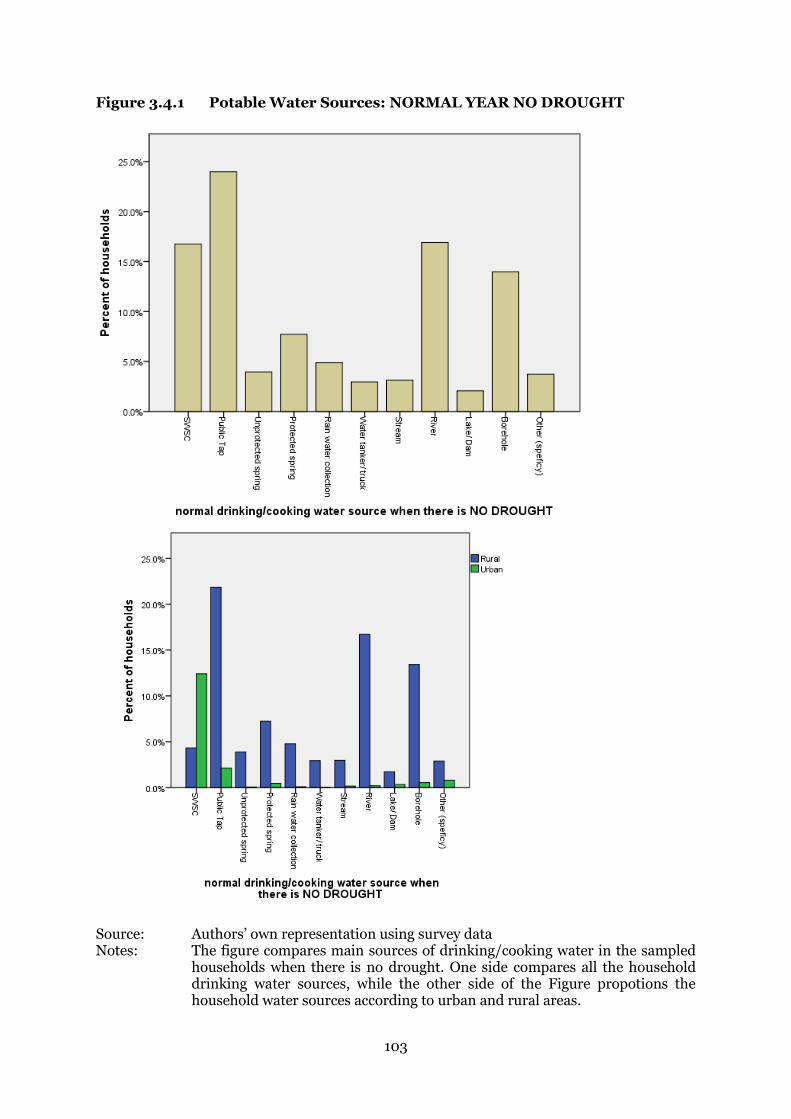
103
Figure 3.4.1 Potable Water Sources: NORMAL YEAR NO DROUGHT
Source: Authors’ own representation using survey data Notes: The figure compares main sources of drinking/cooking water in the sampled
households when there is no drought. One side compares all the household drinking water sources, while the other side of the Figure propotions the household water sources according to urban and rural areas.
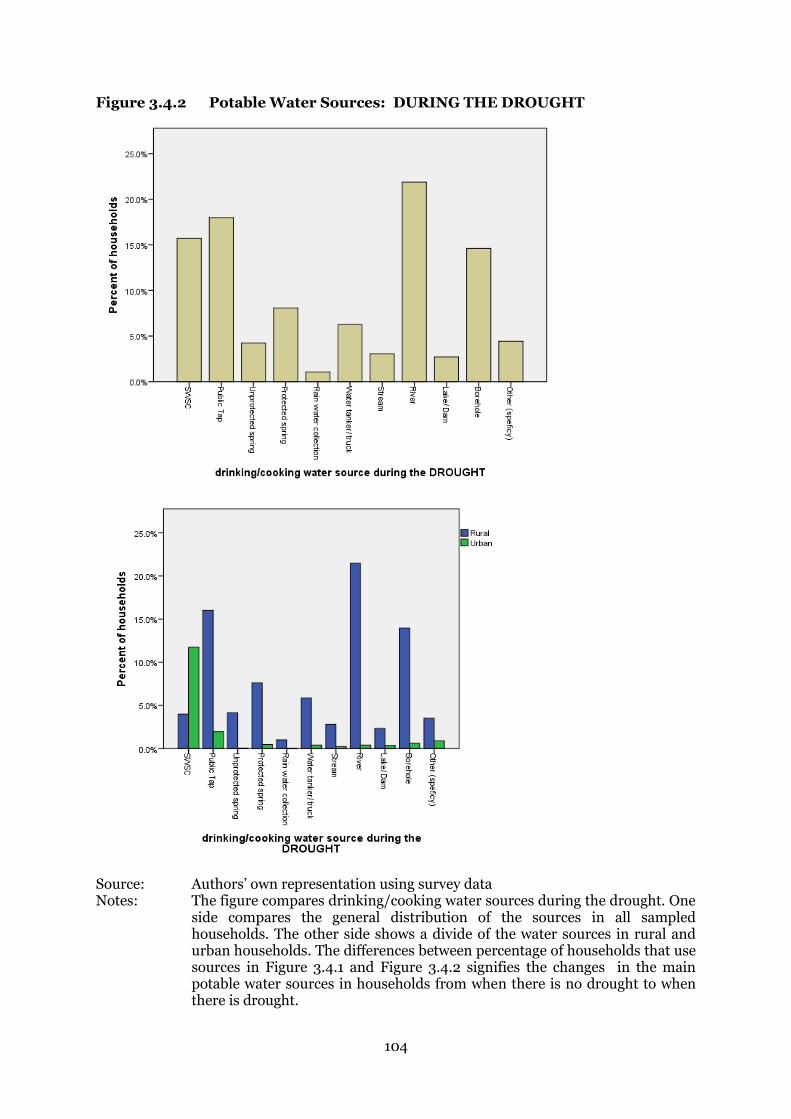
104
Figure 3.4.2 Potable Water Sources: DURING THE DROUGHT
Source: Authors’ own representation using survey data Notes: The figure compares drinking/cooking water sources during the drought. One
side compares the general distribution of the sources in all sampled households. The other side shows a divide of the water sources in rural and urban households. The differences between percentage of households that use sources in Figure 3.4.1 and Figure 3.4.2 signifies the changes in the main potable water sources in households from when there is no drought to when there is drought.

105
Figure 3.4.3 Average Water Consumption (No Drought versus Drought)
Source: Authors’ own representation using survey data Notes: The figures provide details on the average water consumption when there is no
drought compared to when there is drought. The “mean” is the average water consumption per day in each region.

106
Figure 3.4.4 Average Monthly Water Costs (No Drought versus Drought)
Source: Authors’ own representation using survey data Notes: The figures gives the average water expenditure per household in each region
of Swaziland. It compares montly water costs when there is no drought to when there is drought. The mean is the average money in Emalangeni spent per month to pay for water in each region.
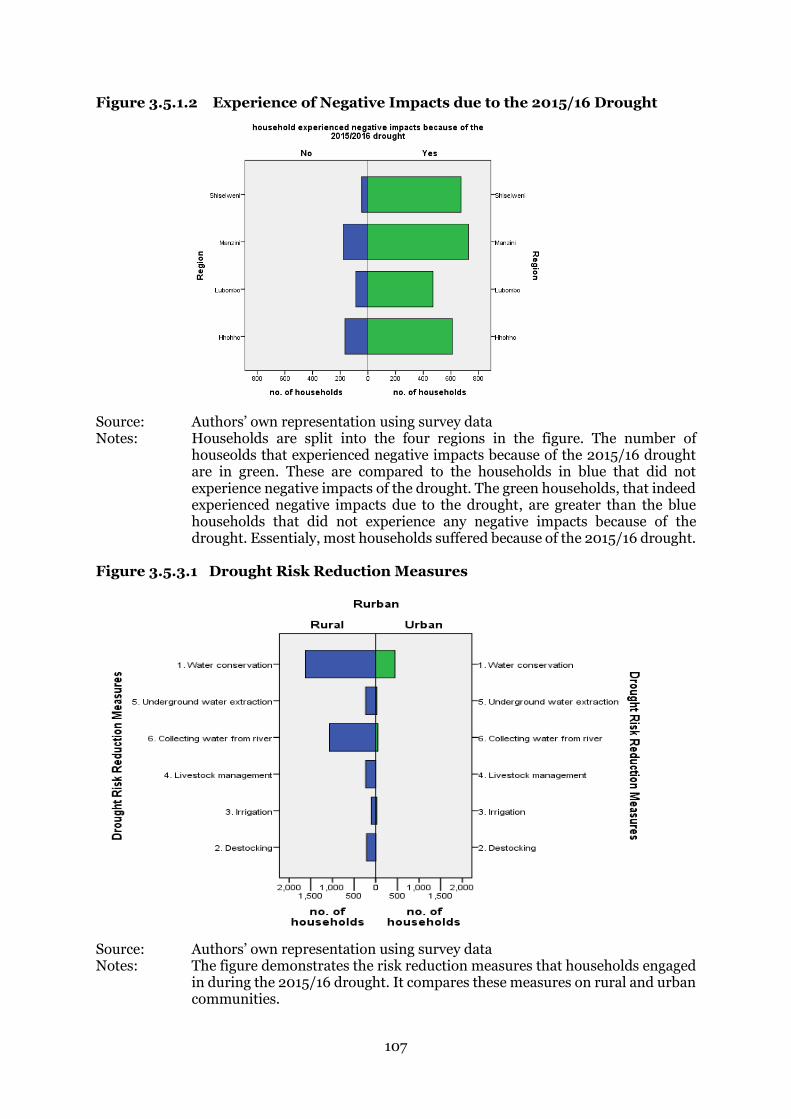
107
Figure 3.5.1.2 Experience of Negative Impacts due to the 2015/16 Drought
Source: Authors’ own representation using survey data Notes: Households are split into the four regions in the figure. The number of
houseolds that experienced negative impacts because of the 2015/16 drought are in green. These are compared to the households in blue that did not experience negative impacts of the drought. The green households, that indeed experienced negative impacts due to the drought, are greater than the blue households that did not experience any negative impacts because of the drought. Essentialy, most households suffered because of the 2015/16 drought.
Figure 3.5.3.1 Drought Risk Reduction Measures
Source: Authors’ own representation using survey data Notes: The figure demonstrates the risk reduction measures that households engaged
in during the 2015/16 drought. It compares these measures on rural and urban communities.
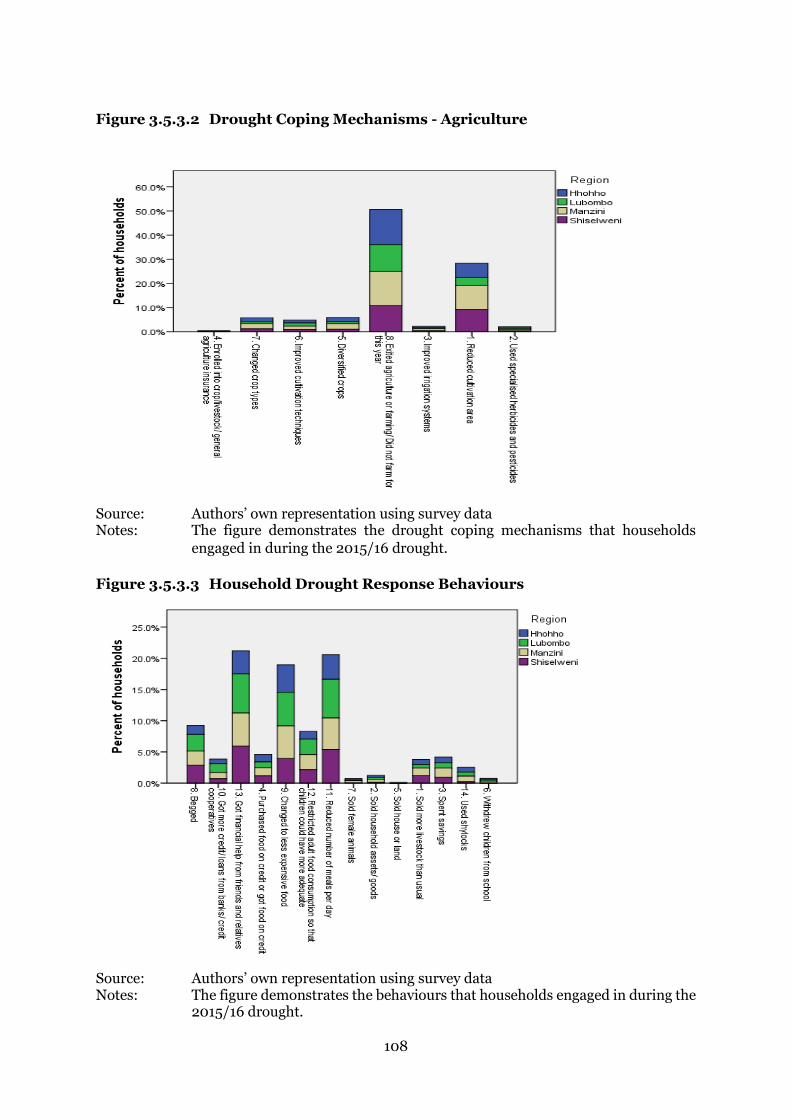
108
Figure 3.5.3.2 Drought Coping Mechanisms - Agriculture
Source: Authors’ own representation using survey data Notes: The figure demonstrates the drought coping mechanisms that households
engaged in during the 2015/16 drought.
Figure 3.5.3.3 Household Drought Response Behaviours
Source: Authors’ own representation using survey data Notes: The figure demonstrates the behaviours that households engaged in during the
2015/16 drought.

![SWAZILAND GOVERNMENT GAZETTE EXTRAORDINARY - Swaziland Competition … Commission Regulations... · SWAZILAND GOVERNMENT GAZETTE EXTRAORDINARY VOL. XLVIII] ... \ THE COMPETITION ACT,](https://img.pdfslide.net/doc/110x75/5ad0acb57f8b9a8b1e8e2be8/swaziland-government-gazette-extraordinary-swaziland-competition-commission.jpg)