Embed Size (px)
Citation preview


Copyright ©FATA-DA 2010 All rights reserved
Citation, reproduction or translation of this publication, in whole or part, for educational or other non-commercial purposes is authorized, provided
the source is fully acknowledged.

Table of Contents
ACRONYMS 4
EXECUTIVE SUMMARY 5
INTRODUCTION 7
Background on FATA 7
FATA Administration 8
People and Ethnic Diversity of FATA 10
Economy of FATA 13
Conditions under which business operates in FATA 14
Economic framework 14
Comerce and trade regime 15
Project Rationale 15
TERMS OF REFERENCE 16
Objectives of the study 16
Scope of Services 16
Time Schedule, Reporting, Completion Time 17
Reporting 17
Methodology 18
Preliminary Assessment 18
Selection of the Study Area 19
Questionnaire Development 20
Training of Field Staff 20
Pre- testing 20
Primary Data Collection 20
Data Accuracy/Quality Check 20
Data Entry 21
Field Monitoring and Coordination 21
Stakeholders Consultation 22
THE INDUSTRIAL SECTOR IN FATA 23
Establishment of Industries in FATA 23
List of Industrial Units established by defunct FATA Development Corporation 23
Nature of Industries in FATA 24
Major Goods produced in FATA 25
Size of the Industrial Units in FATA 25
Productivity of Industrial Units in FATA 26
Nature of ownership of Industries 27
Sources of Finance 28
Proportion of personal capital (Capital Structure) 30
Procedure adopted for Establishing Industries 31
Sources of Energy 31
Nature and Sources of Raw Material used in Industries in FATA 32
Major Problems faced by industries in FATA 33
Closure of Industries 34
Major Reason of Industries closure 35
Incentives Demanded By the Industries in FATA 36
Impact of current law and order situation 37
SERVICE SECTOR IN FATA 38
History of the Establishment of Services Sector in FATA 38
Volume and Size of Business Units 38
Type of Ownership of the Business 39
Nature of business 39
Sources of Finance 40
Procedure adopted for establishment of Business 41
Sources of Energy 42
Nature of Goods and Services of the Services Sector in FATA 43
Source of goods and raw material used in Service Sector of FATA 43
Major Problems faced by businesses in FATA 45
Incentives, facilities and priorities 46
Level of Satisfaction of businessmen in FATA 47
Consequences of the Present Law and Order Situation on the Businesses 47
Documentation and registration of the Busincess 48
SITUATION OF LABOUR FORCE IN FATA 50
Labour Force in the Industrial Sector of FATA 50
Percentage of Industries Recruiting Workers 50
Age of workers 51
Education and Skill level of workers 51
Working Conditions and Salaries in Industries in FATA 52
Labour Force in the Service Sector of FATA 54
Age, Education and Skill level of Workers 54
Working Conditions 56
Salary Range 56
Origin of Workers 57
Facilities/Incentives Provided to Workers 57
Nature of Skilled Workers needed in service sector of FATA 58
WAY FORWARD 59
1. Economic Reforms 59
2. Political and Legal Reforms: 64
ANNEXURE 66
Annexure –I SME Definition for the purpose of classifying small & Medium Enterprises 66
Annexure –II FATA Industries’ Statistical Data 67
Annexure –III FATA Service Sector Statistical Data 127
Annexure –IV Database for Survey Analysis 152

Annexure – V Report on Consultative Workshop 159
Annexure – VI English Questionnaires A
Annexure –VII URDU Questionnaires R

Survey-Enumeration of Industries, Service Sector Entities, Labor Force and Identifying constraints in FATA
ACRONYMS
ACO Agency Coordination Officer
CAMP Community Appraisal & Motivation Programme
DFID Department for International Development
FATA Federally Administered Tribal Areas
FCR Frontier Crimes Regulations
FDA FATA Development Authority
FIP Financial Inclusion Program
FR Frontier Region
GoP Government of Pakistan
MNA Member National Assembly
PA Political Agency
SBP State Bank of Pakistan
TACCI Tribal Area Chamber of Commerce & Industries
TESCO Tribal Electric Supply Corporation
TORs Terms of References
WAPDA Water and Power Development Authority

Survey-Enumeration of Industries, Service Sector Entities, Labor Force and Identifying constraints in FATA
FATA Development Authority 5
EXECUTIVE SUMMARY
FATA is one of the most underprivileged regions in Pakistan. It has one of the lowest socio-economic indices in Pakistan. Commerce and trade form a major source of livelihoods in the tribal areas, second only to agriculture.i The commerce and trade activities in FATA can be essentially divided in three main segments i.e industrial, service and the situation of labour. The lowest socio-economic indices for FATA in part reflect weak performance of these sectors over the years. The existing conditions, also contributed to by the security sitation, do not provide adequate opportunities to the people of FATA. CAMP, with the support and guidance of the FATA Development Authority (FDA), organized a survey of the Industrial, Service and Labor force along the identified parameters and TORs. The main aim of the survey was to carry out an assessment of existing conditions and business environment under which the aforementioned sectors & businesses operate in FATA, to identify the bottlenecks hindering development, analyze problems and find out remedies for sustainable development of the Industrial & Service sectors and Labor force in FATA. The survey revealed that in general, environment to do businesses in FATA are not conducive. It is not easy to initiate new or even operate businesses in FATA due to a host of impeding reasons. These mainly include lack of legal framework, security, access to finance, skilled labour, raw material, inability to market and sell products and acute shortage of energy supply. FATA currently does not even have primary laws to regulate and protect businesses, which increases transaction costs. In absence of any legal framework, commercial banks cannot extend credit facilities to FATA. This increases cost of doing business which has contributed to retarded growth over decades besides causing multiplicative problems including chronic structural unemployment due to untrained local labour. Absence of tax regime and virtually free (stolen) electricity is contributing to Inefficient growth in some industries. Many industries have now closed due to security situation, lack of access to finance and energy. The current, century old, administrative and political system of FATA is also a hindering factor for businesses to flourish in the area. Industrial sector of FATA mainly consists of coal mining, extraction of marble, sporting and light arm manufacturing, cloth sewing, candle making, and ice making etc. Majority of the industries in FATA consist of small (66%) to medium (32%) units. A small number of the industrial units i.e. 2% can hardly be categorized as large scale units. A large number of factors, including operational inefficiencies, inability to respond to market needs, use of old technologies and lack of access to cheap finance and inputs have made production less competitive. One of the main reasons of the small size of the industrial units is the ownership of the businesses. Majority of the business i.e. 82.47% are established under sole proprietorships. Absence of cheap credit facilities makes expansion or expanding into larger scale operation difficult. The industrial base in FATA is not diversified and most (49.1%) of the raw material is supplied from the settled areas. One of the main reasons identified during the survey which has badly affected the industrial activity, besides law and order situation, is shortage of power. In absence of recognition by the government and not operating in clusters planning provision of cheap electricity will be an arduous task. The industrial units of FATA face frequent power breakdowns and low voltage. Although the problem is presently common in
Survey-Enumeration of Industries, Service Sector Entities, Labor Force and Identifying constraints in FATA
FATA Development Authority 6
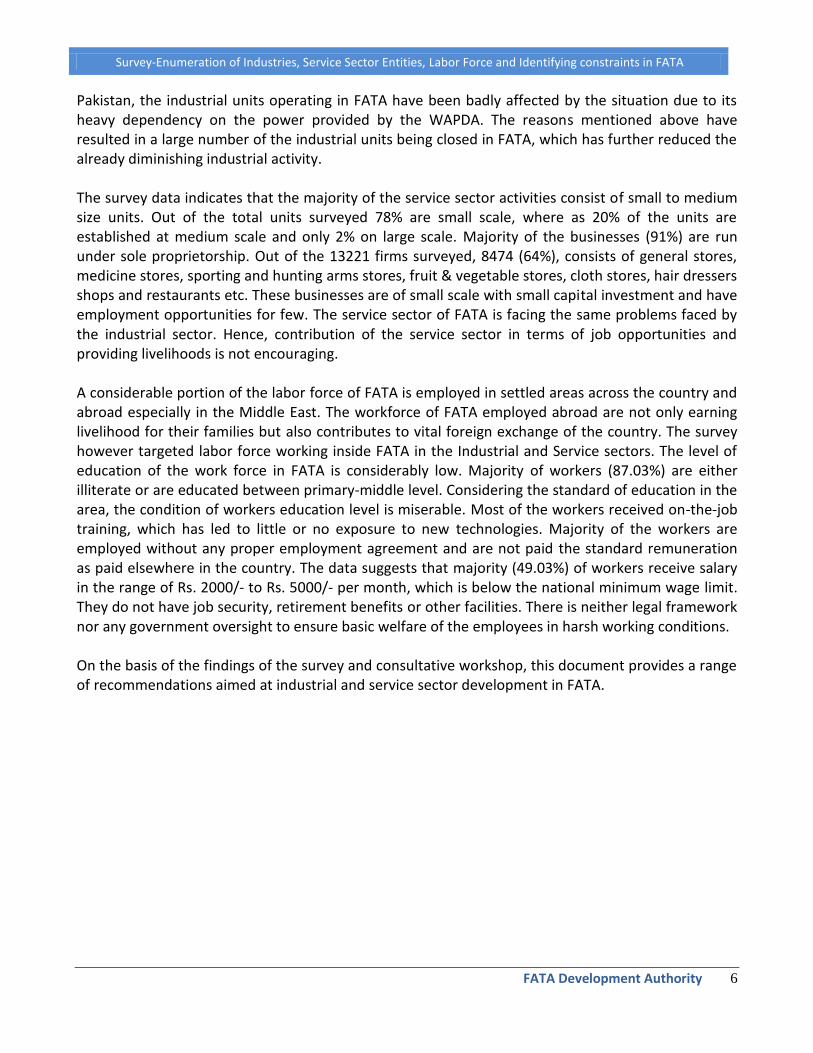
Pakistan, the industrial units operating in FATA have been badly affected by the situation due to its heavy dependency on the power provided by the WAPDA. The reasons mentioned above have resulted in a large number of the industrial units being closed in FATA, which has further reduced the already diminishing industrial activity. The survey data indicates that the majority of the service sector activities consist of small to medium size units. Out of the total units surveyed 78% are small scale, where as 20% of the units are established at medium scale and only 2% on large scale. Majority of the businesses (91%) are run under sole proprietorship. Out of the 13221 firms surveyed, 8474 (64%), consists of general stores, medicine stores, sporting and hunting arms stores, fruit & vegetable stores, cloth stores, hair dressers shops and restaurants etc. These businesses are of small scale with small capital investment and have employment opportunities for few. The service sector of FATA is facing the same problems faced by the industrial sector. Hence, contribution of the service sector in terms of job opportunities and providing livelihoods is not encouraging. A considerable portion of the labor force of FATA is employed in settled areas across the country and abroad especially in the Middle East. The workforce of FATA employed abroad are not only earning livelihood for their families but also contributes to vital foreign exchange of the country. The survey however targeted labor force working inside FATA in the Industrial and Service sectors. The level of education of the work force in FATA is considerably low. Majority of workers (87.03%) are either illiterate or are educated between primary-middle level. Considering the standard of education in the area, the condition of workers education level is miserable. Most of the workers received on-the-job training, which has led to little or no exposure to new technologies. Majority of the workers are employed without any proper employment agreement and are not paid the standard remuneration as paid elsewhere in the country. The data suggests that majority (49.03%) of workers receive salary in the range of Rs. 2000/- to Rs. 5000/- per month, which is below the national minimum wage limit. They do not have job security, retirement benefits or other facilities. There is neither legal framework nor any government oversight to ensure basic welfare of the employees in harsh working conditions. On the basis of the findings of the survey and consultative workshop, this document provides a range of recommendations aimed at industrial and service sector development in FATA.
Survey-Enumeration of Industries, Service Sector Entities, Labor Force and Identifying constraints in FATA
FATA Development Authority 7
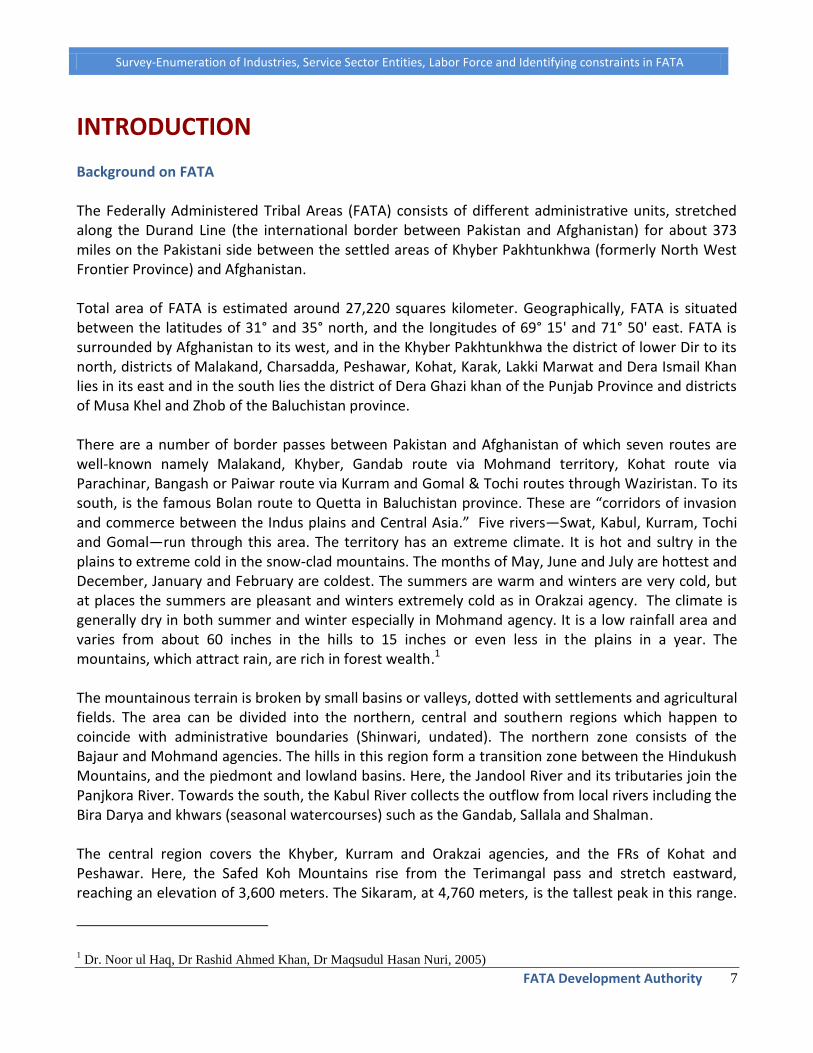
INTRODUCTION Background on FATA The Federally Administered Tribal Areas (FATA) consists of different administrative units, stretched along the Durand Line (the international border between Pakistan and Afghanistan) for about 373 miles on the Pakistani side between the settled areas of Khyber Pakhtunkhwa (formerly North West Frontier Province) and Afghanistan.
Total area of FATA is estimated around 27,220 squares kilometer. Geographically, FATA is situated between the latitudes of 31° and 35° north, and the longitudes of 69° 15' and 71° 50' east. FATA is surrounded by Afghanistan to its west, and in the Khyber Pakhtunkhwa the district of lower Dir to its north, districts of Malakand, Charsadda, Peshawar, Kohat, Karak, Lakki Marwat and Dera Ismail Khan lies in its east and in the south lies the district of Dera Ghazi khan of the Punjab Province and districts of Musa Khel and Zhob of the Baluchistan province.
There are a number of border passes between Pakistan and Afghanistan of which seven routes are well-known namely Malakand, Khyber, Gandab route via Mohmand territory, Kohat route via Parachinar, Bangash or Paiwar route via Kurram and Gomal & Tochi routes through Waziristan. To its south, is the famous Bolan route to Quetta in Baluchistan province. These are “corridors of invasion and commerce between the Indus plains and Central Asia.” Five rivers—Swat, Kabul, Kurram, Tochi and Gomal—run through this area. The territory has an extreme climate. It is hot and sultry in the plains to extreme cold in the snow-clad mountains. The months of May, June and July are hottest and December, January and February are coldest. The summers are warm and winters are very cold, but at places the summers are pleasant and winters extremely cold as in Orakzai agency. The climate is generally dry in both summer and winter especially in Mohmand agency. It is a low rainfall area and varies from about 60 inches in the hills to 15 inches or even less in the plains in a year. The mountains, which attract rain, are rich in forest wealth.1
The mountainous terrain is broken by small basins or valleys, dotted with settlements and agricultural fields. The area can be divided into the northern, central and southern regions which happen to coincide with administrative boundaries (Shinwari, undated). The northern zone consists of the Bajaur and Mohmand agencies. The hills in this region form a transition zone between the Hindukush Mountains, and the piedmont and lowland basins. Here, the Jandool River and its tributaries join the Panjkora River. Towards the south, the Kabul River collects the outflow from local rivers including the Bira Darya and khwars (seasonal watercourses) such as the Gandab, Sallala and Shalman.
The central region covers the Khyber, Kurram and Orakzai agencies, and the FRs of Kohat and Peshawar. Here, the Safed Koh Mountains rise from the Terimangal pass and stretch eastward, reaching an elevation of 3,600 meters. The Sikaram, at 4,760 meters, is the tallest peak in this range.
1 Dr. Noor ul Haq, Dr Rashid Ahmed Khan, Dr Maqsudul Hasan Nuri, 2005)

Survey-Enumeration of Industries, Service Sector Entities, Labor Force and Identifying constraints in FATA
FATA Development Authority 8
The Kurram River flows north-west to south-east, entering North Waziristan below the town of Thal in the Hangu district of the Khyber Pakhtunkhwa, and eventually joining the Indus River. In Orakzai Agency, the Khanki and Mastura streams flow to the east to meet the Bara River. The towns of Bara and Khajuri form a plains area from where the Bara River and its tributaries join the Kabul River near Peshawar. To the north of the Kabul River stand the Mullagori and Shilman hills. The fertile Bara, Khanki, Kurram and Mastura valleys contain the most extensively cultivated land in FATA.
The southern region comprises the North Waziristan and South Waziristan agencies, and the FRs of Bannu, Dera Ismail Khan, Lakki Marwat and Tank. To the south of the Safed Koh are the Sulaiman Mountains and the Waziristan hills. The hills rise to an altitude of between 1,500 and 3,000 meters, and are mostly barren. Takht-i-Sulaiman, located in FR Dera Ismail Khan, is the highest peak in the Sulaiman range, at 3,487 meters. Overall drainage in this region is toward the east. The Gomal River flows in the south, while the Kurram River passes though the north. The Jandola, Kaitu and Tochi are smaller rivers in this area. The rod kohi system (flood irrigation, or torrent-spate irrigation) is commonly practiced mainly in the FR areas. The Gomal and Tochi mountain passes in the south connect Pakistan to Afghanistan.
An interesting mix of sedimentary, igneous and metamorphic rock is found in the area. The most common sedimentary formations consist of sandstone, limestone, shale and conglomerates, occurring in the south-west. Partly metamorphosed andesite, granite and gabbro make up the bulk of igneous masses. Metamorphic rocks in the area include schist, slate and marble.
The soil is derived mainly from the local weathering of bedrock, deposited by streams and rivers, though loess also occurs to some extent. Landforms in the area are varied and include piedmont, plains, valleys, gravel fans, rough broken land and gullied land. Level areas are loamy, while lowlands are lightly to strongly calcareous. The content of organic matter and available phosphorus is very low.
FATA lies on the cusp of two major climatic systems, the monsoon to the east and the Mediterranean towards the west. Most parts of FATA are arid and semi-arid, with warm summers and cool winters, although some areas in the Kurram and Orakzai agencies fall within the humid and sub-humid zone. The pattern and character of summer and winter rainfall is intermixed to such an extent that it is difficult to determine which is dominant. According to meteorological data, the area receives more winter precipitation as a result of western disturbances and some rain in the summer from the monsoon. Annual rainfall in the area varies dramatically, from 630 millimeters reported in Kurram during 2001–02, to just 88 millimeters in neighboring Khyber Agency during the same year.
FATA Administration
FATA enjoys unique status in the constitution of the Islamic Republic of Pakistan. Administratively the region is different from the rest of Pakistan. Federal Government directly administers the affairs of FATA. The President of Pakistan has the authority to implement rules and regulation in FATA. The President nominates and appoints Governor of the Khyber Pakhtunkhwa province who exercises power of the President. The administration of FATA is carried out through FATA secretariat located in the provincial capital Peshawar. The law implemented elsewhere in Pakistan does not apply in FATA. FATA is regulated through FCR – the Frontier Crimes Regulations, implemented in the region by the

Survey-Enumeration of Industries, Service Sector Entities, Labor Force and Identifying constraints in FATA
FATA Development Authority 9
British in 1901. According to the constitution of the Islamic Republic of Pakistan, the jurisdiction of Supreme Court and High Court does not extend to FATA.
The total area of the FATA is divided into the following administrative units called Agencies and frontier regions;
Agencies; 1. Khyber Agency 2. Mohmand Agency 3. Bajaur Agency 4. Orakzai Agency 5. Kurram Agency 6. North Waziristan Agency 7. South Waziristan Agency Frontier Regions; 1. Frontier Region, Bannu 2. Frontier Region, Dera Ismail Khan 3. Frontier Region, Kohat 4. Frontier Region, Lakki Marwat 5. Frontier Region, Peshawar 6. Frontier Region,Tank
Each tribal Agency is administered by a Political Agent (PA), assisted by a number of assistant Political Agents, Tehsildars (administrative head of a Tehsil) and Naib Tehsildars (Deputy Tehsildar), as well as members from various local police (Khassadars) and security forces (Levies, Scouts). As part of his administrative functions, the Political Agent oversees the working of line departments and service providers. He is responsible for handling inter-tribal disputes over boundaries or the use of natural resources, and for regulating the trade in natural resources with other agencies or the settled areas.
The Political Agent plays a supervisory role for development projects and chairs an Agency development sub-committee, comprising various government officials, to recommend proposals and approve development projects. He also serves as project coordinator for rural development schemes.
An FR is administered by the District Coordination Officer (DCO) of the respective settled district, who exercises the same powers in an FR as the Political Agent does in a tribal Agency.
All civil and criminal cases in FATA are decided under the Frontier Crimes Regulation 1901 by a jirga (council of elders). Residents of the tribal areas may, however, approach the apex courts (Supreme Court of Pakistan and Peshawar High Court) with a constitutional writ challenging a decision issued under the 1901 Regulation.
Survey-Enumeration of Industries, Service Sector Entities, Labor Force and Identifying constraints in FATA
FATA Development Authority 10
FATA has been given the right to elect by universal adult franchise its representatives in the National Legislative Assembly in 1997 on non party basis. Now FATA has 12 members in the National Assembly and 8 members in the Senate of Pakistan. By the present government’s reforms in the Frontier Crime Regulations, political parties are now allowed to engage in political activities in FATA.
People and Ethnic Diversity of FATA
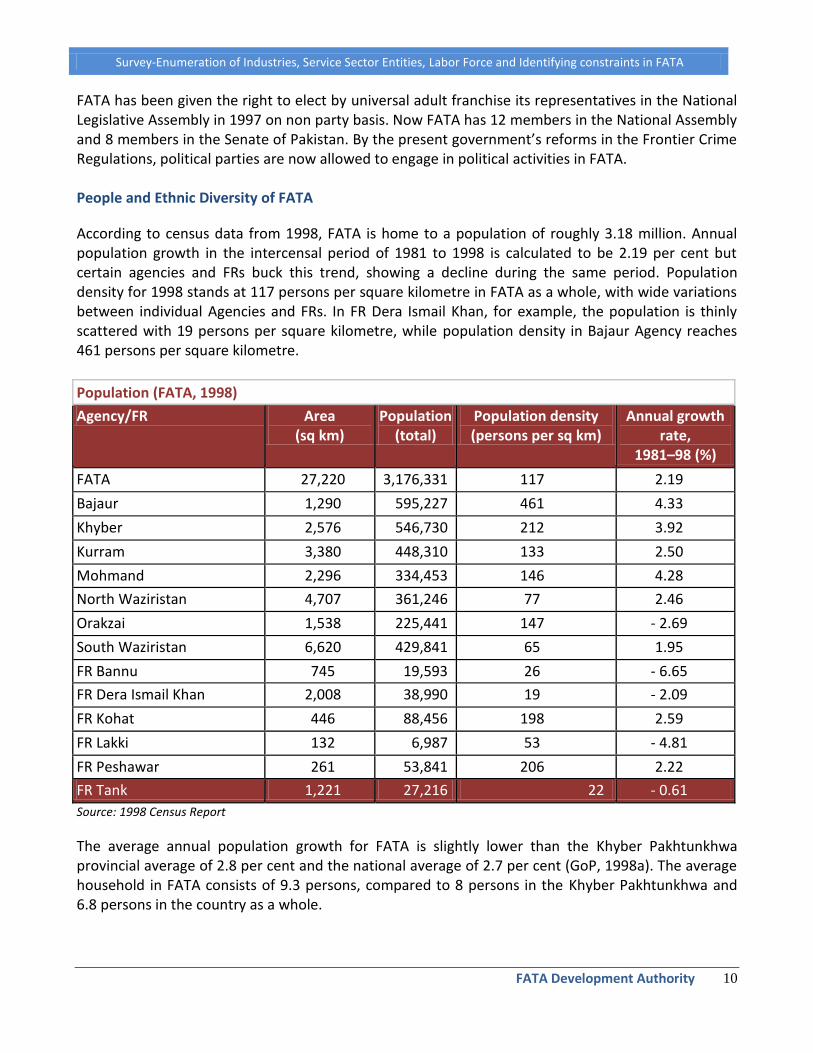
According to census data from 1998, FATA is home to a population of roughly 3.18 million. Annual population growth in the intercensal period of 1981 to 1998 is calculated to be 2.19 per cent but certain agencies and FRs buck this trend, showing a decline during the same period. Population density for 1998 stands at 117 persons per square kilometre in FATA as a whole, with wide variations between individual Agencies and FRs. In FR Dera Ismail Khan, for example, the population is thinly scattered with 19 persons per square kilometre, while population density in Bajaur Agency reaches 461 persons per square kilometre.
Population (FATA, 1998)
Agency/FR Area (sq km)
Population (total)
Population density (persons per sq km)
Annual growth rate,
1981–98 (%)
FATA 27,220 3,176,331 117 2.19
Bajaur 1,290 595,227 461 4.33
Khyber 2,576 546,730 212 3.92
Kurram 3,380 448,310 133 2.50
Mohmand 2,296 334,453 146 4.28
North Waziristan 4,707 361,246 77 2.46
Orakzai 1,538 225,441 147 - 2.69
South Waziristan 6,620 429,841 65 1.95
FR Bannu 745 19,593 26 - 6.65
FR Dera Ismail Khan 2,008 38,990 19 - 2.09
FR Kohat 446 88,456 198 2.59
FR Lakki 132 6,987 53 - 4.81
FR Peshawar 261 53,841 206 2.22
FR Tank 1,221 27,216 22 - 0.61
Source: 1998 Census Report
The average annual population growth for FATA is slightly lower than the Khyber Pakhtunkhwa provincial average of 2.8 per cent and the national average of 2.7 per cent (GoP, 1998a). The average household in FATA consists of 9.3 persons, compared to 8 persons in the Khyber Pakhtunkhwa and 6.8 persons in the country as a whole.

Survey-Enumeration of Industries, Service Sector Entities, Labor Force and Identifying constraints in FATA
FATA Development Authority 11
Demographic indicators (Pakistan, KHYBER PAKHTUNKHWA and FATA, 1998)
Indicator Pakistan Khyber
Pakhtunkhwa FATA
Geographical area (sq km) 796,096 74,521 27,220
Annual population growth, 1981–98 (%) 2.69 2.82 2.19
Average household size (persons) 6.80 8.00 9.30
Urban population (% of total) 32.50 16.87 2.70
Population density (persons per sq km) 166.30 238.10 116.70
Source: 1998 Census Report
The gender ratio of 108 males for every 100 females is somewhat perplexing, since some 126,577 persons, most of whom are likely to be men, are recorded as migrants from FATA in other parts of Pakistan during the 1998 census. This should in theory leave a higher proportion of females in the local population. Census reporting in FATA is likely to have been distorted by problems in gathering data, since tribal custom forbids the disclosure of information about women to outsiders.
Population by gender (FATA, 1998)
Agency/FR Total Male Female Ratio*
FATA 3,176,331 1,652,047 1,524,284 108
Bajaur 595,227 305,137 290,090 105
Khyber 546,730 284,602 262,128 109
Kurram 448,310 229,634 218,676 105
Mohmand 334,453 175,404 159,049 110
North Waziristan 361,246 192,432 168,814 114
Orakzai 225,441 112,766 112,675 100
South Waziristan 429,841 231,080 198,761 116
FR Bannu 19,593 10,380 9,213 113
FR Dera Ismail Khan 38,990 20,497 18,493 111
FR Kohat 88,456 45,472 42,984 106
FR Lakki 6,987 3,450 3,537 98
FR Peshawar 53,841 27,063 26,778 101
FR Tank 27,216 14,130 13,086 108
Source: 1998 Census Report
Survey-Enumeration of Industries, Service Sector Entities, Labor Force and Identifying constraints in FATA
FATA Development Authority 12
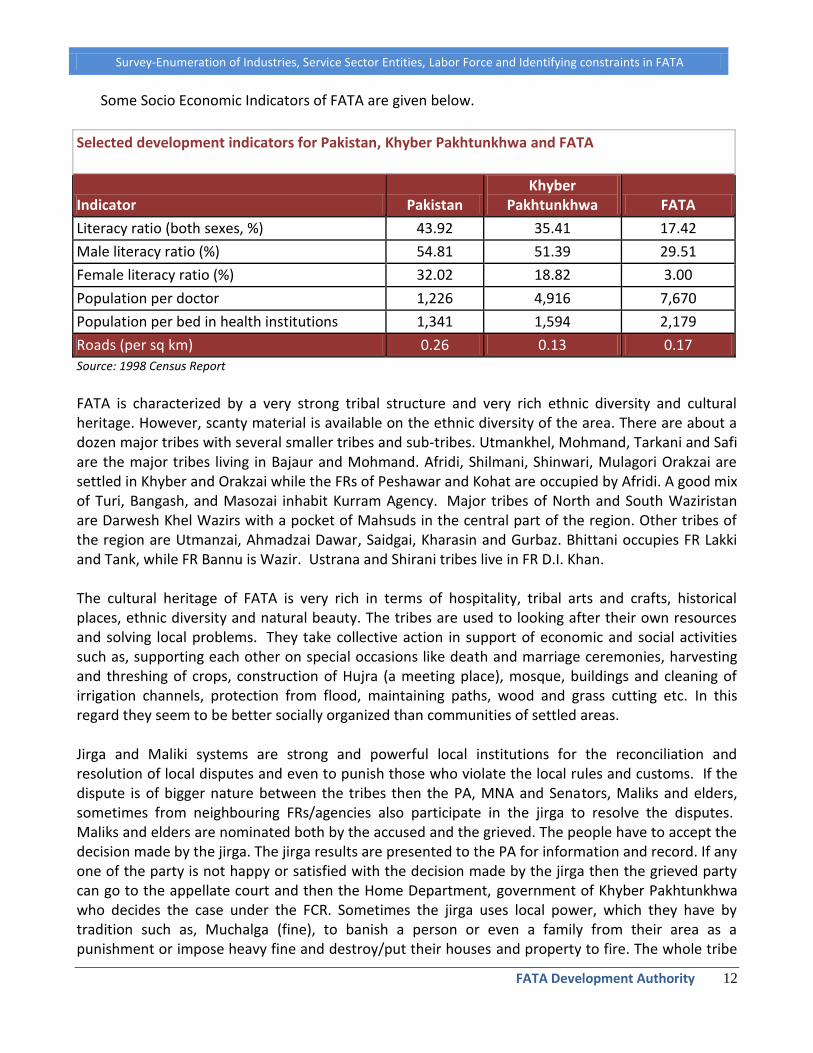
Some Socio Economic Indicators of FATA are given below.
Selected development indicators for Pakistan, Khyber Pakhtunkhwa and FATA
Indicator Pakistan Khyber
Pakhtunkhwa FATA
Literacy ratio (both sexes, %) 43.92 35.41 17.42
Male literacy ratio (%) 54.81 51.39 29.51
Female literacy ratio (%) 32.02 18.82 3.00
Population per doctor 1,226 4,916 7,670
Population per bed in health institutions 1,341 1,594 2,179
Roads (per sq km) 0.26 0.13 0.17
Source: 1998 Census Report
FATA is characterized by a very strong tribal structure and very rich ethnic diversity and cultural heritage. However, scanty material is available on the ethnic diversity of the area. There are about a dozen major tribes with several smaller tribes and sub-tribes. Utmankhel, Mohmand, Tarkani and Safi are the major tribes living in Bajaur and Mohmand. Afridi, Shilmani, Shinwari, Mulagori Orakzai are settled in Khyber and Orakzai while the FRs of Peshawar and Kohat are occupied by Afridi. A good mix of Turi, Bangash, and Masozai inhabit Kurram Agency. Major tribes of North and South Waziristan are Darwesh Khel Wazirs with a pocket of Mahsuds in the central part of the region. Other tribes of the region are Utmanzai, Ahmadzai Dawar, Saidgai, Kharasin and Gurbaz. Bhittani occupies FR Lakki and Tank, while FR Bannu is Wazir. Ustrana and Shirani tribes live in FR D.I. Khan. The cultural heritage of FATA is very rich in terms of hospitality, tribal arts and crafts, historical places, ethnic diversity and natural beauty. The tribes are used to looking after their own resources and solving local problems. They take collective action in support of economic and social activities such as, supporting each other on special occasions like death and marriage ceremonies, harvesting and threshing of crops, construction of Hujra (a meeting place), mosque, buildings and cleaning of irrigation channels, protection from flood, maintaining paths, wood and grass cutting etc. In this regard they seem to be better socially organized than communities of settled areas. Jirga and Maliki systems are strong and powerful local institutions for the reconciliation and resolution of local disputes and even to punish those who violate the local rules and customs. If the dispute is of bigger nature between the tribes then the PA, MNA and Senators, Maliks and elders, sometimes from neighbouring FRs/agencies also participate in the jirga to resolve the disputes. Maliks and elders are nominated both by the accused and the grieved. The people have to accept the decision made by the jirga. The jirga results are presented to the PA for information and record. If any one of the party is not happy or satisfied with the decision made by the jirga then the grieved party can go to the appellate court and then the Home Department, government of Khyber Pakhtunkhwa who decides the case under the FCR. Sometimes the jirga uses local power, which they have by tradition such as, Muchalga (fine), to banish a person or even a family from their area as a punishment or impose heavy fine and destroy/put their houses and property to fire. The whole tribe

Survey-Enumeration of Industries, Service Sector Entities, Labor Force and Identifying constraints in FATA
FATA Development Authority 13
makes a lashkar (group together) for the implementation of the decision taken by the jirga. Due to these strong local traditional rules the reported crime rate in FATA is low. However, with the passage of time the element of corruption has also entered this traditional dispute resolution system. It is reported that the poor and vulnerable cannot afford to have a jirga. There are a lot of requirements of jirga like hospitality and many other things, which the poor cannot afford. Thus jirga is now becoming very expensive to convene. There is a grievance among the people that most of the time the ultimate decision is in favour of the rich and the influential. A Malik has his own status in his tribe. The Political Agent (PA) gives him some amount as Mojib (allowance) periodically to run his local hospitality expenses. The local people respect Maliks possessing good quality, quantity of weapons and the number of male members to use these weapons when needed. Traditionally the household head has a strong hold and decision-making power for the whole family. The wives are traditionally submissive to their husbands and the likelihood of divorce or separation in the tribal society is negligible. If there is dislike and conflict between wife and husband, he will marry another girl if he is rich and also keep his old wife. The tribesmen when they are in their local area generally wear their traditional clothes with a large turban and rifle on the shoulder. The women-folk generally use printed cloth and observe strict purdah from outsiders. Their working and festival dresses are all the same with the exception that they wear new dresses on festivals like Eid and weddings or when visiting relatives outside the village. In the winter season the males use a woollen blanket, while the women’s dress remains the same. Tribal women are very fond of wearing ornaments and jewellery of all type made of gold and silver. A lot of money is spent on the local ceremonies, particularly on marriage, death, birth and other ceremonies/festivals like celebration of Eid and performing Haj. People of FATA are fond of games and sports, which are essential for healthy living and positive growth of youth. Unfortunately, with the exception of a few places, there are hardly any sports grounds or similar facilities in FATA. There are no sports clubs to facilitate and arrange tribal sport tournaments. However, there are a variety of local games and sports played commonly all over both indoor and outdoor. These include hunting, gun shooting, wrestling, swimming and local child games, dog/cock/bird fights and many other games.
Economy of FATA With a small industrial and service sector base, there are few livelihood opportunities available to the people in FATA. The local economy is primarily pastoral, with agriculture practiced in a few fertile valleys. Most households are engaged in primary-level activities such as subsistence agriculture and livestock rearing, or small-scale business conducted locally. Others are involved in trade within the tribal belt or with down-country markets. Mining and extraction of natural resources in some areas of FATA can be termed as major industrial activity. Those who are able to travel, find work in cities across Pakistan as well as in the Middle East, using their earnings to support families at home. The more highly qualified have in many cases migrated permanently along with their families to urban centers outside the tribal areas, including Bannu, Dera Ismail Khan and Peshawar. They and their

Survey-Enumeration of Industries, Service Sector Entities, Labor Force and Identifying constraints in FATA
FATA Development Authority 14
children are reluctant to return to FATA, leading among other things to an acute shortage of doctors, teachers and skilled workers generally and in particular to a dearth of qualified female teachers and doctors. Conditions under which business operates in FATA Conditions for doing business in FATA are not favourable. The economy of FATA is undocumented. Businesses that run in FATA are not registered with any government authority in any form; hence enjoy no government patronage. Credit facility as available to the businesses elsewhere in the country, is not available to FATA. In absence of legal framework in FATA as implemented in the rest of the country, commercial banks though operating in FATA do not advance loans to people of FATA as absence of land revenue act make it impossible for banks to ensure collateral for advances. Law and order situation particularly after 9/11 has aggravated the situation further. Tens of thousands of the people, especially those who had business in FATA have left the area and migrated towards settled areas of the country. Resultantly, a large number of business entities of FATA have closed down adding to already large portions of structural unemployment. Non-availability of raw material on sustainable basis, power shortages, poor infrastructure, and non-availability of skilled workers, high production cost, problems in marketing and the aggravated law and order situation are some reasons which have brought the businesses of FATA at the verge of complete collapse. The current Administrative and Political system of FATA is also hindering the businesses to flourish. Establishment of a new business in FATA is hard, especially for those investors who do not belong to FATA. Permission from the administrative authority of FATA and local tribes is a difficult task as the outsiders cannot purchase and own lands in FATA. They have to acquire land for business purpose from local tribe on lease who will dictate the terms and conditions of lease agreement. For settlement of disputes there is no other system except jirga, which in many cases is not able to settle the complex disputes arising between businessmen. Economic framework The statutory regime regulating industrial activity elsewhere in Pakistan does not apply to the tribal areas (Ali, 2003). Industry is not subject to direct taxes or regulation. In this sense, at least, FATA’s industrial sector is the ultimate free-market environment. In the absence of adequate legal cover, investment is a risky business. Acquiring land is also an issue since, under the tribal system, outsiders cannot own land in the region. Any industry that is set up in FATA requires some form of contract with the tribe on whose land it is established. Where lease agreements are in place, enforcement is only possible through a jirga. In general, all contracts and agreements are enforced under the Frontier Crimes Regulation by a jirga, and not through the judicial channels available elsewhere in Pakistan. The system does not provide a distinct codified framework under which business and contractual disputes can be resolved. Although a number of scheduled Pakistani banks operate in FATA (GoKHYBER PAKHTUNKHWA, 2005a), current State Bank of Pakistan restrictions prohibit these institutions from extending loans to people in the tribal areas. These factors serve as a disincentive

Survey-Enumeration of Industries, Service Sector Entities, Labor Force and Identifying constraints in FATA
FATA Development Authority 15
for investment in general, and particularly for corporations and large firms. Under the circumstances, it is also difficult to employ and retain suitable workers.2 Comerce and trade regime Opportunities in commerce and trade are hampered by many factors. The absence of a robust legal framework to regulate financial services and commercial transactions makes the business climate uncertain, prevents small entrepreneurs from expanding their operations and deters new players from entering the sector. Educated professionals and skilled workers are in short supply, and bringing labour into the tribal areas is not a viable option. The security situation adds to the general level of uncertainty, which exacerbate when conflict erupts between tribes or clans. Businesses must also contend with bad roads, disruptions in power supply, inadequate storage facilities, and a host of similar problems arising from poorly developed infrastructure and insufficient auxiliary services. For the government, valuable tax revenue is lost. Meanwhile, the lack of reliable statistical data concerning commercial activity makes it difficult to carry out meaningful planning.
Project Rationale In order to fill the information gap, CAMP was selected by FATA Development Authority (FDA) through consultant selection process to conduct a survey of existing Industries, Service Sector Entities, Labour force and Identifying Constraints in FATA. The survey is aimed to collect data about existing Industries, Service Sector entities, Labour force & Identifying constraints in all Seven Agencies and Six FRs on the identified parameters, guidelines as provided in the TORs.
2 FATA Sustainable Development Plan (2006-2015)
Survey-Enumeration of Industries, Service Sector Entities, Labor Force and Identifying constraints in FATA
FATA Development Authority 16
TERMS OF REFERENCE Objectives of the study The objective of the project is to conduct a survey under three thematic area/components i.e. all industrial units, service sectors entities and the work force employed therein so that it can be documented and analyzed to devise policy interventions and design projects that can help in providing an enabling environment for attracting investment as well as improve the working conditions of the labor force. The results of the survey will be developed into a database which will be studied and analyzed to identify the gaps, shortcomings and depending on the outcome of the survey, accordingly focused projects and interventions will be designed. Since FDA will soon be embarking on the major mega project of ROZs in FATA, therefore the survey results are intended to identify the challenges and potential of the industry as well as to identify the impediments which restrict the development of industry in FATA. Moreover, the labor survey will also help in designing policy interventions and identifying specific labor laws that are mandatory to be adopted to comply with the requirements of ROZs legislation. Scope of Services Carry out an extensive survey of existing industries, service sector entities & labor Force & identifying constraints in all the seven Agencies and Six Frontier Regions on the parameters described subsequently hereunder:
- Propose additional parameters as well as the client can increase or decrease the parameters after mutual discussion and the results of the initial survey to be reflected in the inception report.
- Identify the sectors to be covered under the service sector entities with detailed need assessment and justification.
- The survey will cover but not limited to the following information/data covered under the following parameters.
1. No. of industrial & service units established, closed and still operating in FATA with the following details:
Complete location of business with Mailing Address, telephone/Fax \Nos,
Year of establishment
Legal status of business
Type of business
Classification of business (as defined in SME policy of SMEDA)
Corporate set up/structure
Mode of Financing of Project/unit/business

Survey-Enumeration of Industries, Service Sector Entities, Labor Force and Identifying constraints in FATA
FATA Development Authority 17
Debt Equity Ratio, if financed
Capital structure
Details of Owner
Identity of owner
Motive of establishing unit/business
Type of product/s manufactured or services rendered
Rated production capacity
Actual production capacity (based on last three years production)
Source of Power
Name/Type of Raw material used
Yearly requirement of raw materials
Source of raw materials
Current operational status
Reason for closer
2. Operational issues of running units. 3. Constraints that hamper or discourage investment in FATA 4. Statutory, administrative recommendations to encourage investment in Industry Commerce & Trade in FATA. 5. Total number of labor force with designation, qualification and experience employed unit wise, sector wise, and area wise and area/Agency/FR wise. 6. Source of labor/employees. 7. Skill set of the labor force. 8. Employment practice, work conditions and wages structure of the labor force. 9. Detailed statistical analysis of the collected data on three counts separately i.e. industries, service sector and labor force from various perspectives to identify gaps and opportunities. 10. Identify and recommend policy measure and projects to be initiated consequent to the analytical results of the survey on all three counts. 11. Recommendation for development and management of Database/Data bank for the collected data.
Time Schedule, Reporting, Completion Time Completion period for the assignment and to produce the required deliverables is estimated as six (6) months from the award of the contract. Reporting
Elaborate the methodology and work plan for conducting the survey.
Devise and get it approved from the clients the tools and techniques i.e. questionnaires for collecting data and opinions survey.
The data has to be collected, analyzed and reported under three components/thematic areas identified above.
Survey-Enumeration of Industries, Service Sector Entities, Labor Force and Identifying constraints in FATA
FATA Development Authority 18
Keep a constant liaison with the FATA DA to receive feedback and incorporate the remedial measures proposed during the course of compilation of the final document or the proposed Plan of Action.
Write and submit an inception report within the first two weeks after conducting preliminary surveys and meetings. The inception report will contain, but not limited to the methodology to be adopted during the survey period and subsequent work plan.
Keep posted FATA DA during the course of the study and submit monthly progress/updates compared with work plans during the period of the Survey.
A draft report and a final report to be submitted at the end of the assignment.
Methodology In formulating the project document, CAMP kept its past experience at the forefront and also reviewed a number of documents related to survey approaches. This included various options of large scale processes, possible methodologies and how to achieve the best possible approaches. An extensive and in-depth desk review was undertaken to document all the factual and historical information regarding the subject. This information will help the policy makers to have an insight of the existing laws, governance related issues, service sector and labour force and the factors involved in hindering or preventing the growth of the aforementioned sectors in the FATA. Besides reviewing the recently developed Sustainable Development Plan (SDP), which reveals that industrial activity in FATA is restricted primarily to small, owner-financed units, operating without government oversight, CAMP built on this information by gathering more specific information. CAMP deputed staff at the agency and FR level to gather and validate the information requested in the TORs through an extensive data form (questionnaire). Preliminary Assessment
CAMP launched the groundwork of the survey initiative by organizing a series of preliminary meetings with the key stakeholders including informants in the Tribal Chambers of Commerce and Industries (TCCI), journalists from FATA, and members of the trade union. The initiative was planned to be spearheaded through CAMP’s five well staffed field offices strategically located to cover each and every region of FATA. CAMP staff has been deputed to assess local situation and gather and report initial information to launch survey. CAMP has a well established presence inside FATA since long. CAMPs initial analysis and review indicates that commerce and trade form a major source of livelihood in the tribal areas, second only to agriculture. The majority of this activity is in the form of wholesale and retail trade in consumer goods and consumer durables, clearance and transportation services, warehousing, hotels and restaurants, used vehicle spare parts, vehicles, and small-scale commercial establishments providing auxiliary services. It is a well known fact that during the 1980s, the region was a major centre for opium production and trafficking. Today, the transit trade with Afghanistan provides employment for the local population.

Survey-Enumeration of Industries, Service Sector Entities, Labor Force and Identifying constraints in FATA
FATA Development Authority 19
The idea of long-term investment with slow but steady returns is not part of the business culture. It is partly for this reason that industrial development has failed to take off. Industrial activity is restricted primarily to small, owner-financed units, operating without government oversight. These include stone processing, textile weaving, furniture manufacture and light engineering units producing sporting and light hunting arms. It is estimated that some 10,000 workers are currently employed in the industrial sector in FATA. With the exception of those engaged in weapons and furniture manufacture, most local workers are unskilled. Some mineral extraction is taking place in various agencies, using outdated technology and antiquated methods. With few industries and only limited un-organized mining, unemployment and underemployment are high. Many seek employment as short-term unskilled labourers or enlist in the local security and paramilitary forces. Those who are able to travel find work in cities across Pakistan as well as in the Middle East, using their earnings to support families at home. The more highly qualified among them have in many cases migrated permanently with their families. They and their children are reluctant to return to the tribal areas, leading among other things to an acute shortage of doctors, teachers and skilled workers generally and in particular to a dearth of qualified female teachers and doctors. The local economy operates on an informal basis and is undocumented, since few laws providing for the regulation of economic activity have been extended to FATA. Access to financing is also restricted by State Bank of Pakistan rules prohibiting banks from extending credit facility to people in the tribal areas. Poverty has, to some extent, made the population vulnerable to extremist tendencies and crime. In the absence of viable options to earn a living, the lure of illicit activities such as smuggling (consumer goods, weapons) and drug trafficking is as difficult to resist as the call of extremist elements. There are few livelihood opportunities available to the people. The local economy is chiefly pastoral, with agriculture practised in a few fertile valleys. Most households are engaged in primary-level activities such as subsistence agriculture and livestock rearing, or small-scale business conducted locally. Others are involved in trade within the tribal belt or with down-country markets. Women take active part in agricultural activities, collect fuel wood and fetch water, besides attending to household work and family duties. The most immediate concern in this regard is the absence of reliable statistical data. Figures available from various official sources are often unreliable and frequently contradictory, making it impossible to accurately gauge the situation on the ground or carry out meaningful planning. There is limited conceptual and technical capacity within government departments, with most offices unable to achieve their development targets. Selection of the Study Area The survey studies all seven Tribal Agencies; Khyber, Orakzai, Kurram, Bajaur, Mohmand, North Waziristan, South Waziristan, and six Frontier Regions; Bannu, Lakki, D.I. Khan, Tank, Kohat and Peshawar.

Survey-Enumeration of Industries, Service Sector Entities, Labor Force and Identifying constraints in FATA
FATA Development Authority 20
Questionnaire Development Two different comprehensive questionnaires were developed and shared with FDA for its valuable feedback and comments. After receiving comments from FDA, a further review and modification of the questionnaire was made before it was finalized and approved. For the ease of the inteviewee and keeping inview the education level in FATA, both the questionnaires were developed and administerd in Urdu.
CAMP worked closely with FDA Department of Industries to enlist and identify all service sectors, before data forms were developed and distributed. CAMP ensured that the data collected is correct, useful and provided strategic guidance for the planned development interventions.
Training of Field Staff After the questionnaires were final, an extensive two-day training workshop was conducted at Peshawar on 19 and 20 December 2009 for the enumerators and field supervisors. The objective of the training session was to explain the scope of work, develop understanding of the questionnaire and train the field staff on the survey methodology. A session on security was also included in the training, keeping in mind the current situation in FATA. A training report was submitted to the FDA within two weeks of the training. Pre- testing The questionnaires/data forms were pre-tested by interviewing a few respondents in FATA. This helped the enumerators to identity any problems and seek clarification in the questionnaires/data forms or in field deployment strategy. Primary Data Collection The primary data was collected through a survey questionnaire identifying existing Industries, Service Sector entities, & Labour force & detecting constraints in all seven agencies and six FRs Regions on the parameters in the guidelines and TORs circulated by the FATA Development Authority (FDA). A structured questionaire was used for data collection. Data Accuracy/Quality Check It was ensured that the data correctly records the event it represents and data gathered from the field is accurate. The most common place for data to become inaccurate is on initial data gathering and data entry. Trained enumerators and data entry operators were appointed for this purpose and were properly trained on questionnaires, interviewing technique and data entry. The enumerators for each Agency/FR were involved throughout the data collection process in the same Agency/FR in order to make the data more accurate.

Survey-Enumeration of Industries, Service Sector Entities, Labor Force and Identifying constraints in FATA
FATA Development Authority 21
Agency Team Leaders checked the data collection process and collected data in the field on the spot. The Field Coordinator has also checked the completed questioners/data forms when received from field by CAMP Office at Peshawar. After assurance that the data collected was accurate and reliable it was processed for data entry. Data Entry Two different databases were developed for data entry of two thematic questionnaires/data forms. CAMP engaged 8 Data Entry Operators and an MIS Manager to develop and manage databases for data entry of the collected and compiled data forms (questionnaires) for industry and service sector entities, seperately. The data entry process was continuesly monitored by the MIS Manger. After completion of the data entry it was cleaned for errors free results and statisitcal analysis were made on three separete counts i.e. industries, service sector and labor force employed therein from various perspectives to identify gaps and opportunities. CAMP has been working on reforms for FCR and has first hand knowledge about the constraints; this helped CAMP to provide statuary and administrative recommendations to encourage investment in industry, commerce and trade in FATA. This was based partly on the perceptions, views and input from the entrepreneurs in FATA and FRs besides incorporating knowledge based on expertise and experience of the core staff about FATA business environment. The data forms (questionnaires) has also yielded the total number of labour force with designation, qualification and experience employed in each of the sector-wise industrial unit in each of the Agency and FRs. CAMP has identifed and recommended necessary policy measures and initiatives, based on the results of the survey and outcome of the stakeholder consultative workshop. Field Monitoring and Coordination CAMP core team ensured quality monitoring and evaluation of the whole exercise through close coordination with the agency and FR based FDA staff. CAMP ensured that questionnaires were administered to the target group in each of the Tehsils and sections, which is representative of each of the tribe and sub-tribe based in identified agencies of FATA. CAMP worked closely with the Manager Industries at the FDA to plan the survey and provide technical input based on is longstanding experience in FATA. CAMP also coordinated closely with the FDA to identify Tehsils and specific sections where the survey will be conducted. The planning phase briefly included technical input on revised questionnaire design, sample design and preparing the survey instruments. Using existing contacts and resources, CAMP worked with the Political Administration and communities to hire local staff from the respective communities in which the survey will be organized. CAMP also worked with the FDA to pre-test the survey and location of the pilot will be decided in coordination with the FDA. Furthermore, Agency Coordination Officer (ACO), of FDA posted in the respective agencies/FRs was the focal person for the respective data collection/survey

Survey-Enumeration of Industries, Service Sector Entities, Labor Force and Identifying constraints in FATA
FATA Development Authority 22
team. Therefore, the survey team in that particular agency/FR remained in constant contact and coordinated all field activities through the respective ACO. Stakeholders Consultation Stakeholders consultation workshop was organised at Peshawar on May 24, 2010 once the field data was gathered and some preliminary desk review was done. The agenda of the workshop was approved by FATA Development Authority (FDA). The Stakeholders’ consultation and analysis of their views on these thematic areas helped develop better understanding of the situation. A one-day consultation workshop brought together all stakeholders, including but not limited to trade unions, labour unions, FATA Chamber of Commerce, FDA and other relevant government entities, etc. over 50 participants attended the workshop which was organized in Peshawar.

Survey-Enumeration of Industries, Service Sector Entities, Labor Force and Identifying constraints in FATA
FATA Development Authority 23
THE INDUSTRIAL SECTOR IN FATA The latest survey of Industrial units presently operating in FATA has revealed some important aspects of the economy of FATA. This report is based on findings of an extensive survey questionnaire administered to industries in FATA. Establishment of Industries in FATA The history of the establishment of industry in FATA dates back to 1956. Although some growth in establishment of industries was observed in the period spanning from 1956 to 1977, there is an unprecedented growth in this respect in the early eighties, which can be correlated with better access to electricity in the tribal areas, coupled with a virtually tax free regime, led to industrial growth. Since early 1980 out of all the tribal regions and agencies, FR Kohat, Khyber and Mohmand Agencies have enjoyed rapid industrial growth. The main reason, besides others, is that these areas are in close vicinity with the cities in settled areas, having access to market, skilled labor & raw material, as well as financial resources, hence inadvertently forming themselves into loose clusters and deriving benefits thereof. Another factor, servings as a catalyst in growth of the industrial sector was the demographic transition that took place in the region. With the soviet invasion of Afghanistan, hundreds of thousands of Afghan refugees migrated to Pakistan, with greater influx in FATA, for their survival.
The people of Pakistan and more specifically FATA share common historical, social, cultural and business relations with Afghanistan, which resulted in a surge in economic activities in the area, presumably providing labour and some capital besides a demand for some sectors.
History of industries in FATA has not been limited a private sector investments alone. The government has endeavored to invest in various sectors including Marble, Edible oil and Ghee, Cigarette manufacturing, woollen mills, leather tanneries and products, match and glass, starting from mid seventies to late eighties. The total investment over the years amounted to around Rs. 108 million and employed more than 1400 personnel. However, these efforts could not be sustained due a variety of factors including inefficiencies that existed in project planning as well as management besides increasing costs of doing business in FATA, which ultimately led to the last venture being closed in October 1993 List of Industrial Units established by defunct FATA Development Corporation
S.# Name of Industrial unit
Date of Establishment
Date of closure
Investment in Million Present status Employees
1. Oil Expelling & Refining Plant, Bajour Agency
September 1988
October 1993 14.300
Sold for Rs. 9.000 Million in October 1993 159
2. Mohmand Glass September July 2.872 Advertised for 50

Survey-Enumeration of Industries, Service Sector Entities, Labor Force and Identifying constraints in FATA
FATA Development Authority 24
Factory, Ghalanai, Mohmand Agency
1977 1979 sale on 18 August 1995 but no response received
3. Bara Cigarette Factory, Bara Khyber Agency August 1976
October 1986 9.981
Sold for Rs. 10.30 Million in July 1992 105
4. Bara Ghee Mills, Bara Khyber Agency July 1976 1978 17.220
Handover to Ghee Corporation of Pakistan in 1978 273
5. Mulagori Marble Factory, Khyber Agency
February 1980
September 1986 9.271
Sold for Rs. 9.350 Million in 1996 147
6.
Kurram Food Product at Sadda, Kurram Agency March 1977
January 1983 5.835
Sold for Rs. 4.750 Million in October 1993 41
7.
Tochi Village Match Factory Miranshah, North Waziristan Agency
October 1975
August 1984 12.692
Sold for Rs. 11.900 Million in June 1995 221
8.
Tochi Woolen Mills Miranshah, North Waziristan Agency August 1978
August 1985 12.682
Sold for Rs. 7.880 Million in January 1996 84
9.
Looms Unit Mir Ali, North Waziristan Agency
February 1982
January 1985 2.972
Sold for Rs. 3.100 Million in October 1993 30
10. South Waziristan Tanneries at Jandola
December 1978
May 1982 11.151
Advertized in Newspapers but no response received 93
11.
South Waziristan Foot, Wear & Leather Goods Factory Jandola
October 1982
May 1985 10.386
Advertized in Newspapers but no response received 202
Nature of Industries in FATA
The major industrial production units in FATA are sporting and light hunting arms & ammunition, cloth sewing, mining especially coal & marble, candle making, and cement. Out of 1815 units surveyed, 1332 (73.39%) are manufacturing a variety of goods. The following graph (Figure - 1) indicates nature of industries in FATA. Table-2 and Table-3 in Annexure have detailed data.

Survey-Enumeration of Industries, Service Sector Entities, Labor Force and Identifying constraints in FATA
FATA Development Authority 25
Figure - 1
Major Goods produced in FATA Traditionally sporting and hunting arms is the major industry in FATA. Such industries usually consist of a few workers working at small scale often outside the main markets. These industries are located mainly in FR Kohat and Khyber agency. Other industries like cloth sewing, packing machines, flour mills, ice factories etc are established at very small scale, producing mainly for local consumption, although some of the production is also supplied to neighboring settled areas. The multiplicity of the industrial production units in FATA is shown in the Table-4 in Annexure. Size of the Industrial Units in FATA
The data in Table-5 illustrated in the graph (Figure – 2) below indicates that the majority of industry consists of small to medium size units. Out of 1815 industrial entities surveyed 1198 (66%) are small scale, 583 (32%) medium scale and 27 (2%) are large scale units. The lack of availability of credit facility, deteriorating law and order situation, frequent power shortages, non-availability of skilled labor and poor infrastructure are the main factors which has discouraged establishment of large scale manufacturing industries in the area.

Survey-Enumeration of Industries, Service Sector Entities, Labor Force and Identifying constraints in FATA
FATA Development Authority 26
Figure - 2
(As per SMEDA classification – annexure - A)
In spite of the fact that majority of the industrial units in FATA are labor intensive, industries fail to provide adequate job opportunities owing to their small size. Absence of economies of scale and lack of use of efficient production techniques in small units has often led to higher per unit cost leading to rapid increase in fixed cost, making products less competitive. With little skilled human resource base, large investment inside FATA faces a disincentive. This has historically led to large portions of populations, particularly youth, who are structurally unemployed as they do not have skills to match the little opportunities that were available. Productivity of Industrial Units in FATA The production capacity of the industrial units in FATA and their actual capacity as shown in the Tables-6 and Table-7 at Annexure indicates the restricted level of production activity in various sectors and retarded economic activity. Table-8 in Annexure indicates factors behind the low productivity. Limited availability of financial resources, unskilled workers, and primitive methods of production, bad law & order situation, outdated machinery, inconsistent supply of raw material & electricity and inability to market remain the main impediments in achieving total capacity utilization. Worsening law and order situation is also one of the main factors contributing to under utilization of the production capacity.
Survey-Enumeration of Industries, Service Sector Entities, Labor Force and Identifying constraints in FATA
FATA Development Authority 27
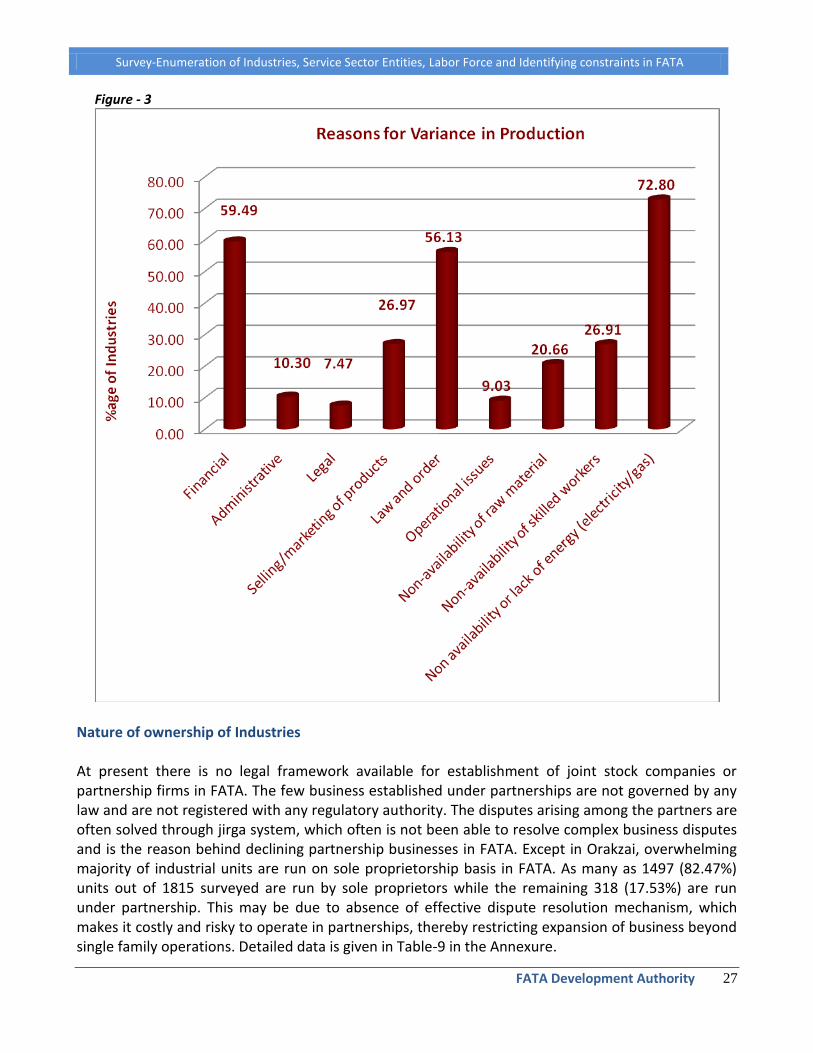
Figure - 3
Nature of ownership of Industries At present there is no legal framework available for establishment of joint stock companies or partnership firms in FATA. The few business established under partnerships are not governed by any law and are not registered with any regulatory authority. The disputes arising among the partners are often solved through jirga system, which often is not been able to resolve complex business disputes and is the reason behind declining partnership businesses in FATA. Except in Orakzai, overwhelming majority of industrial units are run on sole proprietorship basis in FATA. As many as 1497 (82.47%) units out of 1815 surveyed are run by sole proprietors while the remaining 318 (17.53%) are run under partnership. This may be due to absence of effective dispute resolution mechanism, which makes it costly and risky to operate in partnerships, thereby restricting expansion of business beyond single family operations. Detailed data is given in Table-9 in the Annexure.

Survey-Enumeration of Industries, Service Sector Entities, Labor Force and Identifying constraints in FATA
FATA Development Authority 28
Figure - 4
Sources of Finance
One of the other factors of smaller sizes of the industry run by single owners is lack of availability of credit facilities which are offered to industries elsewhere in the country through normal banking system. Hence, major source of financing business in FATA is personal investment or at the most borrowing from relatives and friends. As usually large amounts of money cannot be collected through such arrangements, this has been an impediment to economic activity. As shown in Table-10 and Table-11, a total of 1410 (81.60%) of the firms out of 1815 surveyed were financed by personal investment.
Figure - 5
(1)* Could not contact despite multiple attempts

Survey-Enumeration of Industries, Service Sector Entities, Labor Force and Identifying constraints in FATA
FATA Development Authority 29
Out of the meager loans facility available, majority of loans come from relatives and friends or private lenders. The obvious reason being banks are not able to lend in absence of Land Revenue Act, which is used as an instrument to mortgage assets elsewhere in the country. It is interesting to note yet difficult to explain that the survey has also been able to gather data from some respondents in FATA who have indicated being financed by banks—this may indicate loans availed on the basis of properties pledged in the settled areas, though the use of such funds in FATA may still be illegal.
Figure - 6
(2)* Loan from Bank obtained against collateral in settle areas
The data in Table-12 in Annexure and graphed (Figure–7) below indicates that majority of the people (90.68%) engaged in business activities in the area have had no relationship with banks. They either borrow funds from friends and relatives with no markup at all, or from private lenders on higher mark up rates as compared to the mark up charged by commercial banks. This high cost of lending is leading to a very high cost of doing business inside FATA.
Figure - 7

Survey-Enumeration of Industries, Service Sector Entities, Labor Force and Identifying constraints in FATA
FATA Development Authority 30
However, as banks do not extend loans in tribal areas, they are left with no choice but to make either personal arrangements including personal investment or loans from private lenders on high markup rates. The relevant data on mark up rates is given in Table-12 at Annexure.
Figure - 8
Proportion of personal capital (Capital Structure) The data shows that a large number of businesses i.e. as many as 1410 (77.69%) are run with 100% owner’s equity. Industrial owners in FATA do not have the ability to establish large scale industries with their investment alone. Table-14 and Table-15 in Annexure have the relevant details.
Figure - 9

Survey-Enumeration of Industries, Service Sector Entities, Labor Force and Identifying constraints in FATA
FATA Development Authority 31
Procedure adopted for Establishing Industries As indicated by the Table-16, majority (55.56%) of the businesses are established through consultations with the people already in business. In some cases (37.04%) feasibility studies have also been carried-out before starting the business. Nonetheless, considering the smaller size of the industry in FATA and in absence of any legal requirements, feasibility studies conducted often may not be of the required professional standard. The industrial activities in FATA are not diversified, which indicates that people have invested in businesses that they perceived successfully in the area, without giving attention to the viability of another firm joining a particular industry or opportunity cost of investing in a sector.
Figure - 10
Sources of Energy
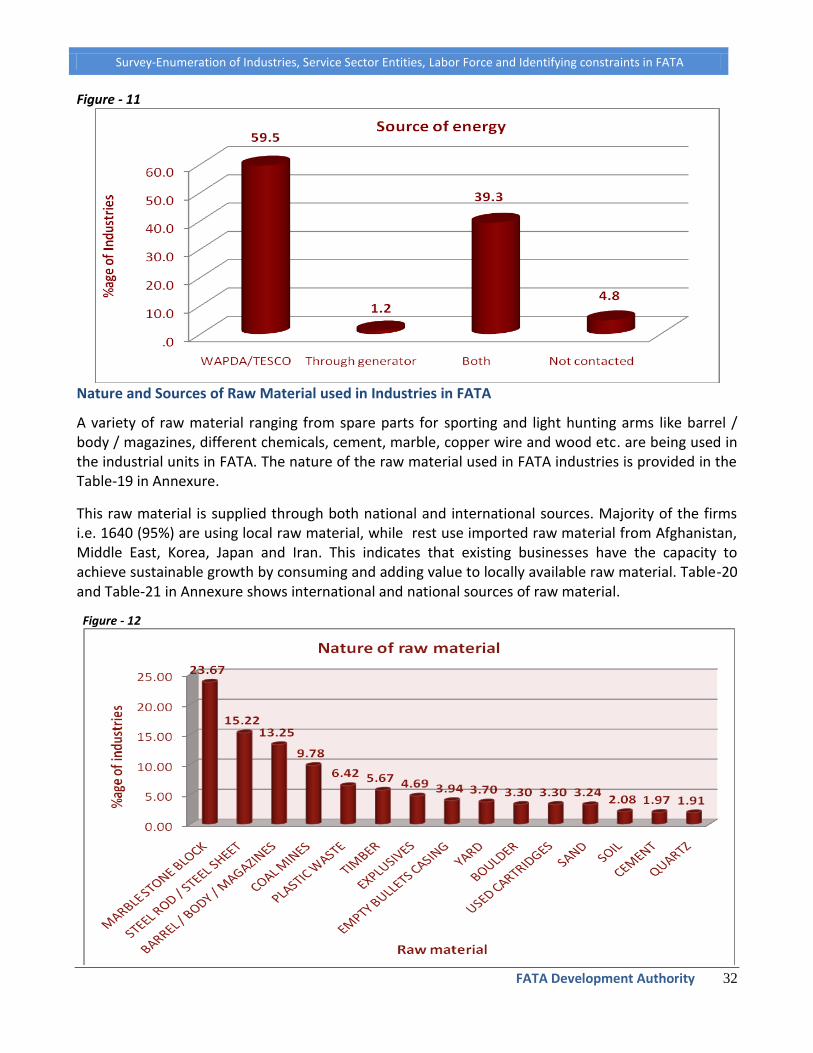
Major source of energy for industries in FATA is the electricity provided by WAPDA. Out of the 1815 units surveyed, 1028 (59.49%) are being run with the electricity provided by the WAPDA alone and 679 (39.29%) units with power acquired from both WAPDA and through self-operated generators. The industrial units in FATA often do not pay for electricity. However, the industrial units have yet to use this facility in their competitive advantage. The reason is frequent breakdowns of electricity and low voltage which has adversely affected their production capacity. Hence, availability of free electricity though initially contributed to rapid industrialization, its unavailability is presently serving as a huge disincentive. The data regarding ratio of electricity provided by WAPDA and other sources is also given in the Table-17 in Annexure.
Survey-Enumeration of Industries, Service Sector Entities, Labor Force and Identifying constraints in FATA
FATA Development Authority 32
Figure - 11
Nature and Sources of Raw Material used in Industries in FATA
A variety of raw material ranging from spare parts for sporting and light hunting arms like barrel / body / magazines, different chemicals, cement, marble, copper wire and wood etc. are being used in the industrial units in FATA. The nature of the raw material used in FATA industries is provided in the Table-19 in Annexure.
This raw material is supplied through both national and international sources. Majority of the firms i.e. 1640 (95%) are using local raw material, while rest use imported raw material from Afghanistan, Middle East, Korea, Japan and Iran. This indicates that existing businesses have the capacity to achieve sustainable growth by consuming and adding value to locally available raw material. Table-20 and Table-21 in Annexure shows international and national sources of raw material.
Figure - 12
Survey-Enumeration of Industries, Service Sector Entities, Labor Force and Identifying constraints in FATA
FATA Development Authority 33
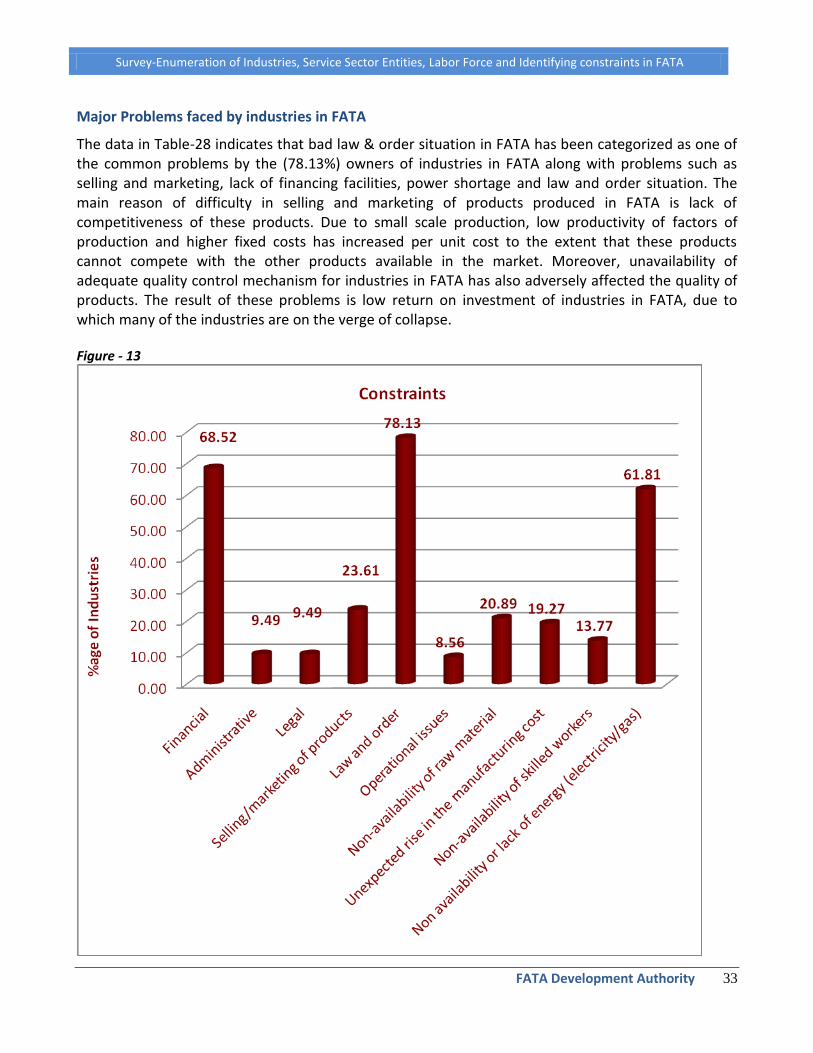
Major Problems faced by industries in FATA
The data in Table-28 indicates that bad law & order situation in FATA has been categorized as one of the common problems by the (78.13%) owners of industries in FATA along with problems such as selling and marketing, lack of financing facilities, power shortage and law and order situation. The main reason of difficulty in selling and marketing of products produced in FATA is lack of competitiveness of these products. Due to small scale production, low productivity of factors of production and higher fixed costs has increased per unit cost to the extent that these products cannot compete with the other products available in the market. Moreover, unavailability of adequate quality control mechanism for industries in FATA has also adversely affected the quality of products. The result of these problems is low return on investment of industries in FATA, due to which many of the industries are on the verge of collapse. Figure - 13
Survey-Enumeration of Industries, Service Sector Entities, Labor Force and Identifying constraints in FATA
FATA Development Authority 34
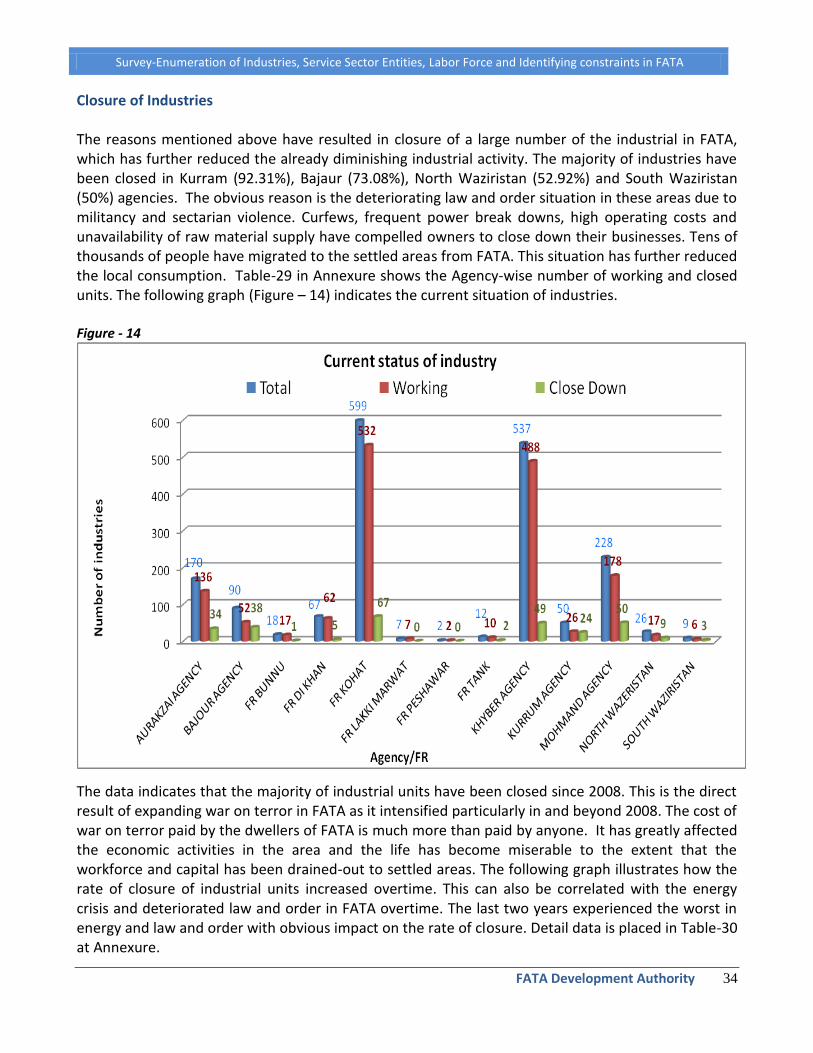
Closure of Industries The reasons mentioned above have resulted in closure of a large number of the industrial in FATA, which has further reduced the already diminishing industrial activity. The majority of industries have been closed in Kurram (92.31%), Bajaur (73.08%), North Waziristan (52.92%) and South Waziristan (50%) agencies. The obvious reason is the deteriorating law and order situation in these areas due to militancy and sectarian violence. Curfews, frequent power break downs, high operating costs and unavailability of raw material supply have compelled owners to close down their businesses. Tens of thousands of people have migrated to the settled areas from FATA. This situation has further reduced the local consumption. Table-29 in Annexure shows the Agency-wise number of working and closed units. The following graph (Figure – 14) indicates the current situation of industries. Figure - 14
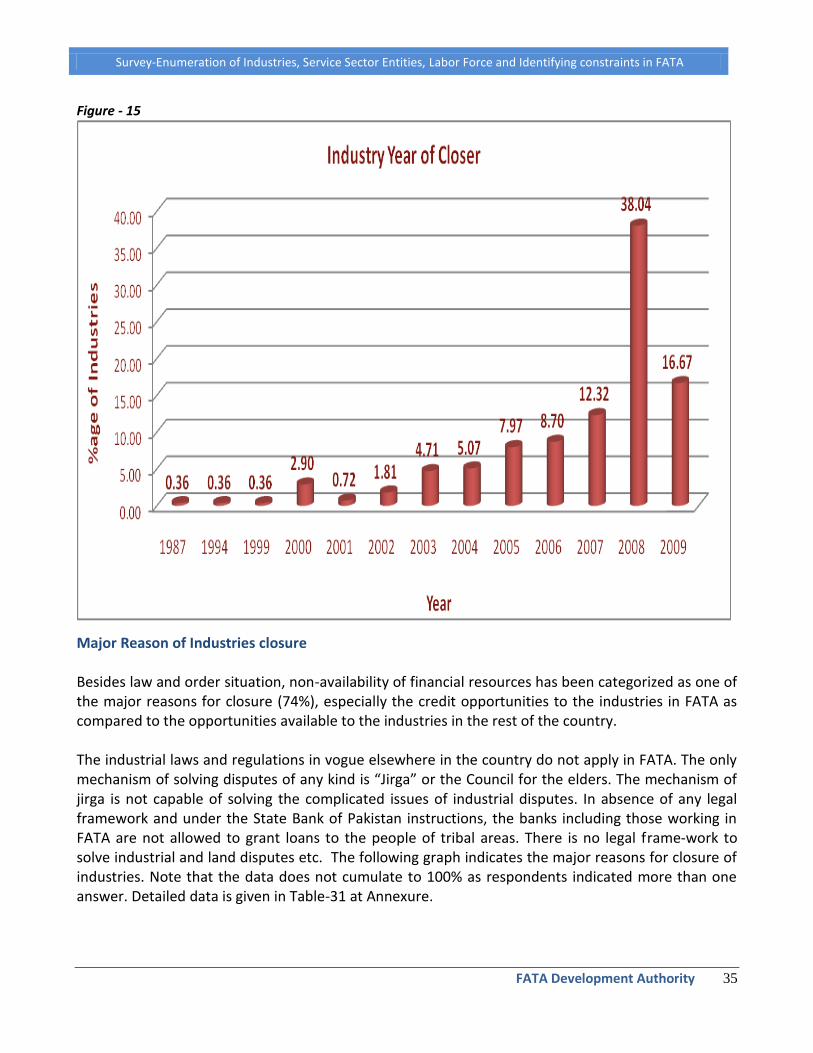
The data indicates that the majority of industrial units have been closed since 2008. This is the direct result of expanding war on terror in FATA as it intensified particularly in and beyond 2008. The cost of war on terror paid by the dwellers of FATA is much more than paid by anyone. It has greatly affected the economic activities in the area and the life has become miserable to the extent that the workforce and capital has been drained-out to settled areas. The following graph illustrates how the rate of closure of industrial units increased overtime. This can also be correlated with the energy crisis and deteriorated law and order in FATA overtime. The last two years experienced the worst in energy and law and order with obvious impact on the rate of closure. Detail data is placed in Table-30 at Annexure.
Survey-Enumeration of Industries, Service Sector Entities, Labor Force and Identifying constraints in FATA
FATA Development Authority 35
Figure - 15
Major Reason of Industries closure Besides law and order situation, non-availability of financial resources has been categorized as one of the major reasons for closure (74%), especially the credit opportunities to the industries in FATA as compared to the opportunities available to the industries in the rest of the country. The industrial laws and regulations in vogue elsewhere in the country do not apply in FATA. The only mechanism of solving disputes of any kind is “Jirga” or the Council for the elders. The mechanism of jirga is not capable of solving the complicated issues of industrial disputes. In absence of any legal framework and under the State Bank of Pakistan instructions, the banks including those working in FATA are not allowed to grant loans to the people of tribal areas. There is no legal frame-work to solve industrial and land disputes etc. The following graph indicates the major reasons for closure of industries. Note that the data does not cumulate to 100% as respondents indicated more than one answer. Detailed data is given in Table-31 at Annexure.

Survey-Enumeration of Industries, Service Sector Entities, Labor Force and Identifying constraints in FATA
FATA Development Authority 36
Figure - 16
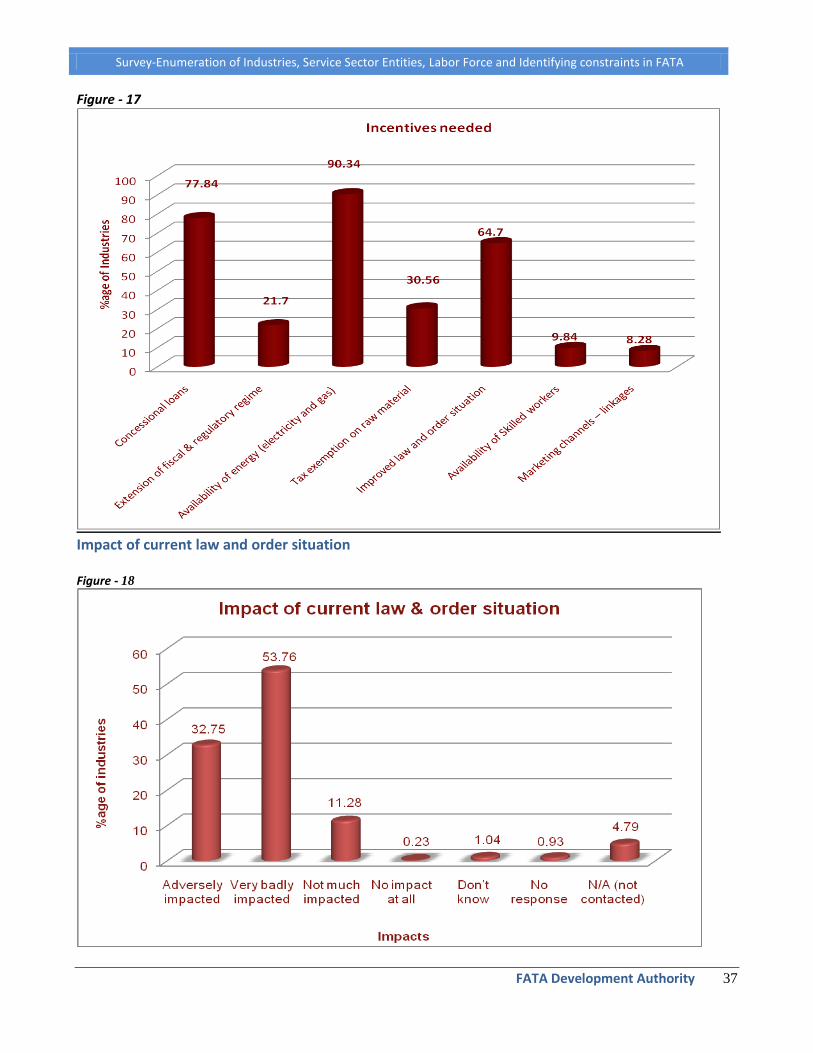
Incentives Demanded By the Industries in FATA The following table and graph (Figure – 17) gives an idea of the type of incentives demanded by the owners of industrial units in FATA. Majority demanded concessional loans, availability of consistent energy at low cost and better law and order situation.
Incentives needed Frequency Percent
Concessional loans 1345 77.84
Extension of fiscal & regulatory regime 375 21.70
Availability of energy (electricity and gas) 1561 90.34
Tax exemption on raw material 528 30.56
Improved law and order situation 1118 64.70
Availability of Skilled workers 170 9.84
Marketing channels – linkages 143 8.28
Survey-Enumeration of Industries, Service Sector Entities, Labor Force and Identifying constraints in FATA
FATA Development Authority 37
Figure - 17
Impact of current law and order situation Figure - 18
Survey-Enumeration of Industries, Service Sector Entities, Labor Force and Identifying constraints in FATA
FATA Development Authority 38
SERVICE SECTOR IN FATA
History of the Establishment of Services Sector in FATA
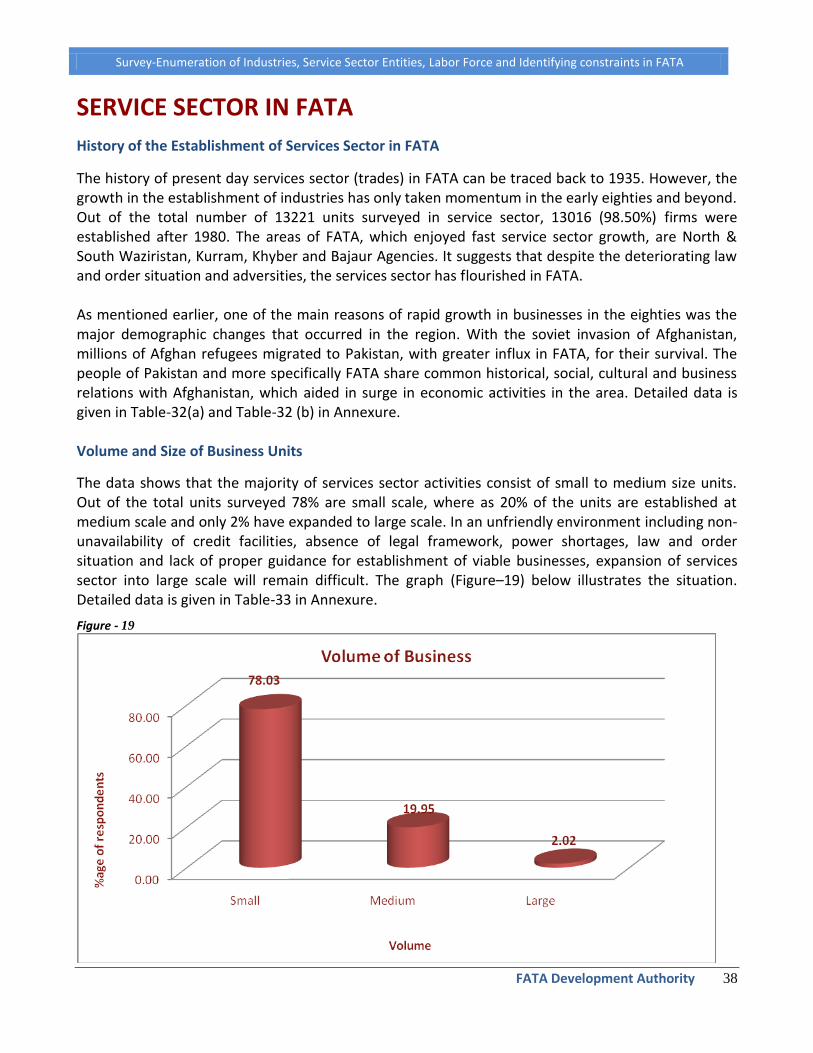
The history of present day services sector (trades) in FATA can be traced back to 1935. However, the growth in the establishment of industries has only taken momentum in the early eighties and beyond. Out of the total number of 13221 units surveyed in service sector, 13016 (98.50%) firms were established after 1980. The areas of FATA, which enjoyed fast service sector growth, are North & South Waziristan, Kurram, Khyber and Bajaur Agencies. It suggests that despite the deteriorating law and order situation and adversities, the services sector has flourished in FATA. As mentioned earlier, one of the main reasons of rapid growth in businesses in the eighties was the major demographic changes that occurred in the region. With the soviet invasion of Afghanistan, millions of Afghan refugees migrated to Pakistan, with greater influx in FATA, for their survival. The people of Pakistan and more specifically FATA share common historical, social, cultural and business relations with Afghanistan, which aided in surge in economic activities in the area. Detailed data is given in Table-32(a) and Table-32 (b) in Annexure. Volume and Size of Business Units
The data shows that the majority of services sector activities consist of small to medium size units. Out of the total units surveyed 78% are small scale, where as 20% of the units are established at medium scale and only 2% have expanded to large scale. In an unfriendly environment including non-unavailability of credit facilities, absence of legal framework, power shortages, law and order situation and lack of proper guidance for establishment of viable businesses, expansion of services sector into large scale will remain difficult. The graph (Figure–19) below illustrates the situation. Detailed data is given in Table-33 in Annexure.
Figure - 19
Survey-Enumeration of Industries, Service Sector Entities, Labor Force and Identifying constraints in FATA
FATA Development Authority 39
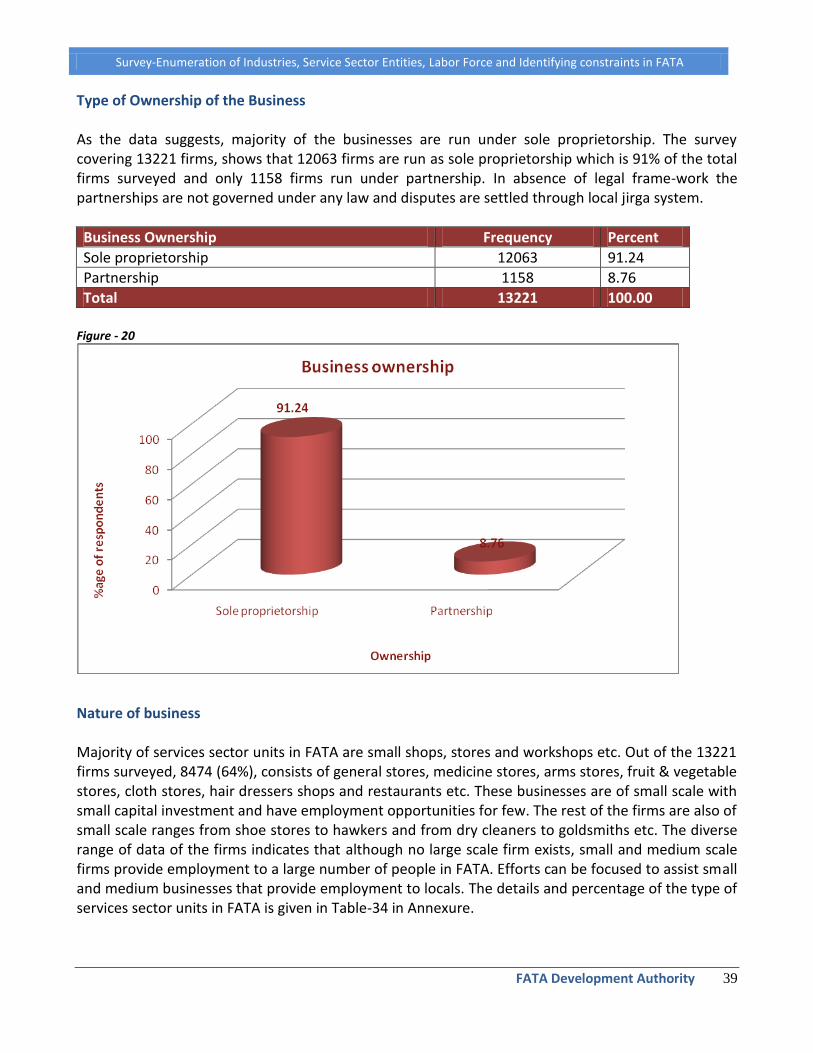
Type of Ownership of the Business As the data suggests, majority of the businesses are run under sole proprietorship. The survey covering 13221 firms, shows that 12063 firms are run as sole proprietorship which is 91% of the total firms surveyed and only 1158 firms run under partnership. In absence of legal frame-work the partnerships are not governed under any law and disputes are settled through local jirga system.
Business Ownership Frequency Percent
Sole proprietorship 12063 91.24
Partnership 1158 8.76
Total 13221 100.00
Figure - 20
Nature of business Majority of services sector units in FATA are small shops, stores and workshops etc. Out of the 13221 firms surveyed, 8474 (64%), consists of general stores, medicine stores, arms stores, fruit & vegetable stores, cloth stores, hair dressers shops and restaurants etc. These businesses are of small scale with small capital investment and have employment opportunities for few. The rest of the firms are also of small scale ranges from shoe stores to hawkers and from dry cleaners to goldsmiths etc. The diverse range of data of the firms indicates that although no large scale firm exists, small and medium scale firms provide employment to a large number of people in FATA. Efforts can be focused to assist small and medium businesses that provide employment to locals. The details and percentage of the type of services sector units in FATA is given in Table-34 in Annexure.

Survey-Enumeration of Industries, Service Sector Entities, Labor Force and Identifying constraints in FATA
FATA Development Authority 40
Sources of Finance The data reflects that 76.89% of the businesses are financed from personal sources. The percentage of loan is as low as 1%. This phenomenon indicates that majority of the businesses are established with little capital, as large business cannot be established with personal investment alone. It also indicates that credit facilities are not available to the services sector in FATA as available to the services sector elsewhere in Pakistan. Figure - 21
Out of the 1% loan availed by the businesses, the majority (i.e. 99.61%) of the loan amount came from private lenders, friends and relatives. A negligible amount (i.e. 0.23%) came from banks, which again is interesting and might indicate bank advances to persons rather than businesses and in settled areas.
The negligible contribution of banks is due to the fact that the businesses in FATA are not governed under any law, nor is any sort of regulatory legal framework in place. This makes it impossible for banks to finance businesses in FATA. Since many of the businesses are small and medium in nature, specific credit facilities including micro finance can be a solution in this regard to a variety of businesses. Detail data is given in Table-35 (a) to Table-35 (d). The Banks can be allowed to develop separate lending mechanisms, even with collaterals in settled areas to assist in lending. Small businesses can be supported through community guarantees. The data given in Table-36(a) Annexure, confirm the earlier view that banks have little relationship with the businesses in FATA. 94.30% of the businesses have had little to do with banks. Banks have nothing to offer to businesses in FATA as firms cannot offer any collateral to banks to qualify for loans given the existing range of products with the banks. Although majority of the personally availed loans (99.67%) carry 0% mark up, the amount of such loans are insufficient and do not satisfy the requirement of funds for the business. These loans are usually generated from relatives and friends. Detail is given at Table-36 (b) in Annexure.

Survey-Enumeration of Industries, Service Sector Entities, Labor Force and Identifying constraints in FATA
FATA Development Authority 41
Figure - 22
Figure - 23
99.67% busineses do not pay any mark up, while the rest pay less than 1% of annual mark up. Procedure adopted for establishment of Business The data suggests that majority almost (51%) of the businesses are established through consultation with the people already in business. Feasibilities studies have also been carried-out by 32.89% before investing in the business. The services sector in FATA is not diversified and firms are working on a small scale, which suggests that people start business of the kind already established in the area without giving attention of the viability of another firm joining the sector. Such practice increases risks as investment are not adequately planned and discourages efficiency business growth. Nonetheless, consultations play a large part in decision making. Detailed data is given in Table-37 in Annexure.

Survey-Enumeration of Industries, Service Sector Entities, Labor Force and Identifying constraints in FATA
FATA Development Authority 42
Figure - 24
Sources of Energy Major source of energy (89.27%) for service sector in FATA is the electricity provided by the WAPDA which is not paid. The frequent breakdowns of electricity and low voltage do not allow these businesses to provide competitive services. Detail data is given in Table-38 (a) and Table-38 (b) in Annexure. Figure - 25

Survey-Enumeration of Industries, Service Sector Entities, Labor Force and Identifying constraints in FATA
FATA Development Authority 43
Nature of Goods and Services of the Services Sector in FATA The data shows that services sector in FATA consists of small units like arms shops, retail stores, cloth stores, medicine and shoe stores, restaurants and hair salon etc. The business scattered across FATA with concentration of arms shop in FR Kohat (Darra Adam Khel) and Khyber Agency (Bara). The diversity of goods and services provided by the service sector of FATA is given in Table-39 in Annexure.
Figure - 26
Source of goods and raw material used in Service Sector of FATA The sources of the majority of raw material used in the service sector located in FATA are from within FATA. Some of the raw material is supplied from across the country and from abroad like Afghanistan, China, Middle East, Kenya (Tea) etc. The limited service sector does not allow full utilization of locally available raw material. Hence, most of the raw material is transported out of FATA for processing in settled areas. It is particularly important in terms of drain of local wealth from FATA. Details of foreign and local sources are given at Table-40 (a) and Table-40 (b) in Annexure.

Survey-Enumeration of Industries, Service Sector Entities, Labor Force and Identifying constraints in FATA
FATA Development Authority 44
Figure - 27
Figure - 28

Survey-Enumeration of Industries, Service Sector Entities, Labor Force and Identifying constraints in FATA
FATA Development Authority 45
Major Problems faced by businesses in FATA Law and order situation of FATA has been categorized as one of the major problems by entrepreneurs in FATA along with problems of financing facilities and selling & marketing of the products. Moreover, non-availability of proper quality control systems for businesses in FATA has also adversely affected the quality of products. Detail is given in Table-46 in Annexure.
Figure - 29

Survey-Enumeration of Industries, Service Sector Entities, Labor Force and Identifying constraints in FATA
FATA Development Authority 46
Incentives, facilities and priorities Businessmen perceived that a variety of factors will contribute to success. These include concessional loans, extension of industrial laws and regulations, availability of energy, tax/duties exemption on import of raw material, better law and order and availability of skilled workers. Specific incentives are needed with adequate credit facilities as per need of locals in various sectors. It can be noted that although when indicating problems, selling and marketing formed a problem for a very high (56%) in the industries, through in the service sector it has not been prioritized as such. The following graph illustrates the incentives demanded by the firms surveyed. Detail data is given in Table-47 in Annexure.
Figure - 30

Survey-Enumeration of Industries, Service Sector Entities, Labor Force and Identifying constraints in FATA
FATA Development Authority 47
Level of Satisfaction of businessmen in FATA The following data reflects that due to low returns on investment 67.55% of the business owners are satisfied only to some extent with their businesses. 10.76% have indicated total dissatisfaction, while 19.39% have indicated satisfaction and 1.30% have indicated high satisfaction levels.
Satisfied with Business Frequency Percent
Not satisfied 1423 10.76
To some extent satisfied 9063 68.55
Satisfied 2563 19.39
Very much satisfied 172 1.30
Total 13221
Figure - 31
Consequences of the Present Law and Order Situation on the Businesses The data indicates that the major reason of failure of the business activities in FATA has been identified as worsening law and order situation, which has negatively affected more than 90% of the businesses. Until improvement in law and order situation cannot be improved on permanent basis, this will continue to affect the business environment. The level of negative impact of the law and order situation on businesses in FATA is given in Table-48(a) and Table-48(b).

Survey-Enumeration of Industries, Service Sector Entities, Labor Force and Identifying constraints in FATA
FATA Development Authority 48
Figure - 32
Figure - 33
Documentation and registration of the Busincess
The following data indicates that majority of the business are neither registered with any government authority nor keep documentation. As businesses are not governed under any law or regulation, there is tendency not to document affairs of the business. In absence of any regulatory framework, provision of incentives to such business can be risky. Prior to provision of any incentive, the already

Survey-Enumeration of Industries, Service Sector Entities, Labor Force and Identifying constraints in FATA
FATA Development Authority 49
established businesses should be provided regulatory environment by extending registrations even through existing political set-ups.
Registration with any Government Authority Frequency Percent
Yes 1186 8.97
No 12035 91.03
Total 13221
Figure - 34
Documented Frequency Percent
Yes 4545 34.38
No 8676 65.62
Total 13221
Figure - 35

Survey-Enumeration of Industries, Service Sector Entities, Labor Force and Identifying constraints in FATA
FATA Development Authority 50
SITUATION OF LABOUR FORCE IN FATA
A considerable portion of the labor force of FATA is employed in settled areas across the country and abroad especially in the Middle East. The workforce of FATA employed abroad are not only earning livelihood for their families but earn vital foreign exchange for the country. The survey however targeted Labor force working inside FATA in the Industrial and Service sectors. The following analysis shows the poor status of the labor force and working conditions in FATA.
Labour Force in the Industrial Sector of FATA
Although majority of industries recruit workers, the percentage of recruitment of skilled workers is very low. Given the level of industrialization, the level of skill of skilled workers is rudimentary and indicated in training and education levels. Some of the reasons of the low level of employment of skilled workers are lack of availability of technical training institutions, infrastructure, non-availability of professional faculty, and low enrollment in technical training centers. All these factors have contributed to high portions of structural unemployment in FATA as the existing workers find themselves increasingly irrelevant to the demands of little available job market.
Detail of skilled and unskilled workers employed in the industries in FATA is given in Table-22 and Table-23 in Annexure. The data of workers’ origin suggests that workers in FATA belong to different parts of the country. A considerable number of workers (35.04%) do not belong to FATA.
Enhancement of skills of local workers through specialized technical training courses will enable the local workforce to find jobs in their respective agencies, besides inducing investment and entrepreneurial activities. The number of local and non-local workers and their area of origin are given in Table-26 (a) and Table-26(b) in Annexure.
Percentage of Industries Recruiting Workers
Recruiting workers Frequency Percent
Yes 1727 99.94
No 1 0.06
N/A (not contacted) 87 4.79
Total 1815
Figure - 36
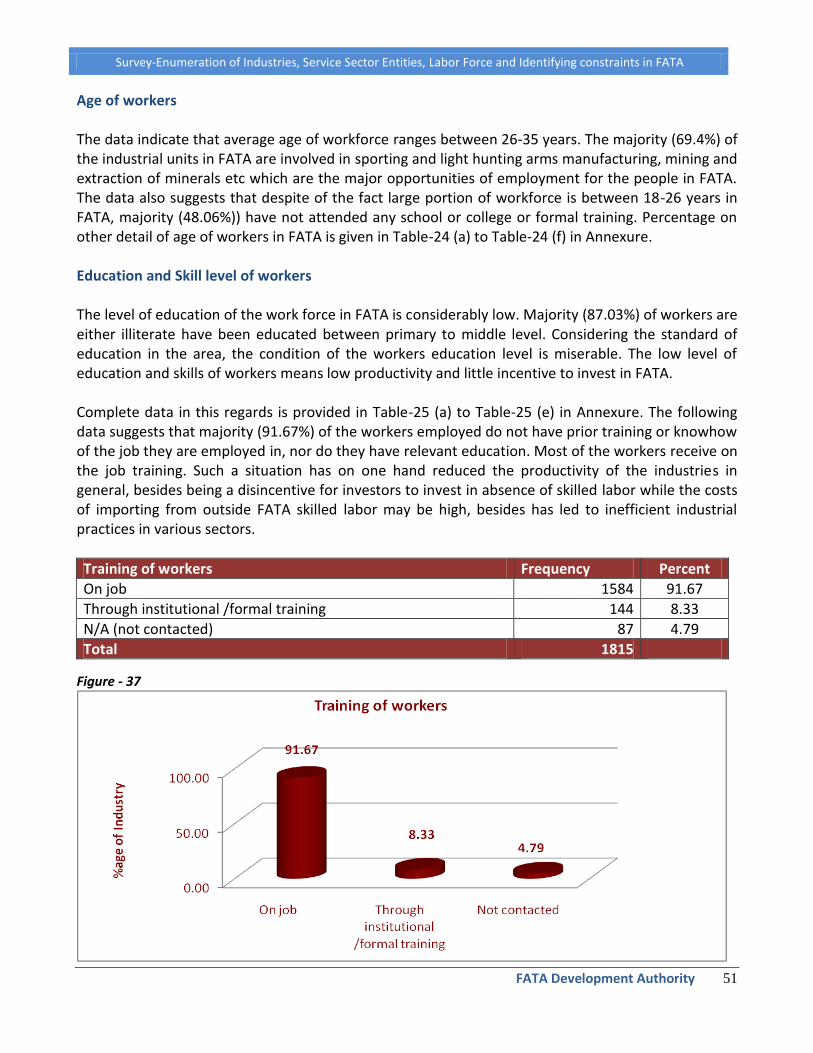
Survey-Enumeration of Industries, Service Sector Entities, Labor Force and Identifying constraints in FATA
FATA Development Authority 51
Age of workers The data indicate that average age of workforce ranges between 26-35 years. The majority (69.4%) of the industrial units in FATA are involved in sporting and light hunting arms manufacturing, mining and extraction of minerals etc which are the major opportunities of employment for the people in FATA. The data also suggests that despite of the fact large portion of workforce is between 18-26 years in FATA, majority (48.06%)) have not attended any school or college or formal training. Percentage on other detail of age of workers in FATA is given in Table-24 (a) to Table-24 (f) in Annexure. Education and Skill level of workers The level of education of the work force in FATA is considerably low. Majority (87.03%) of workers are either illiterate have been educated between primary to middle level. Considering the standard of education in the area, the condition of the workers education level is miserable. The low level of education and skills of workers means low productivity and little incentive to invest in FATA. Complete data in this regards is provided in Table-25 (a) to Table-25 (e) in Annexure. The following data suggests that majority (91.67%) of the workers employed do not have prior training or knowhow of the job they are employed in, nor do they have relevant education. Most of the workers receive on the job training. Such a situation has on one hand reduced the productivity of the industries in general, besides being a disincentive for investors to invest in absence of skilled labor while the costs of importing from outside FATA skilled labor may be high, besides has led to inefficient industrial practices in various sectors.
Training of workers Frequency Percent
On job 1584 91.67
Through institutional /formal training 144 8.33
N/A (not contacted) 87 4.79
Total 1815
Figure - 37

Survey-Enumeration of Industries, Service Sector Entities, Labor Force and Identifying constraints in FATA
FATA Development Authority 52
Working Conditions and Salaries in Industries in FATA The majority (59.89%) of industrial units work on a single shift basis. A few industries (41.31%) conduct second shift of mostly 8 hours. Less working hours and less number of shifts indicate the reasons for under utilization of capacity in the industry. The lesser number of shifts and working hours are mainly due to deteriorating law and order situation, inconsistent power supply and an inconsistent supply of raw material which has resulted in lower operational levels. Figure - 38
Figure - 39
The data suggests that majority (49.03%) of workers receive salary in the range of Rs. 2,000/-Rs. 5,000/- per month, which is below the national minimum wage. The low level salaries are again a result of low level skills of workers. The education and skill level of workers is very low. Table-27 (a) to Table-27(c) provides complete data in this regard.
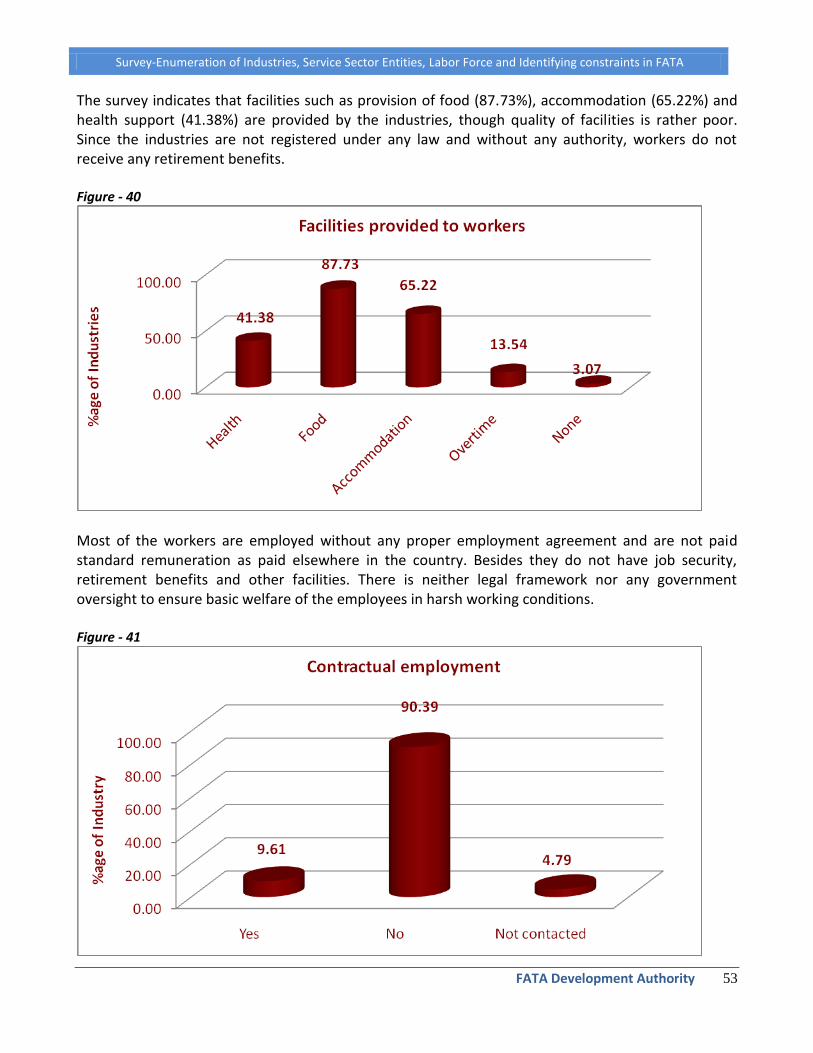
Survey-Enumeration of Industries, Service Sector Entities, Labor Force and Identifying constraints in FATA
FATA Development Authority 53
The survey indicates that facilities such as provision of food (87.73%), accommodation (65.22%) and health support (41.38%) are provided by the industries, though quality of facilities is rather poor. Since the industries are not registered under any law and without any authority, workers do not receive any retirement benefits. Figure - 40
Most of the workers are employed without any proper employment agreement and are not paid standard remuneration as paid elsewhere in the country. Besides they do not have job security, retirement benefits and other facilities. There is neither legal framework nor any government oversight to ensure basic welfare of the employees in harsh working conditions. Figure - 41
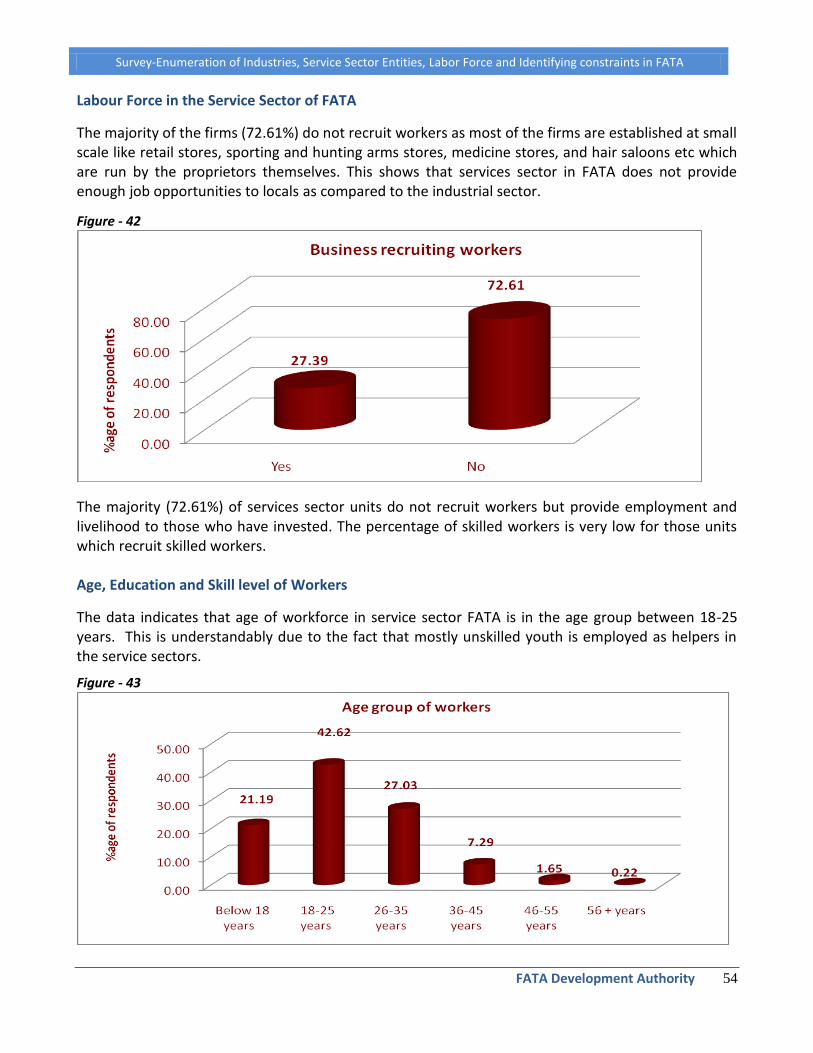
Survey-Enumeration of Industries, Service Sector Entities, Labor Force and Identifying constraints in FATA
FATA Development Authority 54
Labour Force in the Service Sector of FATA
The majority of the firms (72.61%) do not recruit workers as most of the firms are established at small scale like retail stores, sporting and hunting arms stores, medicine stores, and hair saloons etc which are run by the proprietors themselves. This shows that services sector in FATA does not provide enough job opportunities to locals as compared to the industrial sector.
Figure - 42
The majority (72.61%) of services sector units do not recruit workers but provide employment and livelihood to those who have invested. The percentage of skilled workers is very low for those units which recruit skilled workers. Age, Education and Skill level of Workers
The data indicates that age of workforce in service sector FATA is in the age group between 18-25 years. This is understandably due to the fact that mostly unskilled youth is employed as helpers in the service sectors.
Figure - 43

Survey-Enumeration of Industries, Service Sector Entities, Labor Force and Identifying constraints in FATA
FATA Development Authority 55
The data also indicates that a large number of workers below 18 years in FATA are engaged in services sector which also gives an indication that this group has either dropped out of schools or technical education, or has never attended any. Majority of the workers (47%) are illiterate and the rest have the bare minimum of education with some (12.07%) up to the level of matriculation (10th Grade). Many have also dropped out at the primary (16.61%) and middle (15.45%) levels. Some have also attained higher education like Masters 2% and Bachelors 5.3%. Only less than 1% workers have attained education in madrassas.
Figure - 44
Almost 92% of the workers have no skills when they started working and received on the job training. Detailed data regarding age, education and skill level of workers is given in Table-41 (a) to Table-41(f).
Figure - 45

Survey-Enumeration of Industries, Service Sector Entities, Labor Force and Identifying constraints in FATA
FATA Development Authority 56
Working Conditions The majority of businesses work on one shift basis. A few businesses conduct second shift of mostly 8 hours. The less number of shifts and working hours are mainly due to law and order situation, non-availability of consistent power supply, uneven supply of raw material and low demand for local products. Detail data is given in Table-42 (a) and Table-42-(b) in Annexure. Figure - 46
Figure - 47
Salary Range The table-42 (c) indicates that majority of workers receive salary in the range of Rs. 2,000/- Rs. 5,000/- a month, which indicates the level of business operations and little available opportunities,

Survey-Enumeration of Industries, Service Sector Entities, Labor Force and Identifying constraints in FATA
FATA Development Authority 57
which have resulted in a wage rate which is below the national minimum wage rate. The education and skills level of workers is very low which is reflected in earning below the usual wage rates. Origin of Workers
The data of the workers’ origin indicates that workers in FATA belong to different parts of the Khyber Pakhtunkhwa and other parts of the country. A large number of workers belong to FATA as almost all businesses are run by the proprietor himself who in most cases belong to FATA. The number of local and non-local workers in the services sector of FATA is given in Table-43(a) and Table-43 (b) in Annexure.
Facilities/Incentives Provided to Workers Facilities such as provision of food, accommodation and health are provided to workers in the service sector. However, the quality of such facilities is poor. Since the industrial units are not registered under any law with any regulatory authority, workers do not get retirement benefits. Detailed data of the facilities provided to workers is given in Table-44 in Annexure. Figure - 48
Most of the workers are not working under legal employment agreement. Hence, they are not paid standard remuneration as paid elsewhere in the country. The workers also do not enjoy job security. Their employment depends upon willingness of the employer. There is neither any legal framework nor any government oversight to ensure basic welfare needs of the employees. This situation reflects harsh working conditions for the employees.
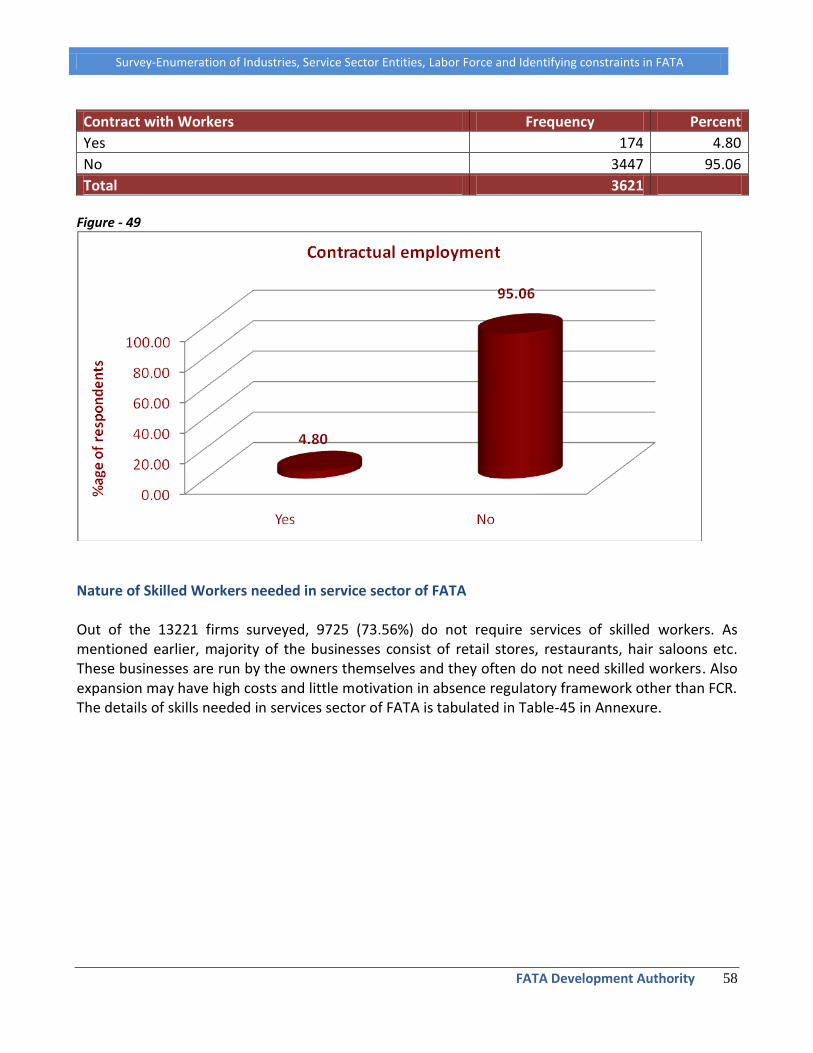
Survey-Enumeration of Industries, Service Sector Entities, Labor Force and Identifying constraints in FATA
FATA Development Authority 58
Contract with Workers Frequency Percent
Yes 174 4.80
No 3447 95.06
Total 3621 Figure - 49
Nature of Skilled Workers needed in service sector of FATA Out of the 13221 firms surveyed, 9725 (73.56%) do not require services of skilled workers. As mentioned earlier, majority of the businesses consist of retail stores, restaurants, hair saloons etc. These businesses are run by the owners themselves and they often do not need skilled workers. Also expansion may have high costs and little motivation in absence regulatory framework other than FCR. The details of skills needed in services sector of FATA is tabulated in Table-45 in Annexure.
Survey-Enumeration of Industries, Service Sector Entities, Labor Force and Identifying constraints in FATA
FATA Development Authority 59
Way Forward
Pakistan’s rankings in the Global Competitiveness Report (GCR) fell from 83rd in 2007 to 101st place in 2009 among 134 countriesii. This puts the situation of FATA in true perspective, which has remained one of the most neglected areas in Pakistan, and where the socio-economic indicators are at the lowest. The situation in FATA cannot be addressed in isolation as any standalone intervention is likely to go waste Massive reforms are needed on all fronts to bring a turnaround in the lives of the People of FATA. The suggestions in this report are based on findings of the survey and a series of consultations with tradesmen and businessmen from FATA. Although, the specific recommendations below list political, legal and economic reforms separately, all measures collectively are focused on greater economic development of FATA.
1. Economic Reforms The economic measures to be taken for the development of industrial and service sectors in FATA are highly interlinked with political and legal reforms in FATA. Given the present scenario, economic measures alone will not be effective. The following economic measures are suggested, based on the problems identified in the survey.
a. Identification of areas with rich natural resources An extensive survey is needed in FATA to identify the potential of natural resources available in the area. The survey will help identify particular areas with rich potential and type of natural resources. Out of 178 industrial units, 148 were coal mining firms (Table-3 in Annexure of the survey). The future survey should also identify the potential of hydroelectricity generation and coal, gas and oil reserves in FATA to provide cheap energy resources for local consumption. For this purpose, specific survey initiatives should be led by FATA Development Authority on a regular basis. A comprehensive database should be developed based on an authentic data regarding mineral deposits and other natural resources of FATA for better planning. This should be widely distributed and assist in reaching out to prospective investors.
b. Development of infrastructure and provision of technical assistance Once identified with rich natural resources, infrastructure such as roads, health, education and training facilities in these areas should be developed for extraction, processing, and marketing of natural resources in an efficient manner. Necessary government support and ensuring enabling environment, such as easy and cheap loans, one-window-operations3 for investors, adequate security arrangements, consistent and energy supply etc should be provided to develop the area, encouraging greater investment from private sectors that promise growth and opportunities.
3 A efficient mechanism implemented at Export Promotion Zones in settled area of Pakistan to assist investors access facilities as electricity, gas, loans
and others through a government assisted one-window operation, to save time and efforts.

Survey-Enumeration of Industries, Service Sector Entities, Labor Force and Identifying constraints in FATA
FATA Development Authority 60
There are unexplored avenues in marble sector where government can take the initial step of providing superior technical expertise and extraction and processing, besides providing training opportunities to make use of waste marble—a case in point here can be investment with greater focus on training opportunities also in marble Mosaic art4 where applicable. Similarly, provision of technical assistance to the gun manufacturing industry may be a challenge as production, though of compatible quality, is essentially illegal as the industry mostly produces replicas of various well known regional and international brands of arms and ammunition. The gun manufacturing industry in the Dera Adam Khel areas of FATA is essentially a cluster. This industry employs more than 10,000 people working in the small arms factories manufacturing Nuts, bolts, triggers, rifle butts and barrels and a variety of ammunition are manufactured in small units.iii The government can provide technical assistance in terms of licensing business besides providing modern training in manufacturing and ensuring access to finance and latest equipment, hence making the industry produce at least legally accepted and regionally competitive even for exports at a later stage. Implementing these steps is expected to ensure a cumulative causation5 that would positively affect host of industries attached both vertically and horizontally to marble, gun manufacturing and coal extraction industries, creating greater benefits for the people of FATA.
c. Encouraging use of cluster-based approaches for efficient economic development in marble, coal and minerals and gun manufacturing industries
Encouraging clustering approaches is very relevant to a number of business sectors such as marble, gun manufacturing, and coal extraction in FATA. A business cluster is a geographic concentration of interconnected businesses, suppliers, and associated institutions in a particular field. Clusters are considered to increase productivity with which companies can compete, nationally and globally.iv Clustering also creates synergies and complementarities and produce externalities from co-location and scale economies. The clusters generate interrelated economic activities due to various reasons such as presence of the unique natural resources in the area, proximity to markets, availability of cheap labor in the area, and may be due to special incentives with an aim to develop particular sector at certain geographic location for example tax holidays, cheap loans, subsidies etc. Although, clusters are often formed on their own, government can nonetheless encourage formation or extension of clusters by providing incentives in industrial estates and manufacturing zones for new industries. Cluster based approach for industrial development has special importance and utility in case of some industries in FATA. Development of industries in FATA in clusters and special industrial
4 Pakistan Stone Development Company (PESDEC) has used this to great success in some areas by providing training to women and can be replicated in
the tribal areas with little investment as the raw material is in abundance. 5 Cumulative Causation is defined as of the nature of the positive feedback that can lead to self-reinforcing growth or
stagnation. http://www.pkarchive.org/theory/dishpan1.html
Survey-Enumeration of Industries, Service Sector Entities, Labor Force and Identifying constraints in FATA
FATA Development Authority 61
zones with interrelated industries at the same geographic location at an appropriate place, in proximity to the extraction point of natural resources, like the proposed “Marble City” in Mohmand agency would be an appropriate option for FATA. This should be adopted as a best practice for other industries, which can then encourage the development of more cottage industries base inside FATA. Such clusters could easily then have all the facilities like special credit arrangements, health education, targeted training and business guidance facilities, industrial machinery repair work shops, concerned government agencies, special security arrangements, better market access through development of road networks for such clusters, and local arrangements for power generations. Clusters will provide opportunities for establishment of profitable business in FATA in at least the sectors identified. These can include:-
Better and manageable security arrangements due to existence of all the industries in same area;
Local production of energy with low distribution cost;
Increased competitiveness of the products due the following reasons; o Reduced Transaction costs; o Reduced transportation cost as the industries will be located in the same geographical
location; o Availability of required skilled workers due to the targeted training facilities in the
areas; o Reduced cost of doing business;
Cluster will provide better and increased job opportunities for the locals;
Concentration of interrelated industries at one place with better training facilities will provide an opportunity to develop more skilled work force in the area;
The attained skills will increase the productivity of the workers and hence, salaries and wages;
Due to increased competition for workers, the working environment will improve considerably.
d. Access to Finance for the Industries in FATA
Monetary and financial policy plays a major direct and indirect role in governmental efforts designed to expand economic activity in times of unemploymentv. Despite significant growth of Pakistan’s financial system, access to finance remains elusive for most Pakistanis, especially for poor people, women, and small businesses in rural areasvi—the situation is worse in FATA. Normal bank lending operations are not allowed in the tribal areasvii. In absence of legal framework, commercial banks cannot extend loans to businesses in FATA. As extension of land revenue laws might take time, government can develop financial instruments which can allow credit facilities to tribal businessmen through personal guarantees and mortgage of property if any in the settled areas of Pakistan. Data indicates that large numbers of small and medium businesses in the service sectors are to an extent satisfied, while also indicating increasing level of satisfaction in many cases. Similarly, small scale businesses have indicated the highest need for financial assistance. Likewise, finance and assistance should be focused more on sectors that need it the most and contribute by employing the highest percentage of workforce.

Survey-Enumeration of Industries, Service Sector Entities, Labor Force and Identifying constraints in FATA
FATA Development Authority 62
This will address one of the main constraints indicated by the businessmen in FATA and will assist them to have relatively easy access to finance which can then be used in purchase of raw material, payments of wages, or used as working capital.
e. Compensations for the Industries affected by the law and order situation The majority of the industries and service sector units in FATA have been badly affected by the law and order situation in the areaviii. As the survey indicates, most of the industries in FATA are established with personal capital and have to be compensated for the losses suffered due to the law and order situation. This will help them resurrect again on sound footings besides inducing greater private investment as investor confidence increases. One mechanism to assess losses can be establishment of a guardian committee with representatives from all sectors and areas. However, in the long run, insurance companies should be encouraged to expand operations through innovative products inside FATA.
f. Immediate steps to solve the problems of the mining sectors Welfare of the workers The survey indicates that the condition of workers in the mining industry is deplorable and needs attention. Government, through immediate amendments in the FCR or promulgation of new laws, should ensure the safety and welfare of workers working in the mine and extraction areas. The present agency administration can be used to ensure that basic and emergency health, water and sanitation facilities should be provided to cope with emergencies during mining activities. Safety standards should be implemented for workers, with necessary training on how to cope with emergencies in mines should be ensured. Provision of these facilities can also be ensured partly through ongoing and planned development activities of foreign funded projects in FATA. Besides, insurance companies can be encouraged to expand inside FATA to cover health, accidental or retirement coverage for laborers working inside FATA. Link Roads to Market For development of mining and other sectors, better roads links between market and the industrial areas be developed and the processing industries should be encouraged to establish businesses near mining sites to reduce transportation and production costs. Training and guidance facilities to use modern scientific techniques The techniques and methods of mining and extraction used in FATA are primitive and the machinery is obsolete. Training centers should be established in the area to impart training on modern lines and

Survey-Enumeration of Industries, Service Sector Entities, Labor Force and Identifying constraints in FATA
FATA Development Authority 63
efficient techniques of mining with use of modern machinery. Guidance and financial support should be provided to acquire modern mining machinery. In fact, a large underpaid workforce both in industries and service also reflects a situation of structural unemployment, where workers do not have adequate skills to match the little available opportunities. This should be addressed with investment in training facilities that provide new skills that truly caters the demand of industries. Safety Regulations Adequate safety regulations should be implemented for development of mining sectors. Mining sectors use explosive material excessively. Presently, no law exists for the commercial use of explosive material which has increased problems faced by this sector as supply of explosive material is cumbersome.
g. Reorganization of Tribal Area Chamber of Commerce and Industries (TACCI)6 Although a defunct FATA Chambers of Commerce and Industries is in place, government needs to help reorganize the FATA Chamber of Commerce and Industries. Fresh elections should be held and due representation to sectors and areas should be given in the Chamber. The Chamber should be involved in future planning for the industrial and services sector of FATA. This will provide a way for effective and efficient policy formulation for industrial growth in FATA.
h. Immediate Steps for Industrial sector development in FATA Rehabilitation of closed industrial units The survey indicated that out of 1815 units, 282 have been closed down and more units are at the verge of closure (Table-29 and Table-30 in Annexure). Immediate steps are needed to rehabilitate these industries which will help generate economic activity besides employment opportunities to the people of FATA. Opening up of Bara Bazar (Market)7 In the consultative meeting, the Tradesmen and Businessmen from FATA have particularly identified the problems being faced by businessmen from Bara Bazar, Khyber Agency. The Bara Bazar is closed now for more than one year due to security operation in the area. Hundreds of thousands of people from different parts of FATA in general and from Khyber Agency in particular have become jobless with closure of Bara Bazar.
Businesses worth billions of Rupees have been closed or shifted to settled areas. The industrial estate near Bara Bazar consists of cloth sewing, PVC pipe and electronic goods such as electric fan
6 This was requested by tribal businessmen in a consultative workshop
7 This issue was raised by traders in a consultative workshop

Survey-Enumeration of Industries, Service Sector Entities, Labor Force and Identifying constraints in FATA
FATA Development Authority 64
manufacturing units which have been severely affected from the situation and are at the verge of total collapse. It is therefore, imperative to take immediate steps to open the Bara Bazar within a completely secure environment to enable the businesses shifted to other places to relocate in famous Bara Bazar.
Consistent Power Supply to Industrial units in FATA8 The FATA businessmen have also demanded subsidized electricity which can be justified as positive externalities are expected to exist though and in the long run, local coal deposits can also be used to generate electricity for local consumption while the government can assist by helping to import coal based power producing units in collaboration with local investors. The industrial and service sector of FATA has been badly affected by the power shortages as in rest of Pakistan. People have placed their own transformers though electricity is often not available. Besides other problems including law and order situation, lack of availability of proper credit facility and raw material etc one of the main problem for the existing industries in FATA is the inconsistent supply of electricity and low voltage. The industries which are trying to survive in the wake of other adversities are badly affected by power shortage. The small scale industrial units of FATA are unable to generate their own electricity. Based on existing power sources the government can ensure electricity to main industries in FATA, however it will be very difficult and inefficient if industries are located far from each other, hence such an incentives is only feasible for industries clustered together. With initial support and technical assistance from the government, local investors could be organized to set up independent power plants inside FATA to provide power to designated areas and sectors. With such a high un-catered and increasing demand for electricity, gradual investment should provide for market based solution in terms of competitive pricing and efficient supply. In order to provide cheap and consistent power supply, locally available resources for energy production like hydro power generation potential, gas and coal reserves should be exploited to produce electricity locally. Besides, renewable energy options such as solar and particularly wind sourced energy should be encouraged.
2. Political and Legal Reforms:
a. Abolition of Frontier Crimes Regulation (FCR): FCR is one of the main obstacles in bringing modern legal and political reforms in FATA. Majority of the people in FATA have voiced concerns against FCR in different surveys conducted for the purpose ix. FCR framework is an administrative tool since the British colonial government and does not allow opportunities of socio-economic development in the area; hence the first and foremost reforms
8 This issue was raised by the businessmen of FATA in a consultative workshop

Survey-Enumeration of Industries, Service Sector Entities, Labor Force and Identifying constraints in FATA
FATA Development Authority 65
should target the very genesis of what people of FATA consider an impediment in their development. Although being a virtual part of the Khyber Pakhtunkhwa, people of FATA do not enjoy the benefits of development in the settled areas. They have historical socio-economic contacts with the people in settled areas. In many cases, the lives of the people of FATA greatly depend on the settled areas. To be able to benefit from the development in the mainstream economy of Pakistan, FATA is best integrated into the Khyber Pakhtunkhwa with due representation to the people of FATA in the provincial and national assemblies.
i. Extension of settled areas Judicial and Land revenue systems into FATA Government can improve development outcomes by providing institutional infrastructure – property rights, peace and order and rules that encourage long-term investmentsx. Lack of extension of the existing Land Revenue Act does not allow for collaterals for loans and hence commercial banks cannot provide credit to local industries in FATA. Extension of judicial and land revenue system are vital for economic development turnaround in FATA. This will also allow financial institutions to extend their lending operations inside FATA, thereby reducing the cost of generating capital, which is high considering limited and expensive sources of availability of funds. A business enabling legal system should also exist for rapid socio-economic development in FATA. The extension of the existing judicial and land revenue system of settled areas to FATA is imperative, as in absence of any legal framework and regulatory system, the investors will remain reluctant to invest in FATA. The data obtained from the survey suggests that some 77% of the businesses are financed by personal investment and the remaining have obtained loans from relatives and friends or from private lenders. Banks and other financial institutions of the country have no direct contribution in business development in FATA due to absence of legal cover. With the advent of development aid in FATA, some insurance companies have already started to provide cover against accidental and terror insurance, this can be enhanced to cover broader scope including health cover for labor, besides initially banks can be encouraged and allowed to accept collateral in settled areas for investment in FATA.

Survey-Enumeration of Industries, Service Sector Entities, Labor Force and Identifying constraints in FATA
FATA Development Authority 66
ANNEXURE
Annexure –I SME Definition for the purpose of classifying small & Medium Enterprises
SME DEFINITION FOR THE PURPOSE OF
CLASSIFYING SMALL AND MEDIUM ENTERPRISES (Source: SME Policy 2006)
Size Sector Employment (a)
Total assets
(excluding land &
building (Rs.
Million) (b)
Annual Sales
(Rs. Million) (c)
Small
Manufacturing <50 Up to 30.0 < 100.0
Service < 50 Up to 20.0 < 100.0
Trade < 20 Up to 20.0 < 100.0
Medium
Manufacturing 51 - 250 30.0 to 100.0 100.0 to 300.0
Service 51 - 250 20.0 to 50.0 100.0 to 300.0
Trade 21 - 50 20.0 to 50.0 100.0 to 300.0
(a). To be eligible, an enterprise must fall into the respective size category as measured by “Employment”.
(b). Fulfilling the criteria either as “a and b” or “a and c”
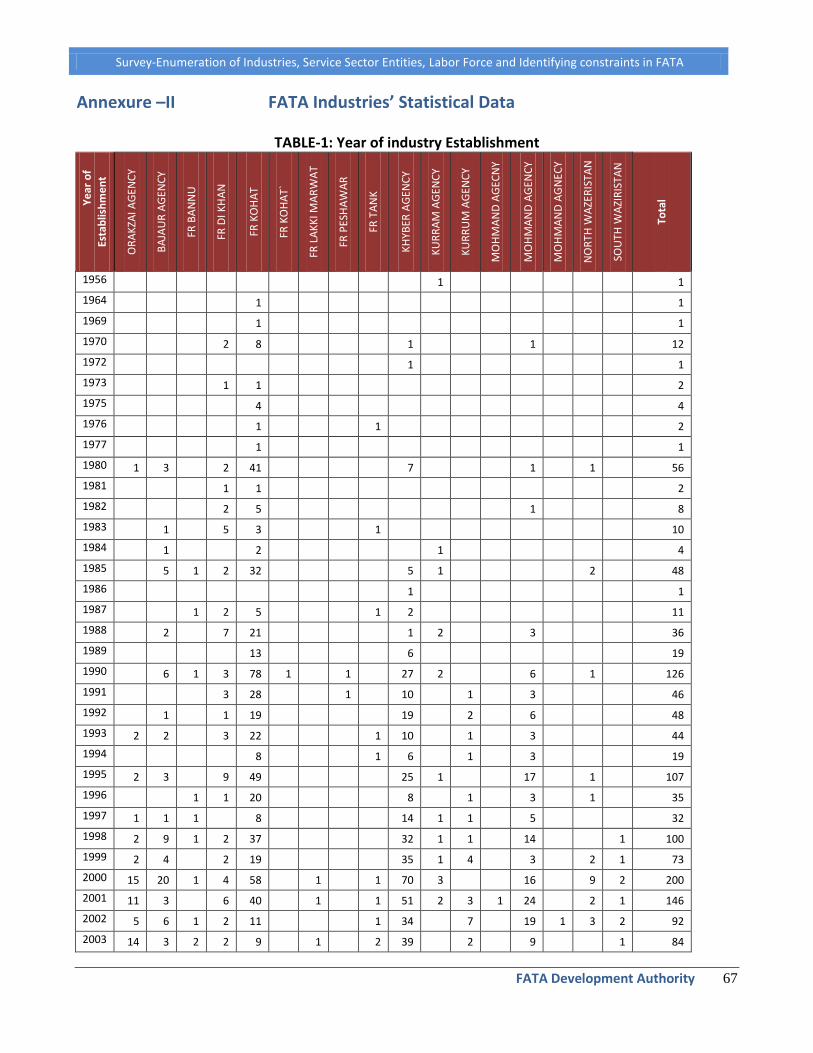
Survey-Enumeration of Industries, Service Sector Entities, Labor Force and Identifying constraints in FATA
FATA Development Authority 67
Annexure –II FATA Industries’ Statistical Data
TABLE-1: Year of industry Establishment
Y
ear
of
Esta
blis
hm
en
t
OR
AK
ZAI A
GEN
CY
BA
JAU
R A
GEN
CY
FR B
AN
NU
FR D
I KH
AN
FR K
OH
AT
FR K
OH
AT`
FR L
AK
KI M
AR
WA
T
FR P
ESH
AW
AR
FR T
AN
K
KH
YBER
AG
ENC
Y
KU
RR
AM
AG
ENC
Y
KU
RR
UM
AG
ENC
Y
MO
HM
AN
D A
GEC
NY
MO
HM
AN
D A
GEN
CY
MO
HM
AN
D A
GN
ECY
NO
RTH
WA
ZER
ISTA
N
SOU
TH W
AZI
RIS
TAN
Tota
l
1956 1 1
1964 1 1
1969 1 1
1970 2 8 1 1 12
1972 1 1
1973 1 1 2
1975 4 4
1976 1 1 2
1977 1 1
1980 1 3 2 41 7 1 1 56
1981 1 1 2
1982 2 5 1 8
1983 1 5 3 1 10
1984 1 2 1 4
1985 5 1 2 32 5 1 2 48
1986 1 1
1987 1 2 5 1 2 11
1988 2 7 21 1 2 3 36
1989 13 6 19
1990 6 1 3 78 1 1 27 2 6 1 126
1991 3 28 1 10 1 3 46
1992 1 1 19 19 2 6 48
1993 2 2 3 22 1 10 1 3 44
1994 8 1 6 1 3 19
1995 2 3 9 49 25 1 17 1 107
1996 1 1 20 8 1 3 1 35
1997 1 1 1 8 14 1 1 5 32
1998 2 9 1 2 37 32 1 1 14 1 100
1999 2 4 2 19 35 1 4 3 2 1 73
2000 15 20 1 4 58 1 1 70 3 16 9 2 200
2001 11 3 6 40 1 1 51 2 3 1 24 2 1 146
2002 5 6 1 2 11 1 34 7 19 1 3 2 92
2003 14 3 2 2 9 1 2 39 2 9 1 84

Survey-Enumeration of Industries, Service Sector Entities, Labor Force and Identifying constraints in FATA
FATA Development Authority 68
2004 21 3 1 1 14 1 24 3 3 13 1 2 87
2005 25 10 2 4 11 1 1 29 1 2 31 117
2006 25 5 1 9 1 18 1 10 1 71
2007 23 2 1 9 1 1 27 10 1 75
2008 17 1 8 24 11 1 62
2009 4 2 1 8 13 28
2010 3 3
170 90 18 67 598 1 7 2 12 537 20 30 1 225 2 26 9 1815
TABLE-2: Nature of industry
Nature of Industry Frequency Percent
Manufacturing 1332 73.4
Processing 283 15.6
Assembling 22 1.2
Other 178 9.8
Total 1815 100.0
TABLE-3: Nature of industry (other)
Nature of Industry (Other) Frequency Percent
AMMUNITION 1 0.06
CANDLE MAKING 1 0.06
CEMENT BLOCKS 4 0.22
CEMENT FACTORY 2 0.11
CLOTHS SEWING 2 0.11
COAL MINING 148 8.15
COLD DRINKS 1 0.06
FLOUR MILL 1 0.06
HOUSE DECORATION 1 0.06
ICE FACTORY 2 0.11
MARBLE FACTORY 2 0.11
METAL WORK 2 0.11
PACKING MACHINE 1 0.06
PLASTIC GRINDING 1 0.06
PLASTIC MAKING 1 0.06
PRINTING 1 0.06
STONE CRUSHING 4 0.22
WOOD WORKS 3 0.17
Total 178 9.81

Survey-Enumeration of Industries, Service Sector Entities, Labor Force and Identifying constraints in FATA
FATA Development Authority 69
TABLE-4: Major goods produced in FATA
Goods
Fre
qu
en
cy
OR
AK
ZAI A
GEN
CY
BA
JAU
R A
GEN
CY
FR B
AN
NU
FR D
I KH
AN
FR K
OH
AT
FR L
AK
KI M
AR
WA
T
FR P
ESH
AW
AR
FR T
AN
K
KH
YBER
AG
ENC
Y
KU
RR
AM
AG
ENC
Y
MO
HM
AN
D A
GEN
CY
MO
HM
AN
D A
GN
ECY
NO
RTH
WA
ZER
ISTA
N
SOU
TH W
AZI
RIS
TAN
30 BORE ARMS 126 126
32 BORE PISTOL 1 1
44 BORE ARMS 24 24
7 MM ARMS 3 3
9 MM ARMS 2 2
ACHAR 4 4
SPORTING & LIGHT HUNTING ARMS 368 360 3 4 1
AUTO PARTS 1 1
BAG 1 1
BALDE 8 8
BARDANA 1 1
BISCUTES 1 1
BOTTLE 1 1
BOX 2 1 1
BRICKS 31 29 1 1
CABLE 2 2
CANDLES 3 3
CARDS 1 1
CARTRIDGE 42 42
CEMENT BLOCKS 29 4 7 2 2 2 9 3
CHIPS 17 1 6 1 4 5
CIGARETTE 11 11
CLOTH 55 1 53 1
COAL EXTRACTION 175 169 6
COLD DRINKS 14 1 4 2 1 4 1 1
COT 1 1
CRUSH STONES 26 1 6 3 3 11 2
DAILY USE STUFFS 2 2
DANA 14 14
DISTALED WATER 1 1
DOORS 2 2
DYE 1 1
EATING SOUPS 1 1
ELECTRIC GOODS 3 1 1 1

Survey-Enumeration of Industries, Service Sector Entities, Labor Force and Identifying constraints in FATA
FATA Development Authority 70
EVERY KINDS OF GOOD 1 1
FAZNA SILE OIL 1 1
FERTILIZERS 1 1
FILTER 1 1
FIXTURE & FURNITURE 40 34 1 1 2 1 1
FLOUR 16 2 1 5 1 1 1 1 3 1
FURNITURE 3 2 1
GATE 1 1
GHEE 1 1
GRAND 1 1
GREEN CHIPS 1 1
HANDICRAFTS 6 3 1 1 1
HOUSEHOLD GOODS 4 4
ICE 24 2 1 12 4 5
JEM CUTTING 1 1
JIPSAM GOODS 1 1
KNIFE 1 1
KON 1 1
KOWADER POWDER 1 1
LEATHER GARMENTS 1 1
LINING ACID 3 3
LOCKETS 1 1
MAKING CHIPS 1 1
MAKING FURNITURE 1 1
MARBLE STONES 316 1 214 1 100
MARBLE TILES 130 29 3 1 52 44 1
MAT 2 1 1
MATCH BOX 5 5
NAILS 1 1
OLD TYRE 2 2
PACKING OF PRODUCTS 2 2
PAPER 2 2
PIPE 31 1 1 8 1 19 1
PLASTIC BAGS 2 2
PLASTIC GOODS 22 1 2 15 3 1
PLASTIC PIPE 4 3 1
PLASTIC SHOES 2 1 1
PLOYESTER GOODS 2 2
POPS 5 5
POTS 2 1 1
POTATO CHIPS 1 1
POTS POWDER 6 6
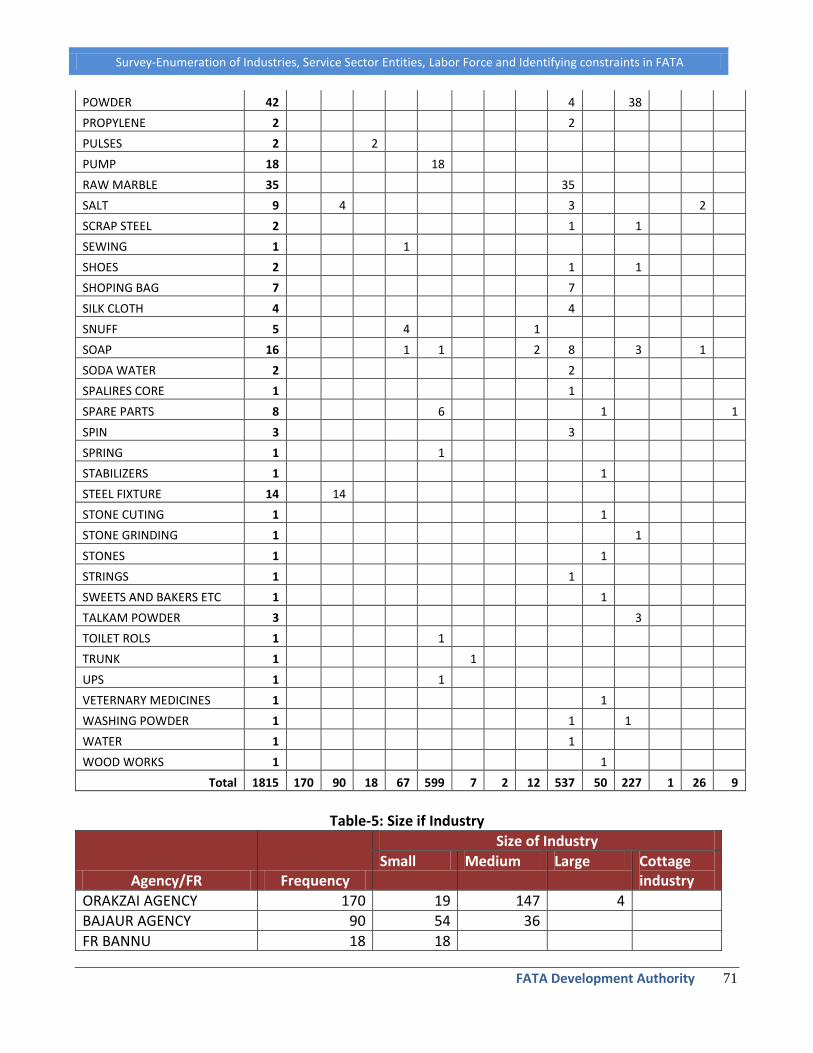
Survey-Enumeration of Industries, Service Sector Entities, Labor Force and Identifying constraints in FATA
FATA Development Authority 71
POWDER 42 4 38
PROPYLENE 2 2
PULSES 2 2
PUMP 18 18
RAW MARBLE 35 35
SALT 9 4 3 2
SCRAP STEEL 2 1 1
SEWING 1 1
SHOES 2 1 1
SHOPING BAG 7 7
SILK CLOTH 4 4
SNUFF 5 4 1
SOAP 16 1 1 2 8 3 1
SODA WATER 2 2
SPALIRES CORE 1 1
SPARE PARTS 8 6 1 1
SPIN 3 3
SPRING 1 1
STABILIZERS 1 1
STEEL FIXTURE 14 14
STONE CUTING 1 1
STONE GRINDING 1 1
STONES 1 1
STRINGS 1 1
SWEETS AND BAKERS ETC 1 1
TALKAM POWDER 3 3
TOILET ROLS 1 1
TRUNK 1 1
UPS 1 1
VETERNARY MEDICINES 1 1
WASHING POWDER 1 1 1
WATER 1 1
WOOD WORKS 1 1
Total 1815 170 90 18 67 599 7 2 12 537 50 227 1 26 9
Table-5: Size if Industry
Agency/FR Frequency
Size of Industry
Small Medium Large Cottage industry
ORAKZAI AGENCY 170 19 147 4
BAJAUR AGENCY 90 54 36
FR BANNU 18 18
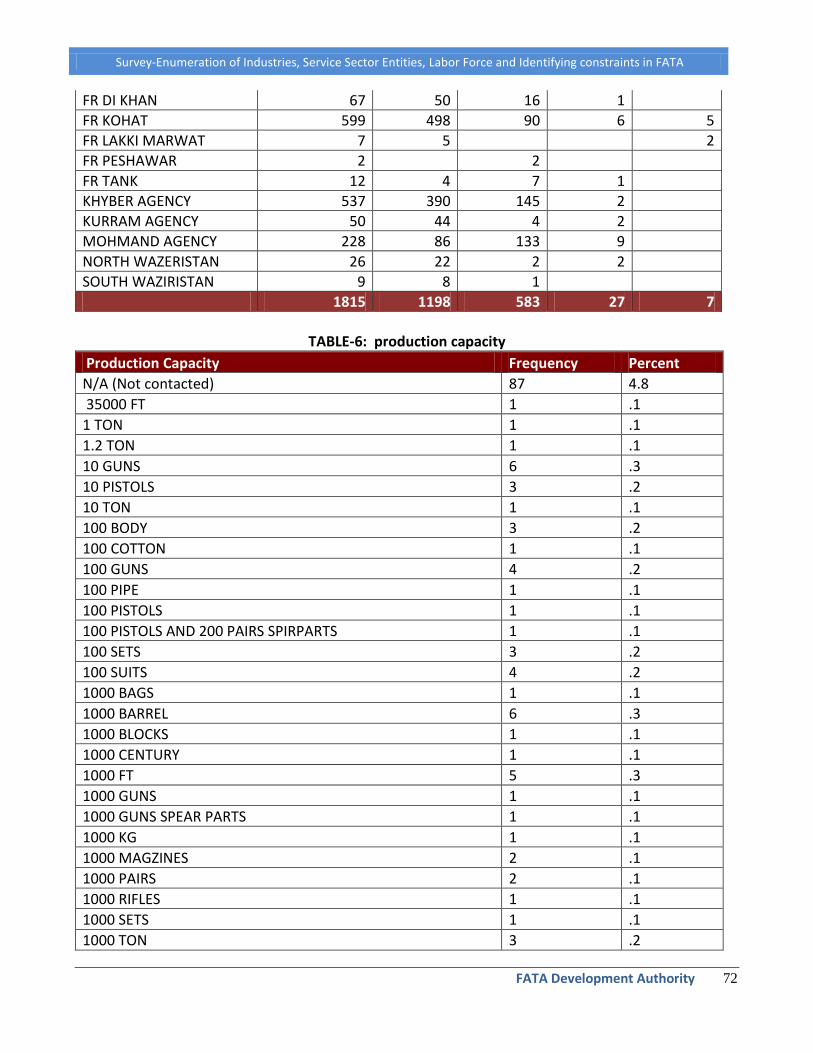
Survey-Enumeration of Industries, Service Sector Entities, Labor Force and Identifying constraints in FATA
FATA Development Authority 72
FR DI KHAN 67 50 16 1
FR KOHAT 599 498 90 6 5
FR LAKKI MARWAT 7 5 2
FR PESHAWAR 2 2
FR TANK 12 4 7 1
KHYBER AGENCY 537 390 145 2
KURRAM AGENCY 50 44 4 2
MOHMAND AGENCY 228 86 133 9
NORTH WAZERISTAN 26 22 2 2
SOUTH WAZIRISTAN 9 8 1
1815 1198 583 27 7
TABLE-6: production capacity
Production Capacity Frequency Percent
N/A (Not contacted) 87 4.8
35000 FT 1 .1
1 TON 1 .1
1.2 TON 1 .1
10 GUNS 6 .3
10 PISTOLS 3 .2
10 TON 1 .1
100 BODY 3 .2
100 COTTON 1 .1
100 GUNS 4 .2
100 PIPE 1 .1
100 PISTOLS 1 .1
100 PISTOLS AND 200 PAIRS SPIRPARTS 1 .1
100 SETS 3 .2
100 SUITS 4 .2
1000 BAGS 1 .1
1000 BARREL 6 .3
1000 BLOCKS 1 .1
1000 CENTURY 1 .1
1000 FT 5 .3
1000 GUNS 1 .1
1000 GUNS SPEAR PARTS 1 .1
1000 KG 1 .1
1000 MAGZINES 2 .1
1000 PAIRS 2 .1
1000 RIFLES 1 .1
1000 SETS 1 .1
1000 TON 3 .2

Survey-Enumeration of Industries, Service Sector Entities, Labor Force and Identifying constraints in FATA
FATA Development Authority 73
10000 SACKS 2 .1
10000 AMMUNITION 6 .3
10000 BLOCKS 8 .4
10000 BRICKS 4 .2
10000 CENTURY 2 .1
10000 FT 7 .4
10000 ICE CREAM 3 .2
10000 KG 10 .6
10000 LITER 6 .3
10000 MAGZINE 1 .1
10000 METER 2 .1
10000 TON 2 .1
10000 TRUCK 1 .1
100000 AMMUNITION 32 1.8
100000 KG 11 .6
100000 METER 9 .5
100000 POTS 1 .1
100000 SETS 1 .1
100000 TON 2 .1
1000000 AMMUNITION 1 .1
1000000 FT 1 .1
1000000 KG 1 .1
100000000 BAGS 1 .1
10150 METER 1 .1
110 SUITS 2 .1
11200000 AMMUNITION 1 .1
12 RIFLES 1 .1
120 GUNS 2 .1
120 MAGZINE 1 .1
120 TON 3 .2
1200 BARREL 1 .1
1200 FT 1 .1
1200 GOODS 1 .1
1200 GUNS AND PISTOLS 1 .1
1200 KG 1 .1
1200 PAIRS 1 .1
1200 SETS 1 .1
12000 SACKS 1 .1
12000 AMMUNITION 1 .1
12000 BLOCKS 2 .1
12000 BRICKS 1 .1
12000 COTTON 1 .1
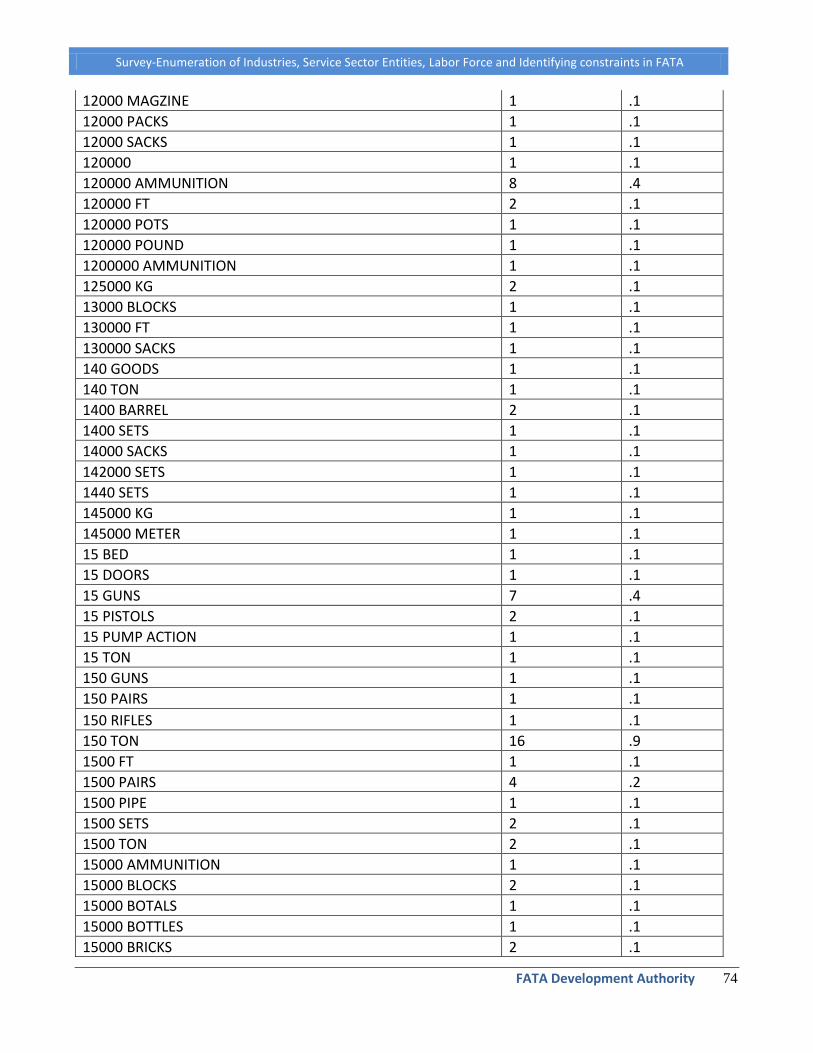
Survey-Enumeration of Industries, Service Sector Entities, Labor Force and Identifying constraints in FATA
FATA Development Authority 74
12000 MAGZINE 1 .1
12000 PACKS 1 .1
12000 SACKS 1 .1
120000 1 .1
120000 AMMUNITION 8 .4
120000 FT 2 .1
120000 POTS 1 .1
120000 POUND 1 .1
1200000 AMMUNITION 1 .1
125000 KG 2 .1
13000 BLOCKS 1 .1
130000 FT 1 .1
130000 SACKS 1 .1
140 GOODS 1 .1
140 TON 1 .1
1400 BARREL 2 .1
1400 SETS 1 .1
14000 SACKS 1 .1
142000 SETS 1 .1
1440 SETS 1 .1
145000 KG 1 .1
145000 METER 1 .1
15 BED 1 .1
15 DOORS 1 .1
15 GUNS 7 .4
15 PISTOLS 2 .1
15 PUMP ACTION 1 .1
15 TON 1 .1
150 GUNS 1 .1
150 PAIRS 1 .1
150 RIFLES 1 .1
150 TON 16 .9
1500 FT 1 .1
1500 PAIRS 4 .2
1500 PIPE 1 .1
1500 SETS 2 .1
1500 TON 2 .1
15000 AMMUNITION 1 .1
15000 BLOCKS 2 .1
15000 BOTALS 1 .1
15000 BOTTLES 1 .1
15000 BRICKS 2 .1

Survey-Enumeration of Industries, Service Sector Entities, Labor Force and Identifying constraints in FATA
FATA Development Authority 75
15000 CENTURY 2 .1
15000 COPPIES 1 .1
15000 FT 4 .2
15000 INSTANT 1 .1
15000 KG 3 .2
15000 METER 2 .1
15000 SACKS 4 .2
150000 AMMUNITION 7 .4
150000 AMMUNITOIN 1 .1
150000 CENTURY 1 .1
150000 ICE CREAM 1 .1
150000 INSTANT 1 .1
150000 KG 2 .1
150000 METER 1 .1
16 GUNS 1 .1
160 TON 1 .1
1600 BARREL 1 .1
16000 BLOCKS 1 .1
16000 FT 1 .1
16000 MON 1 .1
16000 SACKS 11 .6
160000 AMMUNITION 1 .1
160000 METER 2 .1
17000 SACKS 5 .3
18 DOUBLE BED 1 .1
180 METER 1 .1
180 SUITS 1 .1
180 TON 1 .1
1800 DOZEN 1 .1
1800 KG 1 .1
1800 TON 3 .2
18000 BAGS 1 .1
18000 FT 1 .1
18000 METER 2 .1
18000 SACKS 3 .2
18000 TON 1 .1
180000 AMMUNITION 2 .1
19000 KG 1 .1
2.5 TON 1 .1
20 DOORS 1 .1
20 GOODS 1 .1
20 GUNS 12 .7

Survey-Enumeration of Industries, Service Sector Entities, Labor Force and Identifying constraints in FATA
FATA Development Authority 76
20 PARTS 1 .1
20 PISTOLS 14 .8
20 RIFLES 4 .2
20 SINGLE BED 1 .1
20 TON 6 .3
200 BAGS 1 .1
200 BLOCKS 1 .1
200 BODY 2 .1
200 COTTON 2 .1
200 GUNS 6 .3
200 GUNS, 500 PAIRS 1 .1
200 PAIRS 2 .1
200 PIPE 3 .2
200 PISTOLS 1 .1
200 RIFLES 1 .1
200 SACKS 2 .1
200 SETS 2 .1
200 TON 1 .1
200 TYRE 2 .1
2000 BAGS 1 .1
2000 BRICKS 1 .1
2000 COTTON 1 .1
2000 DOOR 1 .1
2000 DYES 1 .1
2000 FOLDING 2 .1
2000 FT 7 .4
2000 ICE CREAM 1 .1
2000 MAGZINE 1 .1
2000 PAIRS 2 .1
2000 SACKS 2 .1
2000 TILES 1 .1
2000 TON 4 .2
20000 AMMUNITION 4 .2
20000 BLOCKS 2 .1
20000 BRICKS 1 .1
20000 CENTURY 1 .1
20000 FT 20 1.1
20000 KG 9 .5
20000 METER 2 .1
20000 SACKS 1 .1
20000 SPRING 1 .1
200000 AMMUNITION 29 1.6

Survey-Enumeration of Industries, Service Sector Entities, Labor Force and Identifying constraints in FATA
FATA Development Authority 77
200000 KG 2 .1
200000 METER 7 .4
2000000 AMMUNITION 1 .1
2000000 METER 1 .1
210 TON 1 .1
21000 KG 1 .1
21000 METER 1 .1
2160 TON 1 .1
22000 BLOCKS 1 .1
23000 GRAND 1 .1
23000 METER 1 .1
24 GUNS 1 .1
24 TON 1 .1
240 TON 2 .1
2400 BAGS 1 .1
2400 GUNS 1 .1
24000 BAGS 1 .1
24000 BLOCKS 1 .1
24000 FT 3 .2
24000 KG 1 .1
25 DOORS 1 .1
25 GUNS 2 .1
25 PISTOLS 6 .3
25 RIFLES 3 .2
25 TRUCK 1 .1
250 AMMUNITION 1 .1
250 BOX 2 .1
250 PAIRS 1 .1
250 PIPES 1 .1
250 TON 1 .1
2500 AMMUNITION 1 .1
2500 FT 2 .1
2500 TON 1 .1
25000 BLOCKS 5 .3
25000 BRICKS 1 .1
25000 FT 59 3.3
25000 KG 1 .1
25000 METER 2 .1
25000 SACKS 3 .2
25000 TON 1 .1
250000 AMMUNITION 4 .2
250000 FT 3 .2
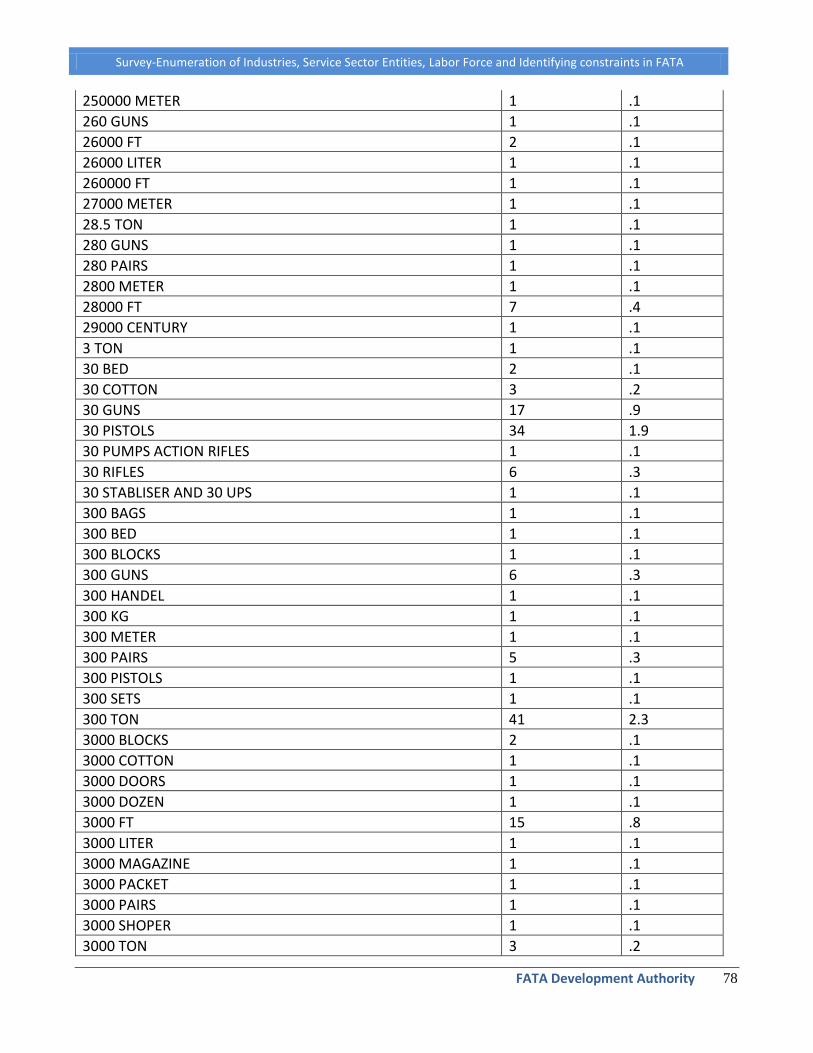
Survey-Enumeration of Industries, Service Sector Entities, Labor Force and Identifying constraints in FATA
FATA Development Authority 78
250000 METER 1 .1
260 GUNS 1 .1
26000 FT 2 .1
26000 LITER 1 .1
260000 FT 1 .1
27000 METER 1 .1
28.5 TON 1 .1
280 GUNS 1 .1
280 PAIRS 1 .1
2800 METER 1 .1
28000 FT 7 .4
29000 CENTURY 1 .1
3 TON 1 .1
30 BED 2 .1
30 COTTON 3 .2
30 GUNS 17 .9
30 PISTOLS 34 1.9
30 PUMPS ACTION RIFLES 1 .1
30 RIFLES 6 .3
30 STABLISER AND 30 UPS 1 .1
300 BAGS 1 .1
300 BED 1 .1
300 BLOCKS 1 .1
300 GUNS 6 .3
300 HANDEL 1 .1
300 KG 1 .1
300 METER 1 .1
300 PAIRS 5 .3
300 PISTOLS 1 .1
300 SETS 1 .1
300 TON 41 2.3
3000 BLOCKS 2 .1
3000 COTTON 1 .1
3000 DOORS 1 .1
3000 DOZEN 1 .1
3000 FT 15 .8
3000 LITER 1 .1
3000 MAGAZINE 1 .1
3000 PACKET 1 .1
3000 PAIRS 1 .1
3000 SHOPER 1 .1
3000 TON 3 .2
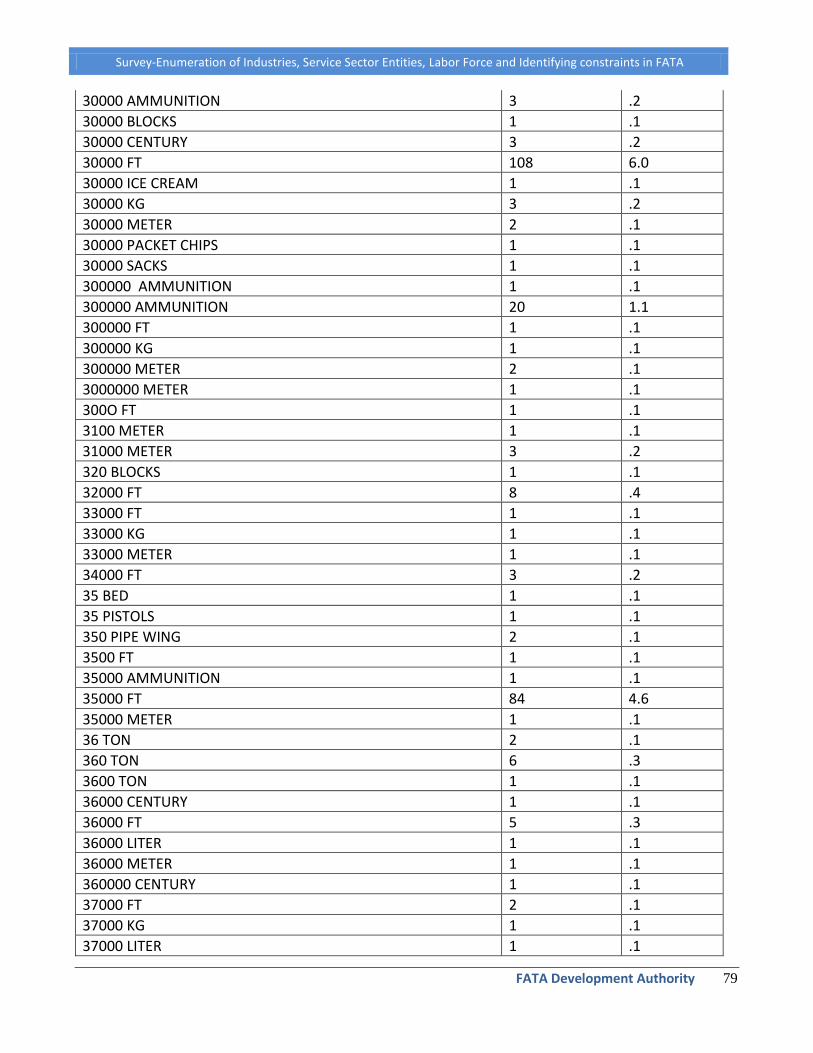
Survey-Enumeration of Industries, Service Sector Entities, Labor Force and Identifying constraints in FATA
FATA Development Authority 79
30000 AMMUNITION 3 .2
30000 BLOCKS 1 .1
30000 CENTURY 3 .2
30000 FT 108 6.0
30000 ICE CREAM 1 .1
30000 KG 3 .2
30000 METER 2 .1
30000 PACKET CHIPS 1 .1
30000 SACKS 1 .1
300000 AMMUNITION 1 .1
300000 AMMUNITION 20 1.1
300000 FT 1 .1
300000 KG 1 .1
300000 METER 2 .1
3000000 METER 1 .1
300O FT 1 .1
3100 METER 1 .1
31000 METER 3 .2
320 BLOCKS 1 .1
32000 FT 8 .4
33000 FT 1 .1
33000 KG 1 .1
33000 METER 1 .1
34000 FT 3 .2
35 BED 1 .1
35 PISTOLS 1 .1
350 PIPE WING 2 .1
3500 FT 1 .1
35000 AMMUNITION 1 .1
35000 FT 84 4.6
35000 METER 1 .1
36 TON 2 .1
360 TON 6 .3
3600 TON 1 .1
36000 CENTURY 1 .1
36000 FT 5 .3
36000 LITER 1 .1
36000 METER 1 .1
360000 CENTURY 1 .1
37000 FT 2 .1
37000 KG 1 .1
37000 LITER 1 .1

Survey-Enumeration of Industries, Service Sector Entities, Labor Force and Identifying constraints in FATA
FATA Development Authority 80
38000 BLOCKS 1 .1
38000 CENTURY 1 .1
38000 FT 2 .1
390 TON 2 .1
4 TO 6 FURNITURE SETS 1 .1
4.5 TON 1 .1
40 BED 1 .1
40 BOX 1 .1
40 COTTON 2 .1
40 DOORS 1 .1
40 GUNS 15 .8
40 MAGZINE 1 .1
40 PISTOLS 26 1.4
40 RIFLES 1 .1
400 BLOCKS 3 .2
400 COTTON 1 .1
400 FOR HAND 1 .1
400 GUNS 7 .4
400 MAGZINE 1 .1
400 PAIRS 2 .1
400 SETS 1 .1
400 SINGAL BARREL, 50 PISTOLS, 1500 PAIRS 1 .1
400 TON 5 .3
4000 BORE 1 .1
4000 COTTON 1 .1
4000 DOORS 2 .1
4000 FT 10 .6
4000 KG 3 .2
4000 TON 1 .1
40000 AMMUNITION 3 .2
40000 BLOCKS 1 .1
40000 CENTURY 5 .3
40000 FT 36 2.0
40000 KG 1 .1
40000 LITER 1 .1
40000 METER 1 .1
400000 AMMUNITION 3 .2
41000 CENTURY 1 .1
42000 FT 1 .1
4320 TON 3 .2
45 GOODS 1 .1
450 AMMUNITION 1 .1

Survey-Enumeration of Industries, Service Sector Entities, Labor Force and Identifying constraints in FATA
FATA Development Authority 81
450 TON 9 .5
4500 FT 7 .4
4500 SACKS 2 .1
4500 TON 1 .1
45000 AMMUNITION 1 .1
45000 FT 20 1.1
45000 TON 2 .1
4680 TON 1 .1
480 TON 1 .1
4800 LITER 1 .1
48000 CENTURY 1 .1
48000 FT 1 .1
48000 SACKS 1 .1
50 BED 1 .1
50 GOODS 1 .1
50 GUNS 5 .3
50 PISTOLS 17 .9
50 RIFLES 3 .2
50 SACKS 1 .1
50 SINGLE BED 1 .1
50 TON 2 .1
500 BARREL 3 .2
500 BOTTLES 1 .1
500 MATS 1 .1
500 PAIRS 4 .2
500 PIPE 1 .1
500 SETS 3 .2
500 TON 10 .6
5000 AMMUNITION 2 .1
5000 CANDELS 2 .1
5000 COTTON 2 .1
5000 DOORS 1 .1
5000 FT 16 .9
5000 METER 1 .1
5000 SACKS 1 .1
5000 SOAP 5 .3
5000 TON 4 .2
50000 AMMUNITION 3 .2
50000 CENTURY 1 .1
50000 FT 23 1.3
50000 KG 1 .1
50000 LETIRE 1 .1

Survey-Enumeration of Industries, Service Sector Entities, Labor Force and Identifying constraints in FATA
FATA Development Authority 82
50000 METER 3 .2
50000 PAIRS 2 .1
500000 AMMUNITION 1 .1
500000 KG 1 .1
500000 METER 1 .1
5000N BLOCKS 1 .1
5040 TON 1 .1
510 TON 1 .1
540 TON 8 .4
5400 TON 2 .1
54000 TON 1 .1
550 TRALLER 1 .1
5500 TON 1 .1
570 TON 1 .1
5760 TON 1 .1
59000 KG 1 .1
6 TON 1 .1
60 BARREL 1 .1
60 BLOCKS 1 .1
60 DOUBLE BARREL 4 .2
60 GUNS 6 .3
60 PISTOLS 13 .7
60 PUMP ACTION, 100 PISTOLS, 1000 PAIRS 1 .1
60 TON 3 .2
600 BAGS 2 .1
600 BARREL 1 .1
600 BODY 4 .2
600 COTTON 1 .1
600 FOLDING 1 .1
600 GUNS, 1000 PISTOLS 1 .1
600 KG 1 .1
600 PACKS 1 .1
600 PAIRS 4 .2
600 PAIRS AND 300 HANDEL 1 .1
600 RIFLES 2 .1
600 SETS 2 .1
600 SINGLE BARREL 1 .1
600 TON 33 1.8
6000 AMMUNITION 2 .1
6000 BLOCKS 1 .1
6000 BOTTLES 1 .1
6000 COTTON 2 .1

Survey-Enumeration of Industries, Service Sector Entities, Labor Force and Identifying constraints in FATA
FATA Development Authority 83
6000 DOZEN 2 .1
6000 FT 3 .2
6000 KG 2 .1
6000 MON 1 .1
6000 TON 5 .3
60000 AMMUNITION 14 .8
60000 BRICKS 1 .1
60000 FT 3 .2
60000 KG 2 .1
60000 METER 1 .1
60000 POUND 1 .1
600000 AMMUNITION 2 .1
600000 CENTURY 1 .1
600000 FT 1 .1
600000 METER 2 .1
600000 YARDS 1 .1
650 BLOCKS 2 .1
65000 KG 1 .1
660 TON 1 .1
690 TON 1 .1
7 GUNS 1 .1
70 PISTOLS 4 .2
70 RIFLES 2 .1
70 SACKS 1 .1
70 TRALLER 1 .1
700 KG 1 .1
700 TRALLER 1 .1
7000 FT 1 .1
7000 KG 1 .1
7000 TON 1 .1
70000 AMMUNITION 1 .1
70000 BLOCKS 1 .1
70000 BRICKS 2 .1
70000 FT 1 .1
70000 KG 2 .1
700000 CENTURY 1 .1
720 TRUCK 1 .1
7200 POT 1 .1
7200 TON 1 .1
750 PIPE 1 .1
750 TON 5 .3
750 TRALLER 1 .1

Survey-Enumeration of Industries, Service Sector Entities, Labor Force and Identifying constraints in FATA
FATA Development Authority 84
75000 BRICKS 3 .2
7560 TON 1 .1
8 COTTON 1 .1
8 GUNS 3 .2
8 PISTOLS 3 .2
8 SETS 3 .2
80 GOODS 1 .1
80 GUNS 3 .2
80 RIFLES 2 .1
800 COTTON 1 .1
800 FOLDING 1 .1
800 GUNS 1 .1
800 PAIRS 2 .1
800 PARTS 1 .1
800 RIFLES 1 .1
800 TON 1 .1
8000 BLOCKS 1 .1
8000 CANDELS 1 .1
8000 DOZEN 1 .1
8000 FT 2 .1
8000 KG 1 .1
80000 AMMUNITION 13 .7
80000 BRICKS 2 .1
80000 FT 1 .1
80000 KG 1 .1
80000 TON 1 .1
800000 AMMUNITION 1 .1
800000 CENTURY 3 .2
800000 FT 1 .1
800000 METER 1 .1
85000 BRICKS 2 .1
85000 FT 1 .1
850000 BRICKS 1 .1
8640 TON 1 .1
90 GOODS 1 .1
90 GUNS 1 .1
90 PISTOLS 1 .1
90 TON 1 .1
900 BARREL 1 .1
900 BOTTLES 1 .1
900 CENTURY 1 .1
900 TON 21 1.2

Survey-Enumeration of Industries, Service Sector Entities, Labor Force and Identifying constraints in FATA
FATA Development Authority 85
9000 BOTTLES 1 .1
9000 KG 2 .1
9000 TON 1 .1
90000 BRICKS 4 .2
90000 FT 3 .2
95000 BRICKS 4 .2
950000 BRICKS 2 .1
DON’T KNOW 1 .1
ON DEMAND 2 .1
Total 1815 100.0
TABLE-7: Actual production:
Actual Production Frequency Percent
N/A (Not contacted) 87 4.8
15 PISTOLS 1 .1
16000 FT 1 .1
21000 FT 1 .1
09 TON 1 .1
1 TON 2 .1
1.2 TON 1 .1
1.5 TON 1 .1
10 BED 1 .1
10 BLOCKS 1 .1
10 BOX 1 .1
10 COTTON 2 .1
10 GUNS 15 .8
10 PISTOL 1 .1
10 PISTOLS 8 .4
10 PUMP ACTION 1 .1
10 RIFLES 2 .1
10 SINGLE BED 1 .1
10 TON 1 .1
100 BAGS 1 .1
100 BLOCKS 2 .1
100 BODY 1 .1
100 COTTON 1 .1
100 FT 1 .1
100 GUNS 6 .3
100 HANDEL 1 .1
100 MAGZINE 1 .1
100 METER 1 .1
100 PAIRS 3 .2

Survey-Enumeration of Industries, Service Sector Entities, Labor Force and Identifying constraints in FATA
FATA Development Authority 86
100 PISTOL 1 .1
100 RIFLES 1 .1
100 SETS 3 .2
100 SUITS 2 .1
100 TON 9 .5
1000 AMMUNITION 1 .1
1000 BLOCKS 1 .1
1000 COTTON 1 .1
1000 FT 2 .1
1000 FTOLDING 2 .1
1000 ICE CREAM 1 .1
1000 KG 1 .1
1000 PAIRS 6 .3
1000 SACKS 1 .1
1000 SETS 3 .2
1000 TON 1 .1
10000 AMMUNITION 1 .1
10000 BLOCKS 3 .2
10000 BOTALS 1 .1
10000 BRICKS 4 .2
10000 BULLETS 3 .2
10000 CARTRIDGES 1 .1
10000 CENTURY 1 .1
10000 FT 25 1.4
10000 KG 5 .3
10000 METER 6 .3
10000 NETER 1 .1
10000 SACKS 1 .1
10000 SPRING 1 .1
100000 AMMUNITION 10 .6
100000 CARTRIDGES 6 .3
100000 CENTURY 1 .1
100000 FT 1 .1
100000 METER 3 .2
10000000 BAG 1 .1
1080 DYES 1 .1
11 DOORS 1 .1
1100 SACKS 1 .1
11000 1 .1
11000 FT 3 .2
11000 SACKS 1 .1
12 GUNS 4 .2
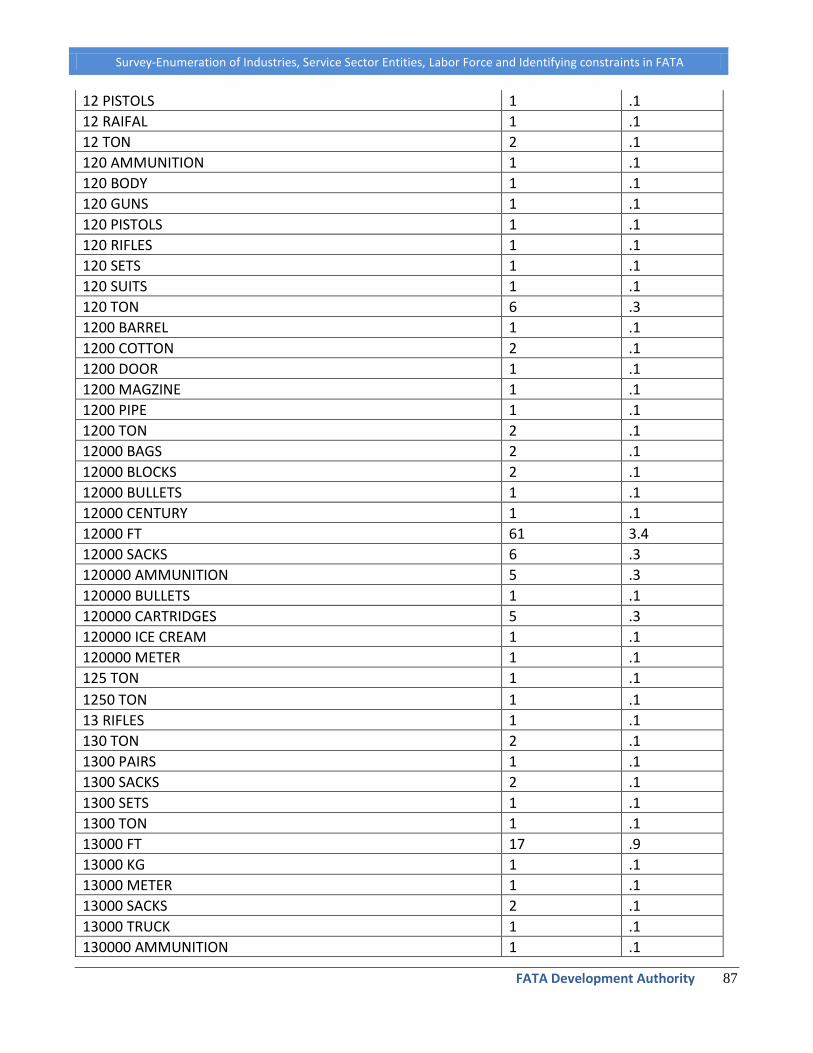
Survey-Enumeration of Industries, Service Sector Entities, Labor Force and Identifying constraints in FATA
FATA Development Authority 87
12 PISTOLS 1 .1
12 RAIFAL 1 .1
12 TON 2 .1
120 AMMUNITION 1 .1
120 BODY 1 .1
120 GUNS 1 .1
120 PISTOLS 1 .1
120 RIFLES 1 .1
120 SETS 1 .1
120 SUITS 1 .1
120 TON 6 .3
1200 BARREL 1 .1
1200 COTTON 2 .1
1200 DOOR 1 .1
1200 MAGZINE 1 .1
1200 PIPE 1 .1
1200 TON 2 .1
12000 BAGS 2 .1
12000 BLOCKS 2 .1
12000 BULLETS 1 .1
12000 CENTURY 1 .1
12000 FT 61 3.4
12000 SACKS 6 .3
120000 AMMUNITION 5 .3
120000 BULLETS 1 .1
120000 CARTRIDGES 5 .3
120000 ICE CREAM 1 .1
120000 METER 1 .1
125 TON 1 .1
1250 TON 1 .1
13 RIFLES 1 .1
130 TON 2 .1
1300 PAIRS 1 .1
1300 SACKS 2 .1
1300 SETS 1 .1
1300 TON 1 .1
13000 FT 17 .9
13000 KG 1 .1
13000 METER 1 .1
13000 SACKS 2 .1
13000 TRUCK 1 .1
130000 AMMUNITION 1 .1
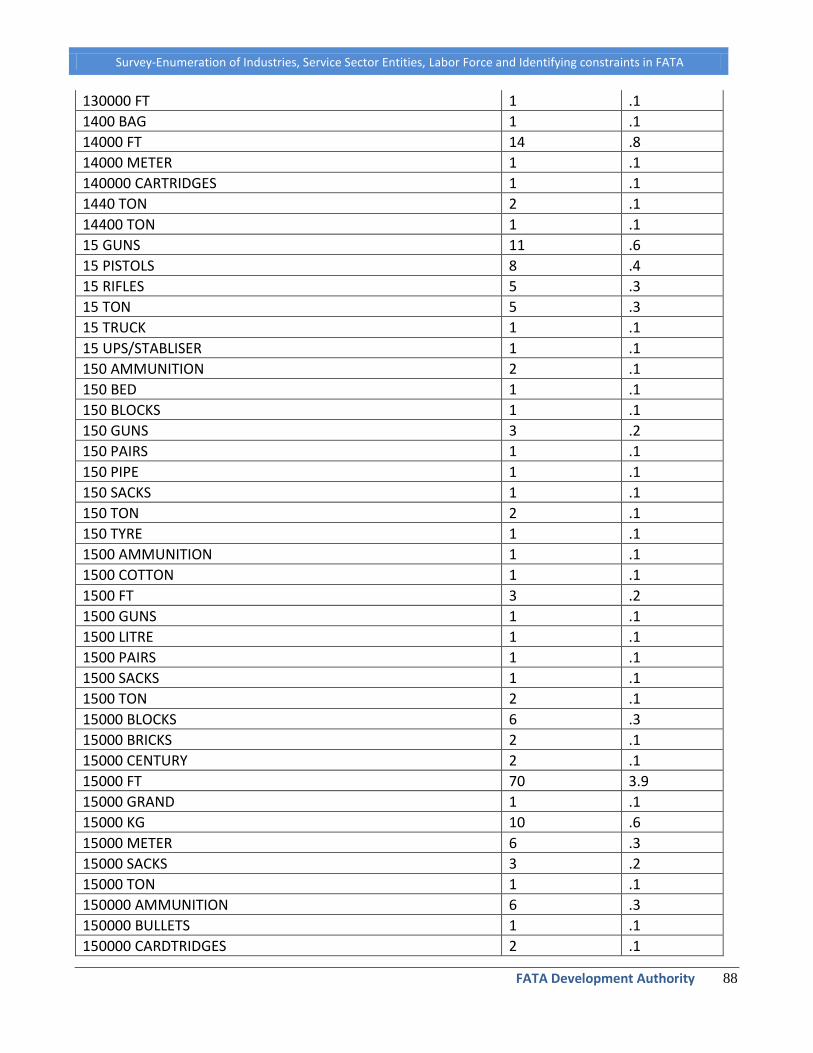
Survey-Enumeration of Industries, Service Sector Entities, Labor Force and Identifying constraints in FATA
FATA Development Authority 88
130000 FT 1 .1
1400 BAG 1 .1
14000 FT 14 .8
14000 METER 1 .1
140000 CARTRIDGES 1 .1
1440 TON 2 .1
14400 TON 1 .1
15 GUNS 11 .6
15 PISTOLS 8 .4
15 RIFLES 5 .3
15 TON 5 .3
15 TRUCK 1 .1
15 UPS/STABLISER 1 .1
150 AMMUNITION 2 .1
150 BED 1 .1
150 BLOCKS 1 .1
150 GUNS 3 .2
150 PAIRS 1 .1
150 PIPE 1 .1
150 SACKS 1 .1
150 TON 2 .1
150 TYRE 1 .1
1500 AMMUNITION 1 .1
1500 COTTON 1 .1
1500 FT 3 .2
1500 GUNS 1 .1
1500 LITRE 1 .1
1500 PAIRS 1 .1
1500 SACKS 1 .1
1500 TON 2 .1
15000 BLOCKS 6 .3
15000 BRICKS 2 .1
15000 CENTURY 2 .1
15000 FT 70 3.9
15000 GRAND 1 .1
15000 KG 10 .6
15000 METER 6 .3
15000 SACKS 3 .2
15000 TON 1 .1
150000 AMMUNITION 6 .3
150000 BULLETS 1 .1
150000 CARDTRIDGES 2 .1

Survey-Enumeration of Industries, Service Sector Entities, Labor Force and Identifying constraints in FATA
FATA Development Authority 89
150000 CARTRIDGES 2 .1
150000 FT 1 .1
16 PISTOLS 2 .1
16.04 TON 1 .1
160 METER 1 .1
160 TYRE 1 .1
1600 DOZEN 1 .1
16000 BLOCKS 1 .1
16000 FT 17 .9
16000 METER 2 .1
16000 TON 1 .1
160000 BULLETS 1 .1
17 GUNS 2 .1
1700 KG 1 .1
17000 BLOCKS 1 .1
17000 FT 17 .9
17000 KG 1 .1
17000 METER 1 .1
175 TON 1 .1
18 ACTION PUMP 1 .1
18 PISTOLS 2 .1
18 RIFLE 1 .1
18 RIFLES 2 .1
180 GUNS 2 .1
180 PAIRS 1 .1
180 PIPE 2 .1
180 SACKS 1 .1
180 TON 2 .1
1800 KG 1 .1
1800 TILES 1 .1
18000 BLOCKS 1 .1
18000 FT 18 1.0
18000 KG 3 .2
18000 METER 2 .1
18000 SACKS 1 .1
180000 AMMUNITION 2 .1
180000 CARTRIDGES 1 .1
180000 FT 1 .1
184 TON 1 .1
1872 TON 1 .1
190 PAIRS 1 .1
19000 FT 2 .1

Survey-Enumeration of Industries, Service Sector Entities, Labor Force and Identifying constraints in FATA
FATA Development Authority 90
19000 METER 1 .1
2 COTTON 1 .1
2 TO 3 FTURNITURE SETS 1 .1
20 COTTON 1 .1
20 GOODS 1 .1
20 GUNS 14 .8
20 MAGZINE 1 .1
20 PARTS 1 .1
20 PISTOLS 33 1.8
20 RIFLES 1 .1
20 SACKS 1 .1
20 TON 2 .1
200 BARREL 1 .1
200 BLOCKS 2 .1
200 BOTTLE 1 .1
200 FT 3 .2
200 FTOR HAND 1 .1
200 GUNS 5 .3
200 PAIRS 5 .3
200 PISTOLS 1 .1
200 SETS 1 .1
200 TON 29 1.6
2000 TON 1 .1
2000 BLOCKS 3 .2
2000 BORE 1 .1
2000 BOTTLE 1 .1
2000 BRICKS 1 .1
2000 COPPIES 1 .1
2000 COTTON 1 .1
2000 DOORS 3 .2
2000 FT 9 .5
2000 KG 2 .1
2000 LITRE 1 .1
2000 MAHGZAINE 1 .1
2000 TON 3 .2
20000 AMMUNITION 1 .1
20000 BRICKS 1 .1
20000 BULETS 1 .1
20000 BULLETS 2 .1
20000 CARTRIDGES 1 .1
20000 CENTURY 3 .2
20000 FT 50 2.8
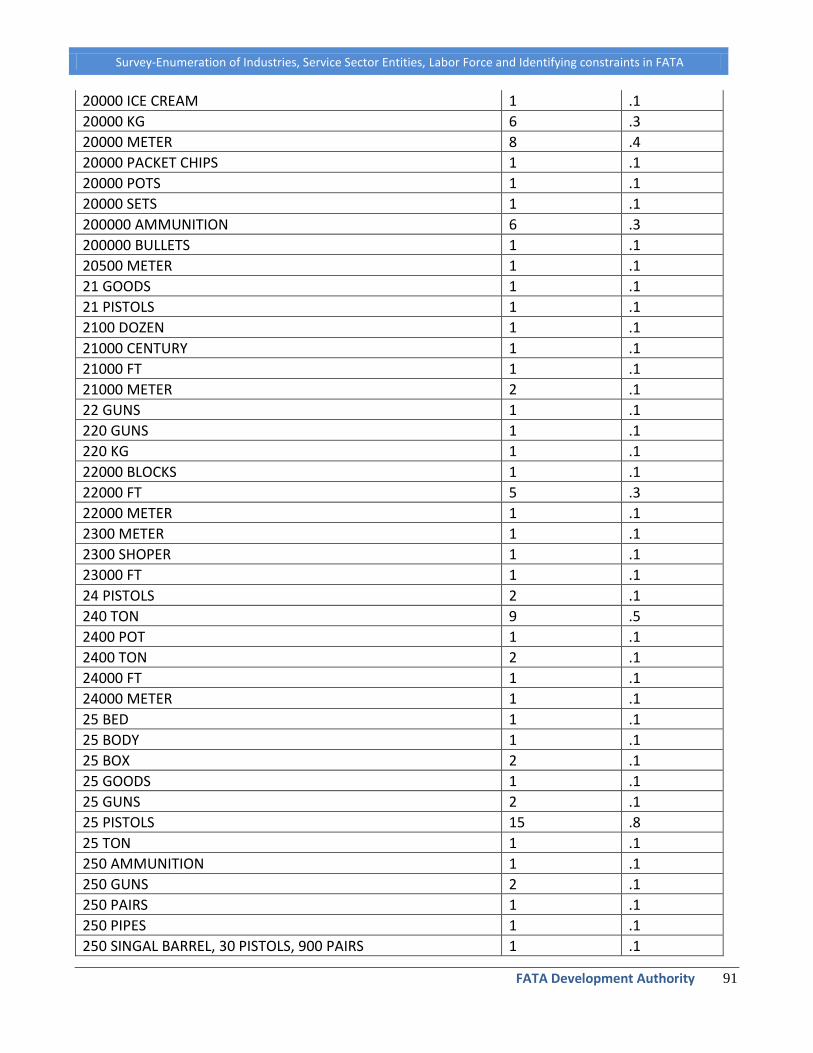
Survey-Enumeration of Industries, Service Sector Entities, Labor Force and Identifying constraints in FATA
FATA Development Authority 91
20000 ICE CREAM 1 .1
20000 KG 6 .3
20000 METER 8 .4
20000 PACKET CHIPS 1 .1
20000 POTS 1 .1
20000 SETS 1 .1
200000 AMMUNITION 6 .3
200000 BULLETS 1 .1
20500 METER 1 .1
21 GOODS 1 .1
21 PISTOLS 1 .1
2100 DOZEN 1 .1
21000 CENTURY 1 .1
21000 FT 1 .1
21000 METER 2 .1
22 GUNS 1 .1
220 GUNS 1 .1
220 KG 1 .1
22000 BLOCKS 1 .1
22000 FT 5 .3
22000 METER 1 .1
2300 METER 1 .1
2300 SHOPER 1 .1
23000 FT 1 .1
24 PISTOLS 2 .1
240 TON 9 .5
2400 POT 1 .1
2400 TON 2 .1
24000 FT 1 .1
24000 METER 1 .1
25 BED 1 .1
25 BODY 1 .1
25 BOX 2 .1
25 GOODS 1 .1
25 GUNS 2 .1
25 PISTOLS 15 .8
25 TON 1 .1
250 AMMUNITION 1 .1
250 GUNS 2 .1
250 PAIRS 1 .1
250 PIPES 1 .1
250 SINGAL BARREL, 30 PISTOLS, 900 PAIRS 1 .1

Survey-Enumeration of Industries, Service Sector Entities, Labor Force and Identifying constraints in FATA
FATA Development Authority 92
250 TON 7 .4
2500 DOORS 1 .1
2500 FT 3 .2
2500 PACKET 1 .1
25000 AMMUNITION 2 .1
25000 BULLETS 2 .1
25000 CENTURY 1 .1
25000 FT 18 1.0
25000 KG 4 .2
25000 LITRE 1 .1
25000 METER 1 .1
25000 TON 1 .1
250000 BULLETS 1 .1
250000 CENTURY 1 .1
260 TON 2 .1
26000 FT 1 .1
264 TON 2 .1
27000 FT 1 .1
27000 METER 1 .1
276 TON 1 .1
2800 AMMUNITION 1 .1
288 TON 1 .1
29000 CENTURY 1 .1
29000 KG 1 .1
3 BED 1 .1
3 GUNS 1 .1
3 TON 1 .1
30 AMMUNITION 1 .1
30 BARREL 1 .1
30 DOUBLE BARREL 4 .2
30 GUNS 12 .7
30 PISTLOS 1 .1
30 PISTOLS 18 1.0
30 RIFLES 2 .1
30 TON 3 .2
300 AMMUNITION 1 .1
300 BODY 3 .2
300 FT 5 .3
300 FTOLDING 1 .1
300 GUNS 1 .1
300 MAGZINE 1 .1
300 PACKS 1 .1
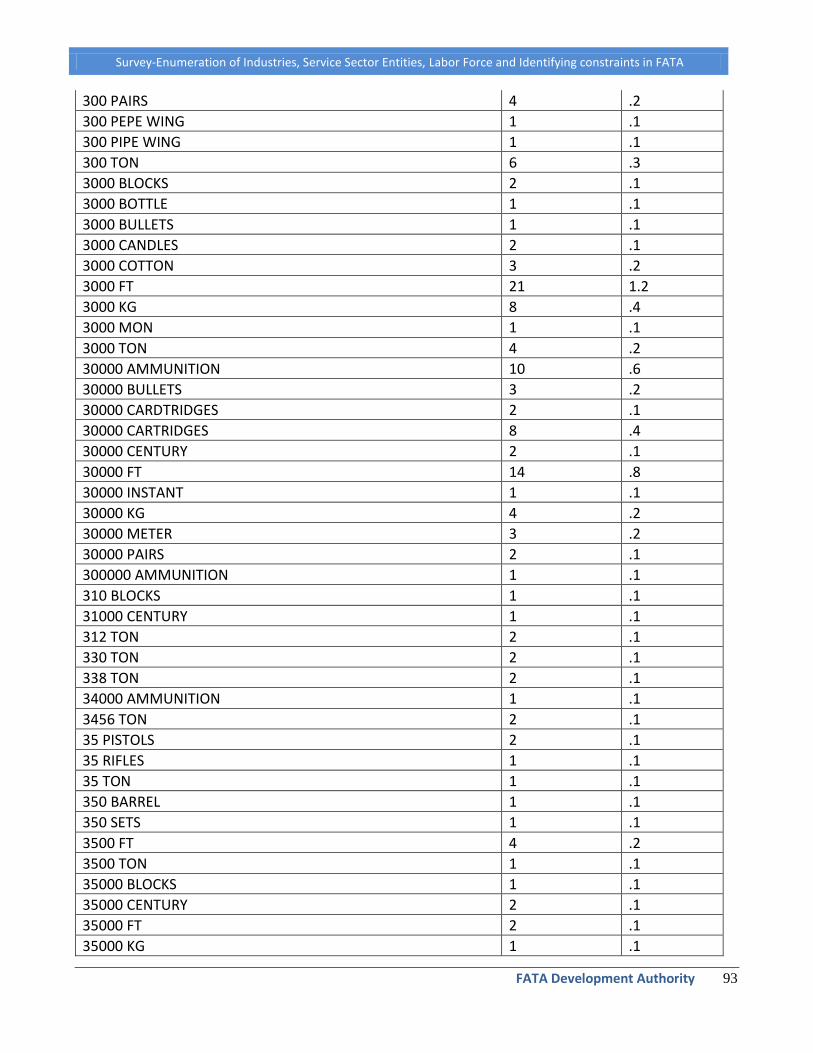
Survey-Enumeration of Industries, Service Sector Entities, Labor Force and Identifying constraints in FATA
FATA Development Authority 93
300 PAIRS 4 .2
300 PEPE WING 1 .1
300 PIPE WING 1 .1
300 TON 6 .3
3000 BLOCKS 2 .1
3000 BOTTLE 1 .1
3000 BULLETS 1 .1
3000 CANDLES 2 .1
3000 COTTON 3 .2
3000 FT 21 1.2
3000 KG 8 .4
3000 MON 1 .1
3000 TON 4 .2
30000 AMMUNITION 10 .6
30000 BULLETS 3 .2
30000 CARDTRIDGES 2 .1
30000 CARTRIDGES 8 .4
30000 CENTURY 2 .1
30000 FT 14 .8
30000 INSTANT 1 .1
30000 KG 4 .2
30000 METER 3 .2
30000 PAIRS 2 .1
300000 AMMUNITION 1 .1
310 BLOCKS 1 .1
31000 CENTURY 1 .1
312 TON 2 .1
330 TON 2 .1
338 TON 2 .1
34000 AMMUNITION 1 .1
3456 TON 2 .1
35 PISTOLS 2 .1
35 RIFLES 1 .1
35 TON 1 .1
350 BARREL 1 .1
350 SETS 1 .1
3500 FT 4 .2
3500 TON 1 .1
35000 BLOCKS 1 .1
35000 CENTURY 2 .1
35000 FT 2 .1
35000 KG 1 .1

Survey-Enumeration of Industries, Service Sector Entities, Labor Force and Identifying constraints in FATA
FATA Development Authority 94
35000 METER 2 .1
36 PISTOLS 1 .1
360 TON 1 .1
364 TON 1 .1
37000 CENTURY 1 .1
37000 FT 1 .1
37000 LITRE 1 .1
3744 TON 1 .1
375 COTTON 1 .1
390 TON 6 .3
4 COTTON 2 .1
4 DOUBLE BED 1 .1
4 GUNS 2 .1
4 PISTOLS 3 .2
4 SETS 2 .1
4.5 TON 1 .1
40 GUNS 2 .1
40 PISTOL 1 .1
40 PISTOLS 10 .6
40 RIFLES 1 .1
40 TON 1 .1
400 AMMUNITION 1 .1
400 BAG 3 .2
400 BARREL 2 .1
400 BODY 1 .1
400 FT 2 .1
400 GOODS 1 .1
400 GUNS 1 .1
400 KG 1 .1
400 LITRE 1 .1
400 PAIRS 4 .2
400 PIPE 1 .1
400 RIFLES 2 .1
400 SACKS 2 .1
400 SETS 2 .1
400 SINGLE BARREL 1 .1
400 TON 11 .6
4000 CANDELES 1 .1
4000 DOZEN 2 .1
4000 FT 17 .9
4000 SACKS 1 .1
4000 SOAP 5 .3

Survey-Enumeration of Industries, Service Sector Entities, Labor Force and Identifying constraints in FATA
FATA Development Authority 95
4000 TON 7 .4
40000 AMMUNITION 8 .4
40000 BULLETS 2 .1
40000 CARTRIDGES 10 .6
40000 CENTURY 1 .1
40000 FT 4 .2
40000 KG 1 .1
40000 METER 2 .1
40000 MONTHLY 1 .1
40000 POUND 1 .1
400000 AMMUNITION 1 .1
400000 FT 1 .1
4056 TON 1 .1
420 TON 1 .1
42000 LETIRE 1 .1
4320 TON 2 .1
4368 TON 1 .1
440 MATS 1 .1
440 TON 1 .1
442 TON 1 .1
45 GUNS 1 .1
45 PISTOLS 2 .1
450 BARREL 1 .1
450 COTTON 1 .1
450 FTOLDING 1 .1
450 PAIRS 2 .1
450 PARTS 1 .1
450 TON 5 .3
4500 TON 2 .1
45000 FT 1 .1
45000 KG 2 .1
45000 METER 1 .1
450000 KG 1 .1
460 TON 2 .1
468 TON 2 .1
48 TON 2 .1
480 TON 3 .2
4800 TON 1 .1
494 TON 1 .1
5 BED 3 .2
5 DOORS 2 .1
5 GUNS 4 .2
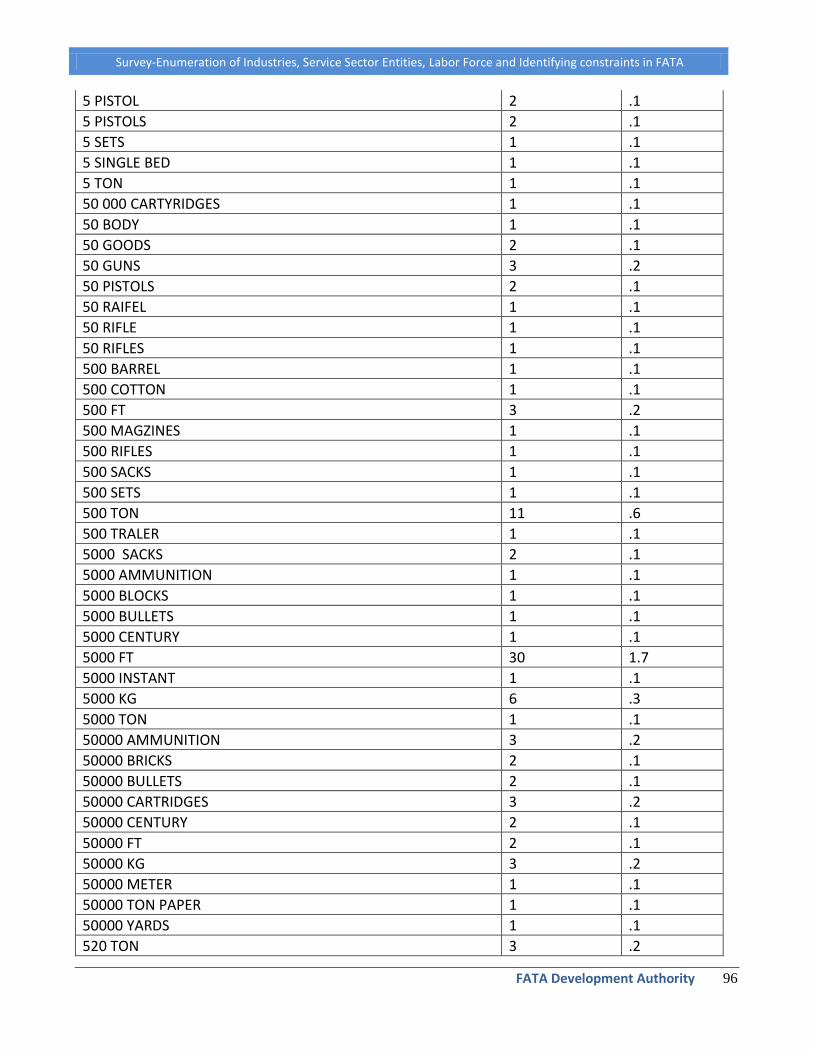
Survey-Enumeration of Industries, Service Sector Entities, Labor Force and Identifying constraints in FATA
FATA Development Authority 96
5 PISTOL 2 .1
5 PISTOLS 2 .1
5 SETS 1 .1
5 SINGLE BED 1 .1
5 TON 1 .1
50 000 CARTYRIDGES 1 .1
50 BODY 1 .1
50 GOODS 2 .1
50 GUNS 3 .2
50 PISTOLS 2 .1
50 RAIFEL 1 .1
50 RIFLE 1 .1
50 RIFLES 1 .1
500 BARREL 1 .1
500 COTTON 1 .1
500 FT 3 .2
500 MAGZINES 1 .1
500 RIFLES 1 .1
500 SACKS 1 .1
500 SETS 1 .1
500 TON 11 .6
500 TRALER 1 .1
5000 SACKS 2 .1
5000 AMMUNITION 1 .1
5000 BLOCKS 1 .1
5000 BULLETS 1 .1
5000 CENTURY 1 .1
5000 FT 30 1.7
5000 INSTANT 1 .1
5000 KG 6 .3
5000 TON 1 .1
50000 AMMUNITION 3 .2
50000 BRICKS 2 .1
50000 BULLETS 2 .1
50000 CARTRIDGES 3 .2
50000 CENTURY 2 .1
50000 FT 2 .1
50000 KG 3 .2
50000 METER 1 .1
50000 TON PAPER 1 .1
50000 YARDS 1 .1
520 TON 3 .2

Survey-Enumeration of Industries, Service Sector Entities, Labor Force and Identifying constraints in FATA
FATA Development Authority 97
550 TON 2 .1
5500 LITRE 1 .1
55000 FT 2 .1
55000 METER 1 .1
570 TON 1 .1
576 TRUCK 1 .1
598 TON 1 .1
6 GUNS 4 .2
6 PISTOLS 1 .1
6 RIFLE 1 .1
6 TON 1 .1
60 AMMUNITION 1 .1
60 GUNS 2 .1
60 PAIRS 1 .1
60 SETS 1 .1
60 TRALER 1 .1
600 AMMUNITION 1 .1
600 BARREL 5 .3
600 BLOCKS 2 .1
600 PAIRS 1 .1
600 RIFLES 1 .1
600 TON 11 .6
6000 SACKS 1 .1
6000 AMMUNITION 2 .1
6000 BLOCKS 2 .1
6000 BOTTLE 1 .1
6000 DOZEN 1 .1
6000 FT 12 .7
6000 KG 1 .1
6000 METER 1 .1
6000 TON 1 .1
60000 AMMUNITION 5 .3
60000 BRICKS 1 .1
60000 BULLETS 5 .3
60000 CARTRIDGES 3 .2
60000 CENTURY 3 .2
60000 FT 2 .1
60000 KG 3 .2
60000 METER 2 .1
60000 TON 3 .2
600000 AMMUNITION 2 .1
600000 BULLETS 1 .1

Survey-Enumeration of Industries, Service Sector Entities, Labor Force and Identifying constraints in FATA
FATA Development Authority 98
600000 FT 1 .1
62000 SETS 1 .1
625 TON 2 .1
6332 CENTURY 1 .1
64 TON 1 .1
650 PIPE 1 .1
650 TRALER 1 .1
65000 KG 3 .2
65000 METER 1 .1
6552 TON 1 .1
660 TON 7 .4
7 GUNS 1 .1
70 BODY 1 .1
70 COTTON 1 .1
70 GUNS 1 .1
70 SACKS 1 .1
70 SETS 1 .1
700 BARREL 2 .1
700 CENTURY 1 .1
700 FT 1 .1
700 KG 1 .1
700 MAGZINES 1 .1
700 SETS 2 .1
700 TRALER 1 .1
7000 AMMUNITION 4 .2
7000 BRICKS 3 .2
7000 FT 6 .3
7000 ICE CREAM 3 .2
7000 KG 1 .1
7000 LITRE 5 .3
7000 MAGZINE 1 .1
7000 SACKS 2 .1
7000 TON 1 .1
70000 AMMUNITION 2 .1
70000 BRICKS 1 .1
70000 CARTRIDGES 3 .2
70000 FT 3 .2
70000 KG 1 .1
70000 METER 2 .1
70000 POTS 1 .1
720 TON 1 .1
7488 TON 1 .1
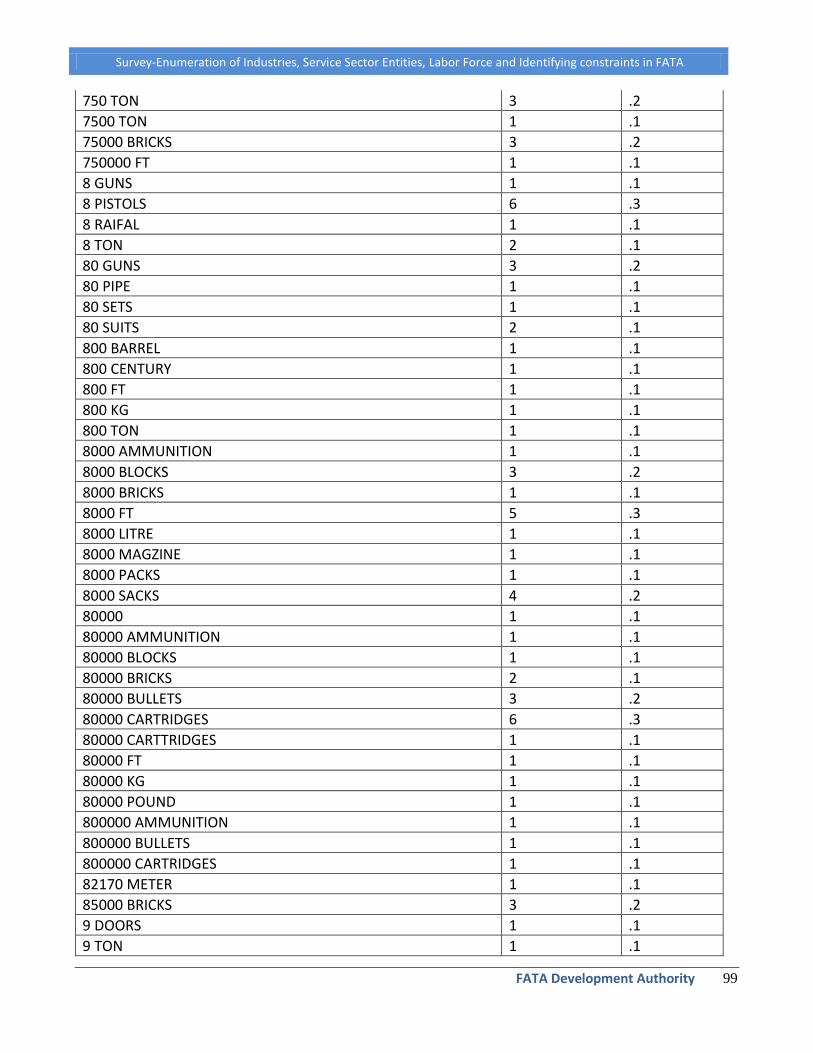
Survey-Enumeration of Industries, Service Sector Entities, Labor Force and Identifying constraints in FATA
FATA Development Authority 99
750 TON 3 .2
7500 TON 1 .1
75000 BRICKS 3 .2
750000 FT 1 .1
8 GUNS 1 .1
8 PISTOLS 6 .3
8 RAIFAL 1 .1
8 TON 2 .1
80 GUNS 3 .2
80 PIPE 1 .1
80 SETS 1 .1
80 SUITS 2 .1
800 BARREL 1 .1
800 CENTURY 1 .1
800 FT 1 .1
800 KG 1 .1
800 TON 1 .1
8000 AMMUNITION 1 .1
8000 BLOCKS 3 .2
8000 BRICKS 1 .1
8000 FT 5 .3
8000 LITRE 1 .1
8000 MAGZINE 1 .1
8000 PACKS 1 .1
8000 SACKS 4 .2
80000 1 .1
80000 AMMUNITION 1 .1
80000 BLOCKS 1 .1
80000 BRICKS 2 .1
80000 BULLETS 3 .2
80000 CARTRIDGES 6 .3
80000 CARTTRIDGES 1 .1
80000 FT 1 .1
80000 KG 1 .1
80000 POUND 1 .1
800000 AMMUNITION 1 .1
800000 BULLETS 1 .1
800000 CARTRIDGES 1 .1
82170 METER 1 .1
85000 BRICKS 3 .2
9 DOORS 1 .1
9 TON 1 .1
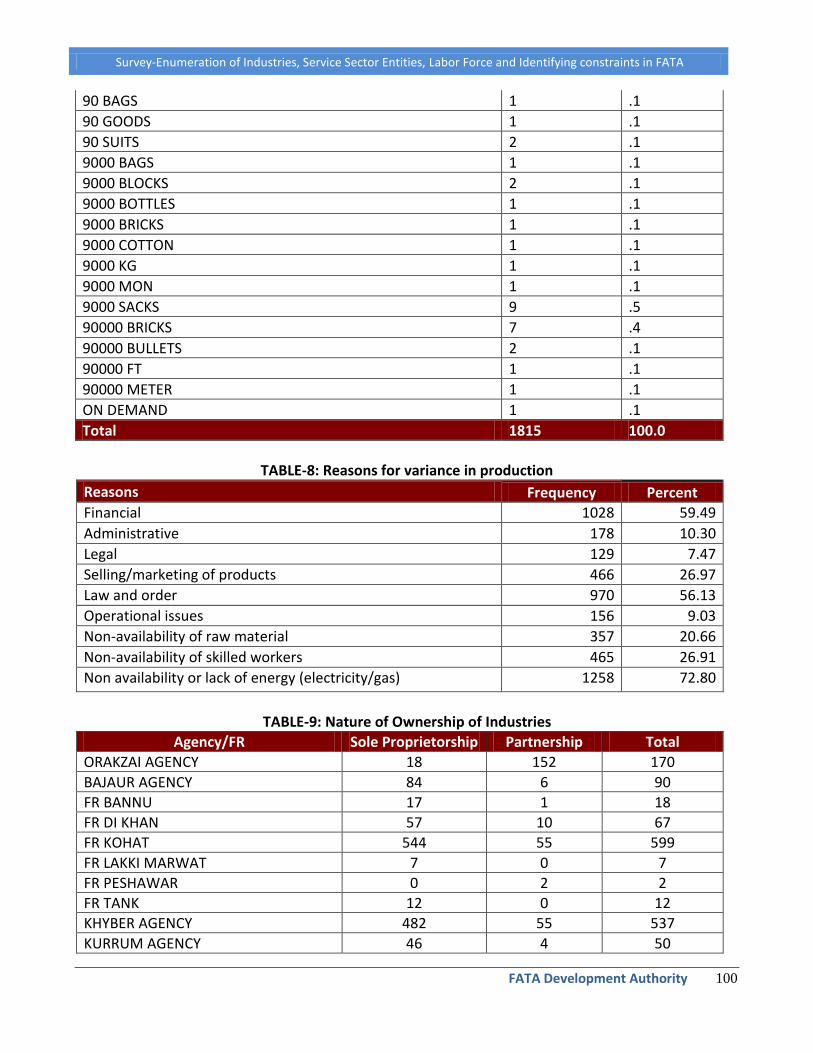
Survey-Enumeration of Industries, Service Sector Entities, Labor Force and Identifying constraints in FATA
FATA Development Authority 100
90 BAGS 1 .1
90 GOODS 1 .1
90 SUITS 2 .1
9000 BAGS 1 .1
9000 BLOCKS 2 .1
9000 BOTTLES 1 .1
9000 BRICKS 1 .1
9000 COTTON 1 .1
9000 KG 1 .1
9000 MON 1 .1
9000 SACKS 9 .5
90000 BRICKS 7 .4
90000 BULLETS 2 .1
90000 FT 1 .1
90000 METER 1 .1
ON DEMAND 1 .1
Total 1815 100.0
TABLE-8: Reasons for variance in production
Reasons Frequency Percent
Financial 1028 59.49
Administrative 178 10.30
Legal 129 7.47
Selling/marketing of products 466 26.97
Law and order 970 56.13
Operational issues 156 9.03
Non-availability of raw material 357 20.66
Non-availability of skilled workers 465 26.91
Non availability or lack of energy (electricity/gas) 1258 72.80
TABLE-9: Nature of Ownership of Industries
Agency/FR Sole Proprietorship Partnership Total
ORAKZAI AGENCY 18 152 170
BAJAUR AGENCY 84 6 90
FR BANNU 17 1 18
FR DI KHAN 57 10 67
FR KOHAT 544 55 599
FR LAKKI MARWAT 7 0 7
FR PESHAWAR 0 2 2
FR TANK 12 0 12
KHYBER AGENCY 482 55 537
KURRUM AGENCY 46 4 50

Survey-Enumeration of Industries, Service Sector Entities, Labor Force and Identifying constraints in FATA
FATA Development Authority 101
MOHMAND AGENCY 197 31 228
NORTH WAZERISTAN 24 2 26
SOUTH WAZIRISTAN 9 0 9
Total 1497 318 1815
TABLE-10: Source of finance
Source of Finance Frequency Percent
Personal Investment 1410 81.6
Loan/credit 8 .5
Both 310 17.9
Not contacted - (1) 87 4.8
Total 1815 100.0
TABLE-11: Source of Loan/credit
Loan/credit Frequency Percent
Bank 3 0.94
Private loaner/friend/relative 314 98.74
Both 1 0.31
Total 318
TABLE-12: Contact with bank for the business matters
Bank Contacts Frequency Percent
Yes 161 9.32
No 1567 90.68
N/A (not contacted) 87 4.79
Total 1815
TABLE-13: Annual markup on loan/credit
Markup on Loan Frequency Percent
0% 186 58.49
10% 10 3.14
13% 1 0.31
15% 27 8.49
17% 1 0.31
18% 26 8.18
19% 6 1.89
2% 1 0.31
20% 44 13.84
21% 2 0.63
22% 3 0.94
5% 7 2.20

Survey-Enumeration of Industries, Service Sector Entities, Labor Force and Identifying constraints in FATA
FATA Development Authority 102
50% 2 0.63
8% 2 0.63
Total 318
TABLE-14: Proportion of personal capital
Finance Proportion Personal Frequency Percent
05% 2 0.11
10% 1 0.06
100% 1410 77.69
20% 1 0.06
30% 29 1.60
40% 20 1.10
50% 36 1.98
60% 60 3.31
65% 3 0.17
70% 89 4.90
75% 4 0.22
80% 45 2.48
85% 7 0.39
90% 15 0.83
95% 2 0.11
Total 1724
TABLE-15: Proportion of Loan/credit
Finance Proportion Loan Frequency Percent
05% 2 0.11
10% 16 0.88
100% 4 0.22
15% 7 0.39
20% 45 2.48
25% 4 0.22
30% 89 4.90
35% 3 0.17
40% 60 3.31
50% 36 1.98
60% 20 1.10
70% 28 1.54
80% 1 0.06
90% 1 0.06
95% 2 0.11
Total 318

Survey-Enumeration of Industries, Service Sector Entities, Labor Force and Identifying constraints in FATA
FATA Development Authority 103
TABLE-16: How Business started?
Business Started Frequency Percent
After proper conducting feasibility study 640 37.04
After consultation with other such business people 960 55.56
Without planning and consultation 128 7.41
N/A (not contacted) 87 4.79
Total 1815
TABLE-17: Source of Energy
Source of Energy Frequency Percent
WAPDA / TESCO 1028 59.49
Through generator 21 1.22
Both 679 39.29
N/A (not contacted) 87 4.79
Total 1815
TABLE-18: Ratio of energy being utilized
I. WAPDA/TESCO: _________%.
Proportion of WAPDA/TESCO Frequency Percent
10% 135 7.81
100% 1028 59.49
15% 25 1.45
20% 75 4.34
25% 8 0.46
30% 202 11.69
40% 138 7.99
5% 11 0.64
50% 36 2.08
60% 13 0.75
70% 17 0.98
80% 13 0.75
90% 4 0.23
95% 2 0.12
II. Generator: _________%
Proportion of Generator Frequency Percent
10% 4
100% 21
20% 14
30% 17
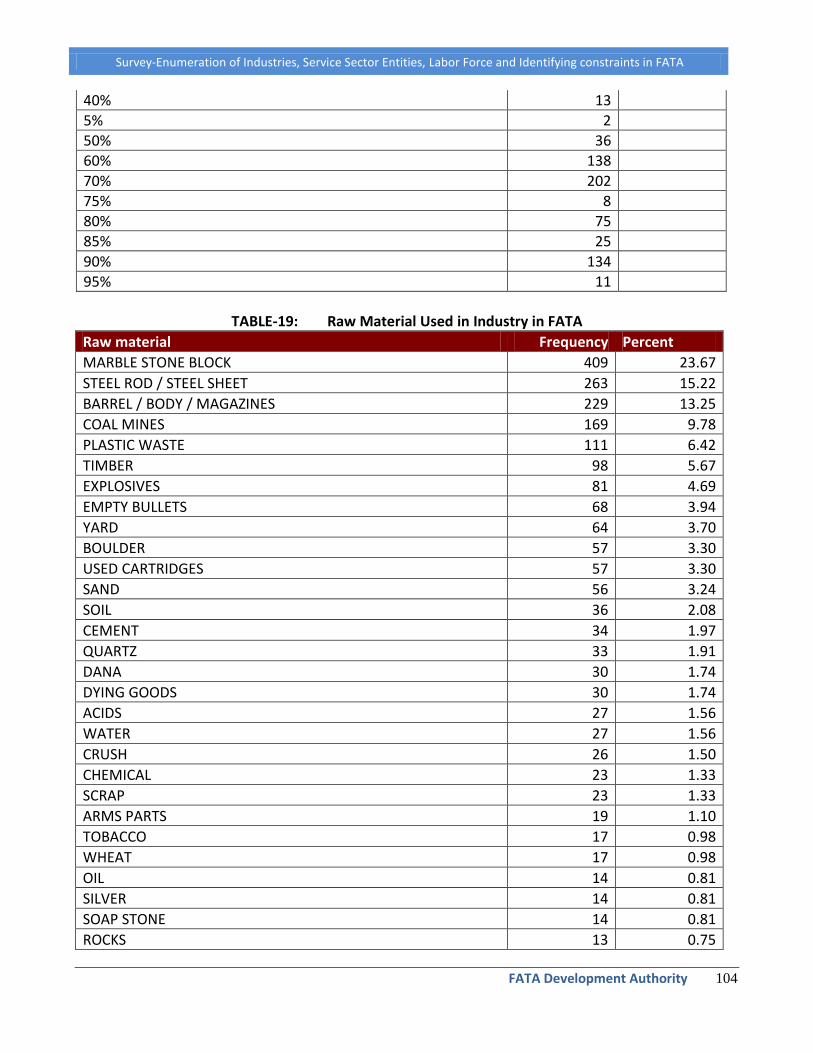
Survey-Enumeration of Industries, Service Sector Entities, Labor Force and Identifying constraints in FATA
FATA Development Authority 104
40% 13
5% 2
50% 36
60% 138
70% 202
75% 8
80% 75
85% 25
90% 134
95% 11
TABLE-19: Raw Material Used in Industry in FATA
Raw material Frequency Percent
MARBLE STONE BLOCK 409 23.67
STEEL ROD / STEEL SHEET 263 15.22
BARREL / BODY / MAGAZINES 229 13.25
COAL MINES 169 9.78
PLASTIC WASTE 111 6.42
TIMBER 98 5.67
EXPLOSIVES 81 4.69
EMPTY BULLETS 68 3.94
YARD 64 3.70
BOULDER 57 3.30
USED CARTRIDGES 57 3.30
SAND 56 3.24
SOIL 36 2.08
CEMENT 34 1.97
QUARTZ 33 1.91
DANA 30 1.74
DYING GOODS 30 1.74
ACIDS 27 1.56
WATER 27 1.56
CRUSH 26 1.50
CHEMICAL 23 1.33
SCRAP 23 1.33
ARMS PARTS 19 1.10
TOBACCO 17 0.98
WHEAT 17 0.98
OIL 14 0.81
SILVER 14 0.81
SOAP STONE 14 0.81
ROCKS 13 0.75
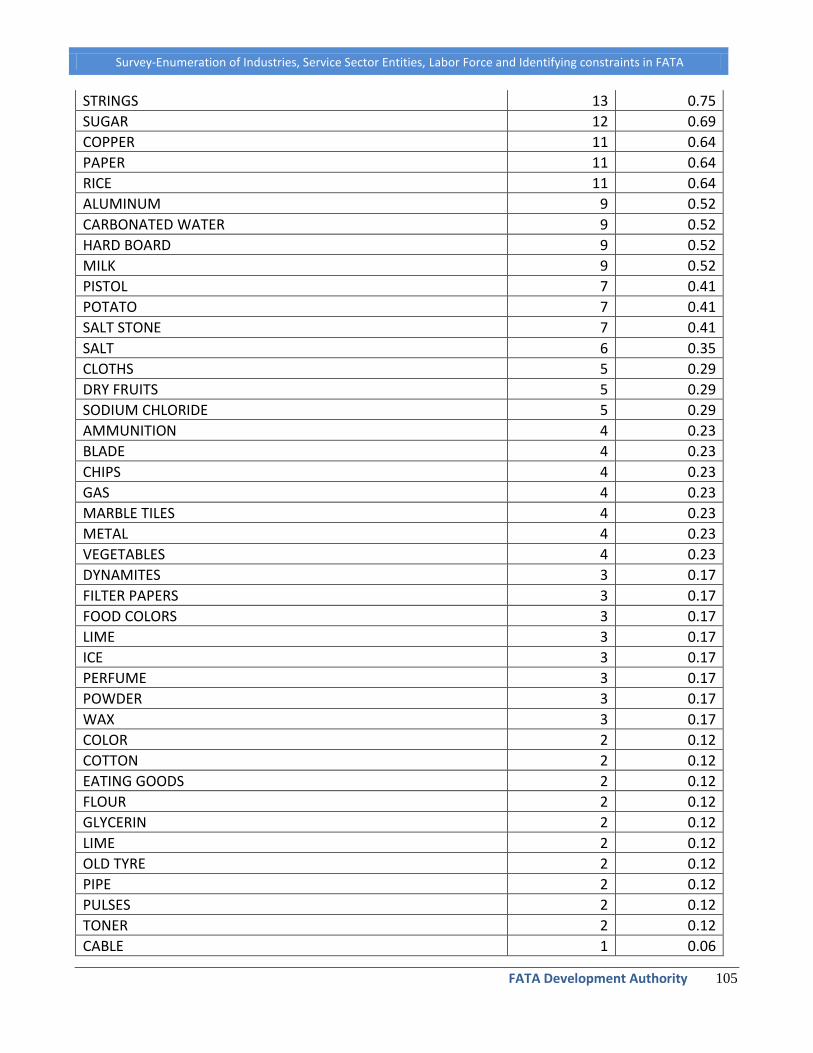
Survey-Enumeration of Industries, Service Sector Entities, Labor Force and Identifying constraints in FATA
FATA Development Authority 105
STRINGS 13 0.75
SUGAR 12 0.69
COPPER 11 0.64
PAPER 11 0.64
RICE 11 0.64
ALUMINUM 9 0.52
CARBONATED WATER 9 0.52
HARD BOARD 9 0.52
MILK 9 0.52
PISTOL 7 0.41
POTATO 7 0.41
SALT STONE 7 0.41
SALT 6 0.35
CLOTHS 5 0.29
DRY FRUITS 5 0.29
SODIUM CHLORIDE 5 0.29
AMMUNITION 4 0.23
BLADE 4 0.23
CHIPS 4 0.23
GAS 4 0.23
MARBLE TILES 4 0.23
METAL 4 0.23
VEGETABLES 4 0.23
DYNAMITES 3 0.17
FILTER PAPERS 3 0.17
FOOD COLORS 3 0.17
LIME 3 0.17
ICE 3 0.17
PERFUME 3 0.17
POWDER 3 0.17
WAX 3 0.17
COLOR 2 0.12
COTTON 2 0.12
EATING GOODS 2 0.12
FLOUR 2 0.12
GLYCERIN 2 0.12
LIME 2 0.12
OLD TYRE 2 0.12
PIPE 2 0.12
PULSES 2 0.12
TONER 2 0.12
CABLE 1 0.06

Survey-Enumeration of Industries, Service Sector Entities, Labor Force and Identifying constraints in FATA
FATA Development Authority 106
BUTTONS 1 0.06
COWARDS 1 0.06
CREAM 1 0.06
DIESEL 1 0.06
ELECTRIC GOODS 1 0.06
FOLDING 1 0.06
FOAM 1 0.06
GLASS 1 0.06
GREECE 1 0.06
GRAND 1 0.06
HINA POWDER 1 0.06
JEM 1 0.06
GYPSUM 1 0.06
LEATHER 1 0.06
LEAVES 1 0.06
MACHINE 1 0.06
MARBLE CHIPS 1 0.06
NAILS 1 0.06
MUD 1 0.06
PAINT 1 0.06
POPS 1 0.06
RUBBER 1 0.06
SPICES 1 0.06
STONE POWDER 1 0.06
SPRING 1 0.06
TABLE-20: Source of Imported Raw Material
Imported From Frequency Percent
N/A (No Import 1640 )Not contacted = 87) 1727 95.15%
AFGHANISTAN 78 4.30%
DUBAI, KOREA 1 0.06%
GERMANY,JAPAN 1 0.06%
IRAN 2 0.11%
KOREA 2 0.11%
KOREA, JAPAN 1 0.06%
SAUDIA ARABIA 1 0.06%
TAIWAN 2 0.11%
Total 1815 100.00%
TABLE-21 Source of local raw Material
Source Local (raw Material) Frequency Percent
N/A (Not Local Import: 25 and Not Contacted: 87) 112 6.2

Survey-Enumeration of Industries, Service Sector Entities, Labor Force and Identifying constraints in FATA
FATA Development Authority 107
AURAKZAI AGENCY 169 9.3
BAHADAR KHEIL 2 .1
BAJOUR AGENCY 39 2.1
BANNU 9 .5
BUNAIR 4 .2
BUNAIR, MALAGORI 18 1.0
BUNAIR, MOHMAND 5 .3
BUNAIR, MOHMAND, MALAGORI 5 .3
BUNAIR, MOHMAND, PARA CHINAR 1 .1
BUNAIR. MARDAN. MALAGORI 1 .1
BUNNU 10 .6
D.I. KHAN 16 .9
DABAR 1 .1
DARA ADAM KHEIL 296 16.3
DARGAI 1 .1
DARZANDA 4 .2
DAYRA 1 .1
DIFFENRENT PLACES 1 .1
DIR 1 .1
DIR, MALAGORI 1 .1
DRAZANDA 3 .2
FAISAL ABAD 13 .7
FAISAL KOT 5 .3
FR DI KHAN 28 1.5
FR KOHAT 3 .2
FR TANK 1 .1
GAROLI 4 .2
GHAMBAT 15 .8
GILGAT 1 .1
GOMAL 1 .1
GUJRANWALAN 15 .8
GUNDI 1 .1
JAMROD 1 .1
JUNDOLA 2 .1
KARACHI 16 .9
KARACHI, LAHORE 3 .2
KARADAMI 1 .1
KEWRA 2 .1
KHAR 7 .4
KHYBER 1 .1
KOHAT 8 .4
KURRAM 4 .2
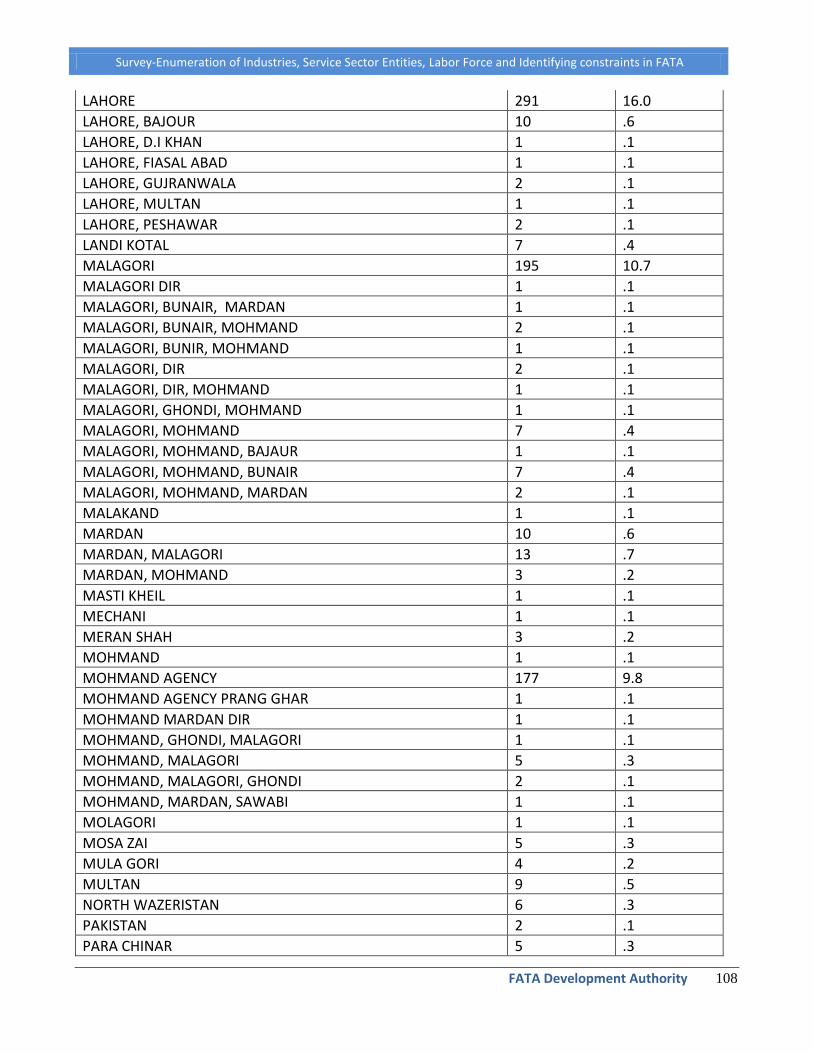
Survey-Enumeration of Industries, Service Sector Entities, Labor Force and Identifying constraints in FATA
FATA Development Authority 108
LAHORE 291 16.0
LAHORE, BAJOUR 10 .6
LAHORE, D.I KHAN 1 .1
LAHORE, FIASAL ABAD 1 .1
LAHORE, GUJRANWALA 2 .1
LAHORE, MULTAN 1 .1
LAHORE, PESHAWAR 2 .1
LANDI KOTAL 7 .4
MALAGORI 195 10.7
MALAGORI DIR 1 .1
MALAGORI, BUNAIR, MARDAN 1 .1
MALAGORI, BUNAIR, MOHMAND 2 .1
MALAGORI, BUNIR, MOHMAND 1 .1
MALAGORI, DIR 2 .1
MALAGORI, DIR, MOHMAND 1 .1
MALAGORI, GHONDI, MOHMAND 1 .1
MALAGORI, MOHMAND 7 .4
MALAGORI, MOHMAND, BAJAUR 1 .1
MALAGORI, MOHMAND, BUNAIR 7 .4
MALAGORI, MOHMAND, MARDAN 2 .1
MALAKAND 1 .1
MARDAN 10 .6
MARDAN, MALAGORI 13 .7
MARDAN, MOHMAND 3 .2
MASTI KHEIL 1 .1
MECHANI 1 .1
MERAN SHAH 3 .2
MOHMAND 1 .1
MOHMAND AGENCY 177 9.8
MOHMAND AGENCY PRANG GHAR 1 .1
MOHMAND MARDAN DIR 1 .1
MOHMAND, GHONDI, MALAGORI 1 .1
MOHMAND, MALAGORI 5 .3
MOHMAND, MALAGORI, GHONDI 2 .1
MOHMAND, MARDAN, SAWABI 1 .1
MOLAGORI 1 .1
MOSA ZAI 5 .3
MULA GORI 4 .2
MULTAN 9 .5
NORTH WAZERISTAN 6 .3
PAKISTAN 2 .1
PARA CHINAR 5 .3

Survey-Enumeration of Industries, Service Sector Entities, Labor Force and Identifying constraints in FATA
FATA Development Authority 109
PARANG GHAR 10 .6
PESHAWAR 110 6.1
PESHAWAR, LAHORE 2 .1
PESHAWAR, MECHANI, NIZAM POOR 1 .1
PESHAWAR,KARACHI 1 .1
PUNJAB 11 .6
QUETTA 1 .1
RAGHGAN 12 .7
SAHIRANI 1 .1
SAIDU 1 .1
SAMAR BAGH 1 .1
SARGODHA 1 .1
SAWABI 12 .7
SAWABI,MARDAN 1 .1
SHAYRANI 1 .1
SINDH 1 .1
SIYALKOT 1 .1
SRAAI NOORANG 1 .1
SWAT 10 .6
TANK 3 .2
TEMAR GARA 6 .3
TORKHAM 2 .1
WALI KOT 4 .2
Total 1815 100.0
Table-22. Number of skilled workers:
Number of Skilled workers Frequency Percent
0 10 0.6
1 74 4.1
2 295 16.3
3 324 17.9
4 195 10.7
5 147 8.1
6 94 5.2
7 42 2.3
8 83 4.6
9 16 0.9
10 74 4.1
11 5 0.3
12 23 1.3
13 13 0.7
14 15 0.8
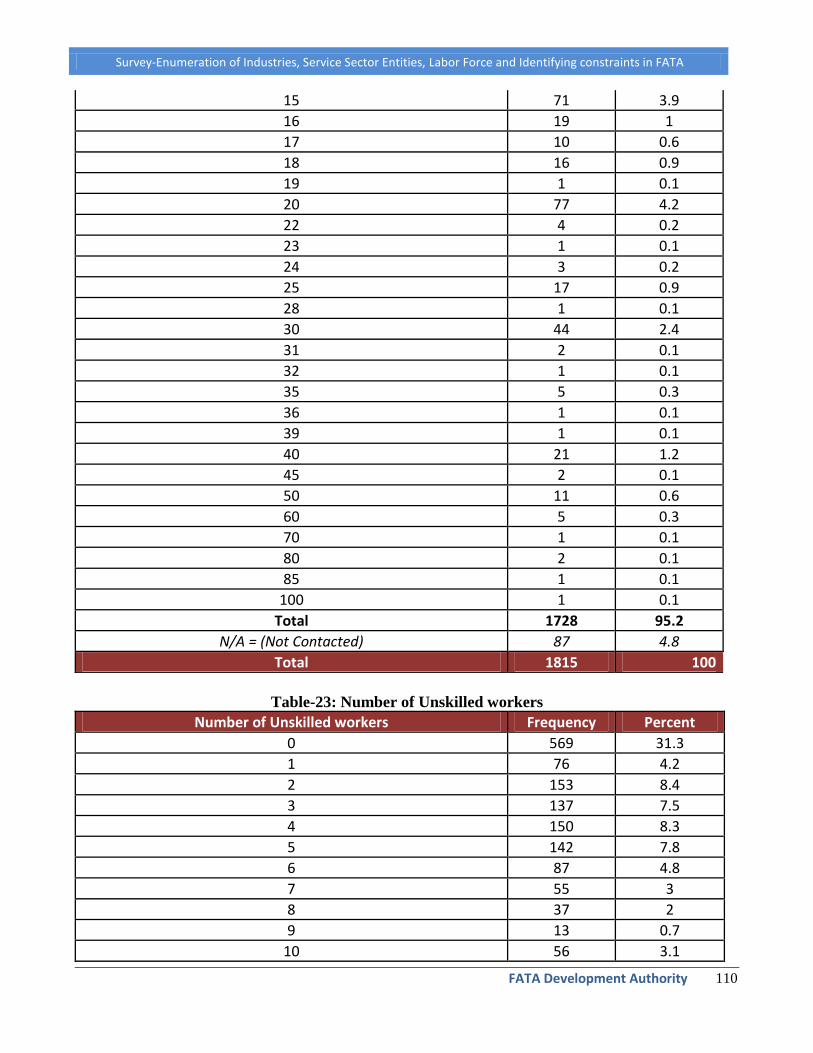
Survey-Enumeration of Industries, Service Sector Entities, Labor Force and Identifying constraints in FATA
FATA Development Authority 110
15 71 3.9
16 19 1
17 10 0.6
18 16 0.9
19 1 0.1
20 77 4.2
22 4 0.2
23 1 0.1
24 3 0.2
25 17 0.9
28 1 0.1
30 44 2.4
31 2 0.1
32 1 0.1
35 5 0.3
36 1 0.1
39 1 0.1
40 21 1.2
45 2 0.1
50 11 0.6
60 5 0.3
70 1 0.1
80 2 0.1
85 1 0.1
100 1 0.1
Total 1728 95.2
N/A = (Not Contacted) 87 4.8
Total 1815 100
Table-23: Number of Unskilled workers
Number of Unskilled workers Frequency Percent
0 569 31.3
1 76 4.2
2 153 8.4
3 137 7.5
4 150 8.3
5 142 7.8
6 87 4.8
7 55 3
8 37 2
9 13 0.7
10 56 3.1

Survey-Enumeration of Industries, Service Sector Entities, Labor Force and Identifying constraints in FATA
FATA Development Authority 111
11 9 0.5
12 26 1.4
13 10 0.6
14 1 0.1
15 28 1.5
16 5 0.3
17 2 0.1
18 3 0.2
20 28 1.5
21 1 0.1
22 1 0.1
23 1 0.1
25 12 0.7
30 31 1.7
31 1 0.1
35 5 0.3
40 31 1.7
44 1 0.1
45 2 0.1
46 1 0.1
50 23 1.3
60 6 0.3
70 8 0.4
80 6 0.3
85 2 0.1
90 2 0.1
95 1 0.1
100 4 0.2
250 1 0.1
500 1 0.1
Total 1728 95.2
NA/ (Not Contacted) 87 4.8
Total 1815 100
TABLE-24 (a) - Age of Workers Below 18
Number of Workers Below 18 Years Frequency Percent
0 978 53.9
1 234 12.9
2 229 12.6
3 98 5.4
4 39 2.1
5 54 3

Survey-Enumeration of Industries, Service Sector Entities, Labor Force and Identifying constraints in FATA
FATA Development Authority 112
6 9 0.5
7 6 0.3
8 9 0.5
9 4 0.2
10 44 2.4
11 1 0.1
12 2 0.1
14 2 0.1
15 6 0.3
20 6 0.3
25 3 0.2
30 2 0.1
35 2 0.1
Total 1728 95.2
N/A (Not Contacted) 87 4.8
Total 1815 100
TABLE-24 (b) - Age of Workers 18-25 Years
Number of Workers 18 - 25 Years Frequency Percent
0 160 8.8
1 190 10.5
2 384 21.2
3 196 10.8
4 173 9.5
5 140 7.7
6 49 2.7
7 28 1.5
8 36 2
9 8 0.4
10 124 6.8
11 3 0.2
12 16 0.9
13 3 0.2
14 11 0.6
15 57 3.1
16 2 0.1
17 1 0.1
18 1 0.1
20 86 4.7
23 2 0.1
25 9 0.5
26 1 0.1
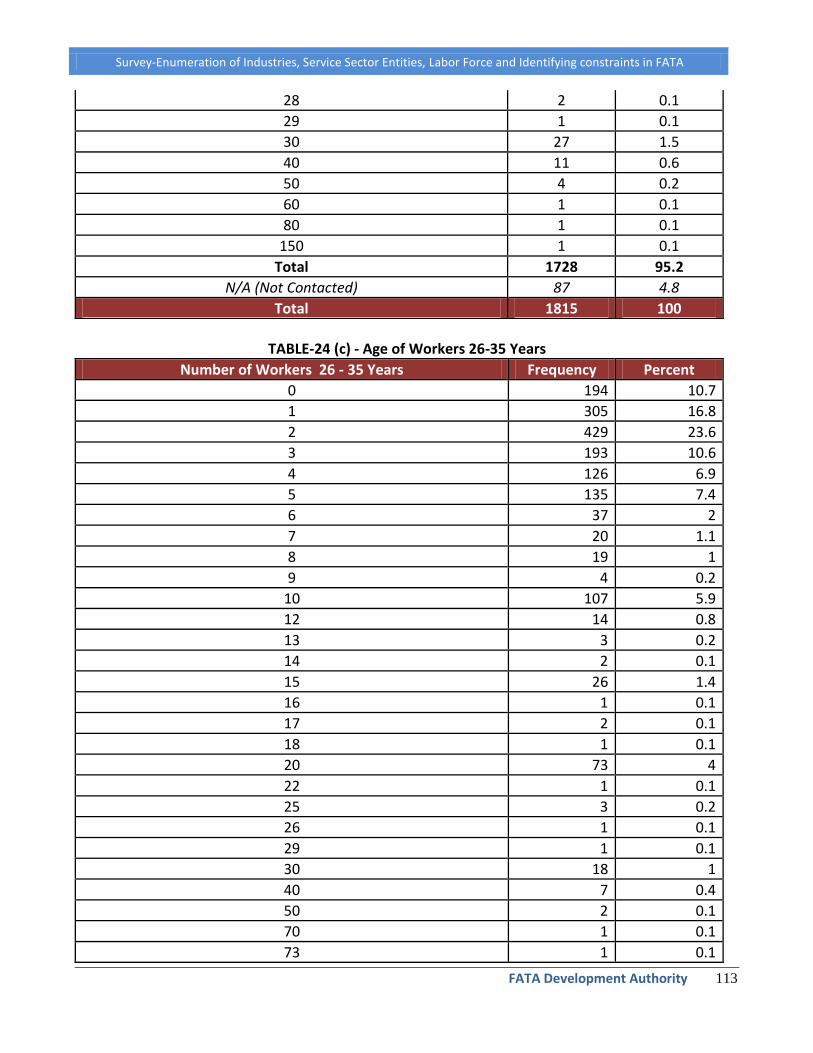
Survey-Enumeration of Industries, Service Sector Entities, Labor Force and Identifying constraints in FATA
FATA Development Authority 113
28 2 0.1
29 1 0.1
30 27 1.5
40 11 0.6
50 4 0.2
60 1 0.1
80 1 0.1
150 1 0.1
Total 1728 95.2
N/A (Not Contacted) 87 4.8
Total 1815 100
TABLE-24 (c) - Age of Workers 26-35 Years
Number of Workers 26 - 35 Years Frequency Percent
0 194 10.7
1 305 16.8
2 429 23.6
3 193 10.6
4 126 6.9
5 135 7.4
6 37 2
7 20 1.1
8 19 1
9 4 0.2
10 107 5.9
12 14 0.8
13 3 0.2
14 2 0.1
15 26 1.4
16 1 0.1
17 2 0.1
18 1 0.1
20 73 4
22 1 0.1
25 3 0.2
26 1 0.1
29 1 0.1
30 18 1
40 7 0.4
50 2 0.1
70 1 0.1
73 1 0.1

Survey-Enumeration of Industries, Service Sector Entities, Labor Force and Identifying constraints in FATA
FATA Development Authority 114
80 1 0.1
200 1 0.1
Total 1728 95.2
N/A (Not Contacted) 87 4.8
Total 1815 100
TABLE-24 (d) - Age of Workers 36-45 Years
Number of Workers 36 - 45 Years Frequency Percent
0 780 43
1 385 21.2
2 241 13.3
3 70 3.9
4 32 1.8
5 52 2.9
6 14 0.8
7 4 0.2
8 8 0.4
9 1 0.1
10 75 4.1
11 1 0.1
12 2 0.1
13 1 0.1
15 10 0.6
18 1 0.1
20 29 1.6
25 2 0.1
30 8 0.4
40 4 0.2
50 5 0.3
60 1 0.1
200 2 0.1
Total 1728 95.2
N/A (Not Contacted) 87 4.8
Total 1815 100
TABLE-24 (e) - Age of Workers 46-55 Years
Number of Workers 46 - 55 Years Frequency Percent
0 1488 82
1 62 3.4
2 59 3.3
3 21 1.2
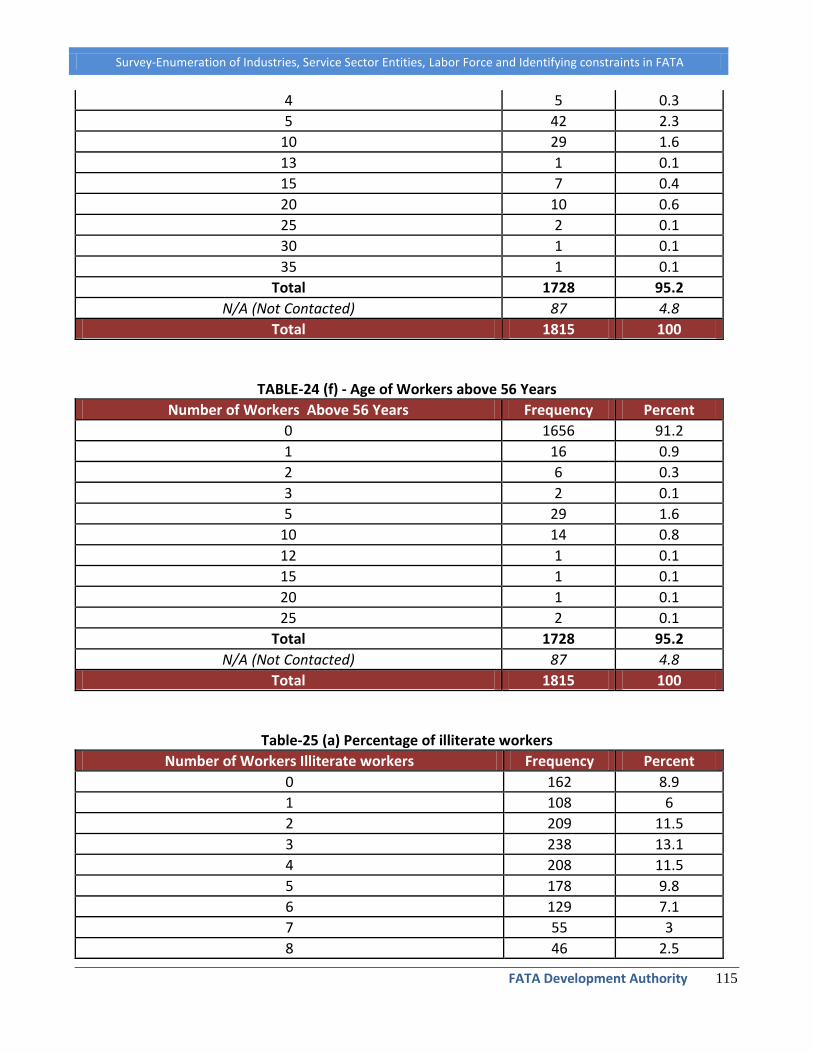
Survey-Enumeration of Industries, Service Sector Entities, Labor Force and Identifying constraints in FATA
FATA Development Authority 115
4 5 0.3
5 42 2.3
10 29 1.6
13 1 0.1
15 7 0.4
20 10 0.6
25 2 0.1
30 1 0.1
35 1 0.1
Total 1728 95.2
N/A (Not Contacted) 87 4.8
Total 1815 100
TABLE-24 (f) - Age of Workers above 56 Years
Number of Workers Above 56 Years Frequency Percent
0 1656 91.2
1 16 0.9
2 6 0.3
3 2 0.1
5 29 1.6
10 14 0.8
12 1 0.1
15 1 0.1
20 1 0.1
25 2 0.1
Total 1728 95.2
N/A (Not Contacted) 87 4.8
Total 1815 100
Table-25 (a) Percentage of illiterate workers
Number of Workers Illiterate workers Frequency Percent
0 162 8.9
1 108 6
2 209 11.5
3 238 13.1
4 208 11.5
5 178 9.8
6 129 7.1
7 55 3
8 46 2.5

Survey-Enumeration of Industries, Service Sector Entities, Labor Force and Identifying constraints in FATA
FATA Development Authority 116
9 15 0.8
10 107 5.9
11 4 0.2
12 16 0.9
13 7 0.4
14 10 0.6
15 37 2
16 4 0.2
17 3 0.2
18 7 0.4
20 70 3.9
21 1 0.1
23 2 0.1
25 9 0.5
26 3 0.2
27 3 0.2
28 2 0.1
30 52 2.9
32 1 0.1
35 4 0.2
40 17 0.9
50 5 0.3
60 2 0.1
70 6 0.3
80 3 0.2
90 2 0.1
95 1 0.1
100 1 0.1
250 1 0.1
Total 1728 95.2
N/A (Not Contacted) 87 4.8
Total 1815 100
Table-25 (b) Percentage of workers with education level of Primary
Number of Workers Primary Frequency Percent
0 447 24.6
1 286 15.8
2 295 16.3
3 162 8.9
4 95 5.2
5 161 8.9
6 37 2

Survey-Enumeration of Industries, Service Sector Entities, Labor Force and Identifying constraints in FATA
FATA Development Authority 117
7 21 1.2
8 12 0.7
9 3 0.2
10 108 6
11 1 0.1
12 2 0.1
13 2 0.1
14 1 0.1
15 24 1.3
17 2 0.1
20 45 2.5
21 2 0.1
22 1 0.1
25 8 0.4
30 6 0.3
35 2 0.1
40 2 0.1
45 1 0.1
50 1 0.1
200 1 0.1
Total 1728 95.2
N/A (Not Contacted) 87 4.8
Total 1815 100
Table-25 (c) Percentage of workers with education level of Middle (1 – 8 Classes)
Number of Workers Middle Frequency Percent
0 777 42.8
1 304 16.7
2 225 12.4
3 91 5
4 58 3.2
5 101 5.6
6 15 0.8
7 5 0.3
8 15 0.8
9 2 0.1
10 73 4
11 1 0.1
13 1 0.1
15 21 1.2
16 3 0.2

Survey-Enumeration of Industries, Service Sector Entities, Labor Force and Identifying constraints in FATA
FATA Development Authority 118
17 2 0.1
18 2 0.1
20 20 1.1
24 1 0.1
25 1 0.1
30 5 0.3
40 1 0.1
50 3 0.2
100 1 0.1
Total 1728 95.2
N/A (Not Contacted) 87 4.8
Total 1815 100
Table-25 (d) Percentage of workers with education level of High School (1 – 10 Classes)
Metric Frequency Percent
0 1095 60.3
1 195 10.7
2 174 9.6
3 48 2.6
4 23 1.3
5 77 4.2
6 8 0.4
7 4 0.2
8 6 0.3
9 1 0.1
10 60 3.3
14 1 0.1
15 14 0.8
16 2 0.1
20 10 0.6
25 2 0.1
30 2 0.1
40 2 0.1
50 1 0.1
60 1 0.1
75 1 0.1
100 1 0.1
Total 1728 95.2
N/A (Not Contacted) 87 4.8
Total 1815 100

Survey-Enumeration of Industries, Service Sector Entities, Labor Force and Identifying constraints in FATA
FATA Development Authority 119
Table-25 (e) Percentage of workers with education level of Higher Secondary (1 – 12 Classes)
Number of Workers Intermediate Frequency Percent
0 1589 87.5
1 56 3.1
2 42 2.3
3 10 0.6
5 22 1.2
10 6 0.3
20 1 0.1
25 2 0.1
Total 1728 95.2
N/A (Not Contacted) 87 4.8
Total 1815 100
Table-25 (f) Percentage of workers with education level of Bachelor Degree
Number of Workers Graduate Frequency Percent
0 1688 93
1 23 1.3
2 4 0.2
3 2 0.1
4 1 0.1
5 3 0.2
7 2 0.1
10 1 0.1
15 1 0.1
20 2 0.1
80 1 0.1
Total 1728 95.2
N/A (Not Contacted) 87 4.8
Total 1815 100
Table-25 (g) Percentage of workers with education level of Masters Degree
Number of Workers Master Frequency Percent
0 1717 94.6
1 9 0.5
2 2 0.1
Total 1728 95.2
N/A (Not Contacted) 87 4.8
Total 1815 100
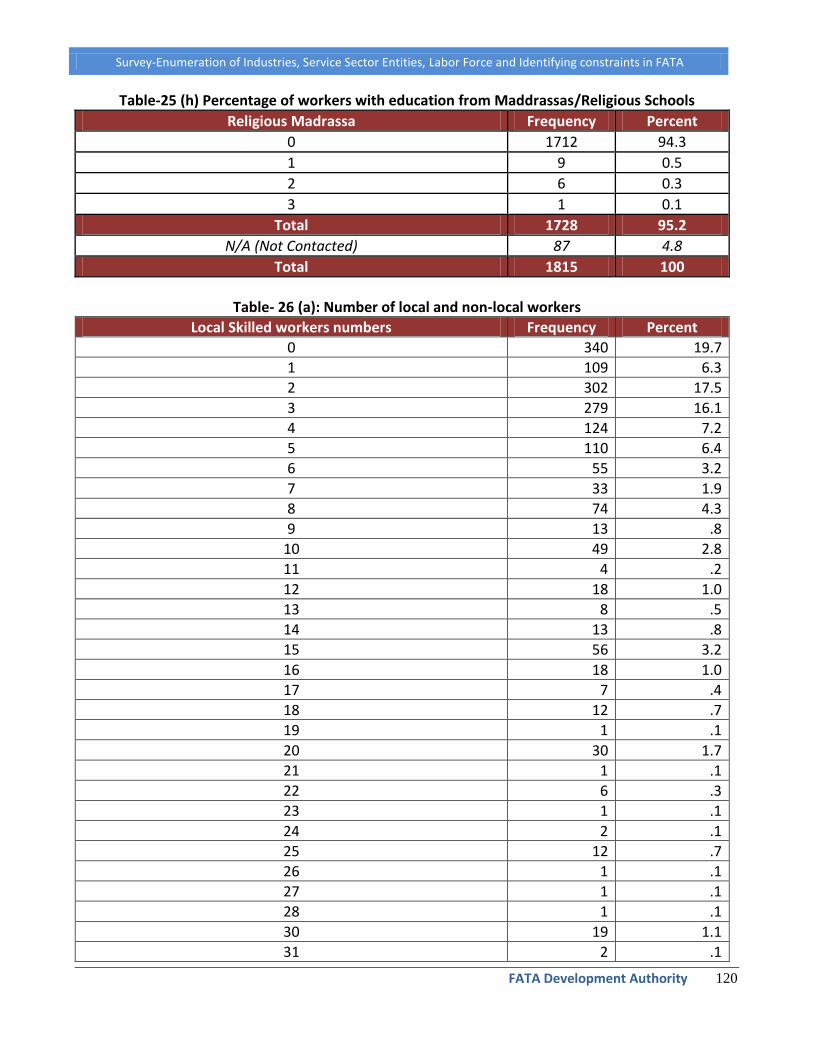
Survey-Enumeration of Industries, Service Sector Entities, Labor Force and Identifying constraints in FATA
FATA Development Authority 120
Table-25 (h) Percentage of workers with education from Maddrassas/Religious Schools
Religious Madrassa Frequency Percent
0 1712 94.3
1 9 0.5
2 6 0.3
3 1 0.1
Total 1728 95.2
N/A (Not Contacted) 87 4.8
Total 1815 100
Table- 26 (a): Number of local and non-local workers
Local Skilled workers numbers Frequency Percent
0 340 19.7
1 109 6.3
2 302 17.5
3 279 16.1
4 124 7.2
5 110 6.4
6 55 3.2
7 33 1.9
8 74 4.3
9 13 .8
10 49 2.8
11 4 .2
12 18 1.0
13 8 .5
14 13 .8
15 56 3.2
16 18 1.0
17 7 .4
18 12 .7
19 1 .1
20 30 1.7
21 1 .1
22 6 .3
23 1 .1
24 2 .1
25 12 .7
26 1 .1
27 1 .1
28 1 .1
30 19 1.1
31 2 .1
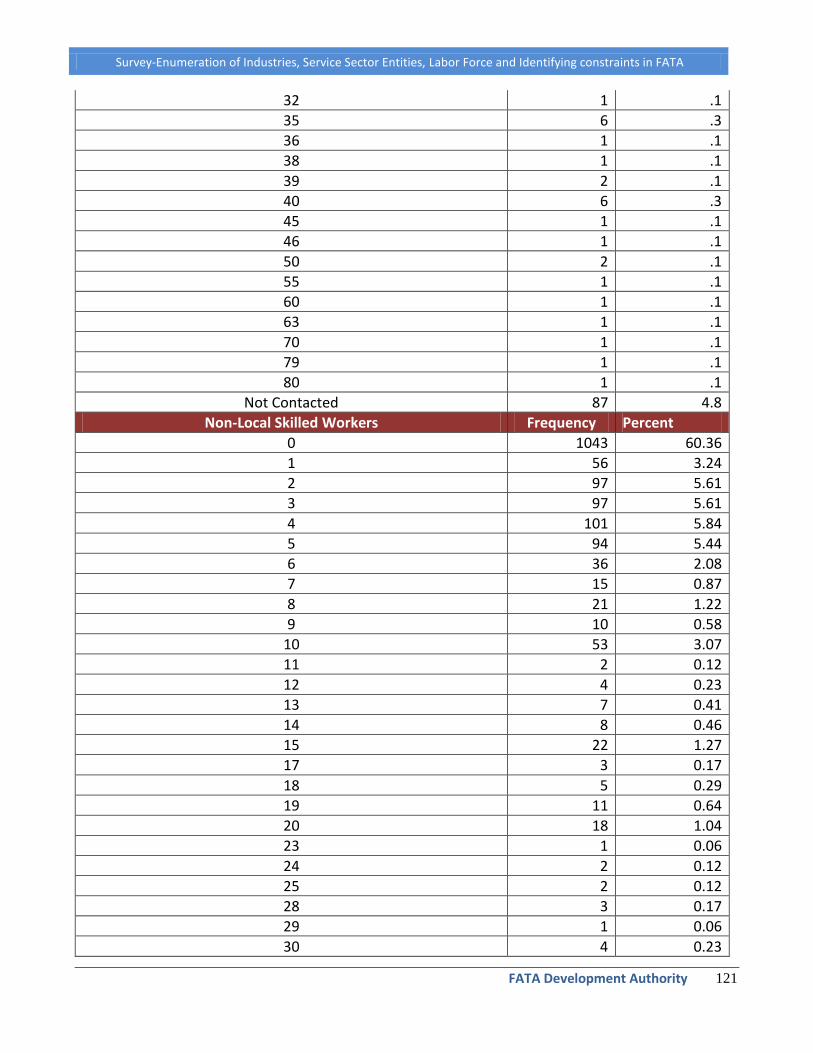
Survey-Enumeration of Industries, Service Sector Entities, Labor Force and Identifying constraints in FATA
FATA Development Authority 121
32 1 .1
35 6 .3
36 1 .1
38 1 .1
39 2 .1
40 6 .3
45 1 .1
46 1 .1
50 2 .1
55 1 .1
60 1 .1
63 1 .1
70 1 .1
79 1 .1
80 1 .1
Not Contacted 87 4.8
Non-Local Skilled Workers Frequency Percent
0 1043 60.36
1 56 3.24
2 97 5.61
3 97 5.61
4 101 5.84
5 94 5.44
6 36 2.08
7 15 0.87
8 21 1.22
9 10 0.58
10 53 3.07
11 2 0.12
12 4 0.23
13 7 0.41
14 8 0.46
15 22 1.27
17 3 0.17
18 5 0.29
19 11 0.64
20 18 1.04
23 1 0.06
24 2 0.12
25 2 0.12
28 3 0.17
29 1 0.06
30 4 0.23

Survey-Enumeration of Industries, Service Sector Entities, Labor Force and Identifying constraints in FATA
FATA Development Authority 122
34 1 0.06
35 4 0.23
38 1 0.06
40 2 0.12
42 1 0.06
45 1 0.06
50 1 0.06
75 1 0.06
Not Contacted 87
Total 1815
Table- 26 (b): Origin of workers
Non-Local Workers Belongs to Frequency Percent
NA (No Import=1092, Not Contacted:=87) 1179 65.0
AFGHANISTAN 6 .3
AKA KHEIL 1 .1
AKORA KHATTAK 1 .1
ATTOCK 8 .4
ATTOCK PESHAWAR 1 .1
AZA KHEIL 20 1.1
AZAKHEIL, NOHSERA, MATANI 2 .1
BADH BAIR 6 .3
BAJOUR 3 .2
BALOCHISTAN 1 .1
BANNU 9 .5
BARA 1 .1
BARA KHYBER AGENCY 3 .2
BUNER 2 .1
BUNER, MARDAN 1 .1
CHARSADDA 28 1.5
CHARSADDA, AZA KHEIL, MARDAN 1 .1
CHARSADDA, MARDAN, AZAKHEIL 2 .1
CHARSADDA, MASHUKHEIL, PESHAWAR 1 .1
CHARSADDA, PESHAWAR 2 .1
D.I KHAN 5 .3
DI KHAN, KARAK, LAHORE 1 .1
DIFFERENT PLACES 1 .1
DIR 16 .9
DIR & SWAT 102 5.6
FAISAL ABAD 7 .4
FATEH JHANG 2 .1
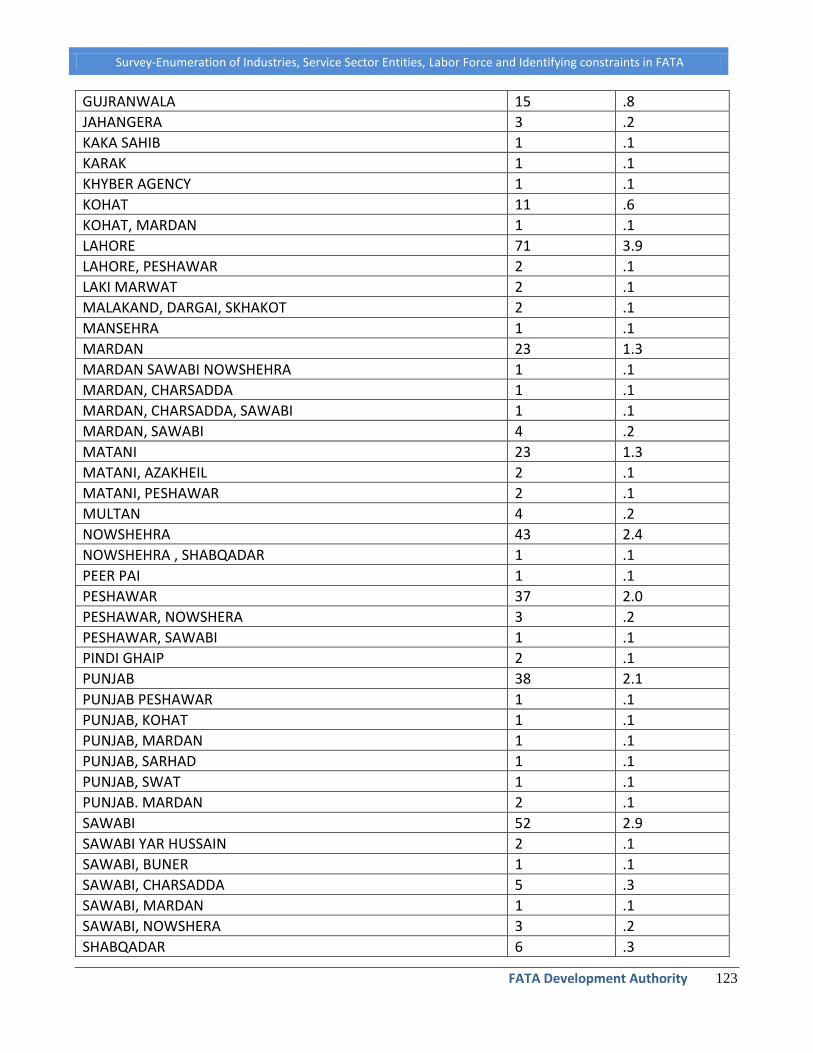
Survey-Enumeration of Industries, Service Sector Entities, Labor Force and Identifying constraints in FATA
FATA Development Authority 123
GUJRANWALA 15 .8
JAHANGERA 3 .2
KAKA SAHIB 1 .1
KARAK 1 .1
KHYBER AGENCY 1 .1
KOHAT 11 .6
KOHAT, MARDAN 1 .1
LAHORE 71 3.9
LAHORE, PESHAWAR 2 .1
LAKI MARWAT 2 .1
MALAKAND, DARGAI, SKHAKOT 2 .1
MANSEHRA 1 .1
MARDAN 23 1.3
MARDAN SAWABI NOWSHEHRA 1 .1
MARDAN, CHARSADDA 1 .1
MARDAN, CHARSADDA, SAWABI 1 .1
MARDAN, SAWABI 4 .2
MATANI 23 1.3
MATANI, AZAKHEIL 2 .1
MATANI, PESHAWAR 2 .1
MULTAN 4 .2
NOWSHEHRA 43 2.4
NOWSHEHRA , SHABQADAR 1 .1
PEER PAI 1 .1
PESHAWAR 37 2.0
PESHAWAR, NOWSHERA 3 .2
PESHAWAR, SAWABI 1 .1
PINDI GHAIP 2 .1
PUNJAB 38 2.1
PUNJAB PESHAWAR 1 .1
PUNJAB, KOHAT 1 .1
PUNJAB, MARDAN 1 .1
PUNJAB, SARHAD 1 .1
PUNJAB, SWAT 1 .1
PUNJAB. MARDAN 2 .1
SAWABI 52 2.9
SAWABI YAR HUSSAIN 2 .1
SAWABI, BUNER 1 .1
SAWABI, CHARSADDA 5 .3
SAWABI, MARDAN 1 .1
SAWABI, NOWSHERA 3 .2
SHABQADAR 6 .3
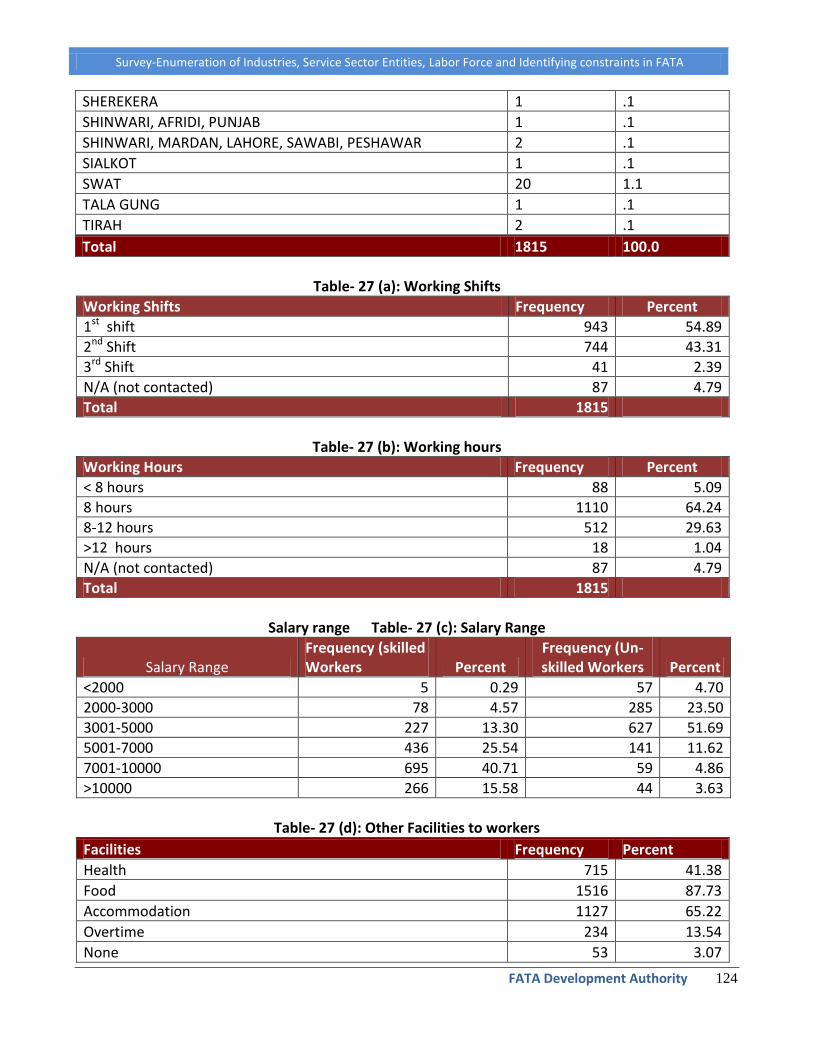
Survey-Enumeration of Industries, Service Sector Entities, Labor Force and Identifying constraints in FATA
FATA Development Authority 124
SHEREKERA 1 .1
SHINWARI, AFRIDI, PUNJAB 1 .1
SHINWARI, MARDAN, LAHORE, SAWABI, PESHAWAR 2 .1
SIALKOT 1 .1
SWAT 20 1.1
TALA GUNG 1 .1
TIRAH 2 .1
Total 1815 100.0
Table- 27 (a): Working Shifts
Working Shifts Frequency Percent
1st shift 943 54.89
2nd Shift 744 43.31
3rd Shift 41 2.39
N/A (not contacted) 87 4.79
Total 1815
Table- 27 (b): Working hours
Working Hours Frequency Percent
< 8 hours 88 5.09
8 hours 1110 64.24
8-12 hours 512 29.63
>12 hours 18 1.04
N/A (not contacted) 87 4.79
Total 1815
Salary range Table- 27 (c): Salary Range
Salary Range Frequency (skilled Workers Percent
Frequency (Un-skilled Workers Percent
<2000 5 0.29 57 4.70
2000-3000 78 4.57 285 23.50
3001-5000 227 13.30 627 51.69
5001-7000 436 25.54 141 11.62
7001-10000 695 40.71 59 4.86
>10000 266 15.58 44 3.63
Table- 27 (d): Other Facilities to workers
Facilities Frequency Percent
Health 715 41.38
Food 1516 87.73
Accommodation 1127 65.22
Overtime 234 13.54
None 53 3.07
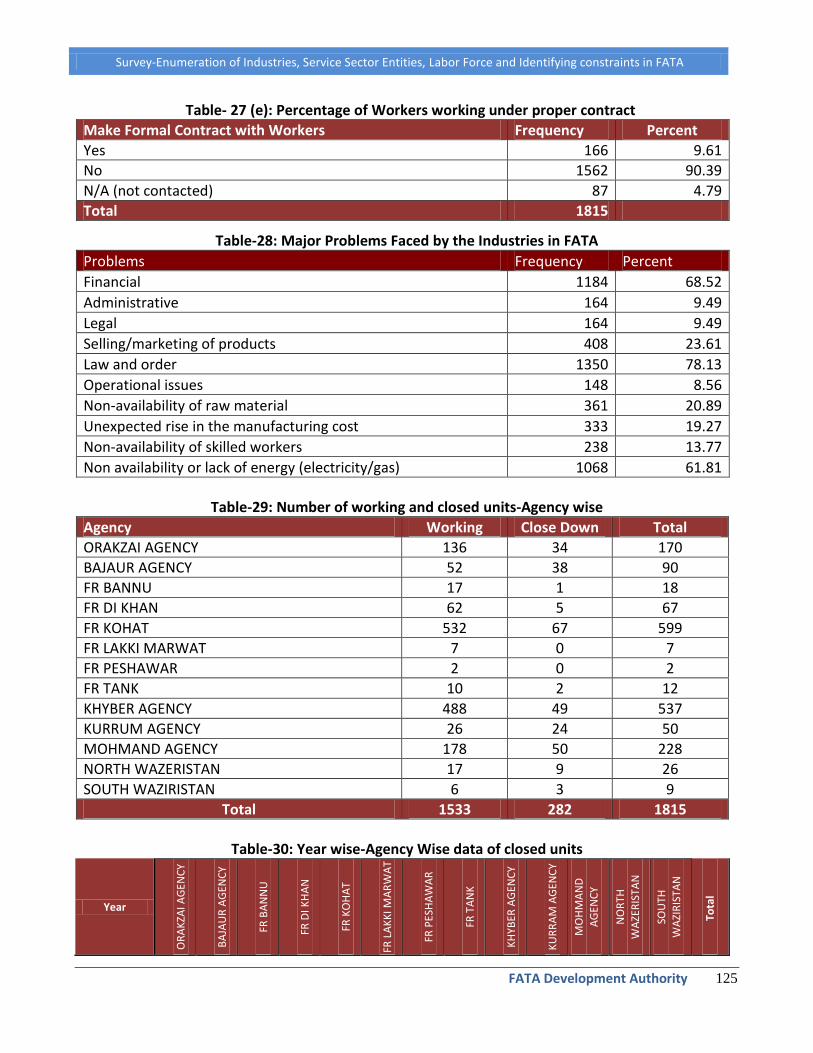
Survey-Enumeration of Industries, Service Sector Entities, Labor Force and Identifying constraints in FATA
FATA Development Authority 125
Table- 27 (e): Percentage of Workers working under proper contract
Make Formal Contract with Workers Frequency Percent
Yes 166 9.61
No 1562 90.39
N/A (not contacted) 87 4.79
Total 1815
Table-28: Major Problems Faced by the Industries in FATA
Problems Frequency Percent
Financial 1184 68.52
Administrative 164 9.49
Legal 164 9.49
Selling/marketing of products 408 23.61
Law and order 1350 78.13
Operational issues 148 8.56
Non-availability of raw material 361 20.89
Unexpected rise in the manufacturing cost 333 19.27
Non-availability of skilled workers 238 13.77
Non availability or lack of energy (electricity/gas) 1068 61.81
Table-29: Number of working and closed units-Agency wise
Agency Working Close Down Total
ORAKZAI AGENCY 136 34 170
BAJAUR AGENCY 52 38 90
FR BANNU 17 1 18
FR DI KHAN 62 5 67
FR KOHAT 532 67 599
FR LAKKI MARWAT 7 0 7
FR PESHAWAR 2 0 2
FR TANK 10 2 12
KHYBER AGENCY 488 49 537
KURRUM AGENCY 26 24 50
MOHMAND AGENCY 178 50 228
NORTH WAZERISTAN 17 9 26
SOUTH WAZIRISTAN 6 3 9
Total 1533 282 1815
Table-30: Year wise-Agency Wise data of closed units
Year
OR
AK
ZAI A
GEN
CY
BA
JAU
R A
GEN
CY
FR B
AN
NU
FR D
I KH
AN
FR K
OH
AT
FR L
AK
KI M
AR
WA
T
FR P
ESH
AW
AR
FR T
AN
K
KH
YBER
AG
ENC
Y
KU
RR
AM
AG
ENC
Y
MO
HM
AN
D
AG
ENC
Y
NO
RTH
WA
ZER
ISTA
N
SOU
TH
WA
ZIR
ISTA
N
Tota
l
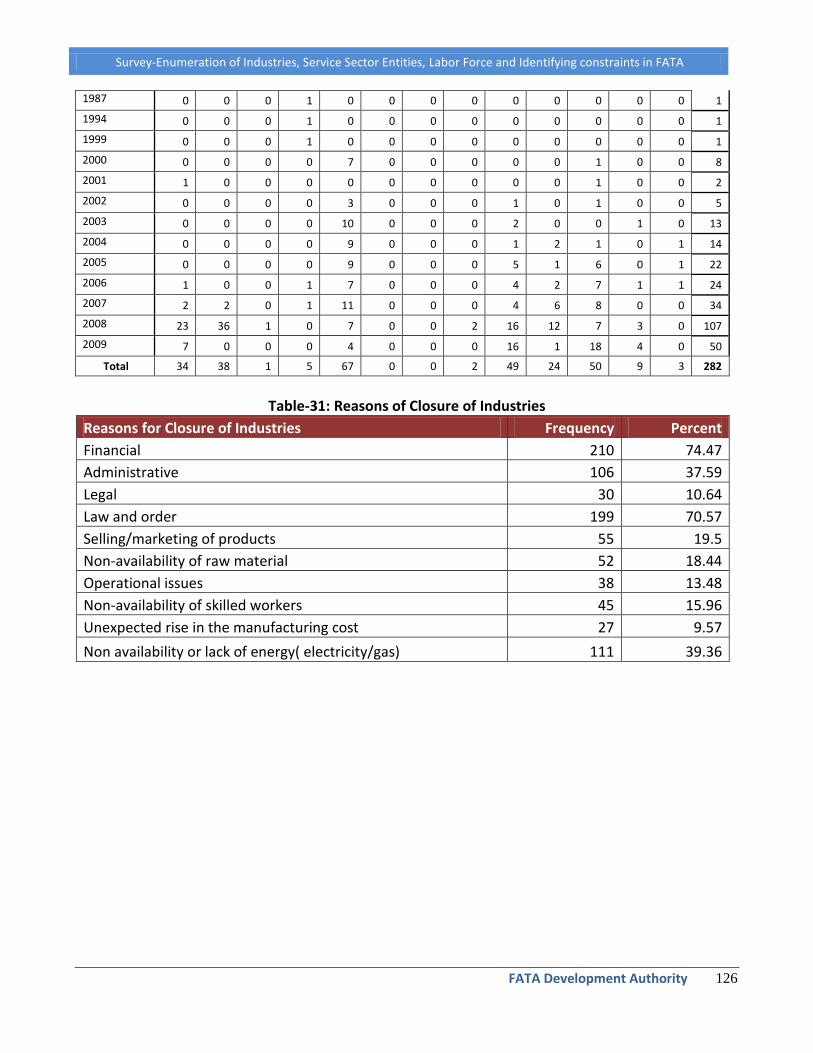
Survey-Enumeration of Industries, Service Sector Entities, Labor Force and Identifying constraints in FATA
FATA Development Authority 126
1987 0 0 0 1 0 0 0 0 0 0 0 0 0 1
1994 0 0 0 1 0 0 0 0 0 0 0 0 0 1
1999 0 0 0 1 0 0 0 0 0 0 0 0 0 1
2000 0 0 0 0 7 0 0 0 0 0 1 0 0 8
2001 1 0 0 0 0 0 0 0 0 0 1 0 0 2
2002 0 0 0 0 3 0 0 0 1 0 1 0 0 5
2003 0 0 0 0 10 0 0 0 2 0 0 1 0 13
2004 0 0 0 0 9 0 0 0 1 2 1 0 1 14
2005 0 0 0 0 9 0 0 0 5 1 6 0 1 22
2006 1 0 0 1 7 0 0 0 4 2 7 1 1 24
2007 2 2 0 1 11 0 0 0 4 6 8 0 0 34
2008 23 36 1 0 7 0 0 2 16 12 7 3 0 107
2009 7 0 0 0 4 0 0 0 16 1 18 4 0 50
Total 34 38 1 5 67 0 0 2 49 24 50 9 3 282
Table-31: Reasons of Closure of Industries
Reasons for Closure of Industries Frequency Percent
Financial 210 74.47
Administrative 106 37.59
Legal 30 10.64
Law and order 199 70.57
Selling/marketing of products 55 19.5
Non-availability of raw material 52 18.44
Operational issues 38 13.48
Non-availability of skilled workers 45 15.96
Unexpected rise in the manufacturing cost 27 9.57
Non availability or lack of energy( electricity/gas) 111 39.36

Survey-Enumeration of Industries, Service Sector Entities, Labor Force and Identifying constraints in FATA
FATA Development Authority 127
Annexure –III FATA Service Sector Statistical Data
Table-32 (a): Year of Business Establishment: B
usi
nes
s Ye
ar o
f Es
tab
lish
men
t
Ora
kzai
Age
ncy
Baj
aur
Age
ncy
FR B
ann
u
FR D
I Kh
an
FR K
OH
AT
FR L
AK
KI
FR P
ESH
AW
AR
FR T
AN
K
KH
YBER
AG
ENC
Y
KU
RR
AM
AG
ENC
Y
MO
HM
AN
D
AG
ENC
Y
NO
RTH
W
AZI
RIS
TAN
SOU
TH
WA
ZIR
ISTA
N
Tota
l
1935 1 1
1940 1 1 2
1944 1 1
1949 1 1
1950 1 1
1954 1 1
1955 1 1 2
1959 4 4
1960 2 1 3
1965 1 2 3
1968 1 1
1969 7 7
1970 3 25 18 1 1 3 7 2 26 86
1972 1 1
1973 2 2 4
1974 1 1
1975 6 5 16 1 5 10 2 24 69
1976 1 1
1977 2 2
1978 1 1 4 1 1 8
1979 3 2 1 6
1980 16 84 2 4 275 4 17 31 155 11 599
1981 2 1 1 13 2 2 2 5 2 30
1982 3 2 1 18 3 1 4 1 23 3 59
1983 3 11 1 2 18 3 38
1984 1 1 8 1 1 10 14 1 37
1985 16 62 2 3 127 2 2 3 21 22 5 64 3 332
1986 2 3 1 15 5 5 1 19 51
1987 2 2 2 4 1 3 1 9 17 2 43
1988 11 10 2 124 1 1 2 6 21 2 19 8 207
1989 2 1 5 16 2 3 5 14 1 14 5 68
1990 22 179 8 19 186 5 7 13 94 68 13 144 11 769
1991 13 3 2 16 29 4 5 5 31 6 1 21 11 147

Survey-Enumeration of Industries, Service Sector Entities, Labor Force and Identifying constraints in FATA
FATA Development Authority 128
1992 6 61 2 10 40 6 14 5 45 19 3 36 17 264
1993 9 15 1 12 28 10 10 5 22 8 2 30 9 161
1994 7 16 2 12 18 6 8 2 43 5 5 30 8 162
1995 29 159 2 29 41 26 25 12 203 46 20 105 33 730
1996 4 35 10 26 55 14 20 8 61 26 10 64 55 388
1997 16 34 8 28 6 24 37 16 117 28 4 65 66 449
1998 18 118 11 24 63 37 40 36 141 40 6 106 75 715
1999 18 22 7 16 29 24 31 31 199 39 12 146 69 643
2000 27 275 24 45 42 24 67 53 274 120 26 166 91 1234
2001 25 51 42 43 43 33 32 34 147 46 14 379 135 1024
2002 11 84 23 19 39 22 24 17 113 47 16 204 91 710
2003 22 77 46 45 11 16 19 28 112 43 11 321 138 889
2004 10 87 31 18 11 31 18 24 72 47 16 259 57 681
2005 15 103 37 31 4 33 13 14 58 89 34 129 48 608
2006 12 62 33 14 13 25 7 19 57 52 27 284 24 629
2007 9 91 43 14 12 34 5 5 77 64 23 241 22 640
2008 9 86 21 11 22 15 1 4 47 45 28 167 15 471
2009 1 56 23 3 9 2 2 32 55 14 32 7 236
2010 2 2
TOTAL 348 1815 383 453 1350 399 390 352 2025 1053 300 3333 1020 13221
Table-32 (b): Number of years since the establishments:
Bu
sin
ess
tota
l d
ura
tio
n in
Yea
rs
Ora
kzai
Age
ncy
Baj
aur
Age
ncy
FR B
ann
u
FR D
I Kh
an
FR K
OH
AT
FR L
AK
KI
FR P
ESH
AW
AR
FR T
AN
K
KH
YBER
AG
ENC
Y
KU
RR
AM
AG
ENC
Y M
OH
MA
ND
A
GEN
CY
NO
RTH
W
AZI
RIS
TAN
SOU
TH
WA
ZIR
ISTA
N
Tota
l
1 1 56 23 3 9 2 2 34 55 14 32 7 238
2 8 86 21 11 22 15 1 4 47 45 28 167 15 470
3 10 91 43 15 12 34 6 5 78 64 26 241 22 647
4 11 62 33 13 13 25 6 19 56 52 24 284 24 622
5 16 103 37 31 4 33 13 14 58 89 34 129 48 609
6 10 87 31 18 11 31 18 24 72 47 16 259 57 681
7 22 77 46 45 11 16 19 28 112 43 11 321 138 889
8 11 84 23 20 40 22 25 17 114 47 16 210 91 720
9 25 51 42 42 42 33 31 34 146 46 14 373 135 1014
10 27 275 24 45 42 24 67 53 274 120 26 166 91 1234
11 18 22 7 16 29 24 31 31 199 39 12 146 69 643
12 18 118 11 24 63 37 40 36 141 40 6 106 75 715
13 16 34 8 28 6 24 37 16 117 28 4 65 66 449
14 4 36 10 27 55 14 20 8 61 26 10 64 55 390

Survey-Enumeration of Industries, Service Sector Entities, Labor Force and Identifying constraints in FATA
FATA Development Authority 129
15 29 160 2 29 41 26 25 12 203 46 20 105 33 731
16 7 15 2 11 18 6 8 2 43 5 5 30 8 160
17 9 15 1 12 28 10 10 5 22 9 2 30 9 162
18 5 59 2 8 39 5 14 5 44 18 3 35 13 250
19 14 5 2 18 30 5 5 5 32 6 1 22 15 160
20 22 179 8 19 187 5 7 13 94 68 13 144 11 770
21 2 1 6 16 2 3 5 15 1 14 5 70
22 11 10 1 124 1 1 2 6 22 2 20 8 208
23 2 2 2 4 1 3 1 8 1 16 2 42
24 2 3 1 15 5 6 20 52
25 16 63 2 3 127 2 2 3 22 21 5 64 3 333
26 1 1 8 1 1 10 14 1 37
27 3 11 1 2 18 3 38
28 3 2 2 18 3 1 4 1 23 3 60
29 2 1 13 2 2 1 5 2 28
30 17 84 2 4 275 4 17 34 155 11 603
31 3 2 1 1 7
32 1 1 2 2 1 7
34 1 5 6
35 4 3 17 1 3 8 2 19 57
36 2 1 1 4
37 2 2 4
38 1 1
39 1 6 7
40 1 25 17 1 1 3 13 2 20 83
41 1 1 2
42 1 1
45 1 1 2
50 2 1 3
51 4 4
55 1 1 2
56 1 1
60 2 2
66 1 1
70 1 1
75 1 1
348 1815 383 453 1350 399 390 352 2025 1053 300 3333 1020 13221
Table-33: Volume of business:
Business Volume Frequency Percent
Small 10316 78.03
Medium 2638 19.95

Survey-Enumeration of Industries, Service Sector Entities, Labor Force and Identifying constraints in FATA
FATA Development Authority 130
Large 267 2.02
Total 13221 100.00
Table-34: Nature of business
Nature of Business Frequency Percent
AGRI PRODUCTS 7 .1
ARMS 660 5.0
AUTO BARGAIN 39 .3
AUTO DECORATION 15 .1
AUTO ELECTRICIAN 1 .0
AUTO SPARE PARTS 188 1.4
AUTO WORKSHOP 121 .9
BAKERY 97 .7
BEAUTY PARLOR 1 .0
BLACKSMITH 29 .2
BLANKETS STORE 26 .2
BOOKS STORE 122 .9
BREAD SHOP 40 .3
BRICKS FACTORY 10 .1
BUTCHER SHOP 167 1.3
CAP STORE 45 .3
CARPENTER 42 .3
CARPET STORE 13 .1
CATERING 16 .1
CEMENT DEALER 70 .5
CHICKEN SHOP 60 .5
CLINIC 116 .9
CLOTH STORE 527 4.0
COBBLER 47 .4
COLD DRINKS SHOP 81 .6
COMPUTER SHOP 65 .5
CONSTRUCTION 24 .2
COOK 9 .1
COSMETICS 63 .5
CROCKERY STORE 93 .7
CURRENCY CHANGER 9 .1
CUSTOM AGENCY 4 .0
CYCLE WORKSHOP 51 .4
DAIRY 5 .0
DRIVER 133 1.0
DRY CLEANER 6 .0
DRY FRUITS 33 .2

Survey-Enumeration of Industries, Service Sector Entities, Labor Force and Identifying constraints in FATA
FATA Development Authority 131
EDUCATION 83 .6
ELECTRIC STORE 282 2.1
ELECTRICIAN 40 .3
ELECTRONIC WORKSHOP 8 .1
ELECTRONICS 124 .9
FARMAR 1 .0
FAST FOOD 7 .1
FILLING STATION 93 .7
FISH SHOP 12 .1
FLOUR / GRINDING 122 .9
FOOD DEALER 499 3.8
FRUITS / VEGETABLES 622 4.7
FURNITURE 47 .4
GARMENTS 14 .1
GAS FILLING 61 .5
GENERAL STORE 4253 32.2
GOLD SMITH 7 .1
GUARD 5 .0
HAIR DRESSERS 278 2.1
HARDWARE 57 .4
HAWKER 48 .4
HOSPITAL 19 .1
HOTEL 253 1.9
HOUSERY 8 .1
JEWELERS 83 .6
LABORATORY 31 .2
LABOURER 25 .2
MECHANIC 147 1.1
MEDICENE SOTRE 838 6.3
MILK SHOP 68 .5
MINING 14 .1
MOBILE SHOP 177 1.3
OIL DEALER 1 .0
PAINT SHOP 54 .4
PCO 121 .9
PHOTO STUDIO 21 .2
PHOTOSTATE 33 .2
PLASTIC STORE 28 .2
POULTRY 34 .3
PRINTING 3 .0
REAL ESTATE 9 .1
SANITARY STORE 38 .3

Survey-Enumeration of Industries, Service Sector Entities, Labor Force and Identifying constraints in FATA
FATA Development Authority 132
SAW MACHINE 7 .1
SCRAP STORE 49 .4
SERVICE STATION 1 .0
SHOE STORE 236 1.8
SNUFF SHOP 91 .7
SPORTS SHOP 21 .2
STEEL STORE 47 .4
SWEETS HOUSE 188 1.4
TAILORING 288 2.2
TEA SHOP 120 .9
TRANSPORT 68 .5
TRAVEL AGENCY 13 .1
TYRE SHOP 92 .7
VETERINARY 38 .3
VIDEO CENTER 59 .4
WELDER 42 .3
WOOD DEALER 158 1.2
Total 13221 100.0
Table-35 (a): Source of Finance
Source of Finance Frequency Percent
Personal investment 10166 76.89
Loan 172 1.30
Both 2883 21.81
Total 13221 100.00
Table-35 (b) Source of Loans
Loan from Frequency Percent
Bank 7 0.23
Private loaner/friend/relative 3043 99.61
Both 5 0.16
Total 3055 100.00
Table-35 (c): Proportion of personal capital:
% of Finance Portion Personal Frequency Percent
100 10166 76.89
50 701 5.30
60 601 4.55
70 490 3.71
80 381 2.88
30 282 2.13
40 278 2.10
90 113 0.85

Survey-Enumeration of Industries, Service Sector Entities, Labor Force and Identifying constraints in FATA
FATA Development Authority 133
20 88 0.67
75 37 0.28
10 19 0.14
65 19 0.14
85 18 0.14
55 9 0.07
25 6 0.05
45 4 0.03
15 2 0.02
83 1 0.01
41 1 0.01
95 1 0.01
35 1 0.01
63 1 0.01
66 1 0.01
68 1 0.01
Total 13221 100.00
Table-35 (d): Proportion of loan
% of Finance Portion Loan Frequency Percent
50 702 22.98
40 601 19.67
30 490 16.04
20 380 12.44
70 283 9.26
60 278 9.10
10 113 3.70
80 87 2.85
25 36 1.18
35 20 0.65
15 19 0.62
90 19 0.62
45 9 0.29
75 6 0.20
55 4 0.13
85 2 0.07
34 1 0.03
32 1 0.03
5 1 0.03
65 1 0.03
17 1 0.03
37 1 0.03
Total 3055 100.00

Survey-Enumeration of Industries, Service Sector Entities, Labor Force and Identifying constraints in FATA
FATA Development Authority 134
Table-36 (a): Annual markup on loan
% of Annual Markup on Loan Frequency Percent
0 3045 99.67
15 1 0.03
20 4 0.13
22 1 0.03
25 3 0.10
7 1 0.03
Total 3055 206.81
Table-36 (b): Contacts with Banks
Bank Contact Frequency Percent
Yes 754 5.70
No 12467 94.30
Total 13221 100.00
Table-37: How Business started?
Business started Frequency Percent
After proper conducting feasibility study 4349 32.89
After consultation with other such business people 6738 50.96
Without planning and consultation 2134 16.14
Total 13221 100.00
Table-38 (a): Source of Energy
Energy Source Frequency Percent
WAPDA / TESCO 11802 89.27
Through generator 293 2.22
Both 1126 8.52
Total 13221 100.00
Table-38 (b): Ratio of energy being utilized
III. WAPDA/TESCO: _________%.
% Proportion of WAPDA/TESCO Frequency Percent
100 11802 89.27
50 252 1.91
80 139 1.05
60 137 1.04
30 136 1.03
70 122 0.92
40 114 0.86
20 93 0.70
75 34 0.26

Survey-Enumeration of Industries, Service Sector Entities, Labor Force and Identifying constraints in FATA
FATA Development Authority 135
90 28 0.21
10 24 0.18
05 14 0.11
35 10 0.08
85 7 0.05
55 5 0.04
45 4 0.03
25 3 0.02
65 2 0.02
57 1 0.01
83 1 0.01
00 293 2.22
Total 13221 100.00
IV. Generator: _________%
% Proportion of Generator Frequency Percent
100 293 2.22
50 255 1.93
20 148 1.12
40 138 1.04
30 128 0.97
60 114 0.86
70 110 0.83
80 96 0.73
10 34 0.26
25 33 0.25
90 24 0.18
95 14 0.11
65 10 0.08
15 6 0.05
45 5 0.04
55 4 0.03
75 3 0.02
35 2 0.02
17 1 0.01
43 1 0.01
00 11802 89.27
Total 13221 100.00
Table-39: Nature of Goods and Services of the Service Sector in FATA
Nature of service Frequency Percent
SPORTING AND LIGHT HUNTING ARMS 690 5.22
AUTO BARGAIN 73 0.55
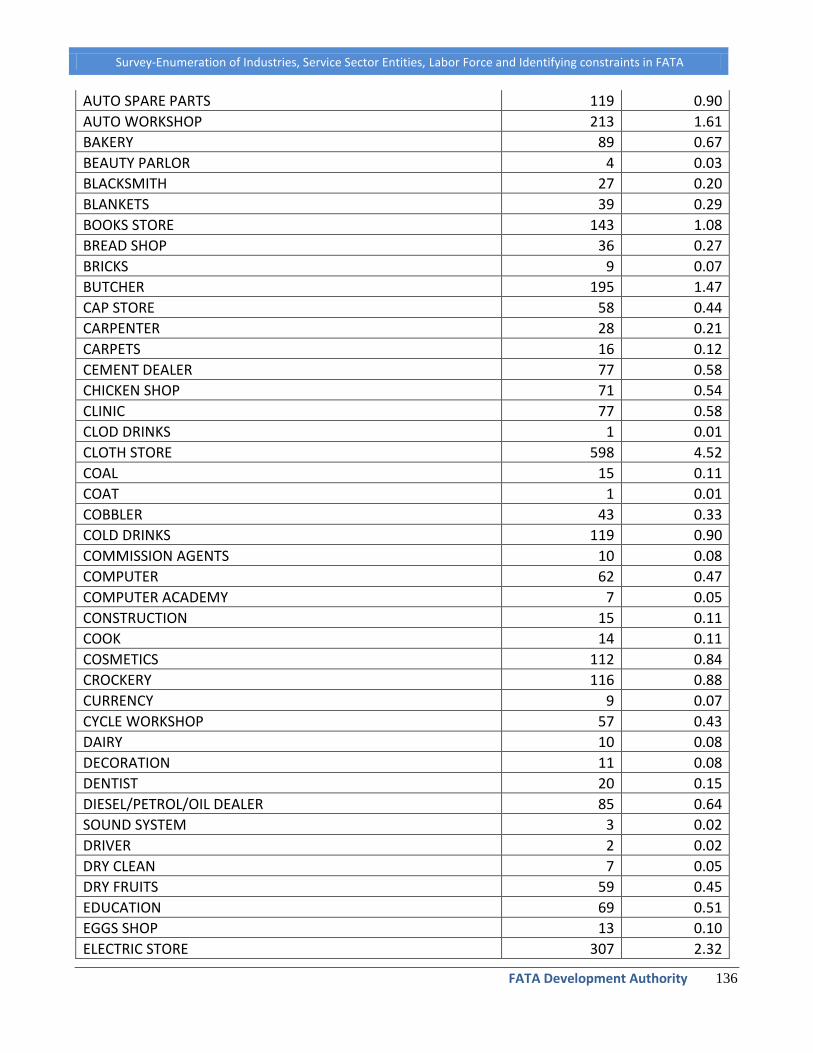
Survey-Enumeration of Industries, Service Sector Entities, Labor Force and Identifying constraints in FATA
FATA Development Authority 136
AUTO SPARE PARTS 119 0.90
AUTO WORKSHOP 213 1.61
BAKERY 89 0.67
BEAUTY PARLOR 4 0.03
BLACKSMITH 27 0.20
BLANKETS 39 0.29
BOOKS STORE 143 1.08
BREAD SHOP 36 0.27
BRICKS 9 0.07
BUTCHER 195 1.47
CAP STORE 58 0.44
CARPENTER 28 0.21
CARPETS 16 0.12
CEMENT DEALER 77 0.58
CHICKEN SHOP 71 0.54
CLINIC 77 0.58
CLOD DRINKS 1 0.01
CLOTH STORE 598 4.52
COAL 15 0.11
COAT 1 0.01
COBBLER 43 0.33
COLD DRINKS 119 0.90
COMMISSION AGENTS 10 0.08
COMPUTER 62 0.47
COMPUTER ACADEMY 7 0.05
CONSTRUCTION 15 0.11
COOK 14 0.11
COSMETICS 112 0.84
CROCKERY 116 0.88
CURRENCY 9 0.07
CYCLE WORKSHOP 57 0.43
DAIRY 10 0.08
DECORATION 11 0.08
DENTIST 20 0.15
DIESEL/PETROL/OIL DEALER 85 0.64
SOUND SYSTEM 3 0.02
DRIVER 2 0.02
DRY CLEAN 7 0.05
DRY FRUITS 59 0.45
EDUCATION 69 0.51
EGGS SHOP 13 0.10
ELECTRIC STORE 307 2.32

Survey-Enumeration of Industries, Service Sector Entities, Labor Force and Identifying constraints in FATA
FATA Development Authority 137
ELECTRICIAN 34 0.26
ELECTRONICS 163 1.23
FARMER 13 0.10
FAST FOOD 38 0.29
FILLING STATION 21 0.16
FISH 13 0.10
FLOUR / GRINDING 40 0.30
FOOD DEALER 320 2.42
FOOD SHOP 272 2.06
FOOD STORE 527 3.99
FRUITS / VEGETABLES 697 5.27
FURNITURE 88 0.67
GARMENTS 23 0.17
GAS FILLING 60 0.45
GENERAL STORE 3361 25.42
GENERAL TRADERS 30 0.23
GRASS 7 0.05
GUARD 7 0.05
HAIR DRESSERS 226 1.71
HARDWARE STORE 85 0.64
HAWKER 31 0.23
HOSPITAL 19 0.14
HOTEL 23 0.17
JEWELERS 81 0.61
LABORATORY 32 0.18
LABOURER 12 0.12
LEATHER STORE 20 0.15
MARBLE DEALER 16 0.12
MASON 1 0.01
MECHANIC 96 0.73
MEDICAL STORE 805 6.09
MILK SHOP 78 0.59
MOBILE 194 1.47
OIL DEALER 99 0.75
OPTICS 2 0.02
PAINT 58 0.44
PCO 128 0.97
PHOTO STUDIO 23 0.17
PHOTOSTAT 43 0.33
PLASTIC 40 0.29
POULTRY 19 0.14
REAL ESTATE 10 0.08
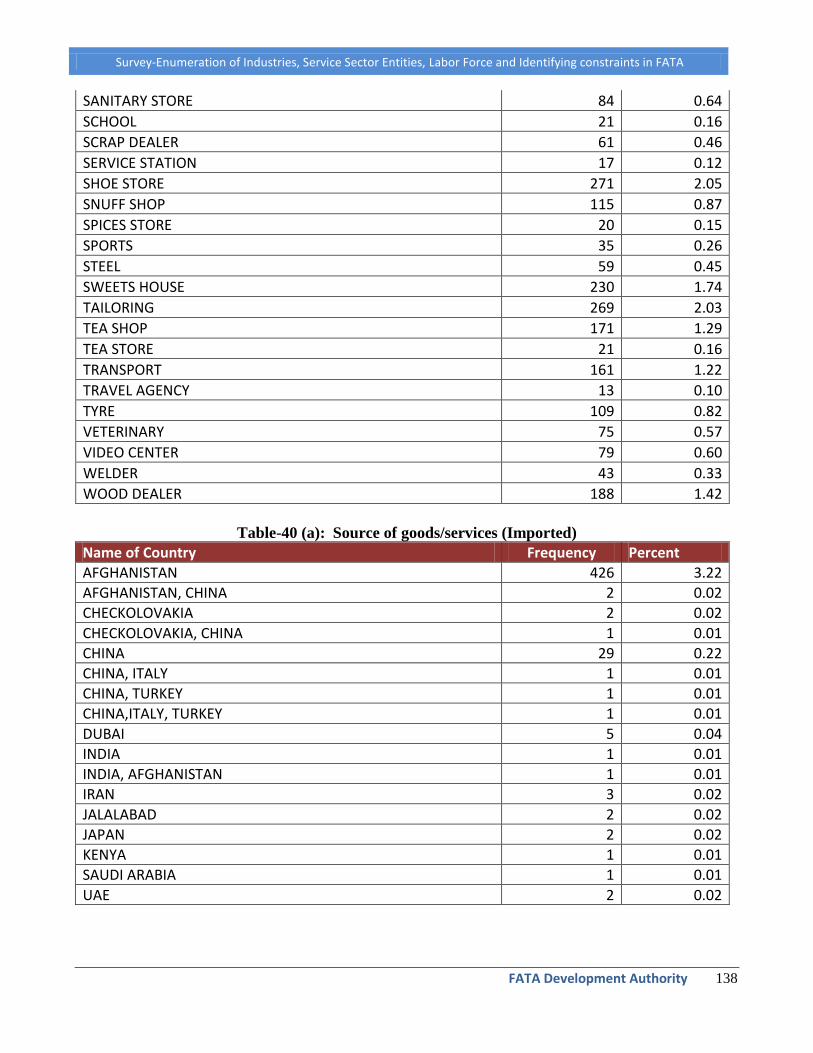
Survey-Enumeration of Industries, Service Sector Entities, Labor Force and Identifying constraints in FATA
FATA Development Authority 138
SANITARY STORE 84 0.64
SCHOOL 21 0.16
SCRAP DEALER 61 0.46
SERVICE STATION 17 0.12
SHOE STORE 271 2.05
SNUFF SHOP 115 0.87
SPICES STORE 20 0.15
SPORTS 35 0.26
STEEL 59 0.45
SWEETS HOUSE 230 1.74
TAILORING 269 2.03
TEA SHOP 171 1.29
TEA STORE 21 0.16
TRANSPORT 161 1.22
TRAVEL AGENCY 13 0.10
TYRE 109 0.82
VETERINARY 75 0.57
VIDEO CENTER 79 0.60
WELDER 43 0.33
WOOD DEALER 188 1.42
Table-40 (a): Source of goods/services (Imported)
Name of Country Frequency Percent
AFGHANISTAN 426 3.22
AFGHANISTAN, CHINA 2 0.02
CHECKOLOVAKIA 2 0.02
CHECKOLOVAKIA, CHINA 1 0.01
CHINA 29 0.22
CHINA, ITALY 1 0.01
CHINA, TURKEY 1 0.01
CHINA,ITALY, TURKEY 1 0.01
DUBAI 5 0.04
INDIA 1 0.01
INDIA, AFGHANISTAN 1 0.01
IRAN 3 0.02
JALALABAD 2 0.02
JAPAN 2 0.02
KENYA 1 0.01
SAUDI ARABIA 1 0.01
UAE 2 0.02
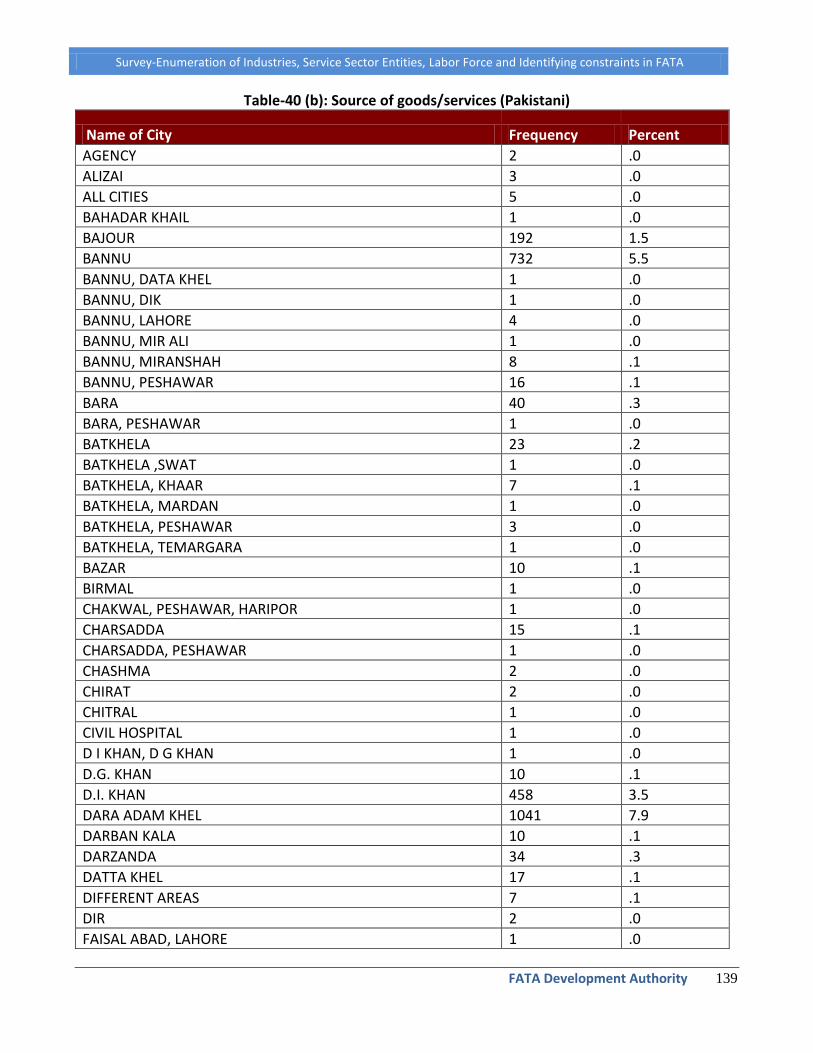
Survey-Enumeration of Industries, Service Sector Entities, Labor Force and Identifying constraints in FATA
FATA Development Authority 139
Table-40 (b): Source of goods/services (Pakistani)
Name of City Frequency Percent
AGENCY 2 .0
ALIZAI 3 .0
ALL CITIES 5 .0
BAHADAR KHAIL 1 .0
BAJOUR 192 1.5
BANNU 732 5.5
BANNU, DATA KHEL 1 .0
BANNU, DIK 1 .0
BANNU, LAHORE 4 .0
BANNU, MIR ALI 1 .0
BANNU, MIRANSHAH 8 .1
BANNU, PESHAWAR 16 .1
BARA 40 .3
BARA, PESHAWAR 1 .0
BATKHELA 23 .2
BATKHELA ,SWAT 1 .0
BATKHELA, KHAAR 7 .1
BATKHELA, MARDAN 1 .0
BATKHELA, PESHAWAR 3 .0
BATKHELA, TEMARGARA 1 .0
BAZAR 10 .1
BIRMAL 1 .0
CHAKWAL, PESHAWAR, HARIPOR 1 .0
CHARSADDA 15 .1
CHARSADDA, PESHAWAR 1 .0
CHASHMA 2 .0
CHIRAT 2 .0
CHITRAL 1 .0
CIVIL HOSPITAL 1 .0
D I KHAN, D G KHAN 1 .0
D.G. KHAN 10 .1
D.I. KHAN 458 3.5
DARA ADAM KHEL 1041 7.9
DARBAN KALA 10 .1
DARZANDA 34 .3
DATTA KHEL 17 .1
DIFFERENT AREAS 7 .1
DIR 2 .0
FAISAL ABAD, LAHORE 1 .0
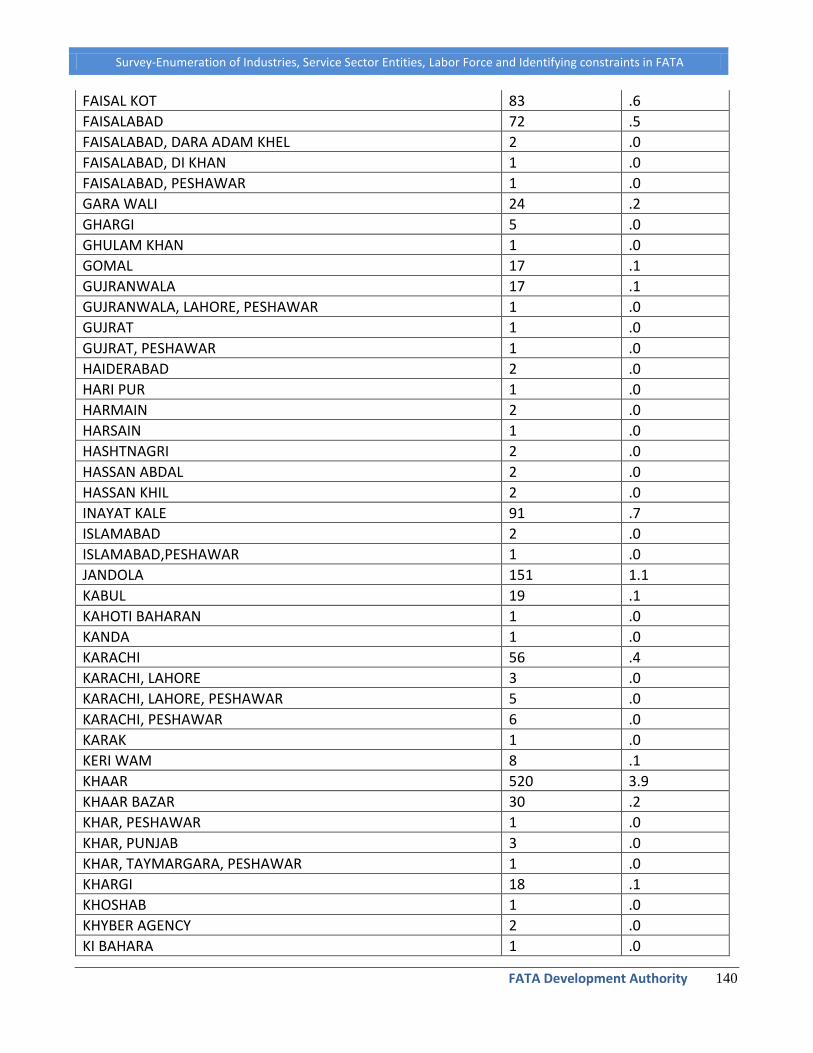
Survey-Enumeration of Industries, Service Sector Entities, Labor Force and Identifying constraints in FATA
FATA Development Authority 140
FAISAL KOT 83 .6
FAISALABAD 72 .5
FAISALABAD, DARA ADAM KHEL 2 .0
FAISALABAD, DI KHAN 1 .0
FAISALABAD, PESHAWAR 1 .0
GARA WALI 24 .2
GHARGI 5 .0
GHULAM KHAN 1 .0
GOMAL 17 .1
GUJRANWALA 17 .1
GUJRANWALA, LAHORE, PESHAWAR 1 .0
GUJRAT 1 .0
GUJRAT, PESHAWAR 1 .0
HAIDERABAD 2 .0
HARI PUR 1 .0
HARMAIN 2 .0
HARSAIN 1 .0
HASHTNAGRI 2 .0
HASSAN ABDAL 2 .0
HASSAN KHIL 2 .0
INAYAT KALE 91 .7
ISLAMABAD 2 .0
ISLAMABAD,PESHAWAR 1 .0
JANDOLA 151 1.1
KABUL 19 .1
KAHOTI BAHARAN 1 .0
KANDA 1 .0
KARACHI 56 .4
KARACHI, LAHORE 3 .0
KARACHI, LAHORE, PESHAWAR 5 .0
KARACHI, PESHAWAR 6 .0
KARAK 1 .0
KERI WAM 8 .1
KHAAR 520 3.9
KHAAR BAZAR 30 .2
KHAR, PESHAWAR 1 .0
KHAR, PUNJAB 3 .0
KHAR, TAYMARGARA, PESHAWAR 1 .0
KHARGI 18 .1
KHOSHAB 1 .0
KHYBER AGENCY 2 .0
KI BAHARA 1 .0

Survey-Enumeration of Industries, Service Sector Entities, Labor Force and Identifying constraints in FATA
FATA Development Authority 141
KOHAT 180 1.4
KOHAT ROAD PINDI 1 .0
KOHAT, BANNU 1 .0
KOHAT, CHARAT 1 .0
KOHAT, PESHAWAR 3 .0
KOI BAHARAN 47 .4
KRACHI, PANJAB 1 .0
KURRAM AGENCY 4 .0
LAGODAR 1 .0
LAHOR,SARGODA,DIRA 1 .0
LAHORE 574 4.3
LAHORE , KARACHI, ISLAMABAD 1 .0
LAHORE, CHARSADDA, PESHAWAR 1 .0
LAHORE, GUJRAT 8 .1
LAHORE, GUJRAWALAN 2 .0
LAHORE, KARACHI 13 .1
LAHORE, KARACHI, FAISALABAD 1 .0
LAHORE, MARDAN 2 .0
LAHORE, PESHAWAR 46 .3
LAHORE, PESHAWAR, FAISAL ABAD 1 .0
LAHORE, PESHAWAR, MARDAN 2 .0
LAHORE, PINDI, PEHSAWAR 1 .0
LAHORE, RAWAL PINDI 2 .0
LAHORE, TAYMARGARA 1 .0
LAHORE,FAISAL ABAD 1 .0
LAHORE,SWAT,PESHAWAR 1 .0
LAKKI MARWAT 16 .1
LANDI KOTAL 238 1.8
LANGODAR 1 .0
LAWANA 1 .0
LAYA 1 .0
LIFTRI BAZAR 1 .0
LOCAL CITY 71 .5
MADA KHAIL 1 .0
MANDI 1 .0
MARDAN 35 .3
MARDAN, LAHORE 1 .0
MARDAN, PARA CHINAR 1 .0
MARDAN, PESHAWAR 6 .0
MARDAN, PESHAWAR,PANJAB 1 .0
MARDAN, PINDI 1 .0
MARDAN, SWAT 6 .0
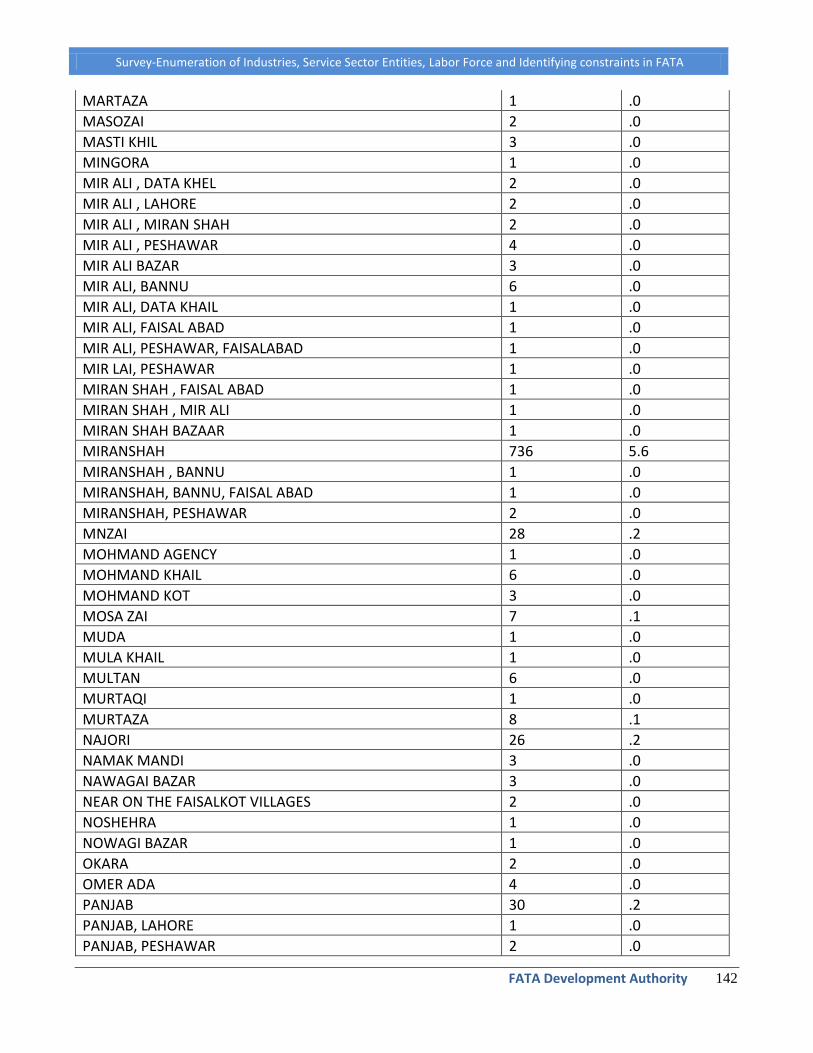
Survey-Enumeration of Industries, Service Sector Entities, Labor Force and Identifying constraints in FATA
FATA Development Authority 142
MARTAZA 1 .0
MASOZAI 2 .0
MASTI KHIL 3 .0
MINGORA 1 .0
MIR ALI , DATA KHEL 2 .0
MIR ALI , LAHORE 2 .0
MIR ALI , MIRAN SHAH 2 .0
MIR ALI , PESHAWAR 4 .0
MIR ALI BAZAR 3 .0
MIR ALI, BANNU 6 .0
MIR ALI, DATA KHAIL 1 .0
MIR ALI, FAISAL ABAD 1 .0
MIR ALI, PESHAWAR, FAISALABAD 1 .0
MIR LAI, PESHAWAR 1 .0
MIRAN SHAH , FAISAL ABAD 1 .0
MIRAN SHAH , MIR ALI 1 .0
MIRAN SHAH BAZAAR 1 .0
MIRANSHAH 736 5.6
MIRANSHAH , BANNU 1 .0
MIRANSHAH, BANNU, FAISAL ABAD 1 .0
MIRANSHAH, PESHAWAR 2 .0
MNZAI 28 .2
MOHMAND AGENCY 1 .0
MOHMAND KHAIL 6 .0
MOHMAND KOT 3 .0
MOSA ZAI 7 .1
MUDA 1 .0
MULA KHAIL 1 .0
MULTAN 6 .0
MURTAQI 1 .0
MURTAZA 8 .1
NAJORI 26 .2
NAMAK MANDI 3 .0
NAWAGAI BAZAR 3 .0
NEAR ON THE FAISALKOT VILLAGES 2 .0
NOSHEHRA 1 .0
NOWAGI BAZAR 1 .0
OKARA 2 .0
OMER ADA 4 .0
PANJAB 30 .2
PANJAB, LAHORE 1 .0
PANJAB, PESHAWAR 2 .0

Survey-Enumeration of Industries, Service Sector Entities, Labor Force and Identifying constraints in FATA
FATA Development Authority 143
PARA CHINAR 146 1.1
PESHAWAR 5227 39.5
PESHAWAR, BAJOUR 2 .0
PESHAWAR, BANNU 1 .0
PESHAWAR, BATKHELA 5 .0
PESHAWAR, CHARSADDA 9 .1
PESHAWAR, DARA ADAM KHEL 9 .1
PESHAWAR, DI KHAN 1 .0
PESHAWAR, KHAR 2 .0
PESHAWAR, KHOSHAB 1 .0
PESHAWAR, LAHORE 32 .2
PESHAWAR, LAHORE, MARDAN 1 .0
PESHAWAR, LAHORE, TAYMARGARA 1 .0
PESHAWAR, LHAORE, BUTTKHAILA 5 .0
PESHAWAR, MARDAN 11 .1
PESHAWAR, MARDAN, LAHORE 1 .0
PESHAWAR, PARA CHINAR 1 .0
PESHAWAR, PINDI 7 .1
PESHAWAR, SHOBA 9 .1
PESHAWAR, SWAT 12 .1
PESHAWAR, SWAT, TEMERGARA 2 .0
PESHAWAR, TAIRMARGARA 1 .0
PESHAWAR, TEMARGARA 4 .0
PESHAWAR, TORKHAM 1 .0
PESHAWAR,BAJOUR 1 .0
PESHAWAR,PINDI 6 .0
PHRANG GHAR 1 .0
PINDI, LAHORE 7 .1
PINDI, TEMARGARA 5 .0
PINDI,TEMARGARA 1 .0
PUJNAB 1 .0
PUJNAB, SARHAD 15 .1
PUNJAB 146 1.1
PUNJAB, DIFFERENT AREAS 1 .0
PUNJAB, SARHAD 6 .0
QILLA 1 .0
QUETTA 2 .0
RAGHGAN 1 .0
RAWALPINDI 28 .2
RAZMAK 4 .0
SADDA 70 .5
SADDA, PESHAWAR 3 .0

Survey-Enumeration of Industries, Service Sector Entities, Labor Force and Identifying constraints in FATA
FATA Development Authority 144
SAIDGAI 1 .0
SARAE NORANG 64 .5
SARAI DERPA KHAIL 1 .0
SARGI 2 .0
SARGODHA 6 .0
SAWABI 4 .0
SHABQADAR 24 .2
SHADAGE 1 .0
SHAH WALI ZARMAK 1 .0
SHAIR GHAR, PESHAWAR 1 .0
SHALMAN 1 .0
SHAWAAL 10 .1
SHER GARH 7 .1
SHERANI 137 1.0
SHIKHAN 1 .0
SIALKOT 5 .0
SOOR DAAG 1 .0
SRY TAJORE 1 .0
SWAT 6 .0
SWAT, PESHAWAR 4 .0
SWAT, PESHAWR 1 .0
SWAT, TIMARGIRA, PESHAWAR 1 .0
SWATT 1 .0
TAJORE 261 2.0
TAJORE, SRY NOORANG 1 .0
TAJORI, SARAE NORANG 2 .0
TAL PESHAWAR 1 .0
TAL, KOHAT 1 .0
TALAGANG 1 .0
TALASH 1 .0
TALL 2 .0
TALL, PESHAWAR 1 .0
TANGI 2 .0
TANK 48 .4
TANK, DI KHAN 1 .0
TANK, MIRAN SHAH 1 .0
TANK, PESHAWAR 4 .0
TAROJABA 1 .0
TEMARGARA, BATKHILA,PESHAWAR 1 .0
TEMARGARA, MARDAN 7 .1
TEMARGARA, PESHAWAR, SWAT 1 .0
TEMARGARA, PUNJAB 1 .0

Survey-Enumeration of Industries, Service Sector Entities, Labor Force and Identifying constraints in FATA
FATA Development Authority 145
TEMARGARAH, PESHAWAR 2 .0
THAL 1 .0
TIRAH 11 .1
TOJARE 1 .0
TORJAN 2 .0
TOURKHAM 168 1.3
UMER ADA 9 .1
WANA 115 .9
WANA, DI KHAN 3 .0
WANA, TANK 4 .0
WASTI KORAM 2 .0
WAZIRISTAN 5 .0
Total 13221 100.0
Table-41 (a): Business Recruiting Workers
Recruit workers Frequency Percent
Yes 3621 27.39
No 9600 72.61
Total 13221 100.00
Table-41 (b): Number of skilled workers employed
Number of Skilled Workers Frequency Percent
1 1507 41.62
2 785 21.68
3 278 7.68
4 129 3.56
5 51 1.41
6 47 1.30
7 8 0.22
8 14 0.39
9 2 0.06
10 18 0.50
11 2 0.06
12 7 0.19
13 1 0.03
14 7 0.19
15 9 0.25
16 4 0.11
18 7 0.19
20 9 0.25
21 3 0.08
22 1 0.03
23 1 0.03

Survey-Enumeration of Industries, Service Sector Entities, Labor Force and Identifying constraints in FATA
FATA Development Authority 146
25 1 0.03
28 2 0.06
30 5 0.14
35 1 0.03
Total 2899
Table-41 (c): Number of unskilled workers
Number of Un-Skilled Workers Frequency Percent
1 959 26.48
2 527 14.55
3 251 6.93
4 72 1.99
5 28 0.77
6 15 0.41
7 7 0.19
8 11 0.30
9 5 0.14
10 10 0.28
12 2 0.06
13 1 0.03
15 3 0.08
18 1 0.03
20 1 0.03
30 2 0.06
Total 1895
Table-41 (d): Age of Workers
Age Group of Workers Frequency Percent
Below 18 years 2155 21.19
18-25 years 4335 42.62
26-35 years 2750 27.03
36-45 years 742 7.29
46-55 years 168 1.65
56 + years 22 0.22
Total 10172
Table-41 (e). Educational level of workers
Education level Frequency Percent
Illiterate 4344 42.71
Primary level 1690 16.61
Middle level (1-8 classes) 1572 15.45
High school (1-10 classes) 1228 12.07
Higher secondary School (1-12 classes) 462 4.54

Survey-Enumeration of Industries, Service Sector Entities, Labor Force and Identifying constraints in FATA
FATA Development Authority 147
Bachelor degree 549 5.40
Master degree 264 2.60
Madrasa/Religious schooling 63 0.62
Total 10172
Table-41 (f): Skilled workers received training
How skilled workers trained Frequency Percent
On job 2657 91.65
Through institutional /formal training 242 8.35
Total 2899 21.93
Table-42 (a): Working shifts:
Working Shifts Frequency Percent
1st shift 9099 68.82
2nd Shift 4042 30.57
3rd Shift 80 0.61
Total 13221 100.00
Table-42 (b): Working hours
Working hours Frequency Percent
< 8 hours 3325 25.15
8 hours 6377 48.23
8-12 hours 3286 24.85
>12 hours 233 1.76
Total 13221 100.00
Table-42(c): Salary range
Salary Limit Frequency (Skilled
Worker) Percent Frequency (Un-Skilled Worker) Percent
<2000 230 6.35 549 15.16
2000-3000 532 14.69 878 24.25
3001-5000 1271 35.10 407 11.24
5001-7000 777 21.46 47 1.30
7001-10000 71 1.96 10 0.28
>10000 18 0.50 4 0.11
Total 2899 1895
Table-43 (a). Skilled workers: Local
Local Skilled workers numbers Frequency Percent
1 1164 40.15
2 563 19.42

Survey-Enumeration of Industries, Service Sector Entities, Labor Force and Identifying constraints in FATA
FATA Development Authority 148
3 184 6.35
4 75 2.59
5 36 1.24
6 31 1.07
7 9 0.31
8 9 0.31
9 4 0.14
10 10 0.34
11 2 0.07
12 6 0.21
13 5 0.17
14 6 0.21
15 4 0.14
16 4 0.14
17 2 0.07
18 3 0.10
20 7 0.24
21 2 0.07
22 1 0.03
23 1 0.03
25 1 0.03
28 2 0.07
30 4 0.14
35 1 0.03
Total 2136
Table-43 (b): Skilled workers: Non-Local
Non local skilled workers numbers Frequency Percent
1 941 32.46
2 228 7.86
3 39 1.35
4 24 0.83
5 8 0.28
6 1 0.03
7 1 0.03
8 3 0.10
9 2 0.07
10 3 0.10
18 1 0.03
Total 1251
Table-44: Other facilities/incentives provided to workers
Facilities Frequency Percent

Survey-Enumeration of Industries, Service Sector Entities, Labor Force and Identifying constraints in FATA
FATA Development Authority 149
Health 582 16.07
Food 3439 94.97
Accommodation 542 14.97
Overtime 56 1.55
None 131 3.62
Table-45: Type of skilled Workers Needed in Service Sector
Kind of skill worker Frequency Percent
ACCOUNTANT 5 0.04
ACTIVE 26 0.20
AMMUNITION EXPERT 381 2.88
ANY ONE 1 0.01
AUDITING EXPERT, HARDWORKING 2 0.02
BAKING EXPERT 5 0.04
BUTCHER EXPERIENCED 3 0.02
CARPENTER 3 0.02
CHILDREN CARE HOSPITAL 1 0.01
COMPUTERS EXPERTS 4 0.03
COOKING EXPERT 5 0.04
CUTTING HAIR EXPERT 1 0.01
DESIGNER 2 0.02
DIPLOMA HOLDER 2 0.02
DISPENSER 1 0.01
DOCTOR 2 0.02
DON'T NEED 9726 73.56
DRIVER 7 0.05
ECONOMICAL TO WORK ON LOW SALARY 3 0.02
EDUCATED 514 3.89
ELECTRICIAN 14 0.11
ENGINE EXPERT 8 0.06
EXPERIENCE OF WORKING IN BIG CITIES 1 0.01
EXPERIENCE, EDUCATED, HARD WORKER 7 0.05
EXPERIENCED IN RELATED FIELD 1 0.01
EXPERIENCED, EDUCATED, HARD WORKER 949 7.18
EXPERT, RELIABLE, MASTER DEGREE HOLDER 1 0.01
EXPERT, SKILLED, AUTO ELECTRICIAN AND AUTO MECHANIC 1 0.01
GENERAL STORE 1 0.01
GRAPHICS DESIGNER 1 0.01
GOOD AND ALERT 6 0.05
GOOD ENGLISH LITERATE 1 0.01
HAIR DRESSER 10 0.08
HAVE EXPERIENCE IN RELATED FIELD 1 0.01

Survey-Enumeration of Industries, Service Sector Entities, Labor Force and Identifying constraints in FATA
FATA Development Authority 150
HAVE GOOD NATURE AND MATURE. 1 0.01
HEALTHY, INTELLIGENT 8 0.06
HONEST, EXPERIENCED, HARD WORKER 307 2.32
HOTEL EXPERT 7 0.05
INTELLIGENT, HONEST 142 1.07
IRON EXPERT 1 0.01
LAB TECHNICIAN 4 0.03
LEATHER SHOES EXPERT 2 0.02
LOCAL AND HARD WORKER 2 0.02
LOCAL DRIVER 2 0.02
LOCAL PEOPLE 1 0.01
MACHINE EXPERT 5 0.04
MATURE AND SENSIBLE 3 0.02
MECHANIC 61 0.46
MECHANIC, AUTO EXPERT 1 0.01
MEDICAL TECHNICIAN 16 0.12
MEDICINE EXPERT 16 0.12
MINING ENGINEER 12 0.09
MOBILE REPAIRING EXPERT 6 0.05
MOBILE TECHNICIAN EXPERT 1 0.01
PAINTING EXPERIENCED 1 0.01
PHOTOGRAPHER 5 0.04
PLUMBER 1 0.01
POLITE AND EDUCATED 30 0.23
PRINTING EXPERT 1 0.01
RELATED TO THE MEDICAL FIELD AND LAB TECHNICIAN 1 0.01
SALES MAN 88 0.67
SKILLED 703 5.32
CONFECTIONARY EXPERT 1 0.01
TAILORING EXPERT 63 0.48
TEACHER EXPERIENCED 20 0.15
TECHNICIAN 6 0.05
TV, RADIO MECHANIC 1 0.01
WELDER 6 0.05
total 13221 100.00
Table-46: Major Problems the Businesses are Facing in FATA
Problems Frequency Percent
Financial 9022 68.24
Administrative 2743 20.75
Legal 2623 19.84
Selling / Marketing of products 5220 39.48

Survey-Enumeration of Industries, Service Sector Entities, Labor Force and Identifying constraints in FATA
FATA Development Authority 151
Law and Order 11262 85.18
Non-Availability of goods/products 4283 32.40
Unexpected rise in the goods/products prices 1427 10.79
Non-Availability of Skilled workers 4734 35.81
Non availability or lack of energy (electricity / gas) 322 2.44
Table-47: Incentives, Facilities and Priorities for development
Incentives Frequency Percent
Concessional loans 9529 72.07
Extension and implementation of industrial laws and regulations to FATA 4886 36.96
Availability of energy (electricity and gas) 10217 77.28
Tax exemption on raw material 4674 35.35
Better law and order situation 8116 61.39
Availability of Skilled workers 942 7.13
Selling and marketing facility 18 0.14
Table-48 (a): Affects of the Present Law and Order Situation on the Businesses
Impact Frequency Percent
Badly impacted 6309 47.72
Very badly impacted 6119 46.28
Not much impacted 529 4.00
No impact at all 96 0.73
Don’t know 130 0.98
No response 38 0.29
Total 13221
Table-48 (b): Percentage of Affect of Law and order situation
How much impact Frequency Percent
20 – 30 % 3883 31.24
31 – 50 % 4102 33.01
51 – 70 % 1698 13.66
More than 70% 2745 22.09
Total 12428

Database for Survey Analysis
Annexure –IV Database for Survey Analysis
Salient Features of FATA Survey Database Software
The FATA Survey Database, separately developed for the industrial and services sectors, is basically
intended for the analysis of the statistical data. Effort is made to make it open for comprehensive and
extended reporting along with specific reporting for the purpose of analysis. Apart from the reporting,
the need was also to have a facility for direct analysis from the database. This could only be achieved
with a user-friendly software interface. Although reports can be generated and desirable statistical data
can be extracted by any moderate database user, however, the software interface is developed in such a
way that any novice computer literate person can operate it easily and get the desired results.
Some basic features and their usage are detailed below.
Selecting Agency FR
If the analysis is desired for a specific agency, it‟s good to limit the database records to that specific
agency.
1. To do this, first click on the dropdown list „Select Agency FR‟ and select the desired agency
from the list. You can see the number of respondents (Total Records) from that agency is
displayed under dropdown list.
2. After selecting the agency, click on the “Apply Selection” button.

Database for Survey Analysis
FATA Development Authority 153
This will open a new form displaying all the results form that specific agency.
Selecting All Agencies
If the analysis is desired for all agencies, records from all agencies are required to be selected. For this
follow these steps.
If the Analysis Form is already open:
1. Click on “Select Agency / FR” button to display the Agency Selection Form
2. From the “Select Agency” dropdown list, select “All Agencies”
3. Click “Apply Selection” button
4. Analysis form will re-open displaying data from all agencies.
Filtering Data Data filtering is selecting data based on some specific criteria. Selection of data from specific agency is
one example of filtering data. You may filter data depending on any of the column value (i.e. based on
answers of any question of the survey).

Database for Survey Analysis
FATA Development Authority 154
There three text boxes that depends upon the filtered data.
Total: (i.e. Population of statistical data), selected using Agency FR Selection dropdown list. If
all agencies are selected, it will show the total number of records from all agencies as
Population. Similarly if a specific agency is selected, it will show number of records
from that specific agency as Population.
Count Filtered: Number of records filtered based on the selection of answer (s) of any question or
questions of the survey. For instance Gender= “Female” will filter the records to show
only female respondents.
Percent: The percent check box display the ratio of the filtered data to its population.
Clearing Filtering Data When any filter is required to be cleared or to display all records without any filter, click on “Show All
Records” button. This will remove all filters and display all records of the population.

Database for Survey Analysis
FATA Development Authority 155
Finding Specific Record In order to find any specific record, click on the “Find Record” Button
Find dialog box will be displayed. Write the text in the Find What text box and click the Find Next
button to display the record
Opening Specific Record
Once you find specific record using the Search box or manually, you can open the Survey Form of that
specific respondent
1. First click in the row of the record you want to open
2. Click on the “Open Current Record” button. The survey form of the selected respondent will
be opened in a new window.

Database for Survey Analysis
FATA Development Authority 156
Specifying Criteria for Filtering Sometimes data is required to be filtered from the answers of more than one question. For example the
query could be:
How many/what percent people from Bajaur Agency whose business volume is small and has taken loan from banks
The above query requires three questions to be filtered.
0. Agency FR (Already selected
from the dropdown list)
1. Volume of Business (Q7_
Business Volume column)
2. Finance Source
(Q10_Source_of_Finance
column)
3. Loan source
(Q11_If_Loan_from_where
column)
To specify the criteria for the above query,
1. Select the Agency FR (if not
already selected) using the dropdown list or by clicking the “Select Agency FR” button

Database for Survey Analysis
FATA Development Authority 157
2. Locate the column Q7_ Business Volume in the datasheet above and click in the
empty space right to the column heading. You will see a dropdown list shown in the
following picture.
3. Click on checkbox „Select All‟ to clear all selections, then select only „1-Small‟ check box
4. Click OK button
Now the records are filtered to show only records of business volume= Small Similarly locate ‘Q10_Source_of_finance’ column and click the empty space on the right of the column to display the list of options as shown below.
5. Click on checkbox „Select All‟ to
clear all selections, then select only
„2-Loan‟ and „3-Both‟ check boxes
6. Click OK button
Records are further filtered as per criteria specified in the above steps.
7. Now finally, locate ‘Q11_If_loan_from_where’ column and click the empty space on
the right of the column to
display the list of options
shown below
8. Click on checkbox „Select All‟
to clear all selections, then
select only „1-Bank‟ check box
9. Click OK button.
Now the records have been filtered as desired.

Database for Survey Analysis
FATA Development Authority 158
The records are filtered. Total population is calculated. Filtered records are counted and percentage is also calculated according to the criteria.
Understanding Criteria
Criteria are the conditions on which the data is extracted from the database. In order to check if the
steps followed for filtering the data, the result is the same as what was intended in the query, you can
see the code of the criteria in the criteria box displayed at the right-bottom of the form, which in our
example case is as under: ((([Analysis Form].[Q7_bussiness_volume]="1-Small")
AND
([Analysis Form].[Q10_source_of_finance] Not In ("1-Personal investment"))))
AND
([Analysis Form].[Q11_If_loan_from]="1-Bank")
Transferring the filtered data to Excel You may, sometimes, want the extracted data to be ported to any other software, like excel etc. This is
very easy.
1. First follow all the steps of selecting the data. Once the data is filtered as desired, select the
columns as you would in Excel or Word and Right click on the selected columns to display
shortcut menu as shown in the picture.
2. Select Copy to copy the selected
data to clipboard.
3. Now open Microsoft Excel
4. Click in the first row/column of
the new sheet
5. Click the Paste button or from
the keyboard press Ctrl+V
6. Selected data is transferred to
Excel where further calculation
if required can be made.

Annexure – V Report on Consultative Workshop
Report on Consultative Workshop
Contents
Introduction iii Objective of the Consultative workshop iv Details of the workshop iv Key Findings of the workshop v Recommendations vi List of Participants viii Agenda x

Report On Consultative Workshop
FATA Development Authority iii
Introduction
It is quite obvious that the commerce and trade form a major source of livelihood in the FATA, second only to agriculture. The majority of this activity is in the form of wholesale and retail trade in consumer goods and consumer durables, clearance and transportation services, warehousing, hotels and restaurants, used vehicle spare parts, vehicles, and small-scale commercial establishments providing auxiliary services. It is a well known fact that during the 1980s, the region was a major centre for opium production and trafficking. Today, the transit trade with Afghanistan provides employment for the local population. The idea of long-term investment with slow but steady returns is not part of the business culture. It is partly for this reason that industrial development has failed to take off. Industrial activity is restricted primarily to small, owner-financed units, operating without government oversight. These include stone processing, textile weaving, furniture manufacture and light engineering units producing firearms. It is estimated that some 10,000 workers are currently employed in the industrial sector in FATA. With the exception of those engaged in weapons and furniture manufacture, most local workers are unskilled. Some mineral extraction is taking place in various agencies, using outdated technology and antiquated methods. With few industries and only limited un-organized mining, unemployment and underemployment are high. Many seek employment as short-term unskilled laborers or enlist in the local security and paramilitary forces. Those who are able to travel find work in cities across Pakistan as well as in the Middle East, using their earnings to support families at home. The more highly qualified among them have in many cases migrated permanently with their families. They and their children are reluctant to return to the tribal areas, leading among other things to an acute shortage of doctors, teachers and skilled workers generally and in particular to a dearth of qualified female teachers and doctors. The local economy operates on an informal basis and is undocumented, since few laws providing for the regulation of economic activity have been extended to FATA. Access to financing is also restricted by State Bank of Pakistan rules prohibiting banks from extending credit facility to people in the tribal areas. Poverty has, to some extent, made the population vulnerable to extremist tendencies and criminality. In the absence of viable options to earn a living, the lure of illicit activities such as smuggling (consumer goods, weapons) and drug trafficking is as difficult to resist as to call of extremist elements. There are few livelihood opportunities available to the people. The local economy is chiefly pastoral, with agriculture practiced in a few fertile valleys. Most households are engaged in primary-level activities such as subsistence agriculture and livestock rearing, or small-scale business conducted locally. Others are involved in trade within the tribal belt or with down-

Report On Consultative Workshop
FATA Development Authority iv
country markets. Women take active part in agricultural activities, collect fuel wood and fetch water, besides attending to household work and family duties. The most immediate concern in this regard is the absence of reliable statistical data. Figures available from various official sources are often unreliable and frequently contradictory, making it impossible to accurately gauge the situation on the ground or carry out meaningful planning. There is limited conceptual and technical capacity within government departments, with most offices unable to achieve their development targets. Community Appraisal and Motivation Programme (CAMP) had designed a research study for situation analysis of industrial activity and the constraints business community is facing at the moment. A consultative workshop was planned as part of series of activities to come up with the ground realities and suggest suitable mechanism to revive the dying industry of FATA. The agenda of the workshop was shared with FDA for its feedback. A one-day consultation workshop was held at SS Club Peshawar on May 24, 2010, brought together all stakeholders, including but not limited to trade unions, labour unions, FATA Chamber of Commerce, FDA and other relevant government entities, etc. around 50 participants were invited to attend the workshop which will be organized in Peshawar. The Stakeholders’ consultation and analysis of their views on these thematic areas helped developed better understanding of the situation. Objective of the Consultative workshop
To understand the plight of industries, service sector and labor force in FATA
To develop a mechanism for possible steps for improvement – by the government and private sector - based on recommendations from the workshop
Details of the workshop Mr. Atta ullah Khan, Chief Executive, FDA was invited as a guest of honor for the event. In his opening words he expressed the significance of industries, service sector and Labor force in the development of a country and the potential FATA has in the industrial and service sectors. He highlighted all the efforts that FDA has planned for the uplift of the people of FATA in general and industrialists of FATA in particular. Mr. Khalid Mahmood, Manager Industries FDA gave a background of the FDA and talked about

Report On Consultative Workshop
FATA Development Authority v
the importance of having relevant data before designing and planning a project. For the development of a community the most important factor is to provide them with employment opportunities, which is not possible without the development of industries and social sector. The government’s role was defined by Mr. Mahmood by saying that it creates an enabling environment for establishing private industries. The Government should facilitate the process of creating a suitable and safe environment for the industry and for the investors in this sector. Mr. Khalid explained the progress of FDA including the construction of dams, planning the establishment of industrial estates in FATA (Darra Adam Khel Industrial estate) and industrial cities (Marble City in Mohmand Agency) etc. Mr. Naveed Ahmad Shinwari, Chief Executive, CAMP) and Manager Industries, FDA Mr. Khalid Mahmood Khan jointly deliberated upon the data collected from the field. Mr. Shinwari gave a background of the field research and guidelines that were followed during the research. Local surveyors were hired keeping in mind the security situation. Mr. Shinwari told the forum that the assignment was undertaken in a high risk security situation and chances of lack of support from the stakeholders was high; however the project was completed successfully due to support from all the stakeholders. Key Findings of the workshop
The key findings of the survey were not a surprise for the participants; as they were familiar with the issues that were revealed by the survey in the tribal areas. Following are the key findings: Security Situation: It was unanimously agreed that the security situation has worsened the already unstable economic situation of FATA. The ongoing militancy may be a war by religious extremists, for control of areas, a power struggle, and western agenda or for whatever other reasons has crippled the industry, trade, commerce and business. More than ten thousand shops have been closed with more than five billion rupees at stake.
The participants believed that if, Pakistani authorities and the international community are really sincere in eradicating the menace of local and international terrorism they must apply a holistic approach. The aim of the government should be to encourage private investment and improve economic Growth by providing a conducive environment to the investors. Lack of Proper Infrastructure: One of the key reasons for unwholesome indicators is the informal nature of economy in FATA. In the absence of infrastructure comparable with rest

Report On Consultative Workshop
FATA Development Authority vi
of the country, lack or absence of state institutions, effective legal system, sustainable sources of employment have been missing. Governments were contented with status quo, Maliks self-satisfied and private investors didn’t see any apparent benefits for investing in FATA. The result was recourse to informal means, arms manufacturing and illegal selling, smuggling, narco-trade, limited agriculture or at best migration to settled areas. Lack of Legal Framework: The participants opined that the encroaching Talibanisation is not the product of tribal traditions or resistance. It is the result of short-sighted policies and a colonial-era body of law that isolates the region from the rest of the country, giving it an ambiguous constitutional status and denying political freedoms and economic opportunity to the population. The local economy operates on an informal basis and is undocumented since no laws are there for the regulation of economic activity. It was felt that due to lack of proper financial and trade laws the system has become dysfunctional, which has resulted in dead economy. Institutional Weakness: The discussion concluded that FATA Chamber of Commerce has not been an effective and supportive department for the traders and businessmen. It has been monopolized by few who are taking maximum benefit from it. Any projects that come to FATA are either hijacked by the Political administration or the local influentials. It was felt that no plan can work for FATA until the people of FATA are taken into confidence and are part of the implementation. The leakage of funds also needs to be checked. The participants believed that due to non-availability of basic facilities like electricity, gas, water, along with security environment, the establishment of industrial zone will not be effective for the people; the area needs investments and with these issues still outstanding, external investment seems to be unthinkable. Lack of Industrial Activity: The participants felt that the industrial activity is restricted primarily to small, owner-financed units, operating without government oversight. With the exception of those engaged in weapons and furniture manufacture, most local workers are unskilled. Some mineral extraction is taking place in various agencies, using outdated technology and old methods. Significant reserves of minerals and commercially valuable stone remain unexplored particularly in Mohmand Agency. An area in dire need of resources is the communication infrastructure, specifically roads. Any development in the roads network would have an immediate impact on the people’s lives and make the region more accessible Recommendations
Efforts should be made to implement political, administrative and judicial reforms in keeping with tribal traditions. There must be a concerted effort to dispel the feeling among the people that they are not part of the mainstream. More importantly, the government should address their frustrations and sense of socio‐economic deprivation.

Report On Consultative Workshop
FATA Development Authority vii
Most of the population is unemployed, while the rest is working overseas to make both ends meet. We must develop FATA economically, to stop it from becoming a breeding ground for extremism and militancy.
The government should constitute a committee of members of the entire group of stakeholders which should make an authentic assessment of the loss and then give appropriate compensation to the suffered businessmen. Mr. Khalid Mahmood Khan assured the participants that on the recommendation of the Prime Minister, such a committee is being formed.
Transit tax on the raw material imported to the FATA must be removed.
Beneficial financial laws such as the Financial Recovery Ordinance must be extended to FATA; thus the banks will not hesitate in giving loans to the people of FATA.
The government should provide loans on low markup. Peace was recommended as a key to any kind of development in FATA, whereas consistency in planning and enabling environment is another factor that will help in industrial uplift.
Electricity and gas must be provided to the industries of FATA.
Government should initiate projects in the light of the survey to revive the existing set up of industry and trade in FATA.
Roads must be made to the coal mines in Kurram so that the communication cost is reduced, this will help the coal prices to come down.
There is a high quality and quantity of minerals in FATA, 50% of which gets wasted due to lack of modern scientific methods. If this situation is not controlled on urgent basis our natural resources will be diminished in fifty years instead of hundred years. For dealing with this, we should adopt modern scientific methods.

Report On Consultative Workshop
FATA Development Authority viii
List of Participants
S. # Name of Participant Agency/FR Profession/ Business
1 Haji Muhammad Qasim Jan Bajaur Marble Factory
2 M. Imran Khan Bajaur Marble Factory
3 M. Ismail Bajaur Marble Factory
4 Ikram Ullah Bajaur Journalist
5 Mukram khan atif Mohmand Journalist
6 Jahanzaib Mohmand Marble Factory
7 Abdul Majeed Mohmand Steel mils
8 Niaz Wali Mohmand Marble Factory
9 Haji Ismail Khan Mohmand Marble Factory
10 Haji Faisal Mohmand Marble Factory
11 Shams Mohmmand Mohmand Journalist
12 Nisar Ahmad Mohmand WASDO
13 Raheem gul Khyber Salt Factory
14 Ijaz Mohammad Khyber Marble Factory
15 Irshad Khan Khyber Marble Factory
16 Mohammad Hassan Khyber Business man
17 Mohammad Alam Khyber Plastic Factory
18 Abdullah Khyber Plastic Factory
19 Haji Abdul Hanan Khyber Toyota Frontier Motors
20 Mohammad Hassan Khyber Salt Factory
21 Malik Bakht Ali Orakzai Coal Mine
22 Syed Ibne Ali Orakzai Coal Mine
23 Abdullah Orakzai Coal Mine
24 Wajid Ali Orakzai Coal Mine
25 Abid Hussian Kurram Social Worker
26 Haji Malik Peer Khumar Shah Kurram Tribal Elder
27 Iqbal Hussain Iqbal Kurram Journalist
28 Muneer Hussain Kurram Information & Social Services
29 Enginner Mohammand Zaman NWA Ex. Govt. Servant

Report On Consultative Workshop
FATA Development Authority ix
30 Siraj ul Islam FR Kohat Ammunition Factory
31 Naeem Alam FR Kohat Ammunition Factory
32 Arif Saeed FR Kohat Ammunition Factory
33 Dawar Khan FR Kohat Ammunition Factory
34 Jalil Khan FR Kohat Ammunition Factory
35 Akhtar Ameen Peshawar Reporter Daily Times
36 Khuda Dino Shah Peshawar Bureau Chief KTN News
37 Ali Imran Peshawar Samma Tv
38 Rauf Khattak Peshawar The Nation
39 Hayat Khan Peshawar KTN News
40 Abdul Hakeem Peshawar Waqt Tv
41 Yasir Hussain Peshawar Dunya Tv
42 Zafar Iqbal Peshawar ARY News
43 Mehran Muneer Peshawar Waqt Tv

Report On Consultative Workshop
FATA Development Authority x
AGENDA
Stakeholders Consultation Workshop on
“Survey/enumeration of Industries, Service Sector Entities, Labor Force and Identifying constraints in FATA” SS Club Peshawar – 24 May 2010
Agenda
S. No.
Agenda Time
01 Arrival and Registration 9:00 - 10:00
02 Recitation from the Holy Quran 10:00
03 Welcome Speech by Major (Rtd) Attaullah Khan, Chief Executive - FDA
10:05
04 Workshop objectives and Data Presentation – by Naveed Shinwari (CAMP) and Khalid Mahmood Khan (Manager Industries, FDA)
10:15
05 Open Discussion: The plight of industries, service sector and labor force in FATA
10:45
06 Tea break and groups formation 12: 00
07 Groups Work: Possible steps for improvement – by the government and private sector - Recommendations
12:15
08 Lunch & prayer break 1:15
09 Presentations by groups 2:15
Sponsored by FATA Development Authority (FDA), Peshawar

Questionnaires
Annexure – VI English Questionnaires
Serial Number: _________ Date: ______________
INDUSTRIES SURVEY
English Questionnaire

Questionnaires
FATA Development Authority B
Industries Survey in the FATA
Q1. Serial number: ____________________Date of interview: __________________ Q2. Code: _________________________ Q3. Agency/FR: ____________________ Q4. Name of respondent:_______________ Q5. Business entity name: __________ Q6. Year of industry Establishment: _________________Number of years since the
establishments: ______yrs Q7. Nature of industry:
o Manufacturing o Processing o Assembling o Cottage industry o Others (please specify): _________
Q8. Current condition of the industry
Working
Closed down Q9. If closed down, since when?? ______________________________ Q.10. If the industry is closed down then specify the reasons (multiple choice)
I. Financial II. Administrative
III. Legal IV. Law and order V. Selling/marketing of products
VI. Non-availability of raw material VII. Operational issues
VIII. Non-availability of skilled workers IX. Unexpected rise in the manufacturing cost X. Non availability or lack of energy( electricity/gas)
XI. Others____________________________________________________________ Q.11. Size of your industry (according to the attached SMEDA classification)
I. Small II. Medium

Questionnaires
FATA Development Authority C
III. Large IV. Cottage industry
Q12. Ownership of the Industry:
I. Sole proprietorship II. Partnership
Q13. What is produced in your industry?
I. ____________________________________________ II. ____________________________________________
III. ____________________________________________ Q14. Source of finance:
I. Personal investment II. Loan
III. Both
Q15. If loan, then specify (from where)?
I. Bank II. Private loaner/friend/relative
III. Both Q16. Proportion of personal capital: __________% personal and __________ % loan Q17. Annual markup on loan: _________%: Q18. Have you been in contract with bank for the business matters? Yes ( ) No ( ) Q19. Started the industry:
I. After proper conducting feasibility study II. After consultation with other such business people
III. Without planning and consultation
Q.20. what is your production capacity _________
Quantity
Weight

Questionnaires
FATA Development Authority D
Measurement
Others Monthly ___ Yearly _____
Q.21. What is your actual production: _____________________________
Quantity
Weight
Measurement
Others
Monthly ___ Yearly _____ Q.22. If there is a difference in your actual capacity and production, is it due to the following Reasons?
I. Financial II. Administrative
III. Legal IV. Selling/marketing of products V. Law and order
VI. Operational issues VII. Non-availability of raw material
VIII. Non-availability of skilled workers IX. Non availability or lack of energy(electricity/gas) X. Others____________________________________________________________
Q23. Source of Energy
I. WAPDA / TESCO II. Through generator
III. Both Q24. Ratio of energy being utilized
V. WAPDA/TESCO: _________%.
VI. Generator: _________%
Q25. What kind of raw material is used in your industry?
I. ____________________________

Questionnaires
FATA Development Authority E
II. ____________________________ III. ___________________________
Q26. Source of raw material
Imported: ____________________name of country: _____________________
Pakistani: _______________Name of city/area: ____________________ Q27. Have you recruited workers? Yes ( ) No ( ) Q28. Number of skilled workers: ______________ Q29 Number of unskilled workers:___________ Q30. Age of Workers No.
I. Below 18 years ______ II. 18-25 years ______
III. 26-35 years ______ IV. 36-45 years ______ V. 46-55 years ______
VI. 56 + years ______ Q31. Educational level of workers No.
I. Illiterate ______ II. Primary ______
III. Middle ______ IV. Metric ______ V. Intermediate ______
VI. B.A ______ VII. Master (MA) ______
VIII. Madrasa/Religious ______
Q32. Skilled workers received training?
I. On job II. Through institutional /formal training
Q33. Working shifts:

Questionnaires
FATA Development Authority F
I. 1st shift
II. 2nd Shift III. 3rd Shift
Q34. Working hours
I. < 8 hours II. 8 hours
III. 8-12 hours IV. >12 hours
Q35. Salary range
Q36. Skilled workers are:
I. Local II. Non-local
Q37. If non-local (imported) from which area: _________________________ Q38. What other facilities/incentives you provide to your workers?
I. Health II. Food
III. Accommodation IV. Overtime V. None
Q39. Do you make formal contract with your workers?
Yes ( ) No ( ) Q40. What type of skilled workers do you need (specify) _______________________________________________________________________
Skilled Worker Unskilled Worker
<2000 I <2000 I
2000-3000 II 2000-3000 II
3001-5000 III 3001-5000 III
5001-7000 IV 5001-7000 IV
7001-10000 V 7001-10000 V
>10000 VI >10000 VI

Questionnaires
FATA Development Authority G
_______________________________________________________________________ Q41. What problems you are facing while running the industry? (Multiple choices, Check according got
priority)
I. Financial II. Administrative
III. Legal IV. Selling/marketing of products V. Law and order
VI. Operational issues VII. Non-availability of raw material
VIII. Unexpected rise in the manufacturing cost IX. Non-availability of skilled workers X. Non availability or lack of energy( electricity/gas)
XI. Others____________________________________________________________ Q42. In your opinion, what kind of incentives, facilities and priorities are vital for industrial
development? (Multiple choices, check according to priority)
I. Concessional loans II. Extension and implementation of industrial laws and regulations to FATA
III. Availability of energy (electricity and gas) IV. Tax exemption on raw material V. Better law and order situation
VI. Availability of Skilled workers VII. Selling and marketing facility
VIII. Others____________________________________________________________ Q.43. What are the impacts of current law & order situation on your business?
I. Badly impacted II. Very badly impacted
III. Not much impacted IV. No impact at all V. Don’t know
VI. No response Q44. Other details of your industry: ________________________________
I. Is your industry registered with any government department? Yes ( ) No ( )
II. Does your industry’s matters documented? Yes ( ) No ( ) Q45. Directors’/owners’ details:

Questionnaires
FATA Development Authority H
Number of directors/owners: _____________________________
Name of directors/owners: _____________________________
S. no Names Designation
Q46. Directors/owners belong to:
Number of local directors/owners: ______________________
Number of non-local directors/owners: ______________________ Q47. Complete address of the industry: ____________________________________________ Q48 . Telephone number: ________________ Q49 . Fax number: _____________ Q50 . Email Address: ______________________ Read out the Exit Notes to the Respondent Thank you for participating in our survey, if you want to ask any question, you can contact my supervisor in coming few days. Details of the Interviewer I confirm that the interview is executed according to the instructions Name: ________________________________________________ Signature: _____________________________________________ Date: _________________________________________________ Portion to be filled by the supervisor:

Questionnaires
FATA Development Authority I
Is it important to re-check the interview? Yes ( ) No ( )
Methodology for Cross checking 1. Direct Supervision during the Interview 2. Monitoring in the presence of the Supervisor 3. Cross checking from the supervisor’s /central office through telephone 4. No need for the cross checking
Validated by the Supervisor Name of interviewer: _________________________________Signature:___________________ Date of interview: ____________________________________Method of back check: ________ Supervisors’ comments: __________________________________________________________

Questionnaires
FATA Development Authority J
Serial Number: _________ Date: ______________
SERVICES SECTOR SURVEY
English Questionnaire

Questionnaires
FATA Development Authority K
Services Sector Survey in the FATA
Q1. Serial number: ____________________Date of interview: __________________ Q2. Code: _________________________ Q3. Agency/FR: ____________________ Q4. Name of respondent:_______________ Q5. Business entity name: __________ Q6. Year of Establishment: _____________Number of years since the establishments: _____yrs Q7 Volume of your business:
I. Small II. Medium
III. Large Q9. Ownership of the business:
III. Sole proprietorship IV. Partnership
Q9. Nature of business (choose from the attached list): _________________________ Q10 Source of finance:
IV. Personal investment V. Loan
VI. Both
Q11. If loan, then specify (from where)?
IV. Bank V. Private loaner/friend/relative
VI. Both Q12. Proportion of personal capital: __________% personal and __________ % loan Q13. Annual markup on loan: _________%:

Questionnaires
FATA Development Authority L
Q14. Have you been in contract with bank for the business matters? Yes ( ) No ( ) Q15. Started the business:
IV. After proper conducting feasibility study V. After consultation with other such business people
VI. Without planning and consultation Q16. Source of Energy
IV. WAPDA / TESCO V. Through generator
VI. Both Q17. Ratio of energy being utilized
VII. WAPDA/TESCO: _________%.
VIII. Generator: _________%
Q18. What kind of services/goods you deal in?
IV. ___________________________
V. ____________________________ VI. ____________________________
Q19. Source of goods/services
Imported: ___________________name of country: _____________________
Pakistani: _______________name of city/area: ____________________
Q20. Have you recruited workers? Yes ( ) No ( ) Q21. Number of skilled workers: ______________ Q22 Number of unskilled workers:___________ Q23. Age of Workers No.

Questionnaires
FATA Development Authority M
VII. Below 18 years ______ VIII. 18-25 years ______
IX. 26-35 years ______ X. 36-45 years ______
XI. 46-55 years ______ XII. 56 + years ______
Q24. Educational level of workers No.
IX. Illiterate ______ X. Primary ______
XI. Middle ______ XII. Metric ______
XIII. Intermediate ______ XIV. Bachelor ______ XV. Master ______
XVI. Madrasa/Religious ______
Q25. Skilled workers received training?
III. On job IV. Through institutional /formal training
Q26. Working shifts:
IV. 1st shift V. 2nd Shift
VI. 3rd Shift Q27. Working hours
V. < 8 hours VI. 8 hours
VII. 8-12 hours VIII. >12 hours
Q28. Salary range
Skilled Worker Unskilled Worker
<2000 I <2000 I
2000-3000 II 2000-3000 II
3001-5000 III 3001-5000 III

Questionnaires
FATA Development Authority N
Q29. Skilled workers are:
III. Local IV. Non-local
Q30. If non-local (imported) from which area: _________________________ Q31. What other facilities/incentives you provide to your workers?
I. Health II. Food
III. Accommodation IV. Overtime V. None
Q32. Do you make formal contract with your workers? Yes ( ) No ( ) Q33. What type of skilled workers do you need (specify) _______________________________________________________________________ _______________________________________________________________________ Q34. What problems are the problems you are facing while running the business? (Multiple choices,
check according to priority)
I. Financial II. Administrative III. Legal IV. Selling/marketing of products V. Law and order VI. Non-availability of goods/material VIII. Unexpected rise in the goods/material price IX. Non-availability of skilled workers X. Non availability or lack of energy( electricity/gas) Others____________________________________________________________
5001-7000 IV 5001-7000 IV
7001-10000 V 7001-10000 V
>10000 VI >10000 VI

Questionnaires
FATA Development Authority O
Q35. In your opinion, what kind of incentives, facilities and priorities are vital for industrial development? (Multiple choices, check according to priority)
I. Concessional loans
II. Extension and implementation of industrial laws and regulations to FATA III. Availability of energy (electricity and gas) IV. Tax exemption on goods/ material V. Better law and order situation
VI. Availability of Skilled workers VII. Others____________________________________________________________
Q36. How much you satisfied with your business?
I. Not satisfied II. To some extent satisfied
III. Satisfied IV. Very much satisfied
Q37. What are the impacts of current law & order situation on your business?
I. Badly impacted II. Very badly impacted
III. Not much impacted IV. No impact at all V. Don’t know
VI. No response Q38. If badly affected, approximately in %age
I. 20 – 30 % II. 31 – 50 %
III. 51 – 70 % IV. More than 70%
Q39. Other details of your industry :________________________________
III. Is your industry registered with any government department? Yes ( ) No ( ) IV. Does your industry’s matters documented? Yes ( ) No ( )
Q40. Directors’/owners’ details:
Number of directors/owners: _____________________________

Questionnaires
FATA Development Authority P
Name of directors/owners: _____________________________
S. no Names Designation
Q41. Directors/owners belong to:
Number of local directors/owners: ______________________
Number of non-local directors/owners: ______________________ Q42. Complete address of the industry: ____________________________________________ _______________________________________________________________________ Q43 . Telephone number: ________________ Q44 . Fax number: _____________ Q45 . Email Address: ______________________ Read out the Exit Notes to the Respondent Thank you for participating in our survey, if you want to ask any question, you can contact my supervisor in coming few days. Details of the Interviewer I confirm that the interview is executed according to the instructions Name: ________________________________________________ Signature: _____________________________________________ Date: _________________________________________________ Portion to be filled by the supervisor:
Is it important to re-check the interview? Yes ( ) No ( )
Methodology for Cross checking

Questionnaires
FATA Development Authority Q
1. Direct Supervision during the Interview 2. Monitoring in the presence of the Supervisor 3. Cross checking from the supervisor’s /central office through telephone 4. No need for the cross checking
Validated by the Supervisor Name of interviewer: _________________________________Signature:___________________ Date of interview: ____________________________________Method of back check: ________ Supervisors’ comments: __________________________________________________________

Questionnaires
FATA Development Authority R
Annexure –VII URDU Questionnaires
INDUSTRIES SURVEY
URDU Questionnaire

Questionnaires
FATA Development Authority S

Questionnaires
FATA Development Authority T
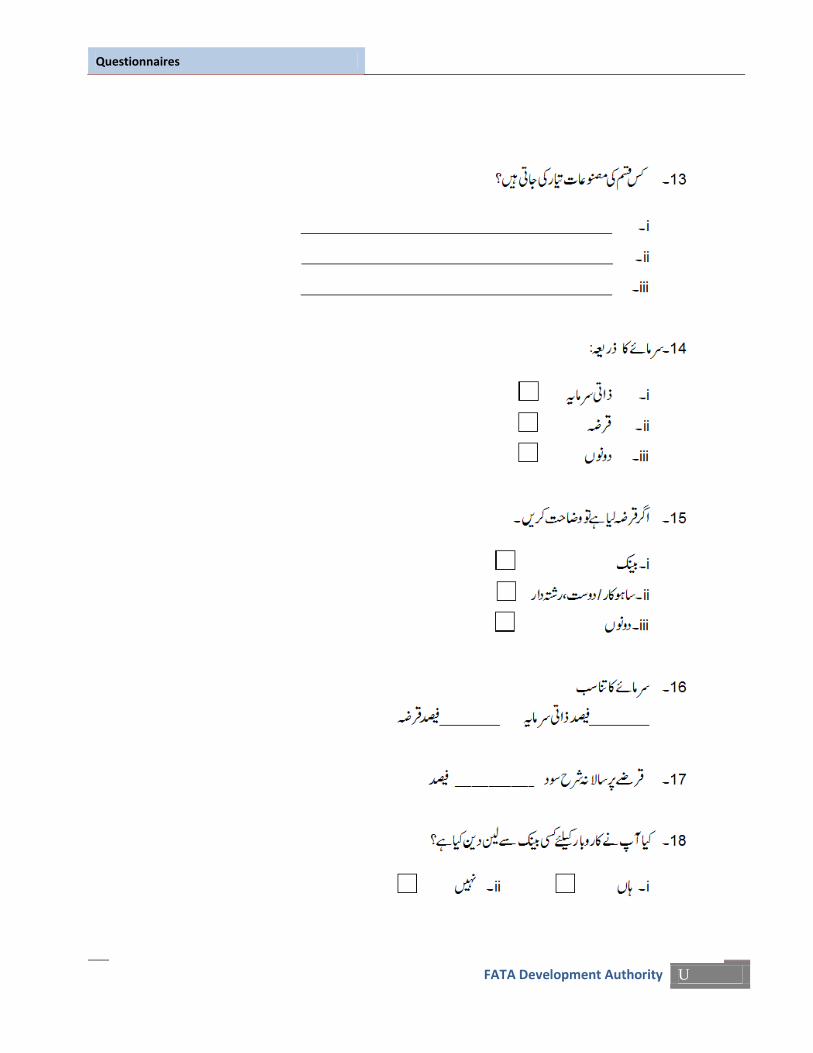
Questionnaires
FATA Development Authority U

Questionnaires
FATA Development Authority V
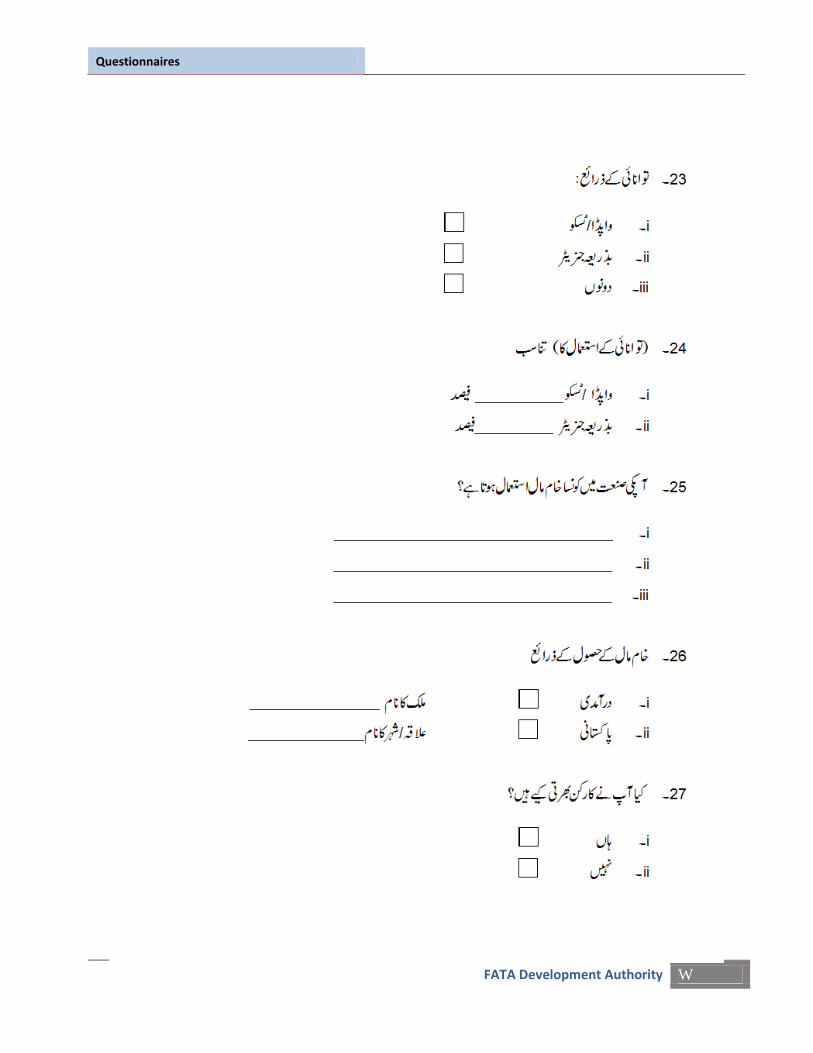
Questionnaires
FATA Development Authority W
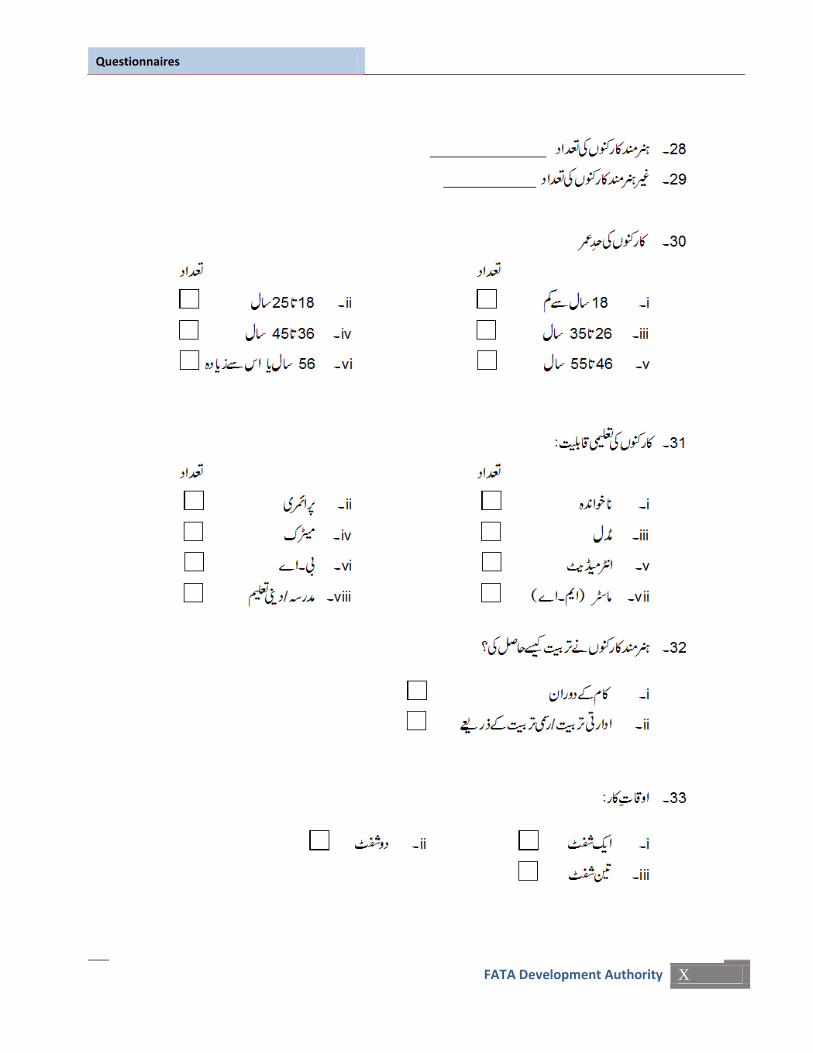
Questionnaires
FATA Development Authority X

Questionnaires
FATA Development Authority Y

Questionnaires
FATA Development Authority Z

Questionnaires
FATA Development Authority AA

Questionnaires
FATA Development Authority BB

Questionnaires
FATA Development Authority CC

Questionnaires
FATA Development Authority DD
SERVICES SECTOR SURVEY
URDU Questionnaire

Questionnaires
FATA Development Authority EE

Questionnaires
FATA Development Authority FF

Questionnaires
FATA Development Authority GG

Questionnaires
FATA Development Authority HH

Questionnaires
FATA Development Authority II
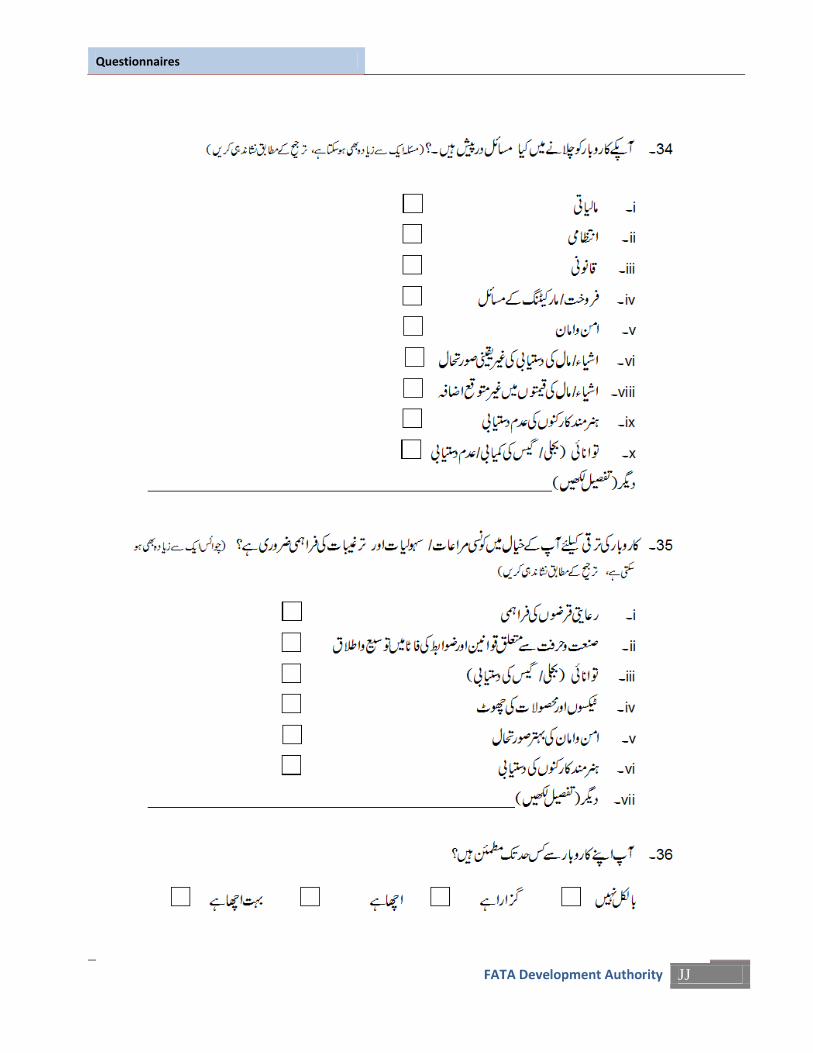
Questionnaires
FATA Development Authority JJ

Questionnaires
FATA Development Authority KK

Questionnaires
FATA Development Authority LL

Questionnaires
FATA Development Authority MM
End Notes
i FATA Secretariat
ii The State of Pakistan‟s Competitiveness Report 2009
iii Sustainable Development Plan for FATA 2008-2015
iv Porter, M. E. 1998, Clusters and the new economics of competition, Harvard Business Review, Nov/Dec98, Vol. 76
Issue 6, p77, v Finance and Fiscal policy for development, Economic Development, Michael P. Todaro & Stephen C. Smith, Chapter
15, Page 753, 2nd
paragraph vi Bringing Finance to Pakistan‟s Poor: A Study on Access to Finance for the Underserved and Small Enterprises,”
World Bank Report 2009. vii
MICROCAPITAL BRIEF: State Bank of Pakistan (SBP) Launches Credit Guarantee Scheme for Small and Rural
Enterprises Funded by United Kingdom‟s Department for International Development (DFID) and Pakistan‟s Financial
Inclusion Program (FIP) http://www.microcapital.org/microcapital-brief-state-bank-of-pakistan-sbp-launches-credit-
guarantee-scheme-for-small-and-rural-enterprises-funded-by-united-kingdoms-department-for-international-
development-dfid-and-pakist/
viii
Cost of conflict in FATA, www.fata.gov.pk ix
Understanding FATA, volume 4 on opinion on FCR, www.understnadingfata.org x World Development Report 1997 - the state in a changing world, Volume 1