Embed Size (px)
Citation preview

0 1 10
Li
-30
-25
-20
-15
-10
-5
0
5
0 0 0 0 1 10
B e1 10 100 1000
B0 1 10 100100010000100000
Al1000 100001000001000000
C a0 0 1 10
Ti0 0 1 10 1001000
C r
0 1 10 100 1000
M n
-30
-25
-20
-15
-10
-5
0
5
1 0 1 0 0 1 0 0 01 0 0 0 01 0 0 0 0 0
F e0 0 1 10
C o0 0 1 10 100
N i0 1 10
C u1 10 100 1000
Z n0 1 10
G a
0 0 1 10 100
A s
-30
-25
-20
-15
-10
-5
0
5
0 0 1 10
S e0 0 1 10
R b1 0 1 0 0 1 0 0 0
Sr0 0 0 1 10 100
Y0 0 0 1 10
Zr0 0 0 0 1
N b
0 0 0 1 10 100
M o
-30
-25
-20
-15
-10
-5
0
5
0 0 0 0 1
A g0 0 0 0 1 10
C d0 0 0 0 1
S n0 0 0 1
S b0 0 0 1 10
C s1 0 1 0 0 1 0 0 0
B a
0 0 0 0
H f
-30
-25
-20
-15
-10
-5
0
5
0 0 0 1 10
P b0 0 0 0
Bi0 0 0 0 1
T h0 0 0 1 10
U0 0 0 0 0 0 1 10
E u0 0 0 1 10 1001000
L a
0 1 10
Li
-45-40-35-30-25-20-15-10
-505
0 0 0
B e0 1 10 100
B0 1 10 100
Al10000 100000 1000000
C a0 0 1 10
Ti0 0 1 10
C r
1 0 1 0 0 1 0 0 0
M n
-45-40-35-30-25-20-15-10
-505
1000 10000
F e0 0 1
C o0 0 1 10
N i0 0 1 10
C u1 10 100
Z n0 1 10
G a
0 0 0 1 10
A s
-45-40-35-30-25-20-15-10
-505
0 0 1 10
S e0 1 10
R b1 0 1 0 0 1 0 0 0
Sr0 0 1
Y0 0 0 1 10
Zr0 0 0 1
N b
0 0 1 10
M o
-45-40-35-30-25-20-15-10
-505
0 0 0 0 0
A g0 0 0 0 0 1
C d0 0 0 0 1
S n0 0 0
S b0 0 0
C s1 0 1 0 0 1 0 0 0
B a
0 0 0 0 0
H f
-45-40-35-30-25-20-15-10
-505
0 0 1
P b0 0 0 0
Bi0 0 0 0 0
T h0 0 0 0
U0 0 0 0
E u0 0 0 1
L a
The source of trace elements in The source of trace elements in groundwater in sandy aquifersgroundwater in sandy aquifers
Marc J.M. Vissers
Faculty of geosciences

Why trace elements in groundwater
• Geochemistry– Redistribution of trace elements (ore and natural
anomalies)– Global biogeochemical cycle
• Environmental science– Atmospheric pollution / acidification– Agricultural pollution / acidification
• Consumption (direct and indirect)

This talk: Environmental geochemistry
- Study area and processes
- Present a 3-step approach for interpretation:- 1: Equilibrium modeling approach- 2: Coprecipitation- codissolution approach- 3: New: Steady-state input approach
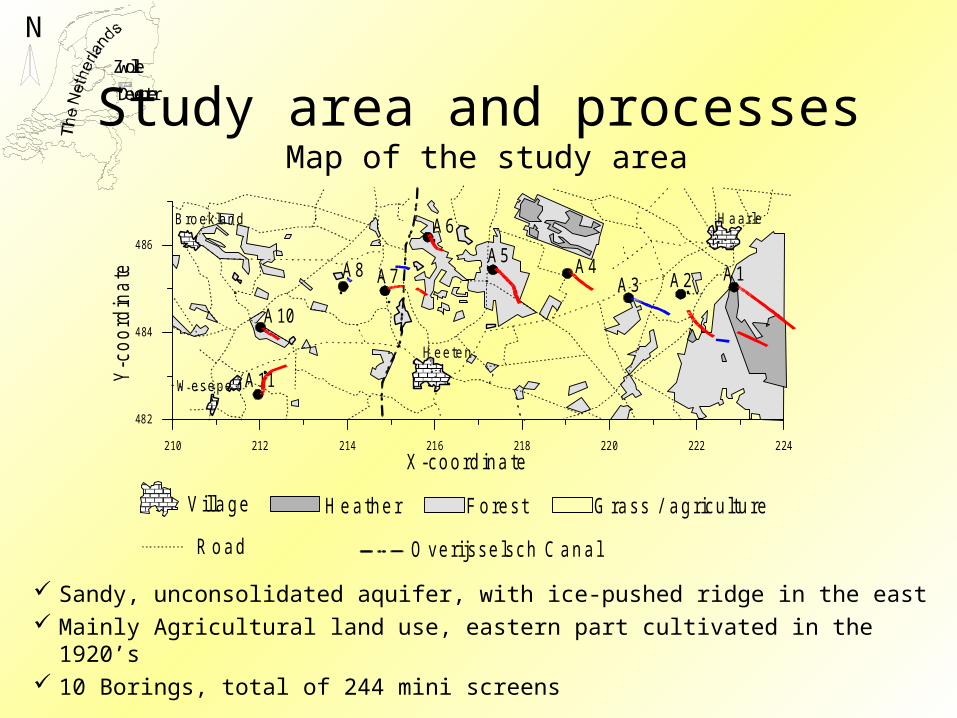
Study area and processes Map of the study area
Sandy, unconsolidated aquifer, with ice-pushed ridge in the east Mainly Agricultural land use, eastern part cultivated in the 1920’s 10 Borings, total of 244 mini screens
NZwolle
Deventer
210 212 214 216 218 220 222 224
482
484
486
A1A2A3A4A5
A6
A7A8
A10
A11
Heeten
Wesepe
HaarleBroekland
Village
R oad
ForestH eather
X -coord ina te
Y-c
oord
ina
te
G rass / ag ricultu re
O verijsselsch C anal
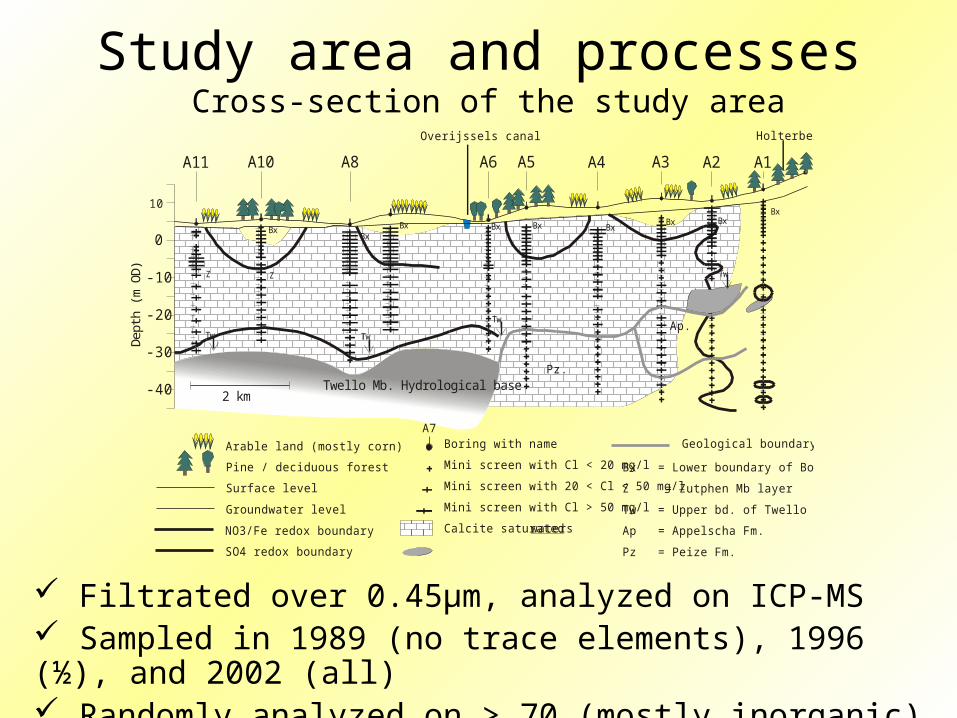
Study area and processes Cross-section of the study area
Filtrated over 0.45μm, analyzed on ICP-MS Sampled in 1989 (no trace elements), 1996 (½), and 2002 (all) Randomly analyzed on > 70 (mostly inorganic) parameters
kk
-40
-30
-20
-10
0
10
Overijssels canal Holterberg
A1A2A3A4A5A6
A7
A8A10A11
Twello Mb. Hydrological base
Groundwater level
Pine / deciduous forest
Arable land (mostly corn)
Calcite saturatedwaters
Boring with name
NO3/Fe redox boundary
SO4 redox boundary
2 km
Dep
th (
m O
D)
Bx
Z
Bx
Tw
Bx
Ap.
BxBxBxBx
Tw
Bx
Z
Tw
Bx
Tw
Surface level
Mini screen with Cl < 20 mg/l
Mini screen with 20 < Cl < 50 mg/l
Mini screen with Cl > 50 mg/l
Bx = Lower boundary of Boxtel Fm
Pz.
Geological boundary
Z = Zutphen Mb layer
Tw = Upper bd. of Twello Mb.
Ap = Appelscha Fm.
Pz = Peize Fm.
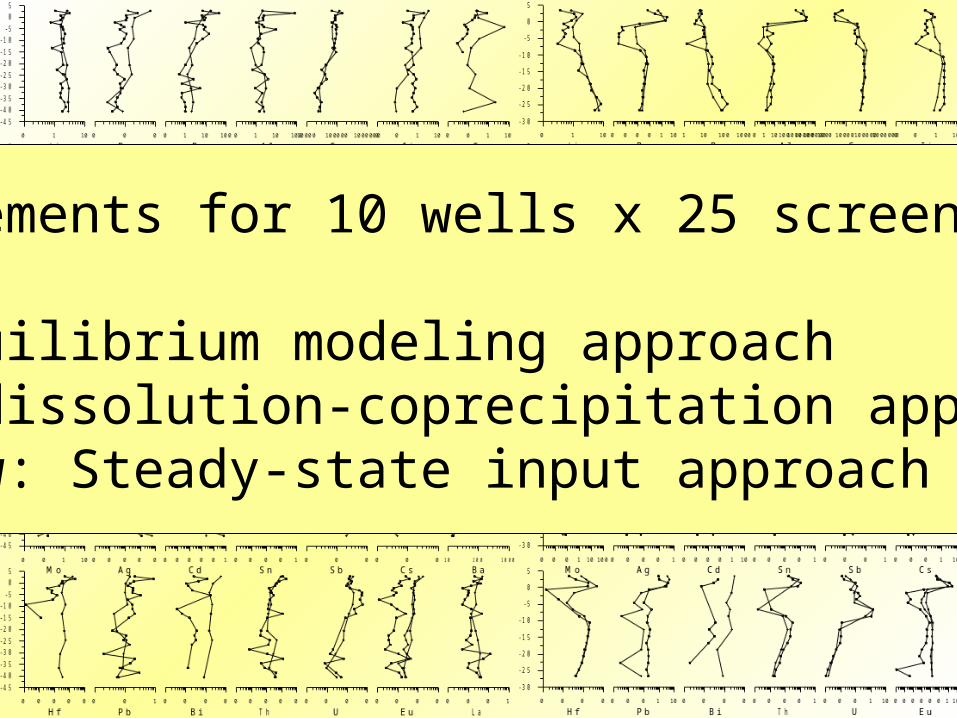
70 elements for 10 wells x 25 screens
1: Equilibrium modeling approach2: Codissolution-coprecipitation approach3: New: Steady-state input approach

1: Equilibrium modeling Theory and Assumptions
• Using CHEAQS and WATEQP– Al3+(aq) + 3OH-(aq) AlOH3(s) Solid phase– Al3+(aq) + F-(aq) AlF2-(aq) Speciation
Equilibrium modeling assumes- chemical equilibrium (also redox and pH)- pure phases- transport in dissolved phase only

1: Equilibrium modeling Results
Pure phase saturation explains:– Sulfate: Barium (barite)– Carbonate: Calcium and apparently iron and manganese in
reduced zone– Hydroxides: Aluminum, manganese in acid zone– Iron / Calcium / pH: Phosphorous (vivianite and apatite)– Phosphates: REY in acid water– Pure phase: Uranium (uraninite) in reduced water
• Depending on local conditions!
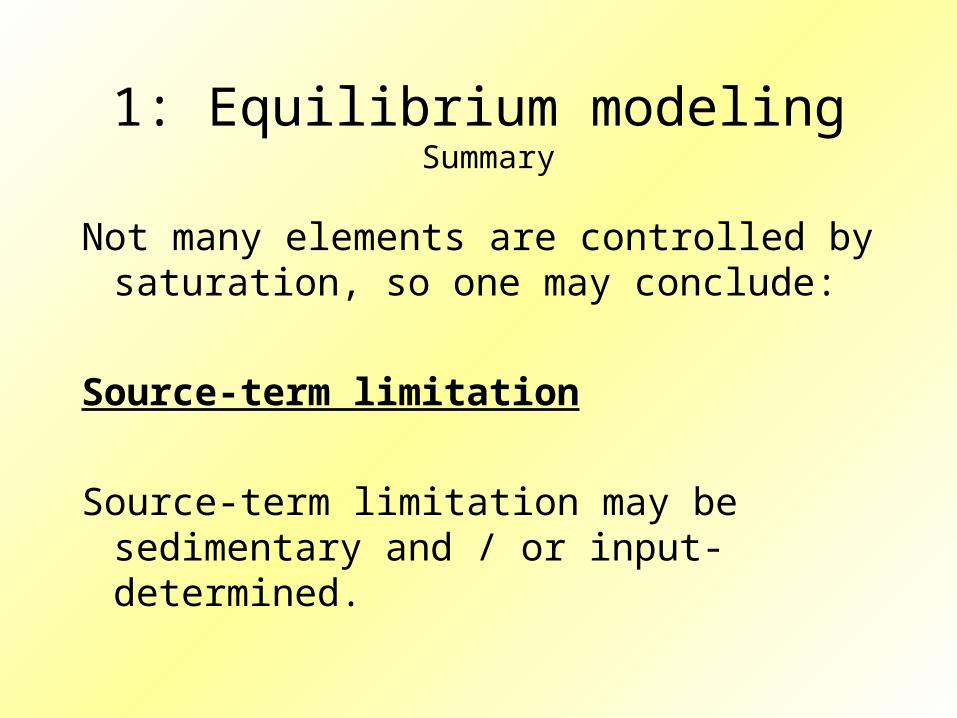
1: Equilibrium modeling Summary
Not many elements are controlled by saturation, so one may conclude:
Source-term limitation
Source-term limitation may be sedimentary and / or input-determined.
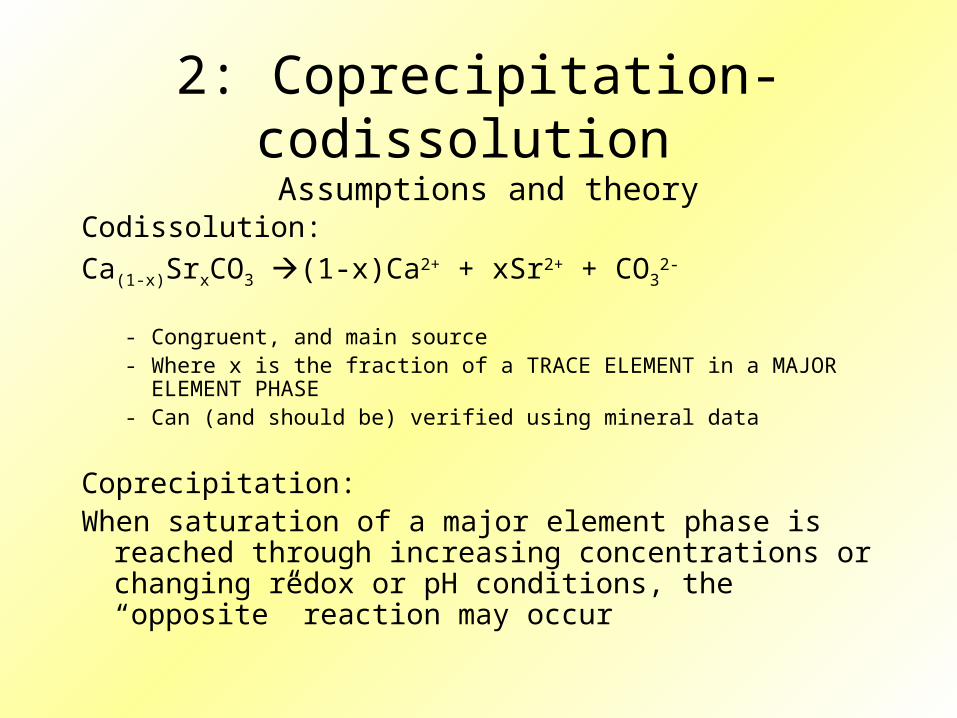
2: Coprecipitation-codissolution Assumptions and theory
Codissolution:Ca(1-x)SrxCO3 (1-x)Ca2+ + xSr2+ + CO3
2-
- Congruent, and main source- Where x is the fraction of a TRACE ELEMENT in a MAJOR ELEMENT PHASE- Can (and should be) verified using mineral data
Coprecipitation:When saturation of a major element phase is reached through
increasing concentrations or changing redox or pH conditions, the “opposite” reaction may occur

2: Coprecipitation-codissolution Bulk sediment geochemistry
(a) Be (mg/kg) (b) La (mg/kg)
0 1 10 100
Ca (g/kg)
0.01
0.1
(c) Sr (g/kg)
Feldspar: 1:14
Clays: 1:60
Calcite: 1:307
Clays: 1:2000
Feldspars: 1:3500
Clays: 1:27000
Feldspars: 1:54000
Heavy minerals
10 100
Al (g/kg)
0.1
1
10 100
Al (g/kg)
1
10
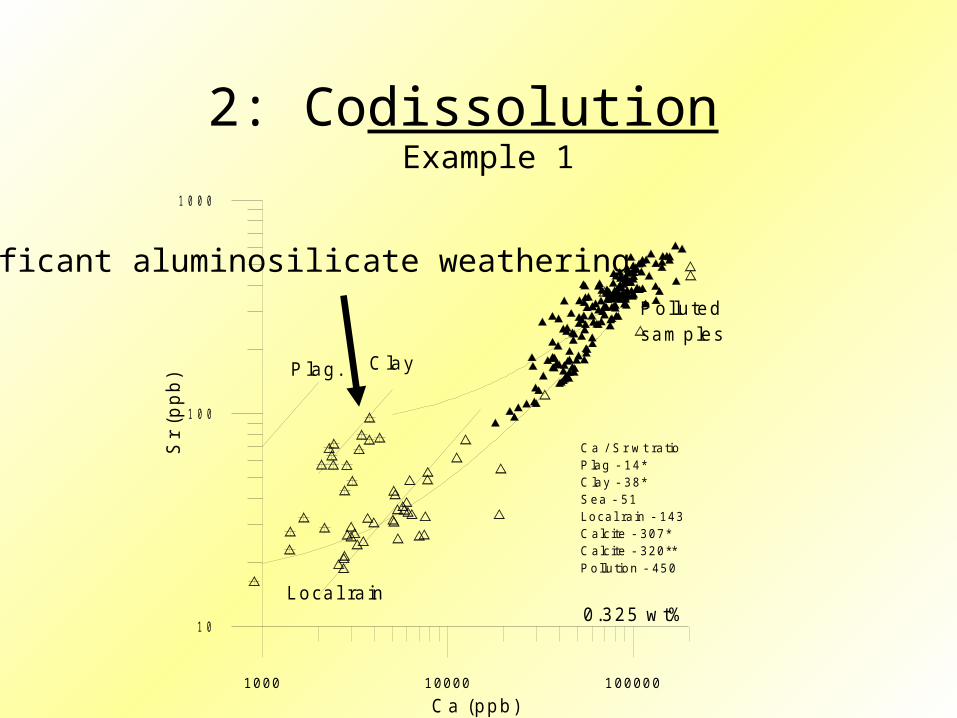
2: Codissolution Example 1
1000 10000 100000
Ca (ppb)
1 0
1 0 0
1 0 0 0
Sr
(ppb
) C lay
0.325 w t%
Pollu tedsam ples
Local ra in
C a / S r w t ra tioP lag - 14*C lay - 38*Sea - 51Local ra in - 143C alc ite - 307*C alc ite - 320**Po llu tion - 450
Plag.
Significant aluminosilicate weathering

2: Codissolution / Coprecipitation Example 2
• Al-Be and Al-Ga (also Al-REE): is observed codissolution real dissolution?
Dutch soil
water
0.1 1 10 100 1000 10000
Al (ppb)
0.0001
0.001
0.01
0.1
1
10
Be
(ppb
)
0.1 1 10 100 1000 10000
A l (ppb)
0.0001
0.001
0.01
0.1
1
Ga
(ppb
)

2: Coprecipitation Example
1 0 1 0 0 1 0 0 0 1 0 0 0 0
F e
0
1
10
100
1000M
n Different source,but relation
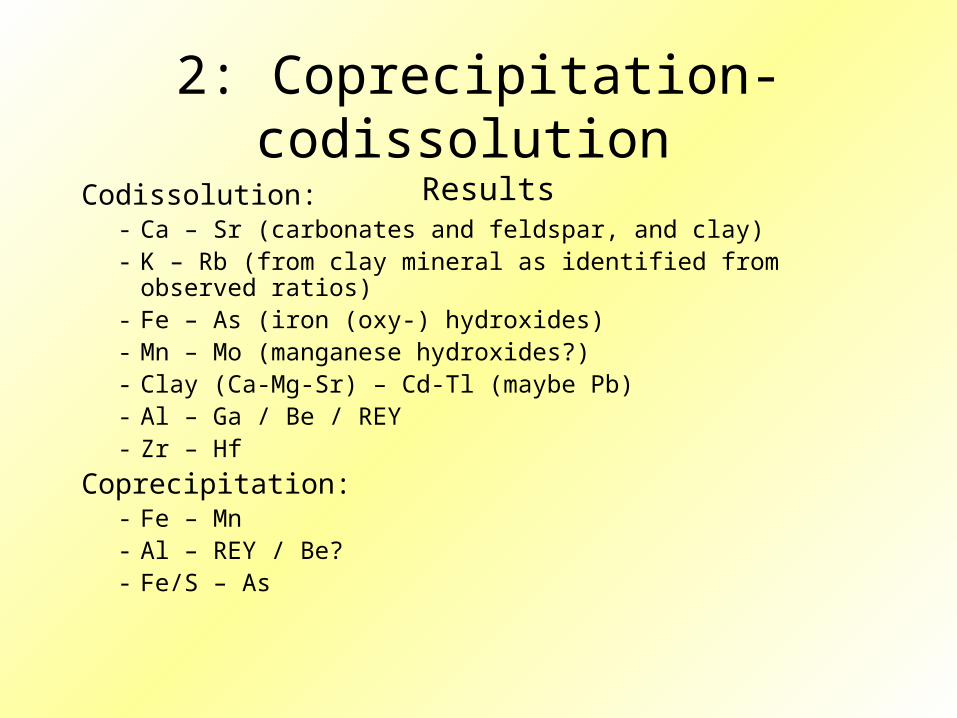
2: Coprecipitation-codissolution Results
Codissolution:- Ca – Sr (carbonates and feldspar, and clay)- K – Rb (from clay mineral as identified from observed ratios)- Fe – As (iron (oxy-) hydroxides)- Mn – Mo (manganese hydroxides?)- Clay (Ca-Mg-Sr) – Cd-Tl (maybe Pb)- Al – Ga / Be / REY- Zr – Hf
Coprecipitation:- Fe – Mn - Al – REY / Be?- Fe/S – As

3: A novel approach
• But what about the ‘normal’ background (e.g. Cu, Pb, Li, etc) and unexplained anomalies (e.g. Zn, Co).
INPUT SOURCE LIMITATION

3: Steady-state input approach Assumptions
- Atmospheric deposition has been relatively constant in the Holocene, and the sediments have become “saturated” with these TE
- Concentrations should be constant with depth- Differences in evaporative concentration ratio TE/CE
should be constant with depth
X-Na+ + Me+(aq) X-Me+ + Na+(aq)seemingly conservative behavior!
- The start of the “Anthropocene” has caused changes!- Geochemical processes cause changes!

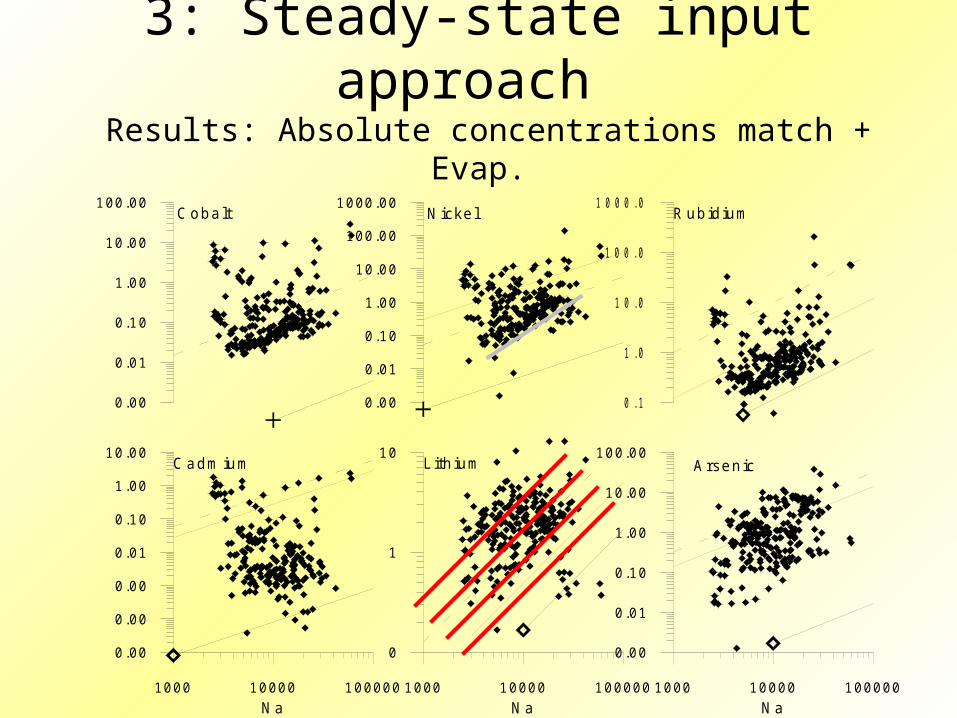
3: Steady-state input approach Results: Absolute concentrations match + Evap.
1000 10000 100000N a
0.00
0.01
0.10
1.00
10.00
100.00Copper
Seawater
Rain SallandRain Sweden
Evaporative concentration
Sorption, depending on pH
1000 10000 100000
N a
0.00
0.00
0.00
0.01
0.10
1.00
10.00
1000 10000 100000N a
0
1
10
1000 10000 100000N a
0.1
1.0
10.0
100.0
1000.0
C adm ium Lith ium
R ubid ium
0.00
0.01
0.10
1.00
10.00
100.00Arsenic
0.00
0.01
0.10
1.00
10.00
100.00
0.00
0.01
0.10
1.00
10.00
100.00
1000.00C obalt N ickel
3: Steady-state input approach Results: Absolute concentrations match + Evap.
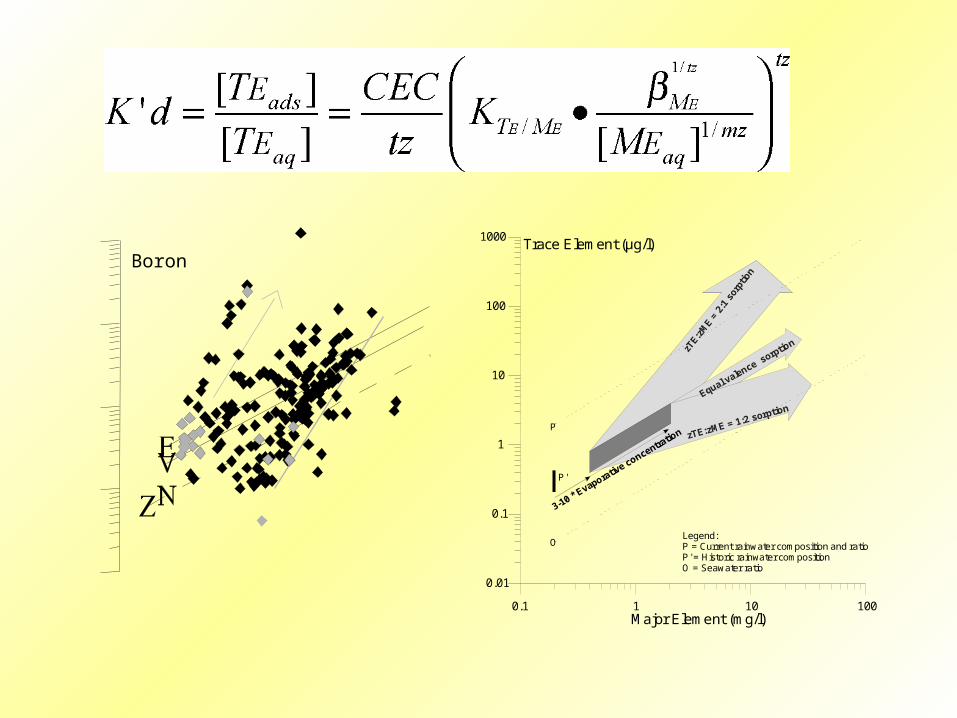
0.1 1 10 100Major Element (mg/l)
0.01
0.1
1
10
100
1000
3-10 * Evaporativ
e concentratio
n
Trace Element (µg/l)
P'
Legend:P = Current rainwater composition and ratioP' = Historic rainwater compositionO = Seawater ratio
zTE:
zME =
2:1
sor
ptio
n
zTE:zME = 1:2 sorption
P
Equal valence sorptio
n
O
Boron

3: Steady-state input approach Lithium normalizing on Sodium (Na)
0 1 10
-60
-40
-20
0
101
102
103
104
105
106
107
108
109
110
111
112
113
114
115
116
117
118
119
120
121
122
123124
125126
127128
129130
131132
201
202
203
204
205
206
207
208
209
210
211
212
213
214
215
216
217
219220
221222
223224225
227
301
303
304
305
306
307
308
309
310
311
312
313
314
315
316
317
318
319
320321
322323
324325
326327
328329
330
401
402
403
404
405
406
407
408
409
410
411
413
414
415
416
417
418419
420421
422423
424425
426
501
502
503
504
505
506
507
508
509
510
511
512
513
514
515
516
517518519
520521
522523
524525
526
601
602
603
604
605
606
607
608
609
610611
612613
614615
616617
618619
620621
622623
701
702
703
704
705
706
707
708
709710
711712
713714
715716
717718
719720
801
802
803
805
806
807
808
809
810
811
813814
815816
817818
819820
821822
823824
1001
1002
1003
1004
1005
1006
1007
1008
1009
1010
1011
10121013
10141015
10161017
10181019
1020
1101
1102
1103
1104
1105
1106
1107
1108
11091110
11111112
111311141115
11181119
0 0 0
-60
-40
-20
0
101
102
103
104
105
106
107
108
109
110
111
112
113
114
115
116
117
118
119
120
121
122
123124
125126
127128
129130
131132
201
202
203
204
205
206
207
208
209
210
211
212
213
214
215
216
217
219220
221222
223224
225
227
301
303
304
305
306
307
308
309
310
311
312
313
314
315
316
317
318
319
320321
322323
324325
326327
328329
330
401
402
403
404
405
406
407
408
409
410
411
413
414
415
416
417
418419
420421
422423
424425
426
501
502
503
504
505
506
507
508
509
510
511
512
513
514
515
516
517518519
520521
522523
524525
526
601
602
603
604
605
606
607
608
609
610611
612613
614615616617
618619
620621
622623
701
702
703
704
705
706
707
708
709710
711712
713714
715716717
718719
720
801
802
803
805
806
807
808
809
810
811
813814
815816
817818
819820821822
823824
1001
1002
1003
1004
1005
1006
1007
1008
1009
1010
1011
10121013
10141015
10161017
10181019
1020
1101
1102
1103
1104
1105
1106
1107
1108
11091110
11111112
11131114
1115
11181119
2 log units 2 log units
Age

3: Steady-state input approach Lithium, Cobalt, Nickel, Rubidium, and Copper
- 5 - 4 - 3log[L i] - log [N a]
-60
-50
-40
-30
-20
-10
0
Dep
th (
M +
SL)
- 6 - 5 - 4 - 3log [C o] - log [N a]
- 5 - 4 - 3 - 2log [N i] - log [N a]
- 5 - 4 - 3 - 2log [R b] - log [N a]
- 5 - 4 - 3log [C u] - log [N a]
Sodium norm alized TE-D epth profiles of L i, Co, N i, R b, and Cu (w tbasis), Num bers indicate boring num ber of anom aly from base line
A 7
A 6
A 1
A 2
A 1
A 1
A 4
A 2
A 2
A 1
A 2
A 3
A 1
A 8
A 1
A 1
A 2
A 3
A 1
A 1 / A 4

Element EQ CD-CP SEQSSI ratioSEQSS
IOther Details
Li CD 15*103 Na X Low-pH weathering, slow ubiquitous IDIS4
Be CD Low-pH weathering
B 2.4*103 Na
Al X Gibbsite
P X Apatite, Vivianite
V 28*104 -
Mn X CP EQ: Mn(hydr)oxides/rhodochrosite, CP: siderite
Fe X Siderite
Co CD 2*104 Ca X Low-pH weathering, mobilization in reduced acid GW
Ni CD 5*104 Na X Low-pH weathering, mobilization in reduced acid GW
Cu 5*104 Na/Ca
Zn CD 3*103 Ca X Low-pH weathering, mobilization in reduced acid GW
As CD X CD: Fe oxyhydroxides; Sedimentary control in #A3
Rb CD 5*104 Na X Low-pH weathering, slow ubiquitous IDIS4
Sr CD Calcite and Al-silicates
Mo X Redox-control
Cd CD 12*106 Ca Low-pH weathering
Cs CD 5*106 Na X Low-pH weathering, slow ubiquitous IDIS4
Ba X CD EQ: Barite, CD: Calcite and Al-silicates
U X X EQ: Uraninite, S: Mobilisation at Mn redox boundary
REY CD Low-pH weathering
Ga* CD Low-pH weathering
Sb* Behaviour similar to U
Tl* CD Low-pH weathering
Pb* 1*105 Ca
Zr* Mobilization on organic complexation
Hf* CD Zircon
Vissers, M.J.M., 2005, Patterns of groundwater quality, NGS335

Conclusions
• The steady-state input approach significantly increases the understanding of trace element behavior in the subsurface– Anomalies can be identified
• Anomalously high weathering releasing Be, Cd, Tl, Ga, Co, Ni• Kinetic incongruent “dissolution”, releasing Li, Rb, Cs• Mobilization in specific redox environments, Zn, Co, Ni• Diffuse atmospheric / agricultural pollution
• The true baseline concentrations can be predicted!

Conclusions
- For many elements rain is the main source.- Apart from breakthrough of K and Rb, also Cu,
Pb and many other elements are observed to be anthropogenically enriched in groundwater
- “Groundwater enrichment factors” of many trace elements vary from 1 (Lithium) to more than 100 (Co, Ni, Zn)

0 1 10
Li
-45-40-35-30-25-20-15-10
-505
0 0 0
B e0 1 10 100
B0 1 10 100
Al10000 100000 1000000
C a0 0 1 10
Ti0 0 1 10
C r
1 0 1 0 0 1 0 0 0
M n
-45-40-35-30-25-20-15-10
-505
1000 10000
F e0 0 1
C o0 0 1 10
N i0 0 1 10
C u1 10 100
Z n0 1 10
G a
0 0 0 1 10
A s
-45-40-35-30-25-20-15-10
-505
0 0 1 10
S e0 1 10
R b1 0 1 0 0 1 0 0 0
Sr0 0 1
Y0 0 0 1 10
Zr0 0 0 1
N b
0 0 1 10
M o
-45-40-35-30-25-20-15-10
-505
0 0 0 0 0
A g0 0 0 0 0 1
C d0 0 0 0 1
S n0 0 0
S b0 0 0
C s1 0 1 0 0 1 0 0 0
B a
0 0 0 0 0
H f
-45-40-35-30-25-20-15-10
-505
0 0 1
P b0 0 0 0
Bi0 0 0 0 0
T h0 0 0 0
U0 0 0 0
E u0 0 0 1
L a
0 1 10
Li
-30
-25
-20
-15
-10
-5
0
5
0 0 0 0 1 10
B e1 10 100 1000
B0 1 10 100100010000100000
Al1000 100001000001000000
C a0 0 1 10
Ti0 0 1 10 1001000
C r
0 1 10 100 1000
M n
-30
-25
-20
-15
-10
-5
0
5
1 0 1 0 0 1 0 0 01 0 0 0 01 0 0 0 0 0
F e0 0 1 10
C o0 0 1 10 100
N i0 1 10
C u1 10 100 1000
Z n0 1 10
G a
0 0 1 10 100
A s
-30
-25
-20
-15
-10
-5
0
5
0 0 1 10
S e0 0 1 10
R b1 0 1 0 0 1 0 0 0
Sr0 0 0 1 10 100
Y0 0 0 1 10
Zr0 0 0 0 1
N b
0 0 0 1 10 100
M o
-30
-25
-20
-15
-10
-5
0
5
0 0 0 0 1
A g0 0 0 0 1 10
C d0 0 0 0 1
S n0 0 0 1
S b0 0 0 1 10
C s1 0 1 0 0 1 0 0 0
B a
0 0 0 0
H f
-30
-25
-20
-15
-10
-5
0
5
0 0 0 1 10
P b0 0 0 0
Bi0 0 0 0 1
T h0 0 0 1 10
U0 0 0 0 0 0 1 10
E u0 0 0 1 10 1001000
L a
?