Embed Size (px)
Citation preview

HAL Id: halshs-01774707https://halshs.archives-ouvertes.fr/halshs-01774707
Submitted on 23 Apr 2018
HAL is a multi-disciplinary open accessarchive for the deposit and dissemination of sci-entific research documents, whether they are pub-lished or not. The documents may come fromteaching and research institutions in France orabroad, or from public or private research centers.
L’archive ouverte pluridisciplinaire HAL, estdestinée au dépôt et à la diffusion de documentsscientifiques de niveau recherche, publiés ou non,émanant des établissements d’enseignement et derecherche français ou étrangers, des laboratoirespublics ou privés.
The South African Urban SystemSolène Baffi, Ivan Turok, Céline Vacchiani-Marcuzzo
To cite this version:Solène Baffi, Ivan Turok, Céline Vacchiani-Marcuzzo. The South African Urban System. Rozenblat C.,Pumain D., Velasquez E. International and Transnational perspectives on Urban Systems, Springer,pp.285-314, 2018, 978-981-10-7798-2. �halshs-01774707�
1
En cours de publication
The South African Urban System, in C. Rozenblat, D. Pumain and E. Velasquez (eds) International and
Transnational perspectives on Urban Systems, Springer, June 2018
The South African Urban System
Solène BAFFI, Geography Department, Stellenbosch University, Stellenbosch, South Africa,
Ivan TUROK, Human Science Research Council, Cape Town, South Africa,
Céline VACCHIANI-MARCUZZO*, University Reims Champagne-Ardenne, UMR 8504
Géographie-cités, Reims, France, [email protected]
*: Corresponding author
Abstract
South Africa is often considered an unusual and extreme case in geography. One difficulty is
whether to label this a developing country (like its neighbouring countries), a former colony
(like the United States and Australia), or an emerging economy (like the BRICS group), because
of its highly diverse and unevenly developed character. South Africa also bears a strong imprint
of its colonial and apartheid history, with long-lasting, path-dependent effects. This special
status alludes to the complex territorial trends that characterise the country. The heterogeneous
settlement dynamics and differentiated social, economic and political systems have exerted a
powerful influence over urbanization trends. The chapter explores whether these trends are
distinctive compared with other countries, and what specific socio-economic challenges are
faced in the urban areas.
Keywords : South Africa – urbanization trends – urban trajectories – social exclusion
1. Introduction
South Africa’s urbanization differs from what can be observed in other African
countries in various respects. First, South Africa urbanised earlier than other parts of sub-
Saharan Africa because of its distinctive economic history of mineral extraction and associated
industrialisation. By the late-19th century it was still a sparsely-populated territory with a largely
agrarian society and extensive arid regions, but with a few localised areas of great industrial
dynamism. These emergent cities quickly became powerful drivers of growth with substantial
multiplier effects on the economy of the whole region and far-reaching social consequences as

2
they suctioned large quantities of labour from the wider sub-continent. The urban population of
the country rose rapidly during the 20th century, and the number of urban areas increased more
than ten-fold. The urban share of the national population increased from about 17% in 1900 to
about 65% today, making South Africa one of the most urbanised countries on the continent
(Turok, 2014).
Second, the pattern of urbanisation in South Africa has been deeply influenced by its
extreme political history. The promulgation of segregation laws at the beginning of the 19th
century and the implementation of “separate development” during apartheid caused a departure
from trends observed elsewhere and produced a distinctive form of urban growth. Urbanisation
accelerated during the first half of the 20th century and then slowed down. Rapid
industrialisation during the first period attracted more and more people from the countryside to
migrate towards the cities in search of livelihoods. The growing black African population in the
cities produced a negative reaction from the ruling white minority group, which resulted in
stringent state controls to restrict further urbanisation. Although the controls did not stop the
process, they dampened it, particularly at the height of apartheid between the late-1950s and
early-1980s (Turok, 2014). Access to living space for Africans, Coloureds and Indians became
dependent of the Group Areas Act at the urban scale, and the implementation of “displaced
urbanisation” at the national scale with the creation of so-called homelands. These laws
imposed a very restrictive and uneven urbanisation on the country’s development path.
Third the removal of restrictive laws and the opening of the country to global economic
forces in the 1990s led to the imposition of new spatial dynamics onto the inherited patterns.
The polarization of economic activities has been reinforced by the adoption of orthodox macro-
economic measures, namely the Growth, Employment and Redistribution programme in 1998.
The inherited socio-spatial inequalities constitute major challenges for the different spheres of
national, provincial and metropolitan government. Indeed, the difficulties of addressing the
inherited inequalities are exacerbated by the state’s reluctance to constrain private actors in their
choice of location. The desires for economic connections to international networks and to gain
visibility on the international stage have tended to concentrate development within restricted
areas in the biggest cities. These dynamics partly explain why South Africa remains one of the
most unequal countries in the world, with a Gini index of 63.4 % in 2011 according to the World
Bank (Todes and Turok, 2017).
In order to better understand the main characteristics of urbanization in South Africa, this
chapter seeks to identify the various dynamics of urbanization over the long term by identifying
their distinctive features from those of cities in general. In order to achieve this, various
approaches have been privileged. A first concern regards the evolution of the structure of the
urban system over the long term (2), followed by a specific focus on the economic trajectories
of the main agglomerations (3). The analysis of the socio-spatial reconfigurations linked with
public policies implemented since 1994 then enlightens the current challenges and innovations
faced in South African cities (4).
2. Main trends in urbanization since the 17th century
2.1 Dynamics of urbanization of a new country since the 17th century
According to the European definition of human settlements at the time, no city existed before
the Dutch colonists established the Cape settlement in 1652 (Coquery-Vidrovitch, 1993). Even
though settlements existed in the area established by Bantus or Khoisans, they did not form the
highly structured pattern of European settlements. However, the goal of the Dutch colonists

3
was not to initiate an intensive colonization of the space located at the tip of Africa. The main
raison d’être of the Cape settlement was its strategic position on the international maritime
road. Nevertheless, after a few years the discoveries of natural resources in the hinterland
brought colonists to establish various small settlements within the Cape Colony. Those pioneer
fronts were not driven the colonial authority but were a consequence of private initiatives by
scattered groups of individuals, the trekboers. From this moment on, the position of the Cape
settlement as an interface located on international trade routes and a bridgehead towards an
unknown hinterland became its main role as a settlement. This situation can be compared to
other new countries such as the United States and Canada, even though the number of settlers
was fewer in South Africa. However the local economy and society remained quite
rudimentary. The weakly developed aspect of the Dutch colony enabled R. J. Davies (1972) to
talk about a “pre-industrial stage” to qualify the Cape Colony between 1652 and 1806. The
agrarian economy remained dominant at this time, few communication networks were built and
the main mode of transportation was the ox-wagon, resulting in lengthy journeys to connect
Cape Town to its surrounding settlements. Therefore, in spite of the foundation of towns at the
time, the lack of integration between the various settlements makes it impossible to refer to the
existence of an urban system as yet.
The strategic position of the Cape of Good Hope on the maritime routes explains why the British
wanted to seize this space, while in Europe French, Dutch and British empires fought to
consolidate their supremacy. In 1806, the Cape settlement became a British possession, the new
colonists having the aim to make the Cape an important harbor able to export sheep wool to the
expanding English industry (Houssay-Holzschuch, 1999). The initial ambition of the British
therefore differed radically from the goals defined by the Dutch when they founded the colony.
Moreover, the colonial territorialization pattern developed by the British relying on transport
and communication networks (McKenzie, 1927) to assert control over the land, meant that the
meshing together of the new colony was quickly established. The colonists operated a thin
administrative division followed by the foundation of new towns to relay the Crown’s power
within the hinterland. A postal service was created in 1806, followed a few decades later by the
implementation of the telegraph in 1860. Roads were built as well as bridges and passes to
facilitate the access to the interior of the country, while omnibus services were inaugurated in
Cape Town to enable increased commuting into town. The construction of the railway network
in 1860 marked a turning point in the connectivity of the territory. The frequency of the
maritime connections between Cape Town and Britain increased along with the speed of the
vessels following the introduction of steam engines. These changes contributed to a shift in the
South African colony’s position in the international system: from an unknown periphery, the
territory was slowly integrated into the British Empire, with major repercussions for its internal
organization.
The simultaneity of the construction of the railroads and the discovery of a rich hinterland where
the British needed to assert their domination influenced the position of the new towns. Indeed,
the reticular pattern implemented led to the foundation of towns along the new rail
communication axis (Fig.1). At this stage, the South African network fits with the model
developed by E. J. Taaffe, R. L. Morrill & P. R. Gould (1963): penetrating lines appeared to
serve different ambitions: establishing political and military connections, and producing
agricultural goods for export. Hence, the railways network was developed according to what
can be observed in other African colonies: the penetrating lines were connecting the main
harbors to areas of agricultural production such as the wine lands or the breeding areas,
especially to export ostrich feathers and sheep wool (Baffi, 2014). At the time, the networking
of the colony combined with the influx of British and European immigrants, the economic
dynamism of the settlers and the political and administrative organization contributed to

4
structuring the space located at the tip of the continent, turning Cape Town into a proper
bridgehead for Southern Africa.
Figure 1: Spatial diffusion of railways in South Africa
This pattern evolved quickly when rich mineral discoveries were made in Kimberley in 1867
and the Witwatersrand in 1886. These discoveries led to a gold rush and the foundation of
Johannesburg, as well as other small mining towns along the 80 kilometer-long ore deposits.
The need to carry heavy machines from the seaports to the Witwatersrand in order to extract
the gold was one of the reasons for the rapid extension of the railway line towards Kimberley
and then Johannesburg: in 1892, a train from Cape Town entered Johannesburg. The dynamism
of the industry was also attributable to the influx of a large workforce: low skilled workers –
mostly Africans – reached Johannesburg by train from the most remote parts of South Africa
and neighboring countries, whereas qualified workers arrived from England or other British
colonies. The importance of the population influx to Johannesburg explains why only ten years
after its foundation, its population exceeded Cape Town’s. Hence, the mining discoveries in
Johannesburg led to a major upheaval in Southern Africa due to the synergies between urban
growth, industrialization and extension of the railways. Three railway lines were built in the
1890s to connect the Witwatersrand with the commercial ports of Maputo, Durban and Cape
Town, based largely on public funding (Turok, 2014). If the coast contained the largest towns
and the economic and political centers during the colonial era, the exceptional growth of
Johannesburg brought about a switch in the urban structure: the center of gravity in the urban
system and the railway network moved towards the interior of the country (Fig.2), starting a
profound and persistent pattern of spatial polarization (Browett & Fair, 1974).
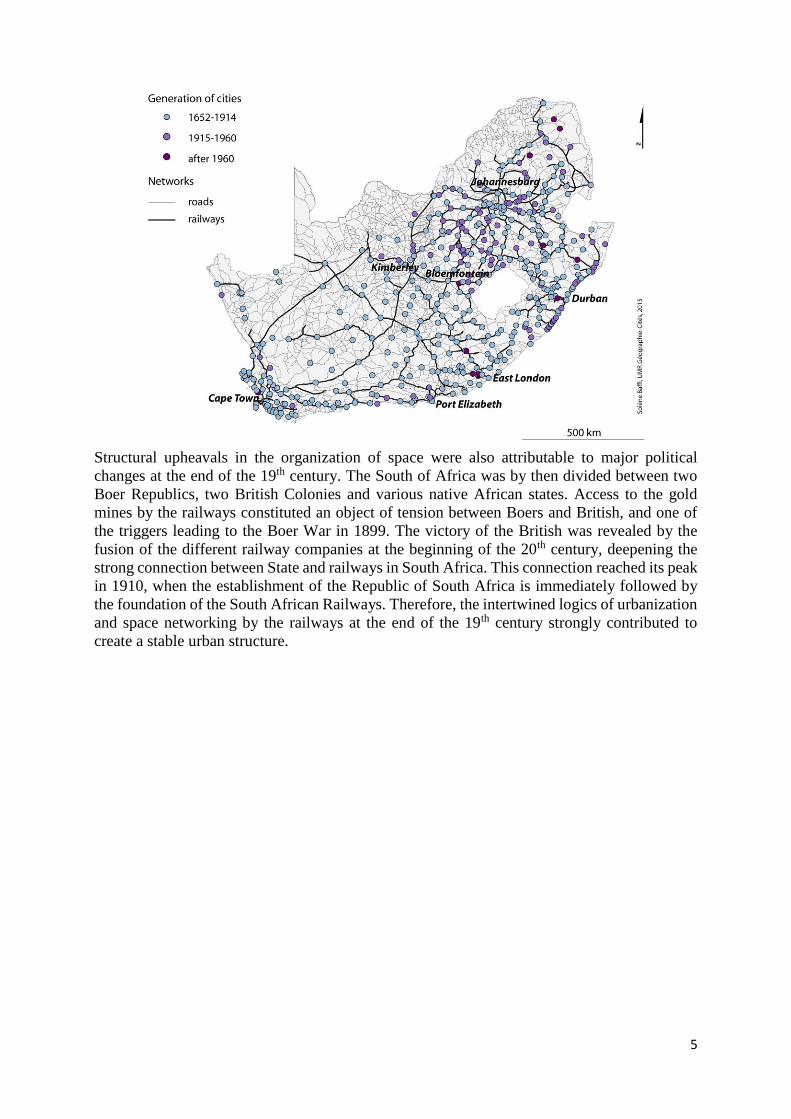
Figure 2: Spatial diffusion of cities and railways in South Africa
5
Structural upheavals in the organization of space were also attributable to major political
changes at the end of the 19th century. The South of Africa was by then divided between two
Boer Republics, two British Colonies and various native African states. Access to the gold
mines by the railways constituted an object of tension between Boers and British, and one of
the triggers leading to the Boer War in 1899. The victory of the British was revealed by the
fusion of the different railway companies at the beginning of the 20th century, deepening the
strong connection between State and railways in South Africa. This connection reached its peak
in 1910, when the establishment of the Republic of South Africa is immediately followed by
the foundation of the South African Railways. Therefore, the intertwined logics of urbanization
and space networking by the railways at the end of the 19th century strongly contributed to
create a stable urban structure.

6
BOX: defining the “urban” in South Africa over the long term
A major challenge faced by geographers is to define what is urban and what is not in a
way that is consistent over time. Urban areas are usually defined administratively, statistically,
morphologically or functionally. However, in South Africa the implementation of segregation
and forced removals reduced the applicability of these criteria. The creation of separate
homelands and townships that lacked an economic base deprived these settlements of the
functions and high order services that normally exist for places of this size. This undermines
the use of a functional criterion. The morphological criterion is also problematic because the
geography of apartheid kept populations physically separate, with major discontinuities in
space in order to isolate the different racial groups. In towns, buffer zones were created to
separate white areas from townships (Coloured, Indian or African). There were also long
distances between the urban centers and many of the former homelands, despite their functional
dependence. The administrative criterion is not useful either because different racial zones
within each city were administered by separate bodies during apartheid.
Throughout the 20th century a legal definition of the city was adopted in the official censuses.
This is a satisfactory approach in most countries. However, because of South Africa’s
tumultuous history, where political action shaped the territory, the legal definition appears
unstable. For instance, the definition of ‘urban’ adopted in 1960 clearly excluded the non-white
parts of towns. These and other inconsistencies undermine the use of a legal definition to
compare cities over the long term. It explains the need to use a new administrative grid and
definition after the democratic transition in 1994. Since the 2001 census, the work conducted
by Statistics South Africa has been valuable. They published a report assessing the main
challenges in defining cities in South Africa and offering a new definition based on a morpho-
functional criterion. This enabled a more inclusive definition of ‘urban’ spaces that incorporated
places that were previously excluded, despite their functional connections, such as suburbs,
townships and towns in the former homelands.
The database Dysturb (Giraut & Vacchiani-Marcuzzo, 2009) was built according to this
morpho-functional definition and a consistent interpretation of what is urban over the long term
(1911-2011). This required the connections between a main urban area and its immediate
peripheries to be considered. These include commuting journeys which are identifiable through a
specific transport system, black taxis, or minibus taxis. These connections were essential to make
choices in order to create a robust and valid spatio-temporal database. A minimum threshold of
5 000 inhabitants was still used once the links between each former white town and its functional
periphery were established.
2.2 Main trends in urban growth (1911-2011)
Between 1870 and 1930, there was the most marked acceleration in the growth of new towns
in the history of South Africa (Giraut, Vacchiani-Marcuzzo, 20091). The combination of this
phenomenon and the political unification of the country by way of the Union Act in 1910 led
to a continuous reinforcement of territorial cohesion in the course of the 20th century.
Thereafter, the situation in relation to the main lines of communication, in particular the
railways, was a determining factor with the region around Johannesburg becoming a railway
centre that was essential in the process of urban growth. A more secondary event occurred in
the 1920s in the form of a prolonged drought, which accelerated population migration from the
countryside to the towns. The speed of evolution was linked to the economic upheavals in the
1 Source: Giraut F., Vacchiani-Marcuzzo C. 2009. Territories and Urbanization, Atlas and geo-historical
information system (DYSTURB). Paris: IRD éditions, CD Rom, 80 p.
7
last decade of the "late Colonial Transition stage", which was an economic expansion phase,
characterised by the healthy mining sector (in the Transvaal – present-day Gauteng – and
Orange Free State) and by the intensification of agriculture, in the course of which the
foundations of the industrial expansion of the 1930s were laid. Unprecedented rural exodus,
mainly made up of Afrikaner farmers, fed the growth of towns in this period. The decisive
factor, after the discovery of mineral wealth, was the intense industrial development from 1933.
The rapid economic expansion, which accelerated with the industrial era, progressively affected
the major part of the South African territory in a variety of ways (Fig.3).
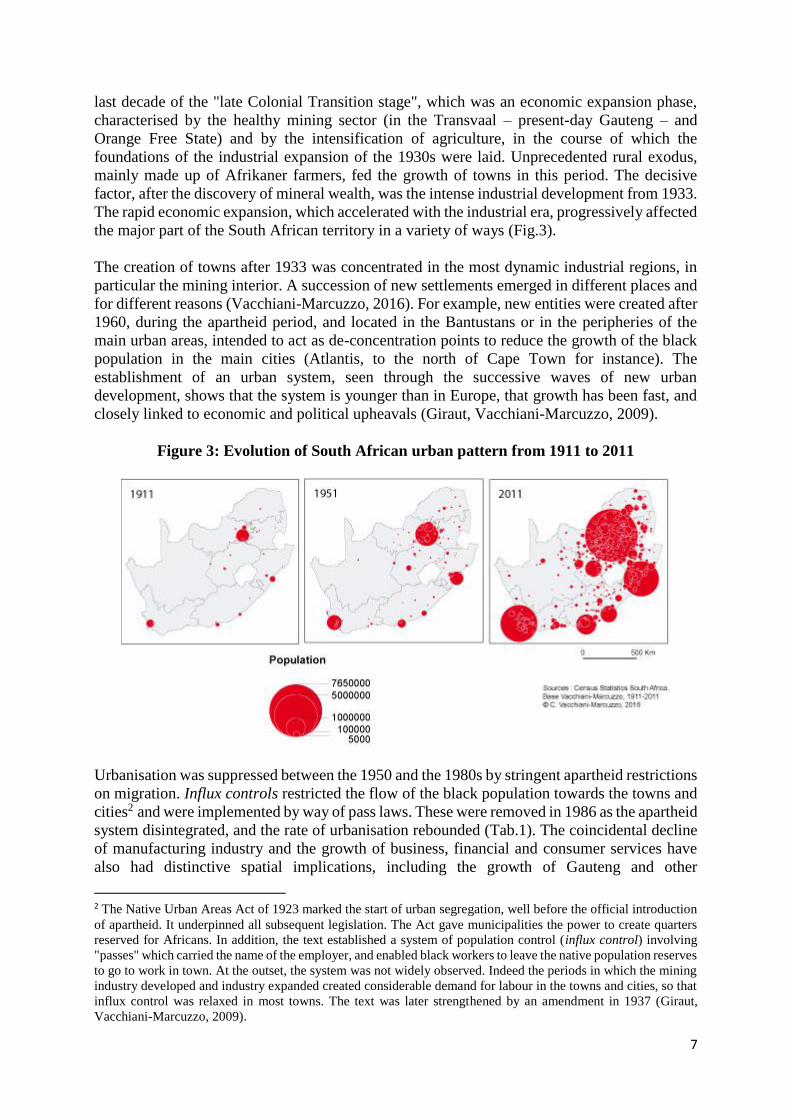
The creation of towns after 1933 was concentrated in the most dynamic industrial regions, in
particular the mining interior. A succession of new settlements emerged in different places and
for different reasons (Vacchiani-Marcuzzo, 2016). For example, new entities were created after
1960, during the apartheid period, and located in the Bantustans or in the peripheries of the
main urban areas, intended to act as de-concentration points to reduce the growth of the black
population in the main cities (Atlantis, to the north of Cape Town for instance). The
establishment of an urban system, seen through the successive waves of new urban
development, shows that the system is younger than in Europe, that growth has been fast, and
closely linked to economic and political upheavals (Giraut, Vacchiani-Marcuzzo, 2009).
Figure 3: Evolution of South African urban pattern from 1911 to 2011
Urbanisation was suppressed between the 1950 and the 1980s by stringent apartheid restrictions
on migration. Influx controls restricted the flow of the black population towards the towns and
cities2 and were implemented by way of pass laws. These were removed in 1986 as the apartheid
system disintegrated, and the rate of urbanisation rebounded (Tab.1). The coincidental decline
of manufacturing industry and the growth of business, financial and consumer services have
also had distinctive spatial implications, including the growth of Gauteng and other
2 The Native Urban Areas Act of 1923 marked the start of urban segregation, well before the official introduction
of apartheid. It underpinned all subsequent legislation. The Act gave municipalities the power to create quarters
reserved for Africans. In addition, the text established a system of population control (influx control) involving
"passes" which carried the name of the employer, and enabled black workers to leave the native population reserves
to go to work in town. At the outset, the system was not widely observed. Indeed the periods in which the mining
industry developed and industry expanded created considerable demand for labour in the towns and cities, so that
influx control was relaxed in most towns. The text was later strengthened by an amendment in 1937 (Giraut,
Vacchiani-Marcuzzo, 2009).

8
metropolitan areas. Many mining towns to the West of Johannesburg and in the Free State have
declined, while service-oriented economies, such as Pretoria and Cape Town, have prospered.
Table 1: Level of urbanization 1911-2011
Year Urbanization rate (%)
1911 18.2
1921 19.8
1936 25.8
1951 35.2
1960 37.9
1970 38.5
1980 42.5
1991 45.6
1996 53.4
2001 56.6
2011 64.1
Thus, despite a relatively high level of urbanization at the national level (64% in 2011), South
Africa is still characterised by marked spatial disparities. The different features inherited from
their histories that were mentioned earlier led to migratory flows that contributed to a complex
territorial structure (Giraut, Vacchiani-Marcuzzo, 2009). In more precise terms, the different
phases of urbanisation generated three main zones of urban concentration, although without
any phenomenon of macrocephaly, which is unusual for the African continent. The primacy
index3 between the first and second urban agglomerations is only 2. In addition, the degree of
urbanisation is unequally spread among the provinces (nine in number since the end of
apartheid). Gauteng province, which includes the three metropolitan areas of Johannesburg,
East Rand (Ekurhuleni4) and Pretoria (Tshwane) obviously heads the list with an urbanised
population level of 99.6%, followed by Western Cape Province (95.1%). At the other extreme
Northern Province has a proportion under 20%. Thus the provinces are at different stages of
urban transition, and with considerable differences between regions. Different cities and towns
across South Africa perform different functions and interact with each other in multiple ways.
2.3 The resilience of urban hierarchy
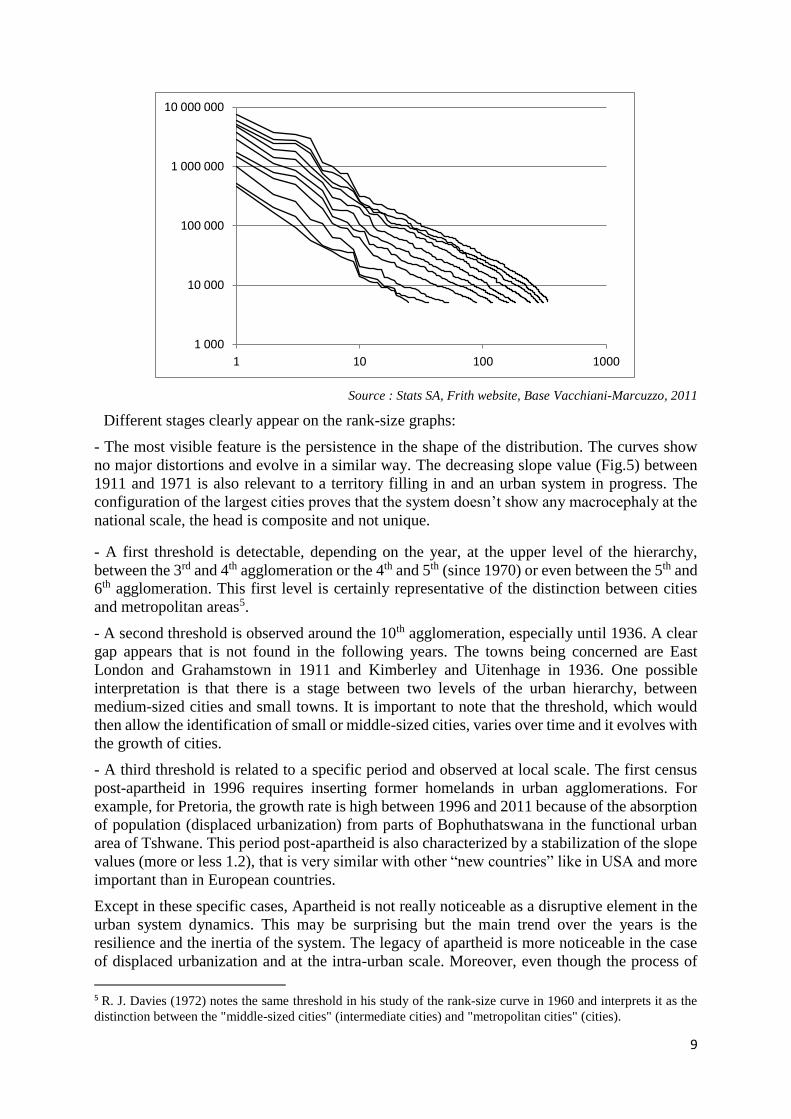
The strong regularity and stability of the rank-size distribution of settlements across the century
(1911-2011) is noteworthy (Fig.4). The graphs are parallel in terms of evolution and similar for
the composition of the head of hierarchy. Indeed, the same metropolitan areas stay at this upper
level over the decades (Johannesburg, Cape Town, Durban, Tshwane).
Figure 4: Rank-Size of South African Urban agglomerations (1911-2011)
3 The primacy index has been calculated since Jefferson (1939) by measuring the relationship between the
population of the first city and that of the second (P1/P2). F. Moriconi-Ebrard (1993) proposed a generalisation of
this notion, distinguishing as metropolises the city or cities situated immediately above the greatest discontinuity
threshold in the distribution of city size (Pi/Pj max) and named this the macrocephaly index. It is therefore not the
same measure, but in theory if a=1 in Zipf's law, it can be expected that P1/P2=2. In practice, the worldwide mean
according to F. Moriconi-Ebrard should be around 4 or 5. 4 The renaming of municipalities affected the names of most of the metropolitan areas.
9
Source : Stats SA, Frith website, Base Vacchiani-Marcuzzo, 2011
Different stages clearly appear on the rank-size graphs:
- The most visible feature is the persistence in the shape of the distribution. The curves show
no major distortions and evolve in a similar way. The decreasing slope value (Fig.5) between
1911 and 1971 is also relevant to a territory filling in and an urban system in progress. The
configuration of the largest cities proves that the system doesn’t show any macrocephaly at the
national scale, the head is composite and not unique.
- A first threshold is detectable, depending on the year, at the upper level of the hierarchy,
between the 3rd and 4th agglomeration or the 4th and 5th (since 1970) or even between the 5th and
6th agglomeration. This first level is certainly representative of the distinction between cities
and metropolitan areas5.
- A second threshold is observed around the 10th agglomeration, especially until 1936. A clear
gap appears that is not found in the following years. The towns being concerned are East
London and Grahamstown in 1911 and Kimberley and Uitenhage in 1936. One possible
interpretation is that there is a stage between two levels of the urban hierarchy, between
medium-sized cities and small towns. It is important to note that the threshold, which would
then allow the identification of small or middle-sized cities, varies over time and it evolves with
the growth of cities.
- A third threshold is related to a specific period and observed at local scale. The first census
post-apartheid in 1996 requires inserting former homelands in urban agglomerations. For
example, for Pretoria, the growth rate is high between 1996 and 2011 because of the absorption
of population (displaced urbanization) from parts of Bophuthatswana in the functional urban
area of Tshwane. This period post-apartheid is also characterized by a stabilization of the slope
values (more or less 1.2), that is very similar with other “new countries” like in USA and more
important than in European countries.
Except in these specific cases, Apartheid is not really noticeable as a disruptive element in the
urban system dynamics. This may be surprising but the main trend over the years is the
resilience and the inertia of the system. The legacy of apartheid is more noticeable in the case
of displaced urbanization and at the intra-urban scale. Moreover, even though the process of
5 R. J. Davies (1972) notes the same threshold in his study of the rank-size curve in 1960 and interprets it as the
distinction between the "middle-sized cities" (intermediate cities) and "metropolitan cities" (cities).
1 000
10 000
100 000
1 000 000
10 000 000
1 10 100 1000

10
drawing new administrative boundaries was very intense during the 1990s (new provinces, new
municipalities boundaries, neo-toponomy, etc.), its impact on urban evolution and urban growth
is not obvious at the scale of urban system.
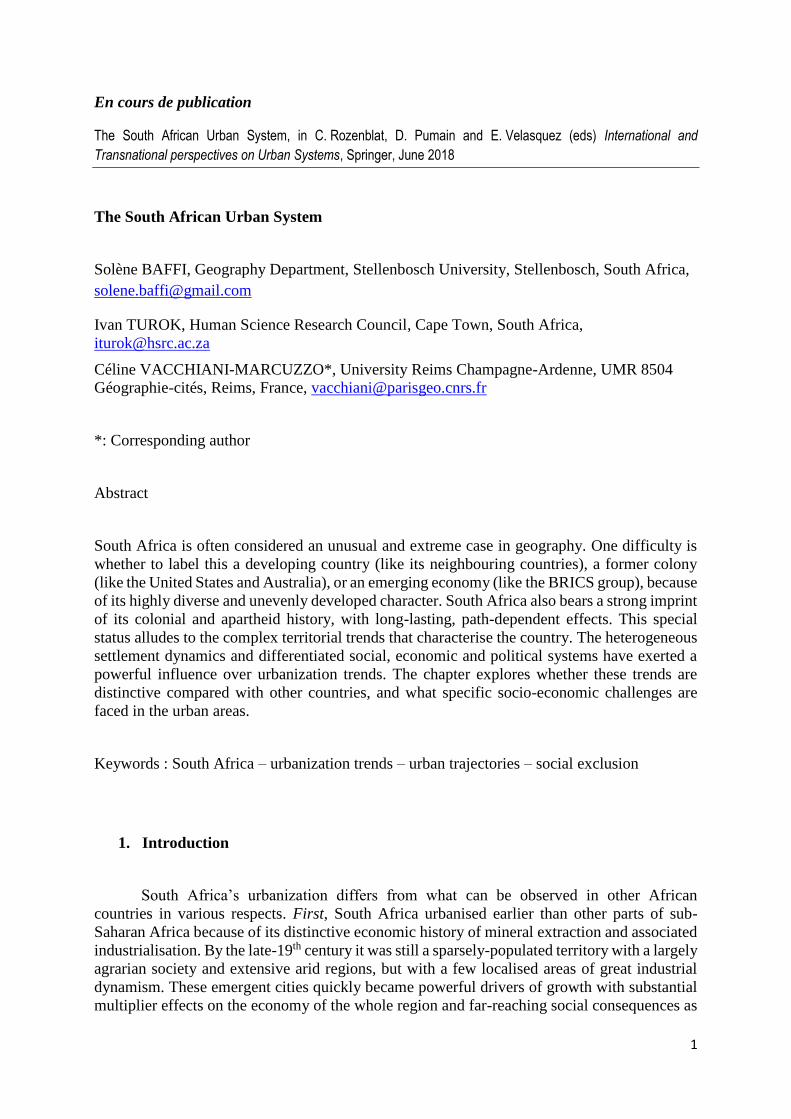
Figure 5: Inequality in city sizes in South Africa (1911-2011)
Date Slope
1911 1.39
1921 1.329
1936 1.311
1951 1.21
1960 1.165
1970 1.165
1980 1.218
1991 1.215
1996 1.196
2001 1.188
2011 1.197
3. Urban economic trajectories
3.1 Functions and specializations of the major cities over the long term
The dynamics of urbanization in Gauteng (formerly Witwatersrand), Cape Town and Durban
were all rather different because their economies had different structures.
Strong urban nodes in Gauteng: Johannesburg and Pretoria
Gauteng was dominated by gold mining and gradually diversified into associated
manufacturing industries and services. These included chemical explosives (for mining), metal
manufacturing, timber and other building materials, civil and mechanical engineering, and
electricity production and distribution. Mining companies themselves were directly involved in
establishing subsidiaries producing cement, clothing, food, beer, steel, chemicals and paper.
Mining also prompted the emergence of the financial services industry, which has replaced
mining as Johannesburg’s leading economic sector for the last two decades (Harrison & Zack,
2012). Gold mining remained the engine of the South African economy for almost 100 years,
and was for many years almost the only source of export revenues. In the 1930s the gold mines
were estimated to account for 50 per cent of all state tax revenues (Turok, 2014). By the peak
of gold production in 1970, South Africa contributed no less than 78 per cent of global output
of gold. Such was the direct importance of gold mining to Gauteng. The expansion of mining
in Gauteng had major local multiplier effects, both indirect and induced. The indirect effects
were experienced across a range of supplier industries, as indicated above.
The largest concentration of manufacturing industry was in a constellation of nine towns in
Ekurhuleni (formerly the East Rand) to the East of Johannesburg. They were Bosburg, Benoni,
Alberton, Brakpan, Germiston, Kempton Park, Edenvale, Springs and Nigel. The East Rand
became the heartland of the country’s manufacturing economy, with sizeable clusters of firms
engaged in metal working, chemicals, food and drink, and packaging. Manufacturing was
Source : Stats SA, Frith website, Base Vacchiani-Marcuzzo, 2011
1,15
1,2
1,25
1,3
1,35
1,4
1,45
1910 1960 2010
11
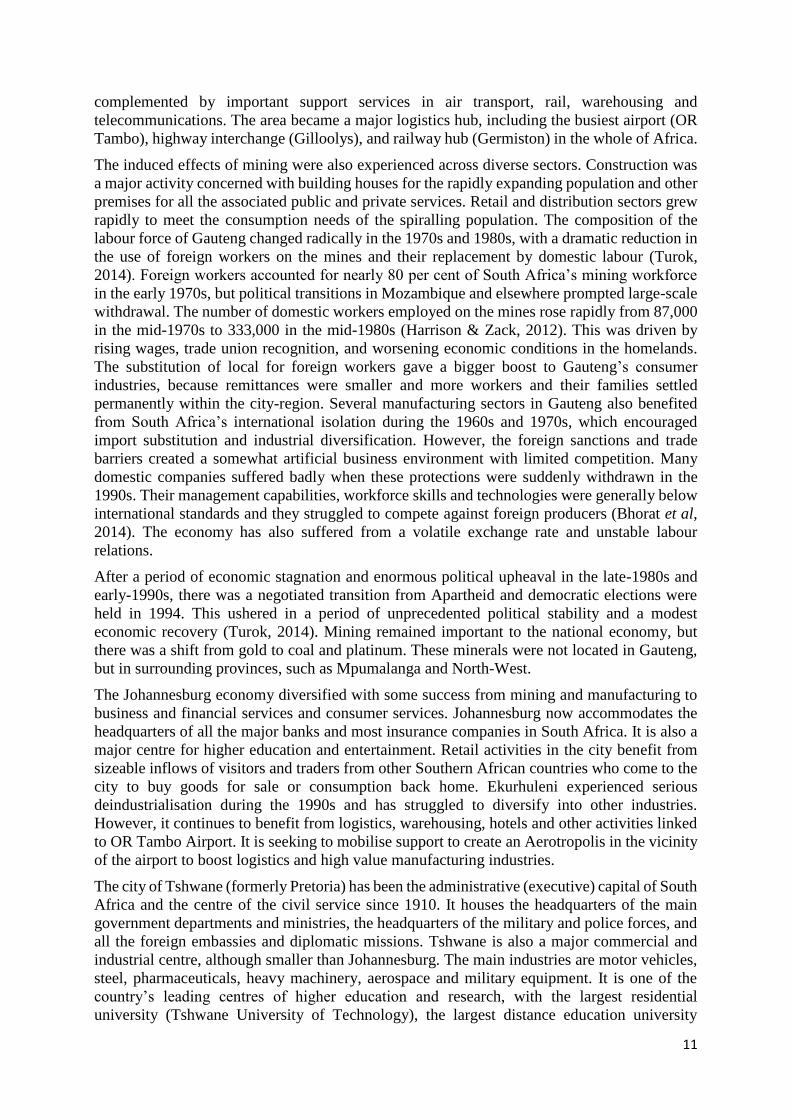
complemented by important support services in air transport, rail, warehousing and
telecommunications. The area became a major logistics hub, including the busiest airport (OR
Tambo), highway interchange (Gilloolys), and railway hub (Germiston) in the whole of Africa.
The induced effects of mining were also experienced across diverse sectors. Construction was
a major activity concerned with building houses for the rapidly expanding population and other
premises for all the associated public and private services. Retail and distribution sectors grew
rapidly to meet the consumption needs of the spiralling population. The composition of the
labour force of Gauteng changed radically in the 1970s and 1980s, with a dramatic reduction in
the use of foreign workers on the mines and their replacement by domestic labour (Turok,
2014). Foreign workers accounted for nearly 80 per cent of South Africa’s mining workforce
in the early 1970s, but political transitions in Mozambique and elsewhere prompted large-scale
withdrawal. The number of domestic workers employed on the mines rose rapidly from 87,000
in the mid-1970s to 333,000 in the mid-1980s (Harrison & Zack, 2012). This was driven by
rising wages, trade union recognition, and worsening economic conditions in the homelands.
The substitution of local for foreign workers gave a bigger boost to Gauteng’s consumer
industries, because remittances were smaller and more workers and their families settled
permanently within the city-region. Several manufacturing sectors in Gauteng also benefited
from South Africa’s international isolation during the 1960s and 1970s, which encouraged
import substitution and industrial diversification. However, the foreign sanctions and trade
barriers created a somewhat artificial business environment with limited competition. Many
domestic companies suffered badly when these protections were suddenly withdrawn in the
1990s. Their management capabilities, workforce skills and technologies were generally below
international standards and they struggled to compete against foreign producers (Bhorat et al,
2014). The economy has also suffered from a volatile exchange rate and unstable labour
relations.
After a period of economic stagnation and enormous political upheaval in the late-1980s and
early-1990s, there was a negotiated transition from Apartheid and democratic elections were
held in 1994. This ushered in a period of unprecedented political stability and a modest
economic recovery (Turok, 2014). Mining remained important to the national economy, but
there was a shift from gold to coal and platinum. These minerals were not located in Gauteng,
but in surrounding provinces, such as Mpumalanga and North-West.
The Johannesburg economy diversified with some success from mining and manufacturing to
business and financial services and consumer services. Johannesburg now accommodates the
headquarters of all the major banks and most insurance companies in South Africa. It is also a
major centre for higher education and entertainment. Retail activities in the city benefit from
sizeable inflows of visitors and traders from other Southern African countries who come to the
city to buy goods for sale or consumption back home. Ekurhuleni experienced serious
deindustrialisation during the 1990s and has struggled to diversify into other industries.
However, it continues to benefit from logistics, warehousing, hotels and other activities linked
to OR Tambo Airport. It is seeking to mobilise support to create an Aerotropolis in the vicinity
of the airport to boost logistics and high value manufacturing industries.
The city of Tshwane (formerly Pretoria) has been the administrative (executive) capital of South
Africa and the centre of the civil service since 1910. It houses the headquarters of the main
government departments and ministries, the headquarters of the military and police forces, and
all the foreign embassies and diplomatic missions. Tshwane is also a major commercial and
industrial centre, although smaller than Johannesburg. The main industries are motor vehicles,
steel, pharmaceuticals, heavy machinery, aerospace and military equipment. It is one of the
country’s leading centres of higher education and research, with the largest residential
university (Tshwane University of Technology), the largest distance education university

12
(UNISA) and a leading research and teaching university (University of Pretoria). Important
scientific and cultural institutions include the Council for Scientific and Industrial Research,
Human Sciences Research Council, Medical Research Institute, Agricultural Research Council
and many museums. The public sector forms an unusually large part of the city’s economy,
both as a source of employment and of demand for property in the city. This has been beneficial
in protecting the city from the worst effects of the global recession and deindustrialisation over
the last decade. Hence Tshwane appears to have a more stable and resilient economy than
Johannesburg and Ekurhuleni, but perhaps also less dynamic because of the dominance of the
public sector.
Durban: An embattled coastal city
Durban is the largest trans-shipment point for imports and exports to Gauteng and other cities
and towns in the interior. It has never possessed the administrative functions of the other four
major cities, so its growth during the 20th century was based on transport, manufacturing and
commercial activities. Durban is the country’s largest port by far, and the logical place to
establish ship repair facilities and industries based on imported inputs, such as chemicals, food
and drink, paper, printing and engineering (Freund & Padayachee, 2002). Many of these sectors
grew strongly between the 1950s and 1980s. Durban municipality became a pioneer during this
period. It was actively involved in acquiring land to assemble sites for industrial development
and expansion. It also introduced a system that put the burden on black workers to pay for the
cost of their own housing and welfare, with no cross-subsidy from the better-off white
ratepayers (Freund and Padayachee, 2002). This involved creating a monopoly on the
production of beer and setting up municipal beer-halls and eating houses for Africans.
Durban’s economy has underperformed relative to the other major cities in South Africa since
the 1990s. One reason for this is the greater dependence on manufacturing. Durban has not
diversified in the same way as Johannesburg and Cape Town. The city has had some success in
attracting automotive manufacturing, with a major Toyota assembly plant and many of its
suppliers. However, many other industries have suffered from poor competitiveness and import
penetration. Clothing and textiles is a prime example. It was once a mainstay of the local
economy, but it has since been decimated by cheap imports from Asia. Durban also suffers
from the lack of provincial and national government departments located in the city. It has
therefore lost out from the sizeable growth in public sector jobs in the country over the last
decade.

13
Cape Town: from Mother city to innovative city
Cape Town thrived as the economic and administrative centre of the Cape Colony during the
19th Century, and subsequently as the legislative capital of the Republic of South Africa, with
a range of associated logistics, manufacturing, cultural, media, property, financial, educational
and tourism activities (Bickford-Smith et al., 1999). Textiles, clothing and furniture were
particularly important for many years. Cape Town also prospered with the head offices of major
companies in retailing, financial services, business services and oil refining (Turok, 2014).
Since the 1990s, the city has benefited from the growth of many service industries, although
not on the same scale as Gauteng. The city is the headquarters of several financial services
companies, international retail chains, media/publishing houses and construction companies.
Tourism has become increasingly important with the diverse attractions of the Western Cape
for entertainment and sightseeing. These include Table Mountain, the Cape Peninsula,
appealing beaches, vineyards, historic buildings and towns, quality hotels and restaurants. Call
centres and business processing operations have also been expanding in the city, most of which
are owned and controlled by multinational corporations. The city has experienced growth in a
range of creative industries, including ICT, design and film production, partly linked to the
attractive lifestyle and image of the city. Finally, the government plays an important role in the
local economy, with the provincial and municipal headquarters, the national parliament, three
universities and major hospitals.
Smaller metropolitan and urban areas
The leading secondary cities are Nelson Mandela Bay (Port Elizabeth), Buffalo City (East
London) and Mangaung (Bloemfontein). The economic performance of all three has been
lacklustre for the last two decades. All three have suffered from the decline of manufacturing
and an inability to diversify into other industries. The automotive sector has provided slight
relief for Nelson Mandela Bay and Buffalo City, with reinvestment by established
multinationals. The public sector has been a much more important source of employment over
the last decade, and provided a lifeline to offset the effects of deindustrialisation.
The economic base of other secondary cities is even narrower. Former gold-mining cities and
towns such as Welkom (now called Matjhabeng) and Klerksdorp (now called Matlosana) have
suffered badly from mining cutbacks and closures. In complete contrast, Rustenburg has been
the fastest growing town in the country over the last decade. Its growth is attributable to the
rapid expansion of platinum and chrome mining and associated processing activities. It has the
four largest platinum mines and the largest platinum refinery in the world.
3.2 Urban economic profiles in the early 21th century
A general overview of trajectories of cities in economic space since the 1960s can be
approached by the shift from “old” to ”new” industries (Fig.6). Indeed, as observed in more
prosperous countries, the economic profile reveals a change around the 1980s with urban
functions more focused on advanced activities such as financial, insurance, telecoms and real
estate (FIRE) and business services (Advanced Producer Services). This well-known shift
towards the tertiary economy occurred in South African cities 10 to 20 years later than in
European or US cities. It’s particularly true for metropolitan areas whereas secondary cities
have more traditional structures, based on manufacturing and mining.

14
Figure 6: Main trajectory of economic profile of cities from 1960’s
Even though South African cities differ according to their stage of economic and technological
development, a process of catching-up is also observed. Nowadays, the urban profile in terms
of economic diversification reveals a strong similarity with others countries.
As large cities adopt innovative cycles (Paulus & Vacchiani-Marcuzzo, 2016), they keep the
footprints of past cycles, so their functional profile appears more diverse and complex (Pumain
et al., 2006). This hypothesis, already tested in other territorial contexts, is based on the number
of employees in the different economic sectors in cities, according to South African economic
nomenclature, very similar to international standards. In this early 21th century, South African
largest cities appear globally less specialized than smaller ones (Fig.7), and this is independent
of any regional effect and the level of economic development. The relationship between city
size and economic diversity appear more evident on the figure 8. All large urban agglomerations
belong to the most diversified group of cities whereas less diversified cities are only small ones
(Pumain et al., 2009).
Figure 7: Economic diversity and city-size in South Africa
© Vacchiani-Marcuzzo, 2005
15
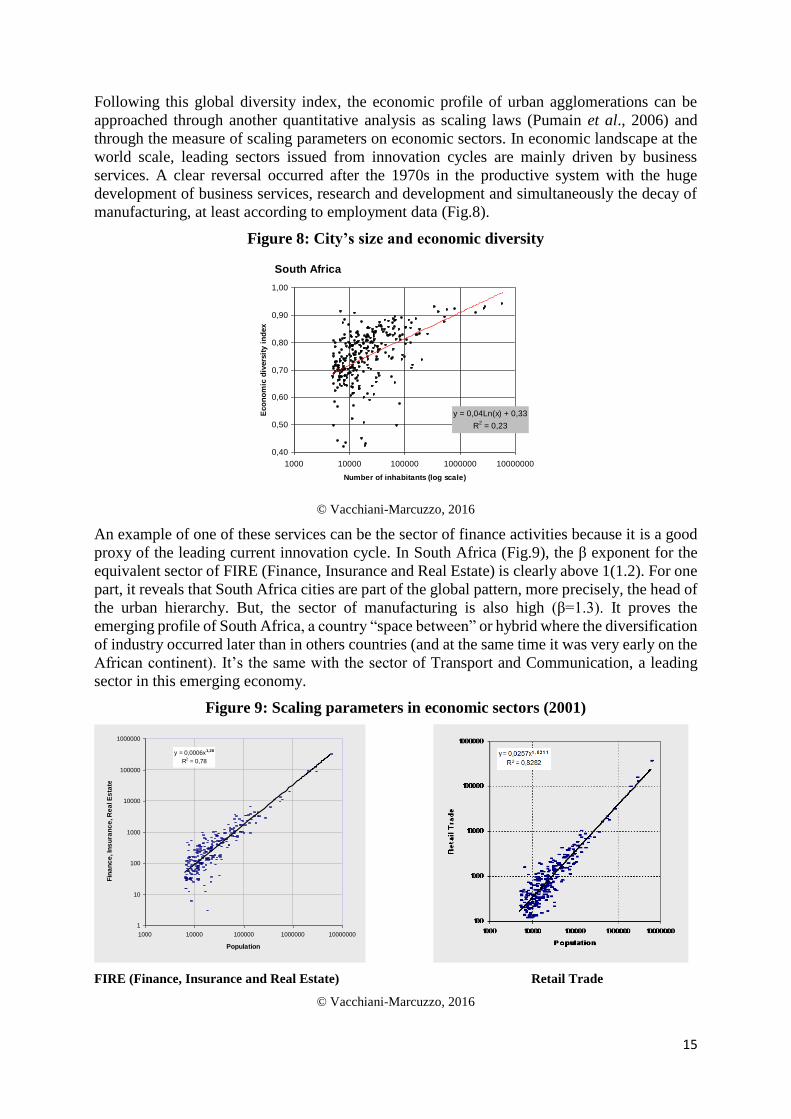
Following this global diversity index, the economic profile of urban agglomerations can be
approached through another quantitative analysis as scaling laws (Pumain et al., 2006) and
through the measure of scaling parameters on economic sectors. In economic landscape at the
world scale, leading sectors issued from innovation cycles are mainly driven by business
services. A clear reversal occurred after the 1970s in the productive system with the huge
development of business services, research and development and simultaneously the decay of
manufacturing, at least according to employment data (Fig.8).
Figure 8: City’s size and economic diversity
© Vacchiani-Marcuzzo, 2016
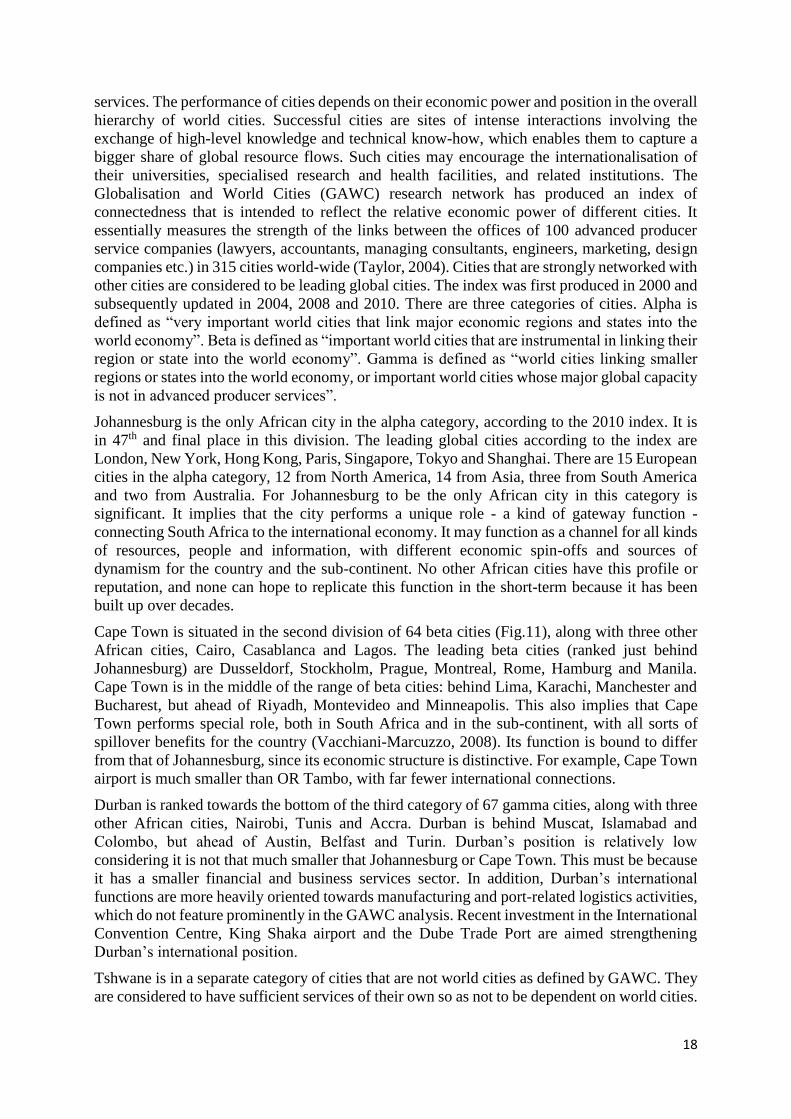
An example of one of these services can be the sector of finance activities because it is a good
proxy of the leading current innovation cycle. In South Africa (Fig.9), the β exponent for the
equivalent sector of FIRE (Finance, Insurance and Real Estate) is clearly above 1(1.2). For one
part, it reveals that South Africa cities are part of the global pattern, more precisely, the head of
the urban hierarchy. But, the sector of manufacturing is also high (β=1.3). It proves the
emerging profile of South Africa, a country “space between” or hybrid where the diversification
of industry occurred later than in others countries (and at the same time it was very early on the
African continent). It’s the same with the sector of Transport and Communication, a leading
sector in this emerging economy.
Figure 9: Scaling parameters in economic sectors (2001)
FIRE (Finance, Insurance and Real Estate) Retail Trade
© Vacchiani-Marcuzzo, 2016
South Africa
y = 0,04Ln(x) + 0,33
R2 = 0,23
0,40
0,50
0,60
0,70
0,80
0,90
1,00
1000 10000 100000 1000000 10000000
Number of inhabitants (log scale)
Eco
no
mic
div
ers
ity i
nd
ex
y = 0,0006x1,28
R2 = 0,78
1
10
100
1000
10000
100000
1000000
1000 10000 100000 1000000 10000000
Population
Fin
an
ce
, In
su
ran
ce
, R
ea
l E
sta
te

16
Other kinds of activities appear more widespread in the whole urban system (β value close to
1) like the retail sector. The private household sector (with a majority of domestic services) has
a β <1 (0.90) which reveals a very common sector, located in all cities and such activities
comprise domestic workers, with around 1.5 million people.
3.3 Continental and international economic leadership/role
3.3.1 How to exist at the world level?
The emphasis in the preceding discussion is on the differences between cities. There are also
some important common issues affecting all or most cities in South Africa. Their poor economic
performance by international standards is crucial. The South African economy has generally
under-performed other middle-income developing countries (including Brazil, Malaysia,
Turkey, Indonesia, Philippines, India and China) on all key indicators – exports, investment,
competition, innovation and productivity (Bhorat et al., 2014). All South African cities suffer
from exceptional levels of inequality and unemployment. The rate of unemployment varies
between 20-40%, depending on how it is defined. High unemployment is attributable to slow
growth in economic output, which in turn is attributable to low productivity growth and low
investment. Economic growth since the 1990s has been driven by household consumption
rather than productive investment. Consumer debt has increased and is now a severe constraint
on household spending. The structure of the economy is skewed towards a few key sectors
which are either highly capital intensive and create few jobs directly (such as the automotive
industry), or highly skill intensive and create few low-skilled jobs that are accessible to
unemployed people (such as financial services). Compared with many other developing
countries, the informal economy is very small and does not help very much to absorb
unemployment (Bhorat et al., 2014). Small businesses struggle to compete against established
companies and suffer from large regulatory burdens. Manufacturing industries that have
traditionally been large employers, such as clothing, textiles, footwear, furniture and electrical
equipment, have been in decline.
The levels of inward foreign direct investment are low by the standards of other middle-income
countries and outweighed by short-term financial flows in the form of portfolio investment.
Many observers believe that South Africa is caught in a middle-income growth trap because of
its failure to diversify from the minerals-energy-complex and move up the value chain towards
innovation-based products and services (Fig.10). Consequently, exports remain dominated by
mineral ores and metals because the country has failed to develop more technologically
sophisticated, higher value added products for export. Two exceptions are insurance/financial
services and tourism. Additional constraints on the development of a more dynamic economy
have been high port handling charges for exports, high costs of rail freight and highly regulated
telecommunications and energy sectors which limit competition and raise costs (Bhorat et al.,
2014).
City economies were relatively self-contained prior to the 1990s because of sanctions against
South Africa, except of course for the export of minerals. Since then deindustrialization has
been severe and cities are struggling to position themselves in a more competitive international
environment. Tourism is important in Cape Town, Johannesburg and Durban, to a lesser extent.
Johannesburg is also an important shopping center for people from the rest of Southern Africa.
Durban is a logistics gateway to the rest of southern Africa. Since 1994 the context of the South
African economy has been transformed from a position of relative isolation from the
international economy to reinsertion and reintegration. Sanctions and exchange controls that

17
prevented companies from investing abroad were lifted. Many protections for the domestic
economy were also withdrawn or substantially reduced. This has coincided with a broader wave
of globalisation that has brought national economies closer together as a result of falling
transport costs, more mobile capital and labour, technological changes, lower tariff protections
and less regulated markets.
Figure 10: Trajectories of main urban agglomerations in economic space related to
sectors privileged by FDIs (1948-2005)
Academics continue to debate whether the improvements in communications and market access
associated with ‘economic integration’ mean more spatially-concentrated activity, or dispersal
to a ‘flatter’ economic landscape. Either way, the fact that the ‘world is getting smaller’ has
created opportunities for South African cities to attract new forms of investment, to serve new
markets and develop new economic functions (Vacchiani-Marcuzzo, 2008). Against this, a
more open and inter-connected economy also means greater competition for resources and
trade, increased import penetration (particularly from China), more pressure to suppress
business costs, and greater vulnerability to external shocks. Since 1994 many of South Africa’s
leading companies have shifted their focus from domestic activities to ‘go global’ by investing
abroad, such as SAB-Miller, BHP Billiton, Naspers, MTN, Anglo American, Old Mutual,
Shoprite and Standard Bank. As a result, South African supermarkets, banks, hotel chains and
telecommunications firms are now very visible in many African cities. South African
companies have been less successful at developing local productive assets and exporting locally
made goods. The country’s rich natural resource endowments still tend to be exported as raw
materials with limited beneficiation and extraction of downstream value from processing and
manufacturing.
3.3.2 Place in the ranking…
There is a lack of research on how well South African cities are integrated into global flows of
finance, trade, talent and information. Global cities develop strong international connections by
becoming organising nodes of global business networks. They are primary locations for the
headquarters of multinational corporations, financial institutions and specialised business
18
services. The performance of cities depends on their economic power and position in the overall
hierarchy of world cities. Successful cities are sites of intense interactions involving the
exchange of high-level knowledge and technical know-how, which enables them to capture a
bigger share of global resource flows. Such cities may encourage the internationalisation of
their universities, specialised research and health facilities, and related institutions. The
Globalisation and World Cities (GAWC) research network has produced an index of
connectedness that is intended to reflect the relative economic power of different cities. It
essentially measures the strength of the links between the offices of 100 advanced producer
service companies (lawyers, accountants, managing consultants, engineers, marketing, design
companies etc.) in 315 cities world-wide (Taylor, 2004). Cities that are strongly networked with
other cities are considered to be leading global cities. The index was first produced in 2000 and
subsequently updated in 2004, 2008 and 2010. There are three categories of cities. Alpha is
defined as “very important world cities that link major economic regions and states into the
world economy”. Beta is defined as “important world cities that are instrumental in linking their
region or state into the world economy”. Gamma is defined as “world cities linking smaller
regions or states into the world economy, or important world cities whose major global capacity
is not in advanced producer services”.
Johannesburg is the only African city in the alpha category, according to the 2010 index. It is
in 47th and final place in this division. The leading global cities according to the index are
London, New York, Hong Kong, Paris, Singapore, Tokyo and Shanghai. There are 15 European
cities in the alpha category, 12 from North America, 14 from Asia, three from South America
and two from Australia. For Johannesburg to be the only African city in this category is
significant. It implies that the city performs a unique role - a kind of gateway function -
connecting South Africa to the international economy. It may function as a channel for all kinds
of resources, people and information, with different economic spin-offs and sources of
dynamism for the country and the sub-continent. No other African cities have this profile or
reputation, and none can hope to replicate this function in the short-term because it has been
built up over decades.
Cape Town is situated in the second division of 64 beta cities (Fig.11), along with three other
African cities, Cairo, Casablanca and Lagos. The leading beta cities (ranked just behind
Johannesburg) are Dusseldorf, Stockholm, Prague, Montreal, Rome, Hamburg and Manila.
Cape Town is in the middle of the range of beta cities: behind Lima, Karachi, Manchester and
Bucharest, but ahead of Riyadh, Montevideo and Minneapolis. This also implies that Cape
Town performs special role, both in South Africa and in the sub-continent, with all sorts of
spillover benefits for the country (Vacchiani-Marcuzzo, 2008). Its function is bound to differ
from that of Johannesburg, since its economic structure is distinctive. For example, Cape Town
airport is much smaller than OR Tambo, with far fewer international connections.
Durban is ranked towards the bottom of the third category of 67 gamma cities, along with three
other African cities, Nairobi, Tunis and Accra. Durban is behind Muscat, Islamabad and
Colombo, but ahead of Austin, Belfast and Turin. Durban’s position is relatively low
considering it is not that much smaller that Johannesburg or Cape Town. This must be because
it has a smaller financial and business services sector. In addition, Durban’s international
functions are more heavily oriented towards manufacturing and port-related logistics activities,
which do not feature prominently in the GAWC analysis. Recent investment in the International
Convention Centre, King Shaka airport and the Dube Trade Port are aimed strengthening
Durban’s international position.
Tshwane is in a separate category of cities that are not world cities as defined by GAWC. They
are considered to have sufficient services of their own so as not to be dependent on world cities.

19
Tshwane’s principal functions are domestic – the executive arm of government, the site of
higher education, research organisations etc.
Figure 11: Ranking of South African cities according to the GAWC index
©Turok, 2014
Source: Based on successive reports from GAWC, accessed at: www.lboro.ac.uk/gawc
Note: The dotted lines signify incomplete observations
This evidence suggests that most South African cities are not strongly integrated into the global
economy, at least for specialised business services. Johannesburg is the exception as the only
city in the premier league of highly-connected world cities. Cape Town is in the second
category. Durban and Tshwane also feature on the list of world cities, but their global
connections seem to be far less significant. Comparing the four indices from 2000 to 2010
enables a simple analysis of the trajectory of these cities over time (Tab.2). Have they become
more or less integrated into the world economy during the last decade? One might have
expected their integration to increase following the end of South Africa’s isolation and the
withdrawal of trade protections and tariff barriers during the 1990s.
Table 2 and figure 11 show the ranking of the cities in each period. The picture is quite mixed
overall and it is difficult to discern a clear trend. Johannesburg’s position has slipped slightly
over the decade. This could be linked with the headquarters of several major corporations being
transferred to the UK, such as Anglo-American, although the city remains the headquarters of
at least seven companies in the Mining Top 100 and the principal location for the major banks
and insurance companies (Harrison & Zack, 2012). Cape Town’s position seems to have been
quite volatile, with no clear increase or decline. Durban appeared to be slipping until the 2010
index suggested a recovery. Tshwane has move in and out of the index, with no consistent trend
over time. Summing up, the main cities have broadly held their own over the last decade, with
no general improvement or deterioration in their global standing.
Table 2: Ranking of South African cities according to the GAWC index
2000 2004 2008 2010
Johannesburg 43 42 44 47
Cape Town 94 81 96 79
Durban 165 173 194 167
Pretoria n.a. 225 n.a. 187
1
51
101
151
201
251
2000 2002 2004 2006 2008 2010
Cit
y R
anki
ng
Year
JohannesburgCairo
Cape TownCasablancaLagosNairobiTunis
DurbanAccraPretoria
Lusaka
Harare

20
Cairo 59 55 61 61
Nairobi 99 165 83 113
Casablanca 110 140 88 95
Lagos 123 150 111 104
Harare 133 194 212 288
Tunis 142 143 144 132
Accra 149 206 158 177
Lusaka 155 n.a. 191 255
©Turok, 2014
Source: Based on successive reports from GAWC, accessed at: www.lboro.ac.uk/gawc
4. Urban planning and urban future
4.1 Rebalancing uneven urbanization
South Africa’s urban system bears the scars of its political history. This is most apparent in
its uneven development. The heyday of apartheid between 1950 and the late-1980s was marked
by intense efforts to impose racial separation and a hostile anti-urban regime (Turok, 2014).
The system was a reaction to the failure of previous state laws to restrict black urbanisation and
fears that white settlements would be inundated by Africans. The governing party was desperate
to avoid blacks outnumbering whites so they could stay in power with a semblance of
legitimacy. Millions of people were forcibly removed from the cities to isolated and barren
‘homelands’ during this era. A stark gap between urban and rural living standards emerged,
creating pent-up migration pressures. Most policies focused on where people lived and resulted
in a severe dislocation between the geography of the economy and population. In addition to
controlling where people could reside, they also deprived blacks of a decent education and
prevented those in the cities from earning a living through self-employment and business start-
ups. This has left a legacy of low business formation rates and high failure rates. Measures were
also introduced to steer the location of industry.
In 1960 a regional policy was brought in to promote industrial decentralisation from the main
cities. This was South Africa’s most enduring form of spatial policy, lasting until 1996 (Todes
and Turok, 2017). The 1960s were a period of buoyant economic growth, seemingly offering
opportunities to disperse expanding industries. The idea was to encourage factories employing
blacks in the cities to move closer to the homelands. The initial focus was on areas bordering
the homelands, particularly those thought to have the best prospects and located closest to cities.
It was rationalized as ‘alleviating over-congestion’ in cities and creating jobs near the
homelands. In the 1970s the policy was extended to incorporate new planning concepts drawn
from abroad. An influential idea was to create large ‘growth poles’ by locating heavy industry
outside the Pretoria-Witwatersrand-Vereeniging region (PWV) (now Gauteng). The 1975
National Physical Development Plan (NPDP) went further with far-reaching proposals for
development axes, growth points, deconcentration points and planned metropolitan areas to
counterbalance ‘over-concentration’ in the big cities and to accommodate white out-migration
from rural areas. As resistance to apartheid increased during the 1980s, economic problems
mounted and policy became more market-friendly. Therefore the policy was revised in 1991,
and eventually wound up in 1996.
There has been no systematic attempt to assess the impact of this policy. Other spatial initiatives
were introduced after 1994, but in a rather fragmented, inconsistent and even contradictory way.
In the absence of an overarching national spatial vision and plan, different government
departments and entities have pursued their own agendas and initiatives. Two programmes are

21
worth mentioning, both aiming to steer investment and growth towards specific areas in order
to re-balance the economic geography of the country and create attractive spaces through
economic incentives (Rogerson, 2001).
- Spatial Development Initiatives (SDIs) were introduced in 1996 at the time the industrial
decentralisation policy was dismantled. SDIs were seen as a means of stimulating growth in
regions with unrealised potential, realising this would need more than mere incentives (Todes
and Turok, 2017). SDIs sought to ‘unlock’ this potential through targeted actions to enhance
infrastructure and encourage new investment. This would require coordination across the public
sector and was consistent with the new government’s macro-economic strategy of supporting
growth led by the private sector and focused on exports. The intention was to tackle apartheid
spatial problems in ways that would enable marginal locations to become internationally
competitive. This meant attracting inward investment in manufacturing. A second objective
was to support economic empowerment through small business development, thereby
broadening economic ownership.
Eleven SDIs were designated across the country: Maputo Corridor, Phalaborwa, Platinum,
West Coast Investment Initiative, Fish River, Wild Coast, Richards Bay, Durban and
Pietermaritzburg, Lubombo and the Gauteng Special Zones. Most were in rural areas or small
towns. Each SDI was supposed to be a short, sharp institutional intervention lasting 12-18
months, then transferred to the province or local investment promotion agency. In practice,
most SDIs lasted for around three years. They were reasonably successful at developing
infrastructure. The public-private partnership approach generated extra investment that would
have been difficult otherwise. Yet the SDIs failed to deliver anything like the numbers of jobs
expected (Todes and Turok, 2017). Some locations were selected for political reasons and failed
to attract private investment. Several project proposals put to investors were simply unrealistic.
Weak institutional capacity and political conflicts in several places also hampered SDI
processes. They were sometimes treated as substitutes for government action, and they suffered
from poor coordination between departments. Their timescales were also too short to achieve
meaningful impacts on the ground in many places.
- Industrial Development Zones (IDZs) were the other national spatial programme implemented
from 2000. They were special zones linked to a seaport or airport and designed for export-
related industries. IDZs were supposed to create jobs by attracting foreign direct investment
and exporting value-added commodities through a standard package of incentives (Todes and
Turok, 2017). Three IDZs were designated during the 2000s: Coega, East London and Richards
Bay. All were publicly owned and run, in some cases with the involvement of provincial or
municipal government. IDZs were supposed to offer world-class infrastructure and utilities
linked to an international port of entry and simplified administrative procedures. However,
extra-territorial customs secured areas were not implemented, and many incentives were
identical to those available outside the zone. Therefore, the programme was very slow to take
effect and heavily criticised for its weak policy framework; poor governance arrangements; ad
hoc funding that prevented long-term planning in the IDZ; lack of special incentives or targeted
investment promotion; inadequate strategic direction, and poor coordination. Consequently, the
IDZs are currently being transformed into Special Economic Zones with enhanced support.
Both SDIs and IDZs have been criticised for their top down approach and failure to involve
local communities (Bek, et al., 2004). They illustrate the difficulties involved in rebalancing
the country’s uneven development with the need for global competitiveness. There was also a
lack of consistency and follow-through across government, resulting in a failure to generate any
kind of development momentum in most locations.

22
4.2 Consolidation of the metropolitan archipelago
Simultaneously, the need to address the deep socio-spatial divisions within the major cities
explains the creation of six metropolitan-wide authorities in 2000. Another intention was to
capitalize on the economic strengths of the large cities, at the risk of reinforcing the inherited
disparities with the countryside.
South African cities remain among the most polarised places in the world. The ideological drive
for racial separation resulted in the creation of highly segregated settlements, with many
damaging effects. Since the advent of democracy in 1994, there has been strong support for
universal human rights and progressive social policies – i.e. a kind of people-centred, pro-poor
approach. However, geographical inequalities have received less direct attention because
spatial gaps are difficult to address and a sense that territories should be treated even-handedly.
Nevertheless, amalgamating the fragmented system of racially-based local authorities has been
an important first step.
This process of organisational restructuring resulted in the establishment of single tier
metropolitan governments for each major city (eThekwini, Tshwane, Ekurhuleni, Nelson
Mandela Bay, Cape Town and Johannesburg). Their first task was to tackle the inherited
‘backlogs’ by extending the provision of basic services to the black townships. They made good
use of the accumulated reserves of the former white municipalities and additional revenues
raised from the established suburban tax base (Turok, 2014). ‘Service delivery’ became the
mantra, implying the extension of electricity, water, sanitation, roads, refuse collection and even
free housing to historically-disadvantaged communities.
The creation of the six metros with their own administrations, large territories and relatively
strong tax bases and planning tools reinforced a perception that these cities could “look after
themselves” financially and technically (Turok, 2014). Along with some lingering resentment
of historically “white” cities within the ruling party, the result was less support or active interest
from national government than one might have anticipated. Some officials recognised that the
metros ought to drive national economic growth in a more competitive global context by
reinvesting a sizeable share of national tax revenues in improved urban infrastructure, but the
prevailing view was that diverting resources to address poverty and lack of institutional capacity
in rural areas was the priority. The relationships between the metros and provincial governments
were complicated by power struggles and several metros complained that the provincial budgets
for schools and hospitals were skewed away from the cities and towards the rural areas. Hence,
the political rescaling of government after 1994 contributed to new spatial tensions within the
country.
Unequal growth across South Africa has been described as “shop window” development by C.
Bénit and P. Gervais-Lambony (2003) because of the skewed policies aimed at attracting elites,
local and foreign capital and tourism back to the main metropolitan centres. This has been
promoted through public-private partnerships and by hosting major events so as to raise
international visibility. For example, Johannesburg welcomed the Earth Summit in 2002 and
the international AIDS Conference in 2003. Durban hosted the Climate Change Conference in
2011 and Cape Town became World Design Capital in 2014. The 2010 FIFA World Cup
undoubtedly made the biggest impact because of the sheer number of visitors attracted by the
event. Hosting these events was fostered by energetic marketing campaigns: Johannesburg
brands itself a “World Class African City”, insisting on its position as the biggest financial
centre on the continent. Durban’s vision is to be Africa’s most caring and liveable city by 2030.
Cape Town’s logo shows Table Mountain and its slogan making progress possible together
refers to the city’s natural asset and its economic spinoffs. All three cities are acutely aware of
the need to position themselves in a wider global context if their economies are to prosper.

23
The consolidation of the biggest cities is fostered by the creation of transport corridors linking
Johannesburg-Pretoria, Durban and Cape Town. The liberalisation of the aviation sector in the
1990s opened the market to new competitors. Even though during the first decade the hegemony
of South African Airways was maintained, the opening of the market to low-cost airlines
changed the sector and boosted the number of airline passengers (Luke & Walters, 2013).
Internal routes focus on Johannesburg as a hub with strong links to Cape Town and Durban.
Airline operators use the term “golden triangle” to describe the connections between these
cities. Regarding the railway network, there has been a reduction in the passenger service
between the main cities, and various railway lines have been closed. The railway offer for
passengers is concentrated on the Cape Town-Johannesburg line, which benefits from Economy
and Tourist trains as well as luxury services with the Premier Class Train and Blue Train.
Johannesburg-Durban also has a reasonably frequent passenger service. The consolidation of
specific transport links and the creation of corridors at a national scale contribute to the
formation of a metropolitan archipelago. This process can be understood as the consequence of
uneven spatial development inherited from apartheid combined with polarization related to
globalisation and competitive pressures.
4.3 South African cities: from fragmented spaces towards innovation in urban planning?
South African cities have faced new challenges since 1994. The spatial mismatch between
jobs and housing inherited from apartheid has been exacerbated since the end of apartheid by
market processes and state housing programmes. The deconcentration and dispersal of middle
class groups and economic activity from the city centres has been analysed by various
researchers (Guillaume, 1997; Turok, 2001; Hindson, 2002) who identified centrifugal
dynamics leading to patterns of re-segregation. The relocation of better-off consumers in new
suburban areas promoted the displacement of retail activity, entertainment and other household-
related services. Suburban centres tend to be well connected to the road infrastructure, but
poorly linked to the main public transport networks, thereby worsening access to jobs and
services for the black majority of the population.
Municipal spatial plans have generally made the case for urban integration and densification,
but they have had insufficient influence over government infrastructure decisions or over the
private sector to achieve this (Turok, 2014). Since 1994 the government has attached particular
importance to building subsidised housing. There has been less support for upgrading squatter
settlements because they are unauthorised and working with these communities is complicated.
It seems easier and more popular to provide everyone with a formal housing unit on its own
site. Financial constraints have required limiting the cost of land, hence focussing on marginal
sites with few rival land users. Provincial governments have controlled the housing budgets,
but local authorities have to pay for the main infrastructure. Struggling to sustain a high level
of housing delivery, National Treasury offered a new Urban Settlements Development Grant
(USDG) in the late-2000s to cover the costs of land, infrastructure and household services that
municipalities were unable to afford. It is estimated that about 3 million state-subsidised houses
have been built to date, for a fifth of all citizens. In sheer quantitative terms this is a notable
achievement that has benefited people’s quality of life and dignity (Turok, 2015).
Yet, important limitations have also come to light, including a declining rate of delivery, higher
costs, inferior construction methods, and evidence of patronage, fraud and corruption in issuing
tenders and managing waiting lists for the housing (Turok, 2014). Migration has meant that the
housing backlog continues to increase, and community protests over public services have
escalated. Many people have doubted whether it is feasible to build millions more of these free
houses, especially when most families cannot afford the cost of ongoing services, property
24
maintenance and daily consumption needs. Some statistics suggest that less than one in three
RDP homeowners have a job. Housing has taken the form of physical shelter, not part of a
rounded human settlement with access to amenities, community services and jobs. The effect
has been to reproduce the extensive spatial form of the apartheid city, in contrast to the
commitment to create sustainable human settlements that was made in 2004. The housing
programme has also damaged sensitive ecosystems and been wasteful to water, energy and
other natural resources. Cities in South Africa are unusual in the world in that the average
population density increases with distance from the centre. This is a source of inefficiency and
inequity, and conditions appear to have worsened in the last two decades.
Transport policy has also experienced continuity with the past. In effect it has to compensate
for the lack of restructuring of the urban form. The public transport system is fragmented with
different modes of travel answerable to different parts of government, and no simple
arrangements for passengers. Travel subsidies favour existing bus and train operators and
neglect minibus taxis, despite them being used by most low income commuters. Commuting
times for black households have risen from an average of 88 to 102 minutes a day over the past
decade because of the peripheral location of new housing and delayed public transport reforms
(Turok, 2015). Citizens commuting to work by public transport spend 2.5 times longer in transit
than Europeans, and twice as long as Americans. The governance of public transport is
beginning to change in several cities to enable more integrated systems managed by single
transport authorities. There is a gradual process of devolution of responsibility for commuter
trains and bus services underway which should permit more sensible planning of different
services and ultimately a seamless public transport network. New bus rapid transit systems are
also being introduced in the big cities. New public investment should mean that the quality
improves and public transport becomes more than a last resort means of mobility for very poor
people. Making public transport in South African cities more viable (and reducing the high
level of government subsidies) will also require raising population densities along transport
corridors because the current sprawling settlement pattern is a source of great inefficiency.
5. Conclusion
The South African urban system is a relevant laboratory for analysing urban trajectories in
emerging economies. Several urbanization processes have comparable features to those of other
countries, such as the extensive, sprawling and fragmented growth of individual towns and
cities. Other aspects are more distinctive and reflect the country’s political history, such as the
stark patterns of urban segregation and the displaced urbanization in and around the homelands.
The opening-up of the economy, and its insertion in global markets and networks, has created
a harsher and more competitive environment for trade and investment, with problems generated
in terms of rising unemployment, poverty and inequality. The challenging context creates many
tensions and trade-offs for contemporary decision-makers, with difficult balances to be struck
between private interests and public goods, economic efficiency and social equity, higher
productivity and balanced development, and accelerated growth versus social inclusion and
cohesion.
References
Baffi S. (2014). Chemins de civilisation ? Le rail dans les politiques territoriales en Afrique du Sud.
L’Espace géographique, vol. 43, n° 4, pp. 338-355.
Bek D., Binns T. & Nel E. (2004). Catching the development train: perspectives on ‟top down” and
‟bottum up” development in post-apartheid South Africa. Progress in development studies, vol. 4, n°
1, pp. 22-46.
25
Bénit C., Gervais-Lambony P. (2003). La mondialisation comme instrument politique local dans les
métropoles sud-africaines (Johannesburg et Ekhuruleni): les ‟pauvres” face aux ‟vitrines”. Annales de
Géographie, n° 634, pp. 628–645.
Bickford-Smith, B., van Heyningen, E. and Worden, N. (1999) Cape Town in the Twentieth Century:
An Illustrated Social History. Cape Town: David Philip, 283 p.
Bhorat, H., Cassim, A. & Hirsch, A. (2014) Policy co-ordination and growth traps in a middle-income
country setting: The case of South Africa. WIDER Working Paper 2014/155, Helsinki: UNU-Wider.
Browett, J.G., Fair T.J.D. (1974). South Africa, 1870‐1970: A View of The Spatial System. South
African Geographical Journal, vol. 56, n° 2, pp. 111-120.
Coquéry-Vidrovitch C. (1993). La ville coloniale ‟lieu de colonisation” et métissage culturel. Afrique
contemporaine, numéro spécial, pp. 11-22.
Davies R.J. (1972). The urban geography of South Africa. Institute for social research, Durban:
University of Natal, 259 p.
Freund, B., Padayachee, V. (2002). (D)urban Vortex: South African City in Transition.
Pietermaritzburg: University of Natal Press, 345 p.
Giraut F., Vacchiani-Marcuzzo C. (2009). Territories and urbanization, Atlas and geo-historical
information system (DYSTURB). Paris: IRD éditions, CD Rom, 80 p.
Guillaume P. (1997). Du blanc au noir… Essai sur une nouvelle ségrégation dans le centre de
Johannesburg. L'Espace géographique, vol. 26, n° 1, pp. 21-33.
Harrison, P. & Zack, T. (2012) The power of mining: the fall of gold and rise of Johannesburg. Journal
of Contemporary African Studies, 30(4), pp.551-570.
Houssay-Holzschuch M. (1999). Le Cap ville sud-africaine, Ville blanche, vies noires. Paris:
l’Harmattan, coll. « Géographie et cultures », 276 p.
Hindson D. (2002). Fragmentation et intégration dans une ville de l'après apartheid: le cas de Durban.
In Navez-Bouchanine F. La fragmentation en question. Paris: L'Harmattan, 411 p.
Jefferson M. (1939). The Law of Primate City. Geographical Review, n° 29, pp. 226-232.
Luke R. & Walters, J. (2013). Overview of the developments in the domestic airline industry in South
Africa since market deregulation. Journal of Transport and Supply Chain Management, vol. 7, n° 1,
pp. 1-11.
Mc Kenzie R.D. (1927). The concept of dominance and world-organization. American Journal of
sociology, vol. 33, n° 1, pp. 28-42.
Moriconi-Ebrard F. (1993). L'urbanisation du monde. Paris, Anthropos, Economica, Collection Villes,
372 p.
Paulus F., & Vacchiani-Marcuzzo C. (2016). Knowledge industry and competitiveness: Economic
trajectories of French urban areas (1962-2008). In A. Cusinato, A. Philippopoulos-Mihalopoulos,
Knowledge-creating Milieus in Europe: Firm Cities, Territories. Springer, pp. 157-170.
Pumain D., Paulus F., Vacchiani-Marcuzzo. (2009). Innovation Cycles and Urban Dynamics in
D. Lane, D. Pumain, S. Van der Leeuw, G. West (eds.), Complexity perspectives on innovation and
social change, ISCOM, Springer, Methodos Series, 237-260.
Pumain D., Paulus F., Lobo J. & Vacchiani-Marcuzzo C. (2006). An evolutionary theory for
interpreting urban scaling laws. Cybergeo, n°343, http://cybergeo.revues.org/2519
Rogerson C.M. (2001). Spatial development initiatives in Southern Africa: The Maputo Development
Corridor. Tijdschrift voor Economische en Sociale Geografie, vol. 93, n° 2, pp. 324-346.
Taaffe E. J., Morrill R. L. & Gould P. R. (1963). Transport expansion in under-developed countries.
The Geographical Review, n° 53, pp. 503-529

26
Taylor, P. J. (2004). World City Network. London: Routledge. 256 p.
Todes, A. & Turok, I. (2017). Spatial Inequalities and Policies in South Africa: Place-based or People-
centred? Progress in Planning. http://dx.doi.org/10.1016/j.progress.2017.03.001
Turok I. (2001). Persistent polarization Post-apartheid? Progress towards urban integration in Cape
Town. Urban Studies, vol. 38, n° 13, pp. 2349-2377.
Turok, I. (2014) South Africa’s tortured urbanization and the complications of reconstruction. In
Martine, G. and McGranahan, G. Urban Growth in Emerging Economies: Lessons from the BRICS.
London: Routledge. 288 p.
Turok, I. (2015). South Africa’s new urban agenda: Transformation of compensation? Local Economy.
DOI: 10.1177/0269094215614259
Vacchiani-Marcuzzo C. (2016). L’Afrique du Sud est-elle un cas à part ? Analyse d’une hybridité
urbaine (Is South Africa apart ? Assessment of an urban hybridity), Habilitation à diriger des
recherches, Université Paris 1 Pantheon-Sorbonne, 2 vol.
Vacchiani-Marcuzzo, C. (2008). Quelle place pour le Cap dans la mondialisation? Stratégies spatiales
des IDE et dynamique urbaine. In Dubresson A., Jaglin S., Le Cap après l’apartheid. Gouvernance
métropolitaine et changement urbain. Paris : Karthala, 157-182. http://halshs.archives-
ouvertes.fr/halshs-00333685
Woolf S.E. & Joubert J.W. (2013). A people-centred view on paratransit in South Africa. Cities, vol.
35, pp. 284-293.