Embed Size (px)
Citation preview
THE SOUTH PACIFIC SEA LEVEL & CLIMATE MONITORING PROJECT
SEA LEVEL DATA SUMMARY REPORT
JULY 2010 - JUNE 2011
This project is sponsored by the Australian Agency for International Development (AusAID) and managed by the Australian Bureau of Meteorology
This report was prepared by: National Tidal Centre Australian Bureau of Meteorology GPO Box 421 Kent Town SA 5071 Australia Tel: (+618) 8366 2730 Fax: (+618) 8366 2651 Email: [email protected] Website: http://www.bom.gov.au/oceanography
Quality Certification: I authorise the issue of this “South Pacific Sea Level and Climate Monitoring Project: Sea Level Data Summary Report, July 2010 to June 2011” in accordance with the quality assurance procedures of the National Tidal Centre, Australian Bureau of Meteorology. William Mitchell Manager, National Tidal Centre, Australian Bureau of Meteorology Please note the following: While care has been taken in the collection, analysis, and compilation of the data, it is supplied on the condition that neither the Commonwealth of Australia nor Australian Bureau of Meteorology shall be liable for any loss or injury whatsoever arising from the use of the data. Copyright for material contained in this document is held by the Commonwealth of Australia. Individuals and organisations are advised that quality controlled six-minute or hourly data from these stations are available on request from the National Tidal Centre. Some handling fees may be charged. For commercial applications, some additional costs may be levied.
South Pacific Sea Level and Climate Monitoring Project: Sea Level Data Summary Report: Jul10–Jun11
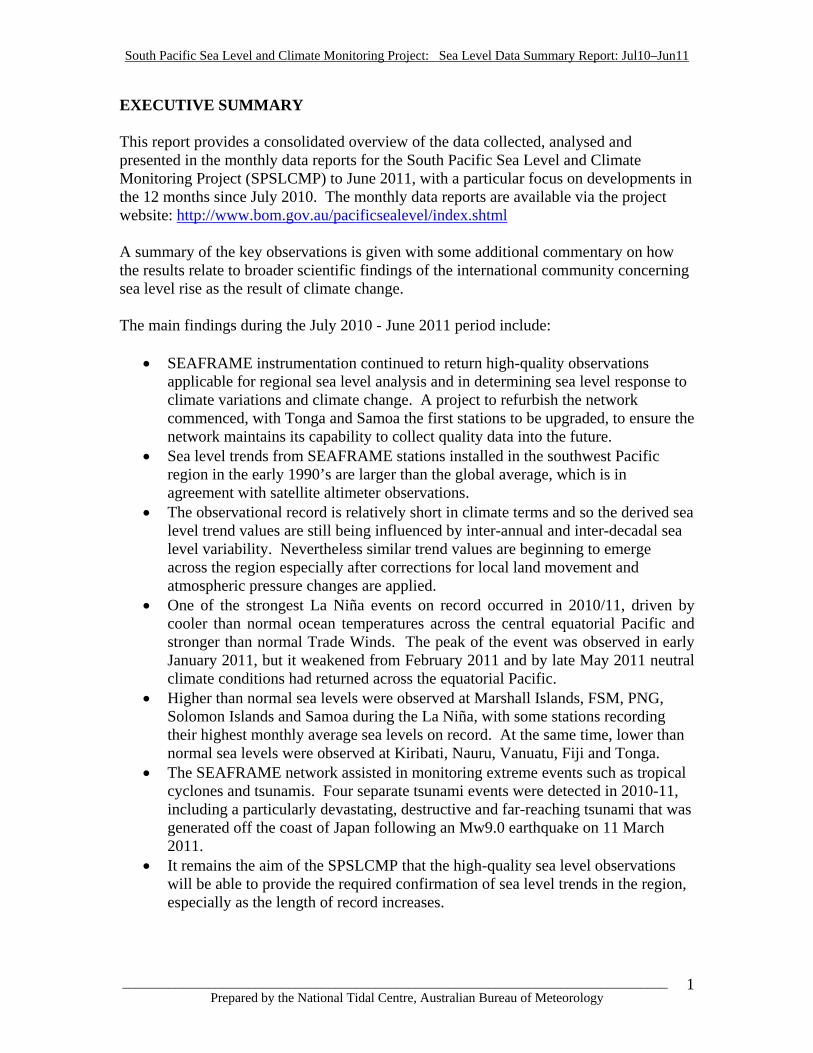
EXECUTIVE SUMMARY This report provides a consolidated overview of the data collected, analysed and presented in the monthly data reports for the South Pacific Sea Level and Climate Monitoring Project (SPSLCMP) to June 2011, with a particular focus on developments in the 12 months since July 2010. The monthly data reports are available via the project website: http://www.bom.gov.au/pacificsealevel/index.shtml A summary of the key observations is given with some additional commentary on how the results relate to broader scientific findings of the international community concerning sea level rise as the result of climate change. The main findings during the July 2010 - June 2011 period include:
• SEAFRAME instrumentation continued to return high-quality observations applicable for regional sea level analysis and in determining sea level response to climate variations and climate change. A project to refurbish the network commenced, with Tonga and Samoa the first stations to be upgraded, to ensure the network maintains its capability to collect quality data into the future.
• Sea level trends from SEAFRAME stations installed in the southwest Pacific region in the early 1990’s are larger than the global average, which is in agreement with satellite altimeter observations.
• The observational record is relatively short in climate terms and so the derived sea level trend values are still being influenced by inter-annual and inter-decadal sea level variability. Nevertheless similar trend values are beginning to emerge across the region especially after corrections for local land movement and atmospheric pressure changes are applied.
• One of the strongest La Niña events on record occurred in 2010/11, driven by cooler than normal ocean temperatures across the central equatorial Pacific and stronger than normal Trade Winds. The peak of the event was observed in early January 2011, but it weakened from February 2011 and by late May 2011 neutral climate conditions had returned across the equatorial Pacific.
• Higher than normal sea levels were observed at Marshall Islands, FSM, PNG, Solomon Islands and Samoa during the La Niña, with some stations recording their highest monthly average sea levels on record. At the same time, lower than normal sea levels were observed at Kiribati, Nauru, Vanuatu, Fiji and Tonga.
• The SEAFRAME network assisted in monitoring extreme events such as tropical cyclones and tsunamis. Four separate tsunami events were detected in 2010-11, including a particularly devastating, destructive and far-reaching tsunami that was generated off the coast of Japan following an Mw9.0 earthquake on 11 March 2011.
• It remains the aim of the SPSLCMP that the high-quality sea level observations will be able to provide the required confirmation of sea level trends in the region, especially as the length of record increases.
__________________________________________________________________________________ Prepared by the National Tidal Centre, Australian Bureau of Meteorology
1

South Pacific Sea Level and Climate Monitoring Project: Sea Level Data Summary Report: Jul10–Jun11
Sea level monitoring station at Kiribati
__________________________________________________________________________________ Prepared by the National Tidal Centre, Australian Bureau of Meteorology
2
South Pacific Sea Level and Climate Monitoring Project: Sea Level Data Summary Report: Jul10–Jun11
CONTENTS
1. BACKGROUND ............................................................................................................ 4
2. SEA LEVEL MONITORING NETWORK.................................................................... 4
3. CLIMATIC AND OCEANOGRAPHIC CONDITIONS............................................... 7
3.1. Extreme Events ........................................................................................................ 7 3.1.1. Tsunamis ........................................................................................................... 7 3.1.2. Tropical Cyclones ............................................................................................. 9
3.2. El Niño – Southern Oscillation (ENSO) ................................................................ 11 3.2.1. ENSO conditions July 2010 – June 2011 ...................................................... 13
3.3. Pacific Decadal Oscillation................................................................................... 17
3.4. Sea Level Rise due to Climate Change.................................................................. 18
4. SEAFRAME DATA ANALYSIS ................................................................................ 20
4.1. Monthly mean sea levels........................................................................................ 20
4.2. Anomalies .............................................................................................................. 20 4.2.1. Sea level anomalies......................................................................................... 20 4.2.2. Barometric pressure anomalies ....................................................................... 21 4.2.3. Water temperature anomalies ......................................................................... 21 4.2.4. Air temperature anomalies.............................................................................. 21
4.3. Sea Level Trends.................................................................................................... 27 4.3.1. Relative sea level trends.................................................................................. 27 4.3.3. Inverted barometric pressure effect ................................................................ 30 4.3.4. Combined net rate of relative sea level trends ................................................ 31 4.3.5. Comparison with satellite altimetry derived sea level trends ......................... 34
5. SEAFRAME INSTRUMENT PERFORMANCE........................................................ 35
6. COMMUNICATION OF RESULTS ........................................................................... 36
7. FURTHER INFORMATION ...................................................................................... 37
__________________________________________________________________________________ Prepared by the National Tidal Centre, Australian Bureau of Meteorology
3
South Pacific Sea Level and Climate Monitoring Project: Sea Level Data Summary Report: Jul10–Jun11
1. BACKGROUND The South Pacific Sea Level and Climate Monitoring Project (SPSLCMP) developed as an Australian response to concerns voiced by Pacific Island countries about the potential impacts of human-induced global warming (the “greenhouse effect”) on climate and sea levels in the South Pacific. The project is sponsored by the Australian Agency for International Development (AusAID) and has been implemented over a number of multi-year phases. The first two phases of the project (from July 1991 to December 2000) established sea level/meteorological monitoring stations at eleven sites, one each in Cook Islands, Fiji, Kiribati, Marshall Islands, Nauru, Papua New Guinea, Solomon Islands, Tonga, Tuvalu, Vanuatu, and Samoa. Another station was established in December 2001 in the Federated States of Micronesia during the project’s third phase (January 2001 to December 2006). The third phase also involved installation of continuous global positioning systems (CGPS) at many of these locations in order to monitor vertical movements of the islands upon which the sea level monitoring stations are based.
The SPSLCMP has, as its principal objective: “The provision of an accurate long term record of sea level in the South Pacific for partner countries and the international scientific community, that enables them to respond to and manage related impacts”
The project has moved into its fourth phase and is now managed by the Australian Bureau of Meteorology. The Bureau’s National Tidal Centre (NTC) is responsible for maintaining the SPSLCMP sea level monitoring network and data analysis activities as part of its operations. The monthly sea level reports and this consolidated data report are accordingly prepared by the NTC. More information on the NTC and its functions can be found at http://www.bom.gov.au/oceanography More information on the overall project can be found at http://www.bom.gov.au/pacificsealevel/index.shtml 2. SEA LEVEL MONITORING NETWORK The project’s sea level and climate monitoring network consists of 12 stations providing a wide coverage across the Southwest Pacific basin (Figure 1 and Table 1). The so-called SEAFRAME (an acronym of SEA Level Fine Resolution Acoustic Measuring Equipment) stations not only measure sea level by two independent means, but also observe a number of “ancillary” variables - atmospheric pressure, air and water temperatures, wind speed and direction.
__________________________________________________________________________________ Prepared by the National Tidal Centre, Australian Bureau of Meteorology
4

South Pacific Sea Level and Climate Monitoring Project: Sea Level Data Summary Report: Jul10–Jun11
110˚
110˚
120˚
120˚
130˚
130˚
140˚
140˚
150˚
150˚
160˚
160˚
170˚
170˚
180˚
180˚
190˚
190˚
200˚
200˚
210˚
210˚
-50˚ -50˚
-40˚ -40˚
-30˚ -30˚
-20˚ -20˚
-10˚ -10˚
0˚ 0˚
10˚ 10˚
20˚ 20˚
PNG
VanuatuFiji
Cook IslandsTongaTonga
Marshall Islands
KiribatiNauru
Tuvalu
Samoa
Solomon Islands
FSMFSMFSM
SPSLCMP SEAFRAME STATION
Figure 1. South Pacific Sea Level and Climate Monitoring Project sites (top) where sea level and climate monitoring stations (bottom) are installed.
__________________________________________________________________________________ Prepared by the National Tidal Centre, Australian Bureau of Meteorology
5

South Pacific Sea Level and Climate Monitoring Project: Sea Level Data Summary Report: Jul10–Jun11
The SEAFRAME observations contribute to the research and analysis efforts of the Centre for Australian Weather and Climate Research (CAWCR) and the Bureau’s National Climate Centre to investigate and monitor regional climatic and oceanographic conditions. Sea level research is also performed through cooperation between CSIRO's Wealth from Oceans National Research Flagship and the Antarctic Climate and Ecosystems Cooperative Research Centre (ACE CRC) and presented at http://www.cmar.csiro.au/sealevel/index.html. Real time and operational users of the data include local port operators and Pacific Island Country meteorological services as well as international tsunami warning agencies involved with the Pacific Tsunami Warning System (PTWS). Sea level data is submitted to international sea level archives such as the University of Hawaii Sea Level Centre and the Permanent Service for Mean Sea Level. The SEAFRAME stations also contribute to the Global Sea Level Observing System (GLOSS) under the auspices of the World Meteorological Organisation (WMO) and Intergovernmental Oceanographic Commission (IOC).
Country Location Date of Installation Fiji Lautoka 23/10/92
Kiribati Tarawa 02/12/92 Vanuatu Port Vila 15/01/93 Tonga Nuku’Alofa 21/01/93
Cook Is. Rarotonga 19/02/93 Samoa Apia 26/02/93 Tuvalu Funafuti 02/03/93
Marshall Is. Majuro 07/05/93 Nauru Nauru 07/07/93
Solomon Is. Honiara 28/07/94 PNG Lombrum, Manus Island 28/09/94 FSM Pohnpei 17/12/01 Niue No gauge at present Palau No gauge at present
Table 1. Locations and installation dates for the project sea level monitoring array.
An associated program of precise levelling of the sea level sensors to land-based benchmarks is undertaken by Geoscience Australia in order to monitor any vertical shifts of the equipment relative to the local land. Geoscience Australia is also operating Continuous Global Positioning System (CGPS) stations for the project to monitor vertical land movements with respect to the International Terrestrial Reference Frame. Further information about these geodetic support programs can be found on the Geoscience Australia website at http://www.ga.gov.au/geodesy/slm/spslcmp/.
__________________________________________________________________________________ Prepared by the National Tidal Centre, Australian Bureau of Meteorology
6

South Pacific Sea Level and Climate Monitoring Project: Sea Level Data Summary Report: Jul10–Jun11
3. CLIMATIC AND OCEANOGRAPHIC CONDITIONS The combination of a number of climatic and oceanographic conditions can affect sea levels across the region. These are described below, including a summary of the present conditions. Supporting information is sourced from the National Climate Centre of the Australian Bureau of Meteorology, the Intergovernmental Panel on Climate Change (IPCC), the UK Met Office, the University of Washington and the University of Colorado.
3.1. Extreme Events Extreme events such as tsunamis (small to potentially large waves caused by seismic disturbances) and cyclones (through associated storm surges) can affect sea levels on short time-scales. The SEAFRAME stations allow tsunamis to be detected and storm surges monitored in real time, and have the capability to report sea levels at one-minute intervals. 3.1.1. Tsunamis The SEAFRAME network detected the following four tsunami events during 2010-11. Vanuatu 10 August 2010 (Mw7.3) A magnitude Mw7.3 earthquake struck some 35 km WNW of Port Vila, Vanuatu at 05:24 UTC on 10 August 2010. It produced a tsunami which measured 0.6m from trough to crest at the SEAFRAME sea level station at Port Vila.
__________________________________________________________________________________ Prepared by the National Tidal Centre, Australian Bureau of Meteorology
7

South Pacific Sea Level and Climate Monitoring Project: Sea Level Data Summary Report: Jul10–Jun11
Vanuatu 25 December 2010 (Mw7.3) A magnitude Mw7.3 earthquake struck at 13:16 UTC on 25 December 2010 around 230km south of Port Vila, Vanuatu. The tsunami that followed measured 0.3m from trough to crest at the SEAFRAME sea level station at Port Vila. Vanuatu 9 January 2011 (Mw6.6) A magnitude Mw6.6 earthquake struck at 10:04 UTC on 9 January 2011 about 160km south of Port Vila, Vanuatu. A small tsunami was generated which measured less than 0.1m from trough to crest at the SEAFRAME sea level station at Port Vila. Japan 11 March 2011 (Mw9.0) On 11 March 2011 at 05:46 UTC a very large earthquake of magnitude Mw9.0 struck off the east coast of Japan. The large tsunami which followed inundated the Japanese coastline and caused severe destruction and loss of life. The tsunami propagated across the entire Pacific Ocean and was recorded by the SEAFRAME stations at FSM (0.7m from trough to crest), Marshall Islands (0.9m), PNG (2.3m), Nauru (0.4m), Kiribati (0.5m), Solomon Islands (0.5m), Tuvalu (0.5m), Vanuatu (1.7m), Fiji (0.6m), Tonga (1.1m) and Cook Islands (0.3m). The SEAFRAME station at Samoa was not operational at the time.
__________________________________________________________________________________ Prepared by the National Tidal Centre, Australian Bureau of Meteorology
8
South Pacific Sea Level and Climate Monitoring Project: Sea Level Data Summary Report: Jul10–Jun11
3.1.2. Tropical Cyclones Eight tropical cyclones (TC) developed in the southwest Pacific region east of 160˚E during the 2010-11 season, namely Tropical Cyclone Vania, Tropical Cyclone Zelia, Tropical Cyclone Wilma, Tropical Cyclone Anthony, Tropical Cyclone Yasi, Tropical Cyclone Zaka, Tropical Cyclone Atu and Tropical Cyclone Bune (Figure 2). Tropical Cyclone Vania started as a tropical depression on 9 January 2011 before it intensified into a Category 3 cyclone. It brought heavy rains and flooding to Fiji and damaged buildings and communication with the Tafea Province of Vanuatu. Tropical Cyclone Zelia entered into the southwest Pacific cyclone region as a category 3 cyclone on 16 January 2011 but began to weaken thereafter and did not affect any of the Pacific Island Countries. Tropical Cyclone Wilma on the other hand developed to the northeast of Fiji and strengthened into a severe tropical cyclone that blew over Tonga causing major damage to the Ha’apai Islands of Tonga. The SEAFRAME station at Nuku’alofa recorded a small storm surge of 0.2m. Tropical Cyclone Anthony moved into the South Pacific region on 24 January 2011 but quickly weakened and did not cause any damage. Tropical Cyclone Yasi formed to the northeast of Vanuatu on 30 January 2011 and reportedly affected the Solomon Islands and Vanuatu before it moved out of the region, intensified and struck Queensland. Tropical Cyclone Zaka formed on 7 February 2011 but moved south towards New Zealand and had little impact on the Pacific Island Countries. Tropical Cyclone Atu passed within 150km of Vanuatu. The SEAFRAME at Port Vila recorded a considerable dip in barometric pressure on 20 February 2011 but sea levels only rose 10cm above the predicted astronomical tide. Tropical Cyclone Bune had its origins near Tonga on 22 March 2011 but had little impact, drifting south and dissipating by 29 March 2011.
__________________________________________________________________________________ Prepared by the National Tidal Centre, Australian Bureau of Meteorology
9

South Pacific Sea Level and Climate Monitoring Project: Sea Level Data Summary Report: Jul10–Jun11
Figure 2. Tropical cyclone tracks in the southwest Pacific during the 2010-11 tropical cyclone season. (Figure courtesy of the UK met office)
__________________________________________________________________________________ Prepared by the National Tidal Centre, Australian Bureau of Meteorology
10

South Pacific Sea Level and Climate Monitoring Project: Sea Level Data Summary Report: Jul10–Jun11
3.2. El Niño – Southern Oscillation (ENSO) The El Niño – Southern Oscillation (ENSO) refers to the periodic change in atmospheric and oceanic patterns in the tropical Pacific Ocean. The warm phase of the ENSO cycle is often simply referred to as El Niño, whilst the cool phase is termed La Niña. ENSO events have a return period of between four to seven years and typically last for around 12 to 18 months. They are a natural part of the climate system and have been affecting the Pacific Basin for thousands of years. During neutral (i.e., neither El Niño nor La Nina phases) conditions (middle panel of Figure 3), the easterly trade winds blow across the tropical Pacific. These winds pile up warm surface water in the west Pacific, so that the sea surface is about 50 cm higher at Indonesia than at Ecuador. The sea surface temperature is about 8°C higher in the west, with cool temperatures off South America, due to an upwelling of cold water from deeper levels. This cold water is nutrient-rich, supporting high levels of primary productivity, diverse marine ecosystems, and major fisheries. Rainfall is found in rising air over the warmer western waters and the east Pacific is relatively dry. During El Niño events (top panel of Figure 3), the trade winds relax in the central and western Pacific. This reduction in the winds causes a reduction in the upwelling along the equator, leading to a depression of the ocean thermocline. This can lead to a “pulse” (called a Kelvin Wave) which in turn depresses the thermocline right across to the eastern Pacific. If the warmer sub surface water migrates to the surface and triggers deep atmospheric convection in areas to the east of their normal location, this can further reduce the trade winds and the cycle is reinforced. The result is a rise in sea surface temperature and a drastic decline in primary productivity, the latter of which adversely affects higher trophic levels of the food chain, including commercial fisheries in this region. Impacts of this shift eastwards in the circulation over the tropical Pacific may include increased cyclone activity in the central Pacific, flooding in Peru or drought in Indonesia and Australia. Large-scale teleconnections may also force changes to the climate of regions far removed from the tropical Pacific. The opposite phase of El Niño is called La Niña (bottom panel of Figure 3). La Niña is characterised by unusually cold ocean temperatures in the equatorial Pacific, as compared to El Niño, which is characterised by unusually warm ocean temperatures in the equatorial Pacific. Global climate anomalies associated with La Niña tend to be opposite those of El Niño.
__________________________________________________________________________________ Prepared by the National Tidal Centre, Australian Bureau of Meteorology
11

South Pacific Sea Level and Climate Monitoring Project: Sea Level Data Summary Report: Jul10–Jun11
Figure 3. Schematic of atmospheric and ocean conditions associated with El Niño and La Nina.
__________________________________________________________________________________ Prepared by the National Tidal Centre, Australian Bureau of Meteorology
12
South Pacific Sea Level and Climate Monitoring Project: Sea Level Data Summary Report: Jul10–Jun11
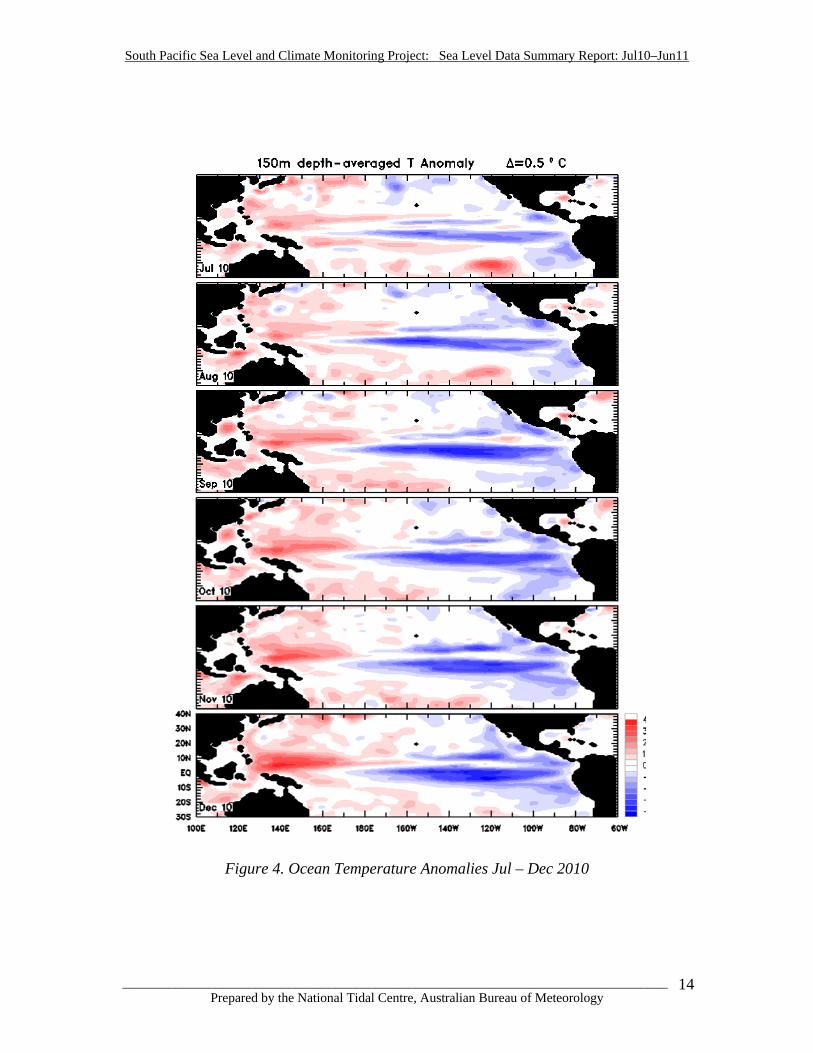
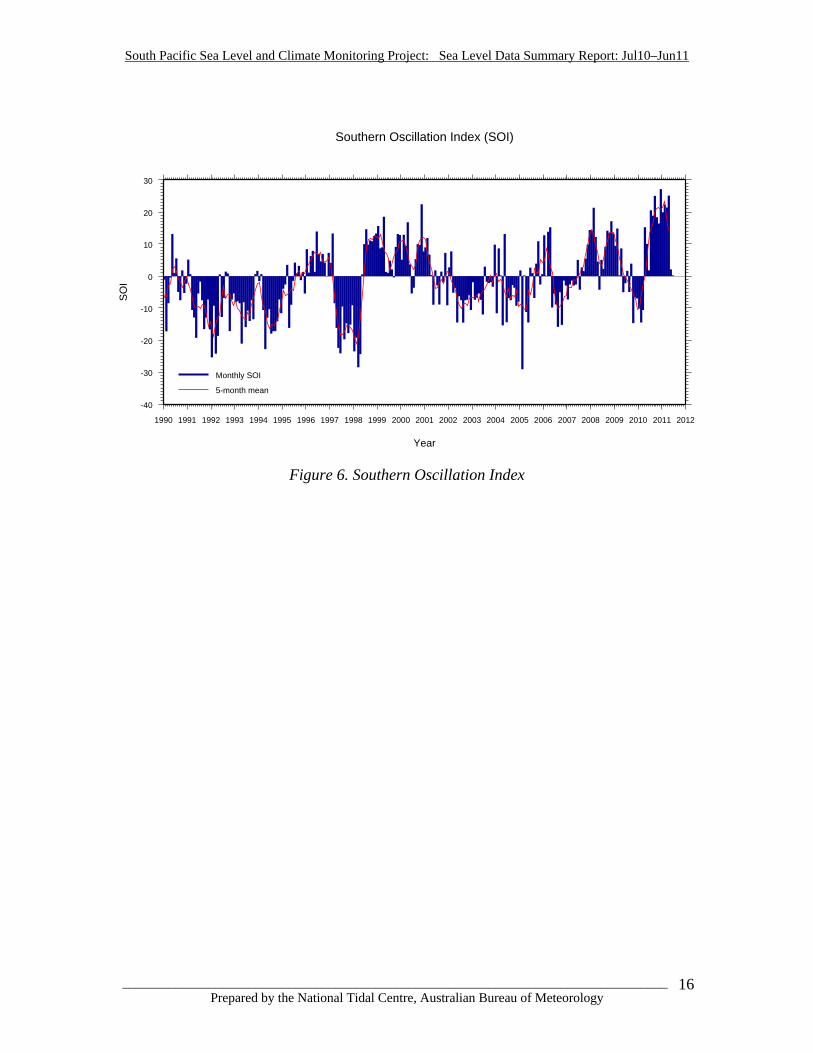
3.2.1. ENSO conditions July 2010 – June 2011 One of the strongest La Niña events on record occurred during 2010–11, as indicated by sustained positive values of the Southern Oscillation Index (Figure 6). Climate conditions across the central equatorial Pacific during the La Niña included cooler than average ocean heat content, stronger than normal Trade Winds and below average cloudiness in the vicinity of the dateline. In contrast, ocean heat content in the western equatorial Pacific and along the South Pacific Convergence Zone was higher than normal during the La Niña, which is typically accompanied by higher than normal sea level. Figure 4 and Figure 5 shows a sequence of monthly heat content across the tropical Pacific over the course of 2010-11. Signs of an emerging La Niña were already evident in June 2010 as a result of ongoing cooling of ocean temperatures across the equatorial Pacific from earlier in the year. The early stages of a La Niña event was recognised in July 2010, and conditions continued to strengthen and reached a peak in early January 2011. The La Niña began to decay in February 2011 as Pacific Ocean temperatures, especially below the surface, began to warm. Atmospheric indicators, such as high values of the Southern Oscillation Index and stronger than normal Trade Winds, remained consistent with a well developed La Niña through March and April but eventually responded to the changes in the ocean. The La Niña reached its end in late May as climate conditions across the equatorial Pacific returned to neutral. Neutral climate conditions continued to be observed at the end of June 2011 and were expected to persist through into the southern hemisphere spring. For further information see: http://www.bom.gov.au/climate
__________________________________________________________________________________ Prepared by the National Tidal Centre, Australian Bureau of Meteorology
13
South Pacific Sea Level and Climate Monitoring Project: Sea Level Data Summary Report: Jul10–Jun11
Figure 4. Ocean Temperature Anomalies Jul – Dec 2010
__________________________________________________________________________________ Prepared by the National Tidal Centre, Australian Bureau of Meteorology
14

South Pacific Sea Level and Climate Monitoring Project: Sea Level Data Summary Report: Jul10–Jun11
Figure 5. Ocean Temperature Anomalies Jan – Jun 2011
__________________________________________________________________________________ Prepared by the National Tidal Centre, Australian Bureau of Meteorology
15
South Pacific Sea Level and Climate Monitoring Project: Sea Level Data Summary Report: Jul10–Jun11
-40
-30
-20
-10
0
10
20
30
SO
I
1990 1991 1992 1993 1994 1995 1996 1997 1998 1999 2000 2001 2002 2003 2004 2005 2006 2007 2008 2009 2010 2011 2012
Year
Southern Oscillation Index (SOI)
5-month mean
Monthly SOI
Figure 6. Southern Oscillation Index
__________________________________________________________________________________ Prepared by the National Tidal Centre, Australian Bureau of Meteorology
16

South Pacific Sea Level and Climate Monitoring Project: Sea Level Data Summary Report: Jul10–Jun11
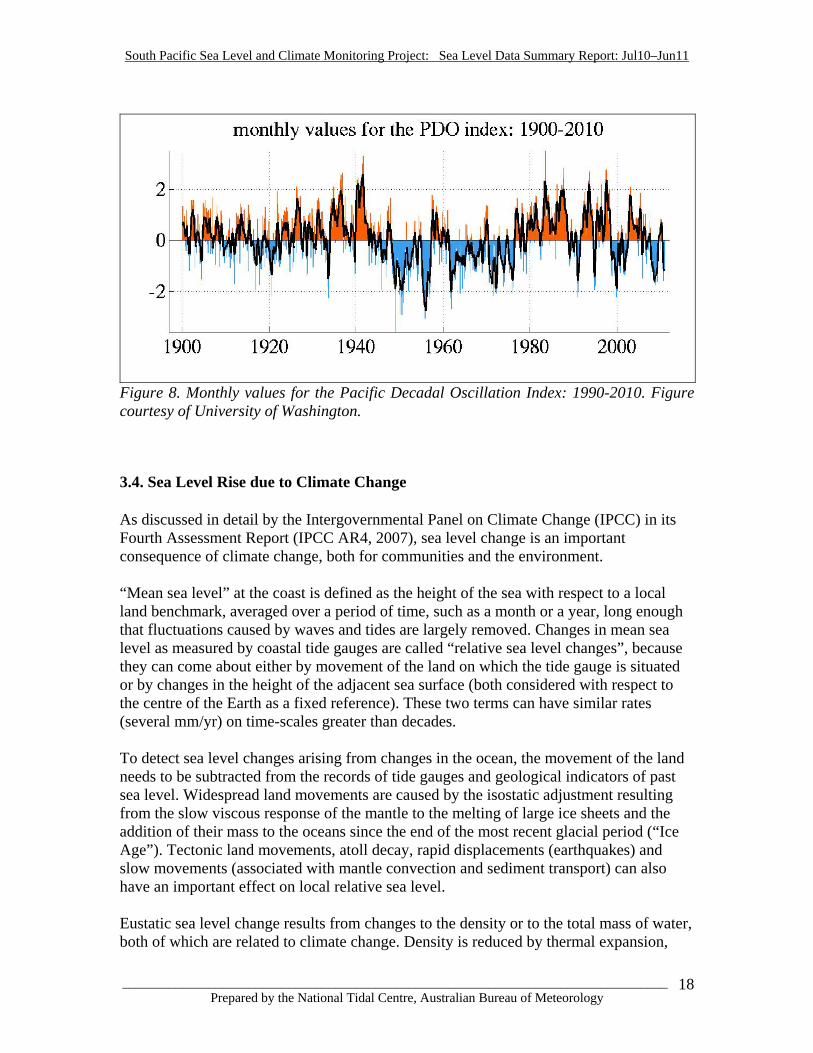
3.3. Pacific Decadal Oscillation Decadal fluctuations are found in a number of different records such as ocean temperature, rainfall, fish populations and sea level. One such fluctuation that has attracted recent attention from scientists is the so-called Pacific Decadal Oscillation (PDO). The PDO is proposed to be a fluctuation of the Pacific Ocean that has similarities to El Niño, but operates over a much longer time period of 20 – 30 years. The positive phase of the PDO is typified by warmer than normal ocean temperature and hence higher than normal sea surface in the eastern equatorial Pacific while a horseshoe pattern of cooler than normal ocean temperature and lower than normal sea surface connects the north, west and south Pacific. During the negative phase, the situation is reversed as outlined in Figure 7.
Figure 7. Schematic of sea surface temperature (°C) and wind stress anomalies during positive and negative phases of the Pacific Decadal Oscillation. Figure courtesy of University of Washington. In order to track the PDO over time scientists have used temperature data to construct a PDO Index, which is shown plotted in Figure 8. The SEAFRAME stations were installed in the early 1990’s and have collected sea levels while the PDO has predominantly been in a positive phase. Over the same period of time satellite altimeters have been collecting data and show evidence of a decadal sea level oscillation in support of the PDO. For instance, Figure 17 shows that from 1992-2011 sea levels rose in the southwest Pacific while they actually fell in some areas of the northeast Pacific.
__________________________________________________________________________________ Prepared by the National Tidal Centre, Australian Bureau of Meteorology
17
South Pacific Sea Level and Climate Monitoring Project: Sea Level Data Summary Report: Jul10–Jun11
Figure 8. Monthly values for the Pacific Decadal Oscillation Index: 1990-2010. Figure courtesy of University of Washington.
3.4. Sea Level Rise due to Climate Change As discussed in detail by the Intergovernmental Panel on Climate Change (IPCC) in its Fourth Assessment Report (IPCC AR4, 2007), sea level change is an important consequence of climate change, both for communities and the environment. “Mean sea level” at the coast is defined as the height of the sea with respect to a local land benchmark, averaged over a period of time, such as a month or a year, long enough that fluctuations caused by waves and tides are largely removed. Changes in mean sea level as measured by coastal tide gauges are called “relative sea level changes”, because they can come about either by movement of the land on which the tide gauge is situated or by changes in the height of the adjacent sea surface (both considered with respect to the centre of the Earth as a fixed reference). These two terms can have similar rates (several mm/yr) on time-scales greater than decades. To detect sea level changes arising from changes in the ocean, the movement of the land needs to be subtracted from the records of tide gauges and geological indicators of past sea level. Widespread land movements are caused by the isostatic adjustment resulting from the slow viscous response of the mantle to the melting of large ice sheets and the addition of their mass to the oceans since the end of the most recent glacial period (“Ice Age”). Tectonic land movements, atoll decay, rapid displacements (earthquakes) and slow movements (associated with mantle convection and sediment transport) can also have an important effect on local relative sea level. Eustatic sea level change results from changes to the density or to the total mass of water, both of which are related to climate change. Density is reduced by thermal expansion,
__________________________________________________________________________________ Prepared by the National Tidal Centre, Australian Bureau of Meteorology
18
South Pacific Sea Level and Climate Monitoring Project: Sea Level Data Summary Report: Jul10–Jun11
which occurs as the ocean warms. The total mass of oceanic water can change through transfers from glaciers, ice caps and the Greenland and Antarctic Ice Sheets. The IPCC AR4, 2007 estimates that global average eustatic sea level rise over the last century was 1.7 ± 0.5 mm/yr. From 1961 to 2003, the average rate of sea level rise is estimated as 1.8 ± 0.5 mm/yr. IPCC AR4, 2007 also recognises that sea level records contain a considerable amount of inter-annual and decadal variability. Projections of future sea level rise, according to an assessment of global coupled ocean-atmosphere climate computer models in IPCC AR4, 2007, ranges from 0.18 to 0.59 m at 2090-2099 relative to 1980-1999. These projections include contributions from thermal expansion and land ice contribution. Thermal expansion is expected to continue well after climate stabilises because of the large heat capacity of the ocean. Although simulations of recent sea level rise (as detected by satellite altimeters for example) are in reasonable agreement with observations, longer-term sea level rise has not been satisfactorily modelled. This implies a deficiency in the current understanding, which is partly related to the poor global coverage of high quality historical tide gauge records and the uncertainty in the corrections for land motions. The high-accuracy sea level stations, in conjunction with the CGPS stations to monitor land motion, installed for the SPSLCMP will help address these issues in future. Sea level change is not expected to be geographically uniform, so information about its distribution is needed to inform assessments of the impacts on coastal regions. The regional pattern depends on ocean surface fluxes, interior conditions and ocean circulation. The most serious impacts are caused not only by changes in mean sea level but by changes to extreme sea levels, especially storm surges and exceptionally high waves, which are forced by meteorological conditions. Climate-related changes in these phenomena therefore also have to be considered. Further information regarding sea level rise is available from the following agencies CSIRO: http://www.cmar.csiro.au/sealevel/index.html IPCC: http://www.ipcc.ch/ For a discussion of the sea level trends being observed in the SPSLCMP, see section 4.3.
__________________________________________________________________________________ Prepared by the National Tidal Centre, Australian Bureau of Meteorology
19
South Pacific Sea Level and Climate Monitoring Project: Sea Level Data Summary Report: Jul10–Jun11
4. SEAFRAME DATA ANALYSIS
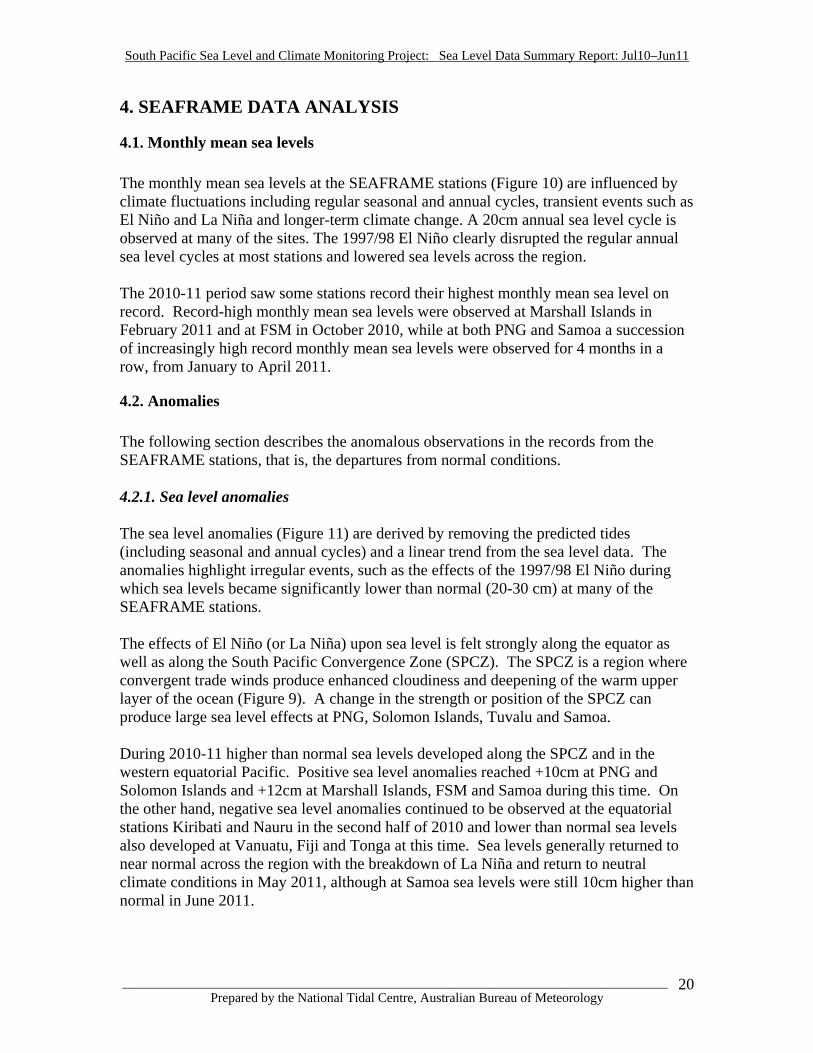
4.1. Monthly mean sea levels The monthly mean sea levels at the SEAFRAME stations (Figure 10) are influenced by climate fluctuations including regular seasonal and annual cycles, transient events such as El Niño and La Niña and longer-term climate change. A 20cm annual sea level cycle is observed at many of the sites. The 1997/98 El Niño clearly disrupted the regular annual sea level cycles at most stations and lowered sea levels across the region. The 2010-11 period saw some stations record their highest monthly mean sea level on record. Record-high monthly mean sea levels were observed at Marshall Islands in February 2011 and at FSM in October 2010, while at both PNG and Samoa a succession of increasingly high record monthly mean sea levels were observed for 4 months in a row, from January to April 2011.
4.2. Anomalies The following section describes the anomalous observations in the records from the SEAFRAME stations, that is, the departures from normal conditions. 4.2.1. Sea level anomalies The sea level anomalies (Figure 11) are derived by removing the predicted tides (including seasonal and annual cycles) and a linear trend from the sea level data. The anomalies highlight irregular events, such as the effects of the 1997/98 El Niño during which sea levels became significantly lower than normal (20-30 cm) at many of the SEAFRAME stations. The effects of El Niño (or La Niña) upon sea level is felt strongly along the equator as well as along the South Pacific Convergence Zone (SPCZ). The SPCZ is a region where convergent trade winds produce enhanced cloudiness and deepening of the warm upper layer of the ocean (Figure 9). A change in the strength or position of the SPCZ can produce large sea level effects at PNG, Solomon Islands, Tuvalu and Samoa. During 2010-11 higher than normal sea levels developed along the SPCZ and in the western equatorial Pacific. Positive sea level anomalies reached +10cm at PNG and Solomon Islands and +12cm at Marshall Islands, FSM and Samoa during this time. On the other hand, negative sea level anomalies continued to be observed at the equatorial stations Kiribati and Nauru in the second half of 2010 and lower than normal sea levels also developed at Vanuatu, Fiji and Tonga at this time. Sea levels generally returned to near normal across the region with the breakdown of La Niña and return to neutral climate conditions in May 2011, although at Samoa sea levels were still 10cm higher than normal in June 2011.
__________________________________________________________________________________ Prepared by the National Tidal Centre, Australian Bureau of Meteorology
20
South Pacific Sea Level and Climate Monitoring Project: Sea Level Data Summary Report: Jul10–Jun11
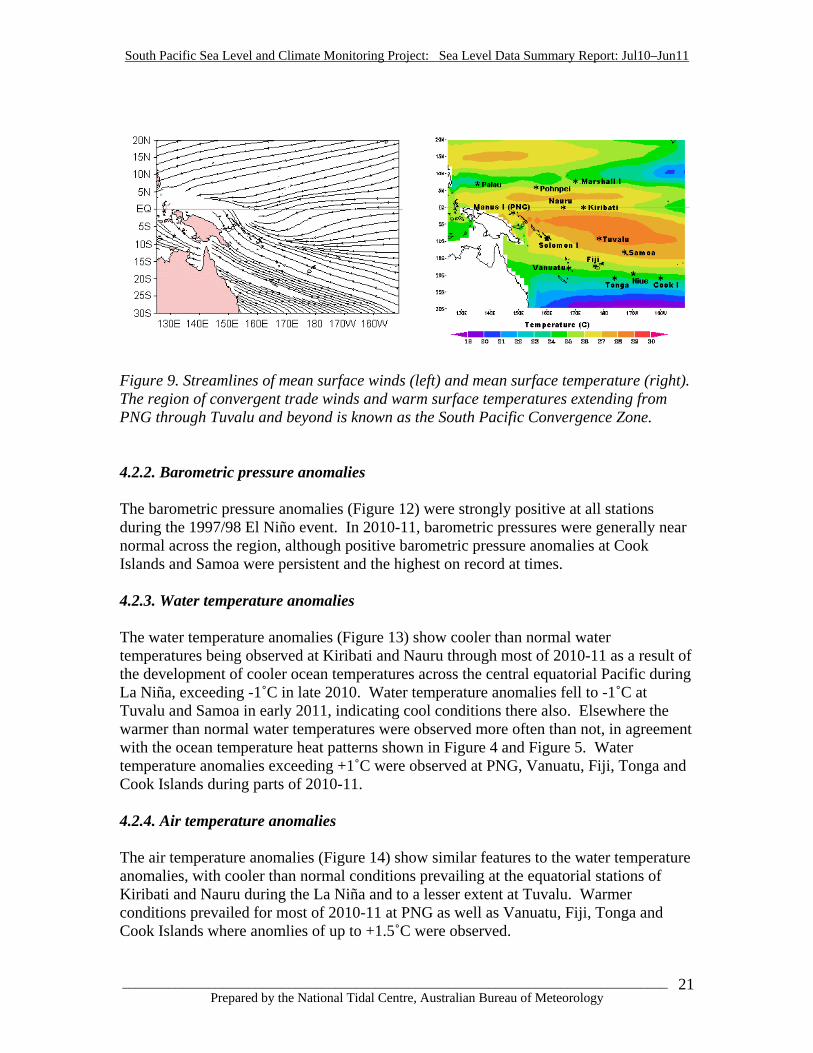
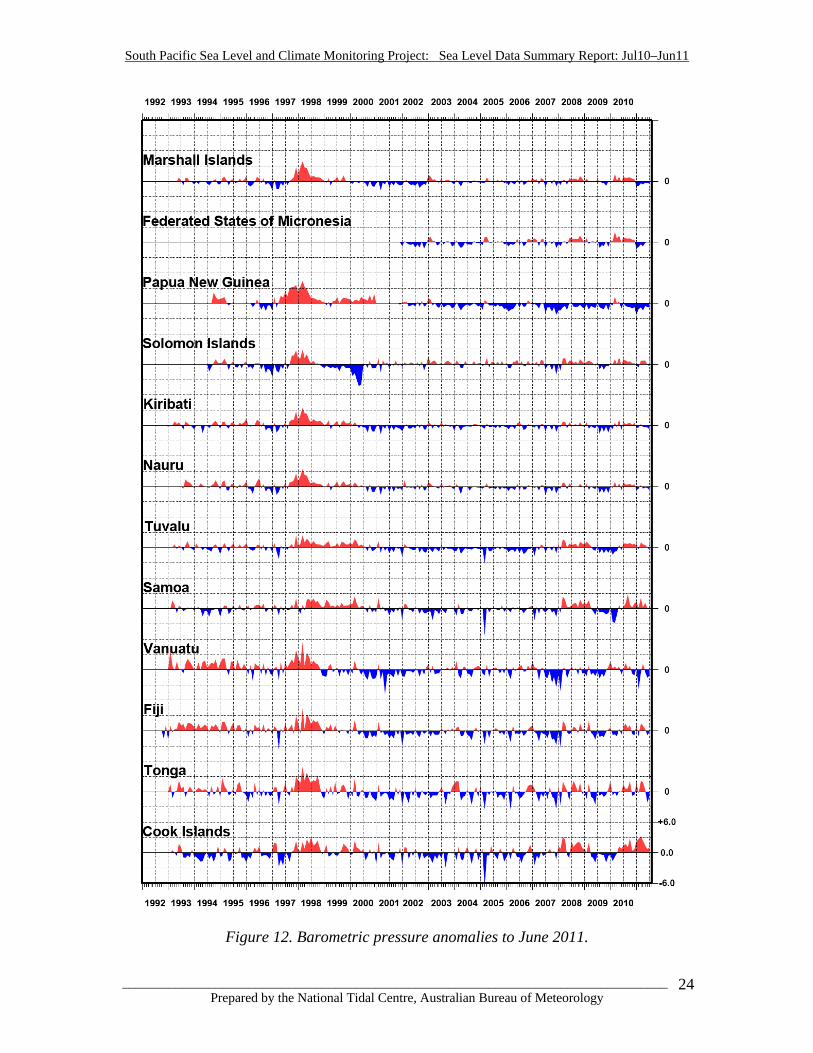
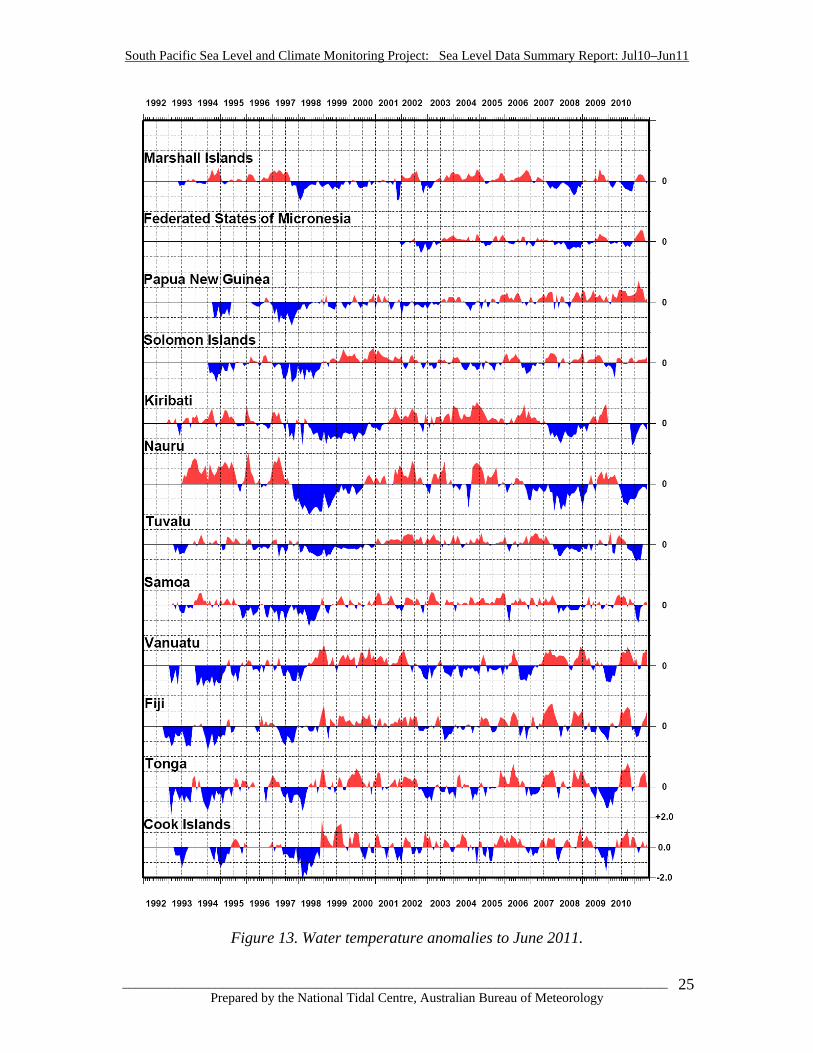
Figure 9. Streamlines of mean surface winds (left) and mean surface temperature (right). The region of convergent trade winds and warm surface temperatures extending from PNG through Tuvalu and beyond is known as the South Pacific Convergence Zone. 4.2.2. Barometric pressure anomalies The barometric pressure anomalies (Figure 12) were strongly positive at all stations during the 1997/98 El Niño event. In 2010-11, barometric pressures were generally near normal across the region, although positive barometric pressure anomalies at Cook Islands and Samoa were persistent and the highest on record at times. 4.2.3. Water temperature anomalies The water temperature anomalies (Figure 13) show cooler than normal water temperatures being observed at Kiribati and Nauru through most of 2010-11 as a result of the development of cooler ocean temperatures across the central equatorial Pacific during La Niña, exceeding -1˚C in late 2010. Water temperature anomalies fell to -1˚C at Tuvalu and Samoa in early 2011, indicating cool conditions there also. Elsewhere the warmer than normal water temperatures were observed more often than not, in agreement with the ocean temperature heat patterns shown in Figure 4 and Figure 5. Water temperature anomalies exceeding +1˚C were observed at PNG, Vanuatu, Fiji, Tonga and Cook Islands during parts of 2010-11. 4.2.4. Air temperature anomalies The air temperature anomalies (Figure 14) show similar features to the water temperature anomalies, with cooler than normal conditions prevailing at the equatorial stations of Kiribati and Nauru during the La Niña and to a lesser extent at Tuvalu. Warmer conditions prevailed for most of 2010-11 at PNG as well as Vanuatu, Fiji, Tonga and Cook Islands where anomlies of up to +1.5˚C were observed.
__________________________________________________________________________________ Prepared by the National Tidal Centre, Australian Bureau of Meteorology
21

South Pacific Sea Level and Climate Monitoring Project: Sea Level Data Summary Report: Jul10–Jun11
Figure 10. Monthly mean sea levels to June 2011.
__________________________________________________________________________________ Prepared by the National Tidal Centre, Australian Bureau of Meteorology
22

South Pacific Sea Level and Climate Monitoring Project: Sea Level Data Summary Report: Jul10–Jun11
Figure 11. Sea level anomalies to June 2011.
__________________________________________________________________________________ Prepared by the National Tidal Centre, Australian Bureau of Meteorology
23
South Pacific Sea Level and Climate Monitoring Project: Sea Level Data Summary Report: Jul10–Jun11
Figure 12. Barometric pressure anomalies to June 2011.
__________________________________________________________________________________ Prepared by the National Tidal Centre, Australian Bureau of Meteorology
24
South Pacific Sea Level and Climate Monitoring Project: Sea Level Data Summary Report: Jul10–Jun11
Figure 13. Water temperature anomalies to June 2011.
__________________________________________________________________________________ Prepared by the National Tidal Centre, Australian Bureau of Meteorology
25

South Pacific Sea Level and Climate Monitoring Project: Sea Level Data Summary Report: Jul10–Jun11
Figure 14. Air temperature anomalies to June 2011.
__________________________________________________________________________________ Prepared by the National Tidal Centre, Australian Bureau of Meteorology
26
South Pacific Sea Level and Climate Monitoring Project: Sea Level Data Summary Report: Jul10–Jun11
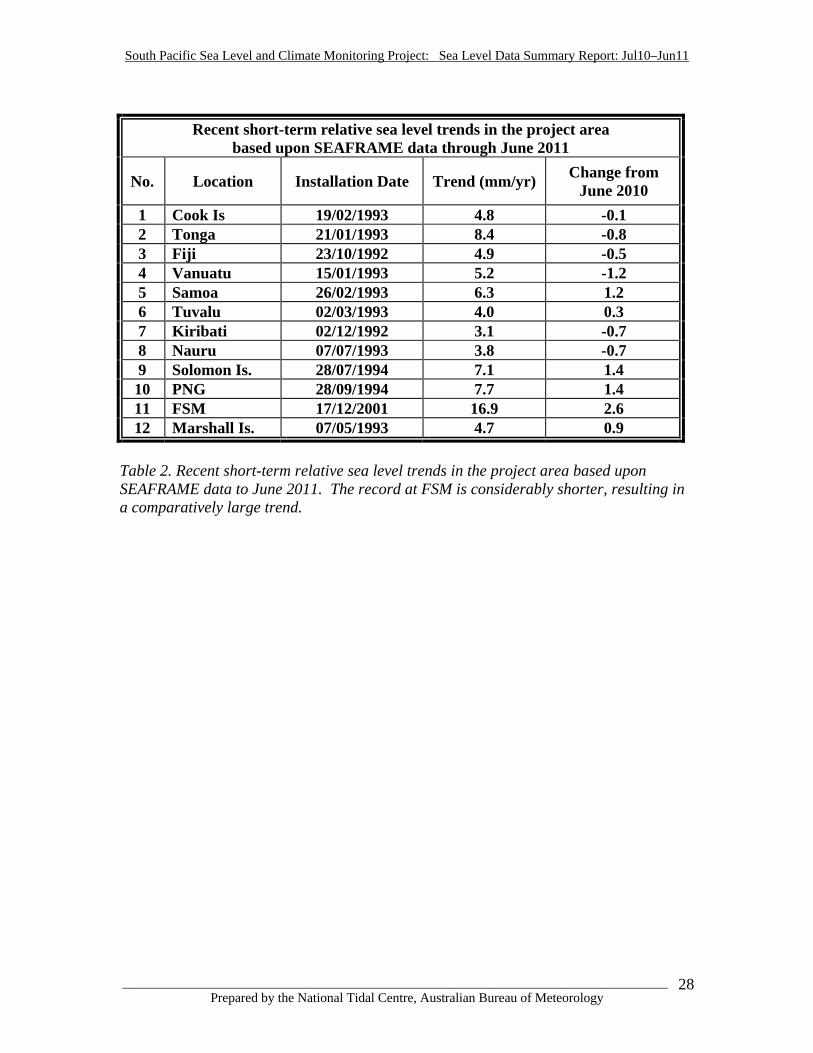
4.3. Sea Level Trends 4.3.1. Relative sea level trends Sea level is influenced by natural climate variability such as El Niño and decadal fluctuations in addition to long-term climate change such as global warming. Over the short term, large climate fluctuations such as El Niño can conceal the longer-term climate change. The vertical stability of a tide gauge or the land upon which it resides also influences measurements of changes in relative sea level, which is why precise levelling of the SEAFRAME to land-based benchmarks is undertaken and continuous GPS measurements are being collected. As the SEAFRAME sea level records grow in length the linear sea level trends that are derived each month will progressively become more indicative of the longer-term change. However, presently the sea level records are still short with respect to the length of data required for detecting signals associated with climate change. Caution must be exercised in interpreting the short-term trends – they will almost certainly change over the coming years as the data set increases in length. To help illustrate this, the changes to the trends that occurred in the past 12 months are listed in Table 2. The latest relative sea level trend estimates are listed in Table 2. Although the sea level trends are not yet indicative of long-term sea level rise across the region, they do demonstrate coherent short-term sea level changes across the region. Similar sea level trends are being observed at neighbouring stations, which is a testament to the quality standards that have been adhered to in the data collection program. These include regular calibration, maintenance and surveying of the SEAFRAME stations and routine quality checks of the collected data. Older sea level networks that were not originally designed for precise long-term sea level monitoring, but whose data is now being used for such, typically do not display the same level of agreement between neighbouring stations. The sea level trend at FSM is large compared to the other stations because the SEAFRAME station was only installed in 2001 and the record is shorter than the others. The trend at Tonga is larger than neighbouring stations Fiji and Cook Islands, which could be explained if the station had subsided as a result of seismo-tectonic activity along the Tonga Trench. Continuous GPS measurements that have been collected by Geoscience Australia since 2002 show subsidence occurred during the Mw8.0 Tonga earthquake in May 2006, but the dominant signal since installation of the CGPS has been one of steady ongoing uplift. Displacements of the tide gauge have occurred as a result of collisions with tugboats on the wharf, but these are captured by the precise levelling corrections and only account for -0.4 mm/yr. Further analysis suggests the cause of the discrepancy occurred prior to the installation of the CGPS.
__________________________________________________________________________________ Prepared by the National Tidal Centre, Australian Bureau of Meteorology
27
South Pacific Sea Level and Climate Monitoring Project: Sea Level Data Summary Report: Jul10–Jun11
Recent short-term relative sea level trends in the project area
based upon SEAFRAME data through June 2011
No. Location Installation Date Trend (mm/yr) Change from June 2010
1 Cook Is 19/02/1993 4.8 -0.1 2 Tonga 21/01/1993 8.4 -0.8 3 Fiji 23/10/1992 4.9 -0.5 4 Vanuatu 15/01/1993 5.2 -1.2 5 Samoa 26/02/1993 6.3 1.2 6 Tuvalu 02/03/1993 4.0 0.3 7 Kiribati 02/12/1992 3.1 -0.7 8 Nauru 07/07/1993 3.8 -0.7 9 Solomon Is. 28/07/1994 7.1 1.4 10 PNG 28/09/1994 7.7 1.4 11 FSM 17/12/2001 16.9 2.6 12 Marshall Is. 07/05/1993 4.7 0.9
Table 2. Recent short-term relative sea level trends in the project area based upon SEAFRAME data to June 2011. The record at FSM is considerably shorter, resulting in a comparatively large trend.
__________________________________________________________________________________ Prepared by the National Tidal Centre, Australian Bureau of Meteorology
28

South Pacific Sea Level and Climate Monitoring Project: Sea Level Data Summary Report: Jul10–Jun11
4.3.2. Precise levelling corrections Near first-order precise levelling of the datum of the sea level observations is an important aspect of the project. The purpose is to monitor the vertical movement of the sea level sensor with respect to the land. Upon installation of the SEAFRAME stations an array of deep-driven benchmarks were established in the immediate vicinity of the instrument and out to a distance of several kilometres. The vertical height of the gauge is monitored by repeatedly surveying the height of the gauge and its benchmarks every 1-2 years. A stable benchmark is identified as the primary tide gauge benchmark against which the tide gauge and other benchmarks are referred. The trend in the surveyed heights of the tide gauges with respect to their primary tide gauge benchmarks can be found in Table 3. The table also shows the number of surveys that have been conducted since each gauge was established.
Trends in the vertical movement of the tide gauge and/or supporting structure with respect to the tide gauge benchmark based upon precise levelling through
to June 2011
No. Location Number of surveys Trend (mm/yr)
1 Cook Is 10 -0.7 2 Tonga 10 -0.4 3 Fiji 11 0.6 4 Vanuatu 10 0.1 5 Samoa 10 -0.9 6 Tuvalu 11 -0.1 7 Kiribati 12 0.0 8 Nauru 12 0.2 9 Solomon Is. 6 -0.3 10 PNG 10 -0.0 11 FSM 4 -0.4 12 Marshall Is. 11 -0.5
Table 3. Trends in the datum of the SEAFRAME sea level sensor as determined from precise levelling between the sensor and the tide gauge benchmark. The precise levelling results indicate a substantial contribution to the relative sea level rise at Samoa is due to subsidence of the tide gauge at a rate of -0.9 mm/yr. Subsidence of a tide gauge produces a positive contribution to the rate of relative sea level rise. Subsidence is also occurring at Cook Islands, Marshall Islands, FSM and Solomon Islands. The tide gauge at Tonga has subsided with respect to the primary tide gauge benchmark as a result of displacements caused by several tug boat collisions, which prompted increased protective works to be established at the site. The tide gauge at Lautoka, Fiji is rising at a rate of 0.6 mm/yr with respect to the tide gauge benchmark.
__________________________________________________________________________________ Prepared by the National Tidal Centre, Australian Bureau of Meteorology
29

South Pacific Sea Level and Climate Monitoring Project: Sea Level Data Summary Report: Jul10–Jun11
4.3.3. Inverted barometric pressure effect Another parameter that influences changes in relative sea level is atmospheric pressure. A 1 hPa fall in barometric pressure, if sustained over a day or more, typically produces a 1 cm rise in the local sea level (within the area beneath the low pressure system), and vice versa. This is known as the inverse barometer effect. Trends in the barometric pressure recorded at the SEAFRAME stations have been examined to quantify what contribution they may be providing to the observed relative sea level trends. Table 4 contains the estimates of the contribution to relative sea level trends by the inverted barometric pressure effect in mm/year at all SEAFRAME sites over the period of the project. With the exception of Cook Islands, Solomon Islands and FSM the contributions are positive, which shows barometric pressure changes are contributing to slightly higher rates of sea level rise at most stations.
Barometric pressure contribution to the relative sea level rise in the project area based upon SEAFRAME data through June 2011
No. Location Installation Date Trend due to Inverse
Barometer (mm/yr)
Change from June 2010
1 Cook Is 19/02/1993 -0.3 -0.2 2 Tonga 21/01/1993 0.3 -0.2 3 Fiji 23/10/1992 0.6 -0.2 4 Vanuatu 15/01/1993 0.9 0.0 5 Samoa 26/02/1993 0.1 -0.1 6 Tuvalu 02/03/1993 0.2 -0.1 7 Kiribati 02/12/1992 0.3 -0.1 8 Nauru 07/07/1993 0.4 0.0 9 Solomon Is. 28/07/1994 -0.3 0.0 10 PNG 28/09/1994 1.3 0.0 11 FSM 17/12/2001 -0.5 0.3 12 Marshall Is. 07/05/1993 0.1 0.0
Table 4. Recent short-term barometric pressure trends expressed as equivalent sea level rise in mm/year based upon SEAFRAME data to June 2011. The trend at FSM is from a comparatively short series and therefore varies considerably.
__________________________________________________________________________________ Prepared by the National Tidal Centre, Australian Bureau of Meteorology
30

South Pacific Sea Level and Climate Monitoring Project: Sea Level Data Summary Report: Jul10–Jun11
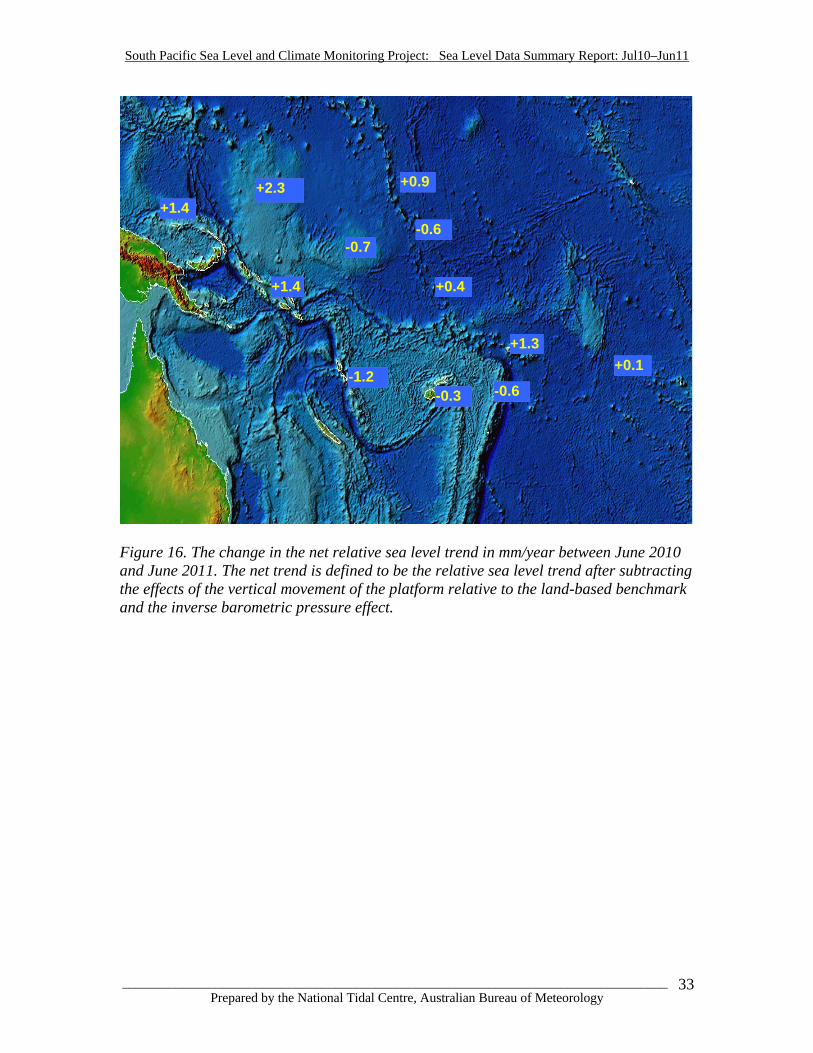
4.3.4. Combined net rate of relative sea level trends The effects of the vertical movement of the platform relative to a land based benchmark and the inverse barometer effect are subtracted from the observed rates of relative sea level change and presented in Table 5 and Figure 15. Despite the short-term nature of the sea level records, Figure 15 shows similar rates are being observed between neighbouring stations. FSM was installed at a much later stage and therefore has a notably different net trend. The net trend at Tonga appears large in comparison to its surrounding sites, perhaps due to island subsidence as a result of its proximity to the Tonga trench. Unfortunately the results from the Tonga CGPS station since its installation in February 2002 indicate island uplift. A comparison with the other gauges suggests the cause of the discrepancy occurred prior to the installation of the CGPS. Figure 16 shows large changes to the net rates of relative sea level rise were experienced at some of the SEAFRAME stations over the past year. The sea level trends at PNG, Solomon Islands, Tuvalu and Samoa all increased primarily as a result of stronger than usual Trade Winds and subsequent piling up of sea level along the South Pacific Convergence Zone during the La Niña. The increase to the sea level trends at FSM and Marshall Islands and the decrease at Kiribati and Nauru are also the result of positive sea level anomalies observed during the La Niña. Large year-to-year changes to the sea level trends illustrate the sea level records are still relatively short in climate terms.
Net relative sea level rise in mm/year through to June 2011
No. Location Installation Date Net Trend (mm/yr)
Change from June 2010
1 Cook Is 19/02/1993 4.4 0.1 2 Tonga 21/01/1993 7.7 -0.6 3 Fiji 23/10/1992 4.9 -0.3 4 Vanuatu 15/01/1993 4.4 -1.2 5 Samoa 26/02/1993 5.3 1.3 6 Tuvalu 02/03/1993 3.7 0.4 7 Kiribati 02/12/1992 2.8 -0.6 8 Nauru 07/07/1993 3.6 -0.7 9 Solomon Is. 28/07/1994 7.1 1.4 10 PNG 28/09/1994 6.4 1.4 11 FSM 17/12/2001 17.0 2.3 12 Marshall Is. 07/05/1993 4.1 0.9
Table 5. The net relative sea level trend estimates after vertical movements in the observing platform and the inverted barometric pressure effect are taken into account.
__________________________________________________________________________________ Prepared by the National Tidal Centre, Australian Bureau of Meteorology
31

South Pacific Sea Level and Climate Monitoring Project: Sea Level Data Summary Report: Jul10–Jun11
+4.1
+2.8 +3.6
+3.7
+5.3
+4.4 +4.9 +7.7
+4.4
+7.1
+6.4 +17.0
Figure 15. The net relative sea level trend in mm/year after subtracting the effects of the vertical movement of the platform relative to the land-based benchmark and the inverse barometric pressure effect utilising all the data collected since the start of the project up to the end of June 2011.
__________________________________________________________________________________ Prepared by the National Tidal Centre, Australian Bureau of Meteorology
32
South Pacific Sea Level and Climate Monitoring Project: Sea Level Data Summary Report: Jul10–Jun11
+0.9
-0.6 -0.7
+0.4
+1.3
-1.2 -0.3 -0.6
+0.1
+1.4
+1.4 +2.3
Figure 16. The change in the net relative sea level trend in mm/year between June 2010 and June 2011. The net trend is defined to be the relative sea level trend after subtracting the effects of the vertical movement of the platform relative to the land-based benchmark and the inverse barometric pressure effect.
__________________________________________________________________________________ Prepared by the National Tidal Centre, Australian Bureau of Meteorology
33

South Pacific Sea Level and Climate Monitoring Project: Sea Level Data Summary Report: Jul10–Jun11
4.3.5. Comparison with satellite altimetry derived sea level trends Satellite altimetry provides measurements of sea level in an absolute reference frame against which tide gauge measurements of relative sea level can be compared. It is important to recognise that satellite altimeters and tide gauges are complimentary datasets. The SEAFRAME sea level data is vital for calibrating and validating satellite altimeter measurements of sea level, as well as monitoring sea levels in coastal regions with an accuracy and timeliness that is not provided by satellite altimeters. The TOPEX/Poseidon (T/P) and subsequent Jason-1 and Jason-2 satellite altimeter missions have enabled sea levels to be measured on a global basis every 10 days since late 1992. The installation of SEAFRAME stations occurred around the same time, and hence both of these measurement programs have covered approximately the same period of sea level change. The global distribution of sea level trends derived from satellite altimetry from December 1992 to March 2011 is illustrated in Figure 17. Increasing sea levels in the western Pacific and falling sea levels in the eastern Pacific during this period are related to decadal fluctuations (see section 3.3). Sea level trends in the SPSLCMP region are generally higher than the global average, which currently stands at ~3.2 mm/yr. The satellite altimetry measurements show high rates of sea level rise have occurred in the far western equatorial Pacific and along the South Pacific Convergence Zone, in agreement the higher rates of sea level rise observed by the SEAFRAME stations located in these areas.
Figure 17. Global distribution of sea level trend (mm/yr) derived from satellite altimeter measurements from Dec 1992 to Mar 2011. (Figure courtesy of University of Colorado)
__________________________________________________________________________________ Prepared by the National Tidal Centre, Australian Bureau of Meteorology
34
South Pacific Sea Level and Climate Monitoring Project: Sea Level Data Summary Report: Jul10–Jun11
5. SEAFRAME INSTRUMENT PERFORMANCE The Observation Network Upgrade Project (ONUP) has recently commenced with funding from AusAID to refurbish the sea level and CGPS equipment to ensure the South Pacific data collection network has the capability to collect quality data for at least another 15 years as well as improve the occupational health and safety of the stations. Station upgrades under ONUP were completed at Tonga in March 2011 and Samoa in June 2011, which provided those sites with a replacement modern data logger, improved data communications and additional radar-type sea level sensor. In terms of the regular maintenance program the following major instrumentation problems were encountered and corrective actions undertaken in 2010-11: • Calibration and maintenance visits were undertaken at Kiribati (November 2010),
Nauru (November 2010) and PNG (March 2011). • Special service visits to Cook Islands and Samoa were required to rectify problems
that could not be resolved by way of local technical support or remote diagnoses. • The special service visit to Cook Islands on 27 September 2010 repaired the primary
and secondary sea level sensors which had developed problems in June 2010. • The special service visit to Samoa on 30 September 2010 resolved problems with the
power supply module that had resulted in data losses from 2 July 2010. • At Nauru problems with the primary acoustic sea level sensor continued (from July
2009), but data from the secondary sea level sensor were used where possible. Normal operation of the sensors resumed following the calibration and maintenance visit in November 2010.
• Problems were encountered with the water temperature sensors at Kiribati (November
2009 – November 2010), Tonga (December 2010 – April 2011) and Tuvalu (from April 2011), the air temperature sensors at Nauru (December 2010 – March 2011) and Tuvalu (from April 2011) and the wind sensors at Vanuatu (from March 2010), Kiribati (from April 2011) and Tuvalu (from March 2011).
• Intermittent problems with satellite and dial-up communications were experienced at
PNG, Samoa, FSM, Tuvalu, Kiribati, Tonga and Nauru, which resulted in some small data gaps where data were unable to be recovered. The satellite communications unit at Tonga developed a fault in May 2011 and was subsequently replaced in June 2011.
__________________________________________________________________________________ Prepared by the National Tidal Centre, Australian Bureau of Meteorology
35

South Pacific Sea Level and Climate Monitoring Project: Sea Level Data Summary Report: Jul10–Jun11
6. COMMUNICATION OF RESULTS Figure 18 shows the number of times the SPSLCMP pages on the Bureau of Meteorology website have been visited, by month since January 2008.
Number of Hits on the Pacific Array Web Pages
0
5000
10000
15000
20000
25000
30000
Jan
FebMar
AprMay
Jun Ju
lAug
Sep OctNov Dec
Month
Tota
l Num
ber
of H
its
2008 2009 2010 2011
Figure 18. Number of Hits on the NTC South Pacific Array Web Page.
__________________________________________________________________________________ Prepared by the National Tidal Centre, Australian Bureau of Meteorology
36

South Pacific Sea Level and Climate Monitoring Project: Sea Level Data Summary Report: Jul10–Jun11
7. FURTHER INFORMATION Further information on the South Pacific Sea Level and Climate Monitoring Project is available at the project website: http://www.bom.gov.au/pacificsealevel/ Information relating specifically to the sea level monitoring program can be obtained from: National Tidal Centre Australian Bureau of Meteorology PO Box 421 Kent Town SA 5067 Tel: (+618) 8366 2730 Fax: (+618) 8366 2651 Email: [email protected] Website: http://www.bom.gov.au/oceanography/
__________________________________________________________________________________ Prepared by the National Tidal Centre, Australian Bureau of Meteorology
37