Embed Size (px)
Citation preview

THE SPANISH INSURANCE MARKET IN 2020


The Spanish insurance market in 2020

Pablo Picasso Bullfight (1934) Oil on canvas
This study has been prepared by MAPFRE Economics. Publication rights have been granted to Fundación MAPFRE.
The information contained in this study may be reproduced in part, provided the source is cited.
Cite as: MAPFRE Economics (2021), The Spanish insurance market in 2020, Madrid, Fundación MAPFRE.
© Cover image: Pablo Picasso Bullfight (1934) Oil on canvas © Sucesión Pablo Picasso. VEGAP, Madrid, 2021 Origin: Museo Nacional Thyssen-Bornemisza, Madrid
© For the texts: MAPFRE Economics - [email protected] Spain: Carretera de Pozuelo, 52 - Edificio 1
28222 Majadahonda, Madrid Mexico: Avenida Revolución, 507
Col. San Pedro de los Pinos 03800 Benito Juárez, Mexico City
© For this edition: 2021, Fundación MAPFRE Paseo de Recoletos, 23. 28004 Madrid, Spain www.fundacionmapfre.org
July 2021.

MAPFRE Economics
Manuel Aguilera Verduzco General Director [email protected]
Ricardo González García Director of Analysis, Sectorial Research and Regulation [email protected]
Gonzalo de Cadenas Santiago Director of Macroeconomics and Financial Analysis [email protected]
Begoña González García [email protected]
Isabel Carrasco Carrascal [email protected]
José Brito Correia [email protected]
Fernando Mateo Calle [email protected]
Rafael Izquierdo Carrasco [email protected]
Eduardo García Castro [email protected]
Daniel Santos Torres Clara Soutullo Rodríguez Lourdes Sánchez Iza David Esteban Montes Rojas Jaime Rebolledo Gutiérrez


Contents
Presentation 9 ..................................................................................
Introduction 11 ....................................................................................
Executive summary 13 .......................................................................
1. Economic and demographic context 19 ........................................1.1. Economic aspects 19 ..........................................................1.2. Demographic aspects 29 ....................................................
2. Structure of the insurance industry 33 ........................................2.1. Market concentration 33 ....................................................2.2. Company ranking 33 ..........................................................2.3. Insurance market structure 36 ..........................................2.4. Distribution channels 41 ....................................................
3. The insurance market in 2020: an analysis of the main business lines 45 ....................................
3.1. Total market 45 ...................................................................3.2. Non-Life insurance lines 58 ...............................................3.3. Life insurance line 77 .........................................................
4. Structural growth trends 83 .........................................................4.1. Penetration, density and depth 83 .....................................4.2. Insurance Protection Gap 88 ..............................................
7THE SPANISH INSURANCE MARKET IN 2020

5. Analysis of capital requirements, own funds and solvency ratios 95 ..........................................................................
5.1. 2020 Solvency and Financial Condition Report 95 .............5.2. Solvency ratios 97 ...............................................................5.3. Life: comparative SCR analysis and the effect of transitional and adjustment measures 99 .....................5.4. Composites: comparative SCR analysis and the effect of transitional and adjustment measures 99 ....5.5. Non-Life: comparative SCR analysis 100 .............................5.6. Relative weight of different SCR risk modules and analysis of other relevant indicators 107 ......................
6. Regulatory outlook 113 ...................................................................6.1. Global trends 113 .................................................................6.2. European Union and Spanish market 113 ...........................
Index of charts and tables 115 .............................................................
References 119 .....................................................................................
Statistical appendix 123.......................................................................
8
THE SPANISH INSURANCE MARKET IN 2020

9
Presentation
Fundación MAPFRE is pleased to present this new edition of the MAPFRE Economics report The Spanish insurance market in 2020, which provides an overview of developments in the insurance industry over the fiscal year through its usual sections on the economic and demographic context, the structure of the insurance industry, an analysis of the main business lines, structural growth trends, the behavior of the capital requirements, own funds and solvency ratios of a representative group of insurance companies and a brief description of recent developments in the regulatory outlook.
In a year dominated by the COVID-19 pandemic, this report analyzes, among other things, the impact that lockdown and social distancing measures have had on insurance activity in Spain in 2020, a fiscal year in which insurance has seen a decrease of -8.2% in premium volume, heavily influenced by the performance of the Life line, which dropped by -20.7%. Despite the decreased revenue, insurance has remained a solvent and profitable industry, meeting its contracted obligations and responsibilities with its policyholders and shareholders by adapting its procedures and capacities to respond to the new needs of the market.
Providing education on insurance and finance is one of the objectives of Fundación MAPFRE considered in the publication of the studies conducted by MAPFRE Economics on different aspects of the economy and insurance activity, whereby we seek to contribute to the general public's understanding of the many benefits that insurance has for society and the economy.
Fundación MAPFRE
THE SPANISH INSURANCE MARKET IN 2020

11
Introduction
The Spanish insurance market in 2020 is an annual report designed to present an analysis of insurance activity performance, from both a contextual and medium-term perspective. In addition, this edition is of particular interest, as it analyzes the performance of the insurance industry in Spain in a year dominated by the economic and social impact of the COVID-19 pandemic.
To this end, the first chapter of the report takes a look at the environment and the most significant economic and demographic trends in Spain that could affect the performance of the insurance industry. The second chapter analyzes the structure and concentration of the insurance market, while the third chapter evaluates the performance of the main business lines during 2020, looking at premium growth and the contribution of different business lines to industry developments, technical performance, results, profitability, and investment and technical provisions.
In addition to these contextual aspects, the fourth chapter of the report addresses the structural trends in the Spanish insurance market over the medium-term, taking into account the period between 2010 and 2020. These trends include an analysis of the penetration, density and depth of insurance in Spain, as well as a revision of our Insurance Protection Gap (IPG) estimate for the Life and Non-Life segments. The fifth chapter provides a review of recent developments in the capital requirements, own funds and solvency ratios of a representative group of companies operating in the Spanish insurance industry, based on the information they have made available to the market in their Solvency and Financial Condition Reports. Finally, the report summarizes key regulatory insurance trends at the global, European Union and Spanish levels.
We trust that this new edition of The Spanish insurance market will be a source of information and analysis that will contribute to a better understanding of the insurance market, thereby strengthening the performance of this financial activity, to the benefit of Spain's economy and society.
MAPFRE Economics
THE SPANISH INSURANCE MARKET IN 2020


13
Executive summary
The global economic context and insurance activity performance.
In 2020, the world economy suffered its greatest downturn since the Second World War, with a fall of around -3.3% in global GDP (compared to growth of 2.9% in 2019) as a result of the crisis caused by the COVID-19 pandemic. GDP dropped by an estimated -6.7% in the eurozone in 2020 and -10.8% in Spain, one of the biggest falls across the world, due to the productive structure of the Spanish economy being hit particularly hard by the effects of mobility restrictions on consumption, commerce, hospitality and tourism-related business.
Central banks intervened quickly, applying ultra-accommodat ive monetary pol ic ies and unprecedented extensive fiscal aid packages, to continue to provide support for financial markets, governments, homes and businesses that was not available in previous economic crises, especially in developed countries. Recovery in 2021 will largely depend on this support being maintained and the pace of the vaccination campaign, both of which already appear unequal, as emerging markets are moving more slowly in the vaccination process and have practically exhausted their fiscal and monetary capacity, forcing them to revoke some of the measured adopted in certain cases.
The insurance industry worldwide has benefited from substantial aid packages, and insurance markets have held solvent and resistant, with smaller drops in business than in previous global crises. Nevertheless, there has been a decrease in premium revenue in many of the most advanced markets and even in some emerging ones, if we exclude the impressive performance seen in China. As such, premium volume worldwide was 6.3 trillion dollars, representing a decrease of
-1.3% in real terms, compared to an increase of 3.0% in 2019.
It should be noted that the sharp economic contraction caused by the pandemic and the implementation of ultra-accommodative monetary policies, with general drops in interest rates in both emerging and developed markets (in an interest rate environment that was already depressed before the pandemic), caused a downturn in the insurance market around the world, especially in the Life segment. This was the line of business most affected by the crisis, primarily in savings products, with a real-terms decrease of -4.4% in written premiums. Unit-linked insurance products were affected by market volatility at the beginning of the year, but began to recover in the second half. The drop occurred in both advanced and emerging markets, excluding China, which saw an increase in real terms of 2.8%, measured in dollars. On the other hand, the Latin America and Caribbean regions sustained a real-terms decrease of -4.9%, and the insurance markets in Europe, the Middle East and Africa (EMEA) suffered the largest loss (-9.1%).
Global premium volume in the Non-Life segment (which represents around 56% of total premiums) increased to 3.5 trillion dollars, an increase of 1.5% in real terms (3.9% in 2019). Non-Life insurance held steady in the face of the crisis, and underwriting was not stalled thanks to the acceleration in digitization processes. The Health line was the line of business that increased the most overall in the insurance markets, spurred by consumer aversion to health risk, while the Automobile line was one of the lines most affected by the crisis, with decreases in premium revenue but also loss experience. The Asia-Pacific markets had the best performance, driven by the growth of the Chinese market.
THE SPANISH INSURANCE MARKET IN 2020

14
THE SPANISH INSURANCE MARKET IN 2020
The Spanish insurance industry in 2020
In Spain, the aggregate premium volume for 2020 was 58.89 billion euros. Total premium volume dropped by -8.2%, furthering the fall in business of -0.4% in 2019. The Spanish insurance industry suffered a severe drop in business in 2020 due to the sharp economic downturn caused by the pandemic. The insurance business was impacted by the effects of lockdown and social distancing measures on employment, business, households and companies, although this impact was not uniform across all business segments. Life business premiums dropped by -20.7% (-5.1% in 2019), mainly due to the fall in the Life savings insurance business of -25% (-6.7% in 2019). Technical provisions (managed savings) in Life insurance reached 194.11 billion euros in 2020, a slight decrease of -0.3% compared to 2019. Life Protection premiums fell by -0.4% — a significant decline compared to the growth in the previous year (3.1% in 2019), due to the economic crisis and the sharp drop in real estate market activity in 2020, also a result of the pandemic.
However, in 2020, Non-Life business in the Spanish market only slowed to 37.05 billion euros in premiums, growing by 1.1% (3.5% in 2019), mainly due to the decline in the automobile insurance and commercial multirisk businesses. The combined ratio for the Non-Life insurance segment during 2020 was 90.5%, which is -2.4 percentage points (pp) below the figure recorded for 2019 (92.9%), due to a -3.6-pp improvement in the loss ratio, coming in at 67%. The administration expense ratio (5.3%) deteriorated by 0.3 pp, while the acquisition expense ratio (18.1%) grew by 0.9 pp.
The implementation of monetary and fiscal policy measures unlike any of those adopted in previous economic crises aided in the resistance demonstrated by the Non-Life business in Spain. The European Central Bank deployed broad quantitative easing measures through bond acquisition programs (Pandemic
Emergency Purchase Programme, or PEPP) for an amount of up to 1.85 trillion euros, flexible by country, added to those measures already applied, enabling governments, households and businesses to continue to obtain financing at reduced costs. This intervention, coupled with fiscal aid packages for workers (through temporary employment regulation measures) and companies, resulted in a less severe drop in the Non-Life business than experienced in other economic crises. The latest data for May 2021 show that Non-Life premium growth is recovering in year-on-year terms by around 2.2% at the aggregate level compared to premiums for the first five months of 2020. Life business premiums are expected to have grown by 9.9% year-on-year in the first five months of the year (compared to the drop of -20.7% across the whole of 2020), with Life savings insurance premiums growing by 12.4% (-25.0% in 2020) and Life Protection insurance premiums coming in at 3.1% (-0.4% in 2020). This recovery observed in the first few months of the year is in line with the Spanish economy's return to growth, greatly supported by the increase in the vaccination rate, which allowed measures taken as a result of new outbreaks to be relaxed.
Automobile insurance remained the line with the largest premium volume in the Non-Life insurance segment, although its trend of reducing its weighting continues; in 2020, it accounted for 29.9% of the premiums in this segment (30.9% in 2019). The amount of premiums issued in this l ine totaled 11.09 billion euros in 2020, representing a year-on-year decline of -2.0%. This can be attributed to the -2.8% drop in the average premium (to 346.5 euros) and not necessarily to the number of insured vehicles, which actually increased by 0.8% up to 32 million. The combined ratio in this line also improved significantly to 87.8% (94.7% in 2019). However, it should be noted that this was an abnormal year marked by mobility restrictions due to the pandemic, with 25% less long-distance travel and the lowest number of deaths in history.

15
THE SPANISH INSURANCE MARKET IN 2020
Health insurance was the second-biggest line by volume within the Non-Life insurance business, representing 25.3% of the total (24.4% in 2019). In 2020, premium volume amounted to 9.39 billion euros, with growth of 5.1% (4.9% in 2019). In 2020, the trend toward collective policies seen in recent years in this line of insurance continued, with an increase of 5.3% in collective insurance, while i n d i v i d u a l i n s u r a n c e g re w b y 4 . 7 % . Nevertheless, 70.3% of the line's allocated premiums are still concentrated in individual insurance. The combined ratio for this line improved in 2020 compared to the previous year due to the drop in loss experience, at 90.2% (93.4% in 2019). However, the line's performance was still suffering the effects of the pandemic in the first few months of 2021, and there has been a strong increase in health costs as policyholders that have put off obtaining non-urgent health treatment due to the pandemic are now seeking care and hospital costs are up due to health protocols in admissions requiring PCR tests and all the new protective equipment. In addition, consolidation of the digital services offered to clients by all the major companies has increased. It is now common for policyholders to be able to have medical consultations by video, chat with medical professionals online, download test results and medical reports, have online appointments with large hospital chains, and manage their policies via their companies' websites or specific mobile applications for this type of insurance.
As for Multirisk insurance, it slightly increased its weighting in the Non-Life business, representing 20.9% of the total (20.5% in 2019), putting it in third place with a premium volume of 7.75 billion euros, 3.1% more than the previous year, despite the economic downturn caused by the pandemic. The Homeowners modality is the segment with the largest market share, representing 60% of the premiums in this line of business. The modalities that accumulated the largest premium volume, Homeowners and Industrial,
performed well, with increases of 2.7% and 5.6% respectively, while Condominium and Commercial premiums also rose, with respective increases of 2.8% and 0.3%. However, the overall combined ratio increased to 94.5% (93.8% in 2019). Storm Gloria had a significant effect on the loss ratio, although it was largely absorbed by the Insurance Compensation Consortium (ICC).
With regard to profitability indicators, the results of the Spanish insurance industry were notable, amounting to 5.8 billion euros in 2020, an increase of 16.6% compared to the previous fiscal year. The profitability of the sector also performed positively in relative terms, with a change to the downward trend seen in the two years prior, and had a return on equity (ROE) of 11.99%, 1.1 pp greater than in 2019. Similarly, industry profitability, measured in terms of return on assets (ROA), increased slightly (0.17 pp), at 1.60% in 2020 compared to 1.42% in 2019.
Total investment by Spanish insurance companies amounted to 335.61 billion euros in 2020, representing a 1.9% increase compared to 2019. An analysis of the investment structure shows that the main category of assets continues to be f ixed income, representing 55% of the investment portfolio, with sovereign fixed income as the dominant component. Corporate fixed income accounted for 18.7% of the portfolio (after deducting the effect of the valuation on derivative and s t r u c t u re d p ro d u c t s ) . M o s t i n d u s t r y investment credit ratings were on the second rung of the ratings map included under Solvency II regulations (equivalent to A), in line with the Spanish sovereign risk rating at the end of 2020. The intervention of central banks and tax authorities, both nationally and at the European Union level, restored stability on the financial markets, which suffered one of the fastest crashes in history in February and March 2020. This decline was partly driven by investors' dash for cash. Nevertheless, the extension of the low interest rate environment

16
THE SPANISH INSURANCE MARKET IN 2020
and potential insolvencies will continue to pose challenges for business and profitability in the insurance industry, especially for Life insurance companies.
Structural trends in insurance in Spain
In relation to the analysis of the structural growth trends for the Spanish insurance industry, in 2020, the performance of the market slowed down again and, for yet another year, diverged from the expansive trend begun in 2014, which peaked in 2016. However, 2020 was a unique year due to the strong economic recession caused by the pandemic, in an environment where the drop in insurance business was less than what the economy overall experienced and was concentrated primarily in the Life business, as reflected in its penetration, density and depth indices. In any event, these indicators remain below the average for the European Union's 15 major economies, although the difference in the Non-Life business penetration level was negligible.
As such, Spanish insurance penetration (premiums/GDP) stood at 5.26% at the end of 2020 (5.16% in 2019). The increasing penetration rate is attributable to the Non-Life insurance segment, the penetration of which was 3.31%, (0.36 pp above that of the previous year), while the Life insurance indicator was 1.95% for 2020 (2.21% in 2019).
Moreover, insurance density (premiums per capita) in Spain reached 1,243.80 euros in 2020 (1,352.50 in 2019). It should be noted that the decrease compared to the previous year was due to the combination of a fall in the Life insurance segment, at 461.20 euros per capita (580.00 in 2019), and an increase in Non-Life insurance, which amounted to 782.60 euros per capita (772.40 in 2019).
Finally, the depth index (the share of direct Life insurance premiums in relation to the market's total direct premiums) was 37.1% in 2020, 5.8 pp below the figure recorded for the previous year. This is the fourth consecutive decline in
the indicator and the largest in the past ten years, which has resulted in levels of market depth that are significantly lower than they were a decade ago. This performance confirms the relative decline of the Life segment within the market since its peak in 2016.
Furthermore, the IPG for the Spanish market was 31.6 billion euros in 2020, 1.9 billion euros less than in 2019, thanks to the positive performance of Non-Life business in Spain in 2020, which practically closed the gap in this segment compared to the set of European reference markets. In structural terms, the composi t ion of the IPG cont inues to demonstrate room for further development in the Life insurance segment. In 2020, 99.8% of the IPG (31.5 billion euros) corresponded to the Life insurance segment (0.2 billion euros less than in the previous year), while the Non-Life segment IPG (0.05 billion euros) represented only the remaining 0.2% (1.7 billion euros less than the previous year).
With regard to competition dynamics and structure, during the past decade, the Spanish insurance industry has continued to show a certain trend toward concentration, which is evident in the drop in the number of companies operating, as well as in the analysis of the Herfindahl and CR5 indices. Nevertheless, it should be noted that this trend appears to have been reversing since 2016, and concentration levels continue to reflect a high level of competition in the Spanish insurance industry, as per the aforementioned indicators.
Solvency posit ion of the Spanish insurance industry
With regard to solvency levels in Spain, individual insurance companies published the fifth Solvency and Financial Condition Report (SFCR) in 2021, in accordance with the new risk-based prudential regulation in force in the European Union since January 1, 2016 (Solvency II). An analysis of a sample of companies representing 70.3% of insurance premiums and 79.4% of technical provisions on the market in 2020 reveals that the industry's solvency continues to reflect a sound position.
17
THE SPANISH INSURANCE MARKET IN 2020
The aggregate total solvency ratio of the sample of insurance companies analyzed was 241%, 2 pp below the value recorded in 2019 (243%). The ratio of companies mainly operating in the Life insurance line was 234% in 2020 (245% in 2019). For companies operating in both the Life and the Non-Life insurance business (Composites), the total aggregate solvency ratio amounted to 216% (225% in 2019). Finally, the companies analyzed in this report operating solely or mainly in the Non-Life insurance sector had a total aggregate solvency ratio of 273% in 2020 (257% in 2019), recording a 16-pp increase compared to the previous fiscal year. With regard to own funds, it should be emphasized that almost all eligible own funds from the universe of the companies analyzed were of the highest quality (99% Tier 1 on aggregate for the sample used, a percentage similar to the previous year).
Lastly, it should be noted that the events of 2020 once again attested to the importance and relevance of volatility adjustments and matching adjustments as mechanisms to (partially) offset the effect that occasional volatility spikes in the financial markets may have on the solvency position of insurance companies and their groups, taking into account their nature of medium- and long-term institutional investors as well as their proper risk management. In this sense, the evolution of the volatility adjustment for the Spanish market reflected the high level of uncertainty experienced by financial markets in the early stages of the health and economic crisis
caused by the COVID-19 pandemic. In March 2020, the currency volatility adjustment for the euro (calculated by the European Insurance and Occupational Pensions Authority [EIOPA]) reached the highest level that this indicator has seen since the Solvency II regulation came into force. This was due to the strong upturn in volatility to which the investment portfolios of the insurance companies operating in the European Economic Area were exposed. This adjustment also reflects the powerful effect of the message issued by the European Central Bank (ECB) on March 18, 2020 approving the PEPP, which involved resorting to the widespread use of unconventional monetary policy measures to provide liquidity to bond markets (sovereign and corporate).


1. Economic and demographic context
1.1. Economic aspects
Global and European environment
The COVID-19 crisis has left its mark on the global economy, recording a fall in GDP of -3.3% in 2020 (see Chart 1.1-a). This has caused an output gap that is estimated to exceed 3% of global potential. The emerging world has contributed disproportionately to this gap, even though it was negative in both emerging and developed regions. China was the only major economy in the world to record positive growth in 2020, with its economy focused on technological competence, domestic sustainable development, integration into regional value chains (especially with Europe) and the promotion of its sovereign governance model.
The economic decline resulting from the pandemic represents the largest loss in GDP recorded since the Second World War. Although extraordinarily severe, global economic decline was much lower than initially expected, thanks to greater "tolerance" of the pandemic seen in the second half of last year and the widespread deployment of fiscal and monetary stimuli. In this regard, global fiscal stimuli are estimated to total around 3.5% in 2020, particularly due to the actions taken by the United States, the European Union and China.
Within this context, markets like China and the United States are leading the way toward a cyclical recovery. However, on a global sca le , recovery i s asynchronous and asymmetrical, with other markets like Latin America showing weak momentum that could become structural. Moreover, this recovery is taking place against a backdrop of increased risk appetite, with a financial market buoyed by tremendous levels of liquidity. It is also set in a context of considerable differences in monetary policy between developed and emerging markets, engendered by the resurgence of global inflationary pressures.
Currently, we are in a recovery phase supported by consumption, which is having a global impact on raw material prices, especially crude oil, which has rebounded from its slump in May 2020 (45 dollars per barrel). Furthermore, this recovery is occurring against a backdrop of increased risk appetite within a financial market both buoyed by the tremendous liquidity available before the pandemic and fueled by unprecedented expansionary monetary policies implemented by central banks virtually everywhere in the world. Global risk aversion is now back at pre-pandemic levels, which has also resulted in regional risk with widespread declines in Emerging Markets Bonds Indices (EMBIs) and a partial return on portfolio investment flows.
19THE SPANISH INSURANCE MARKET IN 2020
Chart 1.1-a Global: economic growth and inflation
(quarterly data, year-on-year variation)
Source: MAPFRE Economics (based on Haver data)
-12
-9
-6
-3
0
3
6
9
12
2013
2014
2015
2016
2017
2018
2019
2020
2021
2022
2023
Real GDP (YoY, %) Inflation (YoY, %)

20
THE SPANISH INSURANCE MARKET IN 2020
However, this is all happening within a monetary policy environment in which clear differences between the developed and emerging world are beginning to become apparent. While the developed world is f lour ish ing by mainta in ing extremely benevolent monetary and financial conditions, some major emerging countries (Brazil, Turkey and Mexico) have either already started tightening their monetary policy in light of accelerating inflation, or are about to do so in the short-term. Despite this, emerging countries are maintaining manageable financial conditions for the time being, thanks to a real effective exchange rate that has appreciated in relative terms against the dollar and is free from short-term pressures, and thanks to the entry/return of portfolio investment flows. Furthermore, the balance of payments for most emerging countries also appears free from pressure at the moment.
In fiscal terms, 2020 marked a turning point in terms of public deficits. Global fiscal stimuli are estimated to total around 3.5% in 2020, particularly due to the actions taken by the United States, the European Union and China. These stimuli are expected to be significantly lower—though still generous—in 2021, primarily as fiscal space appears to be depleting.
Economic environment and demand for insurance In this global environment, the Spanish insurance industry saw a sharp fall in business in 2020 due to the abrupt downturn also suffered by the economy in Spain. The insurance business was impacted by the effects of lockdown and social distancing measures on employment, business, households and companies, although this impact was not uniform across all business segments.
Overall, at an aggregated level, the drop in total premium volume was -8.2%, deepening the -0.4% fall in business in 2019. The origin in both cases was the poor performance of the Life business, which suffered a decline in premiums of -20.7% (-5.1% in 2019), mainly due to the fall in the Life Savings insurance business of -25.0% (-6.7%) in 2019). Life Protection premiums decreased by -0.4% (3.1% in 2019). In contrast to the Life segment, the Non-Life segment only slowed down in 2020, growing by 1.1% (3.5% in 2019), mainly due to the decline in the automobile insurance and commercial multirisk businesses.
Chart 1.1-b Spain: economic growth and demand for insurance,
2010–2020
Chart 1.1-c Spain: trends in direct insurance, 2010–2020
(index 2010=100)
Source: MAPFRE Economics (based on INE and ICEA data)
-15%
-10%
-5%
0%
5%
10%
15%
2010
2011
2012
2013
2014
2015
2016
2017
2018
2019
2020
Insurance market (nominal premiums)Nominal GDP
80
90
100
110
120
2010
2011
2012
2013
2014
2015
2016
2017
2018
2019
2020
Total Life Non-Life GDP

21
THE SPANISH INSURANCE MARKET IN 2020
In the case of the Spanish insurance market, the situation caused by the pandemic has confirmed the close relationship between the economic growth rate and insurance demand. This relationship is illustrated over the medium-term (2010–2020) in Charts 1.1-b and 1.1-c. The analysis of aggregate insurance business volume (Chart 1.1-b) indicates that there was a severe drop in total insurance premiums in Spain in 2020 (-8.2%), in line with the sharp drop in nominal GDP (-10.0%). As can be concluded from this information, the relationship continued to be particularly significant in the Non-Life business until 2019, then in 2020 it moved sharply away from the path of GDP variation, promptly breaking with this trend with an abrupt drop in GDP that has not transferred fully to this business, and closing with an increase in Non-Life premiums of 16.5% over the course of the decade, as opposed to a nominal increase in GDP of 4.4% for the same period (Chart 1.1-c). The Life business is suffering the consequences not only of the economic slowdown caused by the pandemic but also of the ongoing low interest rate environment, dropping by -27.0% in the last decade, with the effects of the 2012 crisis dragging on in this business segment.
The implementation of monetary and fiscal policy measures unlike any of those adopted in previous economic crises aided in the resistance demonstrated by the Non-Life business in 2020. The ECB deployed broad quantitative easing measures through bond acquisition programs (PEPP) for an amount of up to 1.85 trillion euros, flexible by country, in addition to those measures already applied, enabling governments, households and businesses to continue to obtain financing at reduced costs. This intervention, coupled with fiscal aid packages for workers (through temporary employment regulation measures) and companies, resulted in a less severe drop in the Non-Life business than experienced in other economic crises.
In addition, the intervention of central banks and tax authorities, both nationally and at the European Union level, restored stability on the financial markets, which suffered one of the fastest crashes in history in February and March 2020. This decline was partly driven by investors' dash for cash. However, the extension of the low interest rate environment continues to pose a challenge for business and profitability in the insurance industry, especially for insurance companies in the Life segment.
The latest data for the first four months of 2021 show that Non-Life premium growth in Spain is recovering in year-on-year terms, increasing by around 1.9% at the aggregate level compared to premiums for the first four months of 2020. Life business premiums have grown by 4.9% year-on-year in the first four months of the year (compared to the drop of -20.7% across the whole of 2020), with Life savings insurance premiums growing by 5.6% (-25.0% in 2020) and Life Protection insurance premiums recovering with an increase of 1.9% (-0.4% in 2020). This recovery is in line with the Spanish economy's return to growth, greatly supported by the increase in the vaccination rate, which has allowed measures taken as a result of new outbreaks to be relaxed.
Real estate sector
The Spanish real estate market is closely tied to the performance of the insurance market, especially through Life Protection and Multirisk insurance. As has been the case with the rest of the economy, 2020 has been a complex period for the housing sector due to the shutdown in real estate activity during the first few months of the COVID-19 pandemic and a later slow recovery following the trend in infections in the subsequent months, leaving investor and family decisions in the market in suspense. As such, as indicated by the Central Bank of Spain, the uneven performance of the real estate sector in the different regions of the country reflects the change in homeowner
22
THE SPANISH INSURANCE MARKET IN 2020
needs when buying real estate, the slight pressure on housing prices and the financial restrictions that begin to surface when buying1.
The economic situation resulting from social distancing and lockdown measures imposed on the population (adopted to deal with the health crisis caused by the pandemic) has had a substantial effect on the number of real estate transactions. This is reflected in the latest statistics published by the Ministry of Transport, Mobility and Urban Planning for the fourth quarter of 2020, indicating that despite the slight recovery in activity in the fourth quarter compared to the third, the year as a whole saw a year-on-year variation of -14.5%, much greater than the annual decrease accounted for in 2019 (-2.2%).
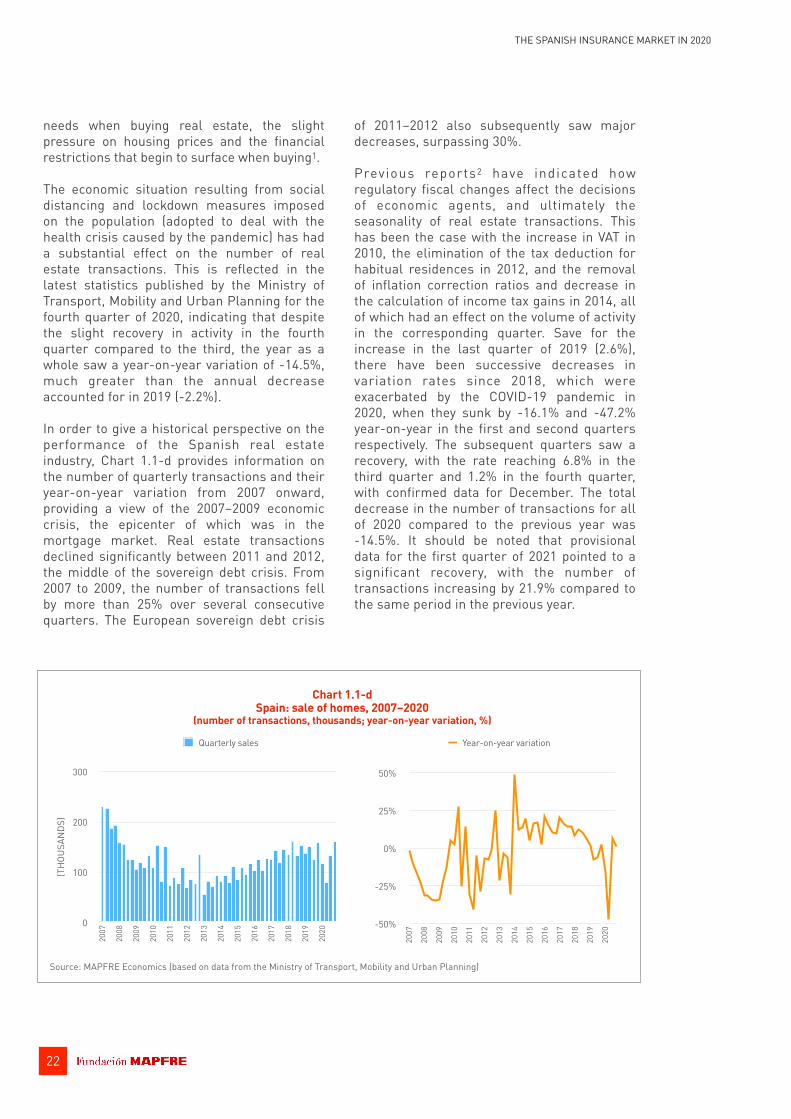
In order to give a historical perspective on the performance of the Spanish real estate industry, Chart 1.1-d provides information on the number of quarterly transactions and their year-on-year variation from 2007 onward, providing a view of the 2007–2009 economic crisis, the epicenter of which was in the mortgage market. Real estate transactions declined significantly between 2011 and 2012, the middle of the sovereign debt crisis. From 2007 to 2009, the number of transactions fell by more than 25% over several consecutive quarters. The European sovereign debt crisis
of 2011–2012 also subsequently saw major decreases, surpassing 30%.
Previous reports2 have indicated how regulatory fiscal changes affect the decisions of economic agents, and ultimately the seasonality of real estate transactions. This has been the case with the increase in VAT in 2010, the elimination of the tax deduction for habitual residences in 2012, and the removal of inflation correction ratios and decrease in the calculation of income tax gains in 2014, all of which had an effect on the volume of activity in the corresponding quarter. Save for the increase in the last quarter of 2019 (2.6%), there have been successive decreases in variation rates since 2018, which were exacerbated by the COVID-19 pandemic in 2020, when they sunk by -16.1% and -47.2% year-on-year in the first and second quarters respectively. The subsequent quarters saw a recovery, with the rate reaching 6.8% in the third quarter and 1.2% in the fourth quarter, with confirmed data for December. The total decrease in the number of transactions for all of 2020 compared to the previous year was -14.5%. It should be noted that provisional data for the first quarter of 2021 pointed to a significant recovery, with the number of transactions increasing by 21.9% compared to the same period in the previous year.
(TH
OUSA
NDS
)
0
100
200
300
2007
2008
2009
2010
2011
2012
2013
2014
2015
2016
2017
2018
2019
2020
Quarterly sales
-50%
-25%
0%
25%
50%
2007
2008
2009
2010
2011
2012
2013
2014
2015
2016
2017
2018
2019
2020
Year-on-year variation
Source: MAPFRE Economics (based on data from the Ministry of Transport, Mobility and Urban Planning)
Chart 1.1-d Spain: sale of homes, 2007–2020
(number of transactions, thousands; year-on-year variation, %)

23
THE SPANISH INSURANCE MARKET IN 2020
Furthermore, the housing stock estimated by the Ministry of Transport, Mobility and Urban Planning is 25,882,055 units, based on provisional data for 2020. A comparison with 2001 indicates a 23.1% increase over the past 18 years, as illustrated by Chart 1.1-e. Although the year-on-year variation in housing stock was greater than 2% before the 2008 economic crisis, later dropping to rates around 0.2%, a slight increase can be noted in 2019 (0.31%) and, as indicated above, provisional data suggests that in will increase by 0.35% in 2020 despite the pandemic, even higher than in the previous year.
A review of new and existing real estate transactions during the last 16 years (see Chart 1.1-f) indicates significant differences; specifically, a significant drop in existing home transactions was observed in 2020, with a year-on-year rate of -16.9%, the largest drop in the last nine years. On the other hand, new home transactions increased by 7.3% compared to 2019, causing the ratio of new homes to total homes to increase slightly, at the expense of existing homes.
0%
1%
2%
3%
2001
2002
2003
2004
2005
2006
2007
2008
2009
2010
2011
2012
2013
2014
2015
2016
2017
2018
2019
2020
Year-on-year variation
Source: MAPFRE Economics (based on data from the Ministry of Transport, Mobility and Urban Planning)
Chart 1.1-e Spain: housing stock, 2001–2020
(number of homes, thousands; year-on-year variation, %)
0
10,000
20,000
30,00020
0120
0220
0320
0420
0520
0620
0720
0820
0920
1020
1120
1220
1320
1420
1520
1620
1720
1820
1920
20
Housing stock
-60%
-40%
-20%
0%
20%
40%
2005
2006
2007
2008
2009
2010
2011
2012
2013
2014
2015
2016
2017
2018
2019
2020
New Existing
0%
20%
40%
60%
80%
100%
2005
2006
2007
2008
2009
2010
2011
2012
2013
2014
2015
2016
2017
2018
2019
2020
Source: MAPFRE Economics (based on data from the Ministry of Transport, Mobility and Urban Planning)
Chart 1.1-f Spain: sales of new homes vs. sales of existing homes, 2005–2020
(year-on-year variation, %; distribution structure, %)

24
THE SPANISH INSURANCE MARKET IN 2020
Analysis of the housing transactions by Autonomous Community for 2020 shows, just as in the previous year and with the exception of Asturias (which had a minimum year-on-year positive rate of 0.81%), negative rates, most notably for the Canary Islands (-30.67%), the Balearic Islands (-26.34%), Valencia (-17.74%), Catalonia (-16.36%), Madrid (-14.62%) and Andalusia (-14.40%). As for the percentage of transactions by province divided by the national total for 2020, the largest decreases in activity were in Santa Cruz de Tenerife (-31.84%), Las Palmas (-29.60%),
Alicante (-22.66%) and Malaga (-18.97%); only the provinces of Segovia (1.75%), Badajoz (0.57%) and Orense (0.10%) saw positive growth, although at highly reduced rates.
An analysis of real estate transactions completed in Spain by foreign nationals (resident and non-resident) shows a decrease during 2020. While these transactions made up 16.5% of the domestic total in 2019, this figure dropped to 14.7% in 2020 (with provisional data for the fourth quarter), with a preference for coastal areas (Alicante, 20.1%; Malaga, 11.4%;
-50%
-25%
0%
25%
50%
2008
2009
2010
2011
2012
2013
2014
2015
2016
2017
2018
2019
2020
Resident foreigners Non-resident foreigners
(TH
OUSA
NDS
)
0
20
40
60
80
100
120
2007
2008
2009
2010
2011
2012
2013
2014
2015
2016
2017
2018
2019
2020
Source: MAPFRE Economics (based on data from the Ministry of Transport, Mobility and Urban Planning)
Chart 1.1-g Spain: real estate transactions involving foreigners, 2007–2020
(number of real estate transactions; year-on-year variation, %)
0
100
200
300
400
500
Rural properties Urban properties Homes Land Other
2015 2016 2017 2018 2019 2020
Chart 1.1-h Spain: trends in number of mortgages, 2015–2020
(number of mortgages, thousands)
Source: MAPFRE Economics (based on data from the Ministry of Transport, Mobility and Urban Planning)

25
THE SPANISH INSURANCE MARKET IN 2020
Canary Islands, 7.1%; Barcelona, 8.3%; and the Balearic Islands, 5.5%), with the sole exception of Madrid (7.6%). Exacerbating the negative trend recorded in 2019 (shown in Chart 1.1-g), the data for 2020 indicated a severe drop in year-on-year variations in transactions by both resident (-22.1%) and non-resident (-30.2%) foreign nationals3.
Furthermore, developments in mortgages taken out between 2016 and 2020 (see Chart 1.1-h), show that the number underwritten for both rural and urban properties dropped in their categories (homes and land). Mortgages granted in 2020 for the purchase and sale of homes made up 72.5% of total mortgages, slightly lower than 2019 (72.6%). In addition, the year-on-year variation in total mortgages over all types of property in the past year was -7.0% (see Chart 1.1-i), adding to the deceleration that occurred in 2019, which, while still positive (3.3%) was lower than that for 2018 (11.3%).
The Instituto Nacional de Estadística (Spanish national statistics institute — INE), through the Índice General de Precios de Vivienda (General Housing Price Index — IPV), recorded a year-on-year variation of 1.5% for the fourth quarter of 2020, less than half of the 3.6% variation
(TH
OUSA
NDS
)
0
500
1,000
1,500
2,00020
0320
0420
0520
0620
0720
0820
0920
1020
1120
1220
1320
1420
1520
1620
1720
1820
1920
20
Mortgages taken out
-40%
-20%
0%
20%
40%
2003
2004
2005
2006
2007
2008
2009
2010
2011
2012
2013
2014
2015
2016
2017
2018
2019
2020
Year-on-year variation
Source: MAPFRE Economics (based on INE data)
Chart 1.1-i Spain: mortgages taken out compared with total properties, 2003–2020
(number of mortgages, thousands; year-on-year variation, %)
0%
30%
60%
90%
1950
1960
1970
1981
1991
2001
2011
Owned (%)Rented or other (%)
Chart 1.1-j Spain: trends in home ownership, rentals and
occupancy free of charge, 1950–2011* (%)
Source: MAPFRE Economics (based on data from the Ministry of Transport, Mobility and Urban Planning) * Latest data available

26
THE SPANISH INSURANCE MARKET IN 2020
published for the same period in 2019, and well below the 6.6% figure posted in 2018. Regarding the IPV for new homes, 2020 closed with an increase of 8.2% compared to 5.3% for 2019, whereas the IPV for existing homes was 0.4% in 2020, compared to 3.4% for 2019.
Previous editions of this report have included the performance of residential rentals published by the Housing and Land Observatory of the Spanish Ministry of Public Works, showing the ongoing trend of reduced leasing in favor of home ownership until 2001, with the number of rentals then increasing in 2011 (latest ten-year data published) (see Chart 1.1-j). Moreover, more recent data from between 2007 and 2019 (the latest data available), on which the INE Living Conditions Survey is based, confirms that the reduction in the percentage of families owning their own homes reduced to 75.9% in 2019, from 76.1% in 2018, and the proportion of homes rented at market price increased accordingly to 15.4% in 2019 (14.8% in 2018), while homes rented below market price remained the same as the previous year at 2.7% (see Chart 1.1-k).
Automobile sector
Spain's fleet of vehicles totaled 34.8 million in 2020, 1.0% more than the previous year4. Once again, it was the motorcycle segment that showed the greatest growth at 3.6%, while private cars, representing 71% of the total, rose by only 0.6% to 24.7 million (see Chart 1.1-l). Conversely, registrations performed poorly, with a drop of -28.4%. The overall decrease in all types of vehicles influenced this drop, particularly the -31.7% decrease in private car registrations (which represent 73% of all registrations for the year) and the -11.8% decrease in motorcycle registrations (which represent 12.6%). The percentage of vehicles over 10 years old as compared to the total rose slightly, from 63.1% to 63.6%.
In an unusual year marked by mobility restrictions due to the pandemic, restrictions and lockdown measures led to a decrease of 25% in the number of long-distance trips, to 321 million (427 million in the previous year). This decrease was greater on weekends (-35.5%) than on weekdays (-20.8%), and in light vehicles (-29.40%) than in heavy vehicles (-2.6%), which continued to supply the entire population even during the most difficult period of the pandemic.
Furthermore, there were 797 serious accidents on intercity roads in 2020, in which 870 people died and another 3,463 required hospitalization — a decrease of 21% in the number of accidents and deaths (213 fewer accidents and 231 fewer deaths) and a decrease of 22% in serious injuries (970 fewer). It should be noted that this is the lowest death figure since these data have been recorded and the first time that the number of deaths on intercity roads has been less than 1,000, a fact that must be examined within the context of the coronavirus pandemic, where mobility—and therefore loss experience related to road accidents—was reduced by 25%.
As for the number of deaths from traffic accidents, 670 people lost their lives in traffic accidents on two-lane roads, 127 fewer than in 2019. Despite this drop, this type of road continues to be the most dangerous, where the highest number of deaths is recorded (77% of total deaths). On the other hand, the
0%
20%
40%
60%
80%
100%
2007
2008
2009
2010
2011
2012
2013
2014
2015
2016
2017
2018
2019
OwnedRented at market priceRented below market priceInhabited free of charge
Chart 1.1-k Spain: breakdown of homes by type of occupancy,
2007–2019 (%)
Source: MAPFRE Economics (based on INE data)

27
THE SPANISH INSURANCE MARKET IN 2020
percentage of deaths caused by running off the road increased, from 39% in 2019 to 44% in 2020. During the first state of alarm, trucks over 3,500 kg were the only method of transport where the loss ratio increased (18 deaths in 2020 compared to 11 in 2019), going from 3% of all deaths on intercity roads between January 1 and March 14 to 15% during the state of alarm.
Business sector
Based on data currently available from the Central Business Register (CBR), there were 3,404,428 active businesses in Spain at the beginning of 2020, which is an increase of 1.2% over the previous year, according to the new statistical concept for businesses modified by the INE to offer a more relevant vision of the current product ion system ( in i t ia t i ve implemented and coordinated throughout the European Statistical System)5. The new definition of a business (implemented in 2018) underscores organizational structure, decision-making autonomy and market orientation; in other words, it accords preference to the economic aspects of units as opposed to the traditional perception, which focuses more on legal aspects.
Based on this information, as on January 1, 2020, "Industrial" was the least heavily weighted sector at 5.8%, followed by "Construction" at 12.3% and "Commercial" at 21.3%, while "Other Services" was once again the one with the highest weighting in the business population structure, representing 60.6% of the total. Seen in terms of size, the companies making up the Spanish business system are characterized by their small size, with 99.8% classified as small and medium-sized enterprises (SMEs)6. In this regard, over 1.91 million businesses (56.2% of the total) have no salaried employees, and another 907,192 (26.6%) have one or two employees. Out of all businesses with employees, those with 20 or more employees represent 4.9% of the total. Greater percentages of small businesses are found in the "Construction" and "Other Services" sectors, while large companies are concentrated in the "Industrial" sector, with 8.4% employing 20 or more employees.
In the autonomous communities, Catalonia is number one in terms of active businesses, with 18.5% of the total. Over 60% of active Spanish bus inesses are concentrated in four autonomous communities: Catalonia (18.5%), Madrid (16.2%), Andalusia (15.6%) and the
-5%
0%
5%
10%
15%
2005
2006
2007
2008
2009
2010
2011
2012
2013
2014
2015
2016
2017
2018
2019
2020
Private cars Trucks and vansMotorcycles All other vehicles
0
10,000
20,000
30,000
40,00020
05
2006
2007
2008
2009
2010
2011
2012
2013
2014
2015
2016
2017
2018
2019
2020
Private cars Trucks and vansMotorcycles Industrial tractorsBuses Other vehicles
Source: MAPFRE Economics (based on data from the Directorate-General for Traffic)
Chart 1.1-l Spain: vehicle fleet, 2005–2020
(number of vehicles, thousands; distribution structure, %)

28
THE SPANISH INSURANCE MARKET IN 2020
Valencian Community (10.9%). However, Madrid has the most businesses with over 250 employees (30.9%), followed by Catalonia (21.9%).
Based on INE statistics on commercial companies, 79,151 companies were created in 2020, 15.8% less than in 2019, in a year marked by the economic impact of the COVID-19 pandemic. Furthermore, the number of companies that were dissolved also decreased in 2020 (20,259), 13.1% less than in 2019, although the number of dissolved companies increased by 10.4% year-on-year in December 2020 alone. Capital increased in 25,195 companies in the year, 17.3% less than in 2019, and the capital subscribed in these increases dropped by 21.9%. 21.8% of the companies created were in the "Commercial" sector, while 15.2% were in "Real estate, finance and insurance". 19.4% of the dissolved companies were "Commercial", and 15.8% were “Cons-truction". Finally, the communities seeing the largest increase in new companies overall for 2020 were Madrid (17,964) and Catalonia (15,020), while the communities with the largest number of companies dissolved were Madrid (6,715) and Andalusia (3,032).
Low interest rate environment
The low interest rate environment persisted, affecting the traditional Life Savings and whole life annuities business in 2020 alongside the deep economic recession caused by the pandemic. Chart 1.1-m shows the lowest, average and highest interest rates reached during 2020, as well as the latest risk-free interest rate curves for the euro published by EIOPA corresponding to December 2020 and May 2021.
At the beginning of 2020, the Spanish insurance market found itself in an environment where the economy had begun to decelerate against a backdrop of low interest rates. In this context, the ECB was already applying accommodating monetary policies with interest rates tied to low levels (0% for main financing operations and -0.5% for deposit facilities). In addition, in
response to this deceleration (which affected Spain along with the rest of the eurozone), the ECB had reactivated the net purchase program under the asset acquisition program in the closing months of the previous year, with a net increase of 20 billion euros per month. This was the starting point before the pandemic hit. The brake on the economy caused by the implementation of social distancing and lockdown measures for the population then combined with this slowdown in activity to cause an unprecedented recession.
T h e E C B ' s re s p o n s e w a s r a p i d a n d resounding, with the massive use of unconventional monetary policy measures (in addition to those just implemented) to provide liquidity to sovereign and corporate bond markets, an additional asset acquisition program (PEPP), which was later expanded to 1.85 trillion euros and made the maximum limits that could be acquired from the various
-0.8%
-0.6%
-0.4%
-0.2%
0.0%
0.2%
0.4%
0.6%
YEARS1 2 3 4 5 6 7 8 9 10 11 12 13 14 15 16 17 18 19 20
2020 average Dec 2020 May 2021
Chart 1.1-m Eurozone: risk-free yield curve
(%)
Source: MAPFRE Economics (based on EIOPA data)
Range of minimum and maximum values in 2020

29
THE SPANISH INSURANCE MARKET IN 2020
Member States more flexible in order to increase the purchases of those that needed it most. These unconventional measures made it possible to secure financing through sovereign and corporate bond markets, ensuring their l iquidity with low risk premiums. The program is still in operation, with a timeline that will extend until the coronavirus crisis is considered over. In addition, the ECB also decided to extend the targeted long-term refinancing operations program (TLTRO III) until June 2022 in order to ensure broad liquidity conditions and maintain a high level of bank credit.
This package of measures helped to moderate the serious problems that could have resulted from the lack of liquidity in the eurozone bond markets, allowing them to continue to function properly and relaxing risk premiums. This means that companies and issuing states can continue to make their issuances, in order to access the necessary liquidity at a reasonable cost and to cope with the current situation and be able to refinance their debts. Nevertheless, as can be seen in Chart 1.1-m, the risk-free yield curve descended further into negative territory, with all of the curve's terms—even 20-year terms—affected, essentially halting the development of the traditional Life Savings and whole life annuity business for the insurance industry.
Recovery prospects have gradually improved in 2021 following considerable progress in the vaccination rate, which has reduced both the incidence of the pandemic and the number of deaths and hospitalizations and allowed the mobility restrictions that were in place to be relaxed. This improvement in prospects has been reflected in the interest rate curve, with a general upturn in market risk-free interest rates in the first four months of 2021 and a steeper gradient in the interest rate curve.
Despite the slight rebound in risk-free interest rates in the first five months of the year, they remain low, and are expected to continue to do so for a long time. This favors economic recovery and insurance activity, especially for more cyclical lines of business, but damages the traditional Life business and the profitability of insurance companies. Nevertheless, the Euro Stoxx 50 index is still performing well, which supports the development of Life insurance products where the policyholder assumes the risk of investment (unit-linked products). In addition, improving economic expectations can help this business, which is adversely affected by the preference of economic agents to remain in liquidity positions.
1.2. Demographic aspects
Demographic trends
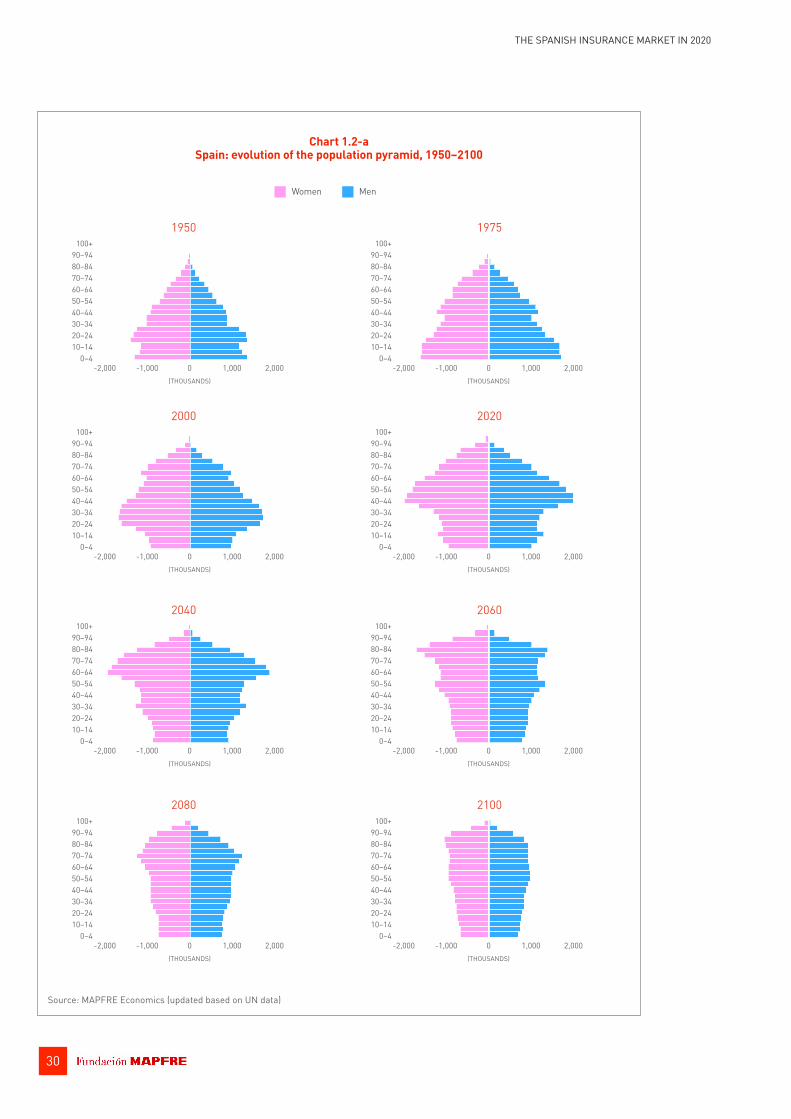
As regards demographic aspects in Spain, the population pyramids created based on the August 2019 update to United Nations (UN) data and forecasts, the latest available, continue to reflect the widespread issue of aging among the Spanish population (see Chart 1.2-a), due to the combination of high birth rates in the 1950s and 1960s, the subsequent fall in the birth rate, low mortality rates, and increased life expectancy.
According to these forecasts (which have not yet captured the possible mortality effects caused by the COVID-19 pandemic), life expectancy at birth in Spain is expected to have reached 83.4 years in 2020, compared to 78.8 years in 2000 (an increase of almost five years over a 20-year period). According to UN forecasts, life expectancy at birth among the Spanish population will reach 87 by 2050 and around 93 in 2100 (see Chart 1.2-b).
30
THE SPANISH INSURANCE MARKET IN 2020
Source: MAPFRE Economics (updated based on UN data)
Chart 1.2-a Spain: evolution of the population pyramid, 1950–2100
100+90–9480–8470–7460–6450–5440–4430–3420–2410–14
0–4
(THOUSANDS)
-2,000 -1,000 0 1,000 2,000
100+90–9480–8470–7460–6450–5440–4430–3420–2410–14
0–4
(THOUSANDS)
-2,000 -1,000 0 1,000 2,000
100+90–9480–8470–7460–6450–5440–4430–3420–2410–14
0–4
(THOUSANDS)
-2,000 -1,000 0 1,000 2,000
100+90–9480–8470–7460–6450–5440–4430–3420–2410–14
0–4
(THOUSANDS)
-2,000 -1,000 0 1,000 2,000
100+90–9480–8470–7460–6450–5440–4430–3420–2410–14
0–4
(THOUSANDS)
-2,000 -1,000 0 1,000 2,000
100+90–9480–8470–7460–6450–5440–4430–3420–2410–14
0–4
(THOUSANDS)
-2,000 -1,000 0 1,000 2,000
1950 1975
2000 2020
2040 2060
100+90–9480–8470–7460–6450–5440–4430–3420–2410–14
0–4
(THOUSANDS)
-2,000 -1,000 0 1,000 2,000
100+90–9480–8470–7460–6450–5440–4430–3420–2410–14
0–4
(THOUSANDS)
-2,000 -1,000 0 1,000 2,000
2080 2100
Women Men

31
THE SPANISH INSURANCE MARKET IN 2020
As noted in previous editions of this report, the issue of the aging population in Spain is becoming more pronounced, giving rise to a constrictive population pyramid, with no expectations of this trend being reversed (creating a stationary population pyramid) until the end of the century. Based on these population patterns and dynamics, a gradual increase in the aging population is expected over the next few years, with consequent fiscal pressures on the State as the so-called baby boomers approach retirement age.
Situation in 2020
In terms of the demographic situation, according to the preview published by the INE containing definitive data as on January 2020 (the latest available data on the publication date for this report), the Spanish population had reached 47.5 million inhabitants, of which 88.5% were Spanish and 11.5% were foreign. As shown in Chart 1.2-c, the net number of
(BIR
THS
PER
WOM
AN)
0
1
2
3
1960
–65
1975
–80
1990
–95
2005
–10
2020
–25
2035
–40
2050
–55
2065
–70
2080
–85
2095
–00
(YEA
RS)
50
60
70
80
90
100
1960
–65
1975
–80
1990
–95
2005
–10
2020
–25
2035
–40
2050
–55
2065
–70
2080
–85
2095
–00
Fertility rate Life expectancy at birth
Source: MAPFRE Economics (updated based on UN data)
Chart 1.2-b Spain: fertility rate and life expectancy at birth, 1950–2100
(MIL
LION
S OF
INH
ABIT
ANTS
)
0
10
20
30
40
50
2010
2011
2012
2013
2014
2015
2016
2017
2018
2019
2020
Spaniards Foreigners
-15%
-10%
-5%
0%
5%
10%
15%
(AN
NUA
L VA
RIAT
ION
, %)
-2%
-1%
0%
1%
2%
2010
2011
2012
2013
2014
2015
2016
2017
2018
2019
2020
TotalSpaniardsForeigners (right axis)
Source: MAPFRE Economics (based on INE data)
Chart 1.2-c Spain: population changes, 2010–2020 (distribution, millions; annual variation, %)

32
THE SPANISH INSURANCE MARKET IN 2020
Spaniards increased by 27,312 (0.07%) in 2019, while the number of foreigners increased by 397,275 (7.9%). In addition, the average age of the population registered in the Municipal Census was 43.8; 44.7 for Spaniards and 36.6 for foreigners. Lastly, Chart 1.2-d presents a breakdown of the population by age and gender, distinguishing between Spaniards and foreigners, based on definitive data published by the INE in January 2020.
Source: MAPFRE Economics (based on INE data)
Chart 1.2-d Spain: breakdown of the population by age and
gender, 2020 (structured in five-year cohorts, %)
Spainiards Foreigners
>8580-8475-7970-7465-6960-6455-5950-5445-4940-4435-3930-3425-2920-2415-1910-14
5-90-4
-5% -3% -1% 1% 3% 5%
Men
4% 5%3%2%1%0%1%2%3%4%5%
Women

2. Structure of the insurance industry
2.1. Market concentration
The analysis of the Herfindahl and CR5 indices and the changes in the number of companies operating in the Spanish insurance market show a certain trend toward market concentration, albeit remaining within limits indicating a high level of competition. Chart 2.1 shows that while the Herfindahl index stood at 550 points in 2010, by 2020 this indicator had risen to 567 points, although decreasing slightly from the previous year (582 points in 2019) and still below the theoretical threshold (1,000–1,500 points), which indicates early signs of concentration in the industry.
The CR5 index also reflects this concentration increase over the 2010–2020 period, although dropping in recent years, heavily influenced by the performance of the Life line. Chart 2.1 also clearly reflects a slight drop in premium revenue over the past four years in the five groups with the greatest share of the segment,
resulting in their market share falling by about 6 pp since 2016, to 54.7%. The first five Non-Life groups increased their share by more than 6 pp, from 40.8% in 2010 to 47.0% in the last fiscal year.
2.2. Company ranking
Total market
As can be seen in Chart 2.2-a, VidaCaixa continued to lead the ranking of the ten largest insurance groups in the Spanish market by premium volume in 2020, with revenue of 7.14 billion euros — a decrease of -16.8% compared to the previous year due to the reduction in sales activity during the state of alarm. This drop in revenue represents a 1.2-pp reduction in its market share, to 12.1%. In turn, MAPFRE retained second place with an 11.3% share, representing a drop of 0.1 pp, followed by Mutua Madrileña, which increased its premium volume by 1.3% and its market share by 0.9 pp. As for
33THE SPANISH INSURANCE MARKET IN 2020
(MAR
KET
SHAR
E, %
)
30%
40%
50%
60%
70%
2010
2011
2012
2013
2014
2015
2016
2017
2018
2019
2020
Total Life Non-Life
300
400
500
600
700
2010
2011
2012
2013
2014
2015
2016
2017
2018
2019
2020
Herfindahl index CR5 index
Source: MAPFRE Economics (based on ICEA data)
Chart 2.1 Spain: concentration indices, 2010–2020

34
THE SPANISH INSURANCE MARKET IN 2020
t h e o t h e r g ro u p s , t h e m o st n o t a b le development was the rise of Helvetia to tenth place in the ranking, after it acquired a majority share of about 70% in the Caser group. In 2019, the Swiss group was 18th in the ranking, with 449 million euros in premiums and a market share of 0.7%, but it reached 1.88 billion euros in premiums and a 3.2% share in 2020.
Non-Life market
The Non-Life segment performed positively in 2020, with premium growth of 1.1%, despite extraordinary circumstances with the outbreak of the COVID-19 pandemic. As can be seen in Chart 2.2-b, all groups in the Non-Life ranking experienced premium growth in 2020, save for a slight decrease for Allianz and Generali. The Mutua Madrileña group led the ranking of the ten largest insurance groups in the Non-Life business in Spain, with premium growth of 2.9% in 2020 and a market share of 14.6%, as a result of the positive performance of its various insurance lines, particularly Health. MAPFRE retained second place in the classification with a 13.9% share and a slight increase of 0.1%, thanks to good performance in the Health and
Multirisk lines, which made up for the drop in Automobile. As mentioned above, Helvetia's significant growth following its acquisition of a majority share in Caser is noteworthy, with the company moving to eighth place in the ranking in this market segment.
Life market
As can be seen in Chart 2.2-c, the decrease of -20.7% in Life premium volume in the Spanish insurance market is reflected in this ranking of the ten largest insurance groups in the segment, with all groups except Ibercaja recording a drop in premiums in 2020 VidaCaixa continued to lead the classification in 2020, increasing its share by 1.5 pp to 32.6%, despite a decrease of -16.8% in its premium revenue. The major reasons for this decrease were the reduction in sales activity during the state of alarm and the continued low interest rate environment.
Source: MAPFRE Economics (based on ICEA data)
Chart 2.2-a Spain: overall ranking of insurance groups by premium volume, 2019–2020
(millions of euros)
VidaCaixa
MAPFRE
Mutua Madrileña
Catalana Occidente
Allianz
AXA
Zurich
Generali
Santalucía
Helvetia
0 3,000 6,000 9,000
1,883
2,147
2,249
2,469
2,880
2,998
3,019
5,526
6,673
7,144
2020 2019
-2,000 -1,000 0 1,000 2,000
1,434.1
-308.5
-191.6
-485.2
-72.4
-431.7
-32.3
71.6
-662.0
-1,437.9
2019–2020 variation

35
THE SPANISH INSURANCE MARKET IN 2020
Source: MAPFRE Economics (based on ICEA data)
Chart 2.2-b Spain: overall ranking of Non-Life insurance groups by premium volume, 2019–2020
(millions of euros)
Mutua Madrileña
MAPFRE
Allianz
AXA
Catalana Occidente
Generali
Sanitas
Helvetia
Asisa
Santalucía
0 1,500 3,000 4,500 6,000
1,230
1,258
1,425
1,442
1,577
2,229
2,245
2,369
5,161
5,419
2020 2019
-400 0 400 800 1,200
21.2
48.0
1,064.7
45.5
-13.6
4.7
29.3
-79.1
5.4
150.2
2019–2020 variation
Source: MAPFRE Economics (based on ICEA data)
Chart 2.2-c Spain: overall ranking of Life insurance groups by premium volume, 2019–2020
(millions of euros)
VidaCaixa
MAPFRE
Zurich
Ibercaja
Santalucía
Santander Seguros
Catalana Occidente
Generali
BBVA Seguros
AXA
0 3,000 6,000 9,000
634
656
672
790
806
918
958
1,436
1,512
7,125
2020 2019
-2,000 -1,000 0 1,000
-101.7
-273.1
-178.1
-37.0
-856.0
-329.7
19.8
-461.6
-667.4
-1,437.0
2019–2020 variation

36
THE SPANISH INSURANCE MARKET IN 2020
Managed savings
With respect to the 2020 ranking of the volume of technical provisions, Chart 2.2-d shows the ten insurance groups with the highest volume of savings managed that year (by their business in Spain). This ranking is led by VidaCaixa, with 56.81 billion euros in Life insurance technical provisions, representing a 29.3% share. MAPFRE ranks second with 16.97 billion euros in provisions and an 8.7% share. The ranking of the groups has hardly changed from the previous year, except for Allianz dropping three places from seventh to tenth, due to the sale of its share in Allianz Popular Vida to Banco Santander, and Ibercaja and Catalana Occidente moving up one and two places respectively. Managed savings only increased in three groups, and decreased in the others.
2.3. Insurance market structure
Insurance companies
Due to the consolidation that has taken place in the Spanish insurance industry over the last few years , the number o f insurance companies has been decreasing, as can be
seen in Chart 2.3-a, which shows that by March 2020 there were 69 fewer companies than in 2010. Factors that have influenced this process include the reorganization of bancassurance agreements made by some banks following mergers with other credit institutions, as well as the entry into force of the Solvency II regulation, with insurance companies seeking a more appropriate size to deal with these new quantitative and qualitative requirements.
At the end of March 2020, the Registro Administrativo de Entidades Aseguradoras (administrative register of insurance companies — RAEA) reported the existence of 207 insurance companies in the Spanish market, five fewer than in March 2019. Their legal structure can be broken down as follows: 126 limited liability companies, 30 mutual companies, and 47 mutual provident societies (MPS) (under the control of the General Directorate for Insurance and Pension Funds [DGSFP]), as well as 4 specialized reinsurance companies.
As for the reorganization processes under way in the bancassurance alliances, an agreement was signed in 2019 allowing for MAPFRE Vida to
Source: MAPFRE Economics (based on ICEA data)
Chart 2.2-d Spain: overall ranking of insurance groups by Life technical provisions, 2019–2020
(millions of euros)
VidaCaixa
MAPFRE
Santander Seguros
BBVA Seguros
Zurich
Mutualidad de la Abogacía
Ibercaja
Catalana Occidente
Santalucía
Allianz
0 20,000 40,000 60,000
6,450
6,542
6,669
7,002
8,405
10,224
12,089
13,649
16,972
56,811
2020 2019
-1,500 0 1,500 3,000
-990.0
-36.2
125.1
-377.7
456.6
-274.3
-719.0
-1,214.1
-624.9
2,074.4
2019–2020 variation

37
THE SPANISH INSURANCE MARKET IN 2020
acquire 51% of Caja Granada Vida and Cajamurcia Vida y Pensiones. Bankia MAPFRE Vida and the companies Caja Granada Vida and Cajamurcia Vida merged on December 31, 2020. The Life business is managed through Bankia MAPFRE Vida, of which MAPFRE has a 51% shareholding. The takeover of Bankia by Caixabank would spur the application of the contractual clause for change of control over Bankia, which grants MAPFRE the option to leave the alliance.
Furthermore, throughout 2020, Banco Santander reorganized the bancassurance business that it acquired with the purchase of Banco Popular. At the beginning of 2020, Banco Santander completed the purchase of the 60% share it needed to control 100% of Allianz Popular Holding, created by the alliance between Banco Popular and the insurer Allianz and made up of three companies: Allianz Popular Vida, Allianz Popular Pensiones and Allianz Popular Asset Management. Subsequently, in July, Aegon acquired 51% of the Life Protection insurance business run by Banco Santander and 51% of the Banco Popular network's new general P&C business not transferred to MAPFRE (as per the agreement between the two companies). In addition, in December 2020, the Spanish Ministry of Economic Affairs and Digital Transformation authorized the transfer
of Popular Vida's 2020 Life Savings insurance portfolio to Santander Seguros.
As mentioned above, one important transaction was Helvetia's acquisition of a majority holding (around 70%) in the insurer Caser. With this operation, Helvetia significantly increased its market share and position with regard to its competitors in Spain, boosted its significant Non-Life business even further, and increased its sales capacity.
Finally, in April 2020, BBVA and Allianz signed an agreement for a bancassurance joint venture, including a long-term exclusive distribution agreement for the sale of Non-Life products (excluding Health) through BBVA's banking network in Spain.
International presence of Spanish insurers
Table 2.3 and Chart 2.3-b rank the four largest internationally active Spanish insurance groups in terms of global premium volume. This information illustrates the extent to which Spanish insurance groups are internationalized. The data refer to 2019 and 2020, and compare domestic business and total business (including international business).
Source: MAPFRE Economics (based on DGSFP data) * For 2019 and 2020, the data is as on March 31 of each year.
Chart 2.3-a Spain: number of companies by legal structure, 2010–2020
(number of companies)
2010
2011
2012
2013
2014
2015
2016
2017
2018
2019
2020
0 100 200 300
Limited liability companies Mutual companiesMutual provident societies Reinsurance companies
Limited liability companies
Mutual companies
MPS
Reinsurance companies
-80 -60 -40 -20 0 20
2
-8
-5
-69
2010–2020 variation

38
THE SPANISH INSURANCE MARKET IN 2020
When ranking by total premium, MAPFRE holds first place with a premium volume of 20.48 billion euros in 2020, although this is 11.1% lower than in 2019 as a result of the global economic situation due to the COVID-19 crisis. It should be noted that in addition to the global shutdown in economic activity, the volume of business was affected by the depreciation of major currencies in the emerging markets where the group operates.
VidaCaixa came in second place, with 7.19 billion euros in direct insurance and accepted reinsurance earned premiums in 2020, 17.1% less than in 2019. VidaCaixa is part of CaixaBank and also possesses 49.92% of SegurCaixa Adeslas, along with the full share capital of the Portuguese company BPI Vida e Pensões, which it acquired in 2017. BPI Vida e Pensões recorded 538 million euros in direct insurance premiums in 2020, compared to 831 million in 2019, positioning it in third place in Portugal's total Life premium ranking.
Insurance group
2019 2020
Global premiums
(millions of euros) (structure, %)
Global premiums
(millions of euros) (structure, %)
Premiums in
Spain
Premiums outside of
Spain
Premiums in
Spain
Premiums outside of
Spain
Premiums in
Spain
Premiums outside of
Spain
Premiums in
Spain
Premiums outside of
Spain
MAPFRE 23,044 7,335 15,709 31.8% 68.2% 20,482 6,673 13,809 32.6% 67.4%
VidaCaixa 8,672 8,582 90 99.0% 1.0% 7,188 7,144 44 99.4% 0.6%
Mutua Madrileña Group 5,467 5,455 12 99.8% 0.2% 5,585 5,526 59 99.0% 1.0%
Catalana Occidente Group 4,414 3,051 1,363 69.1% 30.9% 4,431 3,019 1,412 68.1% 31.9%
Table 2.3 Ranking of main internationally active Spanish insurance groups by total insurance premiums at a global
level, 2020 (millions of euros)
Source: MAPFRE Economics (with data from the annual reports and SFCRs of the groups listed and ICEA)
Source: MAPFRE Economics (with data from the annual reports and SFCRs of the groups listed and ICEA)
Chart 2.3-b Ranking of main internationally active Spanish insurance groups by premium volume, 2020
(millions of euros)
MAPFRE
VidaCaixa
Mutua Madrileña Group
Catalana Occidente Group
0 6,000 12,000 18,000 24,000
4,414
5,467
8,672
23,044
4,431
5,585
7,188
20,482
2020 2019
0% 20% 40% 60% 80%
31.9%
1.0%
0.6%
67.4%
Premiums outside of Spain (% of total in 2020)

39
THE SPANISH INSURANCE MARKET IN 2020
It should be noted that MAPFRE and VidaCaixa are the Spanish insurers selected by EIOPA to participate in the 2021 stress test for the European insurance market. The 2021 stress test focuses on a prolonged COVID-19 scenario, in a lower and longer interest rate environment, and will assess the resistance of its participants to adverse capital and liquidity-related sce-narios to provide supervisors with information on whether insurers can resist severe but plausible shocks. These insurance groups have been selected based on size, market coverage throughout the European Union, the lines of business offered (Life and Non-Life business), the number of jurisdictions represented and, secondly, coverage of the local market. Overall, the object sample, defined in cooperation with the competent national authorities, covers 75% of the European Economic Area based on total Solvency II assets.
The third group in the ranking, Mutua Madrileña, reached 5.59 billion euros in direct insurance and accepted reinsurance written premiums in 2020, with an increase of 3.6% in the Non-Life segment at 5.47 billion euros, and a drop of 37.3% in the Life line. International expansion is one of the group's key strategic pillars for the coming years set out in its geographic, channel and product diversification model. In 2020, Mutua Madrileña increased its participation in the Chilean group Bci Seguros to 60% and formalized its 45% participation in the Colombian company Seguros del Estado, after obtaining authorizations from the competent authorities and regulatory bodies.
The Catalana Occidente Group, which holds fourth place in this ranking, is an insurance multinational operating in more than 50 countries through more than 50 companies. The total volume of earned premiums from direct insurance and accepted reinsurance for fiscal year 2020 was 4.43 billion euros, a slight increase of 0.4%. Positive performance in tradit ional business, namely Multirisk insurance, partially offset the decrease in credit insurance. The Life segment in turn performed well, with turnover increasing by 8.7%, including the Antares business, for the entire fiscal year.
As for the international activity of other Spanish groups, although Santalucía mainly operates in Spain, the group is committed to internation-alizing its business at the strategic level, signing agreements and forming alliances that allow it to export its business models to other markets, such as Burial insurance, which provides funeral services and services concen-trating on the elderly. Santalucía is currently active in Burial insurance in Portugal (through an alliance with Fidelidade), Argentina (where it is distributed through Santalucía Argentina), Colombia (via an agreement with Fundación Grupo Social for distribution of Burial and Assistance insurance through Colmena) and Chile (where it is sold through Bice Vida). Allocated premiums from international business reached 10.3 million euros in 2020.
Asisa operates primarily in Spain, where it provides insurance and assistance activity throughout almost the entire country, but it is growing internationally through new initiatives in various regions. Its operations extend to several countries in Europe, Latin America and the Near East, primarily in the assistance area. In 2020, it was involved in insurance activity in the Life and Non-Life areas in Portugal, operating as a branch. The group's objective is to reproduce the comprehensive health service model that it has developed in the Spanish market in Portugal over the medium-term.
The insurance operations of Banco Santander come under its Wealth Management & Insurance division. In 2020, its focus was on increasing business unrelated to credit and expanding distribution through digital channels. Its Automobile business continues to perform well in Latin America, working with various insurers and new mobility products. In Europe, through its joint venture with MAPFRE, it has launched a Multir isk insurance offering for SMEs in Spain and Portugal and improved its digital services in the United Kingdom and Portugal. It has a gross written premium volume of 7.9 billion euros (down 3% compared to 2019), affected by lower lending and savings activity due to the crisis.

40
THE SPANISH INSURANCE MARKET IN 2020
The premiums written by BBVA Seguros reached a total of 1.13 billion euros for all BBVA insurance activity in Spain in 20207, -21% less than in the previous fiscal year. This is explained by the drop in activity during the COVID-19 lockdown period, reduced sales of individual savings insurance due to the continuing low interest rate environment and the transfer of the Non-Life business to the new company BBVA Allianz Seguros. BBVA has insurance operations outside of Spain in Mexico, Argentina, Colombia, Venezuela and Turkey. In 2020, its subsidiaries in Mexico (Seguros BBVA Bancomer, BBVA Bancomer Seguros Salud , and Pens iones BBVA Bancomer), its main foreign market, recorded 53.37 billion pesos in premiums (2.18 billion dollars), a slight decrease of -0.8%.
CESCE is the flagship for a group of companies that offer comprehensive solutions for commercial credit management and in issuing surety and guarantees in part of Europe and Latin America. In the area of business for its own account, CESCE's volume of earned premiums from direct insurance and accepted reinsurance was 133.8 million euros in Spain, compared to 122.7 million in the previous year. CESCE has more subsidiaries in Latin America than anywhere else, with five, and one branch in Portugal, where its overall premium volume is about 53 million euros.
Finally, AMA Seguros, a Spanish company that specializes in providing insurance to health professionals, has been present in Ecuador for six years as AMA América. The insurer had a premium volume of 2.2 million dollars in the country at the end of 2020.
Spanish companies active in the European Economic Area
As on December 31, 2019, based on the latest DGSFP data available, there were 47 branches
(53 in 2018) operating under the right of establishment in the countries in the European Economic Area (EEA), corresponding to 15 Spanish insurance companies. The country of establishment with the largest number of branches was Portugal (11), followed by Italy (6) and the United Kingdom (4). The United Kingdom exited the European Union on January 31, 2020, marking the start of a transition period that ran until December 31, 2020. After this date, any British companies that wished to continue operating in Spain would have to comply with the regulation for third countries, unless an agreement was reached between the United Kingdom and the European Union. As a result, as on January 1, 2021, insurance companies and insurance intermediaries domiciled in the United Kingdom (including Gibraltar) were no longer authorized to operate in Spain.
As of the end of 2019 there were 53 Spanish companies operating under the freedom to provide services in the EEA, one fewer than in 2018, with Portugal and the United Kingdom still leading with the most companies, followed by Germany and France. Direct insurance and accepted reinsurance gross premiums from these operations amounted to 3.93 billion euros in 2019 (latest data available), with 88% corresponding to Spanish branches in the EEA mainly in the Non-Life business (2.8 billion euros). The companies operating under the freedom to provide services regime recorded 476 million euros. The largest markets in terms of total business were the United Kingdom, France, Portugal and Italy, in that order.

41
THE SPANISH INSURANCE MARKET IN 2020
Foreign investment in the Spanish insurance industry
According to the latest DGSFP data, 21 companies in Spain had foreign capital in 2019, one less than the previous year. The amount of subscribed capital from foreign investors totaled 1.17 billion euros (compared to 1.1 billion in 2018), representing 12.89% of the sector's total capital (11.87% in 2018). It is worth noting that the ranking of companies operating in Spain, shown in part 2.2 of this section of the report, indicates the extent to which large international insurance groups are present in Spain.
Furthermore, as at December 31, 2019 (latest data available) there were 83 branches of EEA country companies and 2 branches of third country companies operating in Spain. At the end of 2018 (latest data available), there were 856 companies authorized to operate in Spain under the freedom to provide services regime, although not all of them were actually conducting operations in Spain. The direct insurance and accepted reinsurance premium volume totaled 5.36 billion euros in 2018 (latest data available), 7.5% more than the previous year, while the premiums issued in companies operating under both the freedom to provide
services regime and the right of establishment increased by 10.8% and 5.8% respectively.
Mutual provident societies
Finally, mutual provident societies are non-profit private insurance companies that offer a voluntary insurance modality in addition to the compulsory social security system, and can also act as alternatives to the social security regime for self-employed workers. In this sector, 219 mutual provident societies belonging to al l professional sectors participate, either directly or through autonomous federations, in the Spanish Confederation of Mutual Societies, the largest ent i t y represent ing mutual provident societies in Spain. Premium revenue was 2.62 billioneuros in 2020. In addition, the volume of managed assets at the end of 2020 totaled 49.44 billion euros, compared to 46.72 billion euros in 2019.
2.4. Distribution channels
Regarding distribution channels in the Spanish insurance market, according to the latest information available from the DGSFP, there were a total of 75,440 insurance intermediaries in Spain as on December 31, 2019 (-3.4% less
(TH
OUSA
NDS
)
0
20,000
40,000
60,000
80,000
100,000
2009
2010
2011
2012
2013
2014
2015
2016
2017
2018
2019
Registered with the DGSFP Autonomous Communities
0
1,500
3,000
4,500
6,000
2009
2010
2011
2012
2013
2014
2015
2016
2017
2018
2019
Source: MAPFRE Economics (based on DGSFP data)
Chart 2.4-a Spain: number of insurance intermediaries, 2009–2019
(insurance brokers and agents)
Insurance agents Insurance brokers

42
THE SPANISH INSURANCE MARKET IN 2020
than in 2018), with 96.8% registered with the DGSFP and remaining 3.2% registered with the Autonomous Communities (see Chart 2.4-a). Of these, 69,670 were exclusive agents and operators; 523 were tied bancassurance agents and operators, and 5,175 were insurance brokers. Lastly, as at the end of 2019, there were also a total of 72 reinsurance brokers.
Regarding the evolution of the intermediary business, with a more detailed breakdown by channel between 2008 and 2018 (period available with this level of detail), which is shown in Charts 2.4-b and 2.4-c, in the case of the Non-Life insurance segment, the main channels over the last few years were, on the one hand, exclusive agents and brokers (both of these coming to 58.1% of the total volume of business in 2018) and, on the other, sales through the companies' own offices (19.7% of all business in 2018). Emerging channels (such as online sales) continue to represent a relatively small portion of Non-Life insurance distribution, not even reaching 2% in 2018.
As regards the Life insurance segment, the most significant part of the business has been channeled through exclusive and tied bancassurance operators, with exclusive operators increasing their share from 24.7% to 34.9% during the period under analysis, and tied operators decreasing their share from 40.2% to 29.2%. The main channels are exclusive agents, company offices, brokers, and tied agents, in that order. Online sales in this line remain negligible.
Finally, Tables 2.4-a and 2.4-b provide the latest available data for the above-mentioned period on the structure of product distribution by channel in the Spanish insurance industry, for both the Non-Life and Life segments.
0
20
40
60
80
100
2008
2009
2010
2011
2012
2013
2014
2015
2016
2017
2018
Exclusive Agents Tied AgentsExclusive bancassurance operators Tied bancassurance operatorsBrokers Company officesInternet portals Other channels
Chart 2.4-b Spain: percentage distribution of the Non-Life
business portfolio by channel (%)
Source: MAPFRE Economics (based on DGSFP data)
0
20
40
60
80
100
2008
2009
2010
2011
2012
2013
2014
2015
2016
2017
2018
Exclusive Agents Tied AgentsExclusive bancassurance operators Tied bancassurance operatorsBrokers Company officesInternet portals Other channels
Chart 2.4-c Spain: percentage distribution of the Life business
portfolio by channel (%)
Source: MAPFRE Economics (based on DGSFP data)

43
THE SPANISH INSURANCE MARKET IN 2020
Channel 2008 2009 2010 2011 2012 2013 2014 2015 2016 2017 2018
Exclusive Agents 35.7 35.7 34.4 34.0 33.0 32.0 33.3 38.6 39.7 33.2 33.7
Tied Agents 1.8 0.6 1.1 1.3 1.6 1.7 1.7 2.2 2.1 2.2 2.5
Exclusive bancassurance operators 2.6 1.9 2.4 2.8 2.8 3.4 4.1 5.1 6.1 5.8 5.9
Tied bancassurance operators 6.3 6.9 7.3 7.4 7.3 7.0 6.8 10.3 10.2 6.8 7.1
Brokers 28.5 26.7 25.0 24.8 24.8 24.4 23.0 16.9 17.3 25.2 24.4
Company offices 19.4 21.3 21.7 21.1 21.7 22.5 22.4 20.3 18.1 20.6 19.7
Internet portals 0.8 0.9 1.1 1.5 1.7 1.9 2.1 2.2 1.6 1.5 1.9
Other channels 5.1 5.9 7.1 7.1 7.2 7.1 6.7 4.6 5.0 4.9 4.7
Total 100.0 100.0 100.0 100.0 100.0 100.0 100.0 100.0 100.0 100.0 100.0
Table 2.4-a Non-Life: business distribution structure by channel
(%)
Source: MAPFRE Economics (based on DGSFP data)
Channel 2008 2009 2010 2011 2012 2013 2014 2015 2016 2017 2018
Exclusive Agents 13.9 12.5 12.5 12.4 13.4 14.8 16.6 15.8 15.7 14.9 15.8
Tied Agents 0.4 0.2 0.5 0.3 0.3 0.5 0.7 1.0 0.9 0.6 0.5
Exclusive bancassurance operators 24.7 28.9 32.5 29.9 29.4 23.8 24.6 23.4 25.3 39.6 34.9
Tied bancassurance operators 40.2 37.4 36.5 41.5 40.4 39.3 38.0 44.5 44.4 27.8 29.2
Brokers 6.3 8.1 8.4 6.7 5.9 8.6 8.4 5.4 4.9 6.9 8.4
Company offices 11.9 10.4 6.7 7.8 9.2 11.6 10.6 7.9 6.7 9.0 10.0
Internet portals 0.0 0.0 0.0 0.2 0.0 0.1 0.1 0.4 0.6 0.2 0.2
Other channels 2.7 2.6 2.8 1.2 1.4 1.4 1.2 1.6 1.5 1.0 1.0
Total 100.0 100.0 100.0 100.0 100.0 100.0 100.0 100.0 100.0 100.0 100.0
Table 2.4-b Life: business distribution structure by channel
(%)
Source: MAPFRE Economics (based on DGSFP data)


3. The insurance market in 2020: an analysis of the main business lines
3.1. Total market
The global insurance business in 2020
The global insurance industry was affected by the effects of the COVID-19 pandemic in 2020, resulting in a decrease in premium revenue in many of the most advanced markets and some of the emerging ones, if you exclude the positive performance of the Chinese insurance market. Premium volume worldwide was 6.3 trillion dollars, a decrease of -1.3% in real terms compared to the increase of 3.0% recorded in 2019.
The Life segment has been affected more severely by the crisis caused by the pandemic, mainly in savings products, with another year of persistent low interest rates and a decrease in real terms of -4.4% in written premiums. Unit-linked insurance products were affected by market volatility at the beginning of the year, but began to recover in the second half. The drop occurred in both advanced and emerging markets, excluding China, which saw an increase in real terms of 2.8%, measured in dollars. Insurance markets in the EMEA region sustained the greatest fall (-9.1%).
Non-Life insurance, on the other hand, proved resistant to the crisis, and underwriting was not stalled, largely due to the acceleration of digitization processes. Non-Life premium volume was 3.5 trillion dollars, a year-on-year increase of 1.5% in real terms. The Health line has been the line of business that has grown the most overall in the markets (driven by health risk aversion), while Automobile insurance has been one of the lines most affected by the crisis, with decreases in premium revenue but also lower loss experience due to the lockdown measures adopted by governments to address the COVID-19 pandemic. Asia-Pacific markets experienced better performance, driven by the growth of the Chinese market.
In order to provide a general overview of the comparative size of the main insurance markets, Table 3.1-a shows a comparison of premium volumes, density (premiums per capita), and penetration (premiums/GDP) in the main international insurance markets. According to this information, the Spanish market holds 14th place in the ranking of world markets by premium volume, behind Hong Kong.
45THE SPANISH INSURANCE MARKET IN 2020
Country
Premiums (billions of
dollars)
Premiums per capita
(dollars)
Premiums /GDP
(%)
United States 2,530.6 7,673 12.0%
China 655.9 455 4.5%
Japan 414.8 3,280 8.1%
Great Britain 338.3 4,523 11.1%
Germany 258.6 3,108 6.8%
France 231.3 3,317 8.6%
South Korea 193.7 3,741 11.6%
Italy 162.0 2,692 8.6%
Canada 143.5 3,775 8.7%
Taiwan 113.3 4,800 17.4%
India 108.0 78 4.2%
Netherlands 87.5 5,022 9.6%
Hong Kong 73.1 9,746 20.8%
Spain 66.3 1,396 5.2%
Australia 62.8 2,448 4.7%
World 6,287.0 809 7.4%
Table 3.1-a Size of the world's largest insurance markets,
2020 (indicators)
Source: MAPFRE Economics (based on Swiss RE data)

46
THE SPANISH INSURANCE MARKET IN 2020
The Spanish insurance industry in 2020
Increase in premium volume
In a year marked by the crisis caused by the COVID-19 pandemic, the Spanish insurance industry recorded a drop in premium volume of -8.2% in 2020 (see Chart 3.1-a), due to a significant decrease in Life business (-20.7%) and a slight increase in the Non-Life segment (1.1%). Table 3.1-b shows how the major Non-Life lines of business break down in terms of premium volume, showing increases (with the exception of Automobile, which dropped by -2%), including a marked increase in Health (5.1%), a line that is always highly resilient in economic crises, especially health crises.
Automobile insurance continues to be the line that contributes the highest premium volume in Non-Life insurance (29.9%), although its share has fallen by 6.4 pp in the last decade, from 36.3% in 2010. The amount of premiums issued in this line totaled 11.09 billion euros in 2020, representing a year-on-year decline of -2.0% (see aforementioned Table 3.1-b). Considering that the average premium decreased by -2.8% to 346.50 euros, the decrease can be attributed to this premium reduction and not the number of insured vehicles, which grew by 0.8% to 32 million. Lastly, 2020's 3.5% increase in new
vehicle sales must be taken into account. These vehicles represent higher sales of high-end products and higher average premiums, although this percentage shows a downward trend recording the largest drop in recent years.
Contrary to what is happening in the Automobile line, Health insurance has gradually increased its market share to 25.3% currently, becoming the second largest Non-Life line since 2009. This line of insurance continued to perform well in 2020, with the premium volume issued increasing by 5.1% to 9.39 billion euros. 70.3% of the line's allocated premiums were in personal insurance, although there has been a trend toward collectivizing health coverage over recent years, with an increase of 5.3% in collective insurance in 2020, while personal coverage has grown by 4.7%. The line continued to be affected by the pandemic in the first few months of 2021, and some effects that had been forecasted at the end of 2020 were observed: fewer cancelations, continued increase in new medical insurance business (over and above the usual in the period) and a considerable increase in health costs with policyholders that delayed non-urgent medical care no longer waiting to seek treatment.
(BIL
LION
S OF
EUR
OS)
0
10
20
30
40
50
60
70
2010
2011
2012
2013
2014
2015
2016
2017
2018
2019
2020
Non-Life Life
-30%
-20%
-10%
0%
10%
20%
30%
2010
2011
2012
2013
2014
2015
2016
2017
2018
2019
2020
Total Life Non-Life
Source: MAPFRE Economics (based on ICEA data)
Chart 3.1-a Trends in direct insurance in Spain, 2010–2020
(earned premiums from direct insurance, billions of euros; annual variation, %)

47
THE SPANISH INSURANCE MARKET IN 2020
Lines 2019 2020% change from
2019 % of total
Total 64,176 58,889 -8.2% 100.00%
Life 27,523 21,837 -20.7% 37.08%
Non-Life 36,652 37,052 1.1% 62.92%
Automobiles 11,312 11,086 -2.0% 18.83%
Automobile TPL 5,875 5,658 -3.7% 9.61%
Automobile Other Guarantees 5,437 5,428 -0.2% 9.22%
Health 8,935 9,388 5.1% 15.94%
Healthcare Assistance 7,912 8,336 5.4% 14.16%
Illness 1,023 1,052 2.9% 1.79%
Multirisk 7,521 7,753 3.1% 13.17%
Homeowners 4,529 4,653 2.7% 7.90%
Commercial 602 604 0.3% 1.03%
Condominium 926 953 2.8% 1.62%
Industrial 1,385 1,463 5.6% 2.48%
Other 79 81 3.0% 0.14%
Burial 2,459 2,491 1.3% 4.23%
Third-Party Liability 1,598 1,639 2.6% 2.78%
Accidents 1,152 1,123 -2.5% 1.91%
Other Damage to P&C 1,292 1,283 -0.7% 2.18%
Credit 607 602 -0.8% 1.02%
Transport 498 523 5.1% 0.89%
Hull 243 266 9.6% 0.45%
Merchandise 255 257 0.7% 0.44%
Assistance 461 339 -26.4% 0.58%
Pecuniary losses 375 318 -15.3% 0.54%
Fire 181 228 26.0% 0.39%
Legal defense 109 112 2.7% 0.19%
Surety 122 136 11.0% 0.23%
Theft 30 30 2.2% 0.05%
Table 3.1-b Distribution of business by lines, 2019–2020
(earned premiums from direct insurance, millions of euros)
Source: MAPFRE Economics (based on ICEA data)

48
THE SPANISH INSURANCE MARKET IN 2020
Multirisk insurance maintained its position as the third Non-Life line by premium volume, with a share of 20.9% in 2020 and revenue of 7.75 billion euros in premiums, 3.1% higher than in the previous year. The modalities with the largest premium volume, Homeowners and Industrial, performed very well with increases of 2 .7% and 5.6% respect ively, whi le Condominium and Commercial premiums also rose, with respective increases of 2.8% and 0.3%.
Burial insurance remained the next Non-Life line in terms of premium volume, with revenue of 2.49 billion euros in 2020, an increase of 1.3%, which was lower than that recorded in the previous fiscal year (3.9%) and the medium-term results for the last ten years. Its performance was affected by weeks of lockdown measures in place during March and April and by the increase in the number of deaths during the pandemic. It should be noted that the growth rates that have been observed in recent years originated in the rise of the single premium. While this modality accounts for only 4% of new business policies, its premium amount exceeds 60% of new contracts.
Lastly, the Life insurance premium volume for 2020 was 21.84 billion euros, a decrease of -20.7% compared to the previous year, with drops in both Life Protection insurance (-0.4%) and Life Savings insurance (-25%). This negative effect is due to the sharp drop in economic activity and the ongoing low interest rate environment, except in unit-linked products, which grew by 1.1%. Only long-term care products performed positively, increasing by 17.9%, although the premium volume was only 8 million euros. In terms of managed savings, technical provisions decreased by 0.3% to 194.11 billion euros, ending the trend of increases that had been ongoing for more than a decade. The number of policyholders also fell
by 1.6% overall, with a major drop in Life Savings (-5%) and Life Protection (-0.1%) products.
Contribution to growth from different business lines
Using a medium-term (2010–2020) analysis, it is clear that it has been Non-Life insurance that has made the greatest contribution to the growth of the Spanish insurance industry over the last decade, contributing 8.6 pp, while the Life business has made a negative contribution of -8.8 pp. Specifically, 2020 saw the industry shrink by 8.2 pp, due to a negative contribution of -8.9 pp from Life insurance and a positive contribution of 0.6 pp from Non-Life lines (see Table 3.1-c and Chart 3.1-b).
The structure of the negative contribution of the Life insurance segment during 2020 was specifically affected by the negative contribution from the Life Savings line (-8.8 pp) and Life Protection insurance (-0.03 pp). This makes four years in a row that the Life sector has made a negative contribution to the Spanish market, driven by the decrease in the Life Savings segment, while Life Protection has shown more stable performance (see Table 3.1-d).
As regards Non-Life insurance, the Multirisk and Health lines both made a positive contribution to growth in 2020, at 0.4 and 0.7 pp respectively (see the aforementioned Table 3.1-d). As mentioned above, Health insurance is a line that has proven to be highly resilient during economic crises, especially in this health-related crisis. On the other hand, the contribution of Automobile insurance to Non-Life performance was negative, at -0.4 pp, caused, among other factors, by the decrease in the average premium and slower growth in new vehicle sales. The rest of the Non-Life lines overall made a negative contribution to growth
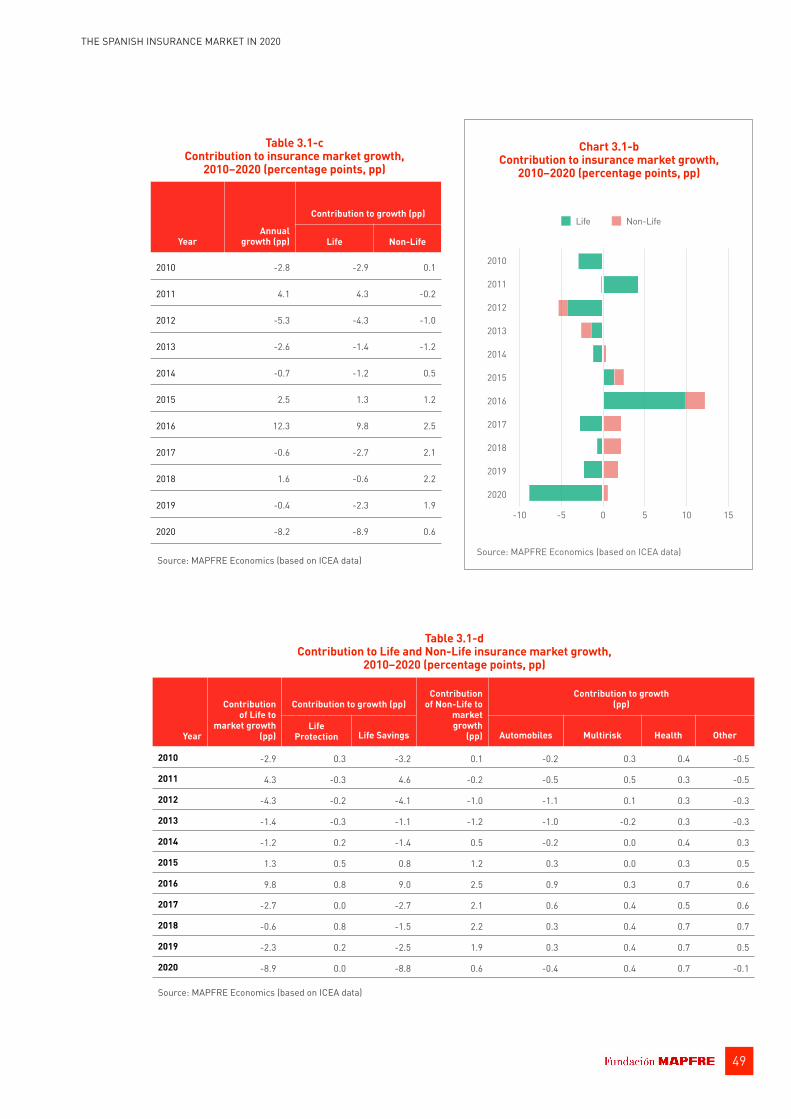
49
THE SPANISH INSURANCE MARKET IN 2020
2010
2011
2012
2013
2014
2015
2016
2017
2018
2019
2020
-10 -5 0 5 10 15
Life Non-Life
Chart 3.1-b Contribution to insurance market growth,
2010–2020 (percentage points, pp)
Source: MAPFRE Economics (based on ICEA data)
YearAnnual
growth (pp)
Contribution to growth (pp)
Life Non-Life
2010 -2.8 -2.9 0.1
2011 4.1 4.3 -0.2
2012 -5.3 -4.3 -1.0
2013 -2.6 -1.4 -1.2
2014 -0.7 -1.2 0.5
2015 2.5 1.3 1.2
2016 12.3 9.8 2.5
2017 -0.6 -2.7 2.1
2018 1.6 -0.6 2.2
2019 -0.4 -2.3 1.9
2020 -8.2 -8.9 0.6
Table 3.1-c Contribution to insurance market growth,
2010–2020 (percentage points, pp)
Source: MAPFRE Economics (based on ICEA data)
Year
Contribution of Life to
market growth (pp)
Contribution to growth (pp)Contribution
of Non-Life to market growth
(pp)
Contribution to growth (pp)
Life Protection Life Savings Automobiles Multirisk Health Other
2010 -2.9 0.3 -3.2 0.1 -0.2 0.3 0.4 -0.5
2011 4.3 -0.3 4.6 -0.2 -0.5 0.5 0.3 -0.5
2012 -4.3 -0.2 -4.1 -1.0 -1.1 0.1 0.3 -0.3
2013 -1.4 -0.3 -1.1 -1.2 -1.0 -0.2 0.3 -0.3
2014 -1.2 0.2 -1.4 0.5 -0.2 0.0 0.4 0.3
2015 1.3 0.5 0.8 1.2 0.3 0.0 0.3 0.5
2016 9.8 0.8 9.0 2.5 0.9 0.3 0.7 0.6
2017 -2.7 0.0 -2.7 2.1 0.6 0.4 0.5 0.6
2018 -0.6 0.8 -1.5 2.2 0.3 0.4 0.7 0.7
2019 -2.3 0.2 -2.5 1.9 0.3 0.4 0.7 0.5
2020 -8.9 0.0 -8.8 0.6 -0.4 0.4 0.7 -0.1
Table 3.1-d Contribution to Life and Non-Life insurance market growth,
2010–2020 (percentage points, pp)
Source: MAPFRE Economics (based on ICEA data)

50
THE SPANISH INSURANCE MARKET IN 2020
of -0.1 pp. The analysis in Table 3.1-d shows that Health and Multirisk insurance have also contributed positively to growth in the last decade (5.3 and 2.7 pp respectively), while Automobile's contribution has been negative (-1 pp).
Technical performance: combined ratio performance
Notwithstanding the greater detail shown below when analyzing the various business lines of the Spanish insurance market, Chart 3.1-c presents the aggregate technical performance of the Spanish insurance industry over the
(%)
0
20
40
60
80
100
120
2010
2011
2012
2013
2014
2015
2016
2017
2018
2019
2020
Loss ratioAdministration expense ratioAcquisition expense ratio
2010–20112011–20122012–20132013–20142014–20152015–20162016–20172017–20182018–20192019–2020
-6 -4 -2 0 2 4 6 8
-4.0
6.3
-3.1
-0.7
-3.5
-0.1
1.3
3.2
1.2
-1.5
Source: MAPFRE Economics (based on ICEA data)
Chart 3.1-c Trends in the total combined ratio, 2010–2020
(total combined ratio, %; annual change in combined ratio, pp)
Annual change in combined ratio (pp)
(%)
0
20
40
60
80
100
2010
2011
2012
2013
2014
2015
2016
2017
2018
2019
2020
Loss ratioAdministration expense ratioAcquisition expense ratio
2010–20112011–20122012–20132013–20142014–20152015–20162016–20172017–20182018–20192019–2020
-3 -2 -1 0 1 2
-2.4
-0.8
-0.3
0.4
-1.2
0.8
-0.7
1.4
0.6
-1.2
Source: MAPFRE Economics (based on ICEA data)
Chart 3.1-d Trends in the Non-Life combined ratio, 2010–2020
(total combined ratio, %; annual change in combined ratio, pp)
Annual change in combined ratio (pp)

51
THE SPANISH INSURANCE MARKET IN 2020
2010–2020 period, based on the trend in the total combined ratio. When taken into account for the entire insurance market, this information shows that the combined ratio reached 104.0% in 2020, an improvement of -4.0 pp compared to 2019 (108.0%), due to a drop of 7.1 pp in the loss ratio and an increase of 3.1 pp in expenses; the loss ratio was 85.4% (92.4% in 2019), the administration expense ratio was 4.2% (3.5% in 2019), and the acquisition expense ratio was 14.4% (12.1% in 2019).
That said, the combined ratio for the Non-Life insurance segment during 2020 was 90.5%, 2.4 pp less than the figure recorded for 2019 (92.9%), thanks to the loss ratio dropping -3.6 pp to 67% (see Chart 3.1-d). Furthermore, the administration expense ratio was 5.3% (a reduction of 0.3 pp), while the acquisition expense ratio was 18.1% (increasing by 0.9 pp).
Results and profitability
The Spanish insurance industry recorded a result of 5.8 billion euros in 2020, an increase of 16.6% compared to the previous year. It should be noted that the technical account result increased by 7.3%, as shown in Table 3.1-e, due to improvements in the Non-Life line, which offset the decrease in the Life business.
The technical account for the Non-Life segment posted a result of 4.17 billion euros in 2020, an increase of 20.2% compared to the previous fiscal year, with the drop in the loss ratio being reflected in the improved combined ratio and the financial result coming in at 0.5 pp less than in 2019, placing the final technical-financial result at 12.1% of allocated premiums — an increase of 1.9 pp compared to the previous year (see Table 3.1-f).
Year 2019 2020Percentage
variation
Technical account 5,863 6,291 7.3%
Life 2,397 2,125 -11.4%
Non-Life 3,466 4,166 20.2%
Non-technical account 4,970 5,797 16.6%
Table 3.1-e Spanish insurance industry results, 2019–2020
(results, millions of euros)
Source: MAPFRE Economics (based on ICEA data)
2019 2020
Premium volume issued (millions of euros) 36,652 37,052
Variation in premiums 3.5% 1.1%
Retention 85.6% 85.3%
Gross loss ratio 69.4% 66.1%
Gross expenses 22.9% 23.7%
Net loss ratio 70.7% 67.0%
Net combined ratio 92.9% 90.5%
Financial result 3.1% 2.6%
Technical-financial result 10.2% 12.1%
Table 3.1-f Basic Non-Life insurance indicators, 2019–2020
(premiums, millions of euros; ratio over premiums, %)
Source: MAPFRE Economics (based on ICEA data)
2019 2020
Premium volume issued (millions of euros) 27,523 21,837
Variation in premiums -5.1% -20.7%
Technical provisions (millions of euros) 194,786 194,110
Net expenses (over provisions) 1.1% 1.1%
Financial result (over provisions) 4.9% 3.8%
Technical-financial result (over provisions) 1.2% 1.1%
Table 3.1-g Basic Life insurance indicators, 2019–2020
(premiums, millions of euros; ratio over premiums, %)
Source: MAPFRE Economics (based on ICEA data)

52
THE SPANISH INSURANCE MARKET IN 2020
The technical account for the Life insurance segment posted a result of 2.13 billion euros in 2020, down -11.4% on the previous year. This decrease, coupled with a lower financial result, caused the technical-financial result to drop slightly to 1.1% of technical provisions in 2020, 0.1 pp less than the previous year (see Table 3.1-g). Life insurance technical provisions totaled 194.11 bi l l ion euros in 2020, representing a slight decrease of -0.3% compared to 2019.
In terms of performance, insurance activity changed the downward trend seen in the past two years in 2020, recording a ROE of 11.99%, 1.08 pp more than in 2019 (see Chart 3.1-e). Likewise, industry profitability, measured in terms of return on assets (ROA), also showed a slight increase (0.17 pp), at 1.60% in 2020 compared to 1.42% in 2019 (see Chart 3.1-f).
0%
5%
10%
15%
20%
2010
2011
2012
2013
2014
2015
2016
2017
2018
2019
2020
ROE
2010–20112011–20122012–20132013–20142014–20152015–20162016–20172017–20182018–20192019–2020
-6 -4 -2 0 2 4
1.08
-0.47
-0.58
1.27
1.85
-3.55
-0.33
-2.26
-0.35
-0.70
Source: MAPFRE Economics (based on ICEA data)
Chart 3.1-e Trends in ROE, 2010–2020
(return on equity, %; annual change in ROE, pp)
Annual change in ROE (pp)
0%
1%
2%
3%
2010
2011
2012
2013
2014
2015
2016
2017
2018
2019
2020
ROA
2010–20112011–20122012–20132013–20142014–20152015–20162016–20172017–20182018–20192019–2020
-0.75 -0.50 -0.25 0.00 0.25 0.50
0.17
-0.06
-0.14
0.16
0.25
-0.47
-0.08
-0.07
0.06
-0.06
Source: MAPFRE Economics (based on ICEA data)
Chart 3.1-f Trends in ROA, 2010–2020
(return on assets, %; annual change in ROA, pp)
Annual change in ROA (pp)

53
THE SPANISH INSURANCE MARKET IN 2020
Investments
Total investment by Spanish insurance companies amounted to 335.61 billion euros in 2020, representing a 1.9% increase on the previous year. An analysis of the investment portfolio breakdown by type of assets shows that fixed income securities have increased their relative weight over the 2010–2020 period, from 63.5% in 2010 to 74.9% in 2020. The percentage of assets held as cash or deposits decreased to 6.5% in 2020, compared to 13.7% in 2010. Equity investments had dropped -0.3 pp between 2009 and 2012, but now seem to be back on track toward recovery, reaching 5.7% in 2020, the highest in the last ten years (see Chart 3.1-g). An analysis of the investment structure at the end of 2020 is shown in Chart 3.1-h, showing that sovereign fixed income is predominant in the category of fixed income assets, representing 55% of the investment portfolio.
0%
20%
40%
60%
80%
100%
2010
2011
2012
2013
2014
2015
2016
2017
2018
2019
2020
Fixed income EquityCash and deposits Real estateMutual funds Other investments
Chart 3.1-g Trends in investment structure in the insurance
market, 2010–2020 (%)
Source: MAPFRE Economics (based on ICEA data)
Chart 3.1-h Structure of investments relating to technical
provisions, 2020 (%)
Source: MAPFRE Economics (based on ICEA data) * Net value after deducting the effect of the valuation on derivative and structured products (-1.14%).
0.6%
10.0%
3.5%
6.5%
5.7%
55.0%
18.7%
Corporate fixed income*Sovereign fixed incomeEquityCash and depositsReal estateMutual fundsMortgages and other creditDerivative and structured products (-1.14%)
0%
20%
40%
60%
80%
100%
2010
2011
2012
2013
2014
2015
2016
2017
2018
2019
2020
Traditional business portfolioUnit-linked business portfolio
Chart 3.1-i Trends in the Life insurance business portfolio,
2010–2020* (%)
Source: MAPFRE Economics (based on EIOPA data) *Data for the third quarter of the year (latest available)

54
THE SPANISH INSURANCE MARKET IN 2020
Corporate fixed income represented 19.8% of the portfolio. These average percentages also varied according to the sub-portfolios into which the total investment portfolio can be divided. In these sub-portfolios, investment decisions differed depending on the different requirements in relation to their liquidity and the matching of flows between assets and liabilities. Within portfolios linked to Life insurance commitments, f ixed income accounted for 78.2% of investments, while in Non-Life portfolios, it represented around 39.3%. There were also significant variations in the percentage of investments in real estate and equities, which, in Life portfolios, represented around 2.4% and 2.8% respectively, far below the percentages in Non-Life portfolios (both 14.6%). Finally, the percentage of investments managed through mutual funds was also significantly lower in Life portfolios, where they represented around 7%, compared to 20% in Non-Life.
In terms of the overall risk profile of the investment portfolios related to Life and Non-Life insurance obligations, the duration of assets in Life portfolios is notably higher than in Non-Life portfolios, with around 38.5%
and 11.2% of assets having a duration of over ten years, respectively. In both cases, most investment credit ratings were on the second rung of the ratings map included under Solvency II regulations, in line with the Spanish sovereign risk rating at the end of 2020 (A).
Moreover, it should be noted that Spain's insurance market has one of the lowest shares of unit-linked product portfolios in the eurozone. As can be seen in Chart 3.1-i, this share has remained stable over the last decade, at just 7.5% in 2020, although it appears to be beginning to increase its weight in the portfolio as a whole.
The insurance industry's financial investments posted a return of 3.3% in 2020 (0.9 pp less than the previous year), continuing the downward trend that was kickstarted by the drop in risk-free interest rates as a result of the ultra-accommodative monetary policy adopted by the ECB following the 2012 sovereign debt crisis in the eurozone, and that will now continue for longer thanks to the overlap with the expansive measures adopted in response to the COVID-19 pandemic (see Chart 3.1-j).
-2
0
2
4
6
8
2010
2011
2012
2013
2014
2015
2016
2017
2018
2019
2020
3 months* 6 months* 1 year*5 years* 10 years* Insurance industry
(%)
0
1
2
3
4
5
2010
2011
2012
2013
2014
2015
2016
2017
2018
2019
2020
Return on financial investments
Source: MAPFRE Economics (based on DGSFP data) *Average annual Spanish Government bond yield of specified tenor.
Chart 3.1-j Return on the insurance industry's financial investments, 2010–2020
(financial income/average investment, %; risk-free interest rate, %)

THE SPANISH INSURANCE MARKET IN 2020
55
Finally, it is important to note that the medium-term performance of the investment portfolio was marked by the entry into force of the Solvency II Directive in 2016, which changed the capital requirements for investments based on implicit risk. The entry into force of new capital requirements brought about a change in perceptions regarding investment portfolios, which until 2015, had only included assets used to hedge technical provisions, widening the scope to other portfolios from that year onward, as the new requirements were applicable to all investments, including the portfolio of assets corresponding to insurance companies' own funds.
Technical provisions
Life insurance technical provisions fell slightly by -0.3% to 194.11 billion euros, ending the sustained growth seen over the last decade. The reason for this was the drop in Life Savings products, while Life Protection and Long-Term Care products performed positively. Life insurance technical provisions represented 81.0% of total technical provisions, while provisions for outstanding benefits represented 9.7%, and provisions for unearned premiums and unexpired risks were 6.5% of the total (see Chart 3.1-k).
Practically all Life Savings modalities decreased, with the exception of unit-linked products and individual long-term savings insurance. In specific terms, deferred income and capital products total 71% of provisions; during the fiscal year under review, their performance was positive with drops of -1.0% and -2.6%, respectively.
However, the modality that grew the most in technical provisions in 2020 was once again the unit-linked modality, which grew by 12.5%, accumulating a savings volume of 16.02 billion euros. This indicates that the negative trend in interest rates obliges the unitholder to seek an extra return on their investments.
Insurance developments in the Autonomous Communities
As shown in Table 3.1-h, the decrease in premiums in the Spanish insurance market in 2020 is reflected in the performance of the ten Autonomous Communities with the largest market share, where there were decreases in premium volume in 2020, the largest being in the Community of Madrid at -11.4%. Nevertheless, the Community of Madrid continues to have the largest market share at 21.9%, with a premium volume of 11.09 billion euros, followed by Catalonia with
(BIL
LION
S OF
EUR
OS)
0
50
100
150
20020
10
2011
2012
2013
2014
2015
2016
2017
2018
2019
2020
Provisions for life insurance
2.9%
9.7%81.0%
6.5%
Provisions for unearned premiumsProvisions for life insuranceProvisions for outstanding benefitsOther technical provisions
Source: MAPFRE Economics (based on ICEA data)
Chart 3.1-k Life insurance technical provisions, 2010–2020
(billions of euros)
2020
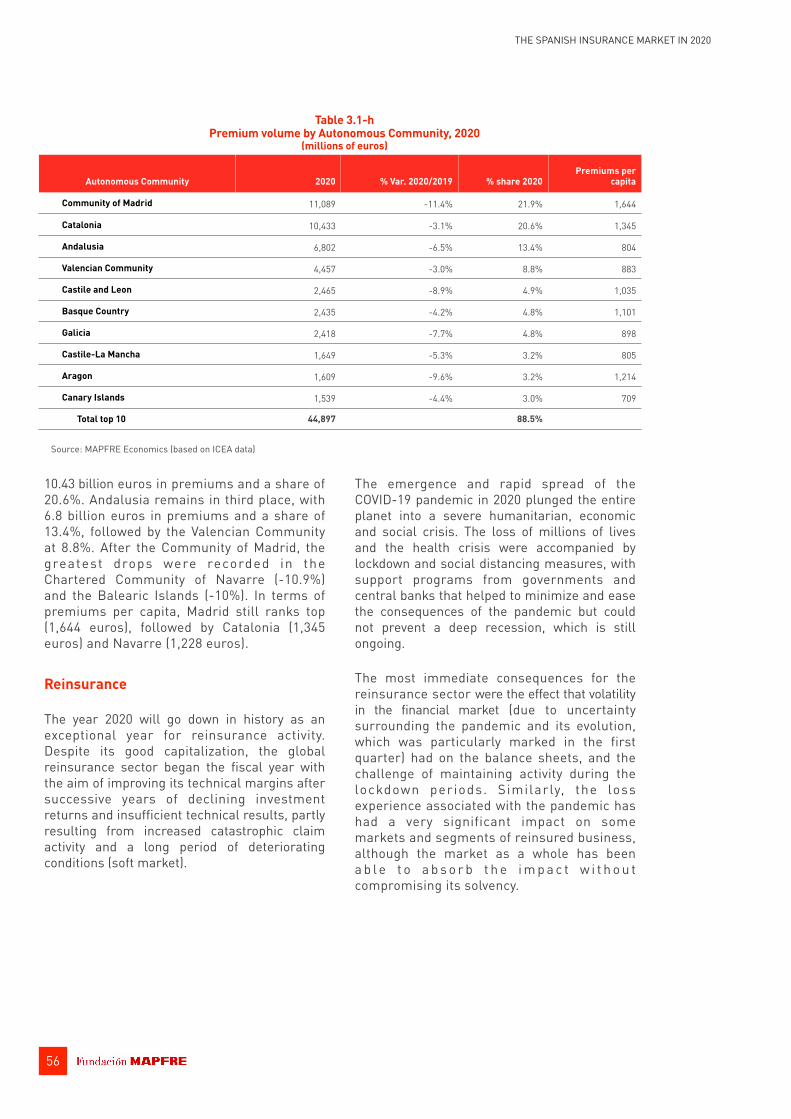
56
THE SPANISH INSURANCE MARKET IN 2020
10.43 billion euros in premiums and a share of 20.6%. Andalusia remains in third place, with 6.8 billion euros in premiums and a share of 13.4%, followed by the Valencian Community at 8.8%. After the Community of Madrid, the greatest drops were recorded in the Chartered Community of Navarre (-10.9%) and the Balearic Islands (-10%). In terms of premiums per capita, Madrid still ranks top (1,644 euros), followed by Catalonia (1,345 euros) and Navarre (1,228 euros).
Reinsurance
The year 2020 will go down in history as an exceptional year for reinsurance activity. Despite its good capitalization, the global reinsurance sector began the fiscal year with the aim of improving its technical margins after successive years of declining investment returns and insufficient technical results, partly resulting from increased catastrophic claim activity and a long period of deteriorating conditions (soft market).
The emergence and rapid spread of the COVID-19 pandemic in 2020 plunged the entire planet into a severe humanitarian, economic and social crisis. The loss of millions of lives and the health crisis were accompanied by lockdown and social distancing measures, with support programs from governments and central banks that helped to minimize and ease the consequences of the pandemic but could not prevent a deep recession, which is still ongoing.
The most immediate consequences for the reinsurance sector were the effect that volatility in the financial market (due to uncertainty surrounding the pandemic and its evolution, which was particularly marked in the first quarter) had on the balance sheets, and the challenge of maintaining activity during the lockdown periods. Similarly, the loss experience associated with the pandemic has had a very significant impact on some markets and segments of reinsured business, although the market as a whole has been a b l e t o a b s o r b t h e i m p a c t w i t h o u t compromising its solvency.
Autonomous Community 2020 % Var. 2020/2019 % share 2020Premiums per
capita
Community of Madrid 11,089 -11.4% 21.9% 1,644
Catalonia 10,433 -3.1% 20.6% 1,345
Andalusia 6,802 -6.5% 13.4% 804
Valencian Community 4,457 -3.0% 8.8% 883
Castile and Leon 2,465 -8.9% 4.9% 1,035
Basque Country 2,435 -4.2% 4.8% 1,101
Galicia 2,418 -7.7% 4.8% 898
Castile-La Mancha 1,649 -5.3% 3.2% 805
Aragon 1,609 -9.6% 3.2% 1,214
Canary Islands 1,539 -4.4% 3.0% 709
Total top 10 44,897 88.5%
Table 3.1-h Premium volume by Autonomous Community, 2020
(millions of euros)
Source: MAPFRE Economics (based on ICEA data)

57
THE SPANISH INSURANCE MARKET IN 2020
The situation has not been much different in Spain. The end of the year saw a slight increase in Non-Life premium growth, although uncertainty remained regarding developments in 2021. The trend toward a high frequency of severe events continued, putting pressure on the reinsurance income statement, with necessary modifications to conditions in 2021 renewals. Despite the excess mortality related to COVID-19, the Life Protection segment kept its margins within acceptable levels . Together wi th the necessary modifications to the economic conditions in these contracts, the other major matter of interest in reinsurance renewals was the introduction of exclusion clauses for infectious diseases and the inclusion or revision of clauses to limit cyber risks.
Activity of the Insurance Compensation Consortium
As a public business entity belonging to the Spanish Ministry of Economics and Business, the ICC carries out numerous key functions in the Spanish insurance industry through the DGSFP. These include extraordinary risk coverage, obligatory automobile insurance, combined agricultural insurance, and the liquidation of insurance companies.
With regard to two of the ICC's main activities (the coverage of extraordinary risks and traffic risks that involve direct Third-Party Liability Automobile insurance and the guarantee fund) , the premiums and surcharges attributed to these activities amounted to 810 million euros in 2020, a reduction of -1.8% compared to 2019, caused by a drop of -1.9% in extraordinary risks and -1.4% in traffic risks. This continues the trend seen in recent years whereby the number of vehicles insured by the ICC that are not covered by private companies is decreasing, while premiums for vehicles under official entities increased slightly by 0.5% (see Table 3.1-i).
In 2020, the loss ratio for direct insurance and accepted reinsurance under extraordinary risk coverage was 55.9% of premiums, and the combined ratio was 62.5%. One factor that should be noted is Storm Gloria, which occurred in January 2020 and cost the ICC 219 million euros at fiscal year-end and resulted in over 52,000 case files. In addition to this damage, the unusual cyclone events that occurred throughout the year should also be taken into account. The loss ratio for third-party liability automobile insurance equaled 64% of premiums.
General activityPremiums and surcharges attributed Loss ratio (direct and accepted)
2019 2020 2019 2020
Extraordinary risks 733.1 719.2 773.7 402.4
P&C 667.7 654.3 769.9 385.1
People 16.3 14.8 1.3 0.8
Pecuniary losses 49.1 50.1 2.6 16.5
Traffic risks 92.0 90.7 59.2 58.1
SOA Guarantee Fund 83.2 82.1 49.2 48.0
Private vehicles 0.5 0.4 0.3 0.6
Official vehicles 8.3 8.3 9.7 9.5
Table 3.1-i Activity of the Insurance Compensation Consortium, 2019–2020
(millions of euros)
Source: Annual Report of the ICC
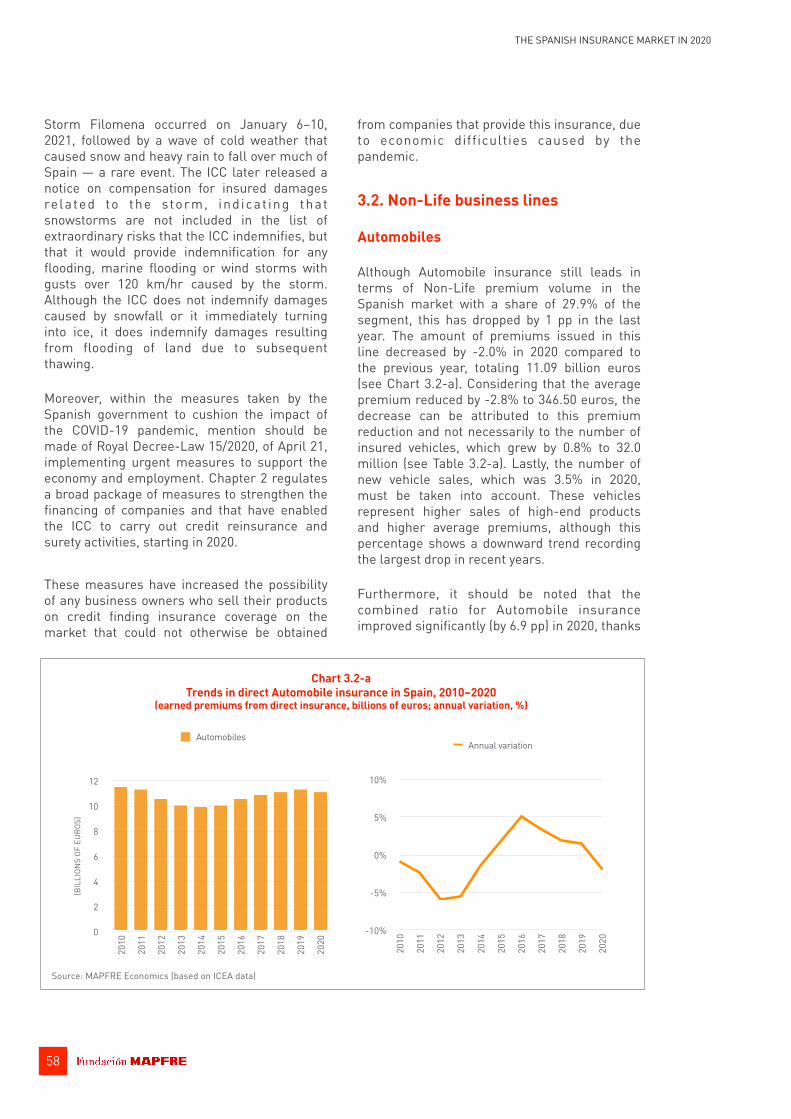
58
THE SPANISH INSURANCE MARKET IN 2020
Storm Filomena occurred on January 6–10, 2021, followed by a wave of cold weather that caused snow and heavy rain to fall over much of Spain — a rare event. The ICC later released a notice on compensation for insured damages related to the storm, ind icat ing that snowstorms are not included in the list of extraordinary risks that the ICC indemnifies, but that it would provide indemnification for any flooding, marine flooding or wind storms with gusts over 120 km/hr caused by the storm. Although the ICC does not indemnify damages caused by snowfall or it immediately turning into ice, it does indemnify damages resulting from flooding of land due to subsequent thawing.
Moreover, within the measures taken by the Spanish government to cushion the impact of the COVID-19 pandemic, mention should be made of Royal Decree-Law 15/2020, of April 21, implementing urgent measures to support the economy and employment. Chapter 2 regulates a broad package of measures to strengthen the financing of companies and that have enabled the ICC to carry out credit reinsurance and surety activities, starting in 2020.
These measures have increased the possibility of any business owners who sell their products on credit finding insurance coverage on the market that could not otherwise be obtained
from companies that provide this insurance, due to economic difficulties caused by the pandemic.
3.2. Non-Life business lines
Automobiles
Although Automobile insurance still leads in terms of Non-Life premium volume in the Spanish market with a share of 29.9% of the segment, this has dropped by 1 pp in the last year. The amount of premiums issued in this line decreased by -2.0% in 2020 compared to the previous year, totaling 11.09 billion euros (see Chart 3.2-a). Considering that the average premium reduced by -2.8% to 346.50 euros, the decrease can be attributed to this premium reduction and not necessarily to the number of insured vehicles, which grew by 0.8% to 32.0 million (see Table 3.2-a). Lastly, the number of new vehicle sales, which was 3.5% in 2020, must be taken into account. These vehicles represent higher sales of high-end products and higher average premiums, although this percentage shows a downward trend recording the largest drop in recent years.
Furthermore, it should be noted that the combined ratio for Automobile insurance improved significantly (by 6.9 pp) in 2020, thanks
(BIL
LION
S OF
EUR
OS)
0
2
4
6
8
10
12
2010
2011
2012
2013
2014
2015
2016
2017
2018
2019
2020
Automobiles
-10%
-5%
0%
5%
10%
2010
2011
2012
2013
2014
2015
2016
2017
2018
2019
2020
Annual variation
Source: MAPFRE Economics (based on ICEA data)
Chart 3.2-a Trends in direct Automobile insurance in Spain, 2010–2020
(earned premiums from direct insurance, billions of euros; annual variation, %)

59
THE SPANISH INSURANCE MARKET IN 2020
Year
Insured vehicles (1)
Direct insurance premiums (2)
Average premium
In euros
% variation
(millions) Annual variation (millions of euros) Annual variation Nominal Real
2010 28.7 -0.3% 11,553 -0.9% 402.5 -0.6% -3.5%
2011 28.9 0.8% 11,285 -2.3% 390.1 -3.1% -5.4%
2012 28.7 -0.7% 10,622 -5.9% 369.8 -5.2% -7.9%
2013 28.6 -0.4% 10,033 -5.5% 350.8 -5.1% -5.4%
2014 28.8 0.7% 9,891 -1.4% 343.4 -2.1% -1.1%
2015 29.1 1.1% 10,061 1.7% 345.4 0.6% 0.6%
2016 29.8 2.4% 10,574 5.1% 354.4 2.6% 1.0%
2017 30.6 2.6% 10,932 3.4% 357.1 0.8% -0.3%
2018 31.5 2.7% 11,146 2.0% 354.4 -0.8% -1.9%
2019 31.8 1.0% 11,321 1.6% 356.3 0.5% -0.3%
2020 32.0 0.8% 11,095 -2.0% 346.5 -2.8% -2.3%
Source: MAPFRE Economics (based on FIVA, ICEA and Insurance Compensation Consortium data) (1) Fichero Informativo de Vehículos Asegurados (FIVA — Information Database for Insured Vehicles) (2) Direct Insurance premiums for insurance companies & ICC
Table 3.2-a Trends in average Automobile insurance premiums, 2010–2020
(millions of euros; annual variation, %)
2019 2020
Premium volume issued (millions of euros) 11,312 11,086
Variation in premiums 1.6% -2.0%
Retention 86.2% 86.9%
Gross loss ratio 74.8% 64.6%
Gross expenses 19.0% 22.4%
Net loss ratio 75.9% 65.2%
Net combined ratio 94.7% 87.8%
Financial result 3.4% 2.4%
Technical-financial result 8.7% 14.6%
Table 3.2-b Basic Automobile insurance indicators, 2019–2020
(premiums, millions of euros; ratio over premiums, %)
Source: MAPFRE Economics (based on ICEA data)
0%
20%
40%
60%
80%
100%
2010
2011
2012
2013
2014
2015
2016
2017
2018
2019
2020
Net combined ratio Net loss ratioNet expenses Technical-financial resultFinancial result
Chart 3.2-b Results performance in the Automobile insurance
line, 2010–2020 (indicators over premiums)
Source: MAPFRE Economics (based on ICEA data)

60
THE SPANISH INSURANCE MARKET IN 2020
to the exceptional situation caused by lockdown measures implemented in response to the COVID-19 pandemic, in which consumers used their vehicles less, thereby reducing loss experience. As a result, the combined ratio for 2020 was 87.8%, an extraordinary result compared to performance over recent years (see Chart 3.2-b and Table 3.2-b).
As noted above, automobile claim frequency dropped significantly in 2020 (see Table 3.2-c), with decreases in personal injuries and material damages (-0.54 pp and -1.85 pp respectively) and a greater drop in damage to own vehicle coverage (-6.65 pp). However, there was an increase in the average cost of personal injury (7.5%) and damage to own vehicle (2.8%) coverage.
2021 outlook
The year 2021 has been marked so far by the gradual slowdown of the effect of the COVID-19 pandemic, which saw normal act iv i ty interrupted during the lockdown period. As such, as the economy picks up pace again, the insurance industry is gradually returning to
pre-pandemic levels. The situation over the past year (uncertainty, temporary furlough schemes, lack of business viability, etc.) has posed new chal lenges for insurance companies. These include advances in electric vehicles, which are assuming a more significant position and are driving the automobile fleet toward a more clean and efficient type of vehicle, and for which the insurance industry must offer innovative solutions.
Furthermore, the increasing digitization of society is transforming the industry via three fundamental pillars: the use of data to create value for the client, the emergence of Insurtech as a driver of innovation, and the use of new advanced driver-assistance systems to improve road safety.
Finally, the most recent data on the first five months of 20218 show a decrease in year-on-year growth in Automobile insurance, with premiums dropping by -0.9%. This result is worse than that seen by all Non-Life lines, which experienced an increase of 2.2% during the same period.
GuaranteesFrequency (%) Average cost (euros)
2019 2020Variation
(pp) 2019 2020Variation
(%)
Third-Party Liability 8.2% 6.1% -2.18 1,744 1,783 2.3%
Bodily injury 1.8% 1.2% -0.54 4,542 4,880 7.5%
Material 7.1% 5.2% -1.85 892 911 2.1%
Damage to own vehicle 27.7% 21.0% -6.65 787 810 2.8%
Broken windshield 6.2% 5.3% -0.88 310 327 5.6%
Theft 0.6% 0.5% -0.13 929 872 -6.1%
Legal defense 1.5% 1.2% -0.33 304 280 -7.9%
Occupants 0.3% 0.2% -0.08 999 1,067 6.8%
Fire 0.1% 0.1% -0.01 3,132 3,167 1.1%
Driver's license suspended 0.0% 0.0% 0.00 802 852 6.3%
Source: MAPFRE Economics (based on ICEA data)
Table 3.2-c Frequencies and average costs by guarantee in Automobile insurance, 2019–2020
(frequency, %; average cost, euros)

61
THE SPANISH INSURANCE MARKET IN 2020
Health
2020 was marked by the coronavirus pandemic, which impacted the Health line in various ways. First of all, healthcare assistance and reimbur-sement insurance provided extraordinary coverage for the pandemic, for both hospital admissions and outpatient treatment, despite all companies excluding epidemics in their general conditions. This was done as part of the
general commitment made by the insurance industry and via the Unión Española de Entidades Aseguradoras y Reaseguradoras (Spanish Associat ion of Insurers and Reinsurers — UNESPA) to support everyone affected by the pandemic. Secondly, there was a significant increase in new business due to the heightened sensitivity of the general public to health (health risk aversion). Thirdly, there was
(BIL
LION
S OF
EUR
OS)
0
2
4
6
8
1020
10
2011
2012
2013
2014
2015
2016
2017
2018
2019
2020
Health
0%
2%
4%
6%
8%
2010
2011
2012
2013
2014
2015
2016
2017
2018
2019
2020
Annual variation
Source: MAPFRE Economics (based on ICEA data)
Chart 3.2-c Trends in direct Health insurance in Spain, 2010–2020
(earned premiums from direct insurance, billions of euros; annual variation, %)
2019 2020
Premium volume issued (millions of euros) 8,935 9,388
Variation in premiums 4.9% 5.1%
Retention 97.4% 97.4%
Gross loss ratio 79.4% 75.8%
Gross expenses 12.8% 13.2%
Net loss ratio 80.6% 77.0%
Net combined ratio 93.4% 90.2%
Financial result 0.6% 0.6%
Technical-financial result 7.3% 10.4%
Table 3.2-d Basic Health insurance indicators, 2019–2020
(premiums, millions of euros; ratio over premiums, %)
Source: MAPFRE Economics (based on ICEA data)
0%
20%
40%
60%
80%
100%
2010
2011
2012
2013
2014
2015
2016
2017
2018
2019
2020
Net combined ratio Net loss ratioNet expenses Technical-financial resultFinancial result
Chart 3.2-d Results performance in the Health insurance line,
2010–2020 (indicators over premiums)
Source: MAPFRE Economics (based on ICEA data)

62
THE SPANISH INSURANCE MARKET IN 2020
a decrease in claims arising from illnesses not related to the virus during the lockdown period, with these costs thereby being deferred and later substantially increasing with the easing of the pandemic. Fourthly, an increase in claims in indemnification insurance, both for companies that decided to provide exceptional cover for work absences due to the coronavirus and for the reduced control over work absences caused by social security, as resources had to be focused on treatment for COVID-19 patients. Fifthly, additional services were provided to the groups most affected in the form of donations to scientific associations and hospitals, discounts for SMEs and the self-employed, and free hospitalization indemnification insurance for health care workers. Sixthly, there was a general increase in average benefit expenses in the last quarter of the year, especially hospital expenses, with health protocols in admissions requiring PCR tests and all the new protective equipment (personal protective equipment, gloves, etc.) And finally, all the major companies have consolidated the digital services they offer to their clients. It is now common for policyholders to be able to have medical consultations by video, chat with medical professionals online, download test results and medical reports, have online appointments with large hospital chains, and manage their policies via their companies' websites or specific mobile applications for this type of insurance, which have improved significantly in a very short period of time.
Due to all of the above, Health insurance once again performed positively in 2020, with premium volume issued increasing by 5.1% to 9.39 billion euros (see Chart 3.2-c). Healthcare Assistance, which accounted for 89% of the premiums in the line, saw the greatest increase, at 5.4%, compared to 2.9% for the Illness modality. In addition, it should be noted that the trend of recent years toward the collectivization of Health insurance continued in 2020, as collective insurance grew by 5.3%, while individual insurance increased by just
4.7%. Nevertheless, 70.3% of the line's allocated premiums are still concentrated in individual insurance.
The line's result improved in 2020 compared to the previous year due to the decrease in the loss ratio, which fell by 3.6 pp, while expenses increased slightly (0.5 pp), resulting in a combined ratio of 90.2%, compared to 93.4% in 2019. A good technical results combined with the financial result staying at 0.6% produced a technical-financial result totaling 10.4% of premiums, a 3.1-pp improvement on the previous year (see Table 3.2-d and Chart 3.2-d).
2021 outlook
The most recent data on the first five months of 2021 show resistance to the growth in Health insurance, with premiums increasing by 4.5% year-on-year. Despite this, the performance of the Health line was clearly affected by the pandemic in the first few months of the year, and some effects that had been forecasted at the end of 2020 materialized. Firstly, the number of cancelations dropped, especially in policies paid for by companies, who see that under current circumstances this is not the best time to consider changes in an area as sensitive as medical insurance. Secondly, the increase in new business for medical insurance—above what is normal during this period—continued. The general public appears to be becoming more and more aware of the need to have private medical insurance, especially after the collapse of the public health system at the worst points of the pandemic. The percentage of insured people is increasing in all the autonomous communities. And lastly, there was a pronounced increase in health costs; with the pandemic starting more than a year ago, policyholders that put off seeking non-urgent medical care can no longer delay it, and the loss ratio is expected to increase significantly this year compared to 2020.
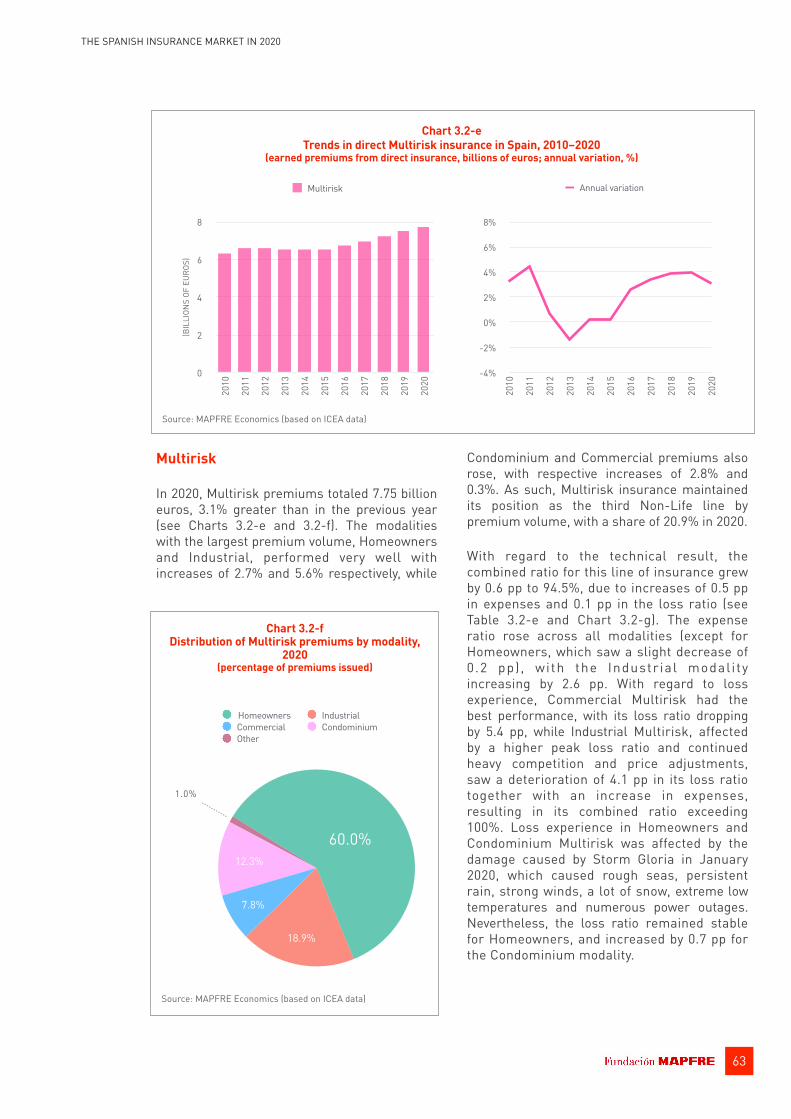
63
THE SPANISH INSURANCE MARKET IN 2020
Multirisk
In 2020, Multirisk premiums totaled 7.75 billion euros, 3.1% greater than in the previous year (see Charts 3.2-e and 3.2-f). The modalities with the largest premium volume, Homeowners and Industrial, performed very well with increases of 2.7% and 5.6% respectively, while
Condominium and Commercial premiums also rose, with respective increases of 2.8% and 0.3%. As such, Multirisk insurance maintained its position as the third Non-Life line by premium volume, with a share of 20.9% in 2020.
With regard to the technical result, the combined ratio for this line of insurance grew by 0.6 pp to 94.5%, due to increases of 0.5 pp in expenses and 0.1 pp in the loss ratio (see Table 3.2-e and Chart 3.2-g). The expense ratio rose across all modalities (except for Homeowners, which saw a slight decrease of 0.2 pp) , with the Industr ial modal i ty increasing by 2.6 pp. With regard to loss experience, Commercial Multirisk had the best performance, with its loss ratio dropping by 5.4 pp, while Industrial Multirisk, affected by a higher peak loss ratio and continued heavy competition and price adjustments, saw a deterioration of 4.1 pp in its loss ratio together with an increase in expenses, resulting in its combined ratio exceeding 100%. Loss experience in Homeowners and Condominium Multirisk was affected by the damage caused by Storm Gloria in January 2020, which caused rough seas, persistent rain, strong winds, a lot of snow, extreme low temperatures and numerous power outages. Nevertheless, the loss ratio remained stable for Homeowners, and increased by 0.7 pp for the Condominium modality.
(BIL
LION
S OF
EUR
OS)
0
2
4
6
820
10
2011
2012
2013
2014
2015
2016
2017
2018
2019
2020
Multirisk
-4%
-2%
0%
2%
4%
6%
8%
2010
2011
2012
2013
2014
2015
2016
2017
2018
2019
2020
Annual variation
Source: MAPFRE Economics (based on ICEA data)
Chart 3.2-e Trends in direct Multirisk insurance in Spain, 2010–2020
(earned premiums from direct insurance, billions of euros; annual variation, %)
Chart 3.2-f Distribution of Multirisk premiums by modality,
2020 (percentage of premiums issued)
Source: MAPFRE Economics (based on ICEA data)
1.0%
12.3%
7.8%
18.9%
60.0%
Homeowners IndustrialCommercial CondominiumOther

64
THE SPANISH INSURANCE MARKET IN 2020
2021 outlook
Data published for the first five months of 2021 show a year-on-year increase of 4.3% in premiums in Mul t i r isk , wi th pos i t i ve performance in almost all modalities except Commercial, which dropped by -0.7%. Particularly notable was an increase of 5.5% for Industrial Multirisk. However, 2021 is proving to be a difficult year for the Multirisk line. Storm Filomena (which mainly brought snowfall, a condition not covered by the ICC), the post-pandemic period and the economic standstill all point to this. The outlook for 2021 is based on economic recovery, forecasted primarily for the last quarter of the year, which will more or less run alongside the mass vaccination of the population against COVID-19 and the assistance provided by governmental bodies to help self-employed people and SMEs to recover. This will mean that the insurance industry will support clients in assessing the necessary coverage and risk protection for these groups.
Homeowners Multirisk
The start of 2020 was arduous; Storm Gloria hit income statements hard in January, but the COVID-19 was yet to arrive. However, despite the economic effects of these phenomena, the Homeowners line performed well in 2020, with the amount of premiums issued rising by 2.7% to 4.65 billion euros. Regarding the result, the loss ratio remained almost unchanged at 61.9% despite the extreme weather events and policyholders spending more time at home due to lockdown, and the expense level improved, resulting in a combined ratio of 94.0%, 0.2 pp less than in the previous year. Nevertheless, a slight fall in the financial result caused the technical-financial result to drop by 0.4 pp to 7.3% of premiums (see Table 3.2-f and Chart 3.2-h).
2019 2020
Premium volume issued (millions of euros) 7,521 7,753
Variation in premiums 4.0% 3.1%
Retention 83.4% 82.0%
Gross loss ratio 63.5% 64.7%
Gross expenses 30.2% 30.1%
Net loss ratio 62.4% 62.5%
Net combined ratio 93.8% 94.5%
Financial result 2.3% 1.8%
Technical-financial result 8.5% 7.3%
Table 3.2-e Basic Multirisk insurance indicators, 2019–2020
(premiums, millions of euros; ratio over premiums, %)
Source: MAPFRE Economics (based on ICEA data)
0%
20%
40%
60%
80%
100%
2010
2011
2012
2013
2014
2015
2016
2017
2018
2019
2020
Net combined ratio Net loss ratioNet expenses Technical-financial resultFinancial result
Chart 3.2-g Results performance in the Multirisk insurance line,
2010–2020 (indicators over premiums)
Source: MAPFRE Economics (based on ICEA data)

65
THE SPANISH INSURANCE MARKET IN 2020
2019 2020
Premium volume issued (millions of euros) 4,529 4,653
Variation in premiums 4.2% 2.7%
Retention 90.0% 90.2%
Gross loss ratio 62.0% 63.4%
Gross expenses 32.0% 31.7%
Net loss ratio 61.8% 61.9%
Net combined ratio 94.2% 94.0%
Financial result 1.9% 1.3%
Technical-financial result 7.7% 7.3%
Table 3.2-f Basic Homeowners Multirisk insurance indicators,
2019–2020 (premiums, millions of euros; ratio over premiums,
Source: MAPFRE Economics (based on ICEA data)
0%
20%
40%
60%
80%
100%
2010
2011
2012
2013
2014
2015
2016
2017
2018
2019
2020
Net combined ratio Net loss ratioNet expenses Technical-financial resultFinancial result
Chart 3.2-h Results performance in the Homeowners Multirisk
insurance line, 2010–2020 (indicators over premiums)
Source: MAPFRE Economics (based on ICEA data)
2019 2020
Premium volume issued (millions of euros) 1,385 1,463
Variation in premiums 5.3% 5.6%
Retention 60.9% 53.0%
Gross loss ratio 73.2% 74.6%
Gross expenses 24.0% 23.9%
Net loss ratio 68.2% 72.4%
Net combined ratio 96.4% 103.2%
Financial result 3.8% 3.2%
Technical-financial result 7.4% -0.1%
Table 3.2-g Basic Industrial Multirisk insurance indicators,
2019–2020 (premiums, millions of euros; ratio over premiums, %)
Source: MAPFRE Economics (based on ICEA data)
-20%
-0%
20%
40%
60%
80%
100%
120%
2010
2011
2012
2013
2014
2015
2016
2017
2018
2019
2020
Net combined ratio Net loss ratioNet expenses Technical-financial resultFinancial result
Chart 3.2-i Results performance in the Industrial Multirisk
insurance line, 2010–2020 (indicators over premiums)
Source: MAPFRE Economics (based on ICEA data)

66
THE SPANISH INSURANCE MARKET IN 2020
2019 2020
Premium volume issued (millions of euros) 602 604
Variation in premiums 1.1% 0.3%
Retention 81.6% 83.3%
Gross loss ratio 56.5% 53.5%
Gross expenses 31.9% 33.4%
Net loss ratio 58.6% 53.2%
Net combined ratio 91.0% 87.5%
Financial result 2.6% 2.6%
Technical-financial result 11.6% 15.0%
Table 3.2-h Basic Commercial Multirisk insurance indicators,
2019–2020 (premiums, millions of euros; ratio over premiums, %)
Source: MAPFRE Economics (based on ICEA data)
0%
20%
40%
60%
80%
100%
120%
2010
2011
2012
2013
2014
2015
2016
2017
2018
2019
2020
Net combined ratio Net loss ratioNet expenses Technical-financial resultFinancial result
Chart 3.2-j Results performance in the Commercial Multirisk
insurance line, 2010–2020 (indicators over premiums)
Source: MAPFRE Economics (based on ICEA data)
2019 2020
Premium volume issued (millions of euros) 926 953
Variation in premiums 3.1% 2.8%
Retention 86.2% 86.0%
Gross loss ratio 61.7% 63.9%
Gross expenses 29.4% 29.8%
Net loss ratio 61.8% 62.6%
Net combined ratio 91.8% 93.5%
Financial result 2.8% 2.4%
Technical-financial result 11.0% 8.9%
Table 3.2-i Basic Condominium Multirisk insurance indicators,
2019–2020 (premiums, millions of euros; ratio over premiums, %)
Source: MAPFRE Economics (based on ICEA data)
0%
20%
40%
60%
80%
100%
2010
2011
2012
2013
2014
2015
2016
2017
2018
2019
2020
Net combined ratio Net loss ratioNet expenses Technical-financial resultFinancial result
Chart 3.2-k Results performance in the Condominium Multirisk
insurance line, 2010–2020 (indicators over premiums)
Source: MAPFRE Economics (based on ICEA data)

67
THE SPANISH INSURANCE MARKET IN 2020
Industrial Multirisk
The Industrial Multirisk insurance premium volume amounted to 1.46 billion euros in 2020, an increase of 5.6% over the previous year. This rate of growth is particularly notable as it is similar to the previous period, continuing a trend seen for the past three years of increases of around 5%. The indicators show a deterioration in the line's technical account, with a combined ratio once again above 100%, as it was in the years before 2019, and a negative technical-financial result (-0.1%). As for the loss ratio, it started increasing again as it had done in the years prior to 2019 (when it improved significantly), growing by 4 pp, due primarily to an increase in peak claims during 2020 and continued major competition and price adjustments (see Table 3.2-a and Chart 3.2-i). With regard to coverage and services, new benefits should be noted related to cyber risks, data protection and, more than innovating with new types of coverage, the adjustment of client coverage to their individual needs depending on how they were affected by COVID-19.
Commercial Multirisk
In 2020, the premium volume for Commercial Multirisk insurance amounted to 604 billion euros, which represents an increase of 0.3% compared with the previous year. This was lower than the growth seen in 2019 (1.1%) and 2018 (1.8%), due to the economic situation caused by the COVID-19 pandemic. The indicators show an improvement in results compared with 2019 due to a 5-pp improvement in the loss ratio as a result of the COVID-19 situation, which saw many businesses closed and insured for long periods. This lower loss experience caused the combined ratio to improve by 3.4 pp compared to the previous year, to 87.5%, and the technical-financial result to increase by 3.4 pp to 15% of premiums; two very good figures for the Multirisk modality (see Table 3.2-h and Chart 3.2-j). However, the current crisis situation may lead to poorer results in the future. Regarding coverage and services, there have been improvements in protection for remote working and in the use of
technology to generate automated offers and verify risks digitally, an innovation that has b e e n a cce l e r a t e d g i v e n t h e c u r re n t circumstances.
Condominium Multirisk
Premiums for Condominium Mult ir isk insurance increased by 2.8% in 2020, slightly less than in the previous year (3.1%), reaching a premium volume of 953 million euros. It should be noted that the client retention rate remained unchanged for this line of coverage as neighborhood association meetings, where changes to insurance companies are made, could not go ahead due to the lockdown measures in p lace. Furthermore, due to Storm Gloria, the loss ratio increased, alongside the combined ratio, which grew by 1.7 pp to 93.5% (see Table 3.2-i and Chart 3.2-k). This, combined with a deterioration in the financial result, led to the technical-financial result dropping by 2.1 pp to 8.9% of premiums.
Other Non-Life lines
Burial
The performance data for the Burial line show that business volume increased slightly by 1.3% to 2.49 billion euros in 2020, less than that recorded for the previous year (3.9%) and the average for the last ten years (see Chart 3.2-l). As with other lines of coverage, this performance was affected by the weeks of lockdown in March and April and the increased number of deaths during the pandemic. However, it should be noted that in spite of this, it remained in positive territory, demonstrating the line's resilience. This resilience, originating in the ongoing structure of the product, has been enhanced during the pandemic as insurers have been able to respond to the enormous challenge of c o n t i n u i n g t o s e r v e f a m i l i e s u n d e r circumstances as complicated as those experienced. The result of this was the retention rate remaining above 98%.

68
THE SPANISH INSURANCE MARKET IN 2020
It should be noted that the growth rates that have been observed in recent years originated in the rise of the single premium. While this modality accounts for only 4% of new business policies, its premium amount exceeds 60% of new contracts. This product, together with mixed modalities, in which one part of the premium is level and the other part is natural, accounts for 82% of the new business
premiums marketed by the sector. In contrast, a significant reduction was observed in the weight of purely level products, which were practically the only option a few years ago. This modality accounts for only 9% of new business premiums, although they exceed 69% in the portfolio as a whole.
(BIL
LION
S OF
EUR
OS)
0.0
0.5
1.0
1.5
2.0
2.5
2010
2011
2012
2013
2014
2015
2016
2017
2018
2019
2020
Burial
0%
2%
4%
6%
8%
10%
2010
2011
2012
2013
2014
2015
2016
2017
2018
2019
2020
Annual variation
Source: MAPFRE Economics (based on ICEA data)
Chart 3.2-l Trends in direct Burial insurance in Spain, 2010–2020
(earned premiums from direct insurance, billions of euros; annual variation, %)
2019 2020
Premium volume issued (millions of euros) 2,459 2,491
Variation in premiums 3.9% 1.3%
Retention 98.5% 98.3%
Gross loss ratio 64.8% 71.0%
Gross expenses 32.8% 32.2%
Net loss ratio 65.5% 72.0%
Net combined ratio 98.4% 104.2%
Financial result 6.3% 4.8%
Technical-financial result 7.9% 0.6%
Table 3.2-j Basic Burial insurance indicators, 2019–2020
(premiums, millions of euros; ratio over premiums, %)
Source: MAPFRE Economics (based on ICEA data)
0%
20%
40%
60%
80%
100%
2010
2011
2012
2013
2014
2015
2016
2017
2018
2019
2020
Net combined ratio Net loss ratioNet expenses Technical-financial resultFinancial result
Chart 3.2-m Results performance in the Burial insurance line,
2010–2020 (indicators over premiums)
Source: MAPFRE Economics (based on ICEA data)

69
THE SPANISH INSURANCE MARKET IN 2020
In 2020, the pandemic put insurers in this line to the test, whereby they learned to respond to the circumstances by adapting their procedures and capacities, meeting the needs of policyholders and their families. This resulted in the loss ratio sustained by the line in 2020 experiencing an upturn, increasing the combined ratio to 104.2%. The number of Burial guarantee claims in 2020 was 299,495, an increase of 17.8% compared to the previous year.
In addition, and as had occurred in previous fiscal years, the low interest rate environment once again required insurers to provide excess provisions, which had a subsequent effect on the income statement. This situation, combined with the continued low interest rates forecasted in the long-term, is forcing companies to review the technical conditions of their products. Operating expenses remain stable as a result of the efforts to curb company expenditure and expenses relating to maintaining conditions.
In addition, the weight of the financial result is notable in the technical account analysis. This was the result of the volume of provisions managed in this line approaching 6.4 billion
euros at the end of 2020, more than twice the premiums issued for the line. Although financial profitability was lower than in the previous year, it made it possible to offset the higher combined ratio that occurred due to the pandemic, keeping the technical-financial result positive (see Table 3.2-j and Chart 3.2-m).
As mentioned in previous editions of this report, it should be noted that for several years bancassurance operators have been entering this line — a channel that previously had no presence in the marketing of burial insurance. Moreover, in terms of competition in this line of the market, the line is well established, with a deep presence in society (almost half of the Spanish population has burial insurance). Competition is therefore most evident in newer segments, such as the single premium, which are insurance policies tailored to a very specific client segment (older individuals without burial insurance) for whom no product existed a few years ago.
(BIL
LION
S OF
EUR
OS)
0.0
0.5
1.0
1.5
2.0
2010
2011
2012
2013
2014
2015
2016
2017
2018
2019
2020
Third-Party Liability
-15%
-10%
-5%
0%
5%
10%
15%
2010
2011
2012
2013
2014
2015
2016
2017
2018
2019
2020
Annual variation
Source: MAPFRE Economics (based on ICEA data)
Chart 3.2-n Trends in direct Third-Party Liability insurance in Spain, 2010–2020
(earned premiums from direct insurance, billions of euros; annual variation, %)

70
THE SPANISH INSURANCE MARKET IN 2020
Third-party liability
In 2020, the premium volume issued in the Third-party liability line increased by 2.6% compared to the previous year, at 1.64 billion euros (see Chart 3.2-n). This increase is the result of various issues that arose in 2020. Firstly, premiums hardened in third-party liability policies, a trend that began in 2019 and was cemented in 2020, particularly in professional third-party liability and directors and officers liability insurance, as well as general third-party liability policies for companies in the Middle Upper Market. In addition, there was an increase in the number of cyber risk and data protection policies taken out as a result of the ever-increasing awareness of the need for protection against these types of events, the growth of remote working in many businesses and the increase in the number of cyber attacks. These increases have mitigated the negative effect of the decrease in billing volumes and the closure
of businesses in sectors that have been particularly hard-hit by the effects of reduced activity due to the economic situation resulting from the pandemic.
Technical account result data show that the loss ratio increased by 0.9 pp in 2020 but that this was offset by the expense ratio dropping by the same amount, with the combined ratio therefore remaining stable at 92.4%. In addition, the drop of -4.2 pp in the financial result caused the technical-financial result for the line to fall from 17.8% of premiums in 2019 to 13.6% in 2020 (see Table 3.2-k and Chart 3.2-o).
Personal accidents
The effects of the state of alarm declared as a result of the COVID-19 pandemic that broke out in March 2020 and the mobility restrictions that have been in place since have resulted in the
2019 2020
Premium volume issued (millions of euros) 1,598 1,639
Variation in premiums 4.3% 2.6%
Retention 71.4% 70.5%
Gross loss ratio 62.4% 62.4%
Gross expenses 28.9% 28.1%
Net loss ratio 60.2% 61.1%
Net combined ratio 92.4% 92.4%
Financial result 10.2% 6.0%
Technical-financial result 17.8% 13.6%
Table 3.2-k Basic Third-Party Liability insurance indicators, 2019–
2020 (premiums, millions of euros; ratio over premiums, %)
Source: MAPFRE Economics (based on ICEA data)
0%
20%
40%
60%
80%
100%
120%
2010
2011
2012
2013
2014
2015
2016
2017
2018
2019
2020
Net combined ratio Net loss ratioNet expenses Technical-financial resultFinancial result
Chart 3.2-o Results performance in the Third-Party Liability
insurance line, 2010–2020 (indicators over premiums)
Source: MAPFRE Economics (based on ICEA data)

71
THE SPANISH INSURANCE MARKET IN 2020
line's premium volume dropping by -2.5% in 2020, to 1.12 billion euros (see Chart 3.2-p). However, by the same token, mobility restrictions have led to a 7.5-pp decrease in the loss ratio, with the combined ratio enjoying a considerable improvement, coming to 67.6%.
It should be noted that the trend in recent years has been toward a considerable adjustment in premiums issued, primarily due to market
competition, resulting in a slight increase in the loss ratio. The adjustment of written premiums has been encouraged by the state of alarm, but unlike in recent years, the loss ratio and, consequently, the combined ratio are at their best levels historically (see Chart 3.2-q and Table 3.2-l).
(BIL
LION
S OF
EUR
OS)
0.0
0.3
0.6
0.9
1.220
10
2011
2012
2013
2014
2015
2016
2017
2018
2019
2020
Personal Accidents
-10%
-5%
0%
5%
10%
15%
2010
2011
2012
2013
2014
2015
2016
2017
2018
2019
2020
Annual variation
Source: MAPFRE Economics (based on ICEA data)
Chart 3.2-p Trends in direct Personal Accident insurance in Spain, 2010–2020
(earned premiums from direct insurance, billions of euros; annual variation, %)
2019 2020
Premium volume issued (millions of euros) 1,152 1,123
Variation in premiums -0.0% -2.5%
Retention 86.5% 86.8%
Gross loss ratio 39.0% 32.9%
Gross expenses 36.4% 34.7%
Net loss ratio 39.5% 32.0%
Net combined ratio 76.5% 67.6%
Financial result 19.5% 28.0%
Technical-financial result 42.9% 60.4%
Table 3.2-l Basic Personal Accident insurance indicators,
2019–2020 (premiums, millions of euros; ratio over premiums, %)
Source: MAPFRE Economics (based on ICEA data)
0%
20%
40%
60%
80%
100%
2010
2011
2012
2013
2014
2015
2016
2017
2018
2019
2020
Net combined ratio Net loss ratioNet expenses Technical-financial resultFinancial result
Chart 3.2-q Results performance in the Personal Accident
insurance line, 2010–2020 (indicators over premiums)
Source: MAPFRE Economics (based on ICEA data)

THE SPANISH INSURANCE MARKET IN 2020
72
Credit
Premium volume for the Credit insurance market dropped by -0.8% in 2020, putting a stop to the growth trend that began in 2018 (see Chart 3.2-r). This development is a reflection of the impact of the COVID-19 pandemic, which, on the one hand, hindered the entry of new clients into the market and, on the
other, led to the upward adjustment of rates in the portfolio of policies in effect.
Furthermore, and as is reflected in Table 3.2-m and Chart 3.2-s, loss experience in this line has increased but remains at sustainable levels. Performance like this is not usually expected in a highly uncertain and volatile macroeconomic and political context, and is
(BIL
LION
S OF
EUR
OS)
0.0
0.3
0.5
0.8
2010
2011
2012
2013
2014
2015
2016
2017
2018
2019
2020
Credit
-15%
-10%
-5%
0%
5%
2010
2011
2012
2013
2014
2015
2016
2017
2018
2019
2020
Annual variation
Source: MAPFRE Economics (based on ICEA data)
Chart 3.2-r Trends in direct Credit insurance in Spain, 2010–2020
(earned premiums from direct insurance, billions of euros; annual variation, %)
2019 2020
Premium volume issued (millions of euros) 607 602
Variation in premiums 3.8% -0.8%
Retention 37.5% 32.5%
Gross loss ratio 52.2% 61.8%
Gross expenses 32.8% 30.5%
Net loss ratio 46.6% 66.3%
Net combined ratio 57.7% 78.6%
Financial result 2.8% 1.4%
Technical-financial result 45.1% 22.8%
Table 3.2-m Basic Credit insurance indicators, 2019–2020
(premiums, millions of euros; ratio over premiums, %)
Source: MAPFRE Economics (based on ICEA data)
-20%
-3%
15%
32%
50%
68%
85%
102%
120%
2010
2011
2012
2013
2014
2015
2016
2017
2018
2019
2020
Net combined ratio Net loss ratioNet expenses Technical-financial resultFinancial result
Chart 3.2-s Results performance in the Credit insurance line,
2010–2020 (indicators over premiums)
Source: MAPFRE Economics (based on ICEA data)

73
THE SPANISH INSURANCE MARKET IN 2020
explained in part by the support provided by the government to mitigate the impact of the crisis caused by the pandemic on companies and on the credit insurers that underwrite the conditions for this support. As such, as a result of this development combined with the efforts to reduce costs, the net combined ratio increased to 78.6%.
Provisional data for sector premiums at the end of March 2021 reflected positive growth at a rate of 7.4%. The COVID-19 crisis continues to keep the market and the Spanish economy in a complex and uncertain situat ion. The impairment of many sectors and the likely upturn in loss experience when government support ends will continue to drive rate growth and an increase in cancelations.
It is still not possible to identify all the consequences that the health crisis will have on this line of coverage over the next few months, but it is reasonable to assume that insurers will continue to adjust their coverage options, prices and risk exposure in particular in countries and sectors that are more vulnerable in the current scenario. Also, it can be expected that more resilient sectors and companies will encourage people to take out policies as a result of greater sensitivity to commercial risk credit. This recovery in demand will be more marked in the
second half of the year, with the gradual improvement of the economy.
Surety
The premium volume for Surety insurance amounted to 136 million euros in 2020, representing an increase of 11% over 2019 (see Chart 3.2-t). Although the growth rate dropped compared to the three years previous, this is still a very positive figure as it was achieved in a highly complex environment caused by the pandemic.
The line's gross loss ratio improved by 13.6 pp compared to 2019, to an impressive 26% (see Table 3.2-n and Chart 3.2-u). This was an unexpected development, as a sharp increase in the loss ratio was feared at the start of the health crisis. The stimulus measures adopted by the Spanish government and at the European Union level undoubtedly had a positive effect on the loss ratio, which remained at highly restrained levels, allowing the sector to achieve excellent results.
Beyond the numbers alone, it should be noted that the sector has been able to adapt to this new reality, and insurers have managed to continue providing services to their clients with almost all of their employees and collaborators
(BIL
LION
S OF
EUR
OS)
0.00
0.05
0.09
0.14
2010
2011
2012
2013
2014
2015
2016
2017
2018
2019
2020
Surety
-40%
-20%
0%
20%
40%
60%
2010
2011
2012
2013
2014
2015
2016
2017
2018
2019
2020
Annual variation
Source: MAPFRE Economics (based on ICEA data)
Chart 3.2-t Trends in direct Surety insurance in Spain, 2010–2020
(earned premiums from direct insurance, billions of euros; annual variation, %)

74
THE SPANISH INSURANCE MARKET IN 2020
working from home. This scenario has driven initiatives for electronic signatures and the deposit of guarantees using virtual platforms that are hoped will completely replace paper versions. Unfortunately, the start of 2021 continued to be affected by the COVID-19 pandemic.
This means that the uncertain economic climate will continue, and that the exceptional measures adopted by governments will persist. Despite this, the line grew by 4% by March 2021, a very good result given the current crisis situation caused by the coronavirus.
2019 2020
Premium volume issued (millions of euros) 122 136
Variation in premiums 45.6% 11.0%
Retention 31.8% 32.9%
Gross loss ratio 39.7% 26.0%
Gross expenses 36.0% 31.6%
Net loss ratio 48.2% 37.3%
Net combined ratio 77.3% 36.0%
Financial result 4.6% 1.8%
Technical-financial result 27.3% 65.7%
Table 3.2-n Basic Surety insurance indicators, 2019–2020
(premiums, millions of euros; ratio over premiums, %)
Source: MAPFRE Economics (based on ICEA data)
-200%
-100%
0%
100%
200%
300%
2010
2011
2012
2013
2014
2015
2016
2017
2018
2019
2020
Net combined ratio Net loss ratioNet expenses Technical-financial resultFinancial result
Chart 3.2-u Results performance in the Surety insurance line,
2010–2020 (indicators over premiums)
Source: MAPFRE Economics (based on ICEA data)
(BIL
LION
S OF
EUR
OS)
0.0
0.2
0.3
0.4
0.6
2010
2011
2012
2013
2014
2015
2016
2017
2018
2019
2020
Hull Merchandise
-20%
-10%
0%
10%
20%
2010
2011
2012
2013
2014
2015
2016
2017
2018
2019
2020
Hull Merchandise
Source: MAPFRE Economics (based on ICEA data)
Chart 3.2-v Trends in direct Transport insurance in Spain, 2010–2020
(earned premiums from direct insurance, billions of euros; annual variation, %)

75
THE SPANISH INSURANCE MARKET IN 2020
Transport
The results of the various Transport lines remained positive in 2020, despite the crisis. Premium volume stood at 523 million euros for the year, which represents growth of 5.1% compared to the previous year (see Chart 3.2-v). This growth continued to benefit from the hardening of conditions in the Aviation line, which began in 2019 and continued to have an impact in 2020. The Maritime business also grew by 3.5%, although this figure was somewhat lower than in the previous year as a result of renewal conditions being hardened and the increasing lack of capacity to insure large fleets.
The Merchandise line was most affected by the shutdown in sales activity in place as a result of the pandemic and lockdown. Although the essential nature of the insurance industry has meant that it has continued to operate at all times, sectors such as manufacturing and automotive have been affected so the line's premiums only slightly increased, by 0.7%.
Furthermore, loss experience was practically nonexistent in Aviation due to the lack of activity in the sector, while Merchandise maintained the same parameters as in the previous year. Maritime, however, remained negative, although less so than in the previous fiscal year, thereby contributing to the continuation of the hardening of conditions begun in 2019.
Transport premiums dropped by -4.3% between January and May 2021, with a 13.8% increase in Maritime insurance that could not offset the drops of -49.7% and -1.9% in Aviation and Merchandise, respectively.
Hull
As can be seen in Table 3.2-o, premiums in the Hull segment increased by almost 10% during 2020, resulting in a premium volume of 266 million euros. As noted above, this increase came mainly from the hardening of conditions that took place during the previous fiscal year due to bad results in the line's technical account. The hardening of renewals that began in the previous year continued, for both premiums and conditions and deductibles.
As confirmed in Table 3.2-0 and Chart 3.2-w, the gross loss ratio improved significantly to 59.2%, and while the net loss ratio did improve by 4.5 pp compared to 2019, expenses prevented the result from being better, increasing by 2.5 pp. Consequently, the combined ratio improved by 2 pp to 105.4%, confirming an improving trend in the line.
Merchandise
In 2020, the Merchandise line's premium volume remained practically unchanged from the previous year, while its result improved thanks to the lack of activity in certain sectors as a result of the pandemic. Maritime merchandise traffic remained active throughout 2020, although it was affected by the closure of a number of ports, difficulty in loading and unloading containers and the lack of activity in c e r t a i n i m p o r t a n t s e c t o r s s u c h a s manufacturing, accessories and automotive, among others. This was reflected in the lack of growth in the line and the drop in the loss ratio (decrease of 14.1 pp compared to the previous year).
Nevertheless, despite the uncertainty created by the pandemic, the results were positive as there was no general decrease in premiums, resulting in a combined ratio not seen for a long time, at 78.1% (see Table 3.2-p and Chart 3.2-x).

76
THE SPANISH INSURANCE MARKET IN 2020
-20%
-0%
20%
40%
60%
80%
100%
120%
2010
2011
2012
2013
2014
2015
2016
2017
2018
2019
2020
Net combined ratio Net loss ratioNet expenses Technical-financial resultFinancial result
Chart 3.2-w Results performance in the Hull Transport line,
2010–2020 (indicators over premiums)
Source: MAPFRE Economics (based on ICEA data)
2019 2020
Premium volume issued (millions of euros) 243 266
Variation in premiums 12.6% 9.6%
Retention 46.4% 37.7%
Gross loss ratio 87.1% 59.2%
Gross expenses 16.5% 17.6%
Net loss ratio 84.7% 80.3%
Net combined ratio 107.4% 105.4%
Financial result 4.8% 2.4%
Technical-financial result -2.6% -3.0%
Table 3.2-o Basic Hull Transport insurance indicators, 2019–2020
(premiums, millions of euros; ratio over premiums, %)
Source: MAPFRE Economics (based on ICEA data)
2019 2020
Premium volume issued (millions of euros) 255 257
Variation in premiums 4.5% 0.7%
Retention 69.0% 66.8%
Gross loss ratio 61.3% 48.8%
Gross expenses 28.0% 26.4%
Net loss ratio 64.1% 50.0%
Net combined ratio 94.1% 78.1%
Financial result 3.8% 2.5%
Technical-financial result 9.6% 24.4%
Table 3.2-p Basic Merchandise Transport insurance indicators,
2019–2020 (premiums, millions of euros; ratio over premiums, %)
Source: MAPFRE Economics (based on ICEA data)
-20%
-0%
20%
40%
60%
80%
100%
120%
2010
2011
2012
2013
2014
2015
2016
2017
2018
2019
2020
Net combined ratio Net loss ratioNet expenses Technical-financial resultFinancial result
Chart 3.2-x Results performance in the Merchandise Transport
insurance line, 2010–2020 (indicators over premiums)
Source: MAPFRE Economics (based on ICEA data)

77
THE SPANISH INSURANCE MARKET IN 2020
Engineering
The total premium volume for Engineering insurance in 2020 was 344 million euros, a slight increase of 1.2%, much lower than the 12.7% growth recorded in 2019. This was driven by the lines with higher premium volume as shown in Table 3.2-q and Chart 3.2-y (Machinery Breakdown [2.4%], Construction [6.4%] and Electronic Equipment [5.8%]), which offset the drop in Erection (-7.3%) and Ten-Year insurance (-15.5%).
As with the rest of the lines, we must wait to assess the effects that disruption to usual activity (due to the COVID-19 pandemic) has had on the various economic sectors, and to find out whether the Engineering sector will continue on this upward trend. Statistics for the first quarter show increases in all Engineering modalities, with the exception of Erection, which dropped by -29.3%.
3.3. Life line
Life insurance reached a total premium volume of 21.84 billion euros in 2020, representing a decrease of -20.7% compared to the previous year. There have been decreases in both Protection (-0.4%) and Savings (-25%) due to the economic crisis caused by the COVID-19 pandemic and the continued low interest rate environment, except for unit-linked products, which grew by 1.1% (see Table 3.3-a and Chart 3.3-a). Long-term care products also performed well, increasing by 17.9%, although the premium volume totals only 8 million euros.
In terms of managed savings, technical provisions decreased by 0.3% to 194.11 billion euros, ending the trend of increases that had been ongoing for more than a decade. It should be noted that in 2020, individual and collective insurance also saw very similar decreases, of -20.3% and -22.9%, respectively. Furthermore, as can be seen in Table 3.3-b, the number of policyholders dropped by -1.6% overall, with a larger drop in Life Savings (-5%) than in Life Protection (-0.1%).
Modality 2020 Variation
Ten-Year 32.3 -15.5%
Construction 78.5 6.4%
Machinery breakdown 159.1 2.4%
Assembly 17.7 -7.3%
Electronic equipment 56.1 5.8%
Total Engineering 343.7 1.2%
Table 3.2-q Breakdown of Engineering insurance by modality,
2020 (premiums, millions of euros; variation, %)
Source: MAPFRE Economics (based on ICEA data)
Chart 3.2-y Breakdown of Engineering insurance premiums by
modality, 2020 (indicators over premiums)
Source: MAPFRE Economics (based on ICEA data)
16.3%
5.1%
46.3%
22.8%
9.4%
Ten-YearConstructionMachinery breakdownAssemblyElectronic equipment

78
THE SPANISH INSURANCE MARKET IN 2020
2021 outlook
The health crisis and its development will impact the performance of the Life line in 2021. However, the performance of the Protection insurance line will be closely associated with consumption and credit developments, as this type of insurance is largely linked to loan
performance. A low interest rate environment was also forecast, which will continue to encourage savers seeking improved return in exchange for greater risk to continue investing in the types of savings alternatives that this kind of situation can provide, such as unit-linked products.
Modality
Premiums Provisions
2020 Annual variation 2020 Annual variation
Individual 18,834 -20.3% 157,691 -0.6%
Collective 3,003 -22.9% 36,419 0.6%
Total 21,837 -20.7% 194,110 -0.3%
Risk 4,840 -0.4% 6,572 1.8%
Dependency 8 17.9% 36 24.6%
Savings/Retirement 16,989 -25.0% 187,501 -0.4%
Insured Pension Plan 883 -28.2% 12,098 -1.9%
Deferred capital 4,751 -24.4% 49,004 -2.6%
Annuities 3,717 -45.8% 89,129 -1.0%
Transformation of equity into whole life annuities 17 -94.6% 2,418 -6.8%
PIAS (Planes Individuales de Ahorro Sistemáticos — individual systematic savings plans)
2,663 -4.9% 14,441 -0.2%
SIALP (Seguro Individual de Ahorro a Largo Plazo — individual long-term savings insurance)
787 -24.3% 4,397 1.7%
Unit-linked 4,171 1.1% 16,016 12.5%
Total 21,837 -20.7% 194,110 -0.3%
Table 3.3-a Breakdown of Life insurance premiums and provisions by modality, 2019–2020
(premiums issued net of cancelations, annual variation, %)
Source: MAPFRE Economics (based on ICEA data)
(BIL
LION
S OF
EUR
OS)
0
5
10
15
20
25
30
35
2010
2011
2012
2013
2014
2015
2016
2017
2018
2019
2020
Life
-30%
-20%
-10%
0%
10%
20%
30%
2010
2011
2012
2013
2014
2015
2016
2017
2018
2019
2020
Annual variation
Source: MAPFRE Economics (based on ICEA data)
Chart 3.3-a Trends in direct Life insurance in Spain, 2010–2020
(earned premiums from direct insurance, billions of euros; annual variation, %)

The latest data for the first five months of 2021 show some recovery of growth in Life Insurance, with a year-on-year premium increase of 9.9%, with Life Protection and Life Savings growing by 3 .1% and 12.4%, respectively.
Pension funds and plans
Pension funds reached a new equity record at the end of 2020 and closed the year with an asset volume of 118.52 billion euros (1.8% more than in 2019).
The Individual System provided all the growth for the year, while the Company System saw a slight decline (see Charts 3.3-b and 3.3-c).
Once again, net contributions were the largest contributor to the growth of Individual Plans in 2020, totaling 1.34 billion euros (18% more than in 2019). The historic trend of positive net contributions to the Individual System may change in 2021 due to the approved reduction of the maximum contributory limit to 2,000 euros. The Company System experienced a slight decrease in the negat ive ba lance o f contributions, due to a reduction in gross benefits for the second consecutive year.
The number of unitholder accounts also decreased slightly compared to 2019 (14,013 fewer accounts), closing the year at 9,541,898 accounts. However, the net number of unitholders was estimated to be 7.5 million at fiscal year-end, given that many have more than one plan open in order to diversify their investments. Pension Plans closed 2020 with positive profitability across all terms, with long-term profitability being satisfactory at an annual average of 3.4% at 25 years for all plans.
Mutual funds
The equity of domestic mutual funds remained unchanged, with a slight reduction of 60 million euros down to 276.5 billion euros (see Chart 3.3-d). The risk profile for Spanish unitholders continued the trend from previous years in 2020 (see Chart 3.3-e), except in one category, which, due to the current economic situation, saw a slight change in the portfolio structure, as is the case with Long-Term Fixed Income Funds, after the improved performance of these types of funds due to reductions in the Internal Rate of Return that occurred in 2020.
Back in 2014, 51% of mutual fund equity was conservative in nature (23% cash and short-term fixed income and 28% guaranteed); while in December 2020, only 25% of savings in mutual funds were channeled through this type of instrument. The reasons behind this performance include a more temporary cause in the form of interest rates performing negatively, which forces the unitholder to seek extra return on their investments, and a more structural cause, such as the increased financial literacy of the average Spanish saver. According to the 11th manager survey conducted by the pension fund and collective investment institution association, Inverco, in the first quarter of 2021, mutual funds are configured as long-term (over five years) savings instruments, with the average holding period greater than four years for almost half of unitholders.
79
THE SPANISH INSURANCE MARKET IN 2020
Modality 2020Annual
variation
Risk 20,785,225 -0.1%
Dependency 65,743 11.0%
Savings/Retirement 9,211,628 -5.0%
Total 30,062,596 -1.6%
Table 3.3-b Breakdown of Life insurance policyholders by
modality, 2019–2020 (number of policyholders; annual variation, %)
Source: MAPFRE Economics (based on ICEA data)
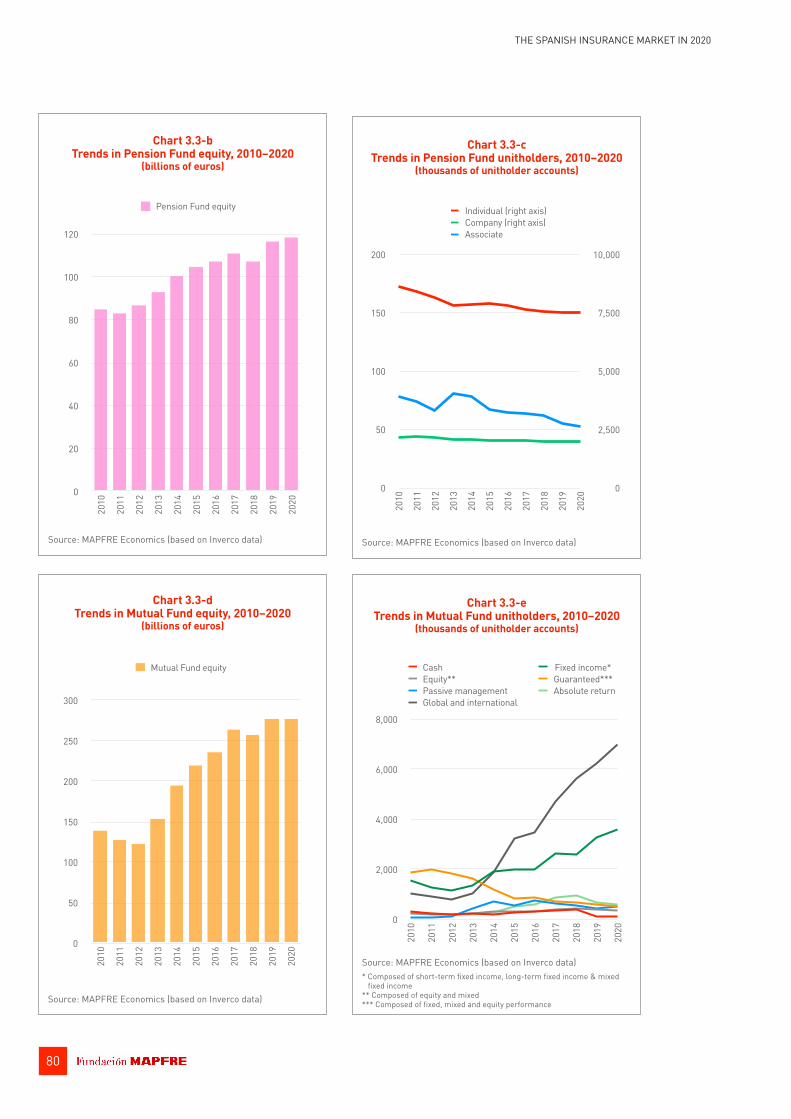
80
THE SPANISH INSURANCE MARKET IN 2020
0
20
40
60
80
100
120
2010
2011
2012
2013
2014
2015
2016
2017
2018
2019
2020
Pension Fund equity
Chart 3.3-b Trends in Pension Fund equity, 2010–2020
(billions of euros)
Source: MAPFRE Economics (based on Inverco data)
0
2,500
5,000
7,500
10,000
0
50
100
150
200
2010
2011
2012
2013
2014
2015
2016
2017
2018
2019
2020
Individual (right axis)Company (right axis)Associate
Chart 3.3-c Trends in Pension Fund unitholders, 2010–2020
(thousands of unitholder accounts)
Source: MAPFRE Economics (based on Inverco data)
0
2,000
4,000
6,000
8,000
2010
2011
2012
2013
2014
2015
2016
2017
2018
2019
2020
Cash Fixed income* Equity** Guaranteed***Passive management Absolute returnGlobal and international
Chart 3.3-e Trends in Mutual Fund unitholders, 2010–2020
(thousands of unitholder accounts)
Source: MAPFRE Economics (based on Inverco data) * Composed of short-term fixed income, long-term fixed income & mixed fixed income ** Composed of equity and mixed *** Composed of fixed, mixed and equity performance
0
50
100
150
200
250
300
2010
2011
2012
2013
2014
2015
2016
2017
2018
2019
2020
Mutual Fund equity
Chart 3.3-d Trends in Mutual Fund equity, 2010–2020
(billions of euros)
Source: MAPFRE Economics (based on Inverco data)

81
THE SPANISH INSURANCE MARKET IN 2020
Outlook for mutual funds and pension funds
The Inverco report on collective investment institutions and pension funds shows that after the increased uncertainty experienced in 2020 due to the health crisis, prospects for 2021 will largely depend on how the pandemic pans out and, in particular, on the availability of the various vaccines, as well as any issues surrounding new waves and variants of the virus. In any event, the maintenance of the measures that governments, central banks and national supervisory bodies implemented at the beginning of the crisis to mitigate its impact on the economy will influence developments in the markets this year, with generally very expansive monetary policies, the effects of which will be continued confidence in variable income markets in 2021 and the profitability of debt and risk premiums remaining at very low levels.


4. Structural growth trends
4.1. Penetration, density and depth
Penetration
Despite the -8.2% decrease in premium volume, a greater drop in GDP at current prices (-10.8%) contributed to insurance penetration in Spain (the ratio of premiums to GDP) amounting to 5.26% in 2020, an increase of 0.1 pp compared to the data for 2019. This increase occurred following three consecutive years of the indicator dropping (see Charts 4.1-a and 4.1-b), after its record high in 2016 (5.73%).
However, penetration in the Life line decreased by -0.26 pp to 1.95% due to a -20.7% drop in premium revenue for the year, much higher than the decrease in GDP. As is clear from Charts 4.1-a and 4.1-b, penetration in the Life segment
has generally been decreasing over the last decade (except in 2011 and 2016), affected by factors including the 2011–2013 European crisis and the current COVID-19 crisis, as well as a prolonged low interest rate environment. The Non-Life insurance penetration index was more stable in the 2010–2020 period, coming in at 3.31% in 2020, a significant increase of 0.36 pp compared to 2019. As such, Spanish insurance penetration has dropped by -0.17 pp over the last decade due to a -0.51-pp fall in the Life line, which could not be offset by the 0.34-pp increase in the Non-Life line.
Life Savings is the Life segment modality with the highest penetration level, reaching 1.52% in 2020, while Life Protection penetration was 0.43% (see Chart 4.1-c). It should be noted that in the case of Life Savings, penetration has dropped consistently over the last four years, with a cumulative drop of -0.9 pp, while the Life Protection insurance indicator has increased by 0.06 pp in the same period. An analysis of the penetration index for this segment over the past decade (index 2010=100) shows that, while penetration in the Life Protection insurance segment rose by 22.9% between 2010 and 2020, the figure for the Life Savings insurance segment dropped by -28.0% over the same period.
Penetration was 3.31% for the Non-Life insurance segment, a significant increase of 0.36 pp compared to 2019, with increases in the main lines of coverage included (see Chart 4.1-d). For the Automobile line, penetration increased by 0.08 pp in 2020 to 0.99%, despite the drop in premiums; the indicator was 0.69% for the Multirisk line (0.60% in 2019); Health had the largest increase, from 0.72% in 2019 to 0.84% in 2020; and penetration was 0.79% for the other Non-Life lines of insurance (0.71% in 2019).
83THE SPANISH INSURANCE MARKET IN 2020
0%
1%
2%
3%
4%
5%
6%
2010
2011
2012
2013
2014
2015
2016
2017
2018
2019
2020
Total Life Non-Life
Chart 4.1-a Trends in penetration, 2010–2020
(premiums/GDP)
Source: MAPFRE Economics (based on ICEA and International Monetary Fund [IMF] data)

84
THE SPANISH INSURANCE MARKET IN 2020
All of this confirms the medium-term mixed penetration trend for Non-Life insurance lines. As such, penetration increased by 17.9% and 40.6% for the Multirisk and Health lines respectively between 2010 and 2020 (index 2010= 100), fell by -7.9% in the Automobile line, and increased by 11.5% in the other Non-Life lines.
Density
The insurance density (premiums per capita) indicator was 1,243.8 euros in Spain in 2020, a decrease of 108.60 euros compared to the previous year. This decrease can be explained by a combination of increased density in the Non-Life insurance segment and a drop in the
70
80
90
100
110
120
2010
2011
2012
2013
2014
2015
2016
2017
2018
2019
2020
Total Life Non-Life
Chart 4.1-b Trends in changes of penetration, 2010–2020
(index 2010=100; annual change, pp)
Source: MAPFRE Economics
2010–20112011–20122012–20132013–20142014–20152015–20162016–20172017–20182018–20192019–2020
-0.4 -0.2 0.0 0.2 0.4 0.6
0.10
-0.19
-0.11
-0.27
0.45
-0.10
-0.10
-0.09
-0.13
0.27
Annual change in penetration (pp)
0%
1%
2%
3%
2010
2011
2012
2013
2014
2015
2016
2017
2018
2019
2020
Life Protection Life Savings
Chart 4.1-c Trends in Life insurance penetration, 2010–2020
(premiums/GDP; index 2010=100)
Source: MAPFRE Economics (based on ICEA and International Monetary Fund [IMF] data)
70
80
90
100
110
120
130
2010
2011
2012
2013
2014
2015
2016
2017
2018
2019
2020
Life Life Protection Life Savings

85
THE SPANISH INSURANCE MARKET IN 2020
Life insurance indicator. The density of the Non-Life segment rose from 772.40 euros in 2019 to 782.60 euros in 2020, while the Life segment dropped from 580 to 461.20 euros over the same period. While the density of the Life insurance segment once again declined
for the fourth consecutive year, that of the Non-Life segment confirmed the rising trend that began in 2013 (see Chart 4.1-e).
If Spanish market density is analyzed from a medium-term perspective (index 2010=100), it achieved low growth of 0.9% over the 2010–2020 period (rising from 1,233.00 to 1,243.80 euros), with a 17.5% decline in the indicator for Life insurance (from 558.90 to 461.20 euros), and a 16.1% increase for Non-Life insurance (from 674.10 to 782.60 euros) over the same period (see Chart 4.1-f).
Similarly to what has been observed in penetration level developments, the density of the Life insurance segment is determined by the performance of Life Savings insurance, standing at 77.8% of the total (4.5 pp less than the previous year). The density of Life Savings insurance was 358.80 euros in 2020 (118.70 euros less than the previous year), continuing the declining trend that began in 2017 following the record high posted in 2016. The Life Protection insurance segment, which stood at 102.40 euros in 2020, recorded a slight decrease of -0.1 euros compared to the previous year (see Chart 4.1-g).
0%
1%
2%
3%
4%20
10
2011
2012
2013
2014
2015
2016
2017
2018
2019
2020
Automobiles MultiriskHealth Other lines
Chart 4.1-d Trends in Non-Life insurance penetration, 2010–2020
(premiums/GDP; index 2010=100)
Source: MAPFRE Economics (based on ICEA and International Monetary Fund [IMF] data)
75
100
125
150
2010
2011
2012
2013
2014
2015
2016
2017
2018
2019
2020
Non-Life Automobiles MultiriskHealth Other lines
0
500
1,000
1,500
2010
2011
2012
2013
2014
2015
2016
2017
2018
2019
2020
Total Life Non-Life
Chart 4.1-e Trends in density, 2010–2020
(premiums per capita, euros)
Source: MAPFRE Economics (based on ICEA and INE data)

86
THE SPANISH INSURANCE MARKET IN 2020
From a medium-term perspective for the 2010–2020 period, which is shown in Chart 4.1-g, Life insurance density dropped by -17.5% over the period. However, while the Life Savings insurance segment fell by -25.1% during this period, the Life Protection insurance segment grew by 27.9%. The above data show that, in the medium-term trend, Life Protection insurance is showing a greater dynamic than the Life Savings insurance segment, although they still have not been
able to achieve the relative significance that they have in the Life insurance portfolio.
Furthermore, as shown by Chart 4.1-h, the density of the Non-Life insurance segment is more equally distributed across the different lines comprising it. As such, in 2020, the densi ty of th is market segment was distributed as follows: 29.9% corresponded to the Automobile line; 25.3% to the Health line; 20.9% to the Multirisk line; and 23.8% to the
80
90
100
110
120
2010
2011
2012
2013
2014
2015
2016
2017
2018
2019
2020
Total Life Non-Life
Chart 4.1-f Trends in changes of density, 2010–2020
(index 2010=100; euros)
Source: MAPFRE Economics
2010–20112011–20122012–20132013–20142014–20152015–20162016–20172017–20182018–20192019–2020
-150 -100 -50 0 50 100 150
-108.6
-17.5
12.3
-13.0
149.2
31.3
-5.0
-22.5
-64.3
48.9
Annual change in density (euros)
0
200
400
600
800
2010
2011
2012
2013
2014
2015
2016
2017
2018
2019
2020
Life Protection Life Savings
Chart 4.1-g Trends in Life insurance density, 2010–2020
(premiums per capita, euros; index 2010=100)
Source: MAPFRE Economics (based on ICEA and INE data)
70
80
90
100
110
120
130
2010
2011
2012
2013
2014
2015
2016
2017
2018
2019
2020
Life Life Protection Life Savings

87
THE SPANISH INSURANCE MARKET IN 2020
other lines in the Non-Life insurance segment, which overall means no positive changes compared to the data reported in 2019. In addition, in the analysis of medium-term trends for the 2010–2020 period, the Health, Multirisk and other Non-Life lines recorded density increases of 46.3%, 22.7% and 16.0% respectively (index 2010=100), while the Automobile line saw its density reduce by 4.2%, breaking with the trend of density recovery seen in previous years.
Depth
The pronounced drop in Spanish Life insurance in 2020 due to both the continued low interest rate environment and the economic effects of the crisis caused by the COVID-19 pandemic have particularly affected depth levels in the sector (share of direct Life insurance premiums in relation to the market's total direct premiums). As such, the indicator (shown in Chart 4.1-i) was at 37.1% in 2020,
0
200
400
600
80020
10
2011
2012
2013
2014
2015
2016
2017
2018
2019
2020
Automobiles Multirisk HealthOther lines
Chart 4.1-h Trends in Non-Life insurance density, 2010–2020
(premiums per capita, euros; index 2010=100)
Source: MAPFRE Economics (based on ICEA and INE data)
80
100
120
140
160
2010
2011
2012
2013
2014
2015
2016
2017
2018
2019
2020
Non-Life Automobiles MultiriskHealth Other lines
30%
35%
40%
45%
50%
2010
2011
2012
2013
2014
2015
2016
2017
2018
2019
2020
Depth
Chart 4.1-i Trends in depth, 2010–2020
(direct Life insurance premiums/total direct premiums, %; annual change, pp)
Source: MAPFRE Economics
2010–20112011–20122012–20132013–20142014–20152015–20162016–20172017–20182018–20192019–2020
-8 -6 -4 -2 0 2 4
-5.8
-2.1
-1.4
-2.4
3.8
0.2
-0.9
-0.2
-1.8
2.3
Annual change in depth (pp)
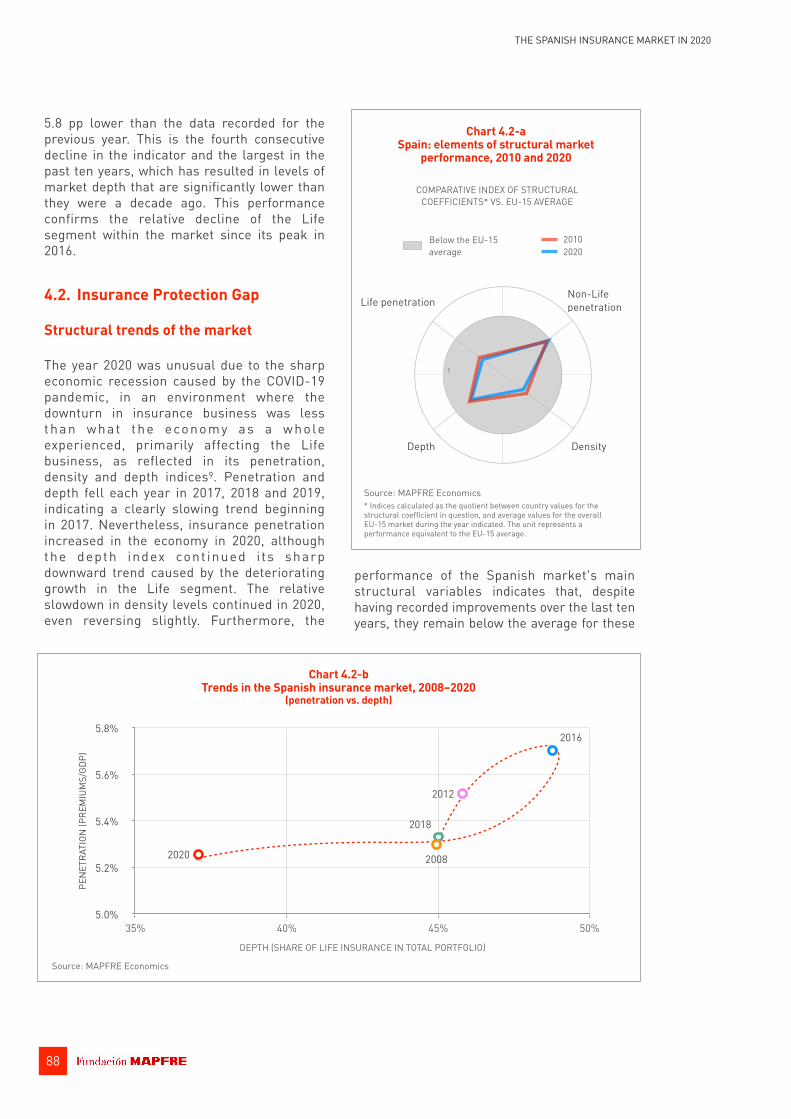
88
THE SPANISH INSURANCE MARKET IN 2020
5.8 pp lower than the data recorded for the previous year. This is the fourth consecutive decline in the indicator and the largest in the past ten years, which has resulted in levels of market depth that are significantly lower than they were a decade ago. This performance confirms the relative decline of the Life segment within the market since its peak in 2016.
4.2. Insurance Protection Gap
Structural trends of the market
The year 2020 was unusual due to the sharp economic recession caused by the COVID-19 pandemic, in an environment where the downturn in insurance business was less t h a n w h a t t h e e co n o m y a s a w h o le experienced, primarily affecting the Life business, as reflected in its penetration, density and depth indices9. Penetration and depth fell each year in 2017, 2018 and 2019, indicating a clearly slowing trend beginning in 2017. Nevertheless, insurance penetration increased in the economy in 2020, although the depth index cont inued i ts sharp downward trend caused by the deteriorating growth in the Life segment. The relative slowdown in density levels continued in 2020, even reversing slightly. Furthermore, the
performance of the Spanish market's main structural variables indicates that, despite having recorded improvements over the last ten years, they remain below the average for these
Source: MAPFRE Economics * Indices calculated as the quotient between country values for the structural coefficient in question, and average values for the overall EU-15 market during the year indicated. The unit represents a performance equivalent to the EU-15 average.
Non-Life penetration
Depth
Life penetration
Density
1
20102020
Chart 4.2-a Spain: elements of structural market
performance, 2010 and 2020
Below the EU-15 average
COMPARATIVE INDEX OF STRUCTURAL COEFFICIENTS* VS. EU-15 AVERAGE
PEN
ETRA
TION
(PRE
MIU
MS/
GDP)
5.0%
5.2%
5.4%
5.6%
5.8%
DEPTH (SHARE OF LIFE INSURANCE IN TOTAL PORTFOLIO)
35% 40% 45% 50%
2020
2018
2016
2012
2008
Chart 4.2-b Trends in the Spanish insurance market, 2008–2020
(penetration vs. depth)
Source: MAPFRE Economics

89
THE SPANISH INSURANCE MARKET IN 2020
indicators for the 15 major economies in the European Union, although the difference in the penetration level for Non-Life business was negligible (see Chart 4.2-a).
Market performance in 2020 seems to confirm that 2016 was a turning point at which it veered off course from the expansion that began in 2014 to return to structural parameters similar to those posted in 2008, especially as regards depth level (see Chart 4.2-b).
Analysis of the Market Development Index (MDI)10, shown in Chart 4.2-c, also confirms this structural trend in the performance of the Spanish insurance market, showing a clear change in the Spanish market's development in 2016, with 2020 seeing a decrease for the fourth consecutive year. Of the various factors behind this performance, the most notable include the slowdown of the Spanish economy and persistent low interest rates, which have affected the business model of the Life insurance segment in particular.
Insurance Protection Gap
Analyzed in the same way as in previous reports11, the IPG reflects the difference between insurance coverage considered economically necessary and beneficial to society, and the amount of coverage actually acquired. Estimating the IPG helps to determine the potential insurance market, which is the market size attainable should the gap disappear. However, it is important to emphasize that the IPG is therefore not a static concept; rather, it changes depending on the growth of the country's economy and the emergence of new risks that are inherent to economic and social development.
80
100
120
140
16020
0520
0620
0720
0820
0920
1020
1120
1220
1320
1420
1520
1620
1720
1820
1920
20
MDI
Chart 4.2-c Market Development Index (MDI) for Spain, 2005–2020
(index 2005=100; annual change)
Source: MAPFRE Economics
2005–20062006–20072007–20082008–20092009–20102010–20112011–20122012–20132013–20142014–20152015–20162016–20172017–20182018–20192019–2020
-30 -20 -10 0 10 20 30 40
-8.3-12.8
-4.6-22.4
33.2-3.6
-9.0-5.5-5.4
27.1-7.5
4.525.1
-7.9-4.1
Annual change in the MDI

90
THE SPANISH INSURANCE MARKET IN 2020
Due to its nature, the IPG is negatively correlated with insurance market growth. Seen from a quantitative perspective, the IPG reduces as penetration increases, but seen from a qualitative point of view, it also tends to decrease as markets become more sophisticated and mature. As such, factors such as sustained economic growth, controlled inflation, higher personal disposable income, the general development of the financial system, an efficient regulatory framework, and the implementation of public policies aimed at increasing financial inclusion and education are factors that drive a decrease in the IPG in the markets12.
2020 Spanish market IPG estimate
Chart 4.2-d shows how the IPG of the Spanish market changed between 2010 and 2020. As can be seen, the insurance gap was 31.6 billion euros in 2020 (1.9 billion euros less than in 2019), thanks to the posit ive performance of the Non-Life business in Spain in 2020, which practically closed the gap in this segment compared to the European benchmark markets. In structural terms, the composi t ion of the IPG cont inues to demonstrate room for further development in the Life insurance segment, as has been mentioned in previous reports. This is evidenced by the fact that, in 2020, 99.8% of
the IPG (31.5 billion euros) corresponded to the Life insurance segment (0.2 billion euros less than in the previous year) while the Non-Life sector (0.05 billion euros) represented only the remaining 0.2% (1.7 billion euros less than in the previous year). The reduction in the Spanish market's IPG in 2020 can therefore be explained by the performance of the Non-Life business, which offset the low contribution of the Life insurance business, which is consistent with the performance of the above-mentioned depth index.
Furthermore, the evolution of the potential insurance market in Spain, i.e. the sum of the actual insurance market and the IPG determined for each year, is shown in Chart 4.2-e. According to this estimate, the potential insurance market in Spain amounted to 90.4 billion euros in 2020, 53.6% above the premium volume actually observed during that year. Again, it is worth highlighting the particularly relevant potential of the Spanish market in the Life insurance segment, in both its Protection and Savings modalities. This is an area of the market that clearly has a lower relative development level compared to other European insurance markets.
0
10
20
30
40
2010
2011
2012
2013
2014
2015
2016
2017
2018
2019
2020
Total IPG
Chart 4.2-d Trends in the Insurance Protection Gap, 2010–2020
(billions of euros)
Source: MAPFRE Economics
0
10
20
30
40
2010
2011
2012
2013
2014
2015
2016
2017
2018
2019
2020
Non-Life IPG Life IPG

91
THE SPANISH INSURANCE MARKET IN 2020
The IPG as a multiple of the market and the ability to close the insurance gap.
The Spanish insurance market gap, expressed as a multiple of the actual insurance market, dropped in 2011 and 2016 but has shown an increasing trend in the last four years. The Life segment has performed similarly, while in Non-Life there has been a more decreasing trend, culminating in there being almost no gap in this line of business in 2020 (see Charts 4.2-f and 4.2-g). The Life insurance segment's
IPG during the year represented 144% of the actual market (29.0 pp more than in 2019), while the Non-Life segment's insurance gap was 0.14% of the actual market in 2020 (-4.7 pp less than in 2019).
Finally, Chart 4.2-h shows the estimate for the Spanish insurance market's capacity to close the insurance gap in the medium-term. In this regard, an updated comparative analysis is provided for the growth trends observed in the Spanish market throughout the last decade
Chart 4.2-e Insurance Protection Gap and potential market, 2010–2020
(billions of euros)
Source: MAPFRE Economics
0
20
40
60
80
100
2010
2011
2012
2013
2014
2015
2016
2017
2018
2019
2020
Actual market IPG90.4
Potential market
58.9 Actual market
31.6IPGt
2020vs. 2010
vs. 2019
Actual market IPG
+0.7
-5.3
-1.0
-1.9
(billions of euros)
0.0
0.2
0.4
0.6
0.8
2010
2011
2012
2013
2014
2015
2016
2017
2018
2019
2020
Total market
Chart 4.2-f Trends in the IPG as a multiple of the actual market, 2010–2020
(number of times actual insurance market)
Source: MAPFRE Economics
0.00
0.06
0.12
0.18
0.0
0.5
1.0
1.5
2010
2011
2012
2013
2014
2015
2016
2017
2018
2019
2020
Life (left axis) Non-Life (right axis)

92
THE SPANISH INSURANCE MARKET IN 2020
(2010–2020), indicating the growth rates needed to close the 2020 IPG over the next ten years.
This analysis shows that the growth of Spain's insurance market achieved an average annual growth of 0.1% (-0.6 pp less than the previous figure) for the 2010–2020 period, with the Life insurance segment falling at an average annual rate of -1.9% (-1.7 pp less than the previous figure) and the Non-Life insurance segment growing at an average annual rate of 1.5% (0.1 pp more than the previous year). As such, if the same growth pattern were maintained over the next ten years, the growth rate for the market as a whole would fall 4.3 pp short of covering the insurance gap recorded for 2020. This means that the Spanish insurance market would need an average growth rate of 4.3% over the next ten years in order to close the IPG estimated this past year.
As the Spanish market's insurance gap is determined by the performance of Life insurance, it is in this segment that the greatest growth efforts will be focused in order for the IPG to be closed within the time frame set out. Thus, for this segment, the rate observed falls 11.2 pp short of what is needed to close the relative gap in the next ten years. This means that in order to close the gap during this period, the Life insurance segment must grow at a sustained average annual rate of 13.1% over the next decade.
Chart 4.2-g Spain: medium-term IPG trends, 2010 and 2020
Source: MAPFRE Economics
IPG AS A MULTIPLE OF THE ACTUAL INSURANCE MARKET
20102020
Life
Total
Non-Life
1.0 0.5
2009
–201
920
10–2
020
-3% -2% -1% 0% 1% 2%
1.5%
1.4%
-1.9%
-0.2%
0.1%
0.7%
Total Life Non-Life
Chart 4.2-h Capacity to close the Insurance Protection Gap, 2010–2020
(average annual growth rate, %; sufficiency or insufficiency to close the IPG, pp)
Source: MAPFRE Economics
In 2
019
In 2
020
-15 -10 -5 0 5
1.5
1.0
-11.2
-8.2
-4.3
-3.6

93
THE SPANISH INSURANCE MARKET IN 2020
The growth insufficiency requirements for closing the IPG rose in the Spanish insurance market in 2020, thereby confirming the general slowdown mentioned in this report. As shown in Chart 4.2-h, between 2019 and 2020, the insufficiency requirements for closing the overall insurance gap increased by 0.7 pp, and by 3 pp in the Life insurance segment.


5. Analysis of capital requirements, own funds and solvency ratios
5.1. 2020 Solvency and Financial Condition Report
Solvency II requirement regulations applicable to insurance companies operating in the European Union establish a system based on three fundamental pillars: Pillar 1 is focused on determining the quantitative aspects that maintain company solvency, Pillar 2 oversees appropriate company governance/supervision, a n d P i l l a r 3 wa s co n ce i ve d to p a ss transparency and reporting requirements on to the market. This regulatory framework, which is currently being revised, aims to create incentives for insurance companies to appropriately manage risks so as to protect policyholder interests, and thereby ensure that the insurance industry contributes to economic and social development, and as a result, to the stability of the financial system.
In particular, the regulations that apply to Pillar 3 state that insurance companies must publish annual information on their financial and solvency position, providing consistent, comparable and detailed information through a Solvency and Financial Condition Report. Insofar as interested economic agents have information that allows them to comprehend each company's implicit risk, these regulations seek to ensure that they in a better position to evaluate the risk assessment and management procedures, the sufficiency of technical provisions and own funds and, therefore, the solvency position of a given company.
Insurance companies operating in the Spanish market published their SFCR for the fifth year in the first quarter of 2021. Based on publicly available information, the following is an analysis of the ratios published for a sample of leading insurance providers operating in the Life segment, those operating in both Life and
Non-Life (Composites), and those mainly devoted to the Non-Life insurance business line. There is also a comparison against these companies' positions at the end of the previous year13.
It should be noted that, in order to broaden this transparency commitment toward the market by insurance companies operating in the Spanish market, Pillar 3 regulations establish the obligation for such companies to disclose in their SFCR the impact that not applying transitional and adjustment measures (LTG measures) would have had on their solvency ratio. These LTG measures were introduced by the Directive to offset any potential damage to businesses with long-term guarantees arising as a result of Solvency II. The most relevant are:
• Transitional measure on technical provisions. This measure allows the difference between the technical provision estimated under the parameters of Solvency II and the one calculated in accordance with the previous Solvency I standards to be phased in gradually over an initial 16-year period, until January 1, 2032 (five years having now elapsed).
• Vo l a t i l i t y a d j u s t m e nt m e a s u re . Th is adjustment allows the discount interest rate used when valuing technical provisions to be corrected in order to mitigate the effects of one-time volatilities on investment portfolio spreads. The adjustment amount is calculated monthly by EIOPA, taking into account the investment portfolio profile at the sector-level in each country. It consists of an adjustment for each currency and an additional adjustment for the country in which the insurance company is located, if that specific market's volatility rises above a certain threshold.
95THE SPANISH INSURANCE MARKET IN 2020

96
THE SPANISH INSURANCE MARKET IN 2020
• Matching adjustment measure between assets and liabilities. When certain requirements are met, this measure makes it possible to adjust the discount curve for technical provisions for companies that have held-to maturity fixed income assets with durations similar to their liabilities and that are therefore not exposed to market spread volatility. This adjustment depends on the characteristics of the portfolio of assets that cover the insurance obligations that profit from this measure, meaning that it is a singular adjustment calculated by the insurance company itself.
It should be noted that this commitment to transparency is especially relevant for Life insurance companies and Composites (those who operate in both Life and Non-Life lines), which of fer products wi th long-term guarantees and to which the aforementioned LTG measures are therefore applicable. For companies mainly operating in the Non-Life insurance sector, the potential effects of not applying measures designed for products with long-term guarantees are negl ig ible . Furthermore, the events that took place in the 2020 fiscal year as a result of the economic
crisis caused by the COVID-19 pandemic highlight the importance and relevance of volatility and matching adjustments as mechanisms to (partially) offset the effects that occasional volatility spikes in financial markets may have on the solvency position of insurance companies and their groups, taking into account their nature of medium- and long-term institutional investors as well as their proper risk management. In this sense, the evolution of the volatility adjustment for the Spanish market reflects the high level of uncertainty experienced by financial markets in the early stages of the health and economic crisis caused by the pandemic (see Chart 5.1).
In March 2020, the currency volatility adjustment for the euro (calculated by EIOPA) reached the highest level that this indicator has seen since the Solvency II regulation came into force. This was due to the strong upturn in volatility to which the investment portfolios of the insurance companies operating in the European Economic Area were exposed. This adjustment also reflects the powerful effect of the message issued by the ECB on March 18, 2020 approving the PEPP, which involved re s o r t i n g t o t h e w i d e s p re a d u s e o f unconventional monetary policy measures to provide liquidity totaling 750 billion euros to bond markets (sovereign and corporate), making the maximum limits they can acquire from individual member states and between asset categories more flexible.
Subsequently, on June 4, 2020, the ECB extended the maximum limit of acquisitions by an additional 600 billion to 1.35 trillion euros, which was reflected again in the indicator, at a time when the trend seemed to be changing. Finally, on December 10, 2020, the ECB again increased the limit on acquisitions by an additional 500 billion to 1 . 8 5 t r i l l i o n e u r o s , e x t e n d i n g t h i s extraordinary purchase program as long as necessary and at least until the end of March 2022.
Source: MAPFRE Economics (based on EIOPA data)
(BAS
IS P
OIN
TS)
0
10
20
30
40
50
Jan-
19
Apr-
19
Jul-
19
Oct-
19
Jan-
20
Apr-
20
Jul-
20
Oct-
20
Jan-
21
Mar
-21
Chart 5.1 The Spanish market: volatility adjustment
trend, 2019–2021
ECB: Pandemic Emergency Purchase Programme — PEPP (705 billion euros)
1st PEPP extension (total 1.35 trillion euros)
2nd PEPP extension (total 1.85 trillion euros)

97
THE SPANISH INSURANCE MARKET IN 2020
5.2. Solvency ratios
The aggregate total solvency ratio for the selected sample of insurance companies operating in the Spanish market in 2020 was 241%, 2 pp below the value recorded in 2019 (243%). An analysis of own funds reveals that almost all eligible funds were of the highest quality (99% were Tier 1 at the aggregate level in the analyzed sample, a percentage similar to in the previous year).
Charts 5.2-a, 5.2-b, and 5.2-c show the solvency ratios published in the SFCRs by all the selected insurance companies operating in the Spanish insurance market (representing 70.3% of insurance premiums and 79.4% of market technical provisions in 2020), accompanied by comparisons against the previous year. Firstly, the aggregate solvency ratio for the sample of insurance companies mainly operating in the Life line during 2020 was 234% (245% in 2019), which represents a decline of -11 pp compared to the previous year. Chart 5.2-a shows that MAPFRE Vida still boasts the highest solvency ratio in this market segment, standing at 483%
(9.4 pp higher than in 2019). The improvement in the Bankia MAPFRE Vida ratio (+21.2 pp) is also noteworthy. Apart from Santander Seguros (-61.5 pp), Bansabadell Vida (-61.5 pp), BBVA Seguros (-5 pp), AXA Aurora Vida (-6 pp) and Mutualidad de la Abogacía (-13 pp), the remainder of the companies analyzed reported improved solvency ratios compared to the previous year.
Secondly, for the sample of companies considered in this report that operate in both the Life and Non-Life insurance sectors (Composites), the total aggregate solvency ratio for 2020 was 216% (225% in 2019), a decline of -9 pp compared to the previous fiscal year. Chart 5.2-b shows that, while Caser's ratio increased by 2 pp from 274% in 2019 to 276% in 2020, giving it the highest ratio within this group of companies, all remaining companies experienced a drop compared to the previous year. The case of Santalucía (217%) is particularly notable, as it saw a significant decline of -26 pp (217% in 2020 compared to 243% in 2019), as did Catalana Occidente, whose solvency ratio deteriorated by -20.4 pp (218% in 2020 versus 238% in 2019).
Chart 5.2-a Life: solvency ratios, 2019–2020
Source: MAPFRE Economics (based on data from the SFCRs published by the companies indicated)
MAPFRE Vida
Bansabadell Vida
BBVA Seguros
Nationale Nederlanden Vida
Ibercaja Vida
Santander Seguros
Mutualidad de la Abogacía
Bankia MAPFRE Vida
VidaCaixa
AXA Aurora Vida
0% 100% 200% 300% 400% 500%
171%
192%
174%
220%
278%
210%
232%
260%
332%
473%
165%
195%
195%
207%
217%
220%
242%
255%
271%
483%
2020 solvency ratio 2019 solvency ratio
-80 -60 -40 -20 0 20 40
-6.0
3.0
21.2
-13.0
-61.5
10.0
10.0
-5.0
-61.4
9.4
Variation in the solvency ratio, 2019–2020 (pp)

98
THE SPANISH INSURANCE MARKET IN 2020
Lastly, companies analyzed herein operating solely or fundamentally in the Non-Life insurance sector had a total aggregate solvency ratio of 273% in 2020 (257% in 2019), recording a 16-pp increase compared to the previous fiscal year. For this type of company, Chart 5.2-c shows an overall improvement in the solvency ratio, the most notable of which was Asisa with 237% (33 pp higher than in 2019), MAPFRE ESPAÑA with 236% (26 pp higher than in the previous year) and Mutua Madrileña with 464%
(26 pp higher than in 2019). Of the other companies, only two saw a reduction in their solvency margins: Ocaso, with a ratio of 272% (-32 pp compared to 2019), and SegurCaixa Adeslas with a ratio of 154% (-1.5 pp compared to 2019).
Chart 5.2-b Composites: solvency ratios, 2019–2020
Caser
Catalana Occidente
Santalucía
Generali
Allianz
0% 100% 200% 300%
190%
203%
243%
238%
274%
189%
196%
217%
218%
276%
2020 solvency ratio2019 solvency ratio
-30 -20 -10 0 10
-1.3
-7.0
-26.0
-20.4
2.0
Variation in the solvency ratio, 2019–2020 (pp)
Source: MAPFRE Economics (based on data from the SFCRs published by the companies indicated)
Chart 5.2-c Non-Life: solvency ratios, 2019–2020
Mutua Madrileña
Ocaso
Sanitas
Asisa
MAPFRE ESPAÑA
Reale Seguros Generales
AXA Seguros Generales
SegurCaixa Adeslas
0% 100% 200% 300% 400% 500%
155%
145%
211%
210%
204%
226%
304%
438%
154%
168%
215%
236%
237%
241%
272%
464%
2020 solvency ratio2019 solvency ratio
-40 -20 0 20 40
-1.6
23.0
4.6
26.2
33.0
14.9
-32.0
26.0
Variation in the solvency ratio, 2019–2020 (pp)
Source: MAPFRE Economics (based on data from the SFCRs published by the companies indicated)

99
THE SPANISH INSURANCE MARKET IN 2020
5.3. Life: comparative SCR analysis and the effect of transitional and adjustment measures
Table 5.3-a shows a breakdown of solvency capital requirement (SCR) results and the solvency ratios for each company operating in the Life segment included in this analysis, along with a few other figures provided for comparison. Chart 5.3-a shows the effect of the LTG measures applied by each company on their solvency ratios, as well as any variation in the overall benefit of these measures compared to the previous year. The analysis of this information shows unequal performance between 2019 and 2020 in the relative benefits obtained from applying these transitional and adjustment measures. The relative benefit obtained by applying these transitional and adjustment measures increased for MAPFRE Vida, Bansabadell Vida, Ibercaja Vida, Nationale Nederlanden Vida and Bankia MAPFRE Vida, but decreased for all other companies. It is important to note that this performance was influenced by the reduction in financial market volatility at the end of March 2020 following a sharp increase in volatility that led to further adjustments in the valuation of technical provisions and SCR when applying volatility and matching adjustments. In addition, there was
an abrupt change of course after the ECB's announcement of important unconventional measures to guarantee liquidity for sovereign a n d c o r p o r a t e b o n d m a r k e t s ( s e e aforementioned Chart 5.1).
Finally, as supplementary information for the sample of insurance companies operating in the Life segment, Charts 5.3-b and 5.3-c, as well as Tables 5.3-b and 5.3-c, show a breakdown of the potential impact on own funds and SCR if they were not entitled to apply the transitional and adjustment measures provided for in the Solvency II directive for insurance products with long-term guarantees.
5.4. Composites: comparative SCR analysis and the effect of transitional and adjustment measures
Table 5.4-a shows the results of the SCR and the solvency ratios for each of the companies operating in both the Life and Non-Life segments (Composites) considered in this analysis, along with a few other figures provided for comparison. Chart 5.4-a shows a breakdown of the weight of the measures applied by each company on solvency ratios, as well as any
CompanyTechnical
provisions (TP) Premiums*
Eligible own
fundsSCR
requiredSolvency
ratioSCR
over TP
Eligible own funds over
assetsSCR over
premiums
VidaCaixa 69,032,947 7,125,513 3,946,420 2,024,150 195.0% 2.9% 2.3% 28.4%
MAPFRE Vida 12,853,272 1,204,911 2,585,385 535,828 482.5% 4.2% 2.9% 44.5%
Bankia MAPFRE Vida 6,402,181 165,372 482,224 246,741 195.4% 3.9% 2.9% 149.2%
Santander Seguros 16,642,979 2,098,890 1,862,217 859,598 216.6% 5.2% 3.7% 41.0%
BBVA Seguros 12,976,432 1,128,081 1,887,291 739,671 255.2% 5.7% 3.7% 65.6%
Bansabadell Vida 9,153,214 1,301,151 793,650 293,342 270.6% 3.2% 2.6% 22.5%
Mutualidad de la Abogacía 8,561,990 587,971 1,785,464 862,073 207.1% 10.1% 7.9% 146.6%
Ibercaja Vida 7,334,238 957,511 602,220 273,146 220.5% 3.7% 3.3% 28.5%
AXA Aurora Vida 6,910,998 637,552 705,789 426,790 165.4% 6.2% 4.9% 66.9%
Nationale Nederlanden Vida 3,752,524 510,324 418,801 173,176 241.8% 4.6% 3.9% 33.9%
Table 5.3-a Life: SCR result and solvency ratio, 2020
(thousands of euros)
Source: MAPFRE Economics (based on data from the SFCRs published by the companies indicated) * Taken from figures on premiums, loss experience and expenses.

100
THE SPANISH INSURANCE MARKET IN 2020
variation in the overall benefit of these measures compared to the previous year.
Finally, as supplementary information, Charts 5.4-b and 5.4-c, as well as Tables 5.4-b and 5.4-c, provide a summary of the comparative analysis of the potential impact on own funds and SCR if the insurance companies considered in this segment were not entitled to apply the transitional and adjustment measures provided for in the Solvency II directive for insurance products with long-term guarantees. In this case, the company benefiting the most from the LTG measures in 2020 was Caser, with a solvency ratio that improved by 107 pp, essentially due to the application of the transitional measure on technical provisions.
5.5. Non-Life: comparative SCR analysis
Finally, companies analyzed in this report operating solely or fundamentally in the Non-Life insurance sector are listed in Table 5.5 along with their SCR results and solvency ratios in 2019. This information is combined with other figures to facilitate comparisons. It should be noted that the analysis of the variation in the solvency ratio between 2019 and 2020 for the insurance companies included in the sample for this segment of the Spanish market is presented in point 5.2 of this report (see aforementioned Chart 5.2-c).
As previously mentioned, the potential impact of not being entitled to apply measures designed for products with long-term guarantees (LTGs) is not shown for this business segment as it is negligible; these measures are effective for companies operating in the Life line, or for Composites with significant elements of this type of business.
-20 -10 0 10 20 30
14.4
-7.8
-11.2
2.6
-1.6
-7.5
-0.1
0.8
20.4
18.1
Chart 5.3-a Life: effect of LTG measures on 2020 solvency ratios and variation vs. 2019
Source: MAPFRE Economics (based on data from the SFCRs published by the companies indicated)
MAPFRE Vida
Bansabadell Vida
Ibercaja Vida
Mutualidad de la Abogacía
BBVA Seguros
AXA Aurora Vida
Nationale Nederlanden Vida
VidaCaixa
Santander Seguros
Bankia MAPFRE Vida
-100% 0% 100% 200% 300% 400% 500%
2020 ratio (no adjustments) TP transitional effectVolatility adjustment effect Matching adjustment effect
Variation in effects of LTG measures on total solvency ratio, 2019–2020 (pp)
483%
271%
220%
207%
255%
165%
242%
195%
217%
195%

101
THE SPANISH INSURANCE MARKET IN 2020
Chart 5.3-b Life: impact of transitional and adjustment measures on own funds, 2020
(millions of euros)
Source: MAPFRE Economics (based on data from the SFCRs published by the companies indicated) * Negative variation implies increased impact of adjustment.
Impact on 2020 own funds Variation vs. 2019*
VidaCaixa
MAPFRE Vida
Bankia MAPFRE Vida
Santander Seguros
BBVA Seguros
Bansabadell Vida
Mutualidad de la Abogacía
Ibercaja Vida
AXA Aurora Vida
Nationale Nederlanden Vida
-80 -40 0 40 80
-3.9
-42.9
1.3
-57.8
-0.8
-2.4
58.2
-8.3
4.9
-1.7
-21.6
4.5
1.1
-2.4
-0.7
-0.8
-13.9
10.9
5.5
-24.1
0.1
6.0
44.8
VidaCaixa
MAPFRE Vida
Bankia MAPFRE Vida
Santander Seguros
BBVA Seguros
Bansabadell Vida
Mutualidad de la Abogacía
Ibercaja Vida
AXA Aurora Vida
Nationale Nederlanden Vida
-1,800 -1,200 -600 0
-40.9
-42.9
-153.2
-152.4
-78.2
-185.9
-1,434.1
-8.3
-14.6
-6.7
-49.3
-6.5
-7.3
-13.5
-10.3
-15.7
-12.1
-130.7
-63.7
-455.6
-672.5
-72.3
-537.8
TP transitional adjustment Volatility adjustment Matching adjustment

102
THE SPANISH INSURANCE MARKET IN 2020
Chart 5.3-c Life: impact of transitional and adjustment measures on SCR, 2020
(millions of euros)
Source: MAPFRE Economics (based on data from the SFCRs published by the companies indicated) * Negative variation implies increased impact of adjustment.
Impact on 2020 SCR Variation vs. 2019*
VidaCaixa
MAPFRE Vida
Bankia MAPFRE Vida
Santander Seguros
BBVA Seguros
Bansabadell Vida
Mutualidad de la Abogacía
Ibercaja Vida
AXA Aurora Vida
Nationale Nederlanden Vida
-80 -40 0 40
1.3
14.3
-19.5
6.7
19.0
11.8
-54.2
0.0
-1.9
-0.2
-1.8
-1.5
0.3
0.5
3.7
-0.1
0.1
-0.1
-0.3
-0.5
24.1
18.0
VidaCaixa
MAPFRE Vida
Bankia MAPFRE Vida
Santander Seguros
BBVA Seguros
Bansabadell Vida
Mutualidad de la Abogacía
Ibercaja Vida
AXA Aurora Vida
Nationale Nederlanden Vida
-400 -300 -200 -100 0 100
-36.4
14.3
-7.9
41.3
20.1
-42.0
-335.0
0.0
0.4
-0.6
2.2
5.5
0.9
4.5
0.4
4.1
0.4
3.6
6.4
24.3
18.0
TP transitional adjustment Volatility adjustment Matching adjustment

103
THE SPANISH INSURANCE MARKET IN 2020
CompanyEligible own
funds*
Impact of the TP transitional adjustment
on own funds
Impact of the volatility adjustment on own
funds
Impact of the matching adjustment on own
funds
VidaCaixa 3,946,420 - -12,148 -1,434,102
MAPFRE Vida 2,585,385 -537,786 -15,726 -185,916
Bankia MAPFRE Vida 482,224 -72,253 -10,262 -78,159
Santander Seguros 1,862,217 -672,524 -13,534 -152,371
BBVA Seguros 1,887,291 -455,596 -7,259 -153,228
Bansabadell Vida 793,650 - -6,513 -42,873
Mutualidad de la Abogacía 1,785,464 -63,683 -49,332 -
Ibercaja Vida 602,220 - -6,664 -40,945
AXA Aurora Vida 705,789 - -14,630 -
Nationale Nederlanden Vida 418,801 -130,661 -8,333 -
Table 5.3-b Life: impact of applying directive measures for long-term products on own funds, 2020
(thousands of euros)
Source: MAPFRE Economics (based on data from the SFCRs published by the companies indicated) * For the effects shown in this Table, we have used the effects on eligible own funds indicated by each company in their reports.
CompanySCR
required
Impact of the TP transitional adjustment
on SCRImpact of the volatility
adjustment on SCR
Impact of the matching
adjustment on SCR
VidaCaixa 2,024,150 - 4,101 -334,976
MAPFRE Vida 535,828 17,997 385 -42,008
Bankia MAPFRE Vida 246,741 24,306 4,534 20,143
Santander Seguros 859,598 6,371 900 41,335
BBVA Seguros 739,671 3,611 5,474 -7,894
Bansabadell Vida 293,342 - 2,171 14,291
Mutualidad de la Abogacía 862,073 - - -
Ibercaja Vida 273,146 - -556 -36,414
AXA Aurora Vida 426,791 - 426 -
Nationale Nederlanden Vida 173,176 386 38 -
Table 5.3-c Life: impact of applying directive measures for long-term products on own funds, 2020
(thousands of euros)
Source: MAPFRE Economics (based on data from the SFCRs published by the companies indicated)

104
THE SPANISH INSURANCE MARKET IN 2020
Company
Technical provisions
(TP) Premiums* Eligible
own fundsSCR
requiredSolvency
ratioSCR over
TPSCR over
premiums
Eligible own funds
over assets
Allianz 8,474,499 2,925,468 1,252,527 663,744 188.7% 7.8% 22.7% 5.7%
Generali 7,209,624 2,070,988 1,922,253 978,976 196.4% 13.6% 47.3% 8.9%
Santalucía 4,320,746 1,442,893 1,831,706 845,264 216.7% 19.6% 58.6% 12.0%
Caser 4,281,004 1,007,036 1,613,019 584,996 275.7% 13.7% 58.1% 8.6%
Catalana Occidente 4,231,815 1,120,279 1,814,005 831,895 218.1% 19.7% 74.3% 12.0%
Table 5.4-a Composites: SCR result and solvency ratio, 2020
(thousands of euros)
Source: MAPFRE Economics (based on data from the SFCRs published by the companies indicated) * Taken from figures on premiums, loss experience and expenses.
Chart 5.4-a Composites: impact of LTG measures on 2020 solvency ratios and variation vs. 2019
Source: MAPFRE Economics (based on data from the SFCRs published by the companies indicated)
Santalucía
Catalana Occidente
Generali
Allianz
Caser
-100% 0% 100% 200% 300%
2020 ratio (no adjustments) TP transitional effectVolatility adjustment effect Matching adjustment effect
-30 -20 -10 0 10
-27.1
-1.5
-2.1
-2.0
-8.6
Variation in effects of LTG measures on total solvency ratio, 2019–2020 (pp)
217%
218%
196%
189%
276%

105
THE SPANISH INSURANCE MARKET IN 2020
Chart 5.4-b Composites: impact of transitional and adjustment measures on own funds, 2020
(millions of euros)
Source: MAPFRE Economics (based on data from the SFCRs published by the companies indicated) * Negative variation implies increased impact of adjustment.
Impact on 2020 own funds Variation vs. 2019*
Allianz
Generali
Santalucía
Caser
Catalana Occidente
-20 0 20 40 60 80
-0.9
-0.8
0.9
60.3
0.3
15.0
12.4
61.1
Allianz
Generali
Santalucía
Caser
Catalana Occidente
-500 -400 -300 -200 -100 0 100
-50.4
-9.1
-17.4
32.0
-18.3
-13.3
-149.1
-432.2
TP transitional adjustment Volatility adjustment Matching adjustment
Chart 5.4-c Composites: impact of transitional and adjustment measures on SCR, 2020
(millions of euros)
Source: MAPFRE Economics (based on data from the SFCRs published by the companies indicated) * Negative variation implies increased impact of adjustment.
Impact on 2020 SCR Variation vs. 2019*
Allianz
Generali
Santalucía
Caser
Catalana Occidente
-40 -20 0 20
2.0
-0.2
-25.3
-3.8
-9.0
-1.4
-9.9
Allianz
Generali
Santalucía
Caser
Catalana Occidente
-50 0 50 100 150
-20.2
0.9
-19.8
0.3
5.6
0.7
111.8
TP transitional adjustment Volatility adjustment Matching adjustment

106
THE SPANISH INSURANCE MARKET IN 2020
CompanyEligible own
funds*
Impact of the TP transitional adjustment on
own funds
Impact of the volatility adjustment on own
funds
Impact of the matching adjustment on own
funds
Allianz 1,252,527 - -13,332 -
Generali 1,922,253 - -18,278 -
Santalucía 1,831,706 - 31,961 -
Caser 1,613,019 -432,195 -17,401 -50,431
Catalana Occidente 1,814,005 -149,120 -9,124 -
Table 5.4-b Composites: impact of applying directive measures for long-term products on own funds, 2020
(thousands of euros)
Source: MAPFRE Economics (based on data from the SFCRs published by the companies indicated) * For the effects shown in this Table, we have used the effects on eligible own funds indicated by each company in their reports.
CompanySCR
requiredImpact of the TP transitional
adjustment on SCRImpact of the volatility
adjustment on SCRImpact of the matching
adjustment on SCR
Allianz 663,744 - 742 -
Generali 978,976 - 5,637 -
Santalucía 845,264 - 333 -
Caser 584,996 111,847 -19,827 -20,179
Catalana Occidente 831,895 - 859 -
Table 5.4-c Composites: impact of applying directive measures for long-term products on SCR, 2020
(thousands of euros)
Source: MAPFRE Economics (based on data from the SFCRs published by the companies indicated)
Company Premiums*
Technical provisions
(TP)Eligible own
fundsSCR
requiredSolvency
ratioSCR over
premiums
Eligible own funds
over assetsSCR over
TP
MAPFRE ESPAÑA 5,047,529 4,322,624 2,930,785 1,240,991 236.2% 24.6% 13.3% 28.7%
SegurCaixa Adeslas 3,981,432 1,522,299 888,176 578,502 153.5% 14.5% 16.1% 38.0%
AXA Seguros Generales 1,936,724 1,621,871 989,333 590,013 167.7% 30.5% 16.0% 36.4%
Mutua Madrileña 1,511,732 2,328,044 4,936,137 1,064,617 463.7% 70.4% 13.0% 45.7%
Sanitas 1,463,565 75,528 443,010 183,638 241.2% 12.5% 25.3% 243.1%
Asisa 1,257,200 255,250 512,443 216,609 236.6% 17.2% 24.3% 84.9%
Ocaso 1,031,597 2,225,895 1,343,793 493,646 272.2% 47.9% 12.8% 22.2%
Reale Seguros Generales 925,019 676,507 483,583 224,448 215.5% 24.3% 15.4% 33.2%
Table 5.5 Non-Life: SCR result and solvency ratio, 2020
(thousands of euros)
Source: MAPFRE Economics (based on data from the SFCRs published by the companies indicated) * Taken from figures on premiums, loss experience and expenses.
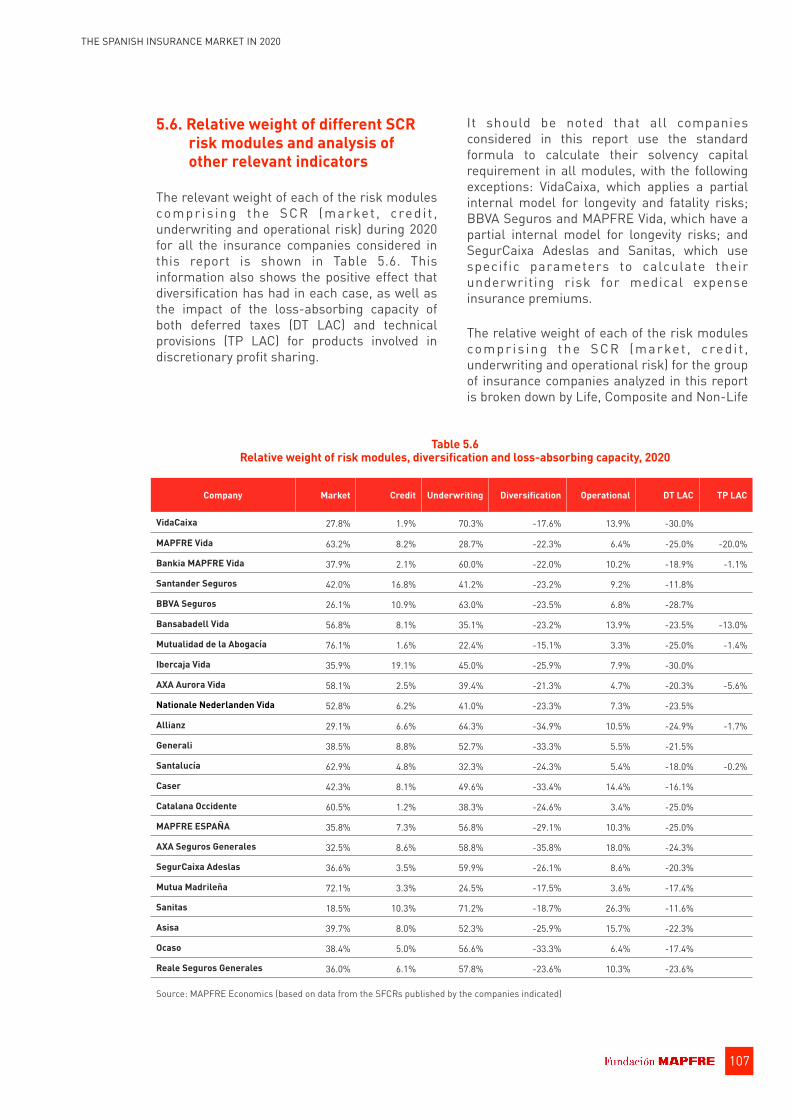
107
THE SPANISH INSURANCE MARKET IN 2020
5.6. Relative weight of different SCR risk modules and analysis of other relevant indicators
The relevant weight of each of the risk modules compr is ing the SCR (market , cred i t , underwriting and operational risk) during 2020 for all the insurance companies considered in this report is shown in Table 5.6. This information also shows the positive effect that diversification has had in each case, as well as the impact of the loss-absorbing capacity of both deferred taxes (DT LAC) and technical provisions (TP LAC) for products involved in discretionary profit sharing.
It should be noted that all companies considered in this report use the standard formula to calculate their solvency capital requirement in all modules, with the following exceptions: VidaCaixa, which applies a partial internal model for longevity and fatality risks; BBVA Seguros and MAPFRE Vida, which have a partial internal model for longevity risks; and SegurCaixa Adeslas and Sanitas, which use specific parameters to calculate their underwriting risk for medical expense insurance premiums.
The relative weight of each of the risk modules compr is ing the SCR (market , cred i t , underwriting and operational risk) for the group of insurance companies analyzed in this report is broken down by Life, Composite and Non-Life
Company Market Credit Underwriting Diversification Operational DT LAC TP LAC
VidaCaixa 27.8% 1.9% 70.3% -17.6% 13.9% -30.0%
MAPFRE Vida 63.2% 8.2% 28.7% -22.3% 6.4% -25.0% -20.0%
Bankia MAPFRE Vida 37.9% 2.1% 60.0% -22.0% 10.2% -18.9% -1.1%
Santander Seguros 42.0% 16.8% 41.2% -23.2% 9.2% -11.8%
BBVA Seguros 26.1% 10.9% 63.0% -23.5% 6.8% -28.7%
Bansabadell Vida 56.8% 8.1% 35.1% -23.2% 13.9% -23.5% -13.0%
Mutualidad de la Abogacía 76.1% 1.6% 22.4% -15.1% 3.3% -25.0% -1.4%
Ibercaja Vida 35.9% 19.1% 45.0% -25.9% 7.9% -30.0%
AXA Aurora Vida 58.1% 2.5% 39.4% -21.3% 4.7% -20.3% -5.6%
Nationale Nederlanden Vida 52.8% 6.2% 41.0% -23.3% 7.3% -23.5%
Allianz 29.1% 6.6% 64.3% -34.9% 10.5% -24.9% -1.7%
Generali 38.5% 8.8% 52.7% -33.3% 5.5% -21.5%
Santalucía 62.9% 4.8% 32.3% -24.3% 5.4% -18.0% -0.2%
Caser 42.3% 8.1% 49.6% -33.4% 14.4% -16.1%
Catalana Occidente 60.5% 1.2% 38.3% -24.6% 3.4% -25.0%
MAPFRE ESPAÑA 35.8% 7.3% 56.8% -29.1% 10.3% -25.0%
AXA Seguros Generales 32.5% 8.6% 58.8% -35.8% 18.0% -24.3%
SegurCaixa Adeslas 36.6% 3.5% 59.9% -26.1% 8.6% -20.3%
Mutua Madrileña 72.1% 3.3% 24.5% -17.5% 3.6% -17.4%
Sanitas 18.5% 10.3% 71.2% -18.7% 26.3% -11.6%
Asisa 39.7% 8.0% 52.3% -25.9% 15.7% -22.3%
Ocaso 38.4% 5.0% 56.6% -33.3% 6.4% -17.4%
Reale Seguros Generales 36.0% 6.1% 57.8% -23.6% 10.3% -23.6%
Table 5.6 Relative weight of risk modules, diversification and loss-absorbing capacity, 2020
Source: MAPFRE Economics (based on data from the SFCRs published by the companies indicated)

108
THE SPANISH INSURANCE MARKET IN 2020
(MIL
LION
S OF
EUR
OS)
0
2,000
4,000
6,000
8,000
10,000
12,000
Mar
ket r
isk
Coun
terp
arty
risk
Unde
rwrit
ing
risk
Sum
of r
isks
Dive
rsifi
catio
n
Basi
c SC
R
Oper
atio
nal
Tech
nica
l pro
visi
ons/
de
ferr
ed ta
x ad
just
men
ts
SCR
Chart 5.6-a Life: relative weight of the different SCR elements for the sample analyzed, 2020
Source: MAPFRE Economics (based on data from the SFCRs published by the companies indicated)
44.1%
6.6%
49.3%
10,230.1
-20.4%
8,147.6
9.1%
-27.7%
6,432.6
-1.1 pp +0.1 pp +1.0 pp 464.6 +0.2 pp 388.5 -0.8 pp +1.4 pp 383.0Variation vs. 2019
(MIL
LION
S OF
EUR
OS)
0
1,000
2,000
3,000
4,000
5,000
6,000
7,000
Mar
ket r
isk
Coun
terp
arty
risk
Unde
rwrit
ing
risk
Sum
of r
isks
Dive
rsifi
catio
n
Basi
c SC
R
Oper
atio
nal
Tech
nica
l pro
visi
ons/
de
ferr
ed ta
x ad
just
men
ts
SCR
Chart 5.6-b Composites: relative weight of the different SCR elements for the sample analyzed, 2020
Source: MAPFRE Economics (based on data from the SFCRs published by the companies indicated)
46.7%
5.9%
47.4%
6,650.7
-30.0%
4,657.5
7.0%
-21.7%
3,904.9
-3.8 pp -0.2 pp +4.0 pp -171.3 -1.4 pp -217.9 +1.0 pp +1.5 pp -68.3Variation vs. 2019

109
THE SPANISH INSURANCE MARKET IN 2020
(MIL
LION
S OF
EUR
OS)
0
2,000
4,000
6,000
8,000M
arke
t ris
k
Coun
terp
arty
risk
Unde
rwrit
ing
risk
Sum
of r
isks
Dive
rsifi
catio
n
Basi
c SC
R
Oper
atio
nal
Tech
nica
l pro
visi
ons/
de
ferr
ed ta
x ad
just
men
ts
SCR
Chart 5.6-c Non-Life: relative weight of the different SCR elements for the sample analyzed, 2020
Source: MAPFRE Economics (based on data from the SFCRs published by the companies indicated)
43.0%
6.0%
51.0%
7,267.7
-27.0%
5,303.6
9.8%
-21.2%
4,590.7
-1.0 pp +0.6 pp +0.4 pp -45.8 -0.9 pp -98 +0.3 pp -0.2 pp -81.4Variation vs. 2019
(MIL
LION
S OF
EUR
OS)
0
5,000
10,000
15,000
20,000
25,000
Mar
ket r
isk
Coun
terp
arty
risk
Unde
rwrit
ing
risk
Sum
of r
isks
Dive
rsifi
catio
n
Basi
c SC
R
Oper
atio
nal
Tech
nica
l pro
visi
ons/
de
ferr
ed ta
x ad
just
men
ts
SCR
Chart 5.6-d Total market: relative weight of the different SCR elements for the sample analyzed, 2020
Source: MAPFRE Economics (based on data from the SFCRs published by the companies indicated)
44.5%
6.2%
49.3%
24,148.6
-25.0%
18,108.7
8.8%
-24.2%
14,928.3
-1.8 pp +0.1 pp +1.7 pp 247.4 -0.5 pp 72.7 +0.1 pp +0.8 pp 233.3Variation vs. 2019

110
THE SPANISH INSURANCE MARKET IN 2020
segments and detailed in Charts 5.6-a, 5.6-b, 5.6-c, and 5.6-d. Likewise, said charts also show the positive effect of diversification in each case, as well as the positive effect derived from the loss-absorbing capacity of both deferred taxes and technical provisions for products involved in profit sharing. Any variation compared to 2019 in the relative weight of each module is also reflected at the top of each Chart.
In 2019, the Life segment (Chart 5.6-a) saw an increase in the relative weight of market risk (+1.5 pp) and a decrease in the weight of counterparty risk (-1.5 pp). The relative weight of underwriting risk remains similar to that of the previous year. There was also a decrease in the relative weight of market risk in 2020 (-1.1 pp) and an increase in counterparty risk (+0.1 pp) and underwriting risk (+1 pp). In addition, there is an increase in the overall weight of diversification profit (+0.2 pp), as well as an increase in the loss-absorbing capacity of deferred taxes and technical provisions for products involved in discretionary profit sharing (+1.4 pp).
For Composite companies (Chart 5.6-b), the reduction in the relative weight of the market risk module (-3.8 pp) between 2019 and 2020 and the increase in the relative weight of underwriting risk (+4 pp) should be noted. Companies engaged predominantly in Non-Life insurance (Chart 5.6-c) experienced a reduction in the relative weight of market risk (-1 pp) and an increase in the weight of counterparty risk (+0.6 pp), as well as a slight benefit from the deferred tax adjustment (-0.2 pp) between 2019 and 2020.
Finally, for the market as a whole (Chart 5.6-d), there was a reduction in the weight of the market risk element (-1.8 pp), and an increase in the weight of counterparty and underwriting risks (+0.1 pp and +1.7 pp respectively). The information also indicates that the benefits of diversification decreased slightly between 2019 and 2020 (-0.5 pp), and that there was a slight drop in the weight of the operational risk module (-0.1 pp).
Source: MAPFRE Economics (based on data from the SFCRs published by the companies indicated)
SanitasMutua Madrileña
AsisaReale Seguros Generales
MAPFRE ESPAÑAAXA Generales
OcasoSegurCaixa AdeslasCatalana Occidente
SantalucíaCaser
Generali EspañaMutualidad de la Abogacía
MAPFRE VidaAllianz
BBVASantander
Nationale Nederlanden VidaAXA Aurora Vida
Bansabadell VidaIbercaja Vida
Bankia MAPFRE VidaVidaCaixa
0% 200% 400% 600%
5.7%
7.5%
8.2%
8.7%
10.2%
11.2%
11.2%
14.5%
14.8%
20.1%
20.9%
26.7%
37.7%
42.4%
42.9%
58.3%
60.4%
61.0%
67.8%
71.5%
200.8%
212.0%
586.6%
Chart 5.6-e Relative weight of own funds vs. technical
provisions, 2020
Source: MAPFRE Economics (based on data from the SFCRs published by the companies indicated)
Mutua MadrileñaMutualidad de la Abogacía
Bankia MAPFRE VidaMAPFRE Vida
BBVACatalana Occidente
CaserOcaso
SantalucíaAXA Aurora VidaGenerali España
SantanderNationale Nederlanden Vida
Ibercaja VidaBansabadell VidaMAPFRE ESPAÑA
VidaCaixaReale Seguros Generales
AXA GeneralesAllianz
AsisaSanitas
SegurCaixa Adeslas0% 200% 400%
22.3%
30.3%
40.8%
42.8%
51.1%
52.3%
55.4%
58.1%
61.0%
62.9%
82.1%
88.7%
92.8%
110.7%
126.9%
130.3%
160.2%
161.9%
167.3%
214.6%
291.6%
303.7%
326.5%
Chart 5.6-f Relative weight of own funds vs. premiums,
2020

111
THE SPANISH INSURANCE MARKET IN 2020
Finally, Charts 5.6-e, 5.6-f, and 5.6-g show a comparison of the relative weight of eligible own funds for the insurance companies a n a l y z e d , b a s e d o n ce r t a i n f i g u re s representative of their size, such as total volume of assets, technical provisions and premiums.
Source: MAPFRE Economics (based on data from the SFCRs published by the companies indicated)
SanitasMutua Madrileña
AsisaOcaso
Reale Seguros GeneralesMAPFRE ESPAÑA
AXA GeneralesCatalana Occidente
SantalucíaSegurCaixa Adeslas
CaserGenerali España
Mutualidad de la AbogacíaMAPFRE Vida
AllianzNationale Nederlanden Vida
BBVAAXA Aurora Vida
SantanderIbercaja Vida
Bansabadell VidaBankia MAPFRE Vida
VidaCaixa0% 40% 80%
4.5%
5.7%
7.1%
7.3%
8.0%
8.2%
9.3%
9.5%
10.8%
13.8%
16.3%
17.5%
23.8%
24.7%
25.9%
26.2%
26.9%
31.5%
33.1%
34.9%
57.5%
60.2%
61.1%
Chart 5.6-g Relative weight of own funds vs. assets, 2020


6. Regulatory outlook
113THE SPANISH INSURANCE MARKET IN 2020
6.1. Global trends
IAIS global capital standard
2020 was the first year of the monitoring phase of the common framework for the cross-border solvency supervision of internationally active insurance groups (IAIGs), performed by the International Association of Insurance Supervisors (IAIS). This monitoring phase of the common framework (ComFrame) will run from 2020 to 2025 and will be followed by an implementation phase starting in 2026. The ComFrame14 includes a number of Insurance Core Principles (ICPs) applicable to the supervision of IAIGs, as well as an International Capital Standard (ICS) for these insurance groups. The standard applies to IAIGs that meet minimum international activity volume requirements, based on three criteria: (i) they have at least 50 billion dollars in assets or 10 billion dollars in premiums; (ii) they operate in at least three jurisdictions; and (iii) at least 10% of their premiums are underwritten outside the original jurisdiction.
In the monitoring phase, the minimum solvency capital calculation required for IAIGs is used for discussion by supervisory colleges on a confidential basis and supervisory action will not be taken based on the results of the standard being applied. The information provided by supervisors during the process will help to drive additional improvements prior to the standard being implemented as a Prescribed Capital Requirement (PCR).
Furthermore, in 2020, the IAIS conducted its first global insurance market evaluation exercise from the perspective of its potential systemic risk, under the new regulatory and supervisory framework called the Holistic Framework, approved at the end of 2019. This exercise (the Global Monitoring Exercise — GME) is part of the monitoring measures aimed
at helping to preserve global financial stability and in 2020, it was adapted to assess the impact of the pandemic on the industry. The result of this exercise showed that the greatest impact was on assets, negatively affecting the profitability and solvency of the insurance industry, although insurers remained resilient both financially and operationally (details on the outcome of this exercise can be found in the 2020 Global Insurance Market Report: COVID-19 Edition15).
6.2. European Union and Spanish market
Solvency II
An important development in the process for the in-depth review of the Solvency II framework occurred in 2020 and may affect aspects included in the directive. On December 17, 2020, EIOPA published its final technical recommendation submitted to the European Commission containing its opinion on the aspects to be addressed by the reform16.
As indicated in its technical recommendation, EIOPA maintains that the Solvency I I G u i d e l i n e s F r a m e w o r k i s w o r k i n g satisfactorily overall , and that i t has signif icantly helped to build the r isk management capacity of insurance companies and their groups. It therefore suggests an evolution of this Guidelines Framework, rather than a revolution. However, it makes significant changes to some key aspects such as the calculation of capital risk weights by interest rate risk, interest rate curves, volatility adjustments, and risk margin, with regard to the calculation of technical provisions, among other things. It also contains a new proposal regarding equity investments, noting that the ability to maintain securities of this type is greater if they support illiquid long-term

114
THE SPANISH INSURANCE MARKET IN 2020
insurance obligations, which would justify more favorable prudential treatment.
The European Commission is working on its legislative reform proposal, which is expected to be released in the third quarter of 2021. Once the Commission has prepared its proposal, it will be debated and approved by the co-legislators (European Council and Parliament), meaning that publication of the reform in the Official Journal of the European Union may not take place until next year.
Insurance distribution and consumer protection
Royal Decree 287/2021 of April 20, on the training and statistical and accounting reporting of insurance and reinsurance distributors in Spain, together with Royal Decree Law 3/2020 of February 4, on urgent measures for the incorporation into the Spanish legal system of various European Union directives regarding private insurance and pension funds and plans (among others), completed the transposition of the Insurance Distribution Directive into Spanish law. Thus, the new regulation on the reporting of information for supervisory purposes is incorporated, and the training (both initial and ongoing) to ensure that insurance distributors possess the necessary knowledge of the products that they sell is regulated, taking into account its complexity, and that client needs are met. Sales activity, informed or advised, may be carried out by the different classes of distributors listed in Royal Decree-Law 3/2020.
Biometric tables
On December 17, 2020, the General Directorate for Insurance and Pension Funds approved its resolution allowing mortality and survivorship tables to be used by insurance and reinsurance companies and approving the technical guide for supervision criteria regarding biometric tables and various recommendations to support the development of sectoral biometric statistics17.
The Resolution of June 2, 2021 of the General Directorate for Insurance and Pension Funds subsequently approved the eligibility of the following as benchmark biometric assumptions for the assessment of accounting technical provisions and for the purposes assessing technical provisions for the special biometric table solvency regime18:
(a) for survivorship insurance, first order tables PER2020_Col_1er.orden for group insurance, and PER2020_Ind_1er.orden for individual insurance, and
(b) for Life Protection insurance, the first order tables PASEM2020_Rel_1er.orden for Life Protection insurance related to other operations, PASEM2020_Decesos_1er.orden for Burial insurance, and PASEM2020_NoRel_1er.orden for other Life Protection insurance.

Index of charts and tables
Table 2.3 Ranking of main internationally active Spanish insurance groups by total insurance premiums at a global level, 2020 38 ...............................................................................
Table 2.4-a Non-Life: business distribution structure by channel 43 ...............................................Table 2.4-b Life: business distribution structure by channel 43 ........................................................Table 3.1-a Size of the world's largest insurance markets, 2020 45 .................................................Table 3.1-b Distribution of business by lines, 2019–2020 47 .............................................................Table 3.1-c Contribution to insurance market growth, 2010–2020 49 ...............................................Table 3.1-d Contribution to Life and Non-Life insurance market growth, 2010–2020 49 .................Table 3.1-e Spanish insurance industry results, 2019–2020 51 .........................................................Table 3.1-f Basic Non-Life insurance indicators, 2019–2020 51 .......................................................Table 3.1-g Basic Life insurance indicators, 2019–2020 51 ...............................................................Table 3.1-h Premium volume by Autonomous Community, 2020 56 .................................................Table 3.1-i Activity of the Insurance Compensation Consortium, 2019–2020 57 ..............................Table 3.2-a Trends in average Automobile insurance premiums, 2010–2020 59 ..............................Table 3.2-b Basic Automobile insurance indicators, 2019–2020 59 ...................................................Table 3.2-c Frequencies and average costs by guarantee in Automobile insurance, 2019–2020 60 .................................................................................................Table 3.2-d Basic Health insurance indicators, 2019–2020 61 ..........................................................Table 3.2-e Basic Multirisk insurance indicators, 2019–2020 64 .......................................................Table 3.2-f Basic Homeowners Multirisk insurance indicators, 2019–2020 65 ................................Table 3.2-g Basic Industrial Multirisk insurance indicators, 2019–2020 65 ......................................Table 3.2-h Basic Commercial Multirisk insurance indicators, 2019–2020 66 ..................................Table 3.2-i Basic Condominium Multirisk insurance indicators, 2019–2020 66 ...............................Table 3.2-j Basic Burial insurance indicators, 2019–2020 68 ...........................................................Table 3.2-k Basic Third-Party Liability insurance indicators, 2019–2020 70 .....................................Table 3.2-l Basic Personal Accident insurance indicators, 2019–2020 71 ........................................Table 3.2-m Basic Credit insurance indicators, 2019–2020 72 ...........................................................Table 3.2-n Basic Surety insurance indicators, 2019–2020 74 ...........................................................Table 3.2-o Basic Hull Transport insurance indicators, 2019–2020 76 ..............................................Table 3.2-p Basic Merchandise Transport insurance indicators, 2019–2020 76 ...............................Table 3.2-q Breakdown of Engineering insurance by modality, 2020 77 ...........................................Table 3.3-a Breakdown of Life insurance premiums and provisions by modality, 2019–2020 78 .....Table 3.3-b Breakdown of Life insurance policyholders by modality, 2019–2020 79 .........................Table 5.3-a Life: SCR result and solvency ratio, 2020 99 ...................................................................Table 5.3-b Life: impact of applying directive measures for long-term products on own funds, 2020 103 ......................................................................................Table 5.3-c Life: impact of applying directive measures for long-term products on own funds, 2020 . 103 ....................................................................................................Table 5.4-a Composites: SCR result and solvency ratio, 2020 104 ......................................................Table 5.4-b Composites: impact of applying directive measures for long-term
products on own funds, 2020 106 ......................................................................................Table 5.4-c Composites: impact of applying directive measures for long-term products on SCR, 2020 106 ................................................................................................Table 5.5 Non-Life: SCR result and solvency ratio, 2020 106 ...........................................................Table 5.6 Relative weight of risk modules, diversification and loss-absorbing capacity, 2020 107 .............................................................................................................
Tables
115THE SPANISH INSURANCE MARKET IN 2020

Chart 1.1-a Global: economic growth and inflation 19 .......................................................................Chart 1.1-b Spain: economic growth and demand for insurance, 2010–2020 20 ..............................Chart 1.1-c Spain: trends in direct insurance, 2010–2020 20 ............................................................Chart 1.1-d Spain: sale of homes, 2007–2020 22 ...............................................................................Chart 1.1-e Spain: housing stock, 2001–2020 23 ...............................................................................Chart 1.1-f Spain: sales of new homes vs. sales of existing homes, 2005–2020 23 .........................Chart 1.1-g Spain: real estate transactions involving foreigners, 2007–2020 24 ...............................Chart 1.1-h Spain: trends in number of mortgages, 2015–2020 24 ...................................................Chart 1.1-i Spain: mortgages taken out compared with total properties, 2003–2020 25 .................Chart 1.1-j Spain: trends in home ownership, rentals and occupancy free of charge, 1950–2011 25 ...........................................................................................Chart 1.1-k Spain: breakdown of homes by type of occupancy, 2007–2019 26 ..................................Chart 1.1-l Spain: vehicle fleet, 2005–2020 27 ...............................................................................Chart 1.1-m Eurozone: risk-free yield curve 28 ...............................................................................Chart 1.2-a Spain: evolution of the population pyramid, 1950–2100 30 .............................................Chart 1.2-b Spain: fertility rate and life expectancy at birth, 1950–2100 31 ......................................Chart 1.2-c Spain: population changes, 2010–2020 31 ......................................................................Chart 1.2-d Spain: breakdown of the population by age and gender, 2020 32 ...................................Chart 2.1 Spain: concentration indices, 2010–2020 33 ...................................................................Chart 2.2-a Spain: overall ranking of insurance groups by premium volume, 2019–2020 34 ...........Chart 2.2-b Spain: overall ranking of Non-Life insurance groups by premium volume, 2019–2020 35 ......................................................................................Chart 2.2-c Spain: overall ranking of Life insurance groups by premium volume, 2019–2020 35 ....Chart 2.2-d Spain: overall ranking of insurance groups by Life technical provisions, 2019–2020 36 .................................................................................................Chart 2.3-a Spain: number of companies by legal structure, 2010–2020 37 .....................................Chart 2.3-b Ranking of main internationally active Spanish insurance groups by premium volume, 2020 38 ...............................................................................................Chart 2.4-a Spain: number of insurance intermediaries, 2009–2019 41 ...........................................Chart 2.4-b Spain: percentage distribution of the Non-Life business portfolio by channel 42 .........Chart 2.4-c Spain: percentage distribution of the Life business portfolio by channel 42 ................Chart 3.1-a Trends in direct insurance in Spain, 2010–2020 46 .........................................................Chart 3.1-b Contribution to insurance market growth, 2010–2020 49 ...............................................Chart 3.1-c Trends in the total combined ratio, 2010–2020 50 ..........................................................Chart 3.1-d Trends in the Non-Life combined ratio, 2010–2020 50 ...................................................Chart 3.1-e Trends in return on equity, 2010–2020 52 ........................................................................Chart 3.1-f Trends in return on assets, 2010–2020 52 .......................................................................Chart 3.1-g Trends in investment structure in the insurance market, 2010–2020 53 .......................Chart 3.1-h Structure of investments relating to technical provisions, 2020 53 ...............................Chart 3.1-i Trends in the Life insurance business portfolio, 2010–2020 53 ......................................Chart 3.1-j Return on the insurance industry's financial investments, 2010–2020 54 .....................Chart 3.1-k Life insurance technical provisions, 2010–2020 55 .........................................................Chart 3.2-a Trends in direct Automobile insurance in Spain, 2010–2020 58 .....................................Chart 3.2-b Results performance in the Automobile insurance line, 2010–2020 59 .........................Chart 3.2-c Trends in direct Health insurance in Spain, 2010–2020 61 .............................................Chart 3.2-d Results performance in the Health insurance line, 2010–2020 61 .................................Chart 3.2-e Trends in direct Multirisk insurance in Spain, 2010–2020 63 .........................................Chart 3.2-f Distribution of Multirisk premiums by modality, 2020 63 ...............................................Chart 3.2-g Results performance in the Multirisk insurance line, 2010–2020 64 .............................Chart 3.2-h Results performance in the Homeowners Multirisk insurance line, 2010–2020 65 ......
Charts
116
THE SPANISH INSURANCE MARKET IN 2020
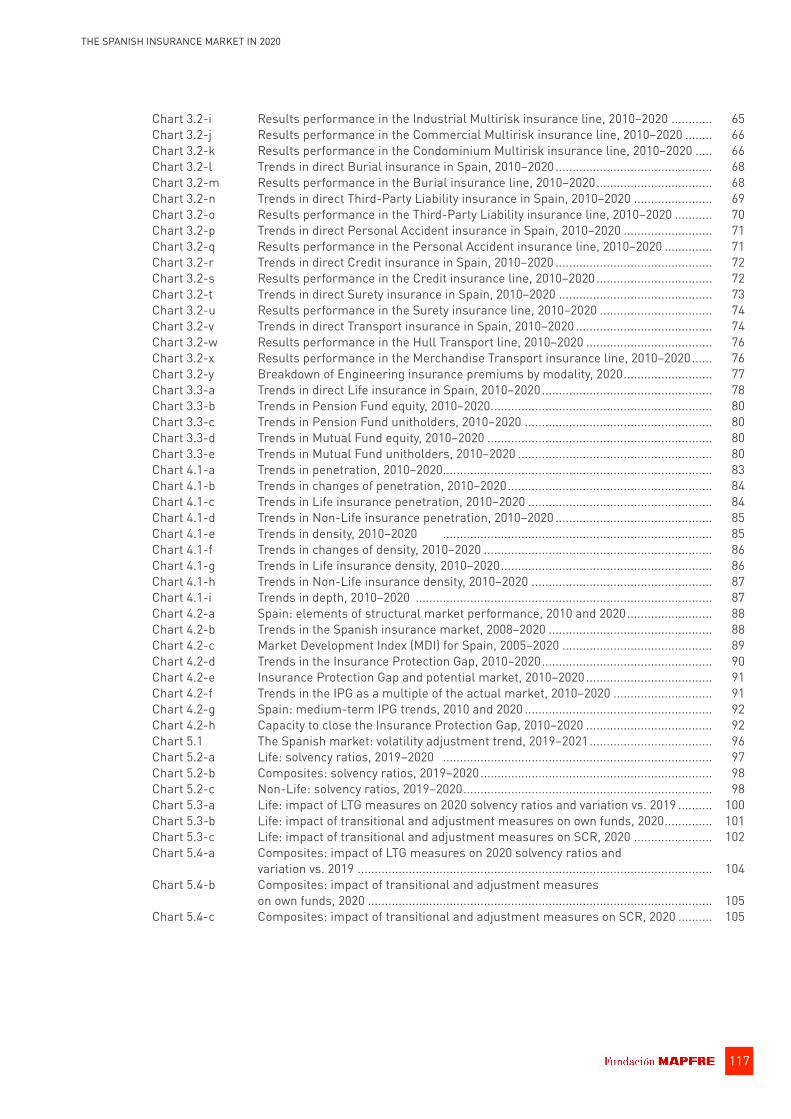
Chart 3.2-i Results performance in the Industrial Multirisk insurance line, 2010–2020 65 ............Chart 3.2-j Results performance in the Commercial Multirisk insurance line, 2010–2020 66 ........Chart 3.2-k Results performance in the Condominium Multirisk insurance line, 2010–2020 66 .....Chart 3.2-l Trends in direct Burial insurance in Spain, 2010–2020 68 ..............................................Chart 3.2-m Results performance in the Burial insurance line, 2010–2020 68 ..................................Chart 3.2-n Trends in direct Third-Party Liability insurance in Spain, 2010–2020 69 .......................Chart 3.2-o Results performance in the Third-Party Liability insurance line, 2010–2020 70 ...........Chart 3.2-p Trends in direct Personal Accident insurance in Spain, 2010–2020 71 ..........................Chart 3.2-q Results performance in the Personal Accident insurance line, 2010–2020 71 ..............Chart 3.2-r Trends in direct Credit insurance in Spain, 2010–2020 72 ..............................................Chart 3.2-s Results performance in the Credit insurance line, 2010–2020 72 ..................................Chart 3.2-t Trends in direct Surety insurance in Spain, 2010–2020 73 .............................................Chart 3.2-u Results performance in the Surety insurance line, 2010–2020 74 .................................Chart 3.2-v Trends in direct Transport insurance in Spain, 2010–2020 74 ........................................Chart 3.2-w Results performance in the Hull Transport line, 2010–2020 76 .....................................Chart 3.2-x Results performance in the Merchandise Transport insurance line, 2010–2020 76 ......Chart 3.2-y Breakdown of Engineering insurance premiums by modality, 2020 77 ..........................Chart 3.3-a Trends in direct Life insurance in Spain, 2010–2020 78 ..................................................Chart 3.3-b Trends in Pension Fund equity, 2010–2020 80 .................................................................Chart 3.3-c Trends in Pension Fund unitholders, 2010–2020 80 .......................................................Chart 3.3-d Trends in Mutual Fund equity, 2010–2020 80 ..................................................................Chart 3.3-e Trends in Mutual Fund unitholders, 2010–2020 80 .........................................................Chart 4.1-a Trends in penetration, 2010–2020 83 ...............................................................................Chart 4.1-b Trends in changes of penetration, 2010–2020 84 ............................................................Chart 4.1-c Trends in Life insurance penetration, 2010–2020 84 ......................................................Chart 4.1-d Trends in Non-Life insurance penetration, 2010–2020 85 ..............................................Chart 4.1-e Trends in density, 2010–2020 85 ...............................................................................Chart 4.1-f Trends in changes of density, 2010–2020 86 ...................................................................Chart 4.1-g Trends in Life insurance density, 2010–2020 86 ..............................................................Chart 4.1-h Trends in Non-Life insurance density, 2010–2020 87 .....................................................Chart 4.1-i Trends in depth, 2010–2020 87 .......................................................................................Chart 4.2-a Spain: elements of structural market performance, 2010 and 2020 88 .........................Chart 4.2-b Trends in the Spanish insurance market, 2008–2020 88 ................................................Chart 4.2-c Market Development Index (MDI) for Spain, 2005–2020 89 ............................................Chart 4.2-d Trends in the Insurance Protection Gap, 2010–2020 90 ..................................................Chart 4.2-e Insurance Protection Gap and potential market, 2010–2020 91 .....................................Chart 4.2-f Trends in the IPG as a multiple of the actual market, 2010–2020 91 .............................Chart 4.2-g Spain: medium-term IPG trends, 2010 and 2020 92 .......................................................Chart 4.2-h Capacity to close the Insurance Protection Gap, 2010–2020 92 .....................................Chart 5.1 The Spanish market: volatility adjustment trend, 2019–2021 96 ....................................Chart 5.2-a Life: solvency ratios, 2019–2020 97 ...............................................................................Chart 5.2-b Composites: solvency ratios, 2019–2020 98 ....................................................................Chart 5.2-c Non-Life: solvency ratios, 2019–2020 98 .........................................................................Chart 5.3-a Life: impact of LTG measures on 2020 solvency ratios and variation vs. 2019 100 ..........Chart 5.3-b Life: impact of transitional and adjustment measures on own funds, 2020 101 ..............Chart 5.3-c Life: impact of transitional and adjustment measures on SCR, 2020 102 .......................Chart 5.4-a Composites: impact of LTG measures on 2020 solvency ratios and variation vs. 2019 104 ........................................................................................................Chart 5.4-b Composites: impact of transitional and adjustment measures on own funds, 2020 105 .....................................................................................................Chart 5.4-c Composites: impact of transitional and adjustment measures on SCR, 2020 105 ..........
117
THE SPANISH INSURANCE MARKET IN 2020

Chart 5.6-a Life: relative weight of the different SCR elements for the sample analyzed, 2020 108 ................................................................................................Chart 5.6-b Composites: relative weight of the different SCR elements for
the sample analyzed, 2020 . 108 ...............................................................................Chart 5.6-c Non-Life: relative weight of the different SCR elements for
the sample analyzed, 2020 109 ..........................................................................................Chart 5.6-d Total market: relative weight of the different SCR elements for
the sample analyzed, 2020 109 ..........................................................................................Chart 5.6-e Relative weight of own funds vs. technical provisions, 2020 110 ......................................Chart 5.6-f Relative weight of own funds vs. premiums, 2020 110 .....................................................Chart 5.6-g Relative weight of own funds vs. assets, 2020 111 ............................................................
118
THE SPANISH INSURANCE MARKET IN 2020

References
1/ See: https://repositorio.bde.es/bitstream/123456789/16551/1/be2102-art16e.pdf
2/ See: MAPFRE Economics (2020), The Spanish insurance market in 2019, Madrid, Fundación MAPFRE, pp. 19–24.
3/ It is important to note that the Ministry of Transport, Mobility and Urban Planning has modified the residency criterion used in the entire historical series, and is now based on residency for tax purposes, which accounts for the differences in weight in the number of transactions indicated in previous versions of this report.
4/ See: https://www.dgt.es/es/seguridad-vial/estadisticas-e-indicadores/parque-vehiculos/tablas-estadisticas/
5/ In accordance with this reformulation, the concept of a company may correspond to an independent legal unit, a group of entities or an autonomous part of a group.
6/ See: http://www.ipyme.org//Publicaciones/Informe-PYME2020.pdf
7/ See: https://www.bbva.com/es/es/bbva-seguros-casi-duplica-su-beneficio-en-2020-respecto-a-2019/
8/ With Investigación Cooperativa entre Entidades Aseguradoras y Fondos de Pensiones (Cooperative Research between Insurance Companies and Pension Funds — ICEA) data, on a sample covering 94.9% of the industry's premiums.
9/ The data used to measure penetration, density and depth indices and presented in this report, as well as figures used to determine the Insurance Protection Gap for 2019 and previous years may display discrepancies when compared with information presented in last year's report (MAPFRE Economics [2020], The Spanish insurance market in 2019, Madrid, Fundación MAPFRE). This is due to premium figures for the Spanish insurance market reported by ICEA being updated, adjustments to data on Spain's GDP published by the INE, and adjustments to the penetration parameters for European insurance markets used in IPG estimates as a result of a review of the data on insurance premiums and GDP.
10/ The Market Development Index, which has been used in our previous reports, aims to summarize the trends in the development and maturity of the insurance markets, and has been constructed on the basis of four individual indices (with 2005 as a base): the penetration index (premiums/GDP); the depth index (Life insurance premiums compared with total market premiums); an index for the evolution of the IPG (index of the inverse of the IPG as a market multiple); and an index for the evolution of the Life insurance IPG (index of the inverse of the IPG for Life insurance as a multiple of the market).
11/ See: MAPFRE Economics [2020], The Spanish insurance market in 2019, Madrid, Fundación MAPFRE, pp. 87–90.
12/ In terms of methodology, the IPG can be measured two ways. The first takes an ex-post approach and is based on observed losses. In this case, the IPG is the difference between the economic losses recorded in a specific period and the portion of said losses that were covered through the insurance compensation mechanism. The ex-ante approach analyzes optimal coverage levels, estimated as the difference between the socioeconomic levels suitable to cover risk and actual coverage levels. The second approach was selected for this fiscal year's report, which involved determining the difference between the optimal and actual level of protection, contemplated as the difference between penetration indices in Spain and those of the top 15 economies within the European Union.
13/ The Solvency and Financial Condition Reports referred to in this report were consulted at the following addresses. For the 2019 reports:
VidaCaixa: https://www.vidacaixa.es/documents/51066/149093/ISFS+VidaCaixa+Individual+2019.pdf/b7825860-ad3e-3702-6185-9ad207aec9d4
MAPFRE Vida: https://www.mapfre.com/media/accionistas/2019/2019-sfcr-mapfre-vida.pdf
Bankia MAPFRE Vida: https://www.mapfre.com/media/accionistas/2019/2019-sfcr-bankia-mapfre-vida.pdf
BBVA Seguros: http://www.bbvaseguros.com/informacion-societaria/situacion-financiera-y-de-solvencia/
Zurich Vida (Sabadell): https://www.zurich.es/es-es/conocenos/grupo-zurich/informes
Ibercaja Vida: https://www.ibercaja.com/accionistas-e-inversores/informacion-economico-financiera
AXA Aurora Vida: https://www.axa.es/axa-espana/informes-sfcr
119THE SPANISH INSURANCE MARKET IN 2020

120
THE SPANISH INSURANCE MARKET IN 2020
AXA Vida: https://www.axa.es/axa-espana/informes-sfcr
Mutualidad de la Abogacía: https://www.mutualidadabogacia.com/wp-content/uploads/2016/11/informe-de-gestion-2016.pdf
Nationale Nederlanden Vida: https://www.nnseguros.es/mas-info/informe-situacion-financiera-y-solvencia
Allianz: https://www.allianz.com/en/investor_relations/results-reports/sfcr.html#tabpar_7217_3Tab
Generali España: https://www.generali.es/quienes-somos/espana/datos-economicos
Caser: https://www.caser.es/conocenos/informacion-legal
Catalana Occidente: https://www.seguroscatalanaoccidente.com/esp/informacion-corporativa
Santalucía: http://www.santalucia.es/situacion-financiera-solvencia-santalucia.pdf
MAPFRE ESPAÑA: https://www.mapfre.com/media/accionistas/2019/2019-sfcr-mapfre-espana.pdf
AXA Seguros Generales: https://www.axa.es/axa-espana/informes-sfcr
SegurCaixa Adeslas: https://www.segurcaixaadeslas.es/es/informacion-corporativa/informe-de-solvencia
Sanitas: http://corporativo.sanitas.es/sala-de-comunicacion/informes-y-publicaciones/
Asisa: https://www.asisa.es/informacion/solvencia
Mutua Madrileña: https://www.grupomutua.es/corporativa/informes-regulatorios.jsp
Reale Seguros Generales: https://www.reale.es/es/quienes-somos/la-compania/informacion-economica
Ocaso: https://www.ocaso.es/es/corporativa/datos-economicos/2019
Santander Seguros Generales: https://www.santanderseguros.es/san/sanseguros/informacion-financiera-solvencia
And for the 2020 reports, the links are as follows:
VidaCaixa: https://www.vidacaixa.es/en/web/corporativo/corporate-information/solvency-and-financial-condition-report
MAPFRE Vida: https://www.mapfre.com/en/solvency/
MAPFRE Bankia Vida: https://www.mapfre.com/en/solvency/
BBVA Seguros: http://www.bbvaseguros.com/informacion-societaria/situacion-financiera-y-de-solvencia/
Zurich Vida (Sabadell): https://www.zurich.es/conocenos
Ibercaja Vida: https://www.ibercajavida.com/
AXA Aurora Vida: https://www.axa.es/axa-espana/informes-sfcr
AXA Vida: https://www.axa.es/axa-espana/informes-sfcr
Mutualidad de la Abogacía: https://www.mutualidadabogacia.com/institucional/empresa/informe-gestion/
Nationale Nederlanden Vida: https://www.nnseguros.es/mas-info/informe-situacion-financiera-y-solvencia
Allianz: https://www.allianz.es/descubre-allianz/allianz-seguros
Generali España: https://www.generali.es/quienes-somos/espana/datos-economicos
Caser: https://www.caser.es/conocenos/informacion-legal
Catalana Occidente: https://www.seguroscatalanaoccidente.com/esp/informacion-corporativa
Santalucía: https://www.santalucia.es/sobre-santalucia/publicaciones
MAPFRE ESPAÑA: https://www.mapfre.com/en/solvency/
AXA Seguros Generales: https://www.axa.es/axa-espana/informes-sfcr
SegurCaixa Adeslas: https://www.segurcaixaadeslas.es/es/informacion-corporativa/informe-de-solvencia
Sanitas: http://corporativo.sanitas.es/sala-de-comunicacion/informes-y-publicaciones/
Asisa: https://www.asisa.es/informacion/solvencia
Mutua Madrileña: https://www.grupomutua.es/corporativa/informes-regulatorios.jsp

121
THE SPANISH INSURANCE MARKET IN 2020
Reale Seguros Generales: https://www.reale.es/es/quienes-somos/la-compania/informacion-economica
Ocaso: https://www.ocaso.es/es/corporativa/datos-economicos
Santander Seguros Generales: https://www.santanderseguros.es/san/sanseguros/informacion-financiera-solvencia
14/ See: https://www.iaisweb.org/page/supervisory-material/insurance-core-principles-and-comframe
15/ See: https://www.iaisweb.org/file/94221/iais-global-insurance-market-report-2020
16/ See: https://www.eiopa.europa.eu/content/opinion-2020-review-of-solvency-ii_en
17/ See: https://www.boe.es/boe/dias/2020/12/28/pdfs/BOE-A-2020-17154.pdf
18/ See: https://www.boe.es/buscar/doc.php?id=BOE-A-2021-9781


123THE SPANISH INSURANCE MARKET IN 2020
Statistical appendix
Table A.1. Size of the world's largest insurance markets, 2009–2020 125 ....................................................Table A.2. Trends in direct insurance premiums in the Spanish insurance market, 2010–2020 128 ............Table A.3. Trends in direct insurance premium growth in the Spanish insurance market, 2010–2020 129 .Table A.4. Contribution to growth of direct insurance premiums
in the Spanish insurance market, 2010–2020 130 .........................................................................Table A.5. Trends in the total and Non-Life combined ratios
in the Spanish insurance market, 2010–2020 131 .........................................................................Table A.6. Trends in the structure of Spanish insurance industry investment, 2010–2020 132 ....................Table A.7. Spanish insurance industry results and profitability, 2010–2020 133 ...........................................Table A.8. Basic Non-Life insurance indicators in the Spanish insurance industry, 2010–2020 134 ............Table A.9. Trends in the number of companies operating in the Spanish insurance industry
by legal structure, 2010–2020 135 .................................................................................................Table A.10. Trends in the number of intermediaries in the Spanish insurance industry
by type, 2009–2019 136 ...................................................................................................................Table A.11. Premium volume by autonomous community, 2010–2020 137 .....................................................Table A.12. Premiums per capita by autonomous community, 2010–2020 138 ...............................................Table A.13. Overall ranking of the ten largest insurance groups in Spain
by premium volume, 2009–2020 139 ..............................................................................................Table A.14. Overall ranking of the ten largest Non-Life insurance groups in Spain
by premium volume, 2009–2020 142 ..............................................................................................Table A.15. Overall ranking of the ten largest Life insurance groups in Spain
by premium volume, 2009–2020 145 ..............................................................................................Table A.16. Trends in concentration in the Spanish insurance industry, 2010–2020 148 ................................Table A.17. Activity of the Insurance Compensation Consortium:
premiums and surcharges allocated, 2010–2020 149 ...................................................................Table A.18. Activity of the Insurance Compensation Consortium:
direct and accepted loss ratio, 2010–2020 150 ..............................................................................Table A.19. Trends in average Automobile insurance premiums, 2010–2020 151 ...........................................Table A.20. Average frequencies and costs by guarantee in Automobile insurance, 2010–2020 152 .............Table A.21. Basic Automobile insurance indicators, 2010–2020 154 ...............................................................Table A.22. Basic Multirisk insurance indicators, 2010–2020 155 ...................................................................Table A.23. Basic Homeowners Multirisk insurance indicators, 2010–2020 156 .............................................Table A.24. Basic Industrial Multirisk insurance indicators, 2010–2020 57 ...................................................Table A.25. Basic Commercial Multirisk insurance indicators, 2010–2020 158 ..............................................Table A.26. Basic Condominium Multirisk insurance indicators, 2010–2020 159 ...........................................Table A.27. Basic Other Multirisk insurance indicators, 2010–2020 160 .........................................................Table A.28. Basic Health insurance indicators, 2010–2020 161 .......................................................................Table A.29. Basic Third-Party Liability insurance indicators, 2010–2020 . 162 ................................................Table A.30. Basic Hull Transport insurance indicators, 2010–2020 163 ..........................................................Table A.31. Basic Merchandise Transport insurance indicators, 2010–2020 164 ............................................Table A.32. Basic Burial insurance indicators, 2010–2020 . 165 .......................................................................Table A.33. Basic Credit insurance indicators, 2010–2020 . 166 .......................................................................Table A.34. Basic Surety insurance indicators, 2010–2020 167 .......................................................................Table A.35. Basic Personal Accident insurance indicators, 2010–2020 . 168 ...................................................Table A.36. Trends in penetration in the Spanish insurance industry, 2010–2020 . 169 ..................................Table A.37. Trends in density and depth in the Spanish insurance industry, 2010–2020 170 .........................Table A.38. Trends in the Insurance Protection Gap in the Spanish insurance market, 2010–2020 171........

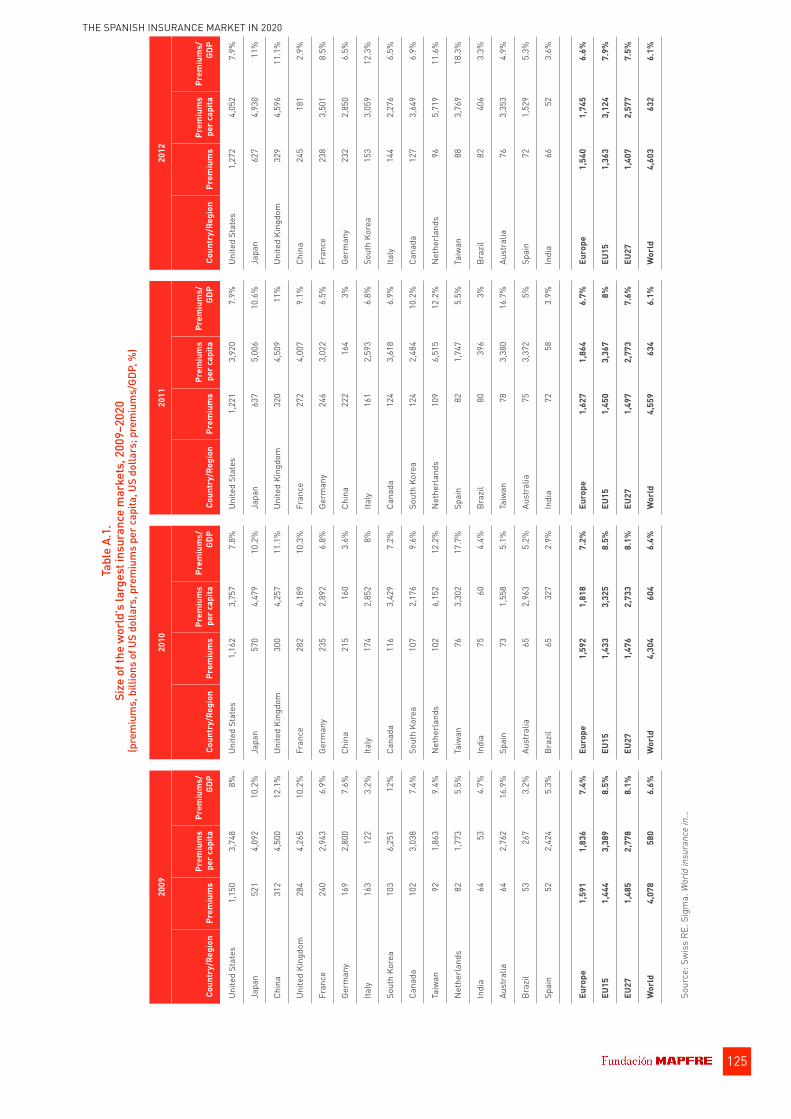
Sour
ce: S
wis
s RE
. Sig
ma.
Wor
ld in
sura
nce
in...
125
Tabl
e A.
1.
Size
of t
he w
orld
's la
rges
t ins
uran
ce m
arke
ts, 2
009–
2020
(p
rem
ium
s, b
illio
ns o
f US
dolla
rs, p
rem
ium
s pe
r cap
ita, U
S do
llars
; pre
miu
ms/
GDP,
%)
2009
2010
2011
2012
Coun
try/
Regi
onPr
emiu
ms
Prem
ium
s pe
r cap
itaPr
emiu
ms/
GD
PCo
untr
y/Re
gion
Prem
ium
sPr
emiu
ms
per c
apita
Prem
ium
s/GD
PCo
untr
y/Re
gion
Prem
ium
sPr
emiu
ms
per c
apita
Prem
ium
s/GD
PCo
untr
y/Re
gion
Prem
ium
sPr
emiu
ms
per c
apita
Prem
ium
s/GD
P
Unite
d St
ates
1,15
03,
748
8%Un
ited
Stat
es1,
162
3,75
77.
8%Un
ited
Stat
es1,
221
3,92
07.
9%Un
ited
Stat
es1,
272
4,05
27.
9%
Japa
n52
14,
092
10.2
%Ja
pan
570
4,47
910
.2%
Japa
n63
75,
006
10.6
%Ja
pan
627
4,93
011
%
Chin
a31
24,
500
12.1
%Un
ited
King
dom
300
4,25
711
.1%
Unite
d Ki
ngdo
m32
04,
509
11%
Unite
d Ki
ngdo
m32
94,
596
11.1
%
Unite
d Ki
ngdo
m28
44,
265
10.2
%Fr
ance
282
4,18
910
.3%
Fran
ce27
24,
007
9.1%
Chin
a24
518
12.
9%
Fran
ce24
02,
943
6.9%
Germ
any
235
2,89
26.
8%Ge
rman
y24
63,
022
6.5%
Fran
ce23
83,
501
8.5%
Germ
any
169
2,80
07.
6%Ch
ina
215
160
3.6%
Chin
a22
216
43%
Germ
any
232
2,85
06.
5%
Italy
163
122
3.2%
Italy
174
2,85
28%
Italy
161
2,59
36.
8%So
uth
Kore
a15
33,
059
12.3
%
Sout
h Ko
rea
103
6,25
112
%Ca
nada
116
3,42
97.
2%Ca
nada
124
3,61
86.
9%Ita
ly14
42,
276
6.5%
Cana
da10
23,
038
7.4%
Sout
h Ko
rea
107
2,17
69.
6%So
uth
Kore
a12
42,
484
10.2
%Ca
nada
127
3,64
96.
9%
Taiw
an92
1,86
39.
4%N
ethe
rlan
ds10
26,
152
12.2
%N
ethe
rlan
ds10
96,
515
12.2
%N
ethe
rlan
ds96
5,71
911
.6%
Net
herl
ands
821,
773
5.5%
Taiw
an76
3,30
217
.7%
Spai
n82
1,74
75.
5%Ta
iwan
883,
769
18.3
%
Indi
a64
534.
7%In
dia
7560
4.4%
Braz
il80
396
3%Br
azil
8240
63.
3%
Aust
ralia
642,
762
16.9
%Sp
ain
731,
558
5.1%
Taiw
an78
3,38
016
.7%
Aust
ralia
763,
353
4.9%
Braz
il53
267
3.2%
Aust
ralia
652,
963
5.2%
Aust
ralia
753,
372
5%Sp
ain
721,
529
5.3%
Spai
n52
2,42
45.
3%Br
azil
6532
72.
9%In
dia
7258
3.9%
Indi
a66
523.
6%
Euro
pe1,
591
1,83
67.
4%Eu
rope
1,59
21,
818
7.2%
Euro
pe1,
627
1,86
46.
7%Eu
rope
1,54
01,
745
6.6%
EU15
1,44
43,
389
8.5%
EU15
1,43
33,
325
8.5%
EU15
1,45
03,
367
8%EU
151,
363
3,12
47.
9%
EU27
1,48
52,
778
8.1%
EU27
1,47
62,
733
8.1%
EU27
1,49
72,
773
7.6%
EU27
1,40
72,
577
7.5%
Wor
ld4,
078
580
6.6%
Wor
ld4,
304
604
6.4%
Wor
ld4,
559
634
6.1%
Wor
ld4,
603
632
6.1%
THE SPANISH INSURANCE MARKET IN 2020
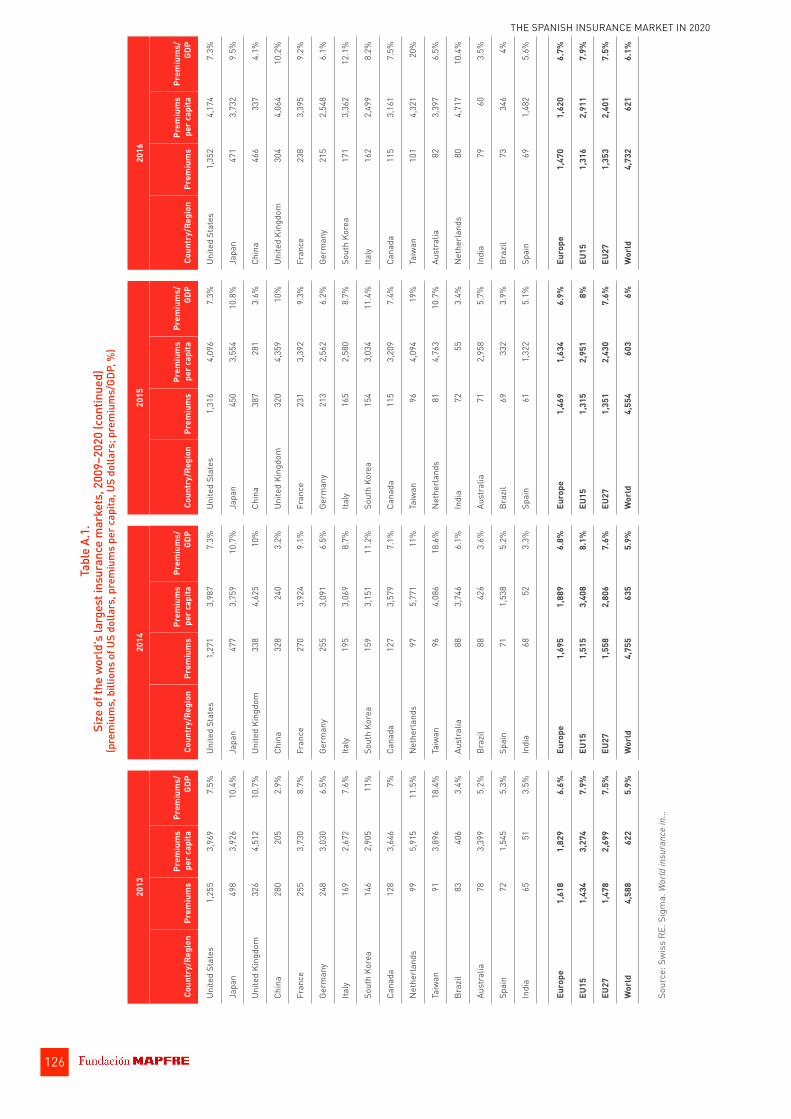
126
Tabl
e A.
1.
Size
of t
he w
orld
's la
rges
t ins
uran
ce m
arke
ts, 2
009–
2020
(con
tinue
d)
(pre
miu
ms,
bill
ions
of U
S do
llars
, pre
miu
ms
per c
apita
, US
dolla
rs; p
rem
ium
s/GD
P, %
)
2013
2014
2015
2016
Coun
try/
Regi
onPr
emiu
ms
Prem
ium
s pe
r cap
itaPr
emiu
ms/
GDP
Coun
try/
Regi
onPr
emiu
ms
Prem
ium
s pe
r cap
itaPr
emiu
ms/
GDP
Coun
try/
Regi
onPr
emiu
ms
Prem
ium
s pe
r cap
itaPr
emiu
ms/
GDP
Coun
try/
Regi
onPr
emiu
ms
Prem
ium
s pe
r cap
itaPr
emiu
ms/
GDP
Unite
d St
ates
1,25
53,
969
7.5%
Unite
d St
ates
1,27
13,
987
7.3%
Unite
d St
ates
1,31
64,
096
7.3%
Unite
d St
ates
1,35
24,
174
7.3%
Japa
n49
83,
926
10.4
%Ja
pan
477
3,75
910
.7%
Japa
n45
03,
554
10.8
%Ja
pan
471
3,73
29.
5%
Unite
d Ki
ngdo
m32
64,
512
10.7
%Un
ited
King
dom
338
4,62
510
%Ch
ina
387
281
3.6%
Chin
a46
633
74.
1%
Chin
a28
020
52.
9%Ch
ina
328
240
3.2%
Unite
d Ki
ngdo
m32
04,
359
10%
Unite
d Ki
ngdo
m30
44,
064
10.2
%
Fran
ce25
53,
730
8.7%
Fran
ce27
03,
924
9.1%
Fran
ce23
13,
392
9.3%
Fran
ce23
83,
395
9.2%
Germ
any
248
3,03
06.
5%Ge
rman
y25
53,
091
6.5%
Germ
any
213
2,56
26.
2%Ge
rman
y21
52,
548
6.1%
Italy
169
2,67
27.
6%Ita
ly19
53,
069
8.7%
Italy
165
2,58
08.
7%So
uth
Kore
a17
13,
362
12.1
%
Sout
h Ko
rea
146
2,90
511
%So
uth
Kore
a15
93,
151
11.2
%So
uth
Kore
a15
43,
034
11.4
%Ita
ly16
22,
499
8.2%
Cana
da12
83,
646
7%Ca
nada
127
3,57
97.
1%Ca
nada
115
3,20
97.
4%Ca
nada
115
3,16
17.
5%
Net
herl
ands
995,
915
11.5
%N
ethe
rlan
ds97
5,77
111
%Ta
iwan
964,
094
19%
Taiw
an10
14,
321
20%
Taiw
an91
3,89
618
.4%
Taiw
an96
4,08
618
.6%
Net
herl
ands
814,
763
10.7
%Au
stra
lia82
3,39
76.
5%
Braz
il83
406
3.4%
Aust
ralia
883,
746
6.1%
Indi
a72
553.
4%N
ethe
rlan
ds80
4,71
710
.4%
Aust
ralia
783,
399
5.2%
Braz
il88
426
3.6%
Aust
ralia
712,
958
5.7%
Indi
a79
603.
5%
Spai
n72
1,54
55.
3%Sp
ain
711,
538
5.2%
Braz
il69
332
3.9%
Braz
il73
346
4%
Indi
a65
513.
5%In
dia
6852
3.3%
Spai
n61
1,32
25.
1%Sp
ain
691,
482
5.6%
Euro
pe1,
618
1,82
96.
6%Eu
rope
1,69
51,
889
6.8%
Euro
pe1,
469
1,63
46.
9%Eu
rope
1,47
01,
620
6.7%
EU15
1,43
43,
274
7.9%
EU15
1,51
53,
408
8.1%
EU15
1,31
52,
951
8%EU
151,
316
2,91
17.
9%
EU27
1,47
82,
699
7.5%
EU27
1,55
82,
806
7.6%
EU27
1,35
12,
430
7.6%
EU27
1,35
32,
401
7.5%
Wor
ld4,
588
622
5.9%
Wor
ld4,
755
635
5.9%
Wor
ld4,
554
603
6%W
orld
4,73
262
16.
1%
Sour
ce: S
wis
s RE
. Sig
ma.
Wor
ld in
sura
nce
in...
THE SPANISH INSURANCE MARKET IN 2020

Tabl
e A.
1.
Size
of t
he w
orld
's la
rges
t ins
uran
ce m
arke
ts, 2
009–
2020
(con
tinue
d)
(pre
miu
ms,
bill
ions
of U
S do
llars
, pre
miu
ms
per c
apita
, US
dolla
rs; p
rem
ium
s/GD
P, %
)
Sour
ce: S
wis
s RE
. Sig
ma.
Wor
ld in
sura
nce
in...
THE SPANISH INSURANCE MARKET IN 2020
127
2017
2018
2019
2020
Coun
try/
Regi
onPr
emiu
ms
Prem
ium
s pe
r cap
itaPr
emiu
ms/
GDP
Coun
try/
Regi
onPr
emiu
ms
Prem
ium
s pe
r cap
itaPr
emiu
ms/
GDP
Coun
try/
Regi
onPr
emiu
ms
Prem
ium
s pe
r cap
itaPr
emiu
ms/
GDP
Coun
try/
Regi
onPr
emiu
ms
Prem
ium
s pe
r cap
itaPr
emiu
ms/
GDP
Unite
d St
ates
1,37
74,
216
7.1%
Unite
d St
ates
1,46
94,
481
7.1%
Unite
d St
ates
2,46
07,
495
11.4
%Un
ited
Stat
es2,
531
7,67
312
.0%
Chin
a54
138
44.
6%Ch
ina
575
406
4.2%
Chin
a61
743
04.
3%Ch
ina
656
455
4.5%
Japa
n42
23,
312
8.6%
Japa
n44
13,
466
8.9%
Japa
n45
93,
621
9.0%
Japa
n41
53,
280
8.1%
Unite
d Ki
ngdo
m28
33,
810
9.6%
Unite
d Ki
ngdo
m33
74,
503
10.6
%Gr
eat B
ritai
n36
64,
362
10.3
%Gr
eat B
ritai
n33
84,
523
11.1
%
Fran
ce24
23,
446
8.9%
Fran
ce25
83,
667
8.9%
Fran
ce26
23,
719
9.2%
Germ
any
259
3,10
86.
8%
Germ
any
223
2,68
76.
0%Ge
rman
y24
12,
908
6.0%
Germ
any
244
2,93
46.
3%Fr
ance
231
3,31
78.
6%
Sout
h Ko
rea
181
3,52
211
.6%
Sout
h Ko
rea
179
3,46
511
.2%
Sout
h Ko
rea
175
3,36
610
.8%
Sout
h Ko
rea
194
3,74
111
.6%
Italy
156
2,66
08.
3%Ita
ly17
02,
754
8.0%
Italy
168
2,76
48.
3%Ita
ly16
22,
692
8.6%
Cana
da12
03,
260
7.2%
Cana
da12
83,
457
7.5%
Cana
da13
33,
548
7.7%
Cana
da14
33,
775
8.7%
Taiw
an11
74,
997
21.3
%Ta
iwan
122
5,16
120
.9%
Taiw
an11
84,
993
20.0
%Ta
iwan
113
4,80
017
.4%
Indi
a98
733.
7%In
dia
100
743.
7%In
dia
106
783.
8%In
dia
108
784.
2%
Braz
il83
398
4.1%
Net
herl
ands
844,
890
9.2%
Net
herl
ands
844,
822
9.2%
Net
herl
ands
885,
022
9.6%
Aust
ralia
803,
247
5.8%
Aust
ralia
793,
160
5.6%
Braz
il74
351
4.0%
Hon
g Ko
ng73
9,74
620
.8%
Net
herl
ands
794,
631
9.6%
Spai
n74
1,58
85.
2%H
ong
Kong
729,
706
19.7
%Sp
ain
661,
396
5.2%
Spai
n71
1,51
95.
4%Br
azil
7334
53.
9%Sp
ain
711,
508
5.1%
Aust
ralia
632,
448
4.7%
Euro
pe1,
479
1,65
16.
5%Eu
rope
1,62
11,
794
6.6%
Euro
zone
1,06
32,
784
7.1%
Euro
zone
1,02
22,
723
7.2%
EU15
1,31
52,
953
7.6%
EU15
1,44
93,
226
7.7%
EU1,
172
2,37
46.
8%EU
1,13
32,
335
6.9%
EU27
1,35
72,
446
7.2%
EU27
1,49
42,
673
7.3%
OECD
4,98
53,
680
9.0%
OECD
4,96
53,
695
9.3%
Wor
ld4,
892
650
6.1%
Wor
ld5,
193
663
5.9%
Wor
ld6,
293
818
7.2%
Wor
ld6,
287
809
7.4%

Sour
ce: I
CEA.
His
toric
ser
ies
of d
irect
bus
ines
s pr
emiu
ms
Tabl
e A.
2.
Tren
ds in
dire
ct in
sura
nce
prem
ium
s in
the
Span
ish
insu
ranc
e m
arke
t, 20
10–2
020
(mill
ions
of e
uros
)
2010
2011
2012
2013
2014
2015
2016
2017
2018
2019
2020
NON-
LIFE
INSU
RANC
E31
,811
.531
,718
.731
,095
.330
,386
.430
,646
.531
,297
.932
,693
.034
,027
.135
,429
.736
,652
.137
,052
.3
Auto
mob
iles
11,5
34.5
11,2
69.5
10,6
07.4
10,0
21.5
9,88
2.1
10,0
52.1
10,5
65.9
10,9
23.3
11,1
37.5
11,3
11.9
11,0
86.4
Auto
mob
ile T
PL5,
963.
85,
847.
95,
485.
35,
177.
75,
029.
65,
169.
05,
508.
85,
716.
65,
850.
75,
875.
45,
658.
3
Auto
mob
ile O
ther
Gua
rant
ees
5,57
0.7
5,42
1.6
5,12
2.0
4,84
3.8
4,85
2.5
4,88
3.0
5,05
7.1
5,20
6.7
5,28
6.8
5,43
6.5
5,42
8.1
Mul
tiris
k6,
297.
46,
578.
76,
626.
86,
537.
16,
550.
46,
564.
56,
734.
36,
964.
77,
234.
37,
521.
17,
753.
4
Hom
eow
ners
3,50
5.5
3,65
5.6
3,76
3.8
3,77
9.0
3,83
6.5
3,91
6.4
4,05
8.9
4,19
6.3
4,34
7.7
4,52
8.6
4,65
2.6
Com
mer
cial
650.
364
8.8
625.
359
6.2
594.
556
5.1
574.
658
4.8
595.
560
2.0
603.
6
Cond
omin
ium
755.
179
4.2
814.
582
3.4
826.
683
6.0
852.
887
2.1
898.
592
6.5
952.
8
Indu
stria
l1,
327.
61,
420.
51,
344.
41,
265.
31,
220.
01,
176.
01,
169.
81,
233.
61,
316.
11,
385.
21,
463.
2
Othe
r58
.959
.678
.873
.272
.771
.078
.277
.876
.578
.881
.2
Heal
th6,
396.
46,
596.
66,
785.
66,
936.
97,
181.
17,
360.
87,
735.
88,
068.
78,
516.
38,
935.
39,
388.
4
Heal
thca
re A
ssis
tanc
e5,
461.
35,
663.
16,
011.
26,
192.
06,
429.
76,
450.
06,
761.
47,
100.
87,
526.
47,
912.
38,
335.
9
Reim
burs
emen
t63
9.5
653.
651
6.4
504.
451
9.6
665.
970
0.4
708.
872
2.1
745.
678
5.6
Subs
idy
295.
627
9.9
258.
024
0.5
231.
724
4.9
273.
925
9.1
267.
827
7.3
266.
8
Othe
r Non
-Life
Lin
es7,
583.
17,
273.
97,
075.
66,
890.
97,
033.
07,
320.
57,
657.
08,
070.
48,
541.
68,
883.
88,
824.
2
Acci
dent
s92
1.6
897.
385
2.5
880.
188
5.5
926.
398
3.8
1,11
4.3
1,15
2.3
1,15
2.1
1,12
3.5
Assi
stan
ce31
0.4
315.
530
9.4
312.
233
5.2
340.
336
4.6
402.
743
3.3
460.
933
9.0
Sure
ty84
.278
.065
.362
.660
.985
.762
.263
.284
.112
2.5
136.
0
Cred
it71
8.6
694.
967
7.4
645.
863
0.5
608.
859
3.1
570.
358
4.4
606.
960
2.0
Buria
l1,
702.
71,
761.
51,
890.
71,
960.
52,
087.
22,
150.
42,
167.
22,
277.
02,
367.
02,
458.
92,
490.
7
Lega
l def
ense
100.
210
2.7
96.7
89.6
92.2
93.1
96.7
100.
510
6.2
109.
511
2.5
Fire
183.
210
2.2
90.6
95.9
108.
817
9.9
206.
811
8.4
194.
518
0.7
227.
8
Othe
r Dam
age
to P
&C
1,08
8.5
964.
293
5.2
819.
884
1.2
870.
81,
047.
81,
105.
71,
241.
91,
321.
31,
313.
2
Pecu
niar
y los
ses
351.
233
9.7
249.
423
3.3
232.
327
6.1
336.
035
0.9
386.
237
5.4
317.
9
Third
-par
ty li
abili
ty1,
624.
11,
531.
01,
447.
81,
352.
41,
342.
11,
359.
81,
385.
01,
508.
31,
532.
11,
597.
61,
638.
5
Tran
spor
t49
8.5
486.
846
0.6
438.
841
7.0
429.
441
3.8
459.
045
9.7
497.
952
3.1
Avia
tion
87.8
75.7
61.5
55.1
47.7
46.0
43.3
67.6
46.0
57.0
73.7
Mar
itim
e20
1.7
200.
619
4.9
185.
317
5.3
178.
916
3.6
161.
416
9.9
186.
119
2.6
Mer
chan
dise
209.
021
0.5
204.
119
8.4
194.
020
4.5
206.
923
0.0
243.
925
4.9
256.
7
LIFE
INSU
RANC
E26
,376
.728
,871
.726
,288
.925
,509
.924
,839
.325
,566
.731
,139
.329
,406
.828
,994
.827
,523
.421
,837
.1
Prot
ectio
n3,
778.
83,
609.
73,
510.
83,
350.
43,
471.
53,
773.
84,
205.
44,
205.
64,
721.
04,
865.
34,
847.
9
Savi
ngs
22,5
97.9
25,2
61.9
22,7
78.0
22,1
59.5
21,3
67.7
21,7
93.0
26,9
33.9
25,2
01.3
24,2
73.8
22,6
58.1
16,9
89.3
TOTA
L M
ARKE
T58
,188
.260
,590
.357
,384
.255
,896
.355
,485
.856
,864
.663
,832
.263
,433
.964
,424
.564
,175
.558
,889
.4
THE SPANISH INSURANCE MARKET IN 2020
128
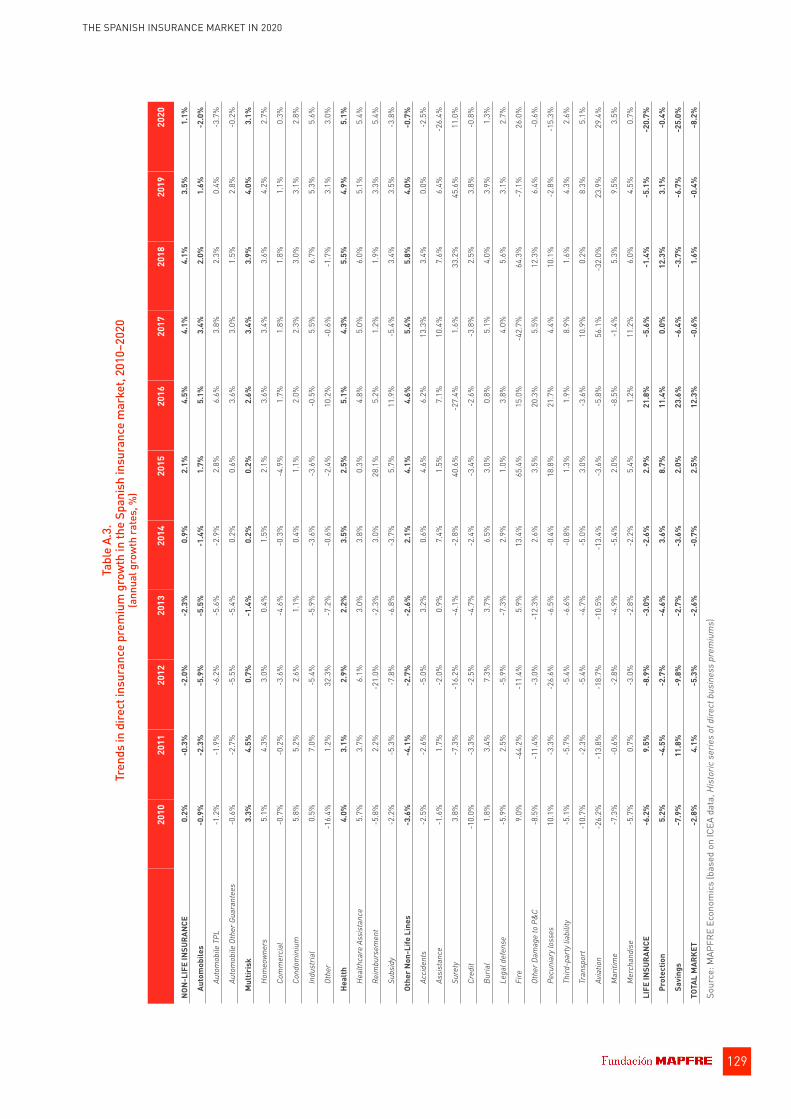
Tabl
e A.
3.
Tren
ds in
dire
ct in
sura
nce
prem
ium
gro
wth
in th
e Sp
anis
h in
sura
nce
mar
ket,
2010
–202
0 (a
nnua
l gro
wth
rate
s, %
)
2010
2011
2012
2013
2014
2015
2016
2017
2018
2019
2020
NON-
LIFE
INSU
RANC
E0.
2%-0
.3%
-2.0
%-2
.3%
0.9%
2.1%
4.5%
4.1%
4.1%
3.5%
1.1%
Auto
mob
iles
-0.9
%-2
.3%
-5.9
%-5
.5%
-1.4
%1.
7%5.
1%3.
4%2.
0%1.
6%-2
.0%
Auto
mob
ile T
PL-1
.2%
-1.9
%-6
.2%
-5.6
%-2
.9%
2.8%
6.6%
3.8%
2.3%
0.4%
-3.7
%
Auto
mob
ile O
ther
Gua
rant
ees
-0.6
%-2
.7%
-5.5
%-5
.4%
0.2%
0.6%
3.6%
3.0%
1.5%
2.8%
-0.2
%
Mul
tiris
k3.
3%4.
5%0.
7%-1
.4%
0.2%
0.2%
2.6%
3.4%
3.9%
4.0%
3.1%
Hom
eow
ners
5.1%
4.3%
3.0%
0.4%
1.5%
2.1%
3.6%
3.4%
3.6%
4.2%
2.7%
Com
mer
cial
-0.7
%-0
.2%
-3.6
%-4
.6%
-0.3
%-4
.9%
1.7%
1.8%
1.8%
1.1%
0.3%
Cond
omin
ium
5.8%
5.2%
2.6%
1.1%
0.4%
1.1%
2.0%
2.3%
3.0%
3.1%
2.8%
Indu
stria
l0.
5%7.
0%-5
.4%
-5.9
%-3
.6%
-3.6
%-0
.5%
5.5%
6.7%
5.3%
5.6%
Othe
r-1
6.4%
1.2%
32.3
%-7
.2%
-0.6
%-2
.4%
10.2
%-0
.6%
-1.7
%3.
1%3.
0%
Heal
th4.
0%3.
1%2.
9%2.
2%3.
5%2.
5%5.
1%4.
3%5.
5%4.
9%5.
1%
Heal
thca
re A
ssis
tanc
e5.
7%3.
7%6.
1%3.
0%3.
8%0.
3%4.
8%5.
0%6.
0%5.
1%5.
4%
Reim
burs
emen
t-5
.8%
2.2%
-21.
0%-2
.3%
3.0%
28.1
%5.
2%1.
2%1.
9%3.
3%5.
4%
Subs
idy
-2.2
%-5
.3%
-7.8
%-6
.8%
-3.7
%5.
7%11
.9%
-5.4
%3.
4%3.
5%-3
.8%
Othe
r Non
-Life
Lin
es-3
.6%
-4.1
%-2
.7%
-2.6
%2.
1%4.
1%4.
6%5.
4%5.
8%4.
0%-0
.7%
Acci
dent
s-2
.5%
-2.6
%-5
.0%
3.2%
0.6%
4.6%
6.2%
13.3
%3.
4%0.
0%-2
.5%
Assi
stan
ce-1
.6%
1.7%
-2.0
%0.
9%7.
4%1.
5%7.
1%10
.4%
7.6%
6.4%
-26.
4%
Sure
ty3.
8%-7
.3%
-16.
2%-4
.1%
-2.8
%40
.6%
-27.
4%1.
6%33
.2%
45.6
%11
.0%
Cred
it-1
0.0%
-3.3
%-2
.5%
-4.7
%-2
.4%
-3.4
%-2
.6%
-3.8
%2.
5%3.
8%-0
.8%
Buria
l1.
8%3.
4%7.
3%3.
7%6.
5%3.
0%0.
8%5.
1%4.
0%3.
9%1.
3%
Lega
l def
ense
-5.9
%2.
5%-5
.9%
-7.3
%2.
9%1.
0%3.
8%4.
0%5.
6%3.
1%2.
7%
Fire
9.0%
-44.
2%-1
1.4%
5.9%
13.4
%65
.4%
15.0
%-4
2.7%
64.3
%-7
.1%
26.0
%
Othe
r Dam
age
to P
&C
-8.5
%-1
1.4%
-3.0
%-1
2.3%
2.6%
3.5%
20.3
%5.
5%12
.3%
6.4%
-0.6
%
Pecu
niar
y los
ses
10.1
%-3
.3%
-26.
6%-6
.5%
-0.4
%18
.8%
21.7
%4.
4%10
.1%
-2.8
%-1
5.3%
Third
-par
ty li
abili
ty-5
.1%
-5.7
%-5
.4%
-6.6
%-0
.8%
1.3%
1.9%
8.9%
1.6%
4.3%
2.6%
Tran
spor
t-1
0.7%
-2.3
%-5
.4%
-4.7
%-5
.0%
3.0%
-3.6
%10
.9%
0.2%
8.3%
5.1%
Avia
tion
-26.
2%-1
3.8%
-18.
7%-1
0.5%
-13.
4%-3
.6%
-5.8
%56
.1%
-32.
0%23
.9%
29.4
%
Mar
itim
e-7
.3%
-0.6
%-2
.8%
-4.9
%-5
.4%
2.0%
-8.5
%-1
.4%
5.3%
9.5%
3.5%
Mer
chan
dise
-5.7
%0.
7%-3
.0%
-2.8
%-2
.2%
5.4%
1.2%
11.2
%6.
0%4.
5%0.
7%
LIFE
INSU
RANC
E-6
.2%
9.5%
-8.9
%-3
.0%
-2.6
%2.
9%21
.8%
-5.6
%-1
.4%
-5.1
%-2
0.7%
Prot
ectio
n5.
2%-4
.5%
-2.7
%-4
.6%
3.6%
8.7%
11.4
%0.
0%12
.3%
3.1%
-0.4
%
Savi
ngs
-7.9
%11
.8%
-9.8
%-2
.7%
-3.6
%2.
0%23
.6%
-6.4
%-3
.7%
-6.7
%-2
5.0%
TOTA
L M
ARKE
T-2
.8%
4.1%
-5.3
%-2
.6%
-0.7
%2.
5%12
.3%
-0.6
%1.
6%-0
.4%
-8.2
%
Sour
ce: M
APFR
E Ec
onom
ics
(bas
ed o
n IC
EA d
ata,
His
toric
ser
ies
of d
irect
bus
ines
s pr
emiu
ms)
THE SPANISH INSURANCE MARKET IN 2020
129

Tabl
e A.
4.
Cont
ribut
ion
to g
row
th o
f dire
ct in
sura
nce
prem
ium
s in
the
Span
ish
insu
ranc
e m
arke
t, 20
10–2
020
(pp)
2010
2011
2012
2013
2014
2015
2016
2017
2018
2019
2020
NON-
LIFE
INSU
RANC
E0.
097
-0.1
59-1
.029
-1.2
350.
465
1.17
42.
453
2.09
02.
211
1.89
70.
624
Auto
mob
iles
-0.1
77-0
.455
-1.0
93-1
.021
-0.2
490.
306
0.90
40.
560
0.33
80.
271
-0.3
51
Auto
mob
ile T
PL-0
.122
-0.1
99-0
.598
-0.5
36-0
.265
0.25
10.
597
0.32
60.
211
0.03
8-0
.338
Auto
mob
ile O
ther
Gua
rant
ees
-0.0
55-0
.256
-0.4
94-0
.485
0.01
60.
055
0.30
60.
234
0.12
60.
232
-0.0
13
Mul
tiris
k0.
334
0.48
30.
079
-0.1
560.
024
0.02
50.
299
0.36
10.
425
0.44
50.
362
Hom
eow
ners
0.28
20.
258
0.17
80.
027
0.10
30.
144
0.25
10.
215
0.23
90.
281
0.19
3
Com
mer
cial
-0.0
08-0
.003
-0.0
39-0
.051
-0.0
03-0
.053
0.01
70.
016
0.01
70.
010
0.00
3
Cond
omin
ium
0.06
90.
067
0.03
40.
015
0.00
60.
017
0.03
00.
030
0.04
20.
043
0.04
1
Indu
stria
l0.
010
0.16
0-0
.126
-0.1
38-0
.081
-0.0
79-0
.011
0.10
00.
130
0.10
70.
122
Othe
r-0
.019
0.00
10.
032
-0.0
10-0
.001
-0.0
030.
013
-0.0
01-0
.002
0.00
40.
004
Heal
th0.
412
0.34
40.
312
0.26
40.
437
0.32
40.
659
0.52
20.
706
0.65
00.
706
Heal
thca
re A
ssis
tanc
e0.
490
0.34
70.
574
0.31
50.
425
0.03
70.
548
0.53
20.
671
0.59
90.
660
Reim
burs
emen
t-0
.066
0.02
4-0
.226
-0.0
210.
027
0.26
40.
061
0.01
30.
021
0.03
70.
062
Subs
idy
-0.0
11-0
.027
-0.0
36-0
.030
-0.0
160.
024
0.05
1-0
.023
0.01
40.
015
-0.0
16
Othe
r Non
-Life
Lin
es-0
.472
-0.5
32-0
.327
-0.3
220.
254
0.51
80.
592
0.64
80.
743
0.53
1-0
.093
Acci
dent
s-0
.040
-0.0
42-0
.074
0.04
80.
010
0.07
30.
101
0.20
40.
060
0.00
0-0
.045
Assi
stan
ce-0
.009
0.00
9-0
.010
0.00
50.
041
0.00
90.
043
0.06
00.
048
0.04
3-0
.190
Sure
ty0.
005
-0.0
11-0
.021
-0.0
05-0
.003
0.04
5-0
.041
0.00
20.
033
0.06
00.
021
Cred
it-0
.133
-0.0
41-0
.029
-0.0
55-0
.027
-0.0
39-0
.028
-0.0
360.
022
0.03
5-0
.008
Buria
l0.
051
0.10
10.
213
0.12
20.
227
0.11
40.
030
0.17
20.
142
0.14
30.
050
Lega
l def
ense
-0.0
110.
004
-0.0
10-0
.012
0.00
50.
002
0.00
60.
006
0.00
90.
005
0.00
5
Fire
0.02
5-0
.139
-0.0
190.
009
0.02
30.
128
0.04
7-0
.139
0.12
0-0
.021
0.07
3
Othe
r Dam
age
to P
&C
-0.1
70-0
.214
-0.0
48-0
.201
0.03
80.
053
0.31
10.
091
0.21
50.
123
-0.0
13
Pecu
niar
y los
ses
0.05
4-0
.020
-0.1
49-0
.028
-0.0
020.
079
0.10
50.
023
0.05
6-0
.017
-0.0
90
Third
-par
ty li
abili
ty-0
.146
-0.1
60-0
.137
-0.1
66-0
.018
0.03
20.
044
0.19
30.
037
0.10
20.
064
Tran
spor
t-0
.100
-0.0
20-0
.043
-0.0
38-0
.039
0.02
2-0
.027
0.07
10.
001
0.05
90.
039
Avia
tion
-0.0
52-0
.021
-0.0
23-0
.011
-0.0
13-0
.003
-0.0
050.
038
-0.0
340.
017
0.02
6
Mar
itim
e-0
.026
-0.0
02-0
.009
-0.0
17-0
.018
0.00
6-0
.027
-0.0
040.
013
0.02
50.
010
Mer
chan
dise
-0.0
210.
003
-0.0
11-0
.010
-0.0
080.
019
0.00
40.
036
0.02
20.
017
0.00
3
LIFE
INSU
RANC
E-2
.911
4.28
8-4
.263
-1.3
57-1
.200
1.31
19.
800
-2.7
14-0
.650
-2.2
84-8
.861
Prot
ectio
n0.
310
-0.2
91-0
.163
-0.2
790.
217
0.54
50.
759
0.00
00.
813
0.22
4-0
.027
Savi
ngs
-3.2
204.
578
-4.0
99-1
.078
-1.4
160.
766
9.04
1-2
.714
-1.4
62-2
.508
-8.8
33
TOTA
L M
ARKE
T-2
.814
4.12
8-5
.292
-2.5
93-0
.734
2.48
512
.253
-0.6
241.
562
-0.3
86-8
.237
Sour
ce: M
APFR
E Ec
onom
ics
(bas
ed o
n IC
EA d
ata,
His
toric
ser
ies
of d
irect
bus
ines
s pr
emiu
ms)
THE SPANISH INSURANCE MARKET IN 2020
130
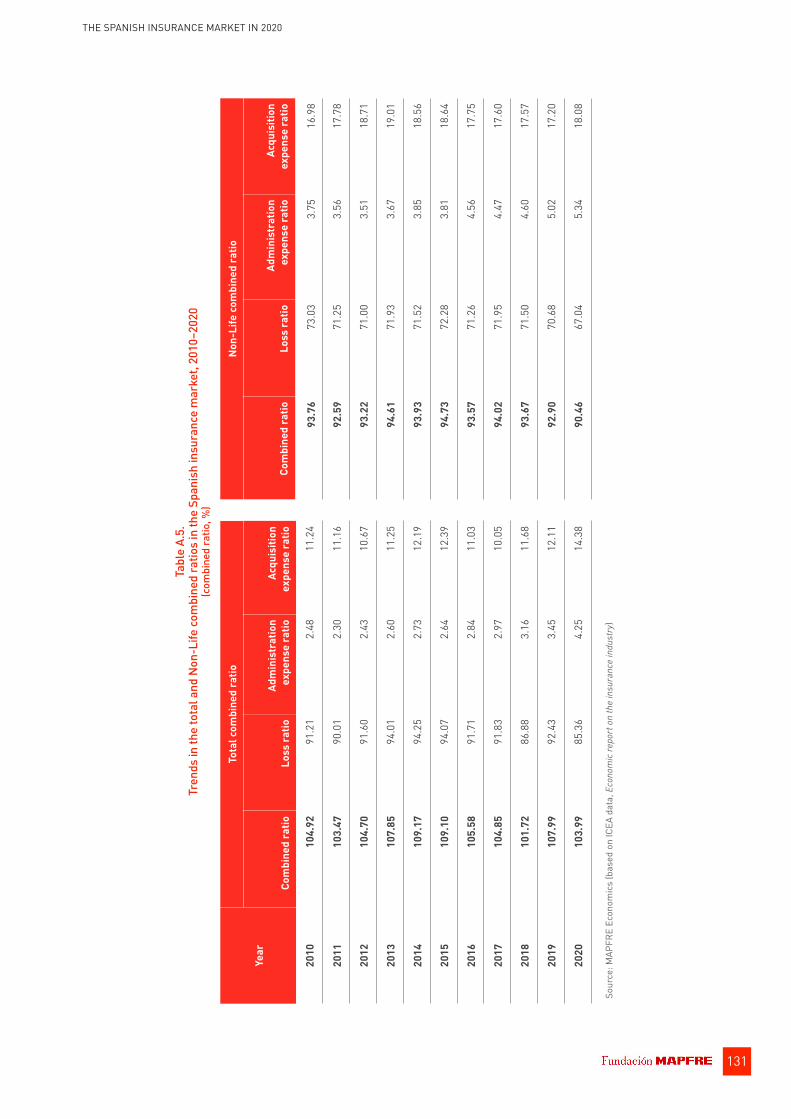
Tabl
e A.
5.
Tren
ds in
the
tota
l and
Non
-Life
com
bine
d ra
tios
in th
e Sp
anis
h in
sura
nce
mar
ket,
2010
–202
0 (c
ombi
ned
ratio
, %)
Year
Tota
l com
bine
d ra
tioNo
n-Li
fe co
mbi
ned
ratio
Com
bine
d ra
tioLo
ss ra
tioAd
min
istr
atio
n ex
pens
e ra
tioAc
quis
ition
ex
pens
e ra
tioCo
mbi
ned
ratio
Loss
ratio
Adm
inis
trat
ion
expe
nse
ratio
Acqu
isiti
on
expe
nse
ratio
2010
104.
9291
.21
2.48
11.2
493
.76
73.0
33.
7516
.98
2011
103.
4790
.01
2.30
11.1
692
.59
71.2
53.
5617
.78
2012
104.
7091
.60
2.43
10.6
793
.22
71.0
03.
5118
.71
2013
107.
8594
.01
2.60
11.2
594
.61
71.9
33.
6719
.01
2014
109.
1794
.25
2.73
12.1
993
.93
71.5
23.
8518
.56
2015
109.
1094
.07
2.64
12.3
994
.73
72.2
83.
8118
.64
2016
105.
5891
.71
2.84
11.0
393
.57
71.2
64.
5617
.75
2017
104.
8591
.83
2.97
10.0
594
.02
71.9
54.
4717
.60
2018
101.
7286
.88
3.16
11.6
893
.67
71.5
04.
6017
.57
2019
107.
9992
.43
3.45
12.1
192
.90
70.6
85.
0217
.20
2020
103.
9985
.36
4.25
14.3
890
.46
67.0
45.
3418
.08
Sour
ce: M
APFR
E Ec
onom
ics
(bas
ed o
n IC
EA d
ata,
Eco
nom
ic re
port
on
the
insu
ranc
e in
dust
ry)
THE SPANISH INSURANCE MARKET IN 2020
131

Tabl
e A.
6.
Tren
ds in
the
stru
ctur
e of
Spa
nish
insu
ranc
e in
dust
ry in
vest
men
t, 20
10–2
020
(inve
stm
ents
, mill
ions
of e
uros
)
Year
Inve
stm
ents
Fixe
d in
com
eEq
uity
Cash
and
dep
osits
Real
est
ate
Mut
ual f
unds
Othe
r inv
estm
ents
2010
63.5
%2.
7%13
.7%
4.6%
6.0%
9.5%
2011
64.9
%2.
6%12
.4%
4.4%
5.2%
10.6
%
2012
67.2
%2.
5%10
.8%
4.1%
4.9%
10.5
%
2013
67.2
%3.
0%11
.1%
3.8%
5.1%
9.8%
2014
68.1
%3.
1%15
.4%
3.8%
6.2%
3.3%
2015
69.3
%3.
4%13
.7%
3.7%
6.7%
3.4%
2016
75.7
%4.
8%8.
6%3.
7%6.
5%0.
7%
2017
74.1
%5.
1%8.
8%3.
6%7.
8%0.
6%
2018
75.7
%5.
2%7.
6%3.
6%7.
8%0.
1%
2019
75.5
%5.
6%6.
4%3.
5%9.
1%-0
.2%
2020
74.9
%5.
7%6.
5%3.
5%10
.0%
-0.6
%
Sour
ce: M
APFR
E Ec
onom
ics
(bas
ed o
n IC
EA d
ata,
Insu
ranc
e co
mpa
ny in
vest
men
ts)
THE SPANISH INSURANCE MARKET IN 2020
132

Tabl
e A.
7.
Span
ish
insu
ranc
e in
dust
ry re
sults
and
pro
fitab
ility
, 201
0–20
20
(res
ults
, mill
ions
of e
uros
, pro
fitab
ility
, %)
Year
Indu
stry
resu
lts1
(mill
ions
of e
uros
)
Prof
itabi
lity
ROE2
(%)
ROA3
(%)
2010
4,08
2,84
316
.03
1.82
2011
4,21
0,77
715
.32
1.76
2012
4,45
8,87
414
.98
1.82
2013
4,57
5,27
612
.72
1.75
2014
4,90
1,84
212
.39
1.68
2015
3,48
2,37
78.
841.
21
2016
4,31
3,05
210
.69
1.46
2017
4,87
3,34
711
.96
1.62
2018
4,51
2,50
611
.38
1.48
2019
4,73
2,84
610
.91
1.42
2020
5,49
3,44
411
.99
1.60
Sour
ce: M
APFR
E Ec
onom
ics
(bas
ed o
n IC
EA d
ata,
Eco
nom
ic re
port
on
the
insu
ranc
e in
dust
ry)
1 The
dat
a di
ffers
from
that
pre
sent
ed in
the
Repo
rt in
that
it re
fers
to a
repr
esen
tativ
e sa
mpl
e an
d no
t the
ent
ire in
dust
ry.
2 N
et re
sult/
Equi
ty a
t the
end
of t
he s
ame
year
. 3
Net
resu
lt/To
tal a
sset
s at
the
end
of th
e sa
me
year
.
THE SPANISH INSURANCE MARKET IN 2020
133

Tabl
e A.
8.
Basi
c N
on-L
ife in
sura
nce
indi
cato
rs in
the
Span
ish
insu
ranc
e in
dust
ry, 2
010–
2020
(p
rem
ium
s, m
illio
ns o
f eur
os; r
atio
ove
r pre
miu
ms,
%)
Year
Wri
tten
prem
ium
s
Basi
c ind
icat
ors
(% o
f pre
miu
ms)
Vari
atio
n in
pr
emiu
ms
Rete
ntio
nGr
oss
loss
ratio
Gros
s ex
pens
esNe
t los
s ra
tioNe
t ex
pens
esNe
t com
bine
d ra
tioFi
nanc
ial
resu
ltTe
chni
cal-
finan
cial
re
sult
2010
31,8
110.
2%85
.2%
71.7
%20
.8%
73.0
%20
.7%
93.8
%4.
6%10
.9%
2011
31,7
19-0
.3%
88.6
%69
.1%
21.3
%71
.2%
21.3
%92
.6%
4.0%
11.4
%
2012
31,0
95-2
.0%
88.6
%68
.9%
22.0
%71
.0%
22.2
%93
.2%
2.9%
9.7%
2013
30,3
86-2
.3%
87.6
%70
.2%
22.2
%71
.9%
22.7
%94
.6%
3.9%
9.3%
2014
30,6
470.
9%87
.9%
69.6
%22
.3%
71.5
%22
.4%
93.9
%4.
8%10
.8%
2015
31,2
982.
1%87
.6%
70.2
%22
.4%
72.3
%22
.5%
94.7
%4.
2%9.
4%
2016
32,6
934.
5%84
.8%
68.9
%22
.6%
71.3
%22
.3%
93.6
%3.
9%10
.3%
2017
34,0
274.
1%84
.9%
71.0
%22
.3%
72.0
%22
.1%
94.0
%3.
5%9.
5%
2018
35,4
304.
1%84
.9%
69.8
%22
.4%
71.5
%22
.2%
93.7
%3.
1%9.
4%
2019
36,6
523.
5%85
.6%
69.4
%22
.9%
70.7
%22
.2%
92.9
%3.
1%10
.2%
2020
37,0
521.
1%85
.3%
66.1
%23
.7%
67.0
%23
.4%
90.5
%2.
6%12
.1%
Sour
ce: M
APFR
E Ec
onom
ics
(bas
ed o
n IC
EA d
ata,
Eco
nom
ic re
port
on
the
insu
ranc
e in
dust
ry)
THE SPANISH INSURANCE MARKET IN 2020
134

Tabl
e A.
9.
Tren
ds in
the
num
ber o
f com
pani
es o
pera
ting
in th
e Sp
anis
h in
sura
nce
indu
stry
by l
egal
str
uctu
re, 2
010–
2020
(n
umbe
r of c
ompa
nies
)
Year
Lim
ited
liabi
lity
com
pani
esM
utua
l com
pani
esM
utua
l pro
vide
nt s
ocie
ties1
Rein
sura
nce
com
pani
es
2010
195
3555
2
2011
188
3455
2
2012
183
3253
2
2013
178
3252
2
2014
168
3153
3
2015
156
3150
3
2016
147
3150
3
2017
145
3148
3
2018
134
3048
3
2019
213
130
483
2020
212
630
474
Sour
ce: M
APFR
E Ec
onom
ics
(bas
ed o
n da
ta fr
om th
e D
GSFP
, Ann
ual r
epor
t on
insu
ranc
e an
d pe
nsio
n fu
nds)
1 Sub
ject
to c
ontr
ol b
y th
e DG
SFP.
2 F
or 2
019
and
2020
, the
dat
a is
as
on M
arch
31
of e
ach
year
.
THE SPANISH INSURANCE MARKET IN 2020
135
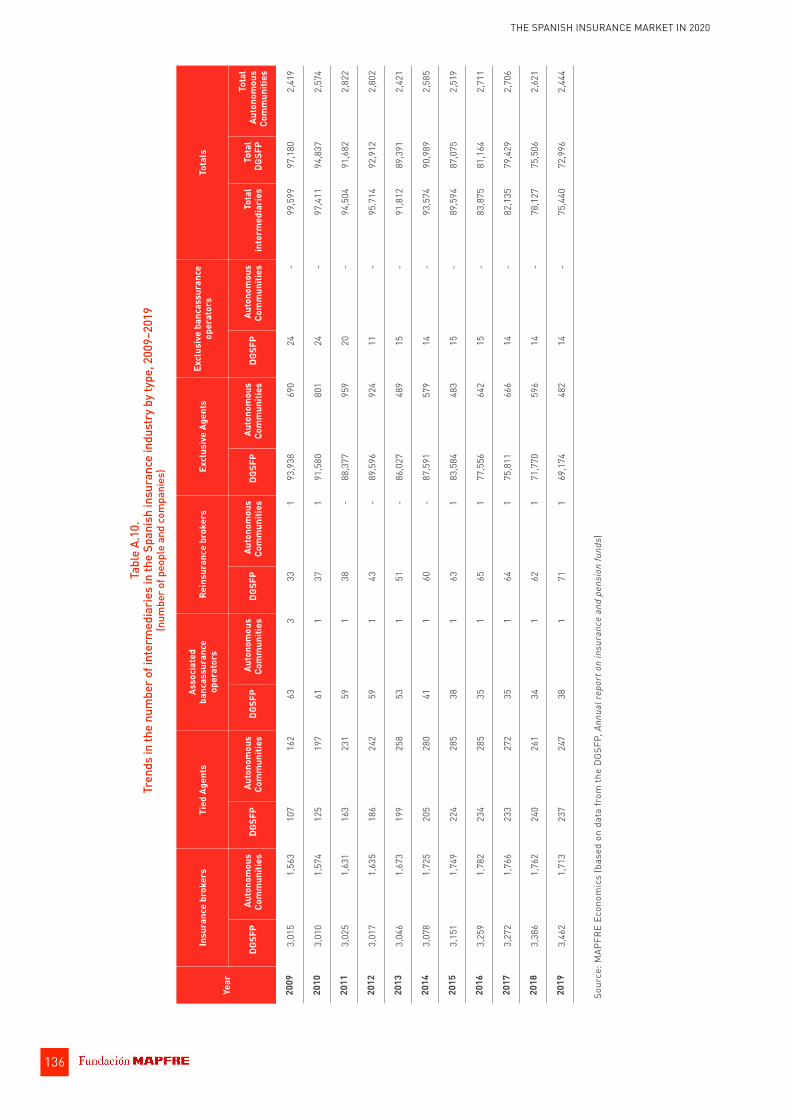
Tabl
e A.
10.
Tren
ds in
the
num
ber o
f int
erm
edia
ries
in th
e Sp
anis
h in
sura
nce
indu
stry
by t
ype,
200
9–20
19
(num
ber o
f peo
ple
and
com
pani
es)
Year
Insu
ranc
e br
oker
sTi
ed A
gent
sAs
soci
ated
ba
ncas
sura
nce
oper
ator
sRe
insu
ranc
e br
oker
sEx
clus
ive
Agen
tsEx
clus
ive
banc
assu
ranc
e op
erat
ors
Tota
ls
DGSF
PAu
tono
mou
s Co
mm
uniti
esDG
SFP
Auto
nom
ous
Com
mun
ities
DGSF
PAu
tono
mou
s Co
mm
uniti
esDG
SFP
Auto
nom
ous
Com
mun
ities
DGSF
PAu
tono
mou
s Co
mm
uniti
esDG
SFP
Auto
nom
ous
Com
mun
ities
Tota
l in
term
edia
ries
Tota
l DG
SFP
Tota
l Au
tono
mou
s Co
mm
uniti
es
2009
3,01
51,
563
107
162
633
331
93,9
3869
024
-99
,599
97,1
802,
419
2010
3,01
01,
574
125
197
611
371
91,5
8080
124
-97
,411
94,8
372,
574
2011
3,02
51,
631
163
231
591
38-
88,3
7795
920
-94
,504
91,6
822,
822
2012
3,01
71,
635
186
242
591
43-
89,5
9692
411
-95
,714
92,9
122,
802
2013
3,04
61,
673
199
258
531
51-
86,0
2748
915
-91
,812
89,3
912,
421
2014
3,07
81,
725
205
280
411
60-
87,5
9157
914
-93
,574
90,9
892,
585
2015
3,15
11,
749
224
285
381
631
83,5
8448
315
-89
,594
87,0
752,
519
2016
3,25
91,
782
234
285
351
651
77,5
5664
215
-83
,875
81,1
642,
711
2017
3,27
21,
766
233
272
351
641
75,8
1166
614
-82
,135
79,4
292,
706
2018
3,38
61,
762
240
261
341
621
71,7
7059
614
-78
,127
75,5
062,
621
2019
3,46
21,
713
237
247
381
711
69,1
7448
214
-75
,440
72,9
962,
444
Sour
ce: M
APFR
E Ec
onom
ics
(bas
ed o
n da
ta fr
om th
e D
GSFP
, Ann
ual r
epor
t on
insu
ranc
e an
d pe
nsio
n fu
nds)
THE SPANISH INSURANCE MARKET IN 2020
136

Tabl
e A.
11.
Prem
ium
volu
me
by a
uton
omou
s co
mm
unity
, 201
0–20
20
(mill
ions
of e
uros
)
2010
2011
2012
2013
2014
2015
2016
2017
2018
2019
2020
Anda
lusi
a5,
966
5,98
25,
717
5,82
46,
045
6,23
76,
949
7,39
47,
276
7,33
86,
802
Arag
on1,
655
1,91
61,
680
1,51
21,
710
1,65
61,
909
1,80
81,
892
1,82
01,
609
Astu
rias
787
835
866
837
956
854
871
904
907
912
852
Bale
aric
Isla
nds
911
1,24
61,
175
1,27
01,
283
1,32
61,
383
1,52
61,
404
1,41
01,
257
Cana
ry Is
land
s1,
234
1,24
11,
269
1,21
21,
269
1,36
71,
641
1,60
31,
583
1,62
81,
539
Cant
abri
a47
146
249
548
549
750
352
452
953
454
551
3
Cast
ile-L
a M
anch
a1,
582
1,64
71,
708
1,61
61,
766
1,70
51,
734
1,74
31,
797
1,76
81,
649
Cast
ile a
nd L
eon
2,22
42,
393
2,33
12,
211
2,27
52,
482
2,65
32,
758
2,80
52,
766
2,46
5
Cata
loni
a9,
942
11,2
2610
,079
9,67
710
,237
10,1
2111
,295
11,3
4510
,809
10,8
3210
,433
Vale
ncia
n Co
mm
unity
4,06
14,
222
4,09
64,
373
4,30
54,
059
4,40
64,
556
4,49
74,
613
4,45
7
Extr
emad
ura
736
674
773
724
696
799
898
868
878
868
820
Galic
ia2,
501
2,61
62,
226
2,15
12,
167
2,27
92,
515
2,61
42,
647
2,66
52,
418
Com
mun
ity o
f Mad
rid
10,2
1710
,178
9,89
69,
369
9,16
59,
422
10,3
8010
,570
10,8
6512
,340
11,0
89
Regi
on o
f Mur
cia
1,03
81,
087
1,03
31,
031
1,04
11,
063
1,16
21,
179
1,15
81,
198
1,12
6
Char
tere
d Co
mm
unity
of
Nava
rre
822
619
622
838
1,00
395
296
196
188
491
881
2
Basq
ue C
ount
ry2,
268
2,47
72,
429
2,32
32,
352
2,39
42,
461
2,52
42,
499
2,56
02,
435
La R
ioja
417
380
356
356
359
345
373
374
382
381
358
Auto
nom
ous
Citie
s of
Ceu
ta
and
Mel
illa
8194
9597
9897
114
113
114
117
107
Sour
ce: I
CEA,
The
insu
ranc
e m
arke
t by p
rovin
ce.
THE SPANISH INSURANCE MARKET IN 2020
137
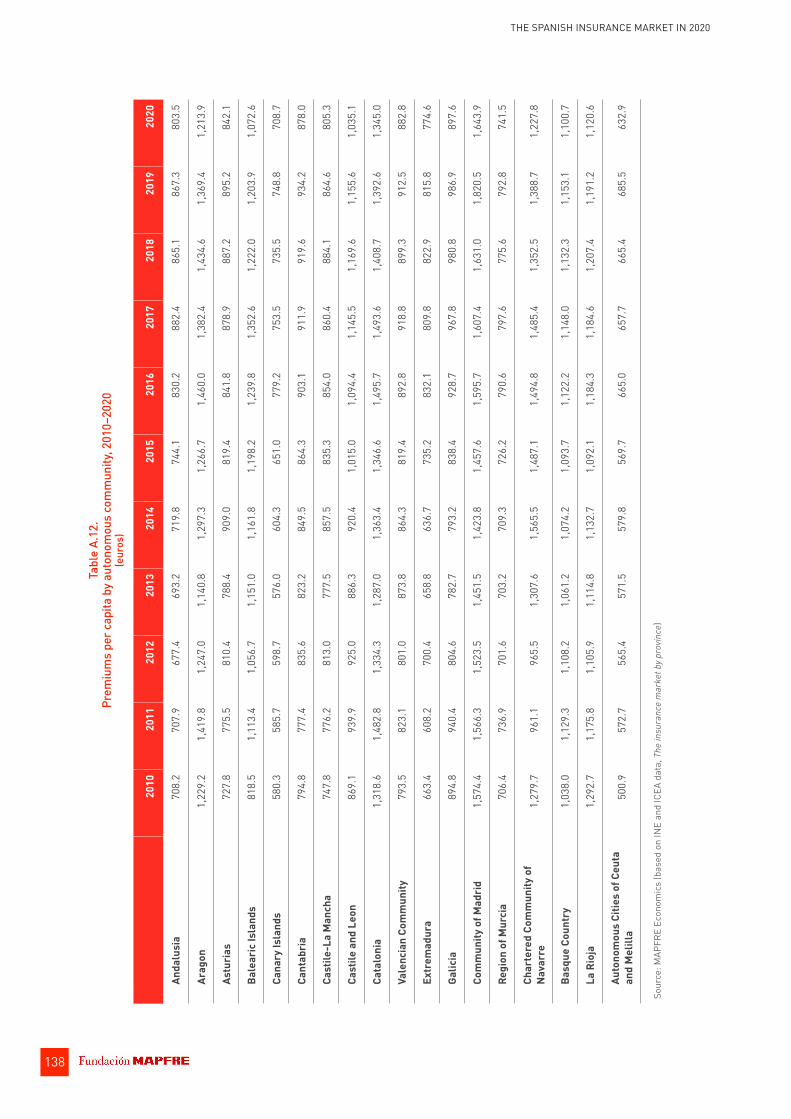
Tabl
e A.
12.
Prem
ium
s pe
r cap
ita b
y aut
onom
ous
com
mun
ity, 2
010–
2020
(e
uros
)
2010
2011
2012
2013
2014
2015
2016
2017
2018
2019
2020
Anda
lusi
a70
8.2
707.
967
7.4
693.
271
9.8
744.
183
0.2
882.
486
5.1
867.
380
3.5
Arag
on1,
229.
21,
419.
81,
247.
01,
140.
81,
297.
31,
266.
71,
460.
01,
382.
41,
434.
61,
369.
41,
213.
9
Astu
rias
727.
877
5.5
810.
478
8.4
909.
081
9.4
841.
887
8.9
887.
289
5.2
842.
1
Bale
aric
Isla
nds
818.
51,
113.
41,
056.
71,
151.
01,
161.
81,
198.
21,
239.
81,
352.
61,
222.
01,
203.
91,
072.
6
Cana
ry Is
land
s58
0.3
585.
759
8.7
576.
060
4.3
651.
077
9.2
753.
573
5.5
748.
870
8.7
Cant
abri
a79
4.8
777.
483
5.6
823.
284
9.5
864.
390
3.1
911.
991
9.6
934.
287
8.0
Cast
ile-L
a M
anch
a74
7.8
776.
281
3.0
777.
585
7.5
835.
385
4.0
860.
488
4.1
864.
680
5.3
Cast
ile a
nd L
eon
869.
193
9.9
925.
088
6.3
920.
41,
015.
01,
094.
41,
145.
51,
169.
61,
155.
61,
035.
1
Cata
loni
a1,
318.
61,
482.
81,
334.
31,
287.
01,
363.
41,
346.
61,
495.
71,
493.
61,
408.
71,
392.
61,
345.
0
Vale
ncia
n Co
mm
unity
793.
582
3.1
801.
087
3.8
864.
381
9.4
892.
891
8.8
899.
391
2.5
882.
8
Extr
emad
ura
663.
460
8.2
700.
465
8.8
636.
773
5.2
832.
180
9.8
822.
981
5.8
774.
6
Galic
ia89
4.8
940.
480
4.6
782.
779
3.2
838.
492
8.7
967.
898
0.8
986.
989
7.6
Com
mun
ity o
f Mad
rid
1,57
4.4
1,56
6.3
1,52
3.5
1,45
1.5
1,42
3.8
1,45
7.6
1,59
5.7
1,60
7.4
1,63
1.0
1,82
0.5
1,64
3.9
Regi
on o
f Mur
cia
706.
473
6.9
701.
670
3.2
709.
372
6.2
790.
679
7.6
775.
679
2.8
741.
5
Char
tere
d Co
mm
unity
of
Nava
rre
1,27
9.7
961.
196
5.5
1,30
7.6
1,56
5.5
1,48
7.1
1,49
4.8
1,48
5.4
1,35
2.5
1,38
8.7
1,22
7.8
Basq
ue C
ount
ry1,
038.
01,
129.
31,
108.
21,
061.
21,
074.
21,
093.
71,
122.
21,
148.
01,
132.
31,
153.
11,
100.
7
La R
ioja
1,29
2.7
1,17
5.8
1,10
5.9
1,11
4.8
1,13
2.7
1,09
2.1
1,18
4.3
1,18
4.6
1,20
7.4
1,19
1.2
1,12
0.6
Auto
nom
ous
Citie
s of
Ceu
ta
and
Mel
illa
500.
957
2.7
565.
457
1.5
579.
856
9.7
665.
065
7.7
665.
468
5.5
632.
9
Sour
ce: M
APFR
E Ec
onom
ics
(bas
ed o
n IN
E an
d IC
EA d
ata,
The
insu
ranc
e m
arke
t by p
rovin
ce)
THE SPANISH INSURANCE MARKET IN 2020
138

Tabl
e A.
13.
Over
all r
anki
ng o
f the
ten
larg
est i
nsur
ance
gro
ups
in S
pain
by p
rem
ium
volu
me,
200
9–20
20
(pre
miu
ms,
mill
ions
of e
uros
; mar
ket s
hare
, %)
2009
2010
2011
2012
Grou
pPr
emiu
ms
% o
f m
arke
tGr
oup
Prem
ium
s%
of
mar
ket
Grou
pPr
emiu
ms
% o
f m
arke
tGr
oup
Prem
ium
s%
of
mar
ket
MAP
FRE
7,78
613
.0M
APFR
E8,
455
14.7
MAP
FRE
8,30
713
.7M
APFR
E7,
956
13.9
ZURI
CH5,
409
9.0
CAIX
A5,
640
9.8
CAIX
A5,
068
8.4
CAIX
A5,
165
9.0
SAN
TAN
DER
3,48
85.
8ZU
RICH
4,64
68.
1M
UTUA
M
ADRI
LEÑ
A3,
472
5.7
MUT
UA
MAD
RILE
ÑA
3,64
56.
4
CAIX
A GR
OUP
3,30
45.
5AX
A3,
117
5.4
ZURI
CH2,
943
4.9
SAN
TAN
DER
3,51
26.
1
AXA
3,28
55.
5AL
LIAN
Z2,
962
5.1
ALLI
ANZ
3,00
15.
0AL
LIAN
Z3,
046
5.3
ALLI
ANZ
3,03
35.
1CA
SER
2,58
24.
5SA
NTA
NDE
R2,
950
4.9
AXA
2,68
34.
7
GEN
ERAL
I2,
584
4.3
GEN
ERAL
I2,
282
4.0
AXA
2,94
34.
9GE
NER
ALI
2,51
34.
4
CASE
R2,
397
4.0
SAN
TAN
DER
2,15
93.
7CA
SER
2,81
84.
7BB
VA2,
109
3.7
CATA
LAN
A OC
CIDE
NTE
2,16
93.
6CA
TALA
NA
OCCI
DEN
TE2,
044
3.5
GEN
ERAL
I2,
416
4.0
CASE
R1,
997
3.5
AVIV
A1,
827
3.0
AVIV
A1,
792
3.1
CATA
LAN
A OC
CIDE
NTE
2,03
93.
4CA
TALA
NA
OCCI
DEN
TE1,
971
3.4
Tota
l mar
ket
59,8
98To
tal m
arke
t57
,587
Tota
l mar
ket
60,5
92To
tal m
arke
t57
,398
Sour
ce: M
APFR
E Ec
onom
ics
(bas
ed o
n IC
EA d
ata,
Ran
king
of t
otal
dire
ct in
sura
nce
by g
roup
and
com
pany
)
THE SPANISH INSURANCE MARKET IN 2020
139

Tabl
e A.
13.
Over
all r
anki
ng o
f the
ten
larg
est i
nsur
ance
gro
ups
in S
pain
by p
rem
ium
volu
me,
200
9–20
20 (c
ontin
ued)
(p
rem
ium
s, m
illio
ns o
f eur
os; m
arke
t sha
re, %
)
2013
2014
2015
2016
Grou
pPr
emiu
ms
% o
f m
arke
tGr
oup
Prem
ium
s%
of
mar
ket
Grou
pPr
emiu
ms
% o
f m
arke
tGr
oup
Prem
ium
s%
of
mar
ket
MAP
FRE
7,06
012
.7M
APFR
E7,
266
13.1
VIDA
CAIX
A7,
189
12.6
VIDA
CAIX
A9,
492
14.9
CAIX
A5,
298
9.5
CAIX
A5,
538
10.0
MAP
FRE
6,41
611
.3M
APFR
E6,
708
10.5
MUT
UA
MAD
RILE
ÑA
3,87
36.
9M
UTUA
M
ADRI
LEÑ
A4,
165
7.5
MUT
UA
MAD
RILE
ÑA
4,33
37.
6ZU
RICH
5,57
18.
7
ALLI
ANZ
3,19
95.
7AL
LIAN
Z3,
287
5.9
ZURI
CH4,
069
7.2
MUT
UA
MAD
RILE
ÑA
4,75
17.
4
SAN
TAN
DER
SEGU
ROS
3,13
65.
6AX
A2,
660
4.8
ALLI
ANZ
3,52
66.
2AL
LIAN
Z3,
566
5.6
AXA
2,71
24.
9ZU
RICH
2,50
74.
5CA
TALA
NA
OCCI
DEN
TE2,
867
5.0
CATA
LAN
A OC
CIDE
NTE
2,90
84.
6
BBVA
SEG
UROS
2,30
04.
1GE
NER
ALI
2,25
94.
1AX
A2,
502
4.4
AXA
2,57
74.
0
GEN
ERAL
I2,
293
4.1
CATA
LAN
A OC
CIDE
NTE
2,16
23.
9GE
NER
ALI
2,30
64.
1GE
NER
ALI
2,50
13.
9
CATA
LAN
A OC
CIDE
NTE
2,01
43.
6BB
VA S
EGUR
OS2,
088
3.8
BBVA
SEG
UROS
2,08
53.
7BB
VA S
EGUR
OS1,
932
3.0
CASE
R1,
713
3.1
SAN
TAN
DER
SEGU
ROS
1,90
33.
4SA
NTA
LUCI
A1,
287
2.3
CASE
R1,
438
2.3
Tota
l mar
ket
55,7
73To
tal m
arke
t55
,486
Tota
l mar
ket
56,9
05To
tal m
arke
t63
,892
Sour
ce: M
APFR
E Ec
onom
ics
(bas
ed o
n IC
EA d
ata,
Ran
king
of t
otal
dire
ct in
sura
nce
by g
roup
and
com
pany
)
THE SPANISH INSURANCE MARKET IN 2020
140

Tabl
e A.
13.
Over
all r
anki
ng o
f the
ten
larg
est i
nsur
ance
gro
ups
in S
pain
by p
rem
ium
volu
me,
200
9–20
20 (c
ontin
ued)
(p
rem
ium
s, m
illio
ns o
f eur
os; m
arke
t sha
re, %
)
2017
2018
2019
2020
Grou
pPr
emiu
ms
% o
f m
arke
tGr
oup
Prem
ium
s%
of
mar
ket
Grou
pPr
emiu
ms
% o
f m
arke
tGr
oup
Prem
ium
s%
of
mar
ket
VIDA
CAIX
A9,
666
15.2
VIDA
CAIX
A8,
218
12.8
VIDA
CAIX
A8,
582
13.4
VIDA
CAIX
A7,
144
12.1
MAP
FRE
6,74
910
.6M
APFR
E7,
291
11.3
MAP
FRE
7,33
511
.4M
APFR
E6,
673
11.3
MUT
UA
MAD
RILE
ÑA
5,00
57.
9M
UTUA
M
ADRI
LEÑ
A5,
270
8.2
MUT
UA
MAD
RILE
ÑA
5,45
58.
5M
UTUA
M
ADRI
LEÑ
A5,
526
9.4
ZURI
CH3,
806
6.0
ALLI
ANZ
3,61
25.
6AL
LIAN
Z3,
430
5.3
CATA
LAN
A OC
CIDE
NTE
3,01
95.
1
ALLI
ANZ
3,51
55.
5ZU
RICH
3,56
05.
5CA
TALA
NA
OCCI
DEN
TE3,
051
4.8
ALLI
ANZ
2,99
85.
1
CATA
LAN
A OC
CIDE
NTE
2,82
64.
5CA
TALA
NA
OCCI
DEN
TE2,
854
4.4
ZURI
CH2,
954
4.6
AXA
2,88
04.
9
SAN
TALU
CIA
2,53
64.
0AX
A GR
OUP
2,59
94.
0AX
A GR
OUP
2,95
24.
6ZU
RICH
2,46
94.
2
GEN
ERAL
I2,
445
3.9
SAN
TALU
CIA
2,58
44.
0SA
NTA
LUCI
A2,
456
3.8
GEN
ERAL
I2,
249
3.8
AXA
GROU
P2,
411
3.8
GEN
ERAL
I2,
409
3.7
GEN
ERAL
I2,
440
3.8
SAN
TALU
CIA
2,14
73.
6
BBVA
SEG
UROS
1,83
72.
9SA
NTA
NDE
R SE
GURO
S1,
977
3.1
SAN
TAN
DER
SEGU
ROS
1,69
42.
6H
ELVE
TIA
1,88
33.
2
Tota
l mar
ket
63,4
10To
tal m
arke
t64
,377
Tota
l mar
ket
64,1
56To
tal m
arke
t58
,889
Sour
ce: M
APFR
E Ec
onom
ics
(bas
ed o
n IC
EA d
ata,
Ran
king
of t
otal
dire
ct in
sura
nce
by g
roup
and
com
pany
)
THE SPANISH INSURANCE MARKET IN 2020
141

Tabl
e A.
14.
Over
all r
anki
ng o
f the
ten
larg
est N
on-L
ife in
sura
nce
grou
ps in
Spa
in b
y pre
miu
m vo
lum
e, 2
009–
2020
(p
rem
ium
s, m
illio
ns o
f eur
os; m
arke
t sha
re, %
)
2009
2010
2011
2012
Grou
pPr
emiu
ms
% o
f m
arke
tGr
oup
Prem
ium
s%
of
mar
ket
Grou
pPr
emiu
ms
% o
f m
arke
tGr
oup
Prem
ium
s%
of
mar
ket
MAP
FRE
5,23
916
.5M
APFR
E5,
166
16.2
MAP
FRE
5,13
616
.2M
APFR
E4,
973
16.0
AXA
2,54
08.
0AX
A2,
402
7.5
MUT
UA
MAD
RILE
ÑA
3,39
310
.7M
UTUA
M
ADRI
LEÑ
A3,
557
11.4
ALLI
ANZ
2,08
16.
5AL
LIAN
Z2,
031
6.4
AXA
2,30
57.
3AX
A2,
126
6.8
CATA
LAN
A OC
CIDE
NTE
1,50
84.
7CA
IXA
1,92
16.
0AL
LIAN
Z2,
032
6.4
ALLI
ANZ
1,97
16.
3
GEN
ERAL
I1,
456
4.6
CATA
LAN
A OC
CIDE
NTE
1,47
64.
6CA
TALA
NA
OCCI
DEN
TE1,
439
4.5
GEN
ERAL
I1,
369
4.4
ZURI
CH1,
295
4.1
GEN
ERAL
I1,
362
4.3
GEN
ERAL
I1,
365
4.3
CATA
LAN
A OC
CIDE
NTE
1,36
64.
4
MUT
UA
MAD
RILE
ÑA
1,25
64.
0M
UTUA
M
ADRI
LEÑ
A1,
305
4.1
ZURI
CH1,
170
3.7
SAN
ITAS
1,13
73.
7
CASE
R1,
191
3.7
ZURI
CH1,
258
4.0
CASE
R1,
106
3.5
ZURI
CH1,
097
3.5
ADES
LAS
1,29
14.
1CA
SER
1,13
73.
6SA
NIT
AS1,
099
3.5
SAN
TALU
CIA
1,04
53.
4
SAN
ITAS
1,04
13.
3SA
NIT
AS1,
068
3.4
SAN
TALU
CIA
992
3.1
ASIS
A1,
021
3.3
Tota
l mar
ket
31,7
79To
tal m
arke
t31
,820
Tota
l mar
ket
31,7
24To
tal m
arke
t31
,116
Sour
ce: M
APFR
E Ec
onom
ics
(bas
ed o
n IC
EA d
ata,
Ran
king
of t
otal
Non
-Life
by g
roup
and
com
pany
)
THE SPANISH INSURANCE MARKET IN 2020
142

Tabl
e A.
14.
Over
all r
anki
ng o
f the
ten
larg
est N
on-L
ife in
sura
nce
grou
ps in
Spa
in b
y pre
miu
m vo
lum
e, 2
009–
2020
(con
tinue
d)
(pre
miu
ms,
mill
ions
of e
uros
; mar
ket s
hare
, %)
2013
2014
2015
2016
Grou
pPr
emiu
ms
% o
f m
arke
tGr
oup
Prem
ium
s%
of
mar
ket
Grou
pPr
emiu
ms
% o
f m
arke
tGr
oup
Prem
ium
s%
of
mar
ket
MAP
FRE
4,63
415
.3M
APFR
E4,
629
15.1
MAP
FRE
4,68
615
MAP
FRE
4,76
114
.5
MUT
UA
MAD
RILE
ÑA
3,67
712
.1M
UTUA
M
ADRI
LEÑ
A3,
927
12.8
MUT
UA
MAD
RILE
ÑA
4,16
913
.3M
UTUA
M
ADRI
LEÑ
A4,
506
13.8
AXA
2,02
16.
7AL
LIAN
Z2,
028
6.6
ALLI
ANZ
2,15
26.
9AL
LIAN
Z2,
272
6.9
ALLI
ANZ
1,97
56.
5AX
A1,
927
6.3
CATA
LAN
A OC
CIDE
NTE
1,93
96.
2CA
TALA
NA
OCCI
DEN
TE2,
043
6.2
GEN
ERAL
I1,
290
4.3
CATA
LAN
A OC
CIDE
NTE
1,29
44.
2AX
A1,
755
5.6
AXA
1,79
35.
5
CATA
LAN
A OC
CIDE
NTE
1,29
04.
3GE
NER
ALI
1,27
54.
2GE
NER
ALI
1,34
84.
3GE
NER
ALI
1,45
94.
5
SAN
ITAS
1,17
83.
9SA
NIT
AS1,
160
3.8
SAN
ITAS
1,16
53.
7SA
NIT
AS1,
216
3.7
ZURI
CH1,
040
3.4
SAN
TALU
CIA
1,06
23.
5ZU
RICH
1,07
23.
4SA
NTA
LUCI
A1,
073
3.3
SAN
TALU
CIA
1,02
93.
4ZU
RICH
1,05
53.
4AS
ISA
1,05
93.
4AS
ISA
1,06
93.
3
ASIS
A96
83.
2AS
ISA
1,01
23.
3SA
NTA
LUCI
A1,
050
3.4
ZURI
CH1,
027
3.1
Tota
l mar
ket
30,2
68To
tal m
arke
t30
,647
Tota
l mar
ket
31,3
38To
tal m
arke
t32
,755
Sour
ce: M
APFR
E Ec
onom
ics
(bas
ed o
n IC
EA d
ata,
Ran
king
of t
otal
Non
-Life
by g
roup
and
com
pany
)
THE SPANISH INSURANCE MARKET IN 2020
143

Tabl
e A.
14.
Over
all r
anki
ng o
f the
ten
larg
est N
on-L
ife in
sura
nce
grou
ps in
Spa
in b
y pre
miu
m vo
lum
e, 2
009–
2020
(con
tinue
d)
(pre
miu
ms,
mill
ions
of e
uros
; mar
ket s
hare
, %)
2017
2018
2019
2020
Grou
pPr
emiu
ms
% o
f m
arke
tGr
oup
Prem
ium
s%
of
mar
ket
Grou
pPr
emiu
ms
% o
f m
arke
tGr
oup
Prem
ium
s%
of
mar
ket
MAP
FRE
4,84
514
.2M
UTUA
M
ADRI
LEÑ
A5,
046
14.3
MUT
UA
MAD
RILE
ÑA
5,26
814
.4M
UTUA
M
ADRI
LEÑ
A5,
419
14.6
MUT
UA
MAD
RILE
ÑA
4,81
614
.2M
APFR
E5,
006
14.1
MAP
FRE
5,15
614
.1M
APFR
E5,
161
13.9
ALLI
ANZ
2,37
37.
0AL
LIAN
Z2,
507
7.1
ALLI
ANZ
2,44
86.
7AL
LIAN
Z2,
369
6.4
CATA
LAN
A OC
CIDE
NTE
2,06
16.
1CA
TALA
NA
OCCI
DEN
TE2,
104
5.9
CATA
LAN
A OC
CIDE
NTE
2,22
56.
1AX
A2,
245
6.1
AXA
1,85
15.
4AX
A1,
927
5.4
AXA
2,21
66.
0CA
TALA
NA
OCCI
DEN
TE2,
229
6.0
GEN
ERAL
I1,
509
4.4
GEN
ERAL
I1,
548
4.4
GEN
ERAL
I1,
590
4.3
GEN
ERAL
I1,
577
4.3
SAN
ITAS
1,27
13.
7SA
NIT
AS1,
344
3.8
SAN
ITAS
1,39
63.
8SA
NIT
AS1,
442
3.9
SAN
TALU
CIA
1,12
93.
3AS
ISA
1,16
23.
3AS
ISA
1,21
13.
3H
ELVE
TIA
1,42
53.
8
ASIS
A1,
099
3.2
SAN
TALU
CIA
1,15
73.
3SA
NTA
LUCI
A1,
208
3.3
ASIS
A1,
258
3.4
ZURI
CH1,
001
2.9
CASE
R1,
022
2.9
ZURI
CH1,
056
2.9
SAN
TALU
CIA
1,23
03.
3
Tota
l mar
ket
34,0
03To
tal m
arke
t35
,382
Tota
l mar
ket
36,6
32To
tal m
arke
t37
,052
Sour
ce: M
APFR
E Ec
onom
ics
(bas
ed o
n IC
EA d
ata,
Ran
king
of t
otal
Non
-Life
by g
roup
and
com
pany
)
THE SPANISH INSURANCE MARKET IN 2020
144

Tabl
e A.
15.
Over
all r
anki
ng o
f the
ten
larg
est L
ife in
sura
nce
grou
ps in
Spa
in b
y pre
miu
m vo
lum
e, 2
009–
2020
(p
rem
ium
s, m
illio
ns o
f eur
os; m
arke
t sha
re, %
)
2009
2010
2011
2012
Grou
pPr
emiu
ms
% o
f m
arke
tGr
oup
Prem
ium
s%
of
mar
ket
Grou
pPr
emiu
ms
% o
f m
arke
tGr
oup
Prem
ium
s%
of
mar
ket
ZURI
CH4,
114
14.6
CAIX
A3,
719
14.4
CAIX
A5,
036
17.4
CAIX
A5,
131
19.5
SAN
TAN
DER
3,33
411
.9ZU
RICH
3,38
913
.2M
APFR
E3,
171
11.0
SAN
TAN
DER
3,36
612
.8
CAIX
A2,
972
10.6
MAP
FRE
3,28
912
.8SA
NTA
NDE
R2,
795
9.7
MAP
FRE
2,98
311
.3
MAP
FRE
2,53
89.
0SA
NTA
NDE
R2,
003
7.8
ZURI
CH2,
060
7.1
BBVA
1,86
57.
1
AVIV
A1,
814
6.5
AVIV
A1,
779
6.9
AVIV
A1,
787
6.2
AVIV
A1,
349
5.1
AEGO
N1,
422
5.1
CASE
R1,
445
5.6
CASE
R1,
712
5.9
IBER
CAJA
1,15
94.
4
CASE
R1,
206
4.3
AEGO
N1,
360
5.3
BBVA
1,62
25.
6GE
NER
ALI
1,14
44.
4
IBER
CAJA
1,14
44.
1IB
ERCA
JA1,
139
4.4
AEGO
N1,
613
5.6
ALLI
ANZ
1,07
54.
1
GEN
ERAL
I1,
128
4.0
ALLI
ANZ
930
3.6
IBER
CAJA
1,50
15.
2CA
SER
976
3.7
BBVA
SEG
UROS
1,12
84.
0GE
NER
ALI
920
3.6
GEN
ERAL
I1,
051
3.6
AEGO
N92
43.
5
Tota
l mar
ket
28,1
19To
tal m
arke
t25
,768
Tota
l mar
ket
28,8
69To
tal m
arke
t26
,282
Sour
ce: M
APFR
E Ec
onom
ics
(bas
ed o
n IC
EA d
ata,
Ove
rall
rank
ing
of L
ife p
rem
ium
s by
gro
up)
THE SPANISH INSURANCE MARKET IN 2020
145
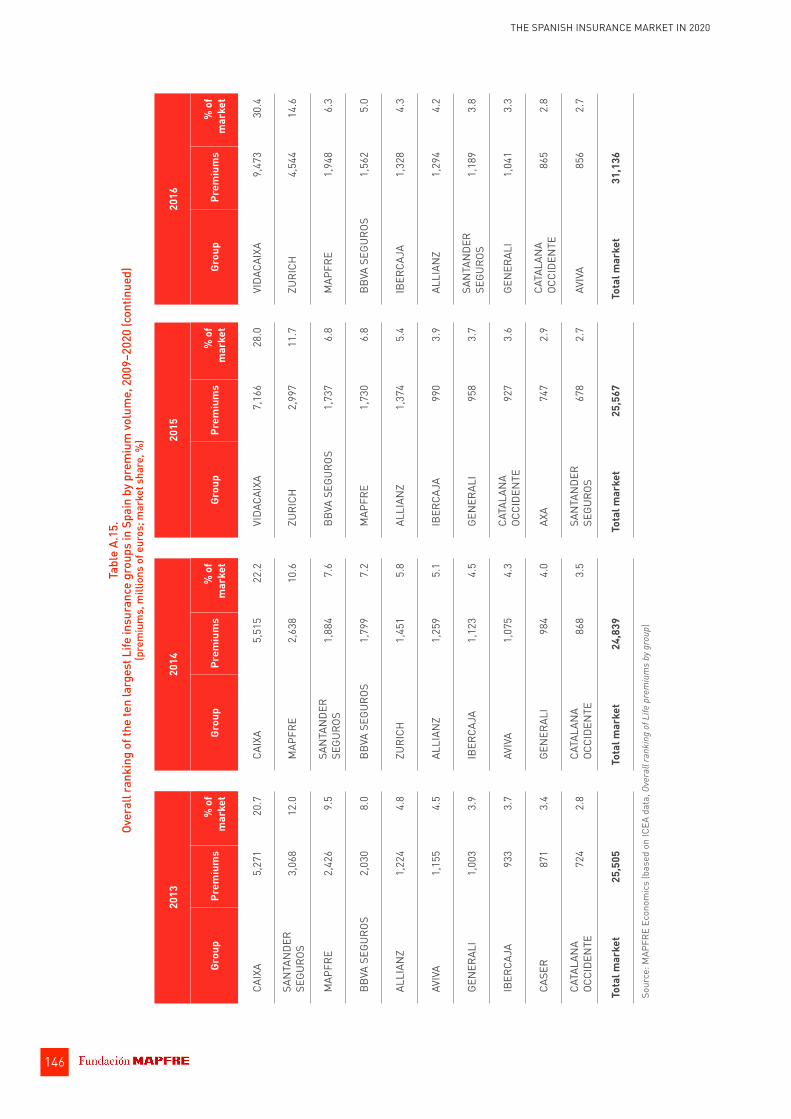
Tabl
e A.
15.
Over
all r
anki
ng o
f the
ten
larg
est L
ife in
sura
nce
grou
ps in
Spa
in b
y pre
miu
m vo
lum
e, 2
009–
2020
(con
tinue
d)
(pre
miu
ms,
mill
ions
of e
uros
; mar
ket s
hare
, %)
2013
2014
2015
2016
Grou
pPr
emiu
ms
% o
f m
arke
tGr
oup
Prem
ium
s%
of
mar
ket
Grou
pPr
emiu
ms
% o
f m
arke
tGr
oup
Prem
ium
s%
of
mar
ket
CAIX
A5,
271
20.7
CAIX
A5,
515
22.2
VIDA
CAIX
A7,
166
28.0
VIDA
CAIX
A9,
473
30.4
SAN
TAN
DER
SEGU
ROS
3,06
812
.0M
APFR
E2,
638
10.6
ZURI
CH2,
997
11.7
ZURI
CH4,
544
14.6
MAP
FRE
2,42
69.
5SA
NTA
NDE
R SE
GURO
S1,
884
7.6
BBVA
SEG
UROS
1,73
76.
8M
APFR
E1,
948
6.3
BBVA
SEG
UROS
2,03
08.
0BB
VA S
EGUR
OS1,
799
7.2
MAP
FRE
1,73
06.
8BB
VA S
EGUR
OS1,
562
5.0
ALLI
ANZ
1,22
44.
8ZU
RICH
1,45
15.
8AL
LIAN
Z1,
374
5.4
IBER
CAJA
1,32
84.
3
AVIV
A1,
155
4.5
ALLI
ANZ
1,25
95.
1IB
ERCA
JA99
03.
9AL
LIAN
Z1,
294
4.2
GEN
ERAL
I1,
003
3.9
IBER
CAJA
1,12
34.
5GE
NER
ALI
958
3.7
SAN
TAN
DER
SEGU
ROS
1,18
93.
8
IBER
CAJA
933
3.7
AVIV
A1,
075
4.3
CATA
LAN
A OC
CIDE
NTE
927
3.6
GEN
ERAL
I1,
041
3.3
CASE
R87
13.
4GE
NER
ALI
984
4.0
AXA
747
2.9
CATA
LAN
A OC
CIDE
NTE
865
2.8
CATA
LAN
A OC
CIDE
NTE
724
2.8
CATA
LAN
A OC
CIDE
NTE
868
3.5
SAN
TAN
DER
SEGU
ROS
678
2.7
AVIV
A85
62.
7
Tota
l mar
ket
25,5
05To
tal m
arke
t24
,839
Tota
l mar
ket
25,5
67To
tal m
arke
t31
,136
Sour
ce: M
APFR
E Ec
onom
ics
(bas
ed o
n IC
EA d
ata,
Ove
rall
rank
ing
of L
ife p
rem
ium
s by
gro
up)
THE SPANISH INSURANCE MARKET IN 2020
146

Tabl
e A.
15.
Over
all r
anki
ng o
f the
ten
larg
est L
ife in
sura
nce
grou
ps in
Spa
in b
y pre
miu
m vo
lum
e, 2
009–
2020
(con
tinue
d)
(pre
miu
ms,
mill
ions
of e
uros
; mar
ket s
hare
, %)
2017
2018
2019
2020
Grou
pPr
emiu
ms
% o
f m
arke
tGr
oup
Prem
ium
s%
of
mar
ket
Grou
pPr
emiu
ms
% o
f m
arke
tGr
oup
Prem
ium
s%
of
mar
ket
VIDA
CAIX
A9,
646
32.8
VIDA
CAIX
A8,
200
28.3
VIDA
CAIX
A8,
562
31.1
VIDA
CAIX
A7,
125
32.6
ZURI
CH2,
805
9.5
ZURI
CH2,
551
8.8
MAP
FRE
2,18
07.
9M
APFR
E1,
512
6.9
MAP
FRE
1,90
46.
5M
APFR
E2,
285
7.9
ZURI
CH1,
898
6.9
ZURI
CH1,
436
6.6
SAN
TAN
DER
SEGU
ROS
1,48
15.
0SA
NTA
NDE
R SE
GURO
S1,
949
6.7
SAN
TAN
DER
SEGU
ROS
1,66
26.
0IB
ERCA
JA95
84.
4
BBVA
SEG
UROS
1,43
14.
9SA
NTA
LUCI
A1,
427
4.9
SAN
TALU
CIA
1,24
74.
5SA
NTA
LUCI
A91
84.
2
SAN
TALU
CIA
1,40
74.
8IB
ERCA
JA1,
325
4.6
ALLI
ANZ
982
3.6
SAN
TAN
DER
SEGU
ROS
806
3.7
IBER
CAJA
1,14
83.
9BB
VA S
EGUR
OS1,
217
4.2
IBER
CAJA
938
3.4
CATA
LAN
A OC
CIDE
NTE
790
3.6
ALLI
ANZ
1,14
23.
9AL
LIAN
Z1,
106
3.8
BBVA
SEG
UROS
929
3.4
GEN
ERAL
I67
23.
1
GEN
ERAL
I93
63.
2GE
NER
ALI
861
3.0
GEN
ERAL
I85
03.
1BB
VA S
EGUR
OS65
63.
0
CATA
LAN
A OC
CIDE
NTE
766
2.6
CATA
LAN
A OC
CIDE
NTE
750
2.6
CATA
LAN
A OC
CIDE
NTE
827
3.0
AXA
634
2.9
Tota
l mar
ket
29,4
07To
tal m
arke
t28
,995
Tota
l mar
ket
27,5
23To
tal m
arke
t21
,837
Sour
ce: M
APFR
E Ec
onom
ics
(bas
ed o
n IC
EA d
ata,
Ove
rall
rank
ing
of L
ife p
rem
ium
s by
gro
up)
THE SPANISH INSURANCE MARKET IN 2020
147

Tabl
e A.
16.
Tren
ds in
conc
entr
atio
n in
the
Span
ish
insu
ranc
e in
dust
ry, 2
010–
2020
(H
erfin
dahl
and
CR5
indi
ces)
Year
Herf
inda
hl in
dex
CR5
inde
x (%
)
Tota
lLi
feNo
n-Li
fe
2010
550.
043
.1%
55.0
%40
.8%
2011
496.
437
.6%
51.4
%45
.1%
2012
508.
340
.6%
55.9
%45
.0%
2013
489.
640
.5%
55.0
%44
.9%
2014
509.
641
.3%
51.0
%45
.0%
2015
549.
644
.9%
58.7
%46
.9%
2016
595.
547
.1%
60.6
%46
.9%
2017
587.
045
.3%
58.7
%46
.9%
2018
569.
743
.4%
56.6
%46
.9%
2019
581.
943
.4%
56.5
%47
.3%
2020
567.
443
.1%
54.7
%47
.0%
Sour
ce: M
APFR
E Ec
onom
ics
(bas
ed o
n IC
EA d
ata,
Ran
king
of t
otal
dire
ct in
sura
nce
by g
roup
and
com
pany
, Ran
king
of t
otal
Non
-Life
by g
roup
and
com
pany
, Ran
king
of t
otal
Life
pre
miu
ms
by g
roup
)
THE SPANISH INSURANCE MARKET IN 2020
148

Tabl
e A.
17.
Activ
ity o
f the
Insu
ranc
e Co
mpe
nsat
ion
Cons
ortiu
m: p
rem
ium
s an
d su
rcha
rges
allo
cate
d, 2
010–
2020
(m
illio
ns o
f eur
os)
Year
Gene
ral a
ctiv
ity: p
rem
ium
s an
d su
rcha
rges
allo
cate
d
Extr
aord
inar
y ri
sks
P&C
Peop
lePe
cuni
ary
loss
esTr
affic
risk
sSO
A Gu
aran
tee
Fund
Priv
ate
vehi
cles
Offic
ial v
ehic
les
2010
656.
359
1.3
23.6
41.3
147.
712
9.1
9.1
9.5
2011
672.
960
5.4
23.4
44.1
128.
811
3.9
5.8
9.1
2012
687.
661
8.8
23.5
45.3
123.
410
9.0
3.5
10.8
2013
704.
463
8.1
22.0
44.3
114.
210
2.5
1.9
9.8
2014
709.
564
8.6
16.8
44.2
107.
698
.11.
08.
5
2015
726.
766
1.8
17.4
47.6
105.
896
.60.
68.
6
2016
745.
767
3.3
18.6
53.8
106.
798
.10.
58.
0
2017
753.
467
7.7
19.8
55.9
93.3
84.6
0.5
8.2
2018
766.
068
9.0
20.6
56.4
88.7
80.0
0.5
8.2
2019
733.
166
7.7
16.3
49.1
92.0
83.2
0.5
8.3
2020
719.
265
4.3
14.8
50.1
90.7
82.1
0.4
8.3
Sour
ce: I
nsur
ance
Com
pens
atio
n Co
nsor
tium
. Ann
ual r
epor
t.
THE SPANISH INSURANCE MARKET IN 2020
149

Tabl
e A.
18.
Activ
ity o
f the
Insu
ranc
e Co
mpe
nsat
ion
Cons
ortiu
m: d
irect
and
acc
epte
d lo
ss ra
tio, 2
010–
2020
(m
illio
ns o
f eur
os)
Year
Gene
ral a
ctiv
ity: d
irect
and
acc
epte
d lo
ss ra
tio
Extr
aord
inar
y ri
sks
P&C
Peop
lePe
cuni
ary
loss
esTr
affic
risk
sSO
A Gu
aran
tee
Fund
Priv
ate
vehi
cles
Offic
ial v
ehic
les
2010
658.
764
5.1
3.1
10.4
168.
714
5.0
10.8
12.9
2011
608.
954
2.3
3.1
63.4
111.
592
.55.
613
.4
2012
281.
029
4.4
0.8
-14.
271
.355
.41.
914
.0
2013
207.
619
1.8
1.5
14.3
69.0
56.7
1.4
10.9
2014
208.
720
5.6
0.9
2.2
57.4
47.1
0.5
9.7
2015
227.
321
6.6
1.0
9.6
68.3
59.0
1.0
8.2
2016
223.
221
8.7
0.8
3.7
58.6
49.0
0.4
9.2
2017
196.
319
0.7
1.5
4.1
57.6
49.9
0.5
7.3
2018
279.
126
3.5
1.5
14.1
61.3
52.4
0.1
8.7
2019
773.
776
9.9
1.3
2.6
59.2
49.2
0.3
9.7
2020
402.
438
5.1
0.8
16.5
58.1
48.0
0.6
9.5
Sour
ce: I
nsur
ance
Com
pens
atio
n Co
nsor
tium
. Ann
ual r
epor
t.
THE SPANISH INSURANCE MARKET IN 2020
150

Tabl
e A.
19.
Tren
ds in
ave
rage
Aut
omob
ile in
sura
nce
prem
ium
s, 2
010–
2020
(m
illio
ns o
f eur
os; a
nnua
l var
iatio
n, %
)
Year
Insu
red
vehi
cles
1Di
rect
insu
ranc
e pr
emiu
ms2
Aver
age
prem
ium
In e
uros
%
var
iatio
n
(mill
ions
of e
uros
)%
var
iatio
n(m
illio
ns o
f eur
os)
% v
aria
tion
Nom
inal
Real
2010
28.7
-0.3
%11
,553
-0.9
%40
3-0
.6%
-3.5
%
2011
28.9
0.8%
11,2
85-2
.3%
390
-3.1
%-5
.4%
2012
28.7
-0.7
%10
,622
-5.9
%37
0-5
.2%
-7.9
%
2013
28.6
-0.4
%10
,033
-5.5
%35
1-5
.1%
-5.4
%
2014
28.8
0.7%
9,89
1-1
.4%
343
-2.1
%-1
.1%
2015
29.1
1.1%
10,0
611.
7%34
50.
6%0.
6%
2016
29.8
2.4%
10,5
745.
1%35
42.
6%1.
0%
2017
30.6
2.6%
10,9
323.
4%35
70.
8%-0
.3%
2018
31.5
2.7%
11,1
462.
0%35
4-0
.8%
-1.9
%
2019
31.8
1.0%
11,3
211.
6%35
60.
5%-0
.3%
2020
32.0
0.8%
11,0
95-2
.0%
346
-2.8
%-2
.3%
Sour
ce: M
APFR
E Ec
onom
ics
(bas
ed o
n FI
VA, I
CEA
and
Insu
ranc
e Co
mpe
nsat
ion
Cons
ortiu
m d
ata)
1 Fic
hero
Info
rmat
ivo d
e Ve
hícu
los
Aseg
urad
os (I
nfor
mat
ion
Data
base
for I
nsur
ed V
ehic
les
— F
IVA)
2 D
irect
insu
ranc
e pr
emiu
ms
for i
nsur
ance
com
pani
es (I
CEA)
and
the
Insu
ranc
e Co
mpe
nsat
ion
Cons
ortiu
m
THE SPANISH INSURANCE MARKET IN 2020
151

Tabl
e A.
20.
Aver
age
freq
uenc
ies
and
cost
s by
gua
rant
ee in
Aut
omob
ile in
sura
nce,
201
0–20
20
(freq
uenc
y, %
; ave
rage
cost
, eur
os)
2010
2011
2012
2013
2014
2015
Freq
uenc
yAv
erag
e co
stFr
eque
ncy
Aver
age
cost
Freq
uenc
yAv
erag
e co
stFr
eque
ncy
Aver
age
cost
Freq
uenc
yAv
erag
e co
stFr
eque
ncy
Aver
age
co
st
Third
-par
ty li
abili
ty10
.0%
1,77
39.
3%1,
853
9.3%
1,76
18.
5%1,
888
8.5%
1,84
18.
5%1,
816
Bodi
ly in
jury
2.1%
4,97
82.
0%5,
050
2.0%
4,93
92.
0%4,
928
2.0%
4,75
12.
0%4,
569
Mat
eria
l8.
5%82
88.
1%86
47.
6%86
87.
2%88
77.
2%87
57.
3%87
3
Dam
age
to o
wn
vehi
cle
43.7
%74
147
.4%
704
44.2
%71
339
.6%
731
36.1
%73
334
.3%
718
Brok
en w
inds
hiel
d8.
4%28
27.
2%29
26.
7%28
66.
7%29
06.
4%28
96.
4%28
8
Thef
t1.
5%96
61.
4%96
11.
3%91
91.
2%89
61.
0%88
20.
9%90
9
Lega
l def
ense
2.1%
282
1.9%
302
1.8%
286
1.8%
310
1.8%
302
1.8%
290
Occu
pant
s0.
4%97
20.
4%93
00.
3%1,
259
0.3%
1,25
20.
2%1,
251
0.2%
1,22
7
Fire
0.1%
3,21
10.
1%3,
243
0.1%
3,07
50.
1%2,
854
0.1%
2,78
20.
1%2,
847
Driv
er's
lice
nse
susp
ende
d0.
0%1,
930
0.0%
1,57
70.
0%1,
627
0.0%
1,31
40.
0%1,
211
0.0%
1,10
8
Sour
ce: I
CEA.
Aut
omob
ile in
sura
nce.
Sta
tistic
s as
of D
ecem
ber.
THE SPANISH INSURANCE MARKET IN 2020
152

Tabl
e A.
20.
Aver
age
freq
uenc
ies
and
cost
s by
gua
rant
ee in
Aut
omob
ile in
sura
nce,
201
0–20
20 (c
ontin
ued)
(fr
eque
ncy,
%; a
vera
ge co
st, e
uros
)
2016
2017
2018
2019
2020
Freq
uenc
yAv
erag
e
cost
Freq
uenc
yAv
erag
e
cost
Freq
uenc
yAv
erag
e
cost
Freq
uenc
yAv
erag
e
cost
Freq
uenc
yAv
erag
e
cost
Third
-par
ty li
abili
ty8.
6%1,
871
8.6%
1,82
08.
4%1,
766
8.2%
1,74
46.
1%1,
783
Bodi
ly in
jury
2.0%
4,97
01.
9%4,
856
1.8%
4,65
21.
8%4,
542
1.2%
4,88
0
Mat
eria
l7.
4%87
27.
4%87
97.
2%89
07.
1%89
25.
2%91
1
Dam
age
to o
wn
vehi
cle
31.5
%71
330
.4%
734
29.3
%77
627
.7%
787
21.0
%81
0
Brok
en w
inds
hiel
d6.
4%29
06.
4%29
16.
7%30
46.
2%31
05.
3%32
7
Thef
t0.
8%91
60.
8%96
80.
7%97
10.
6%92
90.
5%87
2
Lega
l def
ense
1.7%
279
1.7%
278
1.6%
271
1.5%
304
1.2%
280
Occu
pant
s0.
2%1,
265
0.3%
1,24
90.
3%94
10.
3%99
90.
2%1,
067
Fire
0.1%
2,97
70.
1%3,
023
0.1%
3,07
70.
1%3,
132
0.1%
3,16
7
Driv
er's
lice
nse
susp
ende
d0.
0%94
00.
0%80
50.
0%69
40.
0%80
20.
0%85
2
Sour
ce: I
CEA.
Aut
omob
ile in
sura
nce.
Sta
tistic
s as
of D
ecem
ber.
THE SPANISH INSURANCE MARKET IN 2020
153
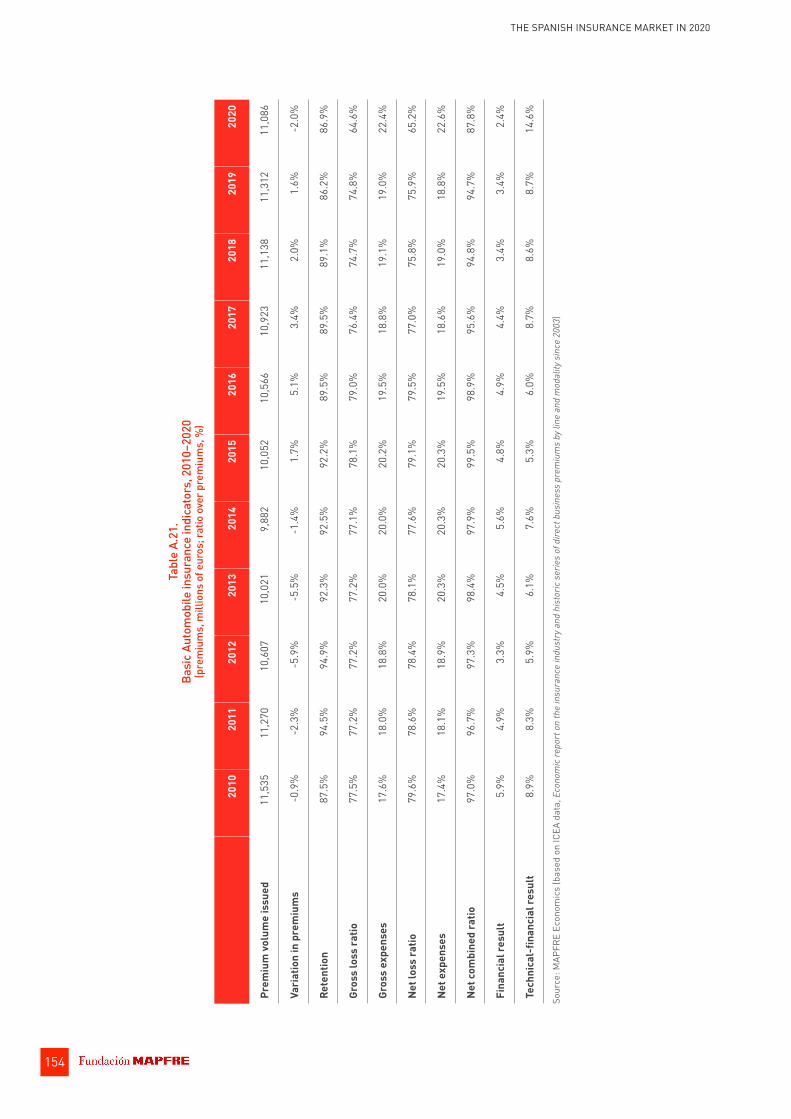
Tabl
e A.
21.
Basi
c Au
tom
obile
insu
ranc
e in
dica
tors
, 201
0–20
20
(pre
miu
ms,
mill
ions
of e
uros
; rat
io o
ver p
rem
ium
s, %
)
2010
2011
2012
2013
2014
2015
2016
2017
2018
2019
2020
Prem
ium
vol
ume
issu
ed11
,535
11,2
7010
,607
10,0
219,
882
10,0
5210
,566
10,9
2311
,138
11,3
1211
,086
Vari
atio
n in
pre
miu
ms
-0.9
%-2
.3%
-5.9
%-5
.5%
-1.4
%1.
7%5.
1%3.
4%2.
0%1.
6%-2
.0%
Rete
ntio
n87
.5%
94.5
%94
.9%
92.3
%92
.5%
92.2
%89
.5%
89.5
%89
.1%
86.2
%86
.9%
Gros
s lo
ss ra
tio77
.5%
77.2
%77
.2%
77.2
%77
.1%
78.1
%79
.0%
76.4
%74
.7%
74.8
%64
.6%
Gros
s ex
pens
es17
.6%
18.0
%18
.8%
20.0
%20
.0%
20.2
%19
.5%
18.8
%19
.1%
19.0
%22
.4%
Net l
oss
ratio
79.6
%78
.6%
78.4
%78
.1%
77.6
%79
.1%
79.5
%77
.0%
75.8
%75
.9%
65.2
%
Net e
xpen
ses
17.4
%18
.1%
18.9
%20
.3%
20.3
%20
.3%
19.5
%18
.6%
19.0
%18
.8%
22.6
%
Net c
ombi
ned
ratio
97.0
%96
.7%
97.3
%98
.4%
97.9
%99
.5%
98.9
%95
.6%
94.8
%94
.7%
87.8
%
Fina
ncia
l res
ult
5.9%
4.9%
3.3%
4.5%
5.6%
4.8%
4.9%
4.4%
3.4%
3.4%
2.4%
Tech
nica
l-fin
anci
al re
sult
8.9%
8.3%
5.9%
6.1%
7.6%
5.3%
6.0%
8.7%
8.6%
8.7%
14.6
%
Sour
ce: M
APFR
E Ec
onom
ics
(bas
ed o
n IC
EA d
ata,
Eco
nom
ic re
port
on
the
insu
ranc
e in
dust
ry a
nd h
isto
ric s
erie
s of
dire
ct b
usin
ess
prem
ium
s by
line
and
mod
ality
sin
ce 2
003)
THE SPANISH INSURANCE MARKET IN 2020
154
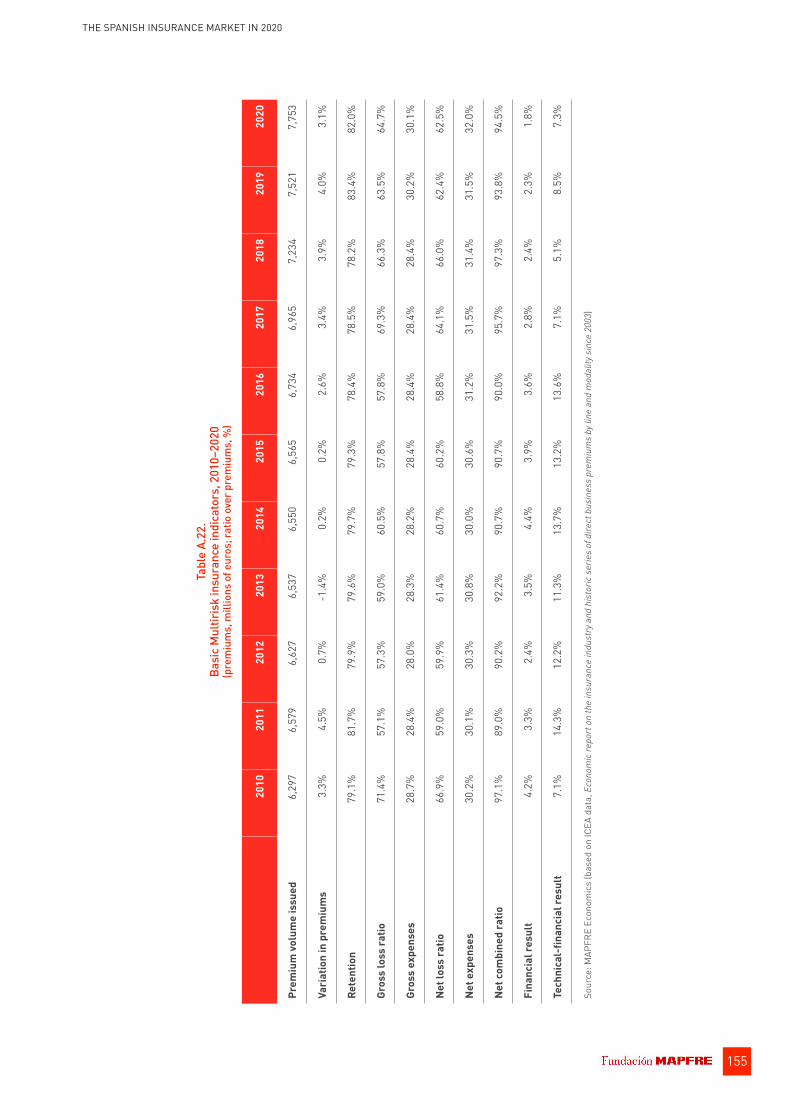
Tabl
e A.
22.
Basi
c M
ultir
isk
insu
ranc
e in
dica
tors
, 201
0–20
20
(pre
miu
ms,
mill
ions
of e
uros
; rat
io o
ver p
rem
ium
s, %
)
2010
2011
2012
2013
2014
2015
2016
2017
2018
2019
2020
Prem
ium
vol
ume
issu
ed6,
297
6,57
96,
627
6,53
76,
550
6,56
56,
734
6,96
57,
234
7,52
17,
753
Vari
atio
n in
pre
miu
ms
3.3%
4.5%
0.7%
-1.4
%0.
2%0.
2%2.
6%3.
4%3.
9%4.
0%3.
1%
Rete
ntio
n79
.1%
81.7
%79
.9%
79.6
%79
.7%
79.3
%78
.4%
78.5
%78
.2%
83.4
%82
.0%
Gros
s lo
ss ra
tio71
.4%
57.1
%57
.3%
59.0
%60
.5%
57.8
%57
.8%
69.3
%66
.3%
63.5
%64
.7%
Gros
s ex
pens
es28
.7%
28.4
%28
.0%
28.3
%28
.2%
28.4
%28
.4%
28.4
%28
.4%
30.2
%30
.1%
Net l
oss
ratio
66.9
%59
.0%
59.9
%61
.4%
60.7
%60
.2%
58.8
%64
.1%
66.0
%62
.4%
62.5
%
Net e
xpen
ses
30.2
%30
.1%
30.3
%30
.8%
30.0
%30
.6%
31.2
%31
.5%
31.4
%31
.5%
32.0
%
Net c
ombi
ned
ratio
97.1
%89
.0%
90.2
%92
.2%
90.7
%90
.7%
90.0
%95
.7%
97.3
%93
.8%
94.5
%
Fina
ncia
l res
ult
4.2%
3.3%
2.4%
3.5%
4.4%
3.9%
3.6%
2.8%
2.4%
2.3%
1.8%
Tech
nica
l-fin
anci
al re
sult
7.1%
14.3
%12
.2%
11.3
%13
.7%
13.2
%13
.6%
7.1%
5.1%
8.5%
7.3%
Sour
ce: M
APFR
E Ec
onom
ics
(bas
ed o
n IC
EA d
ata,
Eco
nom
ic re
port
on
the
insu
ranc
e in
dust
ry a
nd h
isto
ric s
erie
s of
dire
ct b
usin
ess
prem
ium
s by
line
and
mod
ality
sin
ce 2
003)
THE SPANISH INSURANCE MARKET IN 2020
155

Tabl
e A.
23.
Basi
c Ho
meo
wne
rs M
ultir
isk
insu
ranc
e in
dica
tors
, 201
0–20
20
(pre
miu
ms,
mill
ions
of e
uros
; rat
io o
ver p
rem
ium
s, %
)
2010
2011
2012
2013
2014
2015
2016
2017
2018
2019
2020
Prem
ium
vol
ume
issu
ed3,
505
3,65
63,
764
3,77
93,
837
3,91
64,
059
4,19
64,
348
4,52
94,
653
Vari
atio
n in
pre
miu
ms
5.1%
4.3%
3.0%
0.4%
1.5%
2.1%
3.6%
3.4%
3.6%
4.2%
2.7%
Rete
ntio
n88
.8%
91.5
%91
.6%
90.4
%89
.9%
90.2
%90
.0%
90.3
%90
.1%
90.0
%90
.2%
Gros
s lo
ss ra
tio65
.1%
56.8
%57
.8%
59.1
%58
.6%
58.2
%56
.7%
61.2
%64
.1%
62.0
%63
.4%
Gros
s ex
pens
es32
.2%
31.9
%31
.7%
32.0
%31
.2%
31.5
%31
.4%
31.5
%31
.4%
32.0
%31
.7%
Net l
oss
ratio
66.5
%57
.9%
58.9
%60
.1%
59.4
%59
.1%
57.5
%61
.8%
64.6
%61
.8%
61.9
%
Net e
xpen
ses
32.3
%32
.0%
31.6
%32
.1%
30.7
%31
.8%
31.8
%31
.6%
31.4
%32
.4%
32.2
%
Net c
ombi
ned
ratio
98.8
%89
.9%
90.5
%92
.2%
90.1
%90
.9%
89.3
%93
.4%
96.1
%94
.2%
94.0
%
Fina
ncia
l res
ult
3.1%
2.7%
2.1%
3.0%
3.3%
2.8%
2.7%
2.7%
1.8%
1.9%
1.3%
Tech
nica
l-fin
anci
al re
sult
4.4%
12.8
%11
.6%
10.8
%13
.1%
11.9
%13
.4%
9.3%
5.7%
7.7%
7.3%
Sour
ce: M
APFR
E Ec
onom
ics
(bas
ed o
n IC
EA d
ata,
Eco
nom
ic re
port
on
the
insu
ranc
e in
dust
ry a
nd h
isto
ric s
erie
s of
dire
ct b
usin
ess
prem
ium
s by
line
and
mod
ality
sin
ce 2
003)
THE SPANISH INSURANCE MARKET IN 2020
156

Tabl
e A.
24.
Basi
c In
dust
rial M
ultir
isk
insu
ranc
e in
dica
tors
, 201
0–20
20
(pre
miu
ms,
mill
ions
of e
uros
; rat
io o
ver p
rem
ium
s, %
)
2010
2011
2012
2013
2014
2015
2016
2017
2018
2019
2020
Prem
ium
vol
ume
issu
ed1,
328
1,42
11,
344
1,26
51,
220
1,17
61,
170
1,23
41,
316
1,38
51,
463
Vari
atio
n in
pre
miu
ms
0.5%
7.0%
-5.4
%-5
.9%
-3.6
%-3
.6%
-0.5
%5.
5%6.
7%5.
3%5.
6%
Rete
ntio
n56
.0%
56.0
%50
.4%
50.8
%52
.2%
50.6
%47
.9%
48.5
%47
.3%
60.9
%53
.0%
Gros
s lo
ss ra
tio94
.4%
57.5
%59
.2%
62.5
%68
.8%
59.1
%63
.7%
94.3
%76
.0%
73.2
%74
.6%
Gros
s ex
pens
es21
.6%
21.0
%19
.7%
19.8
%20
.5%
20.4
%20
.5%
20.2
%20
.9%
24.0
%23
.9%
Net l
oss
ratio
71.6
%64
.0%
71.0
%74
.8%
70.9
%69
.1%
69.7
%78
.7%
78.2
%68
.2%
72.4
%
Net e
xpen
ses
26.9
%26
.0%
27.9
%28
.6%
28.5
%27
.5%
30.4
%31
.2%
32.3
%28
.2%
30.8
%
Net c
ombi
ned
ratio
98.5
%90
.1%
98.9
%10
3.4%
99.4
%96
.6%
100.
1%10
9.9%
110.
6%96
.4%
103.
2%
Fina
ncia
l res
ult
7.2%
5.3%
3.4%
4.8%
9.0%
7.9%
7.1%
1.6%
4.5%
3.8%
3.2%
Tech
nica
l-fin
anci
al re
sult
8.7%
15.2
%4.
5%1.
4%9.
6%11
.3%
7.0%
-8.4
%-6
.1%
7.4%
-0.1
%
Sour
ce: M
APFR
E Ec
onom
ics
(bas
ed o
n IC
EA d
ata,
Eco
nom
ic re
port
on
the
insu
ranc
e in
dust
ry a
nd h
isto
ric s
erie
s of
dire
ct b
usin
ess
prem
ium
s by
line
and
mod
ality
sin
ce 2
003)
THE SPANISH INSURANCE MARKET IN 2020
157

Tabl
e A.
25.
Basi
c Co
mm
erci
al M
ultir
isk
insu
ranc
e in
dica
tors
, 201
0–20
20
(pre
miu
ms,
mill
ions
of e
uros
; rat
io o
ver p
rem
ium
s, %
)
2010
2011
2012
2013
2014
2015
2016
2017
2018
2019
2020
Prem
ium
vol
ume
issu
ed65
064
962
559
659
456
557
558
559
560
260
4
Vari
atio
n in
pre
miu
ms
-0.7
%-0
.2%
-3.6
%-4
.6%
-0.3
%-4
.9%
1.7%
1.8%
1.8%
1.1%
0.3%
Rete
ntio
n81
.2%
84.6
%86
.1%
85.5
%84
.2%
84.5
%83
.9%
84.1
%83
.4%
81.6
%83
.3%
Gros
s lo
ss ra
tio62
.2%
57.0
%53
.6%
53.7
%56
.4%
55.8
%53
.4%
60.5
%55
.3%
56.5
%53
.5%
Gros
s ex
pens
es29
.7%
29.3
%30
.1%
30.1
%30
.7%
30.5
%31
.2%
32.7
%31
.7%
31.9
%33
.4%
Net l
oss
ratio
64.0
%58
.4%
54.7
%54
.3%
58.1
%57
.5%
55.0
%62
.6%
56.1
%58
.6%
53.2
%
Net e
xpen
ses
29.5
%28
.9%
29.7
%29
.9%
30.2
%30
.1%
31.0
%33
.0%
32.0
%32
.3%
34.4
%
Net c
ombi
ned
ratio
93.5
%87
.3%
84.4
%84
.2%
88.4
%87
.7%
86.0
%95
.6%
88.1
%91
.0%
87.5
%
Fina
ncia
l res
ult
4.8%
3.8%
2.6%
3.8%
4.2%
4.0%
3.5%
3.6%
2.5%
2.6%
2.6%
Tech
nica
l-fin
anci
al re
sult
11.4
%16
.4%
18.2
%19
.7%
15.8
%16
.3%
17.5
%8.
0%14
.4%
11.6
%15
.0%
Sour
ce: M
APFR
E Ec
onom
ics
(bas
ed o
n IC
EA d
ata,
Eco
nom
ic re
port
on
the
insu
ranc
e in
dust
ry a
nd h
isto
ric s
erie
s of
dire
ct b
usin
ess
prem
ium
s by
line
and
mod
ality
sin
ce 2
003)
THE SPANISH INSURANCE MARKET IN 2020
158

Tabl
e A.
26.
Basi
c Co
ndom
iniu
m M
ultir
isk
insu
ranc
e in
dica
tors
, 201
0–20
20
(pre
miu
ms,
mill
ions
of e
uros
; rat
io o
ver p
rem
ium
s, %
)
2010
2011
2012
2013
2014
2015
2016
2017
2018
2019
2020
Prem
ium
vol
ume
issu
ed75
579
481
582
382
783
685
387
289
892
695
3
Vari
atio
n in
pre
miu
ms
5.8%
5.2%
2.6%
1.1%
0.4%
1.1%
2.0%
2.3%
3.0%
3.1%
2.8%
Rete
ntio
n80
.5%
86.8
%86
.7%
86.4
%85
.8%
86.1
%85
.3%
86.1
%87
.0%
86.2
%86
.0%
Gros
s lo
ss ra
tio62
.1%
53.8
%51
.2%
54.5
%54
.3%
53.9
%53
.4%
58.5
%63
.3%
61.7
%63
.9%
Gros
s ex
pens
es27
.8%
27.6
%28
.0%
28.2
%28
.1%
28.8
%29
.2%
29.7
%29
.0%
29.4
%29
.8%
Net l
oss
ratio
65.1
%54
.9%
52.5
%55
.2%
55.2
%55
.1%
54.5
%59
.1%
64.7
%61
.8%
62.6
%
Net e
xpen
ses
26.4
%27
.6%
28.2
%28
.0%
28.0
%28
.7%
29.5
%30
.5%
29.4
%29
.9%
30.9
%
Net c
ombi
ned
ratio
91.4
%82
.5%
80.7
%83
.3%
83.2
%83
.7%
83.9
%89
.5%
94.1
%91
.8%
93.5
%
Fina
ncia
l res
ult
4.4%
3.4%
2.7%
3.8%
4.1%
4.0%
3.9%
4.2%
3.1%
2.8%
2.4%
Tech
nica
l-fin
anci
al re
sult
13.0
%21
.0%
22.0
%20
.5%
20.9
%20
.2%
20.0
%14
.7%
9.0%
11.0
%8.
9%
Sour
ce: M
APFR
E Ec
onom
ics
(bas
ed o
n IC
EA d
ata,
Eco
nom
ic re
port
on
the
insu
ranc
e in
dust
ry a
nd h
isto
ric s
erie
s of
dire
ct b
usin
ess
prem
ium
s by
line
and
mod
ality
sin
ce 2
003)
THE SPANISH INSURANCE MARKET IN 2020
159
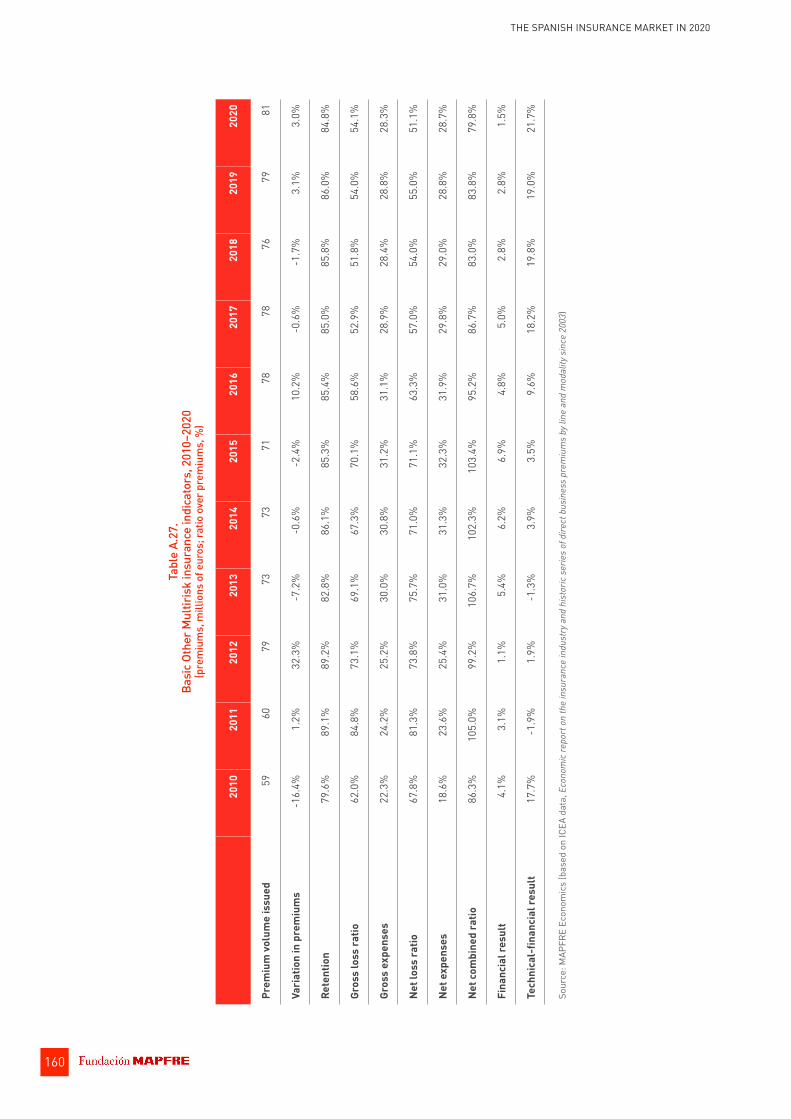
Tabl
e A.
27.
Basi
c Ot
her M
ultir
isk
insu
ranc
e in
dica
tors
, 201
0–20
20
(pre
miu
ms,
mill
ions
of e
uros
; rat
io o
ver p
rem
ium
s, %
)
2010
2011
2012
2013
2014
2015
2016
2017
2018
2019
2020
Prem
ium
vol
ume
issu
ed59
6079
7373
7178
7876
7981
Vari
atio
n in
pre
miu
ms
-16.
4%1.
2%32
.3%
-7.2
%-0
.6%
-2.4
%10
.2%
-0.6
%-1
.7%
3.1%
3.0%
Rete
ntio
n79
.6%
89.1
%89
.2%
82.8
%86
.1%
85.3
%85
.4%
85.0
%85
.8%
86.0
%84
.8%
Gros
s lo
ss ra
tio62
.0%
84.8
%73
.1%
69.1
%67
.3%
70.1
%58
.6%
52.9
%51
.8%
54.0
%54
.1%
Gros
s ex
pens
es22
.3%
24.2
%25
.2%
30.0
%30
.8%
31.2
%31
.1%
28.9
%28
.4%
28.8
%28
.3%
Net l
oss
ratio
67.8
%81
.3%
73.8
%75
.7%
71.0
%71
.1%
63.3
%57
.0%
54.0
%55
.0%
51.1
%
Net e
xpen
ses
18.6
%23
.6%
25.4
%31
.0%
31.3
%32
.3%
31.9
%29
.8%
29.0
%28
.8%
28.7
%
Net c
ombi
ned
ratio
86.3
%10
5.0%
99.2
%10
6.7%
102.
3%10
3.4%
95.2
%86
.7%
83.0
%83
.8%
79.8
%
Fina
ncia
l res
ult
4.1%
3.1%
1.1%
5.4%
6.2%
6.9%
4.8%
5.0%
2.8%
2.8%
1.5%
Tech
nica
l-fin
anci
al re
sult
17.7
%-1
.9%
1.9%
-1.3
%3.
9%3.
5%9.
6%18
.2%
19.8
%19
.0%
21.7
%
Sour
ce: M
APFR
E Ec
onom
ics
(bas
ed o
n IC
EA d
ata,
Eco
nom
ic re
port
on
the
insu
ranc
e in
dust
ry a
nd h
isto
ric s
erie
s of
dire
ct b
usin
ess
prem
ium
s by
line
and
mod
ality
sin
ce 2
003)
THE SPANISH INSURANCE MARKET IN 2020
160

Tabl
e A.
28.
Basi
c He
alth
insu
ranc
e in
dica
tors
, 201
0–20
20
(pre
miu
ms,
mill
ions
of e
uros
; rat
io o
ver p
rem
ium
s, %
)
2010
2011
2012
2013
2014
2015
2016
2017
2018
2019
2020
Prem
ium
vol
ume
issu
ed6,
396
6,59
76,
786
6,93
77,
181
7,36
17,
736
8,06
98,
516
8,93
59,
388
Vari
atio
n in
pre
miu
ms
4.0%
3.1%
2.9%
2.2%
3.5%
2.5%
5.1%
4.3%
5.5%
4.9%
5.1%
Rete
ntio
n98
.1%
97.8
%97
.7%
97.6
%97
.5%
97.4
%97
.4%
97.4
%97
.4%
97.4
%97
.4%
Gros
s lo
ss ra
tio84
.5%
82.8
%82
.7%
83.1
%82
.2%
80.9
%80
.6%
79.9
%79
.0%
79.4
%75
.8%
Gros
s ex
pens
es10
.4%
11.5
%11
.4%
11.7
%11
.8%
12.2
%12
.4%
12.2
%12
.3%
12.8
%13
.2%
Net l
oss
ratio
85.7
%83
.9%
83.8
%84
.5%
83.6
%82
.2%
81.8
%81
.2%
80.3
%80
.6%
77.0
%
Net e
xpen
ses
10.4
%11
.5%
11.4
%11
.7%
11.9
%12
.2%
12.4
%12
.2%
12.3
%12
.8%
13.2
%
Net c
ombi
ned
ratio
96.1
%95
.4%
95.2
%96
.2%
95.5
%94
.4%
94.2
%93
.4%
92.6
%93
.4%
90.2
%
Fina
ncia
l res
ult
1.1%
1.1%
0.8%
1.1%
1.0%
0.7%
0.7%
0.6%
0.3%
0.6%
0.6%
Tech
nica
l-fin
anci
al re
sult
5.0%
5.6%
5.5%
4.9%
5.6%
6.3%
6.5%
7.3%
7.7%
7.3%
10.4
%
Sour
ce: M
APFR
E Ec
onom
ics
(bas
ed o
n IC
EA d
ata,
Eco
nom
ic re
port
on
the
insu
ranc
e in
dust
ry a
nd h
isto
ric s
erie
s of
dire
ct b
usin
ess
prem
ium
s by
line
and
mod
ality
sin
ce 2
003)
THE SPANISH INSURANCE MARKET IN 2020
161

Tabl
e A.
29.
Basi
c Th
ird-P
arty
Lia
bilit
y ins
uran
ce in
dica
tors
, 201
0–20
20
(pre
miu
ms,
mill
ions
of e
uros
; rat
io o
ver p
rem
ium
s, %
)
2010
2011
2012
2013
2014
2015
2016
2017
2018
2019
2020
Prem
ium
vol
ume
issu
ed1,
624
1,53
11,
448
1,35
21,
342
1,36
01,
385
1,50
81,
532
1,59
81,
639
Vari
atio
n in
pre
miu
ms
-5.1
%-5
.7%
-5.4
%-6
.6%
-0.8
%1.
3%1.
9%8.
9%1.
6%4.
3%2.
6%
Rete
ntio
n73
.5%
73.9
%72
.5%
71.8
%72
.1%
72.2
%69
.9%
69.5
%70
.3%
71.4
%70
.5%
Gros
s lo
ss ra
tio42
.8%
55.1
%39
.8%
52.1
%50
.9%
62.1
%67
.7%
69.3
%55
.1%
62.4
%62
.4%
Gros
s ex
pens
es22
.9%
22.6
%24
.6%
25.0
%25
.5%
25.6
%26
.5%
27.2
%28
.2%
28.9
%28
.1%
Net l
oss
ratio
43.2
%51
.4%
38.2
%51
.7%
50.6
%59
.5%
59.6
%73
.9%
54.5
%60
.2%
61.1
%
Net e
xpen
ses
23.7
%23
.4%
26.0
%26
.5%
27.2
%26
.8%
28.0
%29
.4%
32.1
%32
.2%
31.3
%
Net c
ombi
ned
ratio
66.9
%74
.8%
64.3
%78
.2%
77.8
%86
.3%
87.6
%10
3.4%
86.7
%92
.4%
92.4
%
Fina
ncia
l res
ult
12.9
%12
.5%
7.1%
12.4
%15
.2%
14.0
%13
.5%
12.7
%10
.6%
10.2
%6.
0%
Tech
nica
l-fin
anci
al re
sult
46.0
%37
.7%
42.8
%34
.2%
37.4
%27
.7%
25.9
%9.
3%24
.0%
17.8
%13
.6%
Sour
ce: M
APFR
E Ec
onom
ics
(bas
ed o
n IC
EA d
ata,
Eco
nom
ic re
port
on
the
insu
ranc
e in
dust
ry a
nd h
isto
ric s
erie
s of
dire
ct b
usin
ess
prem
ium
s by
line
and
mod
ality
sin
ce 2
003)
THE SPANISH INSURANCE MARKET IN 2020
162

Tabl
e A.
30.
Basi
c Hu
ll Tr
ansp
ort i
nsur
ance
indi
cato
rs, 2
010–
2020
(p
rem
ium
s, m
illio
ns o
f eur
os; r
atio
ove
r pre
miu
ms,
%)
2010
2011
2012
2013
2014
2015
2016
2017
2018
2019
2020
Prem
ium
vol
ume
issu
ed28
927
625
624
022
322
520
722
921
624
326
6
Vari
atio
n in
pre
miu
ms
-14.
0%-4
.6%
-7.2
%-6
.3%
-7.2
%0.
8%-8
.0%
10.7
%-5
.7%
12.6
%9.
6%
Rete
ntio
n44
.0%
49.4
%54
.8%
53.4
%55
.1%
55.8
%53
.6%
52.2
%49
.4%
46.4
%37
.7%
Gros
s lo
ss ra
tio59
.4%
50.9
%73
.1%
55.6
%79
.5%
77.9
%66
.2%
68.5
%94
.9%
87.1
%59
.2%
Gros
s ex
pens
es15
.9%
17.4
%19
.3%
19.5
%19
.9%
20.7
%18
.9%
18.4
%18
.6%
16.5
%17
.6%
Net l
oss
ratio
74.1
%68
.2%
74.3
%67
.6%
90.8
%90
.3%
75.6
%76
.1%
82.8
%84
.7%
80.3
%
Net e
xpen
ses
24.7
%25
.6%
25.6
%27
.2%
26.3
%26
.5%
23.8
%24
.9%
27.0
%22
.6%
25.1
%
Net c
ombi
ned
ratio
98.9
%93
.8%
99.9
%94
.8%
117.
0%11
6.7%
99.4
%10
1.1%
109.
8%10
7.4%
105.
4%
Fina
ncia
l res
ult
7.5%
5.4%
3.9%
4.1%
14.9
%13
.9%
11.6
%-3
.2%
6.5%
4.8%
2.4%
Tech
nica
l-fin
anci
al re
sult
8.6%
11.6
%4.
0%9.
2%-2
.1%
-2.8
%12
.3%
-4.3
%-3
.3%
-2.6
%-3
.0%
Sour
ce: M
APFR
E Ec
onom
ics
(bas
ed o
n IC
EA d
ata,
Eco
nom
ic re
port
on
the
insu
ranc
e in
dust
ry a
nd h
isto
ric s
erie
s of
dire
ct b
usin
ess
prem
ium
s by
line
and
mod
ality
sin
ce 2
003)
THE SPANISH INSURANCE MARKET IN 2020
163

Tabl
e A.
31.
Basi
c M
erch
andi
se T
rans
port
insu
ranc
e in
dica
tors
, 201
0–20
20
(pre
miu
ms,
mill
ions
of e
uros
; rat
io o
ver p
rem
ium
s, %
)
2010
2011
2012
2013
2014
2015
2016
2017
2018
2019
2020
Prem
ium
vol
ume
issu
ed20
921
120
419
819
420
520
723
024
425
525
7
Vari
atio
n in
pre
miu
ms
-5.7
%0.
7%-3
.0%
-2.8
%-2
.2%
5.4%
1.2%
11.2
%6.
0%4.
5%0.
7%
Rete
ntio
n69
.6%
69.1
%65
.4%
63.7
%66
.4%
65.7
%65
.0%
62.0
%63
.2%
69.0
%66
.8%
Gros
s lo
ss ra
tio36
.2%
54.5
%50
.8%
62.0
%65
.3%
71.0
%75
.4%
58.8
%76
.1%
61.3
%48
.8%
Gros
s ex
pens
es25
.1%
25.1
%25
.2%
25.4
%26
.4%
28.1
%28
.7%
27.4
%26
.1%
28.0
%26
.4%
Net l
oss
ratio
49.2
%61
.8%
59.1
%70
.4%
71.8
%78
.4%
72.6
%61
.4%
70.4
%64
.1%
50.0
%
Net e
xpen
ses
28.7
%29
.1%
30.2
%31
.1%
32.0
%33
.3%
34.4
%33
.7%
32.1
%30
.0%
28.1
%
Net c
ombi
ned
ratio
77.9
%90
.9%
89.3
%10
1.5%
103.
8%11
1.7%
107.
0%95
.2%
102.
6%94
.1%
78.1
%
Fina
ncia
l res
ult
5.7%
5.4%
2.7%
4.9%
6.5%
6.3%
5.7%
4.1%
3.6%
3.8%
2.5%
Tech
nica
l-fin
anci
al re
sult
27.8
%14
.5%
13.4
%3.
4%2.
8%-5
.4%
-1.4
%8.
9%1.
1%9.
6%24
.4%
Sour
ce: M
APFR
E Ec
onom
ics
(bas
ed o
n IC
EA d
ata,
Eco
nom
ic re
port
on
the
insu
ranc
e in
dust
ry a
nd h
isto
ric s
erie
s of
dire
ct b
usin
ess
prem
ium
s by
line
and
mod
ality
sin
ce 2
003)
THE SPANISH INSURANCE MARKET IN 2020
164

Tabl
e A.
32.
Basi
c Bu
rial i
nsur
ance
indi
cato
rs, 2
010–
2020
(p
rem
ium
s, m
illio
ns o
f eur
os; r
atio
ove
r pre
miu
ms,
%)
2010
2011
2012
2013
2014
2015
2016
2017
2018
2019
2020
Prem
ium
vol
ume
issu
ed1,
703
1,76
11,
891
1,96
12,
087
2,15
02,
167
2,27
72,
367
2,45
92,
491
Vari
atio
n in
pre
miu
ms
1.8%
3.4%
7.3%
3.7%
6.5%
3.0%
0.8%
5.1%
4.0%
3.9%
1.3%
Rete
ntio
n99
.2%
100.
6%98
.9%
99.0
%98
.4%
98.5
%98
.6%
98.4
%98
.3%
98.5
%98
.3%
Gros
s lo
ss ra
tio52
.5%
51.3
%55
.2%
56.9
%60
.3%
65.2
%63
.7%
62.6
%64
.5%
64.8
%71
.0%
Gros
s ex
pens
es38
.1%
37.8
%37
.5%
36.4
%34
.8%
32.9
%33
.1%
33.0
%33
.0%
32.8
%32
.2%
Net l
oss
ratio
52.8
%50
.7%
55.4
%57
.2%
60.9
%65
.9%
64.3
%63
.1%
65.3
%65
.5%
72.0
%
Net e
xpen
ses
38.1
%37
.2%
37.5
%36
.4%
34.7
%32
.7%
33.0
%32
.9%
32.9
%32
.8%
32.2
%
Net c
ombi
ned
ratio
90.9
%87
.9%
93.0
%93
.5%
95.5
%98
.6%
97.3
%96
.1%
98.2
%98
.4%
104.
2%
Fina
ncia
l res
ult
5.6%
5.7%
6.8%
6.2%
6.5%
7.4%
5.8%
5.8%
5.7%
6.3%
4.8%
Tech
nica
l-fin
anci
al re
sult
14.6
%17
.8%
13.8
%12
.7%
11.0
%8.
8%8.
5%9.
8%7.
5%7.
9%0.
6%
Sour
ce: M
APFR
E Ec
onom
ics
(bas
ed o
n IC
EA d
ata,
Eco
nom
ic re
port
on
the
insu
ranc
e in
dust
ry a
nd h
isto
ric s
erie
s of
dire
ct b
usin
ess
prem
ium
s by
line
and
mod
ality
sin
ce 2
003)
THE SPANISH INSURANCE MARKET IN 2020
165

Tabl
e A.
33.
Basi
c Cr
edit
insu
ranc
e in
dica
tors
, 201
0–20
20
(pre
miu
ms,
mill
ions
of e
uros
; rat
io o
ver p
rem
ium
s, %
)
2010
2011
2012
2013
2014
2015
2016
2017
2018
2019
2020
Prem
ium
vol
ume
issu
ed71
969
567
764
663
160
959
357
058
460
760
2
Vari
atio
n in
pre
miu
ms
-10.
0%-3
.3%
-2.5
%-4
.7%
-2.4
%-3
.4%
-2.6
%-3
.8%
2.5%
3.8%
-0.8
%
Rete
ntio
n54
.3%
54.6
%53
.2%
46.3
%44
.4%
42.1
%34
.4%
34.4
%36
.2%
37.5
%32
.5%
Gros
s lo
ss ra
tio50
.9%
78.2
%81
.4%
70.4
%39
.6%
69.2
%45
.0%
48.0
%49
.6%
52.2
%61
.8%
Gros
s ex
pens
es19
.4%
20.4
%20
.9%
21.9
%24
.1%
24.7
%31
.3%
30.4
%29
.7%
32.8
%30
.5%
Net l
oss
ratio
56.6
%84
.1%
87.8
%68
.7%
42.2
%48
.5%
47.3
%53
.1%
57.3
%46
.6%
66.3
%
Net e
xpen
ses
17.5
%15
.0%
19.2
%22
.1%
19.2
%8.
4%17
.2%
16.5
%9.
4%11
.0%
12.3
%
Net c
ombi
ned
ratio
74.1
%99
.0%
107.
0%90
.9%
61.4
%56
.9%
64.6
%69
.6%
66.7
%57
.7%
78.6
%
Fina
ncia
l res
ult
4.8%
6.2%
5.8%
6.0%
4.5%
4.0%
2.6%
2.6%
3.3%
2.8%
1.4%
Tech
nica
l-fin
anci
al re
sult
30.7
%7.
1%-1
.2%
15.1
%43
.1%
47.1
%38
.0%
33.0
%36
.6%
45.1
%22
.8%
Sour
ce: M
APFR
E Ec
onom
ics
(bas
ed o
n IC
EA d
ata,
Eco
nom
ic re
port
on
the
insu
ranc
e in
dust
ry a
nd h
isto
ric s
erie
s of
dire
ct b
usin
ess
prem
ium
s by
line
and
mod
ality
sin
ce 2
003)
THE SPANISH INSURANCE MARKET IN 2020
166

Tabl
e A.
34.
Basi
c Su
rety
insu
ranc
e in
dica
tors
, 201
0–20
20
(pre
miu
ms,
mill
ions
of e
uros
; rat
io o
ver p
rem
ium
s, %
)
2010
2011
2012
2013
2014
2015
2016
2017
2018
2019
2020
Prem
ium
vol
ume
issu
ed84
7865
6361
8662
6384
122
136
Vari
atio
n in
pre
miu
ms
3.8%
-7.3
%-1
6.2%
-4.1
%-2
.8%
40.6
%-2
7.4%
1.6%
33.2
%45
.6%
11.0
%
Rete
ntio
n44
.4%
40.1
%47
.1%
44.5
%48
.7%
46.4
%35
.1%
36.4
%34
.8%
31.8
%32
.9%
Gros
s lo
ss ra
tio12
4.0%
98.7
%28
4.4%
535.
5%15
9.8%
158.
2%22
.9%
30.4
%15
.7%
39.7
%26
.0%
Gros
s ex
pens
es24
.1%
24.2
%24
.7%
28.3
%27
.8%
33.9
%32
.4%
27.4
%33
.6%
36.0
%31
.6%
Net l
oss
ratio
65.0
%82
.7%
201.
4%23
3.4%
72.1
%64
.0%
33.1
%38
.4%
31.9
%48
.2%
37.3
%
Net e
xpen
ses
23.7
%22
.0%
14.0
%34
.4%
37.9
%41
.7%
25.0
%13
.2%
24.9
%29
.0%
-1.3
%
Net c
ombi
ned
ratio
88.7
%10
4.7%
215.
4%26
7.8%
110.
0%10
5.7%
58.2
%51
.5%
56.8
%77
.3%
36.0
%
Fina
ncia
l res
ult
5.1%
8.2%
9.8%
3.1%
5.0%
3.3%
4.1%
5.8%
6.2%
4.6%
1.8%
Tech
nica
l-fin
anci
al re
sult
16.4
%3.
5%-1
05.7
%-1
64.7
%-5
.1%
-2.3
%45
.9%
54.3
%49
.4%
27.3
%65
.7%
Sour
ce: M
APFR
E Ec
onom
ics
(bas
ed o
n IC
EA d
ata,
Eco
nom
ic re
port
on
the
insu
ranc
e in
dust
ry a
nd h
isto
ric s
erie
s of
dire
ct b
usin
ess
prem
ium
s by
line
and
mod
ality
sin
ce 2
003)
THE SPANISH INSURANCE MARKET IN 2020
167

Tabl
e A.
35.
Basi
c Pe
rson
al A
ccid
ent i
nsur
ance
indi
cato
rs, 2
010–
2020
(p
rem
ium
s, m
illio
ns o
f eur
os; r
atio
ove
r pre
miu
ms,
%)
2010
2011
2012
2013
2014
2015
2016
2017
2018
2019
2020
Prem
ium
vol
ume
issu
ed92
289
785
388
088
692
698
41,
114
1,15
21,
152
1,12
3
Vari
atio
n in
pre
miu
ms
-2.5
%-2
.6%
-5.0
%3.
2%0.
6%4.
6%6.
2%13
.3%
3.4%
0.0%
-2.5
%
Rete
ntio
n89
.5%
89.5
%89
.7%
90.1
%89
.0%
89.0
%87
.9%
87.4
%87
.6%
86.5
%86
.8%
Gros
s lo
ss ra
tio36
.1%
39.0
%34
.2%
41.6
%40
.9%
41.3
%37
.2%
38.3
%38
.7%
39.0
%32
.9%
Gros
s ex
pens
es33
.5%
35.4
%36
.3%
34.9
%36
.7%
37.6
%37
.1%
36.9
%36
.1%
36.4
%34
.7%
Net l
oss
ratio
37.4
%40
.5%
35.3
%40
.8%
41.8
%40
.5%
37.2
%36
.9%
38.5
%39
.5%
32.0
%
Net e
xpen
ses
34.4
%36
.2%
36.9
%35
.2%
37.2
%37
.6%
37.4
%37
.4%
36.4
%37
.0%
35.6
%
Net c
ombi
ned
ratio
71.8
%76
.7%
72.2
%76
.0%
79.0
%78
.1%
74.6
%74
.3%
74.9
%76
.5%
67.6
%
Fina
ncia
l res
ult
5.3%
4.3%
3.8%
11.3
%18
.7%
15.0
%15
.4%
17.0
%19
.4%
19.5
%28
.0%
Tech
nica
l-fin
anci
al re
sult
33.4
%27
.6%
31.6
%35
.3%
39.7
%36
.9%
40.8
%42
.7%
44.5
%42
.9%
60.4
%
Sour
ce: M
APFR
E Ec
onom
ics
(bas
ed o
n IC
EA d
ata,
Eco
nom
ic re
port
on
the
insu
ranc
e in
dust
ry a
nd h
isto
ric s
erie
s of
dire
ct b
usin
ess
prem
ium
s by
line
and
mod
ality
sin
ce 2
003)
THE SPANISH INSURANCE MARKET IN 2020
168

Tabl
e A.
36.
Tren
ds in
pen
etra
tion
in th
e Sp
anis
h in
sura
nce
indu
stry
, 201
0–20
20
(pre
miu
ms/
GDP,
%)
Year
Tota
l mar
ket
Life
insu
ranc
eNo
n-Li
fe in
sura
nce
Tota
l Life
in
sura
nce
Life
Pro
tect
ion
Life
Sav
ings
Tota
l Non
-Life
in
sura
nce
Auto
mob
iles
Mul
tiris
kHe
alth
Othe
r lin
es
2010
5.42
%2.
46%
0.35
%2.
11%
2.97
%1.
08%
0.59
%0.
60%
0.71
%
2011
5.70
%2.
71%
0.34
%2.
37%
2.98
%1.
06%
0.62
%0.
62%
0.68
%
2012
5.57
%2.
55%
0.34
%2.
21%
3.02
%1.
03%
0.64
%0.
66%
0.69
%
2013
5.48
%2.
50%
0.33
%2.
17%
2.98
%0.
98%
0.64
%0.
68%
0.68
%
2014
5.38
%2.
41%
0.34
%2.
07%
2.97
%0.
96%
0.63
%0.
70%
0.68
%
2015
5.28
%2.
37%
0.35
%2.
02%
2.90
%0.
93%
0.61
%0.
68%
0.68
%
2016
5.73
%2.
80%
0.38
%2.
42%
2.94
%0.
95%
0.60
%0.
69%
0.69
%
2017
5.46
%2.
53%
0.36
%2.
17%
2.93
%0.
94%
0.60
%0.
69%
0.69
%
2018
5.35
%2.
41%
0.39
%2.
02%
2.94
%0.
92%
0.60
%0.
71%
0.71
%
2019
5.16
%2.
21%
0.39
%1.
82%
2.94
%0.
91%
0.60
%0.
72%
0.71
%
2020
5.26
%1.
95%
0.43
%1.
52%
3.31
%0.
99%
0.69
%0.
84%
0.79
%
Sour
ce: M
APFR
E Ec
onom
ics
(bas
ed o
n IC
EA a
nd In
tern
atio
nal M
onet
ary
Fund
[IM
F] d
ata)
THE SPANISH INSURANCE MARKET IN 2020
169

Tabl
e A.
37.
Tren
ds in
den
sity
and
dep
th in
the
Span
ish
insu
ranc
e in
dust
ry, 2
010–
2020
(p
rem
ium
s pe
r cap
ita, e
uros
; dire
ct L
ife in
sura
nce
prem
ium
s/to
tal d
irect
pre
miu
ms,
%)
Year
Dens
ity (p
rem
ium
s pe
r cap
ita)
Dept
h (d
irect
Life
in
sura
nce
prem
ium
s/to
tal
dire
ct p
rem
ium
s)To
tal m
arke
t de
nsity
Life
insu
ranc
eNo
n-Li
fe in
sura
nce
Tota
l Life
in
sura
nce
Life
Pr
otec
tion
Life
Sav
ings
Tota
l Non
-Life
in
sura
nce
Auto
mob
iles
Mul
tiris
kHe
alth
Othe
r lin
es
2010
1,23
3.0
558.
980
.147
8.9
674.
124
4.4
133.
413
5.5
160.
745
.3%
2011
1,28
1.9
610.
876
.453
4.5
671.
123
8.4
139.
213
9.6
153.
947
.7%
2012
1,21
7.6
557.
874
.548
3.3
659.
822
5.1
140.
614
4.0
150.
145
.8%
2013
1,19
5.1
545.
471
.647
3.8
649.
721
4.3
139.
814
8.3
147.
345
.6%
2014
1,19
0.1
532.
874
.545
8.3
657.
321
2.0
140.
515
4.0
150.
844
.8%
2015
1,22
1.4
549.
181
.146
8.1
672.
221
5.9
141.
015
8.1
157.
245
.0%
2016
1,37
0.6
668.
690
.357
8.3
702.
022
6.9
144.
616
6.1
164.
448
.8%
2017
1,35
7.7
629.
490
.053
9.4
728.
323
3.8
149.
117
2.7
172.
746
.4%
2018
1,37
0.0
616.
610
0.4
516.
275
3.4
236.
815
3.8
181.
118
1.6
45.0
%
2019
1,35
2.5
580.
010
2.5
477.
577
2.4
238.
415
8.5
188.
318
7.2
42.9
%
2020
1,24
3.8
461.
210
2.4
358.
878
2.6
234.
216
3.8
198.
318
6.4
37.1
%
Sour
ce: M
APFR
E Ec
onom
ics
(bas
ed o
n IC
EA a
nd IN
E da
ta)
THE SPANISH INSURANCE MARKET IN 2020
170
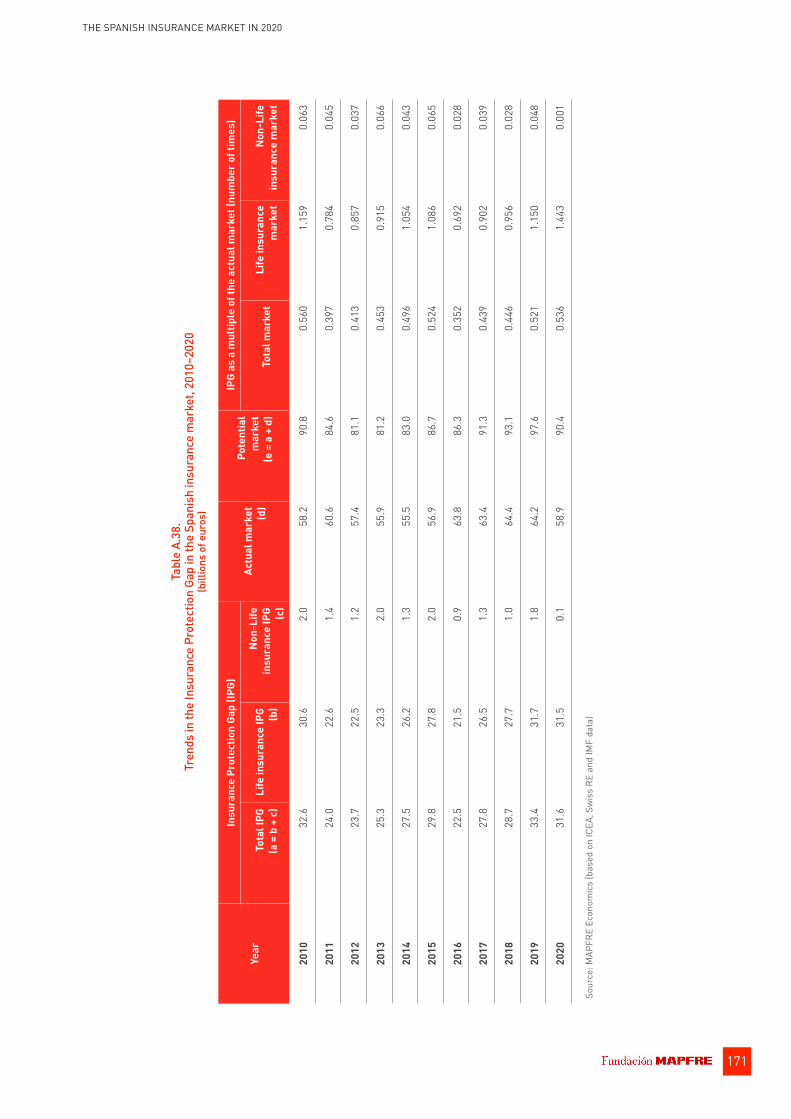
Tabl
e A.
38.
Tren
ds in
the
Insu
ranc
e Pr
otec
tion
Gap
in th
e Sp
anis
h in
sura
nce
mar
ket,
2010
–202
0 (b
illio
ns o
f eur
os)
Year
Insu
ranc
e Pr
otec
tion
Gap
(IPG)
Actu
al m
arke
t (d
)
Pote
ntia
l m
arke
t (e
= a
+ d
)
IPG
as a
mul
tiple
of t
he a
ctua
l mar
ket (
num
ber o
f tim
es)
Tota
l IPG
(a
= b
+ c)
Life
insu
ranc
e IP
G (b)
Non-
Life
in
sura
nce
IPG
(c
)To
tal m
arke
tLi
fe in
sura
nce
mar
ket
Non-
Life
in
sura
nce
mar
ket
2010
32.6
30.6
2.0
58.2
90.8
0.56
01.
159
0.06
3
2011
24.0
22.6
1.4
60.6
84.6
0.39
70.
784
0.04
5
2012
23.7
22.5
1.2
57.4
81.1
0.41
30.
857
0.03
7
2013
25.3
23.3
2.0
55.9
81.2
0.45
30.
915
0.06
6
2014
27.5
26.2
1.3
55.5
83.0
0.49
61.
054
0.04
3
2015
29.8
27.8
2.0
56.9
86.7
0.52
41.
086
0.06
5
2016
22.5
21.5
0.9
63.8
86.3
0.35
20.
692
0.02
8
2017
27.8
26.5
1.3
63.4
91.3
0.43
90.
902
0.03
9
2018
28.7
27.7
1.0
64.4
93.1
0.44
60.
956
0.02
8
2019
33.4
31.7
1.8
64.2
97.6
0.52
11.
150
0.04
8
2020
31.6
31.5
0.1
58.9
90.4
0.53
61.
443
0.00
1
Sour
ce: M
APFR
E Ec
onom
ics
(bas
ed o
n IC
EA, S
wis
s RE
and
IMF
data
)
THE SPANISH INSURANCE MARKET IN 2020
171


Other MAPFRE Economics reports
MAPFRE Economics (2021), 2020 Ranking of the largest European insurance groups, Madrid, Fundación MAPFRE.
MAPFRE Economics (2021), 2020 Ranking of insurance groups in Latin America, Madrid, Fundación MAPFRE.
MAPFRE Economics (2021), 2021 Economic and industry outlook: second quarter perspectives, Madrid, Fundación MAPFRE.
MAPFRE Economics (2021), Pension systems from a global perspective, Madrid, Fundación MAPFRE.
MAPFRE Economics (2021), Insurance industry investment, Madrid, Fundación MAPFRE.
MAPFRE Economics (2021), 2021 Economic and industry outlook, Madrid, Fundación MAPFRE.
MAPFRE Economics (2020), The Latin American insurance market in 2019, Madrid, Fundación MAPFRE.
MAPFRE Economics (2020), The Spanish insurance market in 2019, Madrid, Fundación MAPFRE.
MAPFRE Economics (2020), Elements for the development of Life insurance, Madrid, Fundación MAPFRE.
MAPFRE Economics (2020), Financial inclusion in insurance, Madrid, MAPFRE Economics.
MAPFRE Economics (2019), Population aging, Madrid, Fundación MAPFRE.
MAPFRE Economics (2018), Health systems: a global analysis, Madrid, Fundación MAPFRE.
MAPFRE Economics (2018), Insurance solvency regulation systems, Madrid, Fundación MAPFRE.
MAPFRE Economics (2017), Pension systems, Madrid, Fundación MAPFRE.
MAPFRE Economics (2017), Elements for insurance expansion in Latin America, Madrid, Fundación MAPFRE.


NOTICE
This document has been prepared by MAPFRE Economics for information purposes only. It does not reflect the views or opinions of MAPFRE or Fundación MAPFRE. The document presents and compiles data, views and estimates relative to the time at which it was prepared. These were prepared directly by MAPFRE Economics or otherwise obtained from or prepared using sources considered reliable, but which have not been independently verified by MAPFRE Economics. Therefore, MAPFRE and Fundación MAPFRE specifically refuse all liability with respect to its precision, integrity or correctness.
The estimates contained in this document have been prepared on the basis of widely accepted methodologies and should be treated as forecasts or projections only, given that the results obtained from positive or negative historical data cannot be considered as a guarantee of future performance. Equally, this document and its contents are also subject to changes that will depend on variables such as the economic outlook or market performance. MAPFRE and Fundación MAPFRE therefore refuse all liability with respect to how up to date or relevant these contents may be.
This document and its contents do not constitute any form of offer, invitation or solicitation to purchase, participate or divest in financial assets or instruments. This document and its contents cannot form part of any contract, commitment or decision. With regard to the investment in financial assets connected with the economic variables analyzed in this document, readers of this study must be aware that under no circumstances should they base their investment decisions on the information given in this document. People or companies offering investment products to potential investors are legally bound to provide the necessary information by which to make a suitable investment decision. For all of the foregoing, MAPFRE and Fundación MAPFRE specifically refuse all liability for any direct or indirect loss or damage that may ensue from the use of this document or its contents for these purposes.
The contents of this document are protected by intellectual property laws. The information contained in this study may be reproduced in part, provided the source is cited.

www.fundacionmapfre.org Paseo de Recoletos, 23
28004 Madrid, Spain


www.fundacionmapfre.org Paseo de Recoletos, 23
28004 Madrid, Spain