Embed Size (px)
Citation preview

THE SPECIAL RESEARCH BULLETIN
ON EXTERNAL DEMAND
RESEARCH AND FINANCIAL STABILITy DEPARTMENT
BANk OF BOTSwANA
SEPTEMBER 2021
Volume 34 No. 1

RESEARCH AND FINANCIAL STABILITy DEPARTMENT
BANk OF BOTSwANA
THE SPECIAL RESEARCH BULLETIN
ON EXTERNAL DEMAND
Volume 34 No. 1
SEPTEMBER 2021

The Research Bulletin, September 2021, Volume 34, No 1
Published by
The Research and Financial Stability Department, Bank of Botswana
P/Bag 154, Gaborone, Botswana.
ISSN 1027–5932
This publication is also available at the Bank of Botswana
website: www.bankofbotswana.bw
Copyright © Individual contributors, 2021
Typeset and designed by
Impression House
Tel: +267 3922984, e-mail: [email protected]
www.impressionhouse.com
Printed and bound by
Impression House

Botswana at the above address. A list of the Bank’s other publications, and their prices, are given below.
Bank of Botswana Publications
SADC Rest of Domestic Members the World
1. Research Bulletin (per copy) P11.00 US$10.00 US$15.002. Annual Report (per copy) P22.00 US$15.00 US$20.003. Botswana Financial Statistics Free US$30.00 US$50.00 (annual: 12 issues)4. Aspects of the Botswana Economy: P82.50 US$29.00 US$42.00 Selected Papers
Bank of New York, New York (SWIFT code: IRVTUS3N) Account Number: 8900331348 ABA Number: 021000018 Account Name: Bank of Botswana
Please always indicate the purpose of payment for easy reference. All customers are urged to use the Bank’s website www.bankofbotswana.bw from which most of the publications listed above can be downloaded free of charge.
TheComments: Bank would welcome any comments/suggestions on papers published on the bulletin. Such communication should be addressed to:
The Director Research and Financial Stability Department Bank of Botswana Private Bag 154 Gaborone
The purpose of the Research Bulletin is to provide a forum where research relevant to the Botswana economy can be disseminated. Although produced by the Bank of Botswana, the Bank claims no copyright on the content of the papers. If the material is used elsewhere, an appropriate acknowledgement is expected.
Or, e-mail to: [email protected]
Additional copies of the Research Bulletin are available from the Librarian of the Bank of
Please note that all unitalised prices cover surface mail postage and are inclusive of VAT. Otherprices include airmail postage and are free of VAT. Cheques, drafts, etc., should be drawn in favour of Bank of Botswana and forwarded to the Librarian, Bank of Botswana, Private Bag 154,Gaborone, Botswana.


Contents
Preface 1
An Assessment of External Sector Developments in Botswana and Policy 3ImplicationsBaby Mogapi and Karabo Badirwang
Assessing Foreign Exchange Reserves Adequacy: The Case of Botswana 15Thato Mokoti and Geoffrey Shima Ncube
Assessing the Pula Exchange Rate Alignment 25 Esther M. Mpete
Capital/Financial Flows, Exchange Rate and Monetary Policy in Botswana 41Gaone A. Motsumi, Shima K. Sefakonyana and Tendani Phumusa


1
Preface
It is generally agreed that performance of the external sector is integral to growth prospects for Botswana. This
is given the external market potential that can surmount the constraints of the domestic market. In general,
the current and short- to medium term metrics on population, income levels, business and industrial activity
for Botswana suggest that the domestic market is insufficient to engender local produce at sufficient levels to
achieve annual gross domestic product (GDP) growth rates that would statistically result in high-income status
as espoused in the nation’s Vision 2036; nor would there be a commensurate improvement in productivity in
the absence of the imperative to compete in the external market and for the domestic industry to be integral to
global production and service value chains.
Against this background, the evident decline in the relative share of the external sector in Botswana’s production
does not augur well for the country’s growth prospects. Among others, this is evident from the declining share
of exports in GDP, persistent current account (balance of payments) deficits and related trend decrease in the
foreign exchange reserves. The impact on broader output potential is also noticeable in the transition to lower
rates of economic growth in the last decade or two. There continues to be evaluation of factors that account
for this inauspicious trend. However, in general, the convergence of diagnosis, both internal and external,
is that there is persistent weak traction of structural reforms and transformation initiatives that have so
far been undertaken; while at the same time, macroeconomic policies, frameworks and related institutional
arrangements are deemed strong and appropriate.
Economic policy makers and analysts generally agree that, among the macroeconomic policies, the exchange
rate policy or framework is proximate to external sector performance; hence continuous monitoring of relativity
of exchange rate variables across countries to measure trade competitiveness and influence on output. Most
common is the use of trade weighted real exchange rates to assess, for any country, over- or under-valuation of
the exchange rate. In this regard, while neutrality is desirable, over-valuation is eschewed because it undermines
trade competitiveness of domestic producers. On the other hand, (deliberate) maintenance of an undervalued
currency is viewed in bad light by trading partners because it reduces their bilateral competitiveness.
At the same time, the bilateral and trade-weighted exchange rate outcomes are in the context of a variety of
exchange rate regimes/frameworks, ranging from fixed to floating, with several intermediate arrangements.
For floating exchange rates, the main influences on trend and changes is the relative values of trade, the
interest rate relativities (covered interest parity) and financial flows. Occasionally, specific events (economic,
political, social or environmental) and market sentiment can also move exchange rates; in this case, most
often large magnitude of short-term volatility. For fixed exchange rates and related intermediate arrangements,
adjustments are done in accordance with a specified framework aligned to policy objectives and/or to respond
to adverse developments, with a view to returning to desired macroeconomic policy objectives.
For example, in Botswana and abstracting from nuanced complications, up to May 2005, the exchange rate
could be adjusted to either moderate imported inflation (revalued) towards desired inflation or to improve
external competitiveness of the domestic industry (devalued). From May 2005, with the adoption of the
crawling peg arrangement, the overriding focus became maintenance of a stable trade-weighted real effective
exchange rate, with the objective of safeguarding external competitiveness of the domestic industry in external
markets and against imports coming into the domestic market.
In discussing exchange rates, it is of critical importance to note that the exchange rate is essentially a price
outcome deriving from fundamentals that influence, in successive order, output, trade and returns on capital
relativities across countries; and also, financial/capital flows as influenced by monetary policy or interest rate
relativities. It is possible that for a fixed or managed exchanged regime, discretionary adjustments can, in the
short term, result in price competitiveness of the domestic industry and reverse a statistical overvaluation.
However, often the competitiveness benefits are short-lived and dissipate quickly in the absence of traction of
accompanying structural and policy reforms and improvements in productivity; in several instances continuous
loss of welfare.

2
Bank of Botswana
It is also recognised that maintenance of a fixed exchanged regime, including the crawling peg arrangement
as pertains in Botswana is conditional upon maintenance of sufficient foreign exchange reserves to guarantee
availability of foreign exchange as demanded by the market (and for government procurement) at the fixed rate.
Hence, the imperative to maintain robust external sector performance enabling earning of the foreign exchange
needed to maintain the desired exchange rate. In a floating exchange rate environment, the exchange rate will
change alongside external sector performance; thus depreciate as the foreign exchange demand exceeds the
supply or appreciate with sustained balance of payments surpluses (lower demand relative to foreign exchange
earnings).
The papers in this edition of the Research Bulletin, therefore, make an assessment of external sector
performance for Botswana including evaluation of alignment of the exchange rate and foreign exchange
reserves policies and trends, over time, with the developmental needs of the country and, therefore, prospects
for change of direction to remain congruent with the national development aspirations, recently as indicated
in the Economic Recovery and Transformation Plan (July 2020) and Reset Agenda (May 2021). They contribute
to the body of information and knowledge needed by researchers, policy analysts and practitioners as they,
in their respective roles contribute ideas and implementation frameworks for traction of the much-needed
economic transformation and policy reforms. As usual the learning points and information value is in the
literature reviews, application of methodologies and analytical techniques, research results and findings, as
well as suggestions for policy direction.
As published in this Research Bulletin, the papers are the independent work of the authors and as such, any
recommendations in the respective papers do not reflect the policy position of the Bank of Botswana.
I commend my colleagues; authors and reviewers for this contribution to research.
Kealeboga S Masalila
Deputy Governor

3
An Assessment of External Sector Developments in Botswana and Policy Implications
Baby Mogapi and Karabo Badirwang1
ABSTRACT
This paper examines the performance of the external sector in Botswana over the period 2005 to 2020. It analyses trends in key external sector variables, such as current account, financial account, public external debt, and their resultant impact on the overall balance of payments (BoP) and official foreign exchange reserves. Botswana has, over the years, maintained macroeconomic stability, reflected by a combination of low and stable inflation and a sound financial system. Macroeconomic and financial policies provided a conducive environment for robust economic growth, contributing to favourable BoP outcomes, and maintenance of low and sustainable public debt. However, following the 2008/09 global financial crisis and the subsequent global economic recession, annual economic growth has decelerated, notably the mining sector, which had, hitherto been the main economic driver. Similarly, the non-mining sector, though somewhat resilient, has also recorded low growth rates. The recent low growth rates also occur alongside a recurrence of BoP deficits, as the growth of exports relative to gross domestic product (GDP) have slowed, while imports increased at a faster rate. Overall, this suggests that the economy has not generated sufficient productive capacity and diversification of sources of export earnings; or enhance export competitiveness or, achieved import substitution. It is against this background that the paper analyses the performance of the external sector with a focus on the BoP components, being the current, capital and financial accounts, including the foreign exchange reserves and total public debt, including both domestic and external debt.
1 Senior Economist and Economist, Balance of Payments Section, Research and Financial Stability Department. The views expressed in this paper are those of the authors and do not necessarily reflect those of the Bank of Botswana.
1. INTRODUCTION
The external sector statistics capture a country’s
transactions with the rest of the world. This includes
transactions relating to imports and exports of goods
and services and other financial flows. The direction
and magnitude of international transactions of
a country is reflected in the current, capital and
financial accounts of the balance of payments (BoP).
Therefore, the overall BoP is the sum of balances of
these three accounts. A surplus overall BoP generally
increases a nation's net foreign assets, and vice
versa for a deficit. Botswana recorded favourable
overall BoP from 2005 to 2014, except post global
financial crisis during 2009 - 2010 and during
2012 - 2013, when imports of diamonds increased
significantly due to the relocation of De Beers’
diamond aggregation and sales functions from the
United Kingdom (UK) to Botswana (Table 1). The
favourable overall BoP between 2005 and 2014 were
driven by amongst others, faster annual growth in
exports (principally diamonds) compared to imports
and receipts from the Southern African Customs
Union (SACU). However, since 2015, the overall BoP
has recorded consecutive deficits from P4.1 billion in
2015 to P20.1 billion in 2020. It is worth noting that
trends in merchandise trade (of the current account)
are less a function of exchange rate developments
and more a reflection largely of the external diamond
market developments.
An Assessment of externAl sector Developments in BotswAnA AnD policy implicAtions

4
Bank of Botswana
TABLE 1: BALANCE OF PAyMENTS, 2005 - 2020 (P MILLION)
Current Account Balance Exports Imports SACU receipts
FinancialAccount Balance
Overall Balance
2005 7 994 22 708 13 726 3 873 774 7 0362006 11 317 26 386 15 271 5 109 1 030 10 2562007 11 776 31 695 21 229 7 861 951 10 6942008 1 006 32 757 35 331 7 714 -4 960 7 4522009 -6 835 23 866 33 243 5 826 -1 966 -5 7782010 -5 055 31 885 38 595 8 231 1 366 -6 4022011 - 902 43 897 49 305 7 736 104 1 0532012 -6 271 44 251 59 773 12 786 -1 085 -6 3052013 5 431 66 404 68 037 13 481 12 938 -2 0782014 15 379 76 261 69 795 14 973 10 108 6 2462015 3 051 63 525 70 640 16 108 12 723 -4 1482016 13 109 80 371 64 282 12 351 10 541 -3 2802017 9 593 61 708 53 296 16 336 12 940 -4 2782018 1 170 67 264 62 305 15 747 -3 098 -4 2042019 -12 599 56 388 68 029 14 064 4 690 -12 0222020 -18 251 48 242 71 406 15 600 7 803 -20 059
Source: Bank of Botswana
Botswana has, overall, sustained macroeconomic
stability characterised by, amongst others, low
and stable inflation and a sound financial system.
The macroeconomic stability was, among others,
manifested by maintenance of low and sustainable
public debt and, until recently, positive current
account balances. However, following the 2008/09
global financial crisis and the subsequent economic
recession, annual economic growth in Botswana
dropped considerably from an average of 7.1 percent
during 2005 - 2007 to an average of 6.4 percent
during 2010 - 2012. This was followed by an average
of 4.6 percent, and 3.9 percent during 2013 - 2015
and 2016 - 2018, respectively; annual GDP growth
dropped further to 3 percent in 2019 and contracted
by 7.9 percent in 2020.
In terms of performance of exports, minerals, despite
trend decline in growth and volatility, accounted for
an average of 90.8 percent of total exports in the past
10 years, with diamond exports constituting 92.8
percent of the mineral exports. This is indicative
of slow progress in the diversification of exports.
Revenue from mineral exports also accounted for
the largest proportion of total government revenue
averaging 31.6 percent from 2011 to 2020 which,
however, declined to 15.8 percent in 2020. The lower
mineral revenue receipts in 2020 was mainly due to
the global restrictions on the movement of people and
products that negatively affected regular diamond
sales, resulting in the cancellation of the third sight
by DeBeers and subsequent implementation of
flexible trading approaches, that included allowing
customers to defer their allocations to a later date,
thus shifting demand towards lower-valued goods.
These had resulted in a larger current account deficit
of P18.3 billion during 2020, from a deficit of P12.6
billion in 2019, which contributed to the worsening
of the overall BoP, from a deficit of P12 billion to
P20.1 billion in the same period. Going forward it is
anticipated that changing consumer preferences and
the advent of lab grown diamonds (LGD) will also
negatively affect rough diamond sales.
The deterioration in the BoP since 2015 and resultant
decrease in the foreign exchange reserves, coinciding
with the deceleration in overall output growth, points
to a need to reassess the sustainability of the country’s
growth model, hitherto premised on harnessing the
diamonds endowment to propel growth and increase
in living standards. Indeed, in the 2020 IMF Article
IV Mission Report for Botswana indicated the need
to relook at the growth model arguing for a deliberate
transition from a mining and government-led model
to a private sector and export-driven growth model.
This is in recognition of the significant decline in
mineral revenue as a percentage of GDP, compared
to marginal increases in other government revenue
streams, for example, Value Added Tax and customs
and excise. These observations are also supported
by the fact that, even though the country maintains,
amongst others, a good record of sound policy

5
making, strong institutions and relatively high,
middle income status per capita income, it has one
of the highest unemployment rates and income
inequality in the world. The country ranks amongst
the top 15 countries on unemployment rates and
top 10 with respect to income inequality (The Global
Economy, 2020). In addition, since the global
financial crisis, Botswana has registered BoP deficits,
as manifested by net withdrawal of the government
portion of the foreign exchange reserves to finance
the budget. This paper, therefore, examines trends
in the external position of the country with a focus
on BoP components, being the current, capital and
financial accounts, including the foreign exchange
reserves and total public debt.
The rest of the paper is structured as follows:
Sections 2 discusses the current account, followed
by an overview of the financial account in section 3.
Sections 4 and 5 discuss trends of foreign exchange
reserves and public debt, respectively, while Section
6 protion of De Beers’ diamond aggregation and
sales functions from the United Kingdom (UK) to
Botswana (Table concluding remarks.
2. THE CURRENT ACCOUNT
The current account is made up of four major
components: merchandise trade, services, income
and current transfers. Merchandise trade and
current transfers are the largest drivers of the
current account balance (CAB) in Botswana (Chart
1), with diamond trade being the main determinant
of the merchandise trade balance. The country is
an open economy with total trade estimated at 94.4
percent of GDP, with exports and imports of goods
and services each amounting to an average of 47.2
percent of GDP between 2005 and 2020. However,
trade remains heavily skewed with diamonds being
the dominant product and exports tilted towards
Europe, while the majority of imports, including
transit trade, are from South Africa. Between 2005
and 2012, an average of 69.7 percent of total exports
were destined to the UK, where De Beers’ diamond
aggregation and sales functions were based. This
compares to an average of 66 percent of exports to
Belgium, India, United Arab Emirates, South Africa
and Namibia between 2013 and 2020 after the
relocation of the De Beers diamond aggregation and
sales to Botswana was completed (see Appendix 1).
In comparison, imports from South Africa, including
capital and consumer goods, such as food and
fuel, on average, constituted 75.8 percent and 62.6
percent of total imports during the same periods.
Source: Bank of Botswana
Chart 1: Current aCCount Components (net BalanCe)
An Assessment of externAl sector Developments in BotswAnA AnD policy implicAtions
P M
illi
on

6
Bank of Botswana
The current account, on average, recorded a surplus of P1.9 billion over the period 2005 to 2020. It was, however, volatile, notably falling from a surplus of P11.8 billion in 2007 to deficits averaging P3.6 billion between 2008 and 2012 due the adverse and lasting impact of the 2008/09 global financial crisis. Thereafter, the current account surplus peaked at P15.4 billion in 2014 against the background of the relocation of the De Beers’ diamond aggregation and sales functions from the United Kingdom to Botswana. However, since 2016, the current account balance has been on a downward trajectory culminating in a deficit of P18.3 billion in 2020. The performance of the current account over the years, largely reflects the performance of the merchandise trade account, which is in turn influenced largely by diamond trade; therefore, lack of traction, with respect to diversification of exports and substitution of imports.
The merchandise account balance moved from a revised deficit of P11.6 billion in 2019 to a deficit of P23.2 billion in 2020, in the context of a 5 percent increase in imports and a 14.5 percent decrease in exports. The decrease in exports in 2020 was mostly due to a 16.7 percent decline in diamond sales abroad from P51 billion in 2019 to P42.5 billion (Table 2). The decline in diamond exports mainly stemmed from lower demand by rough diamonds importing countries, such as China, due to the uncertain economic environment caused by the COVID-19 pandemic during 2020. The global restrictions on the movement of people and products negatively affected the regular diamond sale cycles, resulting in cancellation of the third sight and the De Beers’ implementation of more flexible trading
TABLE 2: EXPORTS, 2019 – 2020 (P MILLION)
Percent Share
2019 2020 2019 2020Percentage
Change
Total Exports 56 388 48 242 -14.4
of which:
Diamonds 51 010 42 499 90.5 88.1 -16.7
Copper and Nickel 3 299 - 0.6 9 866.7
Meat and Meat Products 659 221 1.2 0.5 -66.5
Salt and Soda Ash 561 728 1.0 1.5 29.8
Gold 436 525 0.8 1.1 20.4
Textile 161 162 0.3 0.3 0.6
Vehicles and Transport Equipment 400 284 0.7 0.6 -29.0
Other Goods 3 157 3 524 5.6 7.3 11.6Source: Bank of Botswana
approaches which included, allowing customers to defer their allocations to a later date in the year, which shifted demand towards lower-value goods, resulting in lesser diamond receipts. Exports of other commodities also decreased, including meat and meat products (66.5 percent) and vehicles and transport equipment (29 percent). Copper and nickel on the other hand recorded a growth of over 100 percent, mainly comprising base metals extracted by Khoemacau Copper Mine in March 2020. Salt and Soda Ash and Gold registered growth rates of 29.8 percent and 20.4 percent, respectively.
In comparison, diamond imports, which accounted for 31.9 percent of total imports, increased from P20 billion in 2019 to P22.8 billion in 2020 (Table 3). The slight increase in diamond imports is associated with diamonds aggregation activities, including the importation and re-exportation of diamonds. Imports also increased with respect to, amongst others: fuel (9.1 percent), chemicals and rubber products (8.9 percent) and food, beverages and tobacco (5.4 percent), textiles and footwear (15.5 percent). Demand for metal and metal products, textile and footwear, machinery and electrical equipment imports however decreased by 15.6 percent, 8.3 percent, and 5.6 percent, respectively. Reduction in imports was mainly in commodities used in the construction projects2 that were delayed due to the COVID-19 containment measures, resulting in construction work stoppages during the national and Greater Gaborone area lockdowns. In addition, implementation of some public sector financed projects was deferred due to the diversion of funds for expenditure on health and other COVID-19 related activities.
2 These include major construction projects such as the Kazungula Bridge and Okavango Bridge in Mohembo village, the road upgrades in Gaborone and the construction of the Southern African Development Community (SADC) Standby Force Regional Logistics Depot in Rasesa village.

7
3 A resident is any person, regardless of their nationality, who has stayed in a country for more than one year.
4 Other financial flows include loans not classified under direct investment, currency and deposits, and trade credits.
5 The reporting is still based on Balance of Payments Manual 5, so a negative reflects either an increase in offshore investments or a decrease in liabilities for foreign investors, which could also reflect disinvestments. A positive sign is an indication of an increase in foreign investment or a decrease in offshore investment.
TABLE 3: IMPORTS, 2019 – 2020 (P MILLION)
Percent Share
2019 2020 2019 2020Percentage
Change
Total Imports 68 029 71 406 5.0
of which:
Diamonds 20 034 22 786 29.4 31.9 13.7
Fuel 8 864 9 669 13.0 13.5 9.1
Food, Beverages and Tobacco 9 003 9 493 13.2 13.3 5.4
Machinery and Electrical Equipment 8 775 8 281 12.9 11.6 -5.6
Chemicals and Rubber Products 6 344 6 906 9.3 9.7 8.9
Metals and Metal Products 3 550 2 998 5.2 4.2 -15.5
Textile and Footwear 1 629 1 493 2.4 2.1 -8.3
Vehicles and Transport Equipment 6 820 6 435 10.0 9.0 -5.6
Other Goods 3 011 3 345 4.4 4.7 11.1Source: Bank of Botswana
The services account, which comprise transportation, travel and other services is mainly influenced by tourist receipts in travel component. The balance of the travel account had been on an upward trajectory, except in 2020, where it declined from a surplus of P4.5 billion in 2019 to P1.4 billion in 2020. This resulted from the negative effects of the COVID-19 pandemic on the tourism industry, as evidenced by the large decline in tourist visits due to travel restrictions, which is estimated to have reduced by 38.9 percent from 1.8 million in 2019 to 1.1 million in 2020. Consequently, exports of travel decreased significantly from P7.6 billion to P2.4 billion in the same period. Imports of travel services also registered a decline of 67.7 percent from P3.1 billion to P1 billion, also attributable to COVID-19 related travel restrictions.
The income account is primarily driven by dividends and reinvested earnings paid to foreign investors, predominantly in the mining sector that pays significant investment income. These have been increasing since 2005 except for 2020, and estimated to have decreased by 60.2 percent, from P12.8 billion in 2019 to P5.1 billion in 2020, owing to the slowdown of economic activity, particularly mining, due to the effects of the pandemic. A larger proportion of this component in 2020 was dividends paid by Debswana to De Beers. Current transfers are dominated by SACU receipts, which have also boosted the current account over the years. The SACU receipts increased from P3.9 billion in 2005 to P15.6 billion in 2020.
3. FINANCIAL ACCOUNT The financial account measures assets held by residents3 outside the country and liabilities of non-residents held in the resident economy. The account
consists of foreign direct investment (FDI), portfolio investment, and other investment. FDI covers equity investments of at least 10 percent shareholding, related retained earnings and debt transactions between direct investors and their enterprises. The portfolio investment account records only tradable financial instruments such as equity and debt securities involving shareholding of less than 10 percent, while the other investment account reports all other financial flows4. A positive net balance (surplus) on the financial account5 means a country is a net lender to the rest of the world whereas a minus (deficit) reflects a net borrowing position to the rest of the world. For Botswana, the overall financial account is dominated by offshore portfolio investments by the domestic pension funds and external borrowing. The other investment account has also been an important driver of the financial account since 2014, following the relocation of the diamond aggregation activities to Botswana because De Beers started retaining significant proceeds from the diamond aggregation with the parent company in the UK.
For the period 2005 to 2020, the financial account recorded surpluses averaging P4.1 billion (Chart 2). However, significant surpluses were observed between 2013 and 2017, averaging P11.9 billion, mainly from portfolio and other investments, which averaged P7.4 billion and P6 billion, respectively. Foreign direct investmnet registered overall deficits for the period under review, averaging P1.8 billion. Flows of portfolio assets abroad have been increasing
An Assessment of externAl sector Developments in BotswAnA AnD policy implicAtions

8
Bank of Botswana
since 2005, attributable to, among others, increases in offshore investments by pension funds, mainly on equity rather than fixed income securities. Prior to the more recent surge, there was a reduction in the flows to acquire portfolio assets abroad in 2008 due to the negative impact of the global financial crisis on the performance of capital markets. Subsequently, portfolio investment outflows increased from P2.5 billion in 2009 and reached an average of P8.5 billion annually between 2013 and 2015. However, in 2018, there was a P6.8 billion reduction in total flows of offshore investments by pension funds from P52.2 billion to P45.4 billion. This decline was mainly due to the weak performance of offshore asset classes, including global emerging market equities and bonds. Other investment outflows increased in 2014, rising from P1.5 billion in 2013 to P10 billion. Subsequently, net outflows averaged P2.6 billion until 2020, dominated by deposits made by subsidiaries of international companies abroad.
The liability side of the financial account mostly comprise FDI and other investment components, while inward flows of portfolio investments are, in comparison minimal, because of the relatively small size of the capital markets with paucity of financial instruments. Overall, inward investments are relatively small relative to comparator countries and the desirable levels for the countries. This is attributed to the high cost of doing business and inadequate provision of basic infrastructure, including, among others, transport, electricity, telecommunication and internet connectivity, which hinders foreign participation in the domestic economy, including
Source: Bank of Botswana
CHART 2: FINANCIAL ACCOUNT COMPONENTS
capital markets (BoB Annual Report, 2016).
Foreign direct investment inflows in Botswana were largely stable during the period under review, averaging P2.2 billion annually, with the lowest level of P564 million recorded in 2013, due to loan repayments from subsidiaries in Botswana to parent companies abroad. The other investment inflows (other investment account) are dominated by government loan drawdowns (public external debt) and foreign investments in various sectors of the economy. Notably, there were large government drawdowns on loans amounting to P7.2 billion and P4.1 billion in 2009 and 2011, respectively, including tranches from the African Development Bank (AfDB), for loans extended to member countries that were affected by the financial crisis to finance their budget deficits (P6.7 billion and P3.7 billion in 2009 and 2011, respectively).
Chart 3 shows the stock levels of total financial flows into Botswana, which are mostly concentrated in the capital-intensive mining sector. Following the relocation of De Beers Global Sightholder Sales (DBGSS), the share of financial flows into the mining sector increased from 23 percent of total investment in Botswana in 2010 to 36 percent in 2015 and slightly reduced to 22 percent in 2019. The increase was mainly attributable to growth in equity and extension of loans by parent companies to their subsidiaries in the mining sector. Noticeable inflows are also observed in the financial services sector due to the presence of foreign ownership in commercial
P M
illi
on

9
banks and other financial enterprises. By region, Botswana received significant inflows from Europe, accounting for an average of 37 percent of total investment for the period 2005 to 2019. This was followed by Africa with 26 percent, out of which South Africa accounted for over 50 percent. Other African countries that make significant investments in the various sectors include Mauritius, Zimbabwe, Namibia, Kenya and Malawi, all investing mostly in the finance sector.
Source: Bank of Botswana
CHART 3: PROPORTIONS OF FINANCIAL LIABILITIES
4. FOREIgN EXCHANgE RESERvES
Accumulation of the foreign exchange reserves is important to smoothen temporary imbalances in the external sector. The reserves are mainly used to pay for imports of goods and services, provision of foreign exchange to commercial banks for their account and for customers, funding offshore investments by pension fund managers, as well as to meet other government financial obligations (for example, servicing of external debt, payment for external procurement and funding of foreign embassies). The IMF suggests, as a rule of thumb, that a country should hold reserves sufficient to cover 100 percent of short-term debt or the equivalent of a minimum of three months of imports of goods and services. Botswana has, however, over the years, accumulated official foreign reserves far in excess of this measure of reserves adequacy. For instance, Mokoti and Ncube (2020), indicate that “Botswana has accumulated far more foreign exchange reserves than what would be deemed insurance against a financial crisis, as they have averaged 66.4 percent of GDP annually between 1996 and 2018, therefore, exceeding the optimal level of 11.9 percent of GDP over the same period”.
Chart 4 shows the level of Botswana’s foreign exchange reserves from 2005 to 2020 and the corresponding months of import cover.
An Assessment of externAl sector Developments in BotswAnA AnD policy implicAtions

10
Bank of Botswana
Source: Bank of Botswana
CHART 4: LEvEL OF FOREIgN EXCHANgE RESERvES
During the period under review, the level of foreign
exchange reserves averaged P63.1 billion or 17.2
months of import cover of goods and services. From
2005 to 2008, foreign exchange reserves increased by
98.2 percent from P34.6 billion to P68.6 billion, as a
result of consecutive overall BoP surpluses recorded
during the period. However, measured in terms of
months of import cover, the reserves declined from
an equivalent of 23.5 to 21 months of import cover in
the same period, owing to the increase in the import
bill, from P17.6 billion to P39.2 billion in 2005 to
2008. The increase in the import bill was due to
higher prices of food and fuel, which prevailed for
much of 2008 (BoB Annual Report, 2008). Foreign
exchange reserves declined further in 2009 and
2010 mainly due to poor economic and financial
markets performance following the 2008/09 global
financial crisis and the resultant economic recession.
Subsequently, the foreign exchange reserves
generally increased from 2010, from P50.8 billion,
against the background of an improvement in global
economic activity to P84.9 billion in 2015, which was
equivalent to 17.7 months of import cover. However,
since then, the foreign exchange reserves have been
on a downward trajectory and amounted to P53.4
billion (or 10.1 months of import cover) at the end
of 2020.
5. PUBLIC DEBT6
Public debt comprises domestic and external liabilities
of the public sector, which includes: the central
government and its agencies, general government,
non-financial public sector, government-owned
financial corporations, as well as public bodies
outside the central government, including both
guaranteed and non-guaranteed borrowing by the
Government (AFRODAD, 2014). For Botswana this
will, in addition to central government, include
public guaranteed loans. Chart 5 shows the trend
in the level of public debt, also disaggregated into
external and domestic debt, each as a percentage
GDP, for the period 2004/05 to 2019/20.
Between 2005/06 and 2008/09, total public
debt as a percentage of GDP (debt-to-GDP ratio)
averaged 6.1 percent alongside current account
surpluses. However, the global financial crisis
and the resulting lower demand for diamond has
contributed to a decline in government mineral
revenues. The combination of sustained high level
of public spending and a drastic drop in diamond
revenues resulted in a sharp deterioration in current
account and fiscal deficits. The current account
balance recorded deficits from 2009 until 2012, and
along with anticipated a further decline in fiscal
buffers led Government obtaining a budget support
loan from the African Development Bank (AfDB).
Consequently, total debt-to-GDP ratio increased to
18.7 percent in 2009/10, due to the first drawdown
(of P6.7 billion out of an approved P10.4 billion) that
accounted for approximately 8.8 percent of GDP.
Additionally, Botswana received financing from the
Chinese Government, the International Bank for
Reconstruction and Development (IBRD) from 2009,
which increased total public debt to its peak of 26.4
percent in 2011. 6 Private sector was not incorporated due to unavailability of data.

11
Notwithstanding the increase in public debt,
Botswana has maintained low and sustainable public
debt during the period under review, averaging 16.5
percent during 2004/2005 to 2018/2020. Total
public debt has been below the maximum statutory
threshold of 40 percent of GDP, which comprises
20 percent ceilings for external and 20 percent for
domestic debt, including debt guarantees. Total
debt has also remained far below the set threshold
of 60 percent of GDP for SADC macroeconomic
convergence targets. However, given the adverse
impact of COVID-19 containment measures on
economic activity generally, and more specifically on
exports receipts, public debt is expected to increase
considerably to finance current account deficit,
which stood at P18.3 billion in 2020.
6. CONCLUSION
Botswana has, generally, recorded favourable overall
BoP from 2005 to 2014, except for the periods of
2009-10 and 2012-13, when rate of increase in
imports significantly outpaced/exceeded that of
exports, resulting in BoP deficits. The favourable
overall BoP between 2005 and 2014 was driven
by amongst others, growing exports earnings and
receipts from SACU. However, since 2015, the overall
BoP has recorded consecutive deficits ranging from
P4.1 billion to P20.1 billion in 2020, mainly due to
lack of traction in expanding the export base, that
is export diversification and competitiveness, as well
Source: Bank of Botswana
CHART 5: LEvEL OF PUBLIC DEBT AS A PERCENTAgE OF gDP
as achieving import substitution. Consequently,
foreign exchange reserves have been on a downward
trajectory in the latter part of the review period as
a result of drawdowns of the government portion of
the foreign exchange reserves, represented by the
Government Investment Account (GIA) to finance
budget deficits as well as stimulate the economy.
Furthermore, both the overall level of foreign exchange
reserves and balances in the GIA were particularly
negatively affected by the COVID-19 induced trade
shock and consequent economic contraction in
2020. The trend in the current account has been
observed to be dependent on diamond exports, which
is largely influenced by global demand and diamond
prices unrelated to exchange rate movements. Going
forward, however, current account position should
be made less dependent on the diamond market to
cushion the economy and preserve foreign exchange
reserves.
Although public debt rose significantly in the
recent past, especially following the 2008/09
global financial crisis, Botswana’s debt service
matrices and overall sovereign debt level have
been relatively prudently managed, remaining well
below the country’s statutory maximum threshold
of 40 percent of GDP, during and in between the
two major global recessions, 2008-09 and 2020.
Notwithstanding this performance, it is projected
that both domestic and external public debt, in
absolute terms, and as a percentage of GDP, will
increase to finance the budget deficits related to the
An Assessment of externAl sector Developments in BotswAnA AnD policy implicAtions

12
Bank of Botswana
COVID-19 expenditures. Hence, it is important that
external financing be in concessional terms to avoid
repayment difficulties.
In summary, the evident deterioration in key
macroeconomic and external sector indicators
suggest a need for reappraisal of the development/
growth model and related policy mix to build
resilience, for better absorption of risks of episodic
and high impact shocks, as well as promote the
country’s transition to a high-income, consistent
with the Vision 2036 aspirations. The suggestion
to relook at the country’s growth model was
amplified in the 2020 IMF Article IV Mission Report,
which strongly advocated for a transition from a
resource-intensive (diamond mining, in the main)
and government-led model to an innovative private
sector and export-driven approach. The advent
of COVID-19, including the adverse impact and
related identification of opportunities, reinforce the
imperative to refocus strategy in order to maintain
sustainability of the balance of payments and, in
general external sector performance. It is considered
that the recently unveiled economic recovery and
transformation plan, in the main, addresses the
necessary structural reforms, transformation
initiatives and support measures in this regard.
However, this is premised on achieving the right
levels of productivity and response to enable effective
and full implementation.
REFERENCES
AFRODAD. (2014). An Overview of Domestic Debt
in SADC: A Synthesis of Trends, Structure and
Develoment Impacts.
Bank of Botswana Annua Reports. Various Issues
Bank of Botswana. Botswana Financial Statistics.
Various Issues
Central Bank of Nigeria. (2015). External Sector
Development Report. Vol. 7 Issue 1.
https://www.cbn.gov.ng/out/2015
IMF.(2002).AssessingSustainability.https://
doi.org/https://www.imf.org/external/np/
rsus/2002/eng/052802.htm
IMF. (2009). Balance of Payments and International
Investment Positions. In The Economics of
Foreign Exchange and Global Finance (Sixth
Edit). IMF Multimedia Services Division. https://
doi.org/10.1007/978-3-642-00100-0_4
IMF. (2008). Exchange Rate and External Stability
Assessment in a Resource-Dependent Economy:
The Case of Botswana
Makoni, L.M. (2015). Foreign Direct Investmnet-The
Case of Botswana. Acta Universitatis Danubius.
Economica, Vol 11, No 4 (2015)
Mokoti, T. and Ncube,G S. (2020). Assessing
Foreign Exchange Reserves Adequacy: The Case
of Botswana (Work still in progress), Bank of
Botswana Research Bulletin
Motsumi, G., Sefakonyana, S., and Phumusa,
T.(2020) (Unpublished). Capital
Flows, Exchange Rate and Monitory Policy in
Botswana.
Ncube, S. G. (2013). Botswana's External Sector
Performance: 2007 to 2010, Bank of Botswana
Research Bulletin, Vol. 26 No. 1, 1-12
The Global Economy, Unemployment rate - Country
rankings. https://www.theglobaleconomy.com/
rankings/Unemployment_rate/
The Global Economy, Gini inequality index - Country
rankings, https://www.theglobaleconomy.com/
rankings/gini_inequality_index/
The Global Diamond Industry 2015 Growth
Perspectives Amid Short-Term Challenges.
https://www.awdc.be
UNCTAD. (2016). Trade Policy Framework: Botswana.
https://unctad.org/en/PublicationsLibrary/
ditctncd2016d1_en.pdf
UNCTAD. (2005). Determinants of Export
Performance. https://unctad.org/en/docs/
ditctab20051ch2_en.pdf

13
APPENDIX 1
Source: Bank of Botswana
CHART 1.1: PROPORTION OF EXPORT COMMODITIES IN TOTAL EXPORTS7
Source: Bank of Botswana
CHART 1.2: PROPORTION OF IMPORTS COMMODITIES IN TOTAL IMPORTS
7 Non diamond exports include copper, gold and salt & soda ash. Non-mineral exports include hides & skin, iron & steel products, machinery & electrical equipment, metal & metal products, plastics & plastic products, textiles, vehicles & transport equipment, and other goods as recorded by Statistics Botswana.
An Assessment of externAl sector Developments in BotswAnA AnD policy implicAtions

14
Bank of Botswana
Source: Bank of Botswana
Source: Bank of Botswana
CHART 1.3: BOTSwANA EXPORTS By DESTINATION
CHART 1.4: BOTSwANA IMPORTS By ORIgIN

15
Assessing Foreign Exchange Reserves Adequacy: The Case of Botswana
Thato Mokoti and Geoffrey Shima Ncube8
ABSTRACT
This paper estimates the optimal level of foreign exchange reserves for Botswana over the period 1996 - 2018 and also evaluates the potential cost of keeping reserves in excess of what is considered adequate. The study employs the utility maximisation model by Jeanne and Rancière (2006) to simulate the foreign exchange reserves as a buffer that mitigates the drop in output and smoothens consumption in the event of a sudden stop in capital inflows. The study also evaluates the cost of holding excess reserves based on the yield from the Emerging Market Bond Index spread. The results suggest that the optimal level of reserves has averaged 11.9 percent of GDP (translating to 3.5 months of import cover) annually between 1996 and 2018, while excess reserves have averaged 66.4 percent of GDP annually over the same period. This implies that the country has accumulated far more foreign exchange reserves to help smoothen consumption in the case of a crisis. In terms of the opportunity cost, on average, the holding of excess reserves has amounted to a loss of 3 percent of GDP annually in the period under review. While keeping excess reserves is not necessarily a bad thing as these excess reserves act as a buffer against shocks, such as the financial crisis, it is imperative that foreign exchange reserve management in Botswana should take advantage of other alternative uses, including funding infrastructure development that promotes economic activity and diversification, as well as investing the reserves more in assets that yield high returns in order to minimise the cost of holding the reserves above their adequate level.
1. INTRODUCTION
Foreign exchange reserves (or reserve assets in the balance of payments) are those external assets that are readily available and controlled by a country’s monetary authorities. Nations hold these reserves for several reasons, including, among others, to smoothen temporary fluctuations in external payment imbalances (buffer for liquidity needs),
guarantee the stability of the exchange rate, as insurance against large reduction in capital inflows (sudden stops), saving for future generations, boosting international confidence on domestic economy, prestige and as collateral for international borrowing. Therefore, foreign exchange reserves are generally held for liquidity, investment and precautionary motives. The latter, however, tends to be the paramount motive in the case of countries with lower levels of reserves, whereas for countries which have accumulated significant levels, the investment motive tends to predominate.
Botswana has, over the years, accumulated considerable amounts of foreign exchange reserves during periods of high economic growth, driven mainly by developments in the mining sector. Given the structure of the economy, especially the heavy dependence on mineral exports, especially diamonds, it was considered prudent to accumulate reserves during “good times” in order to help absorb economic shocks during “bad times”. Consequently, foreign exchange reserves reached about 40 months of import cover in 2001, but have since declined to around 12.6 months of import cover (as at end of 2019), mainly reflecting the increase in imports and slower growth in exports over the same period.
Even though it may be justifiable to maintain a high level of foreign exchange reserves for precautionary purposes given the economy’s vulnerability to external shocks, there could as well be costs associated with maintaining high levels of foreign exchange reserves. Indeed, there is a perspective that drawing down on reserves to fund infrastructure development could enhance productive capacity and promote both economic activity and diversification.
The adequacy of reserves differs from one country to the other and is mainly a function of a country’s potential foreign exchange liquidity needs in adverse circumstances, which in turn is a function of a country’s vulnerabilities. Like any other country, there is a need for Botswana to keep adequate level of reserves to safeguard against any unanticipated external economic shocks. Furthermore, the accumulation of reserves over their optimal level has raised questions around the world as they tend to yield lower returns than interest payment by government on its long-term external liabilities. Therefore, an evaluation of the cost of holding excess reserves is generally important, and especially for a country like Botswana which heavily depends on a single commodity for export earnings. The paper, therefore, seeks to estimate the most adequate level of reserves for Botswana and the potential cost of
8 Principal Economists, Modelling and Forecasting Unit and Statistics and Information Services Unit, respectively, Research and Financial Stability Department. The views expressed in this paper are those of the authors and do not necessarily reflect those of the Bank of Botswana.
Assessing foreign exchAnge reserves ADequAcy: the cAse of BotswAnA

16
Bank of Botswana
keeping reserves in excess of what is considered adequate.
The remaining part of this paper is organised as follows: Section 2 reviews the relevant literature. The approach used in determining the optimal level of reserves and the method employed to evaluate the potential cost of holding excess reserves are specified in Section 3. Section 4 covers data description, while Section 5 presents the empirical results. Section 6 concludes and makes policy recommendations.
2. EMPIRICAL LITERATURE
There has been several studies, using different approaches, on the optimal level of reserves and the associated cost of holding them. However, there is no single rule of thumb and a universally applicable measure for assessing and determining reserve adequacy. Instead, motives for holding reserves often provide some sort of guidelines for the adequate level of reserves. For instance, if the motive for holding foreign reserves is self-insurance, the amount of accumulated reserves often depends on the level which is deemed enough to lessen the impact of a crisis, should it happen.
Overall, studies on the optimal level of foreign exchange reserves have used four different methods of analysis. These are ratio analysis, cost-benefit analysis, reserve function analysis and qualitative analysis. The ratio analysis, which is the commonly used analysis, includes the use of the imports, exports, external debt, broad money and output ratios. The cost–benefit analysis determines the optimal scale of foreign exchange reserves by maximising the marginal revenue of a country’s income in relation to its marginal cost. The reserve function analysis establishes a model for the related variables and uses significant variables to construct a function for foreign exchange reserve demand. Lastly, the qualitative analysis uses descriptions to analyse the scale of a country’s foreign exchange reserve.
Recently, the IMF (2020) estimated reserves adequacy for Botswana using a ratio analysis metric that employs a risk-weighted measure of four diverse sources of risk. The four are export earnings to capture potential losses from terms of trade shocks, short-term debt to reflect rollover risk, portfolio investments plus medium and long-term debt to account for drawdowns from non-residents’ investment and broad money as a proxy for residents’ capital flight. The study concluded that reserves of 14 percent to 16 percent of GDP would be adequate for Botswana. The study also indicated that for the past twenty years, the level
of foreign exchange reserves far exceeded the upper bound of the adequacy range.
Jeanne and Rancière (2006) estimated the optimal level of reserves for 34 middle-income countries, including Botswana, for the period 1975-2003. Using ratio analysis approach based on utility maximisation model, they considered a small open economy that may be hit by a sudden stop of capital inflows and, therefore, maintains a stock of reserves to smoothen the impact of the sudden stop on domestic absorption. The results from the baseline calibration suggested, on average, an optimal level of reserves equivalent to 10.1 percent of GDP for the 34 middle-income countries.
Elsewhere, from a perspective of financial security, Zhou et al. (2018) used an approach similar to Jeanne and Rancière (2006) to assess the optimal level of reserves for the Chinese economy for the period 1994-2017. The study concluded that the average optimal scale of foreign exchange reserves in case of a sudden stop in capital flows is 13.53 percent of GDP, with the function of foreign exchange reserves holding changing from meeting basic transactions to meeting financial security demands. Bianchi et al. (2016) investigated the optimal accumulation of international reserves for 22 emerging market economies between 1980 and 2015. Using a canonical model of sovereign default with long-term debt and a risk-free asset, the model simulations displayed an average optimal reserve ratio equivalent to 6 percent of GDP for the 22 emerging market economies. The paper also shows that recent developments in emerging economies, including income windfalls, improved policy frameworks, increase in public sectors’ liabilities and an increase in severity of global shocks, imply significant increase in the optimal holding of reserves.
To ascertain the optimal level of reserves derived using the import and broad money ratios in Lesotho, Molapo (2016) employed the model by Jeanne and Rancière (2006) to estimate the optimal level of reserves for Lesotho between 2003 and 2012. The results indicated that the optimal level of reserves for Lesotho is, on average, 44 percent of GDP for a small crisis and 47 percent of GDP for a large crisis.
In terms of the empirical work on assessing the opportunity cost of holding excess reserves, Mezui and Duru (2013) first estimated the adequate level of foreign exchange reserves for 43 African countries between 2000 and 2011 using the traditional metric method of import cover and the

17
Wijnholds and Kapteyn method. They then derived the social cost by multiplying the ratio of excess reserves to GDP by the yields from alternative investment opportunities, including the approach suggested by Rodrik (2006) which estimates the cost based on the spread between the private sector’s cost of short-term external borrowing and the yield the central bank earns on its liquid foreign assets. The results indicate that, on average, the social cost of holding excess reserves amounts to 1.65 percent of GDP. For Botswana, based on the different approaches used, the cost of holding excess reserves averaged 2.6 percent of GDP in 2011.
Elsewhere, Gupta (2008) explored the cost of holding foreign exchange reserves by India between 2001 and 2007. Using a reserve adequacy measure based on a modified version of utility maximisation model, Gupta calculated the cost of holding excess reserves for India by looking at three different alternative uses of resources and found that India is foregoing as much as 2 percent of its GDP by accumulating excess reserves instead of employing those resources for alternative uses.
In their investigation of the increasing cost of foreign reserve holdings among developing nations, Baker and Walentin (2001) assumed that if the assets were not held as reserves, they would be available to nations to fund domestic investment in physical capital. Therefore, they used the return on such investment as the measure of the opportunity cost of holding reserves. They concluded that the implied cost of the rise in reserve holdings is 0.4 - 1 percent of annual GDP in South Asia, and between 1 and 2.1 percent of annual GDP in East Asia. The cumulative costs of a decade of reserve holdings at late nineties levels (compared to the cost of sixties levels of reserve holdings), could exceed 20 percent of GDP in East Asia and would be close to 10 percent of GDP for nations in Sub-Saharan Africa and Latin America.
In relation to motives for holding reserves, Ndikumana (2007) used panel data for the period 1979 - 2005 from 21 African countries to examine, among others, the motivation of holding reserves. The empirical analysis in his paper shows that the recent reserve accumulation cannot be justified by portfolio choice motives (in terms of returns to assets) or stabilisation objectives. Rather, the evidence suggests that the increase in foreign exchange reserves in African countries was mainly driven by the primary commodity export boom and development aid. Aizenman and Lee (2005) explored precautionary and mercantilist motives to the accumulation of international reserves by developing countries
for the period 1980 – 2000. They provided a model that shows that precautionary demand is consistent with high levels of reserves. Their study reveals, however, that existing patterns of growing trade openness and greater exposure to financial shocks by emerging markets go a long way towards accounting for the observed hoarding of international reserves.
3. METHODOLOgyTo determine the adequate level of foreign exchange reserves for Botswana, this paper draws lessons from an approach by Jeanne and Rancière (2006). The model uses the idea of utility maximisation and the three-period model to simulate the foreign exchange reserves as a buffer that reduces changes in the balance of payments when the capital inflows suddenly stop. The assumption is that foreign exchange reserves yield lower returns than the interest that the government must pay on its long-term external liabilities. However, the main benefit of reserves is to allow the government to smoothen domestic consumption in times of crises. Under the utility maximisation framework, the ratio of the foreign exchange reserve to GDP is used as a function of seven measurable variables: the probability of capital halt, the economic growth rate, the risk-free interest rate, the risk aversion coefficient, the term premium, the output loss rate, and the ratio of short-term foreign debt to output. For estimating the social cost of holding excess reserves, the study follows closely the approach used by Mezui and Duru (2013), which derives the social cost by multiplying the ratio of excess reserves to GDP by the proxy for the spread between the private sector’s cost of short-term external borrowing and the yield the central bank earns on its liquid foreign assets, as suggested by Rodrik (2006).
3.1 Derivation of the Model for Estimating the Optimal Level of Reserves9
The real domestic absorption in a small open economy can be expressed as follows:
(1)
Where At is domestic absorption, Yt is real output and TBt is the trade account balance.
Under the international balance of payments, the trade account balance can be expressed as
(2)
9 The derivation of equations is as presented by the original authors of the framework, namely Olivier Jeanne and Romain Rancière (2006).
Assessing foreign exchAnge reserves ADequAcy: the cAse of BotswAnA
18
Bank of Botswana
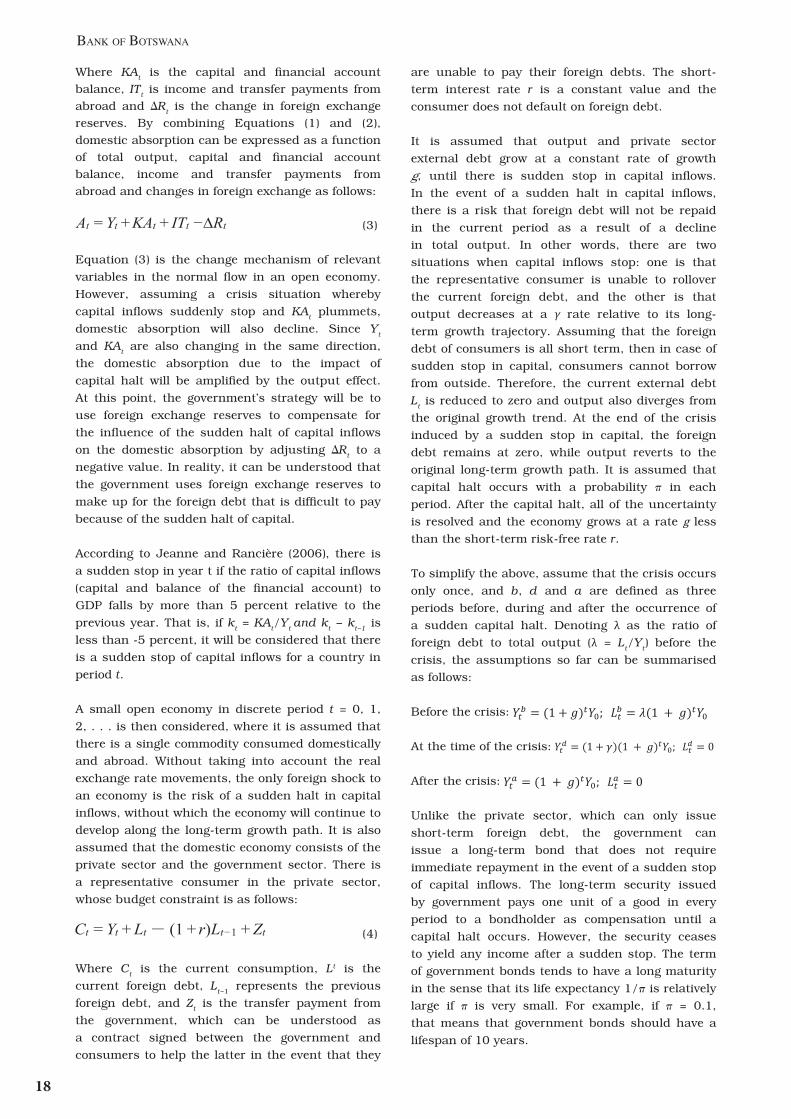
Where KAt is the capital and financial account balance, ITt is income and transfer payments from abroad and ∆Rt is the change in foreign exchange reserves. By combining Equations (1) and (2), domestic absorption can be expressed as a function of total output, capital and financial account balance, income and transfer payments from abroad and changes in foreign exchange as follows:
(3)
Equation (3) is the change mechanism of relevant variables in the normal flow in an open economy. However, assuming a crisis situation whereby capital inflows suddenly stop and KAt plummets, domestic absorption will also decline. Since Yt and KAt are also changing in the same direction, the domestic absorption due to the impact of capital halt will be amplified by the output effect. At this point, the government’s strategy will be to use foreign exchange reserves to compensate for the influence of the sudden halt of capital inflows on the domestic absorption by adjusting ∆Rt to a negative value. In reality, it can be understood that the government uses foreign exchange reserves to make up for the foreign debt that is difficult to pay because of the sudden halt of capital.
According to Jeanne and Rancière (2006), there is a sudden stop in year t if the ratio of capital inflows (capital and balance of the financial account) to GDP falls by more than 5 percent relative to the previous year. That is, if kt = KAt/Yt and kt − kt−1 is less than -5 percent, it will be considered that there is a sudden stop of capital inflows for a country in period t.
A small open economy in discrete period t = 0, 1, 2, . . . is then considered, where it is assumed that there is a single commodity consumed domestically and abroad. Without taking into account the real exchange rate movements, the only foreign shock to an economy is the risk of a sudden halt in capital inflows, without which the economy will continue to develop along the long-term growth path. It is also assumed that the domestic economy consists of the private sector and the government sector. There is a representative consumer in the private sector, whose budget constraint is as follows:
(4)
Where Ct is the current consumption, Lt is the current foreign debt, Lt−1 represents the previous foreign debt, and Zt is the transfer payment from the government, which can be understood as a contract signed between the government and consumers to help the latter in the event that they
are unable to pay their foreign debts. The short-term interest rate r is a constant value and the consumer does not default on foreign debt.
It is assumed that output and private sector external debt grow at a constant rate of growth g, until there is sudden stop in capital inflows. In the event of a sudden halt in capital inflows, there is a risk that foreign debt will not be repaid in the current period as a result of a decline in total output. In other words, there are two situations when capital inflows stop: one is that the representative consumer is unable to rollover the current foreign debt, and the other is that output decreases at a γ rate relative to its long-term growth trajectory. Assuming that the foreign debt of consumers is all short term, then in case of sudden stop in capital, consumers cannot borrow from outside. Therefore, the current external debt Lt is reduced to zero and output also diverges from the original growth trend. At the end of the crisis induced by a sudden stop in capital, the foreign debt remains at zero, while output reverts to the original long-term growth path. It is assumed that capital halt occurs with a probability π in each period. After the capital halt, all of the uncertainty is resolved and the economy grows at a rate g less than the short-term risk-free rate r.
To simplify the above, assume that the crisis occurs only once, and b, d and a are defined as three periods before, during and after the occurrence of a sudden capital halt. Denoting λ as the ratio of foreign debt to total output (λ = Lt/Yt) before the crisis, the assumptions so far can be summarised as follows:
Before the crisis:
At the time of the crisis:
After the crisis:
Unlike the private sector, which can only issue short-term foreign debt, the government can issue a long-term bond that does not require immediate repayment in the event of a sudden stop of capital inflows. The long-term security issued by government pays one unit of a good in every period to a bondholder as compensation until a capital halt occurs. However, the security ceases to yield any income after a sudden stop. The term of government bonds tends to have a long maturity in the sense that its life expectancy 1/π is relatively large if π is very small. For example, if π = 0.1, that means that government bonds should have a lifespan of 10 years.
19
Before the sudden stop of capital, the price of the government bond should be equal to the present discounted value of a unit commodity that it pays in the next period, plus the expected market value of the bond. That is;
implying,
Assuming that the interest rate level that was used to calculate the present value of long-term bonds is higher than the short-term interest rate level r, then the difference δ between the long-term and short-term interest rate can be interpreted as the term premium.
The government issues the long-term bonds to finance foreign exchange reserves. However, the reserves must be accumulated before the sudden stop because the government cannot issue any long-term security during the sudden stop. Supposing that Nt is the number of long-term bonds issued by the government in period t, then the accumulated foreign exchange reserves are represented as follows:
(5)
Before the capital halt, from the government budget constraint, it means that government revenue and expenditure are equal:
(6)
The left hand side of Equation (6) is the sum of the total government expenditure in the current period, including the transfer payment to representative consumers, foreign exchange reserves and the value of the goods repaid in the previous period. The right hand side of the Equation is the total revenue of government, which includes the net income from the repayment of the principal of the previous long-term bond and the current period debt, plus the present value of the foreign exchange reserves held from the previous period. Substituting Equation (5) into Equation (6) in order to solve for the transfer payment Zt that the government subsidises to the representative before the sudden halt occurs:
(7)
Equation (7), suggests that prior to the occurrence of a capital halt, the transfer payment is a negative value, which is a tax levied by the government on
the representative consumer for holding the reserve without investment, which is proportional to the sum of the term premium δ and the probability of capital halt π.
When capital halt occurs, the government transfers the entire net foreign exchange reserves of the previous period to subsidise the consumer to repay the short-term foreign debt which cannot be postponed. The transfer payment is thus:
(8)
Assuming δ + π < 1, in the event of a capital halt, the transfer payments are positive values, so that the government subsidises consumers. However, after a sudden halt of capital, the transfer of the government stops, at which time the foreign exchange reserves Rt, transfer payments Zt, and the number of long-term bonds N are all reduced to zero. Using Equations (7) and (8) to substitute the transfer payments Zt in Equation (4) to solve the level of domestic consumption before, during, and after the capital halt occurs gives:
(9)
(10)
(11)
Equations (9) and (10) describe two aspects of trade-offs in the choice of the optimal scale of foreign exchange reserves. Increasing Rt−1 raises period t domestic consumption if there is a sudden stop. However, that will reduce domestic consumption (taxes that consumers have to pay to reduce the cost of holding excess foreign exchange reserves) if the sudden stop does not occur. Put differently, the accumulation of foreign exchange reserves is equivalent to an insurance that transfers purchasing power from the non-sudden stop state to the sudden stop state.
In order to close the model and obtain the solution for the optimal foreign exchange reserves, there is need to specify the government’s objective function. Following the general social welfare theory, it is assumed that the government’s goal is to optimise the welfare of the representative consumer as follows:
(12)
Where the consumption utility function contains a constant relative risk aversion σ, the higher the degree of consumer risk aversion, the higher the welfare utility due to consumption.
Assessing foreign exchAnge reserves ADequAcy: the cAse of BotswAnA

20
Bank of Botswana
(13)
At this point, the government’s strategy is to find the level of foreign exchange reserve Rt that maximise the level of utility for a representative consumer in each period before the occurrence of a sudden stop. Combining the budget constraints of the representative consumer and government, namely, Equations (4) and (6), the following equation could be obtained:
(14)
Equation (14) shows that accumulating foreign exchange reserve is equivalent to replacing consumers’ non-renewable short-term debt, L, with the government’s long-term debt, PN, in all of the foreign debt of a country. Under the constraints of the overall budget, holding foreign exchange reserves is equivalent to the government using the issuance of long-term bonds to repay the short-term foreign debt that a representative consumer cannot repay in the event of a sudden halt. Although long-term foreign debt reduces the risk that short-term foreign debt cannot be repaid, it brings higher holding costs.
The optimal scale of foreign exchange reserves chosen by the government is the level of reserves that maximises consumer utility in each period t before a sudden capital halt. Rt is only related to the consumption level at period t + 1. Therefore, the optimal scale of the foreign exchange reserves in the t period maximises the expected utility function of period t + 1 consumption.
(15)
Where and are defined by Equations (9) and (10) of the t + 1 period. The first order condition is given by
(16)
The left hand side is the probability of a sudden stop multiplied by the marginal utility of reserves in the event of a sudden stop. The right hand side is the probability of no sudden stops multiplied by marginal cost of reserves assuming no sudden stop. The first order condition can be used to derive the optimal scale of foreign exchange reserves. First, denoting the marginal rate of substitution between consumption in the sudden stop state and consumption in the non-sudden stop state by pt, that is:
(17)
When the term premium δ is equal to zero, then marginal rate of substitution p is equal to 1, implying that domestic consumption is perfectly insured against the risk of a sudden stop . If the term premium δ is positive, then p > 1, which means that domestic consumption is lower in a sudden stop . Manipulation of the first order condition show that the optimal scale of foreign exchange reserves is a constant proportion ρ of the level of output in the next period,
(18)
Where the optimal reserves-to-output ratio ρ is given by the following equation:
(19)
Equation (19) is the measurement model of the optimal foreign exchange reserve scale based on utility maximisation. The optimal scale of foreign exchange reserves is proportional to the probability of sudden capital halt π, term premium δ, economic growth rate g, and the risk aversion coefficient of consumer σ. The optimal scale of foreign exchange reserves is also proportional to the rate of decline in output γ due to sudden capital halt and the ratio of short-term foreign debt to output λ.
3.2 Estimating the Cost of Holding Excess Reserves
As indicated earlier, for estimating the cost of holding excess reserves, the study follows closely the approach used by Mezui and Duru (2013), which estimates the cost based on the spread between the private sector’s cost of short-term external borrowing and the yield the central bank earns on its liquid foreign assets. However, due to the constraint in obtaining precise statistics on the private cost of short-term borrowing as they are not widely traded, the Emerging Market Bond Index (EMBI)10 yield spread is used as a proxy for calculating the cost of holding excess reserves. That is, this study uses the JP Morgan EMBI+ sovereign spread, which averaged around 4.5 percent for the period under review. Hence, the cost of holding excess reserves is calculated as follows:
(20)
Where SCt is the social cost of holding excess reserves, ERt is the excess reserves, GDPt is nominal GDP and EMBI Spread is the JP Morgan EMBI+ sovereign debt spread.
10 The EMBI is JP Morgan's index of dollar-denominated sovereign bonds issued by a selection of emerging market countries. The family of EMBI is the most widely used and comprehensive emerging market sovereign debt benchmark.

21
4. DATA DESCRIPTION
This study uses annual data for the period 1996-2018. The variables used are capital and financial accounts (KAt), short-term external debt, nominal and real GDP and foreign exchange reserves (Rt). These variables are in levels and are sourced from Bank of Botswana and Statistics Botswana. The series for real GDP is measured in constant 2006 prices. The other variables used in the study are the yields on US one-year and ten-year Treasury bills and the JP Morgan Emerging Market Bond Index.
5. RESULTS ON CALIBRATED PARAMETERS, OPTIMAL LEvEL OF RESERvES AND THE COST OF HOLDINg EXCESS RESERvES
5.1 Calibration of Parameters (i) The Probability of a Sudden Stop in Capital
Inflows (π)
As indicated earlier, the model of Jeanne and Rancière (2006) identifies the sudden stop in year t if the ratio of capital inflows to GDP contracts by more than 5 percent relative to the previous year. That is to say, if kt = KAt/Yt and kt − kt−1 is less than -5 percent, it will be considered that there is a sudden stop of capital inflows for a country in period t. According to the critical value of -5 percent, in the 23 years between 1996 and 2018, the critical value has been less than -5 percent in 2001 and 2013. Therefore, the probability of the sudden arrest of capital inflows in Botswana for this paper is identified as π = 0.09.
The two periods of 2001 and 2013 conform to the condition of the sudden stop of capital inflows in Botswana. In 2001, the capital account surplus fell to P105 million from P194 million in 2000. The deficit in the financial account also widened to P1 294 million, due to an increase in the outflow of portfolio assets as well as net outflows with respect to loans, trade credits, currency and deposits by banks abroad, which accounted for the bulk of the increase. Meanwhile, there was a larger net outflow in the financial account in 2013 as a result of an increase in offshore investment (mainly by pension funds), from P23.9 billion in 2012 to P34.2 billion in 2013. Apart from the increase in offshore investment, in 2013, the Bank implemented a modest downward rate of crawl of 0.16 percent in line with the policy objective of maintaining a stable real effective exchange rate of the Pula. As a result, the nominal effective exchange rate depreciated by a similar magnitude in the twelve months to December 2013. Therefore, given that Botswana
is a net importer, this resulted in an increase in outflows.
(ii) Economic Growth Rate (g)
To compute economic growth rate g, this paper uses the mean of the annual rate of growth of real GDP from 1996 to 2018, but excluding 2001 and 2013, which are the years in which sudden-stop of capital inflows occurred. Therefore, based on the data obtained from Statistics Botswana, g = 4.4 percent for the period under review.
(iii) The Risk Aversion Coefficient (σ)
Of the seven parameters, the risk aversion coefficient σ, is the only parameter that cannot be directly measured, hence reference to the existing literature. Studies have shown that the risk aversion coefficient of developing countries is generally higher than that of developed countries (Donadelli and Prosperi, 2012). Since Botswana depends largely on volatile diamond revenue for accumulation of reserves, the degree of risk aversion is higher. Therefore, this paper assumes that the risk aversion coefficient equals to 7 (i.e., σ = 7). According to Jeanne and Rancière (2006), the coefficient lies between 1 and 10.
(iv) The Short-Term Risk-Free Interest Rate (r)
About 95 percent of Botswana’s external debt comes from international organisations. In terms of currency composition, the ratio of US dollar-denominated debt is about 90 percent, which means that in the demand of the foreign exchange, the US dollar is considered a generally stable currency. Therefore, the risk-free interest rate of short-term foreign debt is proxied using the interest rate of the one-year US Treasury bills which is set at 2.4 percent.
(v) The Term Premium (δ)
The value for the term premium, δ=1.5, is the average differential between the yield on the ten-year US Treasury bonds and the one-year US Treasury bonds.
(vi) Size of Sudden Stop (λ)
Parameter λ is calculated as the average level of kt−1− kt over the sample of sudden stops. In this case λ=8.9. The ratio of short-term foreign debt to GDP is normally used but given the insignificant level of short-term debt to GDP, the study uses the approach discussed above.
Assessing foreign exchAnge reserves ADequAcy: the cAse of BotswAnA

22
Bank of Botswana
(vii) The Rate of Output Loss (γ)
The output cost of a sudden stop is calculated by looking at the average difference between GDP growth rate in normal times and the growth rate in sudden stops. The calibration of γ indicates that domestic growth rate falls by 4.1 percentage points on average, relative to the normal times in a sudden stop. Table 1 summarises the calculated parameters.
TABLE 1: CALIBRATED PARAMETERS
Parameter Calibrated Value
Probability of a sudden stop π = 0.09
Economic growth rate g = 0.044
Risk aversion coefficient σ = 7Short-term risk-free interest rate r = 0.024
Term premium δ = 0.015
Size of sudden stop λ = 0.089
Rate of output loss γ = 0.041Note: In interpretation of calibrated parameters, all
values are multiplied by 100, except for risk
aversion coefficient, which cannot be directly
measured, but referenced from the literature.
Source: Authors’ calculation
5.2 The Optimal Level of Reserves
Table 2 shows the empirical estimates of the optimal level of reserves based on the utility maximisation framework. The results indicate that, while foreign exchange reserves averaged 78.2 percent of GDP in the period under review, optimal reserves are on average 11.9 percent of GDP (which translates to an average of 3.5 months of import cover over the period under review), implying that the country has accumulated far more foreign exchange reserves to smoothen consumption in the case of a crisis. The excess reserves are on average 66.4 percent of GDP. However, the results indicate that there has been a downward trend in the level of excess reserves, consistent with the decline in the actual foreign exchange reserves over the years. Meanwhile, the results are generally in line with other studies, including those by Mezui and Duru (2013), who found that the country had excess reserves averaging 71 percent of GDP between 2000 and 2011; amounting to 98.6 percent of GDP in
2000, before declining to 43.1 percent in 2011.
TABLE 2: ACTUAL, OPTIMAL AND EXCESS LEvEL OF FOREIgN EXCHANgE RESERvES
Year Actual Reserves Optimal Reserves Excess Reserves
P Million % of GDP P Million % of GDP IC P Million % of GDP
1996 19076 118.4 1945 12.1 3.7 17131 106.3
1997 21619 118.0 2148 11.7 3.0 19471 106.2
1998 26485 130.8 2692 13.3 3.0 23793 117.5
1999 28852 113.8 3134 12.4 3.4 25718 101.4
2000 33880 114.7 3403 11.5 3.4 30477 103.2
2001 41182 128.4 3653 11.4 3.5 37529 117.0
2002 29926 87.0 3946 11.5 3.5 25980 75.5
2003 23717 63.8 4461 12.0 3.9 19256 51.8
2004 24200 57.6 5386 12.8 3.8 18814 44.8
2005 34610 68.2 6273 12.4 4.3 28337 55.8
2006 47976 81.2 7127 12.1 4.4 40849 69.1
2007 58518 87.1 7930 11.8 3.3 50588 75.3
2008 68612 91.8 7796 10.4 2.4 60816 81.4
2009 57908 78.8 9219 12.5 2.8 48689 66.3
2010 50847 58.5 11141 12.8 3.0 39706 45.7
2011 60271 57.4 11660 11.1 2.5 48611 46.3
2012 59317 54.0 13283 12.1 2.9 46034 41.9
2013 67772 54.1 15481 12.4 3.5 52291 41.8
2014 79111 54.2 15502 10.6 3.3 63609 43.6
2015 84881 58.1 18102 12.4 3.8 66779 45.7
2016 76804 45.0 19114 11.2 4.0 57690 33.8
2017 73693 40.9 20203 11.2 4.8 53490 29.7
2018 71427 37.5 20936 11.0 4.3 50491 26.5Note: IC denotes optimal months of import cover.
Source: Authors’ calculation

23
5.3 The Cost of Holding Excess Reserves
Table 3 shows the estimated cost of holding excess reserves based on the approach used by Mezui and Duru (2013). Even though it may be justifiable to maintain a high level of foreign exchange reserves for precautionary purposes given the economy’s vulnerability to external shocks, the results indicate that on average, the cost of holding excess reserves has amounted to a loss of 3 percent of GDP annually between 1996 and 2018. Factors that could contribute to the cost of holding excess reserves include, among others, the challenge of absorptive capacity, to avoid generating macroeconomic instability and wastage, as well as inadequate monitoring and evaluation capacity in the economy. However, the cost of holding excess reserves has generally been declining over the years, from 4.8 percent of GDP in 1996 to 1.2 percent in 2018. This could be attributed to the strategy adopted by the Bank of Botswana to invest reserves in assets that yield high returns and the decline in foreign exchange reserves over the years.
TABLE 3: COST OF EXCESS RESERvES
Year Excess Reserves/GDP Social Cost
1996 106.3 4.8
1997 106.2 4.8
1998 117.5 5.3
1999 101.4 4.6
2000 103.2 4.6
2001 117.0 5.3
2002 75.5 3.4
2003 51.8 2.3
2004 44.8 2.0
2005 55.8 2.5
2006 69.1 3.1
2007 75.3 3.4
2008 81.4 3.7
2009 66.3 3.0
2010 45.7 2.1
2011 46.3 2.1
2012 41.9 1.9
2013 41.8 1.9
2014 43.6 2.0
2015 45.7 2.1
2016 33.8 1.5
2017 29.7 1.3
2018 26.5 1.2
Source: Authors’ calculation
6. CONCLUSION AND RECOMMENDATIONS
This paper estimates the optimal level of foreign exchange reserves for Botswana over the period 1996-2018 and also evaluates the potential cost of keeping reserves in excess of what is considered adequate. In deriving the adequate level of foreign exchange reserves for Botswana, the study employed the utility maximisation and also identified two periods of capital sudden stops, 2001 and 2013.
The results suggest that the optimal level of reserves in Botswana has averaged 11.9 percent of GDP (or 3.5 months of import cover) annually between 1996 and 2018, while excess reserves have averaged 66.4 percent of GDP annually over the same period. This implies that the country has accumulated far more foreign exchange reserves than what would be implied by an insurance motive against sudden stops and to help smoothen consumption in the case of a crisis. As a result, the Botswana economy performed well during the financial crisis due to the fact that Government had more than enough foreign exchange reserves, which acted as a buffer against the negative effects associated with the crisis. In terms of the opportunity cost, on average, the holding of excess reserves has amounted to a loss of 3 percent of GDP annually in the period under review. As a result, by accumulating reserves over and above the adequate level, Botswana has lost the opportunity of growing its GDP further by not employing some of its reserves for alternative productive uses, such as funding infrastructure development that promotes economic activity and diversification.
While reserve accumulations by countries may play an important role in providing a buffer in the event of a drop in output and providing consumption smoothing mechanism, there is a need to guard against accumulating too much foreign exchange reserves in excess of the adequate level, to minimise incurring costs associated with such a move. Therefore, the structure of foreign exchange reserves should be optimised in Botswana to take advantage of other alternative uses, and avoid excess accumulation above the adequate level. This is because the holding of excess foreign exchange reserves and their rapid growth will certainly cause the rise in holding cost of the reserves, triggering the waste of resources and accumulation of idle funds. Hence, authorities should work on improving implementation capacity of the annual budgets in order to create an alternative use of excess reserves. The use of the excess reserves could be aligned to the implementation
Assessing foreign exchAnge reserves ADequAcy: the cAse of BotswAnA

24
Bank of Botswana
of the National Development Plans, with improved monitoring and periodic evaluation of the Plans to ensure efficiency. Reserve management in Botswana should also strive to ensure that the execess foreign exchange reserves are invested in assets that yield high returns in order to minimise the cost of holding the reserves above their adequate level. Finally, the findings open an avenue for further research on factors that could be leading to the cost of holding excess reserves, including lack of absorptive capacity.
REFERENCESAizenman, J., and Jaewoo Lee (2007). ‘International
Reserves: Precautionary versus Mercantilist
Views, Theory and Evidence’. NBER Working
Paper No. 11366.
Baker, D., and K. Walentin (2001). ‘Money for
Nothing: The Increasing Cost of Foreign Reserve
Holdings to Developing Nations. CEPR Briefing
Paper.
Bianchi, J., Hatchondo, J.C., and L. Martinez (2016).
‘International Reserves and Rollover Risk’.
Federal Reserve Bank of Minneapolis Working
Paper No. 735.
Caballero, R.J., and S Panageas (2004). ‘Contingent
Reserves Management: An Applied Framework’.
MIT Department of Economics Working Paper No.
04-32.
Cassard, Marcel and David Folkerts-Landau (1997).
‘Risk Management of Sovereign Assets and
Liabilities. IMF Working Paper WP/97/166.
Chandan, Sharma and N. R. Bhanumurthy (2011).
‘High cost of holding forex reserves’. Business
Line, Published on September 15, 2011.
Donadelli, M. and Prosperi, L (2012). ‘On the Role
of Liquidity in Emerging Markets Stock Prices.’
Resource Economics, 66, 320-348.
Charles Wyplosz (2007). ‘Debt Sustainability
Assessment: The IMF Approach and Alternatives’.
HEI Working Paper No: 03/2007.
Daniel Mminele (2013). ‘Global trends and South
African reserves management’. Address by,
Deputy Governor of the South African Reserve
Bank, at the Standard Bank 5th African Central
Bank Reserves Management Conference,
Sandton, 5 November 2013.
Greenspan, A. (1999). Currency Reserves and
Debt. Remarks at the World Bank Conference
on Trends in Reserves Management. Washington
DC, April 29.
Gupta, A.S. (2008). ‘The Cost of Holding Excess
Reserves: Evidence from India.’ RePEc.
International Monetary Fund (2011). ‘World
Economic Outlook’. Washington DC, IMF.
International Monetary Fund (2020). ‘Botswana—
Staff Report for the 2019 Article IV Consultation’.
Washington DC, IMF.
Jeanne, O., and Romain Rancière (2006). ‘The
Optimal Level of International Reserves for
Emerging Market Countries: Formulas and
Applications’. IMF Working Paper, WP/06/229.
Mezui, M., and Duru, U (2013). ‘Holding Excess
Foreign Reserves Versus Infrastructure
Finance: What Should Africa Do?’ African Bank
Development Group, Working Paper No. 178,
July 2013.
Molapo Senei S (2016). ‘Optimal International
Reserves in Lesotho’. European Scientific
Journal, May 2016 edition, Vol. 12.
Ndikumana, Léonce (2008). ‘Reserves Accumulation
in African Countries: Sources, Motivations, and
Effects’. UNECA and University of Massachusetts,
Amherst.
Pablo García S. and Claudio Soto G (2004). ‘Large
Hoarding of International Reserves: Are they
worth it?’. Prepared for the VIII Annual Conference
of the Central Bank of Chile.
Rodrik, Dani (2006). ‘The Social Cost of Foreign
Exchange Reserves.’NBER Working Paper No.
11952.
Wijnholds De Beaufort, J.A.H., and A. Kapteyn
(2001). ‘Reserve Adequacy in Emerging Market
Economies.’ IMF Working Paper No. 01/43.
Zhou, G., Yan, X., and Sumei Luo (2018). ‘Financial
Security and Optimal Scale of Foreign Exchange
Reserves in China’. Sustainability Journal, Vol.
10.

25
Assessing the Pula Exchange Rate Alignment
Esther M. Mpete11
ABSTRACT
This paper investigates the alignment of the Pula exchange rate from 2000 to 2019. Using the vector error correction model (VECM), the paper estimates the Behavioural Equilibrium Exchange Rate (BEER) of the Pula during the review period. The variables used to estimate the BEER of the Pula are net foreign assets, terms of trade, the ratio of prices of tradeables to non-tradeables, trade openness and investment. The methodology analyses the stochastic properties of the data and subsequently estimates a VECM to derive the BEER. The long-run permanent equilibrium exchange rate (PEER) is then derived from the trend component of the BEER. Finally, the deviation of the actual real effective exchange rate (REER) from the PEER is used to determine the exchange rate misalignment. During the period under review, there were three periods of overvaluation and three instances of undervaluation, with the results indicating that the Pula is currently moderately overvalued. This suggests an implementation of downward rate of crawl, gradually, as opposed to a sharp once-off devaluation, which could be disruptive to the markets.
1. INTRODUCTION
The currency exchange rate is defined as the price of one currency in terms of another. Exchange rates can either be fixed, managed or floating. Fixed exchange rates are implemented by the monetary authorities of a country, whereas floating exchange rates are determined by the mechanism of market demand and supply, mainly of openly traded financial assets. Market-determined exchange rates tend to automatically correct for distortions or misalignments of the exchange rate, while fixed and managed regimes feature an active role for the authorities in the setting of nominal exchanges rates and, ostensibly, the avoidance of substantial and prolonged episodes of misalignment. The exchange rate is misaligned when there are deviations of a currency from its long-run equilibrium value, in real terms. An equilibrium exchange rate pertains when the demand for a currency is equal to its supply in the economy; it indicates that the price of exchanging
two currencies remains stable and is aligned to the relativities of supply and demand. It is also defined as the long-term exchange rate that equals its purchasing power parity (PPP) in a world where all goods are traded and where markets are fully efficient (Brixiova et al, 2013). Broadly, the actual real exchange rate deviates from this equilibrium due to, among others, shifts caused by real shocks, international capital flows, monetary policy changes, and pegging of nominal exchange rates. In the context of this study, the misalignment means that the exchange rate in real terms (REER) is not consistent with the country’s macroeconomic fundamentals and may affect competitiveness of local industry and ability to industrialise.
A persistent real exchange rate misalignment, particularly an overvaluation, reflects unsustainable macroeconomic conditions, reduces external competitiveness, leads to a misallocation of resources between tradeable and non-tradeable sectors and, ultimately, a currency crisis (Jongwanich, 2009), if prolonged and not addressed. Therefore, regular assessment of an exchange rate for possible misalignment is crucial for policy formulation, especially for countries that manage their nominal exchange rate, like Botswana.
Prior to the 7.5 percent and 12 percent devaluations of 2004 and 2005, respectively, the Pula was assessed to have been overvalued by about 20 percent (Minutes of the Exchange Rate Committee Meeting, October 2003). Following the 2005 devaluation, a new exchange rate framework, the crawling band, was adopted. This was intended to ensure a more orderly, gradual and continuous adjustment of the Pula to maintain the stability of the real effective exchange rate (REER), as opposed to discrete and often large, potentially disruptive adjustments. Even then, exchange rate misalignment could still occur in instances where inflation in Botswana is higher than trading partner average inflation and the implemented rate of crawl is lower than the inflation differential and, therefore, does not completely offset the inflation differential. Indeed, there have been some arguments/observations that the Pula exchange rate is overvalued in relation to its macroeconomic fundamentals and, therefore, misaligned. For example, the IMF 2019 Article IV country report for Botswana (2020), Bosupeng et al. (2019), Econsult (2017) and Iyke and Odhiambo (2015). Moreover, the appreciation of the REER since 2007 by approximately 10 percent and the significant appreciation of the Pula against the South African rand since 2011, by 30 percent and 20 percent in nominal and real terms, respectively, have often
11 Senior Economist in the International Finance and Trade Unit, Research and Financial Stability Department. The views expressed in this paper are those of the author and do not necessarily reflect those of the Bank of Botswana.

26
Bank of Botswana
been cited as evidence to suggest that the Pula exchange rate is misaligned. However, the REER has remained relatively stable from 2015 to 2019. Against this background, this paper seeks to assess and determine if indeed the Pula exchange rate is misaligned by estimating the long-run equilibrium real exchange rate of the Pula. The long-run equilibrium exchange rate is the optimal level of the REER consistent with the country’s macroeconomic fundamentals. The empirical analysis is conducted in three steps. First, the behavioural equilibrium exchange rate (BEER) approach is applied in order to determine which economic fundamentals/variables explain the dynamics of the REER in Botswana. The permanent equilibrium exchange rate (PEER) is then derived from the BEER. Finally, the misalignment is derived as the gap between the actual REER and the PEER.
The remaining part of the paper is organised as follows: Section 2 gives a brief summary of Botswana’s exchange rate policy and analyses the exchange rate framework and performance, as well as its consistency with macroeconomic fundamentals. Section 3 covers the theoretical and empirical literature, while Section 4 specifies the methodology used to assess whether the Pula is misaligned and describes the data used in the analysis. Section 5 presents the results, while Section 6 concludes the paper with policy recommendations.
2. BOTSwANA’S EXCHANgE RATE POLICy
Botswana’s exchange rate policy provides the framework for determining the external value of the national currency, the Pula. The policy’s primary objective is to maintain a stable real effective exchange rate to support the competitiveness of the domestic producers of tradeable goods and services in international and domestic markets. By preserving the value of the Pula, the policy also supports the national objective of economic diversification, growth and employment creation.
The Pula exchange rate is determined on the basis of a peg to a basket of currencies, the choice and relative weights of which is guided by the trade pattern and currencies used in international trade and payments. It is pegged to a trade-weighted basket of currencies that comprise the South African rand and the International Monetary Fund’s unit of account, the Special Drawing Rights (SDR). Pegging to a basket of currencies rather than a single currency means that movements in the Pula exchange rate are not subject to an extreme influence of exceptional volatility of any single currency. The adoption of a pegged exchange rate rather than a floating exchange rate
was justified on the basis that the economy could experience “the Dutch Disease” problem as the production and export of diamonds increased. It was considered that rising export earnings from the dominating sector and the resulting inflows of foreign exchange could cause the nominal exchange rate to appreciate, which, in turn, would cause the real exchange rate to appreciate; hence, resulting in a decline in the competitiveness of local producers of tradeable goods and services. This would undermine other exports and the production of other tradeable commodities competing with imports (Pegg, 2010). As a result, the economy may become less diversified as other tradeable goods sectors fail to grow and perhaps even contract.
2.1 Current Exchange Rate Framework
As indicated above, the primary objective of the exchange rate policy is to maintain a stable REER, which is a geometric trade-weighted mean of the bilateral real exchange rates of the Pula against the currencies of each of the main trading partners – the South African rand and the SDR. It is the yardstick of measuring an economy’s international trade competitiveness. Consequently, an appreciation or depreciation of the REER means that the economy is losing or gaining trade competitiveness. The term “effective” in “real effective exchange rate” means that exchange rate changes are not measured against one particular currency, but against an average index of a basket of currencies, each weighted according to the importance of a country as a trade partner.
The policy framework uses the crawling band exchange rate mechanism to determine the value of the Pula against other currencies (Bank of Botswana, 2005). This mechanism was introduced in May 2005 as an improvement over the less transparent adjustable peg. The adjustable peg was characterised by occasional discrete and secret adjustments to the value of the Pula to alternatively support the competitiveness of tradeable goods or the objective of price stability or accommodate the change in the currency composition of the basket in line with evolving conditions relating to the direction of trade. Consequently, the Pula was devalued in 1982, 1984, 1985, 1990, 1991, 2004 and 2005 to restore external competitiveness. It was revalued in 1980 and 1989 to mitigate inflationary pressures as the sharp depreciation against the major currencies resulted in higher imported inflation into Botswana. In addition to adjusting the value of the Pula the relative weights of the currencies comprising the Pula basket were also changed several times to reflect the structural trade patterns.

27
In the crawling band framework, the prospects for a change in competitiveness (i.e., inflation differentials between Botswana and trading partner countries) are projected and the nominal effective exchange rate (NEER) adjusted gradually to avoid a change or restore price competitiveness (Bank of Botswana, 2018). The gradual adjustments of the Pula exchange rate, which are implemented through the annual rates of crawl, are meant to prevent or correct for any misalignment (either over-valuation or under-valuation) of the exchange rate. When forecast inflation in Botswana is higher/lower than trading partner average forecast inflation, a downward/upward crawl is implemented; and when equal (zero inflation differential), the rate of crawl ought to be zero.
When the crawling band mechanism was introduced, authorities considered its degree of flexibility compared to the prior framework, which would enable policy coordination between the roles of the exchange rate and monetary policies, in achieving the competitiveness and price stability objectives, respectively. Indeed, the flexibility of the crawling band has eased constraints on the operation and effectiveness of the monetary policy, by limiting the scope for policy conflict12. With more flexibility, the nominal exchange rate responds to economic changes, as it allows for consideration to be given to the inflation environment when deciding how to respond to movements in the exchange rate, thus facilitating the adjustment of the real exchange rate in line with maintaining a stable REER.
In addition to providing scope for a more orderly response to changes in economic fundamentals, the crawling band framework also insulates the economy from external shocks by allowing the nominal exchange rate to take up some of the necessary market adjustment via the movements of the Pula basket currencies against each other (which are market-determined). However, the degree of flexibility is limited since the economy is not diversified with relatively low level of financial market development. In terms of policy coordination, the crawling band exchange rate has become an important channel of the monetary policy transmission mechanism. The monetary authorities closely monitor the exchange rate market and consider exchange rate developments in their monetary policy decisions.
The crawling band mechanism allows the exchange rate to move relatively more freely between the policy-determined upper and lower limits of the band in response to market forces. The central parity of the band is subjected to a crawl that entails small daily adjustments aimed at preventing real exchange rate disequilibrium. For the first 7 years following its adoption, the downward rate of crawl, which has varied between zero and 5 percent, was used to correct an appreciating REER emanating from domestic inflation that was higher than the average of trading partner countries inflation.
The framework also provides for a gradual widening of the band between the buy and sell rates in order to allow more flexibility of the exchange rate, which should progressively allow for market determination of the value of the Pula. Widening the band introduces more flexibility to the exchange rate and, therefore, enables monetary policy to become more effective in controlling the inflation path. The extent and pace of further band widening would depend on and reflect foreign exchange market development. When the new framework was introduced, the Bank’s trading margins were widened from +/- 0.125 percent to +/- 0.5 percent in order to increase inter-bank trading in the foreign exchange market (Motsumi and Ntwaepelo, 2019). However, the margins were reduced back to +/- 0.125 percent in 2013 on realisation that the retail cost of foreign exchange transactions was unnecessarily too high for customers; the band limits have since remained unchanged.
Exchange rate bands introduce a measure of flexibility within the mechanism and, therefore, monetary policy flexibility. Evidence from countries, such as Poland and Chile, illustrate a gradual approach from a relatively fixed exchange rate to a more flexible rate involved moving from fixed pegs to crawling pegs to gradually widening crawling bands, and the eventual adoption of a floating regime. At times, this was in response to an increase in capital inflows which put upward pressure on pegged rates and, thus, had to allow exchange rate flexibility to avoid overheating the economy. When countries such as Chile, Hungary and Israel began the transition towards inflation targeting, they operated exchange rate bands wide enough to afford scope for full-fledged inflation targeting. Moreover, purposeful foreign exchange interventions were used to keep the exchange rate within their pre-announced crawling bands, which helped the monetary authorities to focus on achieving their inflation targets. At the same time, the exchange rate crawled downwards to avoid the emergence of competitiveness problems. Over time,
12 While in the previous framework, exchange rate policy focused primarily on discrete and sizable devaluations to correct for an overvalued exchange rate, this resulted in higher domestic inflation calling for a more restrictive monetary policy. However, the monetary policy was increasingly constrained by the need to support the fixed exchange rate (Bank of Botswana, 2005).
Assessing the pulA exchAnge rAte Alignment

28
Bank of Botswana
the bands were widened until they did not serve as a constraint on monetary policy (Carare et al., 2002).
2.2 Exchange Rate Assessment
The performance of the Pula is measured in terms of its REER, an inflation-adjusted and trade-weighted exchange rate of the Pula against its major trading partner currencies, the South African rand and composite currencies comprising the SDR. The Bank currently generates an effective exchange rate (nominal and real) based on the consumer price index (CPI), mainly due to unavailability of data for other indices, such as the producer price index (PPI), the wholesale price index (WPI) and the unit labour cost (ULC). The CPI is a measure of the average of prices of a basket of consumer goods and services at a given period. This index, however, is often a poor proxy for tradeable items as it includes prices of non-traded services. The prices of non-traded goods and services vary substantially between countries, more so that the stages of development differ greatly between Botswana and its major trading partners. Moreover, the calculation of the CPI in different countries is not based on the same basket of goods and services, the weightings often reflect patterns of consumer spending that differ from one country to another (Motsumi and Ntwaepelo, 2019). The two shortcomings may lead to biased outcomes of the
relative prices and, thus, changes in the REER. In addition, the weight of imported tradeables in the Botswana CPI is quite large (42 percent). Therefore, the rate of increase in prices of imported goods is likely to add to the appreciation of the REER compared to the experience of Botswana’s trading partners.
Chart 1 shows an appreciation of the REER since 2007, close to levels prior to the 2005 Pula devaluation, when the Pula was adjudged to be overvalued. In that period, Botswana inflation remained higher than average trading partner inflation and the average downward rate of crawl implemented over the period, thereby, culminating in the appreciation of the REER. In fact, during that period, several publications of the Bank’s Annual Report highlighted that the negative rate of crawl were not adequate to offset the positive inflation differential between Botswana and trading partner countries. During the period 2005 – 2014, the relative prices13 increased by 38 percent, while the NEER depreciated by about 17 percent cumulatively (equivalent to the cumulative downward rate of crawl implemented over this period). Consequently, the REER appreciated by 11 percent.
However, as inflation came under control from 2015 to 2019, resulting in progressively small inflation differentials between Botswana and average
13 Calculated as: ((Botswana CPI/SA CPI)^0.45) x ((Botswana CPI/SDR CPI)^0.55) – the basket weights were changed accordingly.
Chart 1: nominal and real effeCtive exChange rate

29
trading partner inflation, and, therefore, small rates of crawl, the REER remained relatively stable consistent with the policy objective.
TABLE 1: RATES OF CRAwL: 2005 – 2020Date Rate of Crawl Date Rate of Crawl
20/06/2005 -4.80 27/01/2015 0.00
04/07/2006 -3.90 03/01/2016 0.38
04/07/2007 -2.30 03/01/2017 0.26
10/03/2009 -2.91 02/01/2018 -0.30
21/04/2010 -2.61 03/01/2019 0.30
05/06/2012 -0.16 03/01/2020 -1.51
2.3 Measures of External Stability: Key Indicators for Botswana
There are several indicators of an exchange rate misalignment from the various measures of external stability that could indicate whether the exchange rate is misaligned or not. External stability defines the capability of the economy to meet its international financial commitments, with minimum disruptions to trade and financial flows due to rapid and unpredictable movements of the exchange rate (Montiel and Hinkle, 1999). External instability may, therefore, suggest that the exchange rate is misaligned. Measures used to assess external stability with respect to the exchange rate include the current account relative to output (GDP), terms of trade (ToT), levels of foreign debt and foreign exchange reserves.
The Current Account Relative to Output
External balance signifies a condition in which the country’s current account (CA) surplus or deficit is deemed sustainable (Iyke and Odhiambo, 2016). The CA records a country’s trade in goods and services, as well as flows of income and current transfers, with the rest of the world. A surplus (deficit) in the CA indicates that an economy is a net creditor (debtor) to the rest of the world. A persistent CA deficit is sustainable when an economy achieves robust growth and attracts enough capital inflows to the extent that it does not destabilise the exchange rate. However, a persistent CA deficit due to an overvalued exchange rate is unsustainable. When the currency is overvalued, imports become cheaper and the quantity of imports increases, while price elastic exports become uncompetitive resulting in a decline in quantity.
Botswana’s CA balance has been deteriorating since 2015 after reaching a substantial surplus of 17 percent of GDP in 2014 (Chart 2), while both the share of total exports and non-mining exports
GDP has declined from 15 percent in 2014 to 7 percent in 2019. Similarly, Botswana’s share of non-mining exports in world trade (Chart 5) started falling in 2015 as the country continues to fail to have significant traction in export diversification, while the diamond market continues to experience volatility from external shocks. The CA balance narrowed to 2.1 percent of GDP in 2018 amid lower demand for diamonds and fiscal expansion. It deteriorated further in 2019 to -15 percent of GDP.14 The CA deficit, in theory, could be signalling a currency overvaluation.
14 The deficit was due to a fall in diamonds exports, owing to lower demand in an uncertain global economic environment, fragmentation of the midstream retail outlets, oversupply of polished gemstones as well as tight bank financing and currency fluctuations in India, where most of the polishing and trading industry is based.
to GDP started declining from 2014 (Chart 3 and 4). The decline in exports was due to the decline of growth in the volume of both diamond and non-diamond exports since 2014. Of concern is that the share of non-mining exports in non-mining
Chart 2: Current aCCount BalanCeas a perCentage of gdp
Source: Bank of Botswana and Statistics Botswana
Assessing the pulA exchAnge rAte Alignment

30
Bank of Botswana
Foreign Exchange Reserves
Foreign exchange reserves facilitate the determination of the value of a domestic currency and its adjustment and stabilisation. They are an important indicator of a country’s ability to make payments for imports, service foreign debt, support the conduct of monetary policy and defend the value of its currency in case of a managed exchange rate. High foreign exchange reserves represent enhanced external stability and confidence. The country’s foreign exchange reserves have been deteriorating since 2008 (Chart 6), on account of the impact of global financial crisis (GFC),
the drawdown to finance the economic stimulus programme of 2015–2018, an increasing import bill for goods and services as well as servicing Government obligations, while the foreign exchange inflows have been declining. Reserves as a ratio of imports have fallen from 29 months cover in 2007 to 12.6 months in 2019. Similarly, net foreign assets (NFA) as a percent of GDP have been declining (Chart 7). They amounted to 39 percent of GDP in December 2019, less than half the 2008 level (97 percent of GDP). For a country with a nascent capital market, the reserves are needed to provide a buffer against the adverse impact of shocks to the current account. However, there is cause for concern when reserves keep falling given the high dependency on volatile commodity export earnings amidst a high import bill for final consumption. Declining reserves on account of an increasing need to balance payments of the country could indicate an overvalued currency.
External Debt as a Ratio of Output
This ratio shows the extent to which an economy relies on external funding for local projects or to service its fiscal deficit. A higher and increasing external debt/GDP ratio could lead to high and unsustainable debt and propagate macroeconomic
Source: Statistics Botswana
Chart 3: total exports performanCe (Constant priCes)
Source: Statistics Botswana
Chart 4: share of non-mining exports in non-mining gdp (perCent)
Source: International Monetary Fund
Chart 5: market share of non-mining exports in World trade
(Constant us$, 2010)Source: Bank of Botswana
Chart 6: foreign exChange reserves (us$) and import Cover (months)
Source: Bank of Botswana
Chart 7: net foreign assetsas perCent of gdp
P M
illi
on

31
instability. A sustained net increase in foreign goods consumption leads to a fall in national savings and an increase in domestic prices due to imported inflation in the absence or lack of domestic substitutes. This situation leads to increases in the real exchange rates, deterioration in the current account balance and, therefore, in the long run, the real exchange rate disequilibrium may consequently lead to a progressive increase in external debt (Kouladoum, 2018). Chart 8 shows a sharp increase in foreign debt15 as a percent of GDP in 2007/08 to fund government expenditure and imports, on the back of very low diamond earnings during the GFC. Even though the ratio has not reverted to pre-GFC levels, there is no progressive increase in external debt which could suggest neither an external imbalance nor an exchange rate misalignment.
Terms of Trade
Terms of trade (ToT) represent the ratio of a country's export prices to its import prices. An improvement (increase in the index of the ToT) means export prices have risen relative to import prices; and therefore, a country is able to pay for increasingly larger volume of imports with the same amount of exports than before. The ToT and the exchange rate are positively related; a fall in the exchange rate should reduce the ToT because exports become cheaper. Similarly, an appreciation of the exchange rate lowers import prices in terms of the domestic currency and should improve the ToT.
15 Botswana can afford to take on more debt given that its total debt including government guarantees average about 20 percent of GDP; the government exposure remains within the legal limit of 40 percent of GDP and poses minimal risk to both external and financial stability.
16 World Brent oil prices declined from about US$111 per barrel in 2013 to US$46 per barrel in 2015, while the international food prices index declined from 122 to 93 in the same period.
Botswana’s ToT are characterised by marked volatility between 2005 and 2015 (Chart 9). The ToT deteriorated significantly in 2008 due to low commodity prices on account of the impact of the GFC and in 2013 when the country received large volumes of diamond imports following the relocation of the Diamond Trading Company International from London to Gaborone. The significant improvement in the ToT between 2013 and 2015, owed largely to the substantial decline in international oil and food prices16. While the REER was relatively stable and diamond prices remained somewhat stable between 2015 and 2019, the ToT deteriorated, meaning that import prices were rising faster than non-mining export prices, which could be associated with a depreciation of the Pula; thus the decline in ToT does not suggest an overvalued Pula. 3.
Chart 8: government external deBt as a perCent of gdp
Source: Bank of Botswana
Source: Bank of Botswana and author's calculations
Chart 9: Commodity terms of trade and real effeCtive exChange rates
(index deC 2018=100)
Source: Bank of Botswana
Chart 10: diamond priCes(index 1982=100)
Index
Index
Index
Assessing the pulA exchAnge rAte Alignment
32
Bank of Botswana
3. LITERATURE REvIEw
3.1 Measures of the Equilibrium Real Exchange Rate
In the vast literature on the determinants of the real equilibrium exchange rates, three methodologies are most common: the macroeconomic balance (MB) approach, also known as the fundamentals equilibrium exchange rate approach (Williamson, 1994); the behavioural equilibrium exchange rate (BEER) approach (Edwards, 1994); and the natural real rate of exchange (NATREX) approach (Stein 1995).
In assessing the consistency of exchange rates with economic fundamentals, the IMF advocates the External Balance Assessment lite (EBA-lite) for less advanced economies and countries with limited data availability, which includes three approaches of assessment: the current account model, the real exchange rate model, and the external sustainability approach (IMF, 2016).
(1) Macroeconomic Balance Approach
The macroeconomic balance (MB) approach defines the equilibrium exchange rate as the real exchange rate that simultaneously meets conditions of internal and external balances (Ajevskis et al., 2014). The current account gaps are often dependent on the level of potential output. Therefore, the equilibrium real exchange rate is defined as a rate that would lead to the required adjustment in the current account to attain potential output. This approach measures the exchange rate adjustment necessary to shift the underlying current account towards its sustainable level when output is at its potential (equilibrium) level (IMF, 1998). It measures how much the exchange rate should vary to restore the external balance. Eyraud (2009) indicates that there are three stages of measuring MB, being:
a) The first step is to estimate a target for the CA, known as the “CA norm” or the equilibrium CA balance. It is defined as the CA that is compatible with the fundamentals in the medium term. The CA norm is computed from an econometric relation between the CA and its fundamentals – the determinants of savings and investment. The macroeconomic fundamentals are the overall fiscal balance as a ratio of GDP measured as deviation from the average budget balance of trading partners; the net foreign assets (NFA) position relative to GDP; deviation of the real per-capita GDP growth rate from its trading-partner average; PPP-based per capita GDP; and population
growth rate. The estimation should also include dummy variables for economic crises, and in case a country is a financial hub or a financial centre.
b) The second step is the estimation of the underlying CA. This is the CA balance at exchange rates when the economy is producing at its potential output level; it excludes temporary factors. The CA forecast from the World Economic Outlook (WEO) can be used as a measure of the underlying CA, as the WEO projections are conditional on real exchange rates remaining unchanged and assume that actual output equals potential output. The CA norm is compared to the underlying CA.
c) The third step is to determine the CA elasticity. The CA elasticity to the real exchange rate is used to measure the exchange rate change that would close the gap between the underlying CA and its equilibrium value (the CA norm).
(2) Behavioural Equilibrium Exchange Rate Approach
The Behavioural Equilibrium Exchange Rate (BEER) approach directly estimates the equilibrium relationship as the structural (long-run) relationship between economic fundamentals and the real equilibrium exchange rate (IMF, 1998). It searches for a statistically significant relationship between the variables (e.g., net foreign assets, terms of trade, productivity, etc.) and the real exchange rate without specifying the structure that the relationship should take (Williamson, 1994). It estimates an econometric relation in the following 3 steps:
a) Estimation of a relationship between the REER against a set of fundamentals. The macroeconomic fundamentals include: the NFA position of the country; the relative productivity differential between the tradeable and non-tradeable sectors (capital-labour ratio); expected real GDP growth; the output gap; the terms of trade; trade openness; fiscal balance as a ratio of GDP; the real short-term interest rate differential; change in reserves to GDP ratio; the credit to GDP ratio; share of administered prices in the CPI; share of Value Added Tax revenue in GDP; and institutional quality (IMF, 2018).
b) The equilibrium exchange rate is computed as a function of the forecasted values of the fundamentals in the medium term (these can be drawn from the WEO 5-year forecasts).

33
c) The misalignment is measured as the gap between the actual REER and its equilibrium value.
Considering the set of variables that determine the REER that is consistent with economic fundamentals, an equilibrium REER estimated with limited and poor-quality data will result in less reliable results.
(3) The Natural Real Rate of Exchange Approach
Faruqee (1995) defines the Natural Real Rate of Exchange (NATREX) approach as the equilibrium exchange rate that equates the current account balance consistent with full employment to the difference between desired savings and investment. It examines the long-run determinants of the real exchange rate from a stock-flow perspective. The empirical analysis estimates a long-run relationship between the real exchange rate and factors that affect trade flows. These are net foreign assets, terms of trade, trade openness and productivity.
3.2 Empirical Literature Review
Iimi (2006) estimated the behavioural equilibrium exchange rate for Botswana during the era of the adjustable fixed exchange rate mechanism (1985–2004). The BEER approach analysed the behaviour of the REER by comparing the actual REER to the sustainable REER. The study indicated that the Pula was undervalued in the 1980s and appreciated significantly from the mid-1990s to 2004, showing an overvaluation of the REER of up to 10 percent and, thus, providing rationale for adjusting the misalignment by the discrete devaluations of the currency in 2004 and 2005. Iimi ascribed the REER overvaluation to improvements in productivity growth in the mining sector which, in turn, eroded the external competitiveness of other sectors. He, however, noted that the estimation result is likely to be affected by a specification error or omitted variable bias17.
Deléchat and Gaertner (2008) used a combination of three complementary approaches18 to assess the level of the exchange rate in Botswana for the period 1980 – 2007. The paper found that after a period of
overvaluation prior to 2005, Botswana’s REER was broadly in line with economic fundamentals and consistent with external stability. They found that balance of payments and real effective exchange rate developments indicated no immediate threat to external stability, and that CA volatility was high due to the economy’s dependence on diamond exports. They determined that the reserves cover was adequate and there were no significant balance sheet vulnerabilities stemming from the capital and financial account. The REER measures indicated that the 2004-2005 devaluations and the switch to a crawling band regime had undone the previous overvaluation, which was linked to poor productivity in non-tradeables versus tradeables sectors relative to Botswana’s trading partners, and restored REER stability. Delechat and Gaertner projected that, based on existing policies, the CA path was up to 2015 consistent with external sustainability, provided that the future return of investments in mining and energy is higher than that on accumulating financial assets.
Similarly, a study by the Botswana Institute for Development Policy Analysis (Taye, 2012), using the autoregressive distributed lag (ARDL) model to investigate the Pula misalignment during 1990 – 2011, concluded that there was no evidence of misalignment, the exchange rate sufficiently adjusts to any temporary misalignments in the short-term, and that the crawling mechanism seems to serve the economy well. The study also highlighted that because Botswana’s trade structure is characterised by price inelastic exports and imports, the depreciation of the Pula is not likely to lead to significant increases in exports and decreases in imports and, thus, may lead to a deteriorating trade balance.
The study by Iyke and Odhiambo (2015) employed the ARDL bounds testing procedure in modelling the long-run equilibrium real exchange rate for Botswana, using the BEER approach. The variables used in the estimation included the real effective exchange rate, the ratio of government consumption to GDP, trade openness, the terms of trade, the net foreign assets to GDP ratio and the real commodity price index. The terms of trade and trade openness were found to be the only significant determinants of the BEER. They found that the actual real exchange rate appreciated significantly compared to the equilibrium exchange rate during the period 1981 – 1986 and 2002 – 2005 and depreciated significantly compared to the equilibrium exchange rate during the periods 1988 – 1992, 1996 – 2001, and 2006 – 2012. They also found that the speed of adjustment when the actual real exchange rate deviates from its equilibrium level is very slow, meaning that significant deviations are not corrected fast enough.
17 The equilibrium equation estimation omitted one of the macroeconomic fundamentals that are important in the Botswana context, the degree of openness of the economy to trade. The analytical model ignores tariffs and other trade restraints that may affect the prices of non-tradeables relative to tradeables.
18 The three complementary methodologies are: a macroeconomic balance approach, a reduced-form equilibrium real exchange rate approach and an external sustainability approach.
Assessing the pulA exchAnge rAte Alignment

34
Bank of Botswana
In their research, Bosupeng et al. (2019), using the ARDL bounds testing approach, investigated whether the Pula was misaligned during 1980 – 2015.They concluded that the structural misalignment19 caused an overvaluation of the Pula. Moreover, the REER misalignment has had a significant influence of the current account imbalance shown by the cyclical component of the CA. The study further found that Botswana has been experiencing capital inflows during the period of their study as follows; 1980-2007 due to rapid development of the mining sector; and 2012-2015 due to active promotion of foreign direct investment (FDI) through the Economic Diversification Drive (EDD). The study concluded that Botswana should tolerate an overvaluation of the REER of only up to 5 percent.
The IMF (2020) is of the view that Botswana’s large current account surplus is more of a structural characteristic of the economy and is weakly dependent on the exchange rate. The study uses an External Balance Assessment-lite (EBA-lite) methodology focusing on both the CA and REER models. Their findings show that the non-diamond CA deficit is about 10 percent of GDP, suggesting that the Pula is overvalued. Assessing the equilibrium REER, the EBA-lite CA approach estimates the CA gap to be equivalent to -2.4 percent of GDP, with a CA norm of -0.3 percent of GDP in 2019. The estimated elasticity of the trade balance to changes in the REER is -0.25, suggesting that the REER would need to depreciate by 9 percent for the CA to be reduced to the fitted value of the regression. From the perspective of the EBA-lite REER approach, the REER would need to depreciate by almost 20 percent to reach the fitted value of the regression. The authors give more weight to the CA-EBA-lite approach than to the REER approach, which gives a larger overvaluation than the former on account of the once-off CA imbalances in 2019.
It can be drawn from the empirical literature reviewed above that studies covering the period before introducing the crawling band mechanism, observe an overvaluation of the Pula. Indeed, for most of the period between the mid-1980s and 2004, the Pula often appreciated and called for discrete devaluations by the authorities. Studies conducted between 2006 and 2011 conclude that the Pula is in line with economic fundamentals. They have included a dummy variable that captures the 2004 and 2005 devaluations and the transition of the exchange rate mechanism. Recent studies (2015-2019), taking into account the structural
adjustment in the exchange rate, conclude that the Pula is moderately overvalued.
4. METHODOLOgy
This paper adopts the BEER approach to model the real equilibrium exchange rate of the Pula for the period 2000 to 2019 by estimating a VECM. For purposes of this study, this paper focuses on estimating the real effective exchange rate “norm” values consistent with fundamentals and desirable policies. The gap between the norm values and the actual values of the REER implies a misalignment. Following Clark et al. (1998), the BEER approach involves three stages. First, an estimation of the reduced form REER equation is based on the macroeconomic data. Second, the equilibrium real exchange rate is calculated using the coefficients estimated in the first stage. The long-run coefficients are applied to the actual values of regressors resulting in the BEER. The long-term BEER, termed the permanent equilibrium exchange rate (PEER), is derived using the trend component of the Hodrick and Prescott filter (HP filter). Third, is the derivation of the gap between the actual REER and the PEER estimated in the second stage, which is a measure of the misalignment.
4.1 Analytical Framework
As in Palić et al. (2014), the BEER is derived after applying a Johansen cointegration test and then estimating a VECM to determine the long-run relationship among variables. The principle of cointegration relies on the fact that a stationary linear combination of non-stationary series may exist, which is perceived as a long-run equilibrium towards which the dependent vector of series tends to return (Pošta, 2007).
The VECM model of the REER index includes variables that would affect the REER directly and indirectly through changes to the CA balance. Following both Mano et al.(2018) and Palić et al.(2014), the variables included are the net foreign assets to GDP ratio (NFA), the terms of trade to GDP (ToT), the ratio of prices of tradeables to non-tradeables (TNT) (these are proxied with indices in the CPI basket), trade openness to GDP (TRO), and investment as a share of GDP (INV).Government consumption as a share of GDP and productivity calculated as output per worker were also considered as vital fundamentals; however, they were not statistically significant in the model. From an estimated VECM, the behavioural equilibrium exchange rate is, therefore, specified as follows,
19 The structural misalignment arises when exchange rate fundamentals are not reflected in changes of the REER (Bosupeng et al., 2019)
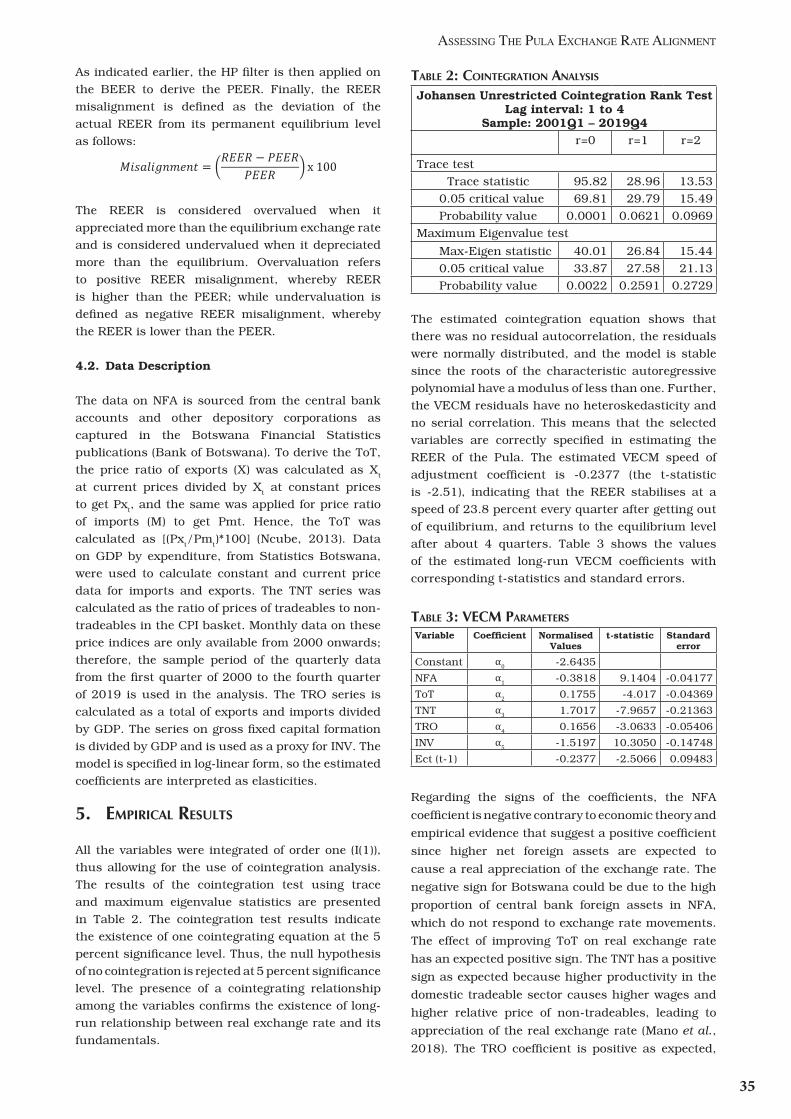
35
As indicated earlier, the HP filter is then applied on the BEER to derive the PEER. Finally, the REER misalignment is defined as the deviation of the actual REER from its permanent equilibrium level as follows:
The REER is considered overvalued when it appreciated more than the equilibrium exchange rate and is considered undervalued when it depreciated more than the equilibrium. Overvaluation refers to positive REER misalignment, whereby REER is higher than the PEER; while undervaluation is defined as negative REER misalignment, whereby the REER is lower than the PEER.
4.2. Data Description
The data on NFA is sourced from the central bank accounts and other depository corporations as captured in the Botswana Financial Statistics publications (Bank of Botswana). To derive the ToT, the price ratio of exports (X) was calculated as Xt at current prices divided by Xt at constant prices to get Pxt, and the same was applied for price ratio of imports (M) to get Pmt. Hence, the ToT was calculated as [(Pxt/Pmt)*100] (Ncube, 2013). Data on GDP by expenditure, from Statistics Botswana, were used to calculate constant and current price data for imports and exports. The TNT series was calculated as the ratio of prices of tradeables to non-tradeables in the CPI basket. Monthly data on these price indices are only available from 2000 onwards; therefore, the sample period of the quarterly data from the first quarter of 2000 to the fourth quarter of 2019 is used in the analysis. The TRO series is calculated as a total of exports and imports divided by GDP. The series on gross fixed capital formation is divided by GDP and is used as a proxy for INV. The model is specified in log-linear form, so the estimated coefficients are interpreted as elasticities.
5. EMPIRICAL RESULTS
All the variables were integrated of order one (I(1)), thus allowing for the use of cointegration analysis. The results of the cointegration test using trace and maximum eigenvalue statistics are presented in Table 2. The cointegration test results indicate the existence of one cointegrating equation at the 5 percent significance level. Thus, the null hypothesis of no cointegration is rejected at 5 percent significance level. The presence of a cointegrating relationship among the variables confirms the existence of long-run relationship between real exchange rate and its fundamentals.
TABLE 2: COINTEgRATION ANALySIS
Johansen Unrestricted Cointegration Rank TestLag interval: 1 to 4
Sample: 2001Q1 – 2019Q4r=0 r=1 r=2
Trace testTrace statistic 95.82 28.96 13.53
0.05 critical value 69.81 29.79 15.49Probability value 0.0001 0.0621 0.0969
Maximum Eigenvalue test
Max-Eigen statistic 40.01 26.84 15.440.05 critical value 33.87 27.58 21.13Probability value 0.0022 0.2591 0.2729
The estimated cointegration equation shows that there was no residual autocorrelation, the residuals were normally distributed, and the model is stable since the roots of the characteristic autoregressive polynomial have a modulus of less than one. Further, the VECM residuals have no heteroskedasticity and no serial correlation. This means that the selected variables are correctly specified in estimating the REER of the Pula. The estimated VECM speed of adjustment coefficient is -0.2377 (the t-statistic is -2.51), indicating that the REER stabilises at a speed of 23.8 percent every quarter after getting out of equilibrium, and returns to the equilibrium level after about 4 quarters. Table 3 shows the values of the estimated long-run VECM coefficients with corresponding t-statistics and standard errors.
TABLE 3: vECM PARAMETERS
Variable Coefficient Normalised Values
t-statistic Standard error
Constant α0 -2.6435
NFA α1 -0.3818 9.1404 -0.04177
ToT α2 0.1755 -4.017 -0.04369
TNT α3 1.7017 -7.9657 -0.21363
TRO α4 0.1656 -3.0633 -0.05406
INV α5 -1.5197 10.3050 -0.14748
Ect (t-1) -0.2377 -2.5066 0.09483
Regarding the signs of the coefficients, the NFA
coefficient is negative contrary to economic theory and
empirical evidence that suggest a positive coefficient
since higher net foreign assets are expected to
cause a real appreciation of the exchange rate. The
negative sign for Botswana could be due to the high
proportion of central bank foreign assets in NFA,
which do not respond to exchange rate movements.
The effect of improving ToT on real exchange rate
has an expected positive sign. The TNT has a positive
sign as expected because higher productivity in the
domestic tradeable sector causes higher wages and
higher relative price of non-tradeables, leading to
appreciation of the real exchange rate (Mano et al.,
2018). The TRO coefficient is positive as expected,
Assessing the pulA exchAnge rAte Alignment

36
Bank of Botswana
this is because trade liberalisation generally lowers
the domestic price of tradeable goods, thus leading
to depreciation of real exchange rate. The coefficient
for INV is negative as expected, because investment
spending leads to export promotion and an
improvement in the CA balance which correspond
with a depreciation of the exchange rate, (Phillips et
al., 2013).
Chart 11 shows the movements of the actual REER,
the estimated BEER and the PEER. The PEER
exhibits less volatility than the BEER; and on
average, the REER does not deviate much from the
equilibrium PEER.
Chart 12 plots the gap between the PEER and the
actual REER, which is interpreted as the deviation
or the misalignment of the Pula from its long-run
equilibrium.
CHART 11: REER, BEER AND PEER OF THE PULA: 2000 – 2019
CHART 12: THE PULA EXCHANgE RATE MISALIgNMENT (PERCENT): 2000 - 2019

37
Table 4 breaks down the assessment of the
misalignment according to episodes. Maximum
and minimum refer to highest and lowest quarterly
misalignment in each period; for example, in quarter
2 of the year 2000 the exchange rate was undervalued
by 18.8 percent, while in quarter 4 of 2003 the Pula
was overvalued by 7.4 percent (see Chart 12).
TABLE 4: EPISODES OF THE PULA REER MISALIgNMENT Period Outcome Minimum (%) Maximum (%) Average (%)
2000Q1 – 2002Q2 Undervaluation -2.6 -18.8 -10.3
2002Q3 – 2005Q1 Overvaluation 0.7 7.4 3.7
2005Q2 – 2008Q1 Undervaluation -0.2 -4.9 -1.6
2008Q2 – 2011Q2 Overvaluation 1.0 4.8 2.6
2011Q3 – 2018Q3 Undervaluation -0.1 -5.5 -3.1
2018Q4 – 2019Q4 Overvaluation 4.3 1.4 2.7
Note: A negative sign indicates undervaluation of the REER; while a positive sign denotes overvaluation of the REER.
Results show that the Pula was undervalued
between 2000 – 2002, 2005 – 2008, and 2011 –
2018. Episodes of overvaluation are 2002 – 2005,
2008 – 2011 and 2019. These timelines correspond
with REER appreciations of 6.1 percent for 2002Q2
– 2005Q1, 5.1 percent between 2008Q2 – 2011Q2,
and 0.2 percent between 2018Q4 – 2019Q4. At the
end of 2019 the REER was moderately overvalued by
4.3 percent.
6. CONCLUSION AND RECOMMENDATIONS
To strengthen trade competitiveness and promote
diversification, the value of the Pula needs to reflect
changes in the fundamentals. An assessment of
some macroeconomic fundamentals, key indicators
of external stability, indicates that Botswana’s
external position is somewhat weak. An empirical
assessment of the equilibrium Pula real exchange
rate was carried out in this paper, by estimating a
behavioural equilibrium using a VECM approach
over the period 2000 – 2019. The behaviour of the
equilibrium is estimated using the terms of trade,
net foreign assets, trade openness, a ratio of prices
of tradeables to prices of non-tradeables and
investment as a ratio of GDP. A permanent (long-term)
equilibrium was derived from the trend component
of the BEER using an HP filter. A misalignment is
derived from the difference between the actual REER
and the derived long-run equilibrium exchange rate.
The plotted misalignment shows alternating periods
of undervaluation and overvaluation of the Pula
during the study period.
The study indicates that the Pula is moderately
overvalued by about 4 percent. The decrease in non-
mining exports, trade balance deficit and declining
of foreign reserves present a strong signal of an
overvalued currency and weakening international
competitiveness. However, the noted CA deficit
and declining non-mining exports since 2015, are
attributable to losses in production, and therefore
exports, in manufacturing, construction, tourism,
transport, communications and finance and business
services, mainly due to challenges in supply of water
and electricity, declining government expenditure
and, by association, the slowing performance of the
mining sector. Broadly, Botswana imports a wide
range of goods and services for consumption and
production, but the main imports are production
inputs, viz. machinery, electricity, electrical
equipment, fuel and chemicals. As it is, the country
has limited domestic productive capacity and,
therefore, inadequate import substitutability, which
limits the responsiveness of domestic production to
any exchange rate adjustments (depreciation). In the
circumstances, the Government’s industrialisation
strategy focuses on enhancing competitiveness and
capacity of the domestic industry to access export
markets and substitute for imports. On the other
hand, the decrease in foreign exchange reserves is
due to relatively slower growth in exports compared
to imports, indicative of lack of traction of economic
diversification efforts. Moreover, declining reserves
are associated with a decrease (or slower growth)
in diamond and SACU revenues and insufficient
increase in alternative revenue sources nor
expanded domestic resource mobilisation, while the
expenditure path is maintained at expansionary
rates.
The overvaluation of the Pula can also be attributed
to the insufficiency of the rate of crawl to offset the
inflation differentials as well as the higher weight
assigned to the SDR which makes the Pula stronger.
In order to align the value of the Pula to the long-
term equilibrium, the authorities could consider
adjustments of the rate of crawl using the Botswana
forecast inflation, instead of the Bank’s inflation
objective range, or the optimal/threshold level of
inflation (Phetwe, 2016), which can be determined
on a continuous basis. In addition, the weights
assigned to the SDR and the South African rand
could be inappropriate due to unreliable data based
Assessing the pulA exchAnge rAte Alignment

38
Bank of Botswana
on foreign currency sales and purchases (errors and
omissions). This data is also influenced by exchange
rate movements between the Pula and its basket
currencies and does not take into account changes
in exports and imports in terms of volumes and
includes non-trade transactions. Due to the lack of
trade in services data or any other better alternative,
the authorities could consider an equal weighting
between the two Pula basket currencies to avoid
bias. Meanwhile, the 2.87 percent downward rate of
crawl that is being implemented with effect from May
2020, is expected to go a long way in re-aligning the
Pula exchange rate.
REFERENCES
Ajevskis, V., Rimgailaite, R., Rutkaste, U., and
Tkačevs, O. (2014). “The Equilibrium Real
Exchange Rate: Pros and Cons of Different
Approaches with Application to Latvia”. Baltic
Journal of Economics, Latvia. 14:1-2, 101-123.
Ali Abbas, S., Bouhga-Hagbe, J., Fatas, A., Mauro,
M., and Velloso, R.C. (2011). “Fiscal Policy and
Current Account”. International Monetary Fund
Working Paper No. 10/121. Washington DC.
Bank of Botswana, Various Annual Reports, 2000 –
2018.
Bank of Botswana, Monetary Policy Reports, 2018 –
2019.
Bosupeng, M., Dzator, J. and Nadolny, A. (2019).
“Exchange Rate Misalignment and Capital Flight
from Botswana: A Cointegration Approach with
Risk Thresholds”. Journal of Risk and Financial
Management 2019, 12, 101.
Brixiova, Z., Egert, B., and Essid, T. H. (2013). “The
Real Exchange Rate and External Competitiveness
in Egypt, Morocco and Tunisia”. Institute for the
Study of Labor (IZA), Germany.
Carare, A., Schaechter, A., Stone, M., and Zelmer,
M. (2002). “Establishing Initial Conditions in
Support of Inflation Targeting”. IMF Working
Paper, No. 02/102.
Clark, P. B., and MacDonald, R. (1998). “Exchange
Rates and Economic Fundamentals: A
Methodological Comparison of BEERs and
FEERs”. IMF Working Paper No. 67. Washington,
DC.
Comunale, Mariarosaria (2015). “Current Account
and REER Misalignments in Central Eastern EU
Countries: using the Macroeconomic Balance
approach”. Bank of Lithuania.
Deléchat, C., and Gaertner, M. (2008). “Exchange
Rate Assessment in a Resource-Rich Dependent
Economy: The Case of Botswana”. IMF Working
Paper, No. 08/83.
Econsult, Economic Review (2017)
Edwards, Sebastian (1987). “Exchange Controls,
Devaluations and Real Exchange Rates: The
Latin American Experience”. NBER working
paper series, No. 2348.
Eyraud, Luc (2009). “Madagascar: A Competitiveness
and Exchange Rate Assessment”. IMF Working
Paper.
Faruqee, H. (1995), “Long-run Determinants of the
Real Exchange Rate: A Stock-Flow Perspective”.
IMF Staff Papers, Vol. 42(1), pp. 80-107.
Hinkle, L., and Montiel, P. J. (1999). “Exchange Rate
Misalignment: Concepts and Measurement for
Developing Countries”. A World Bank research
publication. Washington, DC.
Iimi, Atsutshi (2006). “Exchange Rate Misalignment:
An Application of the Behavioural Equilibrium
Exchange Rate (BEER) to Botswana”. IMF
Working Paper, No. 06/140.
International Monetary Fund (1998). “Exchange Rate
Assessment, Extensions of the Macroeconomic
Balance Approach”. IMF Occasional Paper No.
167. Washington.
International Monetary Fund (2016). “Methodological
Note on EBA-Lite”. Washington.
International Monetary Fund (2018). “The External
Balance Assessment Methodology: 2018 update”.
IMF Working Paper WP/19/65. Washington.
International Monetary Fund (2020). “2019 Botswana
Article IV Staff Report”. Washington.
Iyke, Bernard N., and Odhiambo, Nicholas M. (2016).
“Modelling long-run equilibrium exchange rate
in Botswana”. Macroeconomics and Finance in
Emerging Market 10: 268–85.
Jongwanich, Juthathip (2009). “Equilibrium Real
Exchange Rate, Misalignment, and Export
39
Performance in Developing Asia”. Asian
Development Bank, Economics Working Paper,
Series No. 151. Manila, Philippines.
Kouladoum, Jean-Claude (2018). “External debts
and real exchange rates in developing countries”.
MPRA Paper No. 88440, Munich Personal RePEc
Archive.
Mano, R. C., Osorio-Buitron, C., Ricci, L., and Vargas,
M. (2018). “The External Balance Assessment
(EBA): Level REER Measure”. International
Monetary Fund, Washington.
Motsumi, G. and Ntwaepelo, K. (2019). “Measurements
of the Real Effective Exchange Rate (REER)”.
Research Bulletin, Bank of Botswana.
Musacchio, Aldo (2012). “Mexico's Financial Crisis of
1994-1995”. Harvard Business School Working
Paper, No. 12–101.
Ncube, Geoffrey (2013). Botswana’s External Sector
Performance: 2007 to 2010. Research Bulletin,
Bank of Botswana.
Palić, I., Dumičić, K., and Šprajaček, P. (2014).
“Measuring Real Exchange Rate Misalignment
in Croatia: Cointegration Approach”. Croatian
Operational Research Review. Zagreb, Croatia.
Pegg, Scott (2010). “Is there a Dutch disease in
Botswana?” Resources Policy 35: 14–19.
Phetwe, Moemedi (2016). “Inflation and Economic
Growth: Estimation of a Threshold Level of
Inflation in Botswana”. Research Bulletin, Bank
of Botswana.
Phillips, S., Catão, L., Ricci, L., Bems, R., Das,
M., Di Giovanni, J., Unsal, D. F., Castillo, M.,
Lee, J., Rodriguez, J., and Vargas, M. (2013).
“The External Balance Assessment (EBA)
Methodology”. IMF Working Paper WP/13/272.
International Monetary Fund. Washington.
Pošta, Vít (2007). “Estimation of the Behavioural
Equilibrium Real Exchange Rate of the Czech
Koruna.” IGA University of Economics, Prague,
Czech.
Stein, J. L. (1995). “The Natural Real Exchange Rate
of the United States Dollar and Determinants of
Capital Flows”. (pp. 133–176) in J. Williamson
(editor), Estimating Equilibrium Exchange
Rates, Institute for International Economics,
Washington, DC.
Stein, J. L., and Reynolds, Allen P. (1995).
"Fundamental Determinants of Exchange Rates".
Oxford University Press.
Taye, Haile Kebret (2012). “Is the Botswana Pula
Misaligned?” BIDPA Working Paper No. 33.
Williamson, John, (Editor) (1994). "Estimating
Equilibrium Exchange Rates". Institute for
International Economics. Washington, DC.
Assessing the pulA exchAnge rAte Alignment

40
Bank of Botswana

41
Capital/Financial Flows, Exchange Rate and Monetary Policy in Botswana
Gaone A. Motsumi, Shima K. Sefakonyana and
Tendani Phumusa20
ABSTRACT
Over the years, Botswana has maintained prudent macroeconomic policies and accumulated substantial external reserves arising mainly from the share of export receipts that was due to the government, on, especially the sale of diamonds. This enabled the country to invest in both human and infrastructure development and consequently transitioned from being one of the poorest countries in the world at independence to an upper middle-income country. However, the global financial crisis of 2008/09, and the current COVID-19 global pandemic, have highlighted the vulnerability of the economy to dependence on mineral exports, thus the importance of maintaining external buffers for maintenance of macroeconomic stability. This paper examines some of the key macroeconomic policy choices in Botswana since independence to determine their relevance in the present macroeconomic context, with a particular focus on the current exchange rate policy. It argues for the maintenance of the current exchange rate regime with appropriate modifications to the rate of crawl as circumstances dictate. In the context of weak financial markets, a rush to embrace a flexible exchange rate regime could negatively affect macroeconomic stability because of the inherent volatility of the flexible exchange rate regime.
1. INTRODUCTION
Botswana is a small open mineral-led economy, with total trade accounting for approximately 80 percent of gross domestic product (GDP), while mining output and mineral exports (mainly diamonds) revenue contributes 18.9 percent and 35.7 percent to GDP and government revenue, respectively. In the period prior to the 2008/09 global financial crisis, Botswana has generally recorded positive growth rates which were dominated by mining production; and the overall balance of payments (BoP) was in surplus for most of the years. These, together with the maintenance of prudent macroeconomic policies, enabled
the country to build a considerable amount of external buffers. The Government devoted some financial resources to both human capital and infrastructure development. Consequently, the country transitioned from being one of the poorest countries in the world at independence (1966) to an upper middle-income country by 2004.
Real output growth has however, decelerated since the 2008/09 global financial crisis to an average growth of 4.3 percent in the nine years following the financial crisis compared to 5.3 percent recorded in the ten years prior to the crisis (Chart 1). The overall balance on the BoP has been in deficit for most of the years since the crisis (Chart 2), while external buffers have declined significantly (Chart 3), with foreign exchange reserves falling from a peak of 39 months of import cover in 2001 to a record low of 10.1 months of import cover in December 2020. However, the sharp decline in foreign exchange reserves in 2002 was mainly due to the funding of the Public Officers Pension Fund when Government adopted the Defined Contribution Pension Scheme from the Defined Benefit Pension Scheme. Furthermore, the export sector has been shrinking with exports as a proportion of GDP declining from an average of 61 percent in 1997 to 27 percent in December 2020 (Chart 4). This is despite the Government’s efforts aimed at diversifying the economy over the years as reflected in several government policy documents, such as the Privatisation Policy of 2000, Economic Diversification Drive (2010), Master Plans of 2005 and 2012-2017, Citizen Economic Empowerment Policy (2012) and the Revised Industrialisation Policy (2014). Economic diversification efforts/initiatives have so far been illusive with only limited economic transformation taking place. The 2006 Bank of Botswana Annual Report indicates that, “while Botswana’s overall output growth has been buoyant over the past four decades, the economy remains undiversified as it is dominated by the mining sector, which is the main influence on annual output growth rates.”
20 Principal Economist and Economists from the International Finance and Trade Unit, Research and Financial Stability Department. The views expressed in this paper are those of the authors and do not necessarily reflect those of the Bank of Botswana.
cApitAl/finAnciAl flows, exchAnge rAte AnD monetAry policy in BotswAnA

42
Bank of Botswana
This paper examines some key developments of the current macroeconomic policies to determine the relevance of these policy choices, with particular focus on the exchange rate policy. The rest of the paper is organised as follows: Section 2 deals with some of Botswana’s macroeconomic policies since independence, their evolution, successes and failures. Section 3 addresses the question of monetary autonomy; Section 4 discusses the relevance of the current exchange rate framework, while Section 5 provides some concluding remarks.
2. BOTSwANA’S MACROECONOMIC POLICIES
(a) Exchange Controls and Capital Flows
Botswana introduced exchange controls immediately after obtaining monetary
independence and the national currency, the Pula in 1976. Before independence, the country operated under South African exchange controls. According to Kganetsano (2007), Botswana was allowed, under the IMF’s Articles of Association, to impose restrictions on current and capital account transactions. Furthermore, Hermans (1996), states that under the exchange control regulations and manual, “virtually every kind of transaction involving either payments in foreign exchange or obligations which could result in future claims against Botswana’s foreign exchange reserves, covering capital as well as current transactions, was regulated”. According to Harvey and Jefferis (1995), the introduction of exchange controls in Botswana was based on the premise that “foreign currency should be freely available for current account transactions, so that imports of goods and services were allowed, as were dividend payments to foreign shareholders of domestic businesses and interest payments on foreign loans”. Further,
Source: Bank of Botswana
CHART 1: REAL gDP gROwTH RATES CHART 2: BOTSwANA'S TRADE BALANCE AND OvERALL BALANCE OF PAyMENTS (P MILLION)
CHART 3: FOREIgN EXCHANgE RESERvES (1994-2020)
CHART 4: TOTAL EXPORTS AND IMPORTS (PERCENTAgE OF gDP)
Per
cent
Per
cent
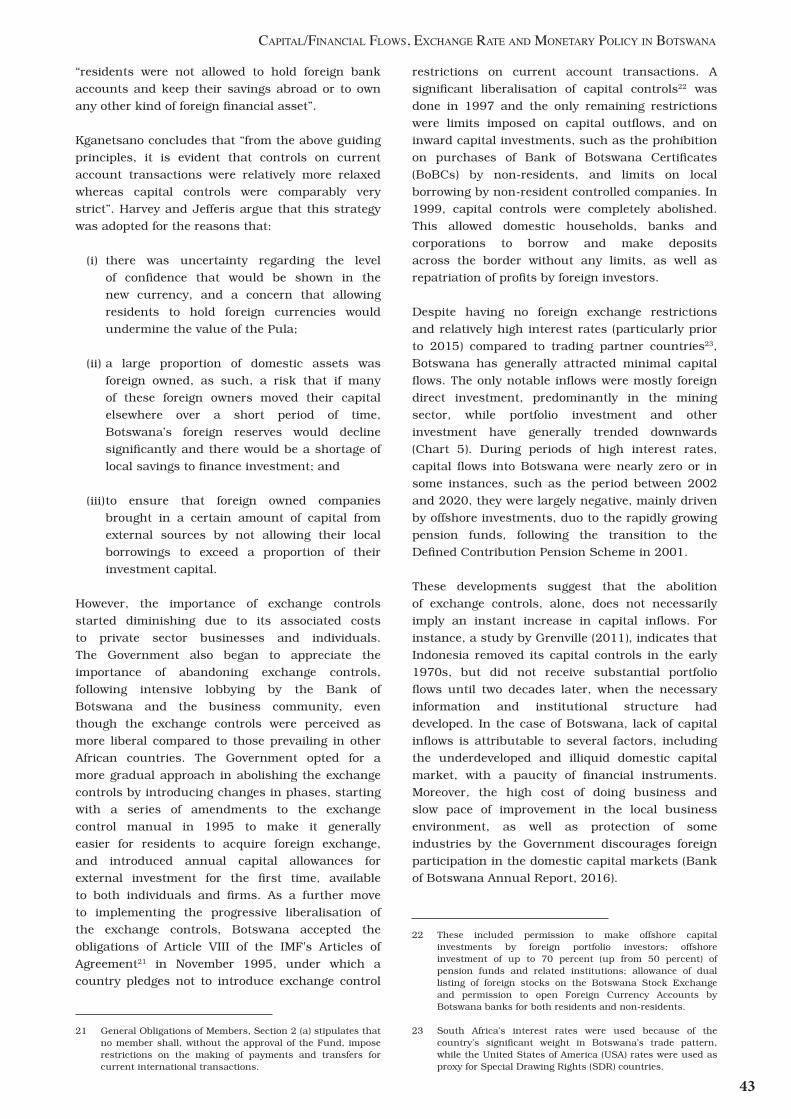
43
“residents were not allowed to hold foreign bank accounts and keep their savings abroad or to own any other kind of foreign financial asset”.
Kganetsano concludes that “from the above guiding principles, it is evident that controls on current account transactions were relatively more relaxed whereas capital controls were comparably very strict”. Harvey and Jefferis argue that this strategy was adopted for the reasons that:
(i) there was uncertainty regarding the level of confidence that would be shown in the new currency, and a concern that allowing residents to hold foreign currencies would undermine the value of the Pula;
(ii) a large proportion of domestic assets was foreign owned, as such, a risk that if many of these foreign owners moved their capital elsewhere over a short period of time, Botswana’s foreign reserves would decline significantly and there would be a shortage of local savings to finance investment; and
(iii) to ensure that foreign owned companies brought in a certain amount of capital from external sources by not allowing their local borrowings to exceed a proportion of their investment capital.
However, the importance of exchange controls started diminishing due to its associated costs to private sector businesses and individuals. The Government also began to appreciate the importance of abandoning exchange controls, following intensive lobbying by the Bank of Botswana and the business community, even though the exchange controls were perceived as more liberal compared to those prevailing in other African countries. The Government opted for a more gradual approach in abolishing the exchange controls by introducing changes in phases, starting with a series of amendments to the exchange control manual in 1995 to make it generally easier for residents to acquire foreign exchange, and introduced annual capital allowances for external investment for the first time, available to both individuals and firms. As a further move to implementing the progressive liberalisation of the exchange controls, Botswana accepted the obligations of Article VIII of the IMF's Articles of Agreement21 in November 1995, under which a country pledges not to introduce exchange control
restrictions on current account transactions. A significant liberalisation of capital controls22 was done in 1997 and the only remaining restrictions were limits imposed on capital outflows, and on inward capital investments, such as the prohibition on purchases of Bank of Botswana Certificates (BoBCs) by non-residents, and limits on local borrowing by non-resident controlled companies. In 1999, capital controls were completely abolished. This allowed domestic households, banks and corporations to borrow and make deposits across the border without any limits, as well as repatriation of profits by foreign investors.
Despite having no foreign exchange restrictions and relatively high interest rates (particularly prior to 2015) compared to trading partner countries23, Botswana has generally attracted minimal capital flows. The only notable inflows were mostly foreign direct investment, predominantly in the mining sector, while portfolio investment and other investment have generally trended downwards (Chart 5). During periods of high interest rates, capital flows into Botswana were nearly zero or in some instances, such as the period between 2002 and 2020, they were largely negative, mainly driven by offshore investments, duo to the rapidly growing pension funds, following the transition to the Defined Contribution Pension Scheme in 2001.
These developments suggest that the abolition of exchange controls, alone, does not necessarily imply an instant increase in capital inflows. For instance, a study by Grenville (2011), indicates that Indonesia removed its capital controls in the early 1970s, but did not receive substantial portfolio flows until two decades later, when the necessary information and institutional structure had developed. In the case of Botswana, lack of capital inflows is attributable to several factors, including the underdeveloped and illiquid domestic capital market, with a paucity of financial instruments. Moreover, the high cost of doing business and slow pace of improvement in the local business environment, as well as protection of some industries by the Government discourages foreign participation in the domestic capital markets (Bank of Botswana Annual Report, 2016).
21 General Obligations of Members, Section 2 (a) stipulates that no member shall, without the approval of the Fund, impose restrictions on the making of payments and transfers for current international transactions.
22 These included permission to make offshore capital investments by foreign portfolio investors; offshore investment of up to 70 percent (up from 50 percent) of pension funds and related institutions; allowance of dual listing of foreign stocks on the Botswana Stock Exchange and permission to open Foreign Currency Accounts by Botswana banks for both residents and non-residents.
23 South Africa’s interest rates were used because of the country’s significant weight in Botswana’s trade pattern, while the United States of America (USA) rates were used as proxy for Special Drawing Rights (SDR) countries.
cApitAl/finAnciAl flows, exchAnge rAte AnD monetAry policy in BotswAnA
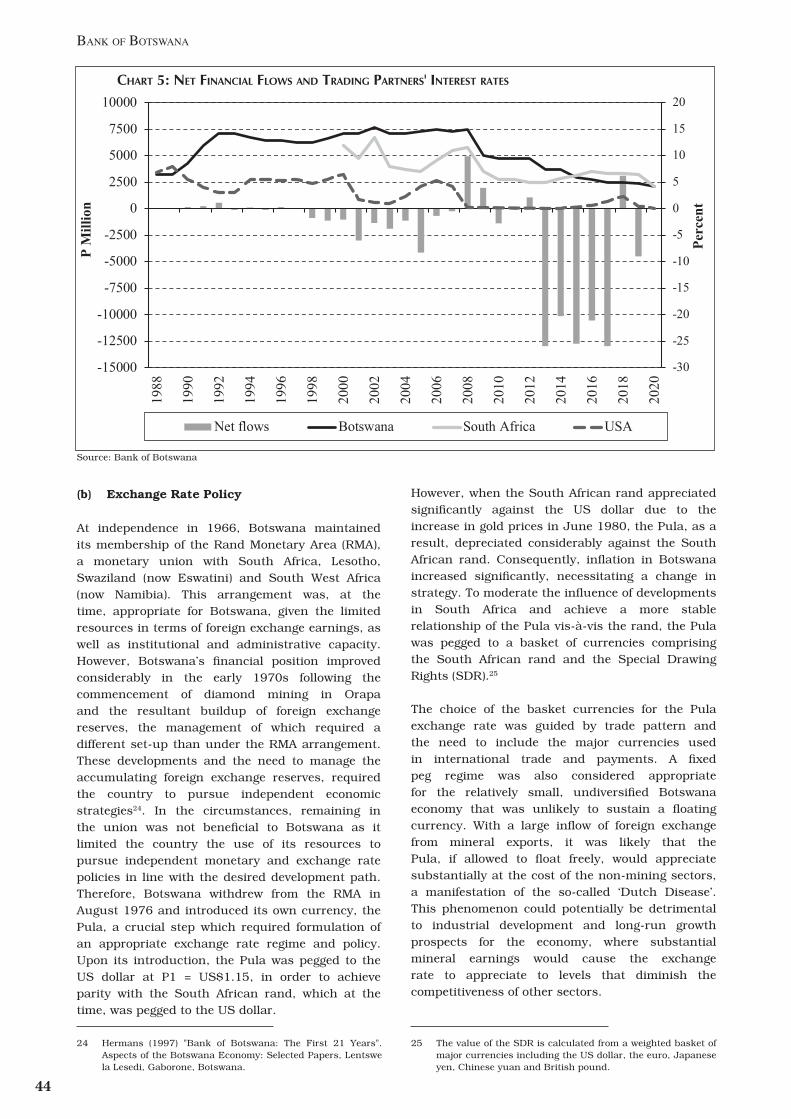
44
Bank of Botswana
CHART 5: NET FINANCIAL FLOwS AND TRADINg PARTNERS' INTEREST RATES
Source: Bank of Botswana
(b) Exchange Rate Policy
At independence in 1966, Botswana maintained its membership of the Rand Monetary Area (RMA), a monetary union with South Africa, Lesotho, Swaziland (now Eswatini) and South West Africa (now Namibia). This arrangement was, at the time, appropriate for Botswana, given the limited resources in terms of foreign exchange earnings, as well as institutional and administrative capacity. However, Botswana’s financial position improved considerably in the early 1970s following the commencement of diamond mining in Orapa and the resultant buildup of foreign exchange reserves, the management of which required a different set-up than under the RMA arrangement. These developments and the need to manage the accumulating foreign exchange reserves, required the country to pursue independent economic strategies24. In the circumstances, remaining in the union was not beneficial to Botswana as it limited the country the use of its resources to pursue independent monetary and exchange rate policies in line with the desired development path. Therefore, Botswana withdrew from the RMA in August 1976 and introduced its own currency, the Pula, a crucial step which required formulation of an appropriate exchange rate regime and policy. Upon its introduction, the Pula was pegged to the US dollar at P1 = US$1.15, in order to achieve parity with the South African rand, which at the time, was pegged to the US dollar.
However, when the South African rand appreciated significantly against the US dollar due to the increase in gold prices in June 1980, the Pula, as a result, depreciated considerably against the South African rand. Consequently, inflation in Botswana increased significantly, necessitating a change in strategy. To moderate the influence of developments in South Africa and achieve a more stable relationship of the Pula vis-à-vis the rand, the Pula was pegged to a basket of currencies comprising the South African rand and the Special Drawing Rights (SDR).25
The choice of the basket currencies for the Pula exchange rate was guided by trade pattern and the need to include the major currencies used in international trade and payments. A fixed peg regime was also considered appropriate for the relatively small, undiversified Botswana economy that was unlikely to sustain a floating currency. With a large inflow of foreign exchange from mineral exports, it was likely that the Pula, if allowed to float freely, would appreciate substantially at the cost of the non-mining sectors, a manifestation of the so-called ‘Dutch Disease’. This phenomenon could potentially be detrimental to industrial development and long-run growth prospects for the economy, where substantial mineral earnings would cause the exchange rate to appreciate to levels that diminish the competitiveness of other sectors.
24 Hermans (1997) "Bank of Botswana: The First 21 Years". Aspects of the Botswana Economy: Selected Papers, Lentswe la Lesedi, Gaborone, Botswana.
25 The value of the SDR is calculated from a weighted basket of major currencies including the US dollar, the euro, Japanese yen, Chinese yuan and British pound.

45
Botswana’s choice of an exchange rate regime was largely consistent with the preference for intermediate exchange rate frameworks by many other developing countries, which capture the positive aspects of the two extremes of fixed and flexible currency arrangements. This exchange rate regime enabled occasional adjustments to the value of the Pula to alternatively support the competitiveness of tradeable goods or the objective of price stability by changing the currency composition of the basket in line with evolving conditions relating to the direction of trade. As a result, the Pula was devalued in 1984, 1985, 1990 and 1991, while it was revalued in 1989. The revaluation was intended to mitigate inflationary pressures as the sharp depreciation of the South African rand against the major currencies led to high inflation in South Africa, and, in turn, an increase in imported inflation into Botswana. In addition to adjusting the value of the Pula, the relative weights were also changed several times to reflect the relevant trade patterns.
While bilateral movements are important, the policy focus was on the composite trade-weighted effective exchange rate, with a desire to attain a stable real effective exchange rate (REER). However, between 1998 and 2005, there was a significant appreciation of the REER, primarily due to higher inflation in Botswana than in trading partner countries on the back of an expansionary fiscal policy, increases in administered prices and the introduction of value added tax in 2002. To reverse the appreciation of the REER, two consecutive devaluations of 7.5 percent and 12 percent were implemented in February 2004 and May 2005, respectively.
Following the May 2005 devaluation and to ensure REER stability going forward without the periodic large and often disruptive discrete adjustment of the nominal exchange rate, a crawling band exchange rate arrangement was introduced, replacing the fixed peg. The annual rate of crawl is determined as the differential between the Bank’s inflation objective and the average forecast inflation for trading partner countries and is implemented through daily small adjustments of the nominal effective exchange rate (NEER). The focus on the inflation objective ensures that monetary policy has a role in combating inflationary pressures and maintaining inflation within the objective range. In turn, the exchange rate arrangement supports the price stability objective by facilitating a continuous, orderly and less inflationary response to changes in economic fundamentals. In contrast, unpredictable large adjustments are less transparent and can result in sharp price increases. There is also the risk of introducing imbalances in the economy and undermining prospects for policy coordination and credibility.
In a move to promote transparency of Botswana’s exchange rate mechanism to enhance credibility of the exchange rate policy and help market participants to make informed decisions, the Government decided to disclose the exchange rate parameters (the rate of crawl and Pula basket weights) in 2013. Therefore, effective 2013, the Ministry of Finance and Economic Development publishes the exchange rate parameters to guide exchange rate policy implementation in the ensuing year.
The current exchange rate regime is considered an improvement relative to the less transparent previous arrangement as it provides some flexibility to absorb real shocks in a mineral based economy that is vulnerable to terms of trade shocks. Furthermore, maintaining stability of the REER and, thereby, promoting Botswana’s external competitiveness as a strategy to diversify the economy from mineral led growth and revenues was considered the most appropriate policy action.
(c) Monetary Policy
The Bank of Botswana’s price stability mandate has largely remained unchanged since the establishment of the Bank in 1975, while the monetary policy framework has evolved over time. In the earlier years, monetary policy approach mainly reflected national policy priorities and development challenges and, as such, was geared towards maintaining low levels of interest rates to promote economic growth26 (Bank of Botswana, 2007). The regulation of interest rates was to avoid excessive credit creation, guard against demand-pull inflation and to encourage the flow of financial resources to the productive sectors of the economy. The interest rate policy was aimed at keeping interest rates low to encourage borrowing and investment, while the rising excess liquidity was absorbed through a call account deposit mechanism at the Bank of Botswana which was open to commercial banks and other large depositors.
The low interest rate policy was abandoned in the late 1980s when it became apparent that it was not effective in influencing investment and aggregate demand. Instead, it was the buoyant mineral export revenues, through government budget, that was instrumental in driving economic activity. This low
26 During National Development Plan (NDP) 5 (1979/80 – 84/85), monetary policy was implemented with a view to support fiscal policies in pursuit of macroeconomic stabilisation. Subsequently, NDP 6 (1985/86 – 90/91) specifically outlined the broad objectives of monetary policy as supporting the balance of payments, maintaining a liberal foreign exchange regime, and avoiding sharp shifts in aggregate demand.
cApitAl/finAnciAl flows, exchAnge rAte AnD monetAry policy in BotswAnA

46
Bank of Botswana
interest rate policy had several unintended negative outcomes. For instance, it led to disintermediation as banks were turning away large deposits despite the good profit margins. The loose monetary policy encouraged borrowing for unproductive projects, while the negative real interest rates rendered control of inflation difficult given the rapid fiscal expansion. Therefore, there was a need to improve the contribution of monetary policy and, consequently, the financial sector to economic performance.
Following a major review of financial development policies and recommendations of the Financial Sector Assessment Programme of 1989, the authorities embarked on financial sector liberalisation which entailed increasing competition in the financial system, deregulation of interest rates in favour of market-determined prices27, reduction and ultimately removal of exchange controls and the use of indirect instruments of monetary policy to sterilise excess liquidity. Therefore, in the 1990s, the Bank introduced several instruments to improve the operations of monetary policy. These included the introduction of short-term Bank of Botswana Certificates (BoBCs) in 1991, as a liquidity management tool to influence short-term market interest rates to be consistent with the monetary policy stance as indicated by the Bank Rate; the Repurchase Agreements and the Secured Lending Facility in 1998, to manage short-term and overnight liquidity fluctuations in the banking system and the annual Monetary Policy Statement (MPS) in 1998 to inform stakeholders about the framework for the formulation and implementation of monetary policy in order to anchor inflation expectations. This evolution of the monetary policy framework from the early 1990s reflected a change in interpretation and understanding of the Bank’s mandate of the policy objective and implementation process.
Although the introduction of BoBCs was successful in managing excess liquidity, monetary policy conduct became very costly to the Bank28 due to the significant amount of excess liquidity that had to be mopped up at relatively high interest rates. Consequently, effective March 2006, only commercial banks were allowed to participate in the BoBCs auctions. The argument was that BoBCs were never meant to be an investment instrument, but rather an instrument of monetary policy for
liquidity management purposes.
Further refinements were implemented in 2008, entailing the adoption of the medium-term inflation forecast as a guide to monetary policy decisions. The Bank specified a medium-term inflation objective range (3 – 6 percent)29 that represents the Bank’s view of price stability. Monetary policy would then respond to deviations from this objective as informed by the medium-term inflation forecasts.
In 2011, the Bank of Botswana decided to cap the amount of outstanding BoBCs at P10 billion, which was subsequently reduced to P5 billion in 2015. The capping of outstanding BoBCs was informed by the need to promote productive deployment of funds and market efficiency, as well as to moderate the cost of liquidity absorption. Additionally, the absorption of residual liquidity through reverse repos was also restricted to 40 percent of market demand. These measures effectively represented an easing of monetary policy through an increase in the amount of loanable funds together with a downward bias of interest rates. With no constraint on the downward momentum of BoBC yields (given unabsorbed excess liquidity), decisions on the policy signalling rate (the Bank Rate) were not anchored to monetary operations, which is essential for transmission of policy to market interest rates. The cap on BoBCs and rationing of reverse repos were lifted in 2016.
The monetary policy framework also recognises the importance of effective monetary policy communication in maintaining transparency, predictability and accountability with respect to the policy framework and actions; thus, fosters market involvement and influences expectations. Since 2017, the Bank publishes the Monetary Policy Committe (MPC) schedule for the year ahead and the Governor delivers a Monetary Policy Statement (MPS) at a press briefing subsequent to each meeting of the MPC to allow for engagement with the media and dissemination of the Bank’s policy stance. Furthermore, in addition to the MPS, the Bank publishes three Monetary Policy Reports (MPRs) to further improve on communication of economic and policy developments. The MPRs
27 From 1976 – 1989, Bank of Botswana had direct regulation of commercial bank interest rates (both lending and deposit rates).
28 In the early 2000s, the demand for the BoBCs increased substantially as investors considered the BoBCs an attractive short-term investment instrument. This was
reflected in non-bank participation in the BoBCs market, which had increased substantially in 2005, where approximately 70 percent of the total outstanding amount of BoBCs of P13 billion were held by non-bank institutions and retail investors.
29 The Bank announced its numeric annual inflation objective range of 4 – 6 percent for the first time in 2002 (adjusted to 4 – 7 percent in 2004). A rolling medium-term (3-year) objective of 3 – 6 percent was introduced in 2006, initially running concurrently with the annual objective (abandoned in mid-2008).

47
provide frequent explanations of current inflation developments and the medium-term forecast to the public; and this helps to communicate the monetary policy stance, anchor inflation expectations and improve the Bank’s transparency and accountability.
The Bank evaluates the monetary policy implementation framework on a regular basis for effectiveness and introduces refinements where necessary. As a result, the Bank introduced measures intended to improve liquidity management, interbank market efficiency and monetary policy transmission. These measures include the introduction of a 7-day BoBC as the main instrument for conducting monetary operations, replacing the 14-day BoBC in April 2019 and the introduction of the Primary Reserve Requirement Averaging (PRRA) in October 2019. Under the PRRA, banks are no longer required to meet their primary reserve requirement on a daily basis but rather as an average level over the one-month maintenance period.
Generally, monetary policy has greatly influenced macroeconomic performance and has been successful in bringing inflation down. Inflation in Botswana has generally trended downwards, with the exception of the period between 1976 and early 1980s, which were the early years of monetary policy formulation in Botswana, therefore the country had less monetary autonomy (Chart 6). In the early 1990s, inflation accelerated due to the rise in domestic fuel prices, lagged effects of the devaluation of the Pula and the widening of the sales tax to cover a range of goods. The introduction of value added tax (VAT) in 2002,
expansionary fiscal policy and increases in administered prices played a role in accelerating inflation in the period between 2002 and 2009. However, following the adoption of a forward-looking monetary policy framework in 2008, improvements to the forecasting framework and the monetary policy communication, as well as enhanced governance structures over the years, price stability has generally been achieved. Inflation declined from a peak of 15.1 percent in August 2008 to around the lower bound of the objective range of 3 – 6 percent since 2015. Inflation averaged 1.9 percent in 2020.
3. THE TRILEMMA FRAMEwORk
With free capital mobility and a fixed exchange rate regime, there has been suggestions that Botswana does not have monetary autonomy, the so-called impossible trinity or trilemma concept as suggested by monetarists Mundell and Fleming (1963). According to the Mundell-Fleming trilemma model, countries have three possible options from which to choose when managing international monetary policy, and these are: (a) setting a fixed currency exchange rate; (b) allowing free capital mobility with no fixed currency exchange rate arrangement and (c) autonomous monetary policy. The model suggests that a country cannot have free capital mobility, a fixed exchange rate regime and monetary autonomy all at the same time, hence the impossible trinity. Instead, a country that opts for free capital mobility and a fixed exchange rate regime, foregoes its monetary autonomy. Thus, a country can only achieve monetary autonomy and free capital mobility if it adopts a flexible exchange rate regime.
Sources: Bank of Botswana and (http://web.pdx.edu/~ito/trilemma_indexes.htm)
CHART 6: BOTSwANA HEADLINE INFLATION AND MONETARy POLICy INDEPENDENCE
cApitAl/finAnciAl flows, exchAnge rAte AnD monetAry policy in BotswAnA
Per
cent
Index

48
Bank of Botswana
The impossible trinity theory captured the attention of many economists leading to a number of studies aimed at testing its validity. For instance, following the collapse of the Bretton Woods system, a number of emerging and developing countries experimented with in-between regimes, raising issues regarding the validity and the relevance of Mundell’s binary choice trilemma. Testing the trilemma paradigm remains a challenge; some economists view the trilemma as just a theory, as most countries are not at the corner options of the trilemma.
Aizenman et al. (2008) outlined new metrics (trilemma indices) for measuring the aspects of the trilemma,30 taking into account substantial international reserve accumulation. The study investigated the degree of exchange rate flexibility, monetary independence and capital account openness for industrialised, emerging and non-emerging countries by calculating indices for each country overtime. Furthermore, Aizenman et al. (2008) complemented the trilemma indices by adding the level of foreign reserves accumulated as a fourth dimension. The evolution of the “trilemma indexes” illustrates that, after the early 1990s, industrialised countries accelerated financial openness, but reduced the extent of monetary independence, while sharply increasing exchange rate stability. In contrast, emerging market countries pursued exchange rate stability as their key priority up to the late 1980s, while non-emerging market developing countries have pursued it throughout the period since 1970. As a stark difference from the latter group of countries, emerging market countries have converged towards intermediate levels of all three indexes, characterising managed flexibility, while retaining some degree of monetary autonomy and accelerating financial openness. This recent trend appears to be sustainable when a country has accumulated a substantial level of international reserves as a buffer that enables it to intervene in foreign exchange markets.
In his presentation at the ‘International Conference on Monetary Policy Frameworks in Developing Countries: Practices and Challenges’, Jefferis (2012), concurred with Aizenman et al (2008). Jefferis (2012), cited the case of Botswana as of particular interest (amongst the Southern African Development Community (SADC) countries reviewed) as the country has been able to combine monetary policy independence, a fair degree of
30 These indices are calculated, updated and published in the http://web.pdx.edu/~ito/trilemma_indexes.htm for 180 countries.
31 Ncube and Mokoti (2020) employed the utility maximisation model and found the optimal level of reserves for Botswana to have averaged 11.9 percent of GDP annually between 1996 and 2018, while excess reserves have averaged 66.4 percent of GDP annually over the same review period. This implies that the country has accumulated far more foreign exchange reserves to smoothen consumption in the case of a crisis. The study also quoted the IMF (2020) study that estimated reserves adequacy for Botswana using a ratio analysis metric that employs a risk-weighted measure of four diverse sources of risk which concluded that reserves of 14 percent to 16 percent of GDP would be adequate for Botswana (reserves stood at 34.1 percent of GDP as at end of Q2 2020).
management over its exchange rate and maintain an open capital account. This is mainly due to the substantial amount of international reserves31
holdings that provides a buffer against output volatility and speculative attacks, thereby allowing for a relaxation of the trilemma constraints. Furthermore, the paper attributes the ability to control money supply and the exchange rate to the unintended constrain in financial integration, brought about by underdeveloped capital markets, thus inhibiting capital mobility. Indeed the evolution of exchange rate framework, from a currency board (as part of the RMA) to the adoption of a more intermediate exchange rate arrangement (the crawling band exchange rate framework) and the slow pace of financial sector development with a paucity of financial instruments has meant that Botswana’s monetary policy autonomy was enhanced over time.
4. RELEvANCE OF THE CURRENT EXCHANgE RATE FRAMEwORk
Botswana has over time managed to maintain a fixed exchange rate regime because of substantial amount of foreign exchange reserves it has accumulated. The reserves enable the country to meet its obligations in foreign exchange and prevent disruptive volatility in the exchange rate. This is particularly important for a country like Botswana. As a small economy, heavily dependent on the export of a few range of resources, the country is vulnerable to economic shocks. This was clearly seen in late 2008 and early 2009 when diamond exports significantly fell due to the global economic slowdown; however, with the reserves as a cushion, imports to the country continued without interruption. This vulnerability necessitates a higher level of reserves being maintained than would be the case in a more diversified economy. A fixed peg regime was considered suitable for the economy of Botswana, which was small and undiversified.
Botswana, with its undiversified economic base, could not have sustained a flexible regime because a surge in capital inflows could have led

49
32 From late 2008, the reserves have decreased significantly due to among others, market revaluation losses, which resulted from the appreciation of the Pula against currencies in which the reserves are held and a drawdown of reserves to meet government obligations.
to a significant appreciation of the Pula, thus, undermining the competitiveness of the non-mining tradeable sector (that is, the Dutch disease phenomenon). However, in recent years, foreign exchange reserves have been dwindling,32 which might make it hard in the future for the country to defend the current exchange rate arrangement. The foreign reserves play an important role in providing a buffer against output volatility and currency speculative attacks and can be used in situations where the economy is faced with shocks.
However, a flexible exchange rate arrangement may not yet be suitable for Botswana since the country’s financial markets are still emerging and the economy is relatively undiversified. In effect, the Dutch disease argument still holds.
5. CONCLUSION AND POLICy RECOMMENDATIONS
The current exchange rate policy has positive attributes which have led to its success. By pegging to a basket of currencies, the economy ensured maintenance of competitiveness of the exchange rate by minimising the volatility of the Pula against major trading partner currencies. The regime embodies transparency and predictability, which have important influence on saving and investment decisions by both locals and foreign investors. Moreover, the exchange rate policy and the choice of a currency peg for the Pula takes a medium to long-term perspective, with a consideration of trade patterns and the fact that, despite short-term fluctuations, currencies generally revert to values that are consistent with economic fundamentals. The policy has a medium to long-term posture that ensures that the exchange rate policy supports broader national policy objectives and is consistent with other macroeconomic policies. The current exchange rate framework also entails flexibility that enables adjustment and maintenance of parameters that support other macroeconomic objectives and effective support for economic activity.
In short, it is being argued that the current exchange rate framework retains its validity and that a more flexible framework will only serve to depress the non-mineral sector of the economy (Dutch disease) in the context of lack of diversification of the economy. Nevertheless, the sustenance of the policy framework is contingent on the maintenance of sufficient levels of foreign
exchange reserves. Moreover, timely adjustments to the crawl rate must continue to be made to avoid undesirable over/undervaluation of the exchange rate and thus promoting external competitiveness and hence macroeconomic stability. REFERENCES
Abiad, A.& Ashoka M., (2005). Financial Reform:
What Shakes It? What Shapes It? American
Economic Review, 95 (1): 66-88
Aizenman, J. (2017, September 4). The new
macroeconomic quadrilemma – Mundell's
trilemma in the era of financial instability. Reserve
Uncertainty and the Supply of International
Credit. Vienna, Austria: Oesterreichische
Nationalbank.
Aizenman, J., Chinn, M., & Ito, H. (2008). Assessing
the Emerging Global Financial Architecture:
Measuring the Trilemma's Configurations over
time. National Bureau of Economic Research
Working Series Paper.
Aizenman, J., Chinn, M., & Ito, H. (2012). The
Impossible Trinity Hypothesis in an Era of Global
Imbalances: Measurement and Testing. Journal
of Economic Literature.
Bank of Botswana. (2001). Annual Report. Gaborone.
Bank of Botswana. (2007). Anuual Report. Gaborone.
Bank of Botswana. (2016). Annual Report. Gaborone.
Bordo, M. D., & Flandreau, M. (2003). Core, Periphery,
Exchange Rate Regimes, and Globalization. In
Globalization in Historical Perspective.
Calvo, G. A., & Reinhart, C. M. (2002). Fear of
Floating. Quarterly Journal of Economics, 379–
408.
Duttagupta, R., Fernandez, G., & Karacadag, C.
(2004). From Fixed to Float: Operational Aspects
of Moving Toward Exchange Rate Flexibility. IMF
Working Paper No: WP/04/126
Duttagupta, R., Fernandez, G., & Karacadag, C.
(2005). Moving to a Flexible Exchange Rate How,
When, and How Fast? IMF Economic Issues No:
38.
Forssbæcka, J., & Oxelheim, L. (2005). On the Link
between Exchange-Rate Regimes and Monetary-
cApitAl/finAnciAl flows, exchAnge rAte AnD monetAry policy in BotswAnA

50
Bank of Botswana
Policy Autonomy: The European Experience.
THE RESEARCH INSTITUTE OF INDUSTRIAL
ECONOMICS, Working Paper No. 637.
Gaetsewe, T., Kapunda, S. M., & Motlaleng, G.
(2015). An Econometric Approach to Exchange
Control Liberalization and Economic Growth: The
Case of Botswana. African Journal of Economic
Review, Volume III, Issue I, 54-71.
Grenville, S. (2011). The Impossible Trinity and
Capital Flows in East Asia. ADBI Working Paper
Series No 319.
Harvey C. and Jefferis, K. R. (1995) "Botswana's
Exchange Controls: Abolition or Liberalisation?",
DevelopmeW Ecowmic Review, Volume 13, 277 -
305 (Blackwell Publishers)
Herman, H.C.L. (1997). Bank of Botswana: The First
21 Years. Aspects of the Botswana Economy:
Selected Papers, Lentswe la Lesedi, Gaborone,
Botswana.
Hsing, Y. (2013). Monetary Autonomy under Different
Exchange Rate Regimes in the Long-Run - The
Case of Seven EU Countries. Theoretical and
Applied Economics, Volume XX (2013), No.
5(582),, 27-32.
Jefferis, K. (1997). Exchange Control Liberalization
in Aspects of the Botswana Economy: Selected
Papers (pp. 503-528). Gaborone: Lentswe la
Lesedi.
Jefferis, K. (2012). Exchange Rate Policy and
Monetary Policy Implementation. International
Conference on Monetary Policy Frameworks in
Developing Countries: Practices and Challenges.
Kikali: International Growth Centre.
Kose, A. M., Prasad, E. S., & Taylor, A. D. (2009).
Thresholds in the Process of International
Financial Integration. National Bureau of
Economic Research.
Lybek, T. (2004). Central Bank Autonomy,
Accountability, and Governance: Conceptual
Framework. IMF Working Papers.
Mundell, R. and Fleming, M.J. (1963). Capital
Mobility and Stabilization Policy under Fixed and
and Flexible Exchange Rates. Canadian Journal
of Economics and Political Science, Vol: 29, 475-
485.
Ncube, G., & Mokoti, T. (2020). Assesing Foreign
Exchange Reserves Adequacy – The Case of
Botswana. Bank of Botswana Special Research
Bulletin (Unpublished).
Őtker-Robe, I., & Vávra, D. (2007). Moving to
Greater Exchange rate Flexibility Operational
Aspects based on Lessons from Detailed Country
Experiences. IMF Occasional Paper No 256
Patnaik, I., & Shah, A. (2010). Asia Confronts the
Impossible Trinity. ADBI Working Paper Series.
Pruski, J., & Szpunar, P. (2008). Capital flows and
their implications for monetary and financial
stability: the experience of Poland. BIS Papers No
44, 403-421.
Summers, L. (2000). International Financial Crises:
Causes, Prevention, and Cures. American
Economic Review.
51
NOTES

52
Bank of Botswana
NOTES

53
NOTES

54
Bank of Botswana
NOTES


56
Bank of Botswana