Embed Size (px)
Citation preview

Developmental Cell, Volume 36
Supplemental Information
The Specification of Geometric Edges by a Plant
Rab GTPase Is an Essential Cell-Patterning
Principle During Organogenesis in Arabidopsis
Charlotte Kirchhelle, Cheung-Ming Chow, Camille Foucart, Helia Neto, York-DieterStierhof, Monika Kalde, Carol Walton, Mark Fricker, Richard S. Smith, AntoineJérusalem, Niloufer Irani, and Ian Moore
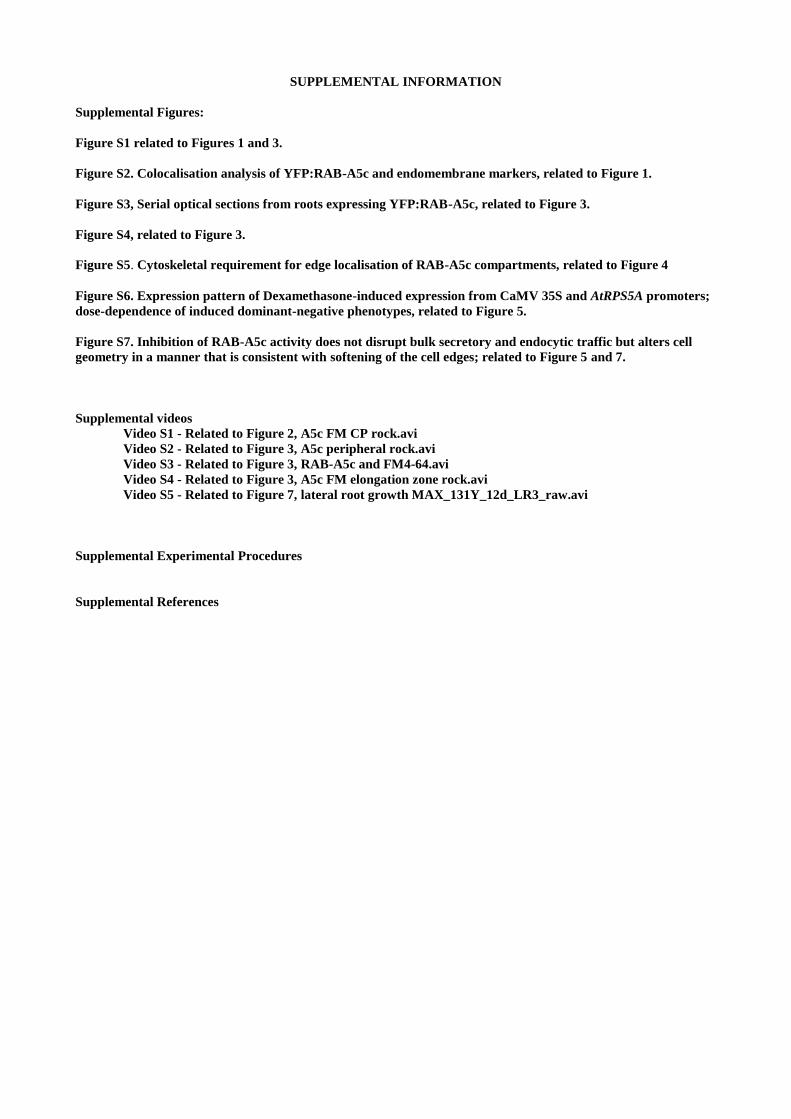
SUPPLEMENTAL INFORMATION
Supplemental Figures:
Figure S1 related to Figures 1 and 3.
Figure S2. Colocalisation analysis of YFP:RAB-A5c and endomembrane markers, related to Figure 1.
Figure S3, Serial optical sections from roots expressing YFP:RAB-A5c, related to Figure 3.
Figure S4, related to Figure 3.
Figure S5. Cytoskeletal requirement for edge localisation of RAB-A5c compartments, related to Figure 4
Figure S6. Expression pattern of Dexamethasone-induced expression from CaMV 35S and AtRPS5A promoters;
dose-dependence of induced dominant-negative phenotypes, related to Figure 5.
Figure S7. Inhibition of RAB-A5c activity does not disrupt bulk secretory and endocytic traffic but alters cell
geometry in a manner that is consistent with softening of the cell edges; related to Figure 5 and 7.
Supplemental videos
Video S1 - Related to Figure 2, A5c FM CP rock.avi
Video S2 - Related to Figure 3, A5c peripheral rock.avi
Video S3 - Related to Figure 3, RAB-A5c and FM4-64.avi
Video S4 - Related to Figure 3, A5c FM elongation zone rock.avi
Video S5 - Related to Figure 7, lateral root growth MAX_131Y_12d_LR3_raw.avi
Supplemental Experimental Procedures
Supplemental References
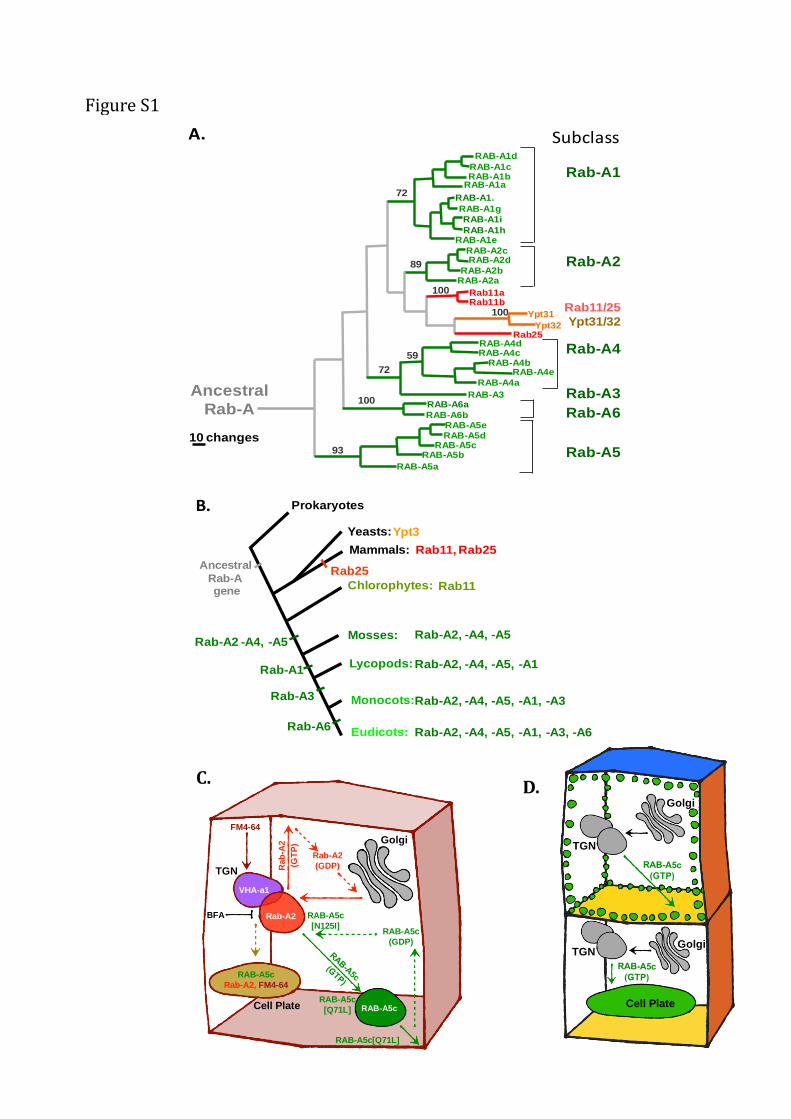
Figure S1
RAB-A4dRAB-A4c
RAB-A4bRAB-A4e
RAB-A4a
RAB-A3
RAB-A5eRAB-A5d
RAB-A5cRAB-A5b
RAB-A5a
RAB-A6a
RAB-A6b
99
72
59
100
93
68
RAB-A1cRAB-A1b
RAB-A1a
RAB-A1.
RAB-A1g
RAB-A1i
RAB-A1h RAB-A1e
72
RAB-A1d
RAB-A2cRAB-A2d
RAB-A2bRAB-A2a
Rab11aRab11b
89
100
100
Rab25
Ypt31
Ypt32
Rab-A1
Rab-A2
Rab-A4
Rab-A3
Rab-A5
Rab-A6
Ancestral
Rab-A
Rab11/25
Ypt31/32
A. Subclass
10 changes
Rab11Chlorophytes:
Rab-A2, -A4, -A5, -A1Lycopods:
Rab11, Rab25Mammals:
Rab-A2, -A4, -A5, -A1, -A3Monocots:
Eudicots: Rab-A2, -A4, -A5, -A1, -A3, -A6
Yeasts:Ypt3
Rab-A3
Rab-A6
Rab25
Prokaryotes
Rab-A2 -A4, -A5Mosses: Rab-A2, -A4, -A5
Ancestral
Rab-A gene
Rab-A1
B.
C.
Golgi
VHA-a1
TGN
Cell Plate
Rab-A2
Rab-A2
(GDP)
RAB-A5c
Rab-A2, FM4-64
RAB-A5c
RAB-A5c
(GDP)
RAB-A5c
[N125I]
RAB-A5c
[Q71L]
RAB-A5c[Q71L]
Rab
-A2
(GT
P)
FM4-64
BFA
Golgi
Cell Plate
Golgi
TGN
TGN
D.

Figure S1 related to Figure 1s and 3.
(A) Rab-A clade in Arabidopsis (green) humans (red) and Saccharomyces cerevisiae (brown) modified from
(Rutherford and Moore, 2002). Maximum parsimony tree showing bootstrap values (1000 replicates) above 50%.
Individual Rab subclasses exhibit characteristic amino sequences in particular regions that contribute to the interaction
specificity of each subclass (Moore et al., 1995; Pereira-Leal and Seabra, 2000; Itzen and Goody, 2011). (B) Schematic
diagram showing the apparent progressive elaboration of Rab-A subclasses in the angiosperm lineage based on Rab
sequences in Chlamydomonas reinhardtii (chlorophyte), Physcomitrella patens (moss), Selaginalla moellendorffii
(lycopod), Oryza sativa (monocot), and Arabidopsis thaliana (eudicot). Based on analysis in M. Elias,
(http://asn.genomics.purdue.edu/mediawiki/index.php/Ras_superfamily_GTPases) and (Elias et al., 2012). (C)
Schematic diagram of RAB-A5c cycle inferred from the localisation of wild-type and mutant proteins in the presence
and absence of Brefeldin A (BFA). The TGN, which has distinct Rab-A2 and VHA-a1 domains, is the earliest site of
accumulation of internalised FM4-64 and is the steady state location of the Rab-A2 subclass which cycles between the
Golgi and the PM (Chow et al., 2008). In contrast RAB-A5c is recruited to the TGN and cycles to RAB-A5c
compartments which exclude FM4-64. At steady state wild-type RAB-A5c is found predominantly on distinct RAB-
A5c compartments but a minor proportion resides at the TGN. RAB-A5c [N125I], which has reduced nucleotide-
binding capacity and is expected to interact strongly with the nucleotide exchange factor, is located exclusively at the
TGN suggesting that wild-type RAB-A5c is initially recruited to this location from the cytosol (dashed arrow).
Conversely, RAB-A5c[Q71L] which is expected to exhibit reduced GTP hydrolysis and to recycle slowly off the
membrane, labels the PM in addition to the RAB-A5c compartments but does not label the TGN. Thus RAB-A5c
compartments are likely to be the steady-state location of active GTP-bound RAB-A5c and are likely to reside on an
anterograde pathway to the PM. As wild-type RAB-A5c is not detected at the PM, we propose that it recycles back to
the cytoplasm (dashed arrow) before or shortly after fusion with the PM. Brefeldin A traps RAB-A5c with other TGN
markers in BFA bodies. In dividing cells, RAB-A5c and Rab-A2 but not VHA-a1 (Chow et al., 2008; Dettmer et al.,
2006) relocate to the cell plate. (D). Schematic representation of AtRAB-A5c distribution in dividing (lower) and non-
dividing (upper) meristematic cells, indicating that edge localisation of the A5c-compartments represents an additional
spatial domain that is distinct from the facial apical/basal/lateral polarity at the PM (indicated by coloured faces) that
has been described previously (Langowski et al., 2010).

YFP-RABA2d GFP-BP80 GFP+YFP
YFP:RAB-A5c GFP:BP80 GFP+YFP Merge
YFP:RAB-A5c N-ST-GFP Merge
VHA-a1-GFPYFP:RAB-A5c Merge
Figure S2
mCh:RAB-A2a
A mCH:RAB-A2a MergeYFP:RAB-A5c
B
C
D
VHA-a1-GFPYFP:RAB-A5c [N125I] Merge
F
GFP+YFP+PI Merge
Anti-KNOLLEMerge+ DAPI
E
GAnti-RAB-A5c
0
0.01
0.02
0.03
0.04
0.05
0.06
0.07
0.08
1 8
15
22
29
36
43
50
57
64
71
78
85
92
YFP-RabA5c
Mitochondria
Re
lati
ve
in
ten
sit
y
Pixels from cell periphery
H
B
I

Figure S2. Colocalisation analysis of YFP:RAB-A5c and endomembrane markers, related to Figure 1.
(A) Individual channels from the image shown in Figure 1 (E); arrows, faint labelling of TGN; arrowheads stronger
labelling of independent structures at the periphery. (B) YFP:RAB-A5c (red) does not colocalise with Golgi (green)
labelled by N-ST-GFP. (C) YFP:RAB-A5c (red) does not colocalise with PVC labelled by BP80:GFP (arrows) but both
markers faintly label the TGN (arrowheads); cell wall labelled by Propidium iodide (PI, blue) shows that structures
labelled most strongly by YFP:RAB-A5c are peripheral. (D) uncropped version of image shown in Figure 1J. (E)
endogenous RAB-A5c colocalises with KNOLLE in BFA bodies of mitotic cells indicated by arrowheads. (F)
Brefeldin-A treated root tips showing that YFP:RAB-A5c[N125I] also colocalises with the TGN marker VHA-a1:GFP
in BFA bodies. (G) YFP:RAB-A5c labels cell plates in dividing cells of a young primary leaf. (H, I) Quantification of
the distribution of YFP:RAB-A5c and mitochondria relative to the cell periphery from images such as those in (I)
acquired from the outer periclinal region of epidermal cells whose cell walls were labelled with propidium iodide; data
points are mean YFP or mitotracker fluorescence ± SD. Scale bars = 10 µm, except G = 20µm and B = 5 µm.

Figure S3, Serial optical sections from roots expressing YFP:RAB-A5c, related to Figure 3. Complete confocal image series shown in Figure 3B,C. Scale bars, 10µm.
1mm 2mm 3mm 4mm
5mm 6mm 7mm 8mm
9mm 10mm 11mm 12mm
13mm 14mm 15mm 16mm
1mm 2mm 3mm 4mm 5mm 6mm 7mm 8mm 9mm 10mm 11mm
Figure S3
B
A

Figure S4, related to Figure 3.
Figure S4
C D E
1µm 1µm 1µm
YFP:RAB-A5c (live imaging)
YFP:RAB-A5cNIAnti-RAB-A5c
Col-0 Anti-RAB-A5c
10 µm
F G H
20 µm
20 µm
A
B
YFP:RAB-A5c RFP:NPSN12 merge
YFP:RAB-A5c RFP:NPSN12 merge
exon 1 exon 2FP
RPFP RPI
500
300400
200100
rab-a5c H2OCol-0 rab-a5c H2OCol-0
RAB-A5cGAPDHJ KCol-0rab-a5c H2O Col-0rab-a5c H2O
FP+RP FP+SAIL_LB1 1500
1000
750

(A,B) Maximum intensity projections of exemplary confocal stacks used for quantitative analysis in Figure 3D of lateral
roots expressing YFP:RAB-A5c and YFP-NPSN12 in the absence (A) and presence (B) of BFA. (C-E) uncropped
versions of images shown in Figure 3E and insets. (I-K) Characterisation of the rab-5c loss-of-function line
SAIL_119_B07 used in Figure 3I. (I) Schematic overview of the AtRAB-A5c locus showing the positions of forward
(FP and reverse (RP) primers used for genotyping (blue) and semi-quantitative RT-PCR (green) and the T-DNA
insertion site of SAIL_119_B07 (red triangle). (J) Confirmation of the SAIL_119_B07 insertion site by genotyping
PCR. (K) Semi-quantitative RT-PCR confirming SAIL_119_B07 is a rab-a5c RNA knock-out line. Left: GAPDH
(positive control), right: RAB-A5c.

Figure S5. Cytoskeletal requirement for edge localisation of RAB-A5c compartments, related to Figure 4
(A) images from a time-series showing mitochondria (mitotracker, blue) cell wall (propidium iodide, red), and
YFP:RAB-A5c (green); arrows and arrowheads are at the same position in each image. (B) average movement of RAB-
A5c compartments and mitochondria at central (c) or peripheral (p) positions (in contact with or overlapping the cell
wall); error bars are SE of average movement in time series of 36 to 62 seconds from 3 different roots. (C) mCherry
tagged RAB-A5c (mCH:RAB-A5c) localises to cell edges in lateral roots of the clasp1 mutant.
0 0.02 0.04 0.06 0.08
Mit (C)
Mit (P)
RAB-A5c (P)
mm.s-1
d eB
Figure S5
0s 24s
A
mCh:RAB-A5c
clasp-1
C
10 mm

Figure S6. Expression pattern of Dexamethasone-induced expression from CaMV 35S and AtRPS5A promoters;
dose-dependence of induced dominant-negative phenotypes, related to Figure 5.
Figure S6
AtRPS5A>Dex>N125I
x YFP:NPSN12YFP:NPSN12Dex
20 µM
1 µM
100 nM
50 nM
0 nM
(DMSO)
50µm
D
0
2
4
6
8
10
12
14
DMSO 1 nM Dex 5 nM Dex 10 nM Dex 50 nM Dex 100 nM Dex 500 nM Dex 1 µM Dex 5 µM Dex 10 µM Dex
Pri
mar
y R
oo
t Le
ngt
h (
mm
)
Wild Type RAB-A5cNI 1 (ho) RAB-A5cNI 2 (ho)
E
A
B
C

(A) In the pOp/LhGR system, expression pattern is determined by the promoter that transcribes the LhGR Dex-
responsive transcription factor LhGR (Craft et al., 2005). The target promoter, pOp, simultaneously directs transcription
of the gene of interest and a uidA (GUS) reporter which can be used to monitor the strength and tissue pattern of
induced expression. (B,C) GUS activity in primary root tips (bottom panels) and successive lateral roots from
transgenic seedlings with Dex-inducible transgene expression controlled by CaMV 35S (B) or AtRPS5A (C) promoters,
24h after transfer to 20μM Dex. Histochemical staining was for 1h at room temperature to emphasise tissue specificity;
longer staining times revealed GUS activity in all tissues with both promoters. Images in C are from one of the two
Dex-inducible lines expressing RAB-A5c[N125I] and used in Figures 5-7. (D) Surface-rendered projections of confocal
image series of YFP fluorescence in lateral roots expressing YFP:NPSN12 (left) or YFP:NPSN12 and RAB-
A5c[N125I] (right) 48h after seedlings were transferred to medium containing the indicated concentrations of Dex. (E)
Primary root length of seedlings germinated and grown for 5 days on medium containing the indicated concentrations of
Dex; white bars, untransformed plants; grey and black bars, two independent transgenic lines expressing RAB-
A5c[N125I] under control of the AtRPS5A promoter; error bars are SD, n= 13 to 22 root length measurements made
with ImageJ from photographs acquired with a Nikon D300 camera using Qcapture software. All transgenes were
homozygous.

Figure S7. Inhibition of RAB-A5c activity does not disrupt bulk secretory and endocytic traffic but alters cell
geometry in a manner that is consistent with softening of the cell edges; related to Figure 5.
0.0 1.25 2.50.625 1.975 0.0 0.5 1.00.25 0.75
Displacement (µm) Maximum principal
stress (relative units)
Figure S71
0x
stiffe
r3
x stiffe
runifo
rm3
x so
fte
r1
0x
so
fte
rM
orp
ho
log
y
A B
C D
DMSO Dex
G
H
DMSO Dex
NM
E
F
YFP:NPSN12
YFP:NPSN12
N125I Dex
J
DMSO
IWild type
RAB-A5cNI L
K

(A-D) 2D Finite Element model of an idealised transverse section through a lateral root epidermis to test the effect
on radial cell geometry and stress distribution within the cell wall of selective stiffening reduction or increase at an edge
domain localised at the intersection of anticlinal and outer periclinal walls. (A,B) Morphology of the uninflated model
with the edge domain shown in red. We tested a smaller edge domain extending 0.5µm into all walls from the
intersection (left) and large edge domain extending 1.0µm into all walls from the intersection (right). (C) Effect of
selective stiffening reduction or increase at the edge domain on cell geometry (heatmap showing spatial displacement
compared to uninflated state, A). Note that stiffness reduction at the edge domain has a strong effect on overall cell
geometry. (D) Effect of selective stiffness reduction and increase at the edge domain on maximum principal stress
distribution in the wall. Note that maximum stress is concentrated at the edge domain when the stiffness of the edges is
equal to or greater than that at the faces, but is relocalised to the cell faces when the stiffness of the edge domain is
reduced.
(E-F) Cross-section through lateral roots shown in Figure 7 after 48h in the absence (E) or presence (F) of RAB-
A5cNI. Images are screenshots from MorphographX showing the segmented 3D mesh. Note the substantial swelling in
the radial direction.
(G-N) Analysis of endomembrane marker distribution in lateral roots expressing RAB-A5c[N125I]. The primary
function of RAB-A5c is likely to be in regulation of intracellular membrane traffic between the TGN and the PM at cell
edges. The loss of cell shape in plants expressing RAB-A5c[N125I] may have resulted either from inhibition of default
membrane traffic to the PM, resulting in non-specific loss of wall integrity and tensile strength, or from perturbation of
a more specific cell patterning principle associated with cell edges. Therefore we examined a number of markers of
default secretory or endocytic membrane traffic and found that all appeared to traffic normally even in severely
misshapen cells after several days on Dex. (G,H) confocal optical sections of the PM marker YFP:NPSN12 in lateral
roots with (B) or without (A) Dex-induced expression of RAB-A5c[N125I] under control of the AtRPS5A promoter;
YFP:NPSN12 continues to be trafficked to the PM without additional accumulation in cytoplasmic vesicles. (I-L)
confocal optical sections of membrane trafficking markers in lateral roots in the absence (DMSO) or presence (Dex) of
RAB-A5c[N125I] under control of the CaMV 35S promoter; (I,J) PIN2:GFP continues to reside at the PM without
additional accumulation in cytoplasmic vesicles; (K,L), nlsRFPmyc-2A-secGFP (Samalova et al., 2006) a ratiometric
soluble secretory marker, secGFP (green), expressed stoichiometrically with nuclear mRFP1 (red) in fully elongated
cells; no additional accumulation of secGFP is detected in cells expressing RAB-A5c[N125I]. (M,N) YFP:NPSN12
(green) and FM4-64 (red) after treatment with Brefeldin A; arrowheads, BFA-bodies containing both markers indicating
that each marker could be internalised and trafficked to the TGN which responded normally to BFA treatment despite
the severely perturbed cell geometry. Arrows, incomplete or misplaced cell walls. Scale bars: E,F, 5µm, G-J,M,N,
10μm; K,L, 20μm.

Supplemental Video Legends
Video S1 - related to Figure 2.
Animated series of projections calculated from confocal z-series from the medial region of root epidermal cells
expressing YFP:RAB-A5c (green) and stained with FM4-64 (red). The central cell shows strong accumulation of
YFP:RAB-A5c at the early cell plate.
Video S2 – related to Figure 3.
Animated series of calculated maximum projections of YFP-RAB-A5c in the young lateral root show in Figure 3L.
Scale bar 10µm.
Video S3 – related to Figure 3.
Animated series of calculated maximum projections of YFP-RAB-A5c (Green) and FM4-64 (Red) in the young lateral
root cells shown in Figure 3C. FM4-64 labels the plasma membrane and TGN. Scale bar 10µm.
Video S4 – related to Figure 3.
Animated series of calculated maximum projections of YFP-RAB-A5c (green) and FM4-64 (red) in the elongation zone
of the lateral root shown in Figure 3M. FM4-64 labels the plasma membrane and TGN. Scale bar 10µm.
Video S5 – related to Figure 7.
4D imaging of lateral root development. Series of maximum intensity projections of confocal z-series from a lateral root
expressing NPSN12-YFP. Series of confocal optical sections on the z-axis were acquired at 30min intervals over 24h in
imaging chambers (see figure 7A). Scale bar 50 µm.

Supplemental Experimental Procedures
Plant material and growth conditions.
These were as described previously (Chow et al., 2008). Lateral roots were imaged from seedlings after 10-12 days in
the growth chamber on vertically oriented agar plates. For Dex induction, seedlings were either germinated on medium
containing Dex diluted from a 100mM stock in DMSO (equivalent volume of DMSO was added to controls) or were
germinated and grown for 5 days in the absence of Dex to allow lateral root development and then transferred to
medium with Dex or DMSO for between 2 and 14 days. Plants were transferred to fresh Dex-containing medium every
7 days. For observation of root hair phenotypes, plants were grown on media solidified 0.7% phytagel rather than agar.
Seeds for clasp-1 and were obtained from the Nottingham Arabidopsis Stock Centre and crossed to fluorescent marker
lines. Seeds expressing GFP:CLASP under its native promoter in a clasp-1 background (Ambrose et al., 2011) were
provided by Prof. G. Wasteneys, University of British Columbia, Canada. The SAIL_119_B07 line carrying a T-DNA
insertion in the first exon of AtRAB-A5c (At2g43130; ARA4) was identified using the T-DNA express Arabidopsis
Gene Mapping Tool (http://signal.salk.edu/cgi-bin/tdnaexpress) and seeds were obtained from the Nottingham
Arabidopsis stock Centre. The insertion was confirmed using the following primer combinations for genotyping PCRs:
5’-GATGGAATTAATTTCATGCGC-3’ (FP) and 5’- CAGTAATGATGAATCTTTGGTGC-3’ (RP) for the wild-type,
and 5’-GATGGAATTAATTTCATGCGC-3’ (FP) and 5’-GCCTTTTCAGAAATGGATAAATAGCCTTGCTTCC-3’
(SAIL_LB1) for the T_DNA insertion. Semi-quantitative PCR was used to confirm RNA knock-out using the following
primers for RAB-A5c: 5’-CATGCTCATCGACGGCAAAG-3’ (FP) and 5’-TATCGTAGACGACGAGGGCT-3’ (RP)
and the following primers for the GAPDH: 5’-CACTTGAAGGGTGGTGCTAAA-3’ and 5’-
AGAGGAGCAAGGCAGTTAGTG-3’.
Plasmid cloning.
All plasmids used for plant transformation were constructed twice independently. To construct 5’A5c-YFP:RAB-A5c-
A5c3’, a 4766bp fragment encompassing the promoter and 5’UTR of RAB-A5c (At2g43130; ARA4) was amplified
from genomic DNA of Arabidopsis thaliana Col-0 as described previously (Chow et al., 2008), using primers 5’-
CTTCTTCTTCGATCGTTTCATGTACCCTCCTAATTCC-3’ and 5’-
CTTCTTGGTACCTTCTCCTTCTTCTTCTTCTCTG-3’. The coding sequence, including intron, and 1027bp
downstream were similarly amplified using 5’-
AACAAGGGCGCGCCTGGAGCAGGAATGTCAGACGACGACGAGAG-3’ and 5’-
AACAAGGGCGCGCCGAAAGAACTAATAATCACCAC-3’ (AscI sites and start codon underlined). These PCR
products were used to generate in-frame fusions to YFP Venus (Nagai et al., 2002) in a binary T-DNA vector to
generate pBIN-proA5c-YFP:RAB-A5c and used to generate transgenic Arabidopsis plants exactly as described
previously for RAB-A2a (Chow et al., 2008). For Dex-inducible expression of RAB-A5c, its coding sequence and
intron were re-amplified from pBIN-proA5c-YFP:RAB-A5c using primer 1 (5’-
ACGCGTCGACCTCGAGTGGCGCGCCTGGAGCAGGAATG-3’; SalI and AscI sites and start codon underlined)
and primer 2 (5’-ACGGGGTACCGGCGCGCCGAAAGAACTAATAATC-3’; KpnI and AscI sites underlined). Mutant
sequences encoding the Q71L and N125I substitutions were generated by overlapping PCR using primers 1 and 2 with
either primers 5’-ACCGCAGGCCTGGAACGCTTCCGCGCCGTTAC-3’ and 5’-
TTCCAGGCCTGCGGTATCCCAAATCTGAGCTTTG-3’ (Q71L) or primers 5’-
TTGGGATCAAATGTGATCTAGAGAGCATAAGAGCGGTGAG-3’ and 5’-
CTCTAGATCACATTTGATCCCAATAAGCATTTTTGCTAC-3’ (N125I). Amplified products were cloned into the
pOp/LhGR inducible expression vector pH-TOP and used to transform Arabidopsis thaliana driver line 4C-S5/7 (Craft
et al., 2005). Mutant sequences were also used to replace the wild-type RAB-A5c coding sequence in pBIN-proA5c-
YFP:RAB-A5c using SalI and KpnI to generate fluorescent fusions with the mutant proteins. Wild-type and mutant
sequences were also re-amplified with GATEWAY™ attB1 and attB2 recombination sites and introduced via BP and
LR recombination reactions into destination vector pOpOn2.1 (L. Camacho and I. Moore, unpublished) and used to
transform wild-type Arabidopsis thaliana Col-0. pOpOn2.1 is a derivative of pOpOff2(Kan) (Wielopolska et al., 2005)
and allows Dex-inducible expression from a single T-DNA. We also used pOpIn2 (C. Canales-Holzeis, and I. Moore,
unpublished) which is a derivative of pOpOn2.1 in which the CaMV 35S promoter that transcribes LhGR is replaced by
the AtRPS5A promoter. To construct mCherry (Shaner et al., 2004) fusions the RAB-A5c promoter and YFP venus
sequence of pBIN-proA5c-YFP:RAB-A5c was replaced by CaMV 35S promoter fragment using SbfI and BamHI sites.
The 35S-RAB-A5c fragment was isolated as a SbfI-ClaI fragment, inserted into the PstI and Cla sites of pBluescript
(stratagene) reisolated using SmaI and SalI and inserted into the EclI36II and SalI sites of binary vector pVKH18 (Craft
et al., 2005). mCherry with N-terminal StrepII and HA tags (Vijayakumar and Moore, unpublished) was amplified
using primers 5’-CATGGGATCCGCTAGTTGGAGCCACCCGCAG-3’ and 5’-
GATAGGATCCCTTGTACAGCTCGTCCATGCC-3’ (BamHI sites underlined) and inserted at the BamHI site
between CaMV 35S and RAB-A5c to give pVKH-35S-mCh:RAB-A5c. The RAB-A5c sequence was removed with
AscI and replaced with an AscI fragment from from pBIN-proA2a-YFP:RAB-A2a (Chow et al., 2008) encompassing
RAB-A2a plus 1.2kb downstream to give pVKH-35S-mCH:RAB-A2a. Both plasmids were used to generate
hygromycin resistant transformants in Col-0 and 5’A5c-YFP:RAB-A5c-A5c3’ backgrounds.

Microscopy.
GFP:CLASP and YFP:RAB-A5c were imaged using Leica SP5 configured to reproduce previously described excitation
and acquisition parameters for these fluorophores (Chow et al., 2008) followed by channel-based bleed-through
correction using Leica LAS software and single fluorophore controls. Other confocal images of immunofluorescence
and fluorescent proteins either singly, in combination, or in conjunction with fluorescent dyes were acquired on a Zeiss
LSM510 META or Leica SP5 as described previously (Chow et al., 2008). Settings for mCherry were those described
previously for mRFP1. Fluorescent dyes were used as described (Chow et al., 2008) and images were acquired from
lateral roots longer than approximately 50µm as younger roots were recalcitrant to staining. Basic image analysis and
processing was performed either in ImageJ or with Zeiss AIM software: brightness or contrast were adjusted with the
Contr tool; image planes parallel to tissue layers were calculated from z-series using the Cut tool; object tracking was
done manually using the measurement tool in the Overlay menu to calculate distance travelled in successive images
with x-axis drift in one image series measured from a fixed reference in the cell wall using the same tool and subtracted
from the distance data for each object. Immunoelectron microscopy was performed on ultrathin thawed cryosections of
formaldehyde-fixed (8%, 2-3 h) and PVP/sucrose-infiltrated seedling root tips and young lateral roots using anti-GFP
polyclonal antisera (1:300; #TP401, Torrey Pines Biolab Inc., East Orange, USA) and silver enhanced (HQ Silver, 8
min; Nanoprobes, Stony Brook, NY, USA) 1nm-gold-labelled secondary antibodies (Nanogold #2004; Nanoprobes) as
previously described (Dettmer et al., 2006). Vesicle diameters were calculated as means of longest and shortest
diameter.
3D Quantification of YFP-RAB-A5c at cell edges.
Confocal stacks of lateral roots coexpressing YFP:RAB-A5c and RFP:NPSN12 were acquired either with or without 1h
treatment with 10µm BFA, which caused relocalisation of YFP:RAB-A5c from cell edges to BFA bodies that were
dispersed throughout the cytoplasm. Stacks were converted from the Leica lif format into single channel TIF stacks
using ImageJ and imported into MorphoGraphX. 2.5D Segmentation in MorphoGraphX (Barbier de Reuille et al., 2014;
Barbier de Reuille et al., 2015) was performed as follows: RFP:NPSN12 TIF image stacks were filtered using Gaussian
Blur with a radius of 0.3 μm. The organ contour was extracted using Edge Detect with a threshold between 4000 and
8000 and adjusted to follow the raw signal as closely as possible using the Fill Holes tool. A mesh following the organ
surface was generated using the Marching Cubes Surface Algorithm at a cube spacing of 5 μm. The mesh was
subsequently smoothed and refined by subdivision. Final meshes had between 500,000 and 700,000 vertices. The
RFP:NPSN12 signal was projected onto the surface, meristematic cells were identified, seeded manually, and the mesh
was segmented using a Watershed Segmentation algorithm. Segmentation errors were corrected manually. After
segmentation was completed, the YFP:RAB-A5c stack was imported into MorphoGraphX and projected onto the
surface in three different sections: 0-2 µm from the surface, 2-4µm from the surface, and 4-6µm from the surface.
Absolute signal intensity and area size was measured for 0-1µm border region, a 0-2 µm border region, and the interior
in each section. Intensities per volume were calculated for a 0-1µm border, 1-2µm border ( by substraction of 0-1 µm
border values for signal intensity and area from the 0-2µm border values) and the interior. The resulting values were
normalised against mean intensity in the total examined volume for each cell to calculate relative enrichment.
Chambers for long-term 4D confocal imaging Imaging chambers adapted from (Littlejohn and Love, 2012) were constructed by gluing two 1 mm-thick strips of glass
across a microscope slide approximately 45 mm apart. Between the glass strips, a gasket of identical height was
fashioned out of gas-permeant Carolina Gel (Blades Biological Ltd., Cowden Edenbridge, UK). A 1 mm-thick slab of
agar-solidified medium with appropriate supplements was placed into the centre of the gasket with 2-4 mm clearance all
round. The gasket was filled with air equilibrated perfluorodecalin (F2 Chemicals Ltd., Lea Town, UK) and one or
more seedlings were placed onto the agar slab with the cotyledons and hypocotyl hanging over the edge, and a coverslip
applied to close the chamber and fixed with micropore tape (3M).
Long-term 4D confocal imaging of lateral root development. 7d old seedlings (homozygous F3) grown under long day conditions on MS, 1% Sucrose, 0.8% agar plates were
transferred into imaging chambers on 1.5% agar, ½ MS, 1% Sucrose, 20μM Dex slabs, and imaged at 0h, 24h, 48h,
72h. Between imaging chambers were returned to long day conditions (horizontal). Roots were routinely imaged using
HCX PL APO CS 20x/0.7 IMM UV lens on a Leica SP5. Images were acquired in z-series at a resolution of 2000x700
at 16 bit depth. Voxel size was 0.259x0.259x0.988 μm. Lateral roots were imaged using identical settings at
consecutive time points. Higher resolution images were acquired using HCX PL APO 63x/1.2 NA lens on Leica SP 5.
For single optical sections, stacks were re-sliced parallel to the root surface using ImageJ (using 1 pixel spacing
avoiding interpolation). For 4D analysis of cell growth, stacks were converted from the Leica lif format into TIF stacks
using ImageJ and imported into MorphoGraphX. 3D Segmentation in MorphoGraphX (Barbier de Reuille et al., 2014;
Barbier de Reuille et al., 2015) was performed as follows: TIF image stacks of lateral roots were filtered using Gaussian
Blur with a radius of 0.3 μm and segmented using the ITK Autoseeded Watershed with a threshold between 800 and
1200. Segmented stacks were manually corrected for over-segmentation errors using a combination of the “Color
picker” and “Bucket” tools. Meshes were generated using the Marching Cubes Algorithm at a cube spacing of 1 μm.
For consecutive time points, meshes of the same cells were identified and manually labeled using the “Grab label from

other surface” tool. When cells had divided, all daughter cells were marked with the parental label.
Drug treatments
Drugs were prepared as stocks in DMSO and applied for 1 hour in water to lateral roots of 9- to 10-day-old seedlings.
Brefeldin A (Sigma-Aldrich) was applied at 10, 25 or 50µm from a 50mM stock, Latrunculin B (Sigma-Aldrich) at
1µM from a 2.5mM stock, Cytochalasin D (Sigma-Aldrich) at 5µm from a 2mM stock, and oryzalin (Supelco) at 10
µM from a 50mM stock. Only roots greater than 50µm in length were imaged as younger lateral roots were recalcitrant
to drug treatments as indicated by controls expressing GFP:MAP4 and GFP:FABD2.
2D Finite Element Model
Our experimental data showed substantial radial swelling in cells in the presence of RAB-A5cNI. While such changes
in geometry could easily be accounted for by changes in cell wall properties at cell faces, it is less clear how a
mechanism acting at the geometric edges of cells could lead the observed cellular phenotypes. We therefore set out to
explore qualitative responses to selective changes at an edge domain at the intersection of anticlinal and outer periclinal
walls of cells under turgor pressure in silico. The 2D Finite Element simulations were run in Abaqus 6.14 Standard
(SIMULIA, see http://abaqus.software.polimi.it/v6.14/index.html for documentation). Idealised cell geometries and cell
wall thickness were based on published data (Dyson et al., 2014). We modelled a transverse section of a lateral root
epidermis with 24 cells in total. The diameter of the modelled root is 100µm, the anticlinal wall length is 10µm, and
each wall is 0.2µm thick. A fillet with a radius of 0.5µm was added at the intersection between anticlinal and outer
periclinal walls to eliminate the sharp 90° angle between anticlinal and periclinal walls resulting in a geometry more
similar to real cells (Dyson et al., 2014). Two different sizes of the edge domain were tested in the model: for the small
size, a T-section extending 0.5µm in all directions from the intersection was defined as the edge; for the large size, a T-
section extending 1.0µm in all directions from the intersection was defined as the edge. Our reasoning for choosing
these sizes was that we wanted to explore the effect that a more or less precisely defined edge domain made in our
model; we selected a 1.0µm edge domain because we measured a significant enrichment of YFP-RAB-A5c in this
border area (Figure 3D) and a 0.5µm area because this is twice the mean distance from PM to distal edge of RAB-A5c
compartments in EM images. The remainder of the walls were defined as cell faces. Both faces and edges were assigned
linear elastic isotropic material properties. Walls were assumed to be quasi-incompressible with a Poisson’s ratio of
0.45 (a Poisson’s ratio of 0.5 was avoided to avoid numerical artifacts) and an elastic modulus of 5x10⁸ Pa. We
uniformly pressurized the cell interior with a turgor pressure of 5 bar. The internal periclinal walls were fully
constrained. The material was meshed with 70,292 linear quadrilateral elements (C2D4R) and tested for spatial
convergence. To explore the influence of mechanical properties at the cell edge on cell geometry and on the distribution
of stresses within the wall, the elastic modulus at the cell edges was varied between 10-fold larger to 10-fold lower than
the elastic modulus at cell faces. For all models, we calculated spatial displacement, van Mises stresses, and Maximum
Principal stresses. van Mises stresses and Maximum Principal stresses were qualitatively very similar but, owing to
space constraints, since von Mises stress is a measure of shearing whereas the wall approximates a membrane, we show
only Max Principal stresses.

Supplemental References
Ambrose, C., Allard, J.F., Cytrynbaum, E.N., and Wasteneys, G.O. (2011). A CLASP-modulated cell edge barrier
mechanism drives cell-wide cortical microtubule organization in Arabidopsis. Nat Commun 2, 430.
Chow, C.M., Neto, H., Foucart, C., and Moore, I. (2008). Rab-A2 and Rab-A3 GTPases define a trans-golgi endosomal
membrane domain in Arabidopsis that contributes substantially to the cell plate. Plant Cell 20, 101-123.
Craft, J., Samalova, M., Baroux, C., Townley, H., Martinez, A., Jepson, I., Tsiantis, M., and Moore, I. (2005). New
pOp/LhG4 vectors for stringent glucocorticoid-dependent transgene expression in Arabidopsis. Plant J 41, 899-918.
Dettmer, J., Hong-Hermesdorf, A., Stierhof, Y.D., and Schumacher, K. (2006). Vacuolar H+-ATPase activity is
required for Endocytic and secretory trafficking in Arabidopsis. Plant Cell 18, 715-730.
Dyson, R.J., Vizcay-Barrena, G., Band, L.R., Fernandes, A.N., French, A.P., Fozard, J.A., Hodgman, T.C., Kenobi, K.,
Pridmore, T.P., Stout, M., et al. (2014). Mechanical modelling quantifies the functional importance of outer tissue
layers during root elongation and bending. New Phytologist 202, 1212-1222.
Elias, M., Brighouse, A., Gabernet-Castello, C., Field, M.C., and Dacks, J.B. (2012). Sculpting the endomembrane
system in deep time: high resolution phylogenetics of Rab GTPases. Journal of Cell Science 125, 2500-2508.
Itzen, A., and Goody, R.S. (2011) GTPases involved in vesicular tafficking: structures and mechanisms. Seminars Cell
and Dev. Biol. 22, 48-56.
Littlejohn, G.R., and Love, J. (2012). A simple method for imaging Arabidopsis leaves using perfluorodecalin as an
infiltrative imaging medium. J Vis Exp.
Moore, I., Schell, J., and Palme, K. (1995) Subclass-specific sequence motifs identified in Rab GTPases. Trends
Biochem. Sci. 20, 10-12.
Pereira-Leal, J.B., and Seabra, M.C. (2000). The mammalian Rab family of small GTPases: Definition of family and
subfamily sequence motifs suggests a mechanism for functional specificity in the Ras superfamily. Journal of Molecular
Biology 301, 1077-1087.
Nagai, T., Ibata, K., Park, E.S., Kubota, M., Mikoshiba, K., and Miyawaki, A. (2002). A variant of yellow fluorescent
protein with fast and efficient maturation for cell-biological applications. Nature Biotechnology 20, 87-90.
Rutherford, S., and Moore, I. (2002). The Arabidopsis Rab GTPase family: another enigma variation. Curr Opin Plant
Biol 5, 518-528.
Samalova, M., Fricker, M., and Moore, I. (2006). Ratiometric fluorescence-imaging assays of plant membrane traffic
using polyproteins. Traffic 7, 1701-1723.
Shaner, N.C., Campbell, R.E., Steinbach, P.A., Giepmans, B.N.G., Palmer, A.E., and Tsien, R.Y. (2004). Improved
monomeric red, orange and yellow fluorescent proteins derived from Discosoma sp red fluorescent protein. Nature
Biotechnology 22, 1567-1572.
Ueda, T., Anai, T., Tsukaya, H., Hirata, A., and Uchimiya, H. (1996). Characterization and subcellular localization of a
small GTP-binding protein (Ara-4) fromArabidopsis: conditional expression under control of the promoter of the gene
for heat-shock protein HSP81-1. Molec Gen Genet 250, 533-539.
Wielopolska, A., Townley, H., Moore, I., Waterhouse, P., and Helliwell, C. (2005). A high-throughput inducible RNAi
vector for plants. Plant Biotechnology Journal 3, 583-590.