Embed Size (px)
Citation preview

The SPRINT Protocol for Tight Glycaemic
Control Geoffrey M Shaw, J. Geoffrey Chase, Xing-Wei Wong, Thomas
Lotz, Jessica Lin, Aaron LeCompte, Timothy Lonergan, Michael
Willacy and Christopher E. HannDept of Intensive Care Christchurch Hospital and Dept of Medicine CSM&HS University of Otago, NZDept of Mechanical Engineering, Centre for Bio-Engineering, Universiity of Canterbury, NZ

Tight glucose control
Hyperglycaemia is prevalent in critical care
Impaired endogenous insulin production
Increased effective insulin resistance
Average blood glucose values > 10mmol/L not uncommon in some critical care units (over length of stay)
Stress of condition induces hyperglycaemia
Tight control better outcomes:
Reduced mortality
Reduced length of stay and length of mechanical ventilation


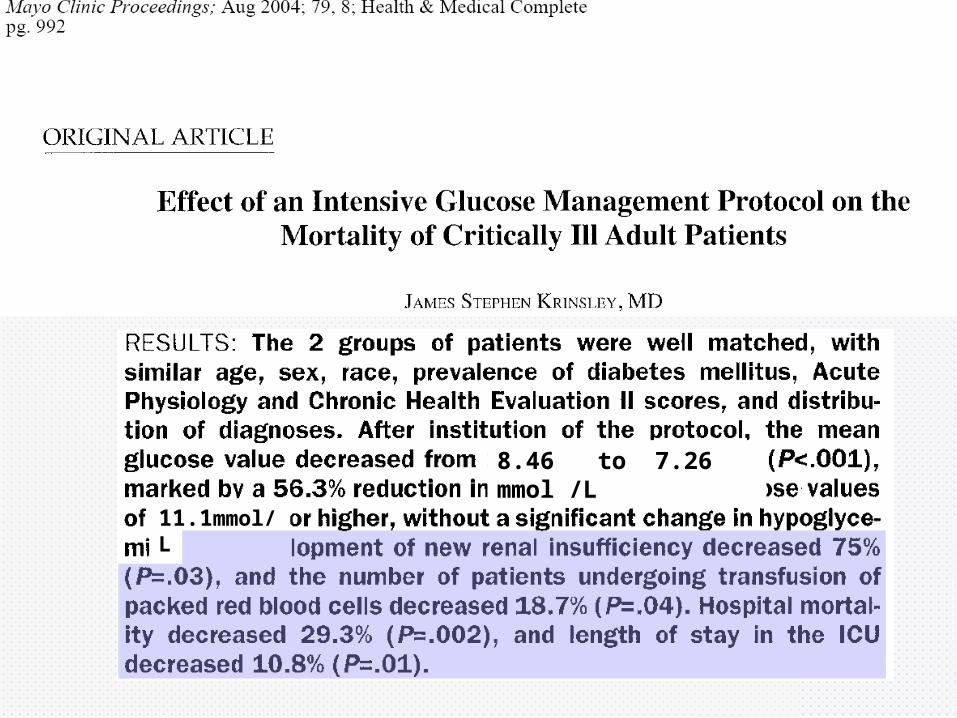
8.46 to 7.26 mmol /L
11.1mmol/L

et al

All patients
LOS >3days

Oxidative stress
Vanhorebeek I. De Vos R, Mesotten D, Wouters P, De Wolf-Peeters C, Van den Berghe G, Protection of hepatocyte mitochondrial ultrastructure and function by strict blood glucose control with insulin in critically ill patients. Lancet 2005;365:53-59
Post-mortem liver biopsies from 20 patientsIntensive insulin (11) vs Conventional treatment (9)
Hypertrophic mitochondria with an increased number of abnormal and irregular cristae and reduced matrix electron density were observed in 7 of 9 conventionally treated patients. Only 1 of 11 patients given intensive insulin treatment had these morphological abnormalities (p=0·005).

Liver: poor glycaemic control
Liver: tight glycaemic control
Skeletal Muscle
Skeletal Muscle

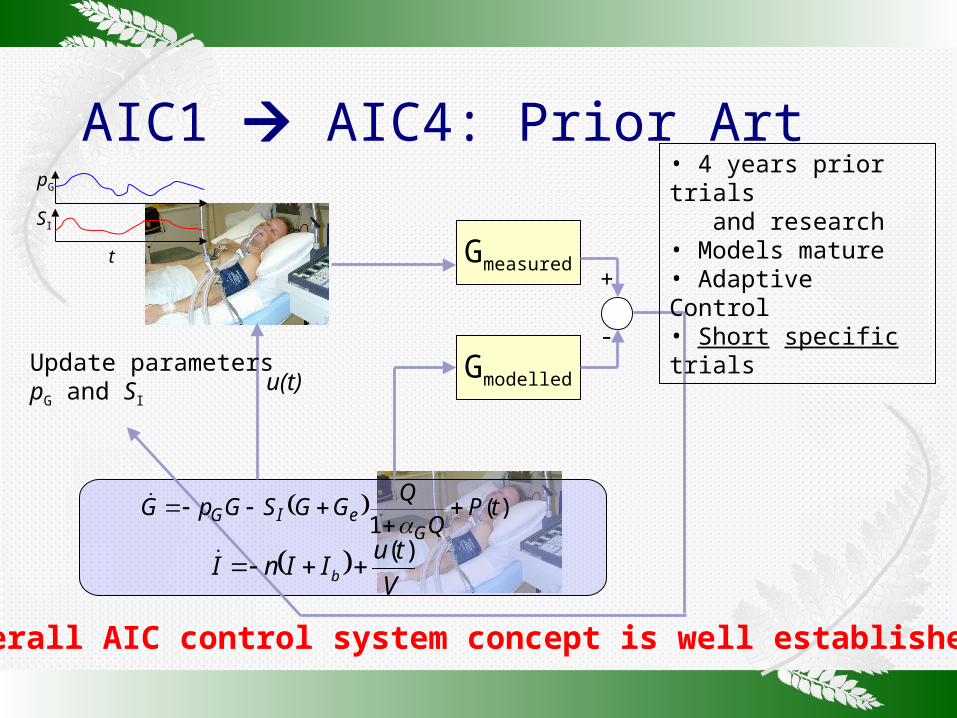
AIC1 AIC4: Prior Art
u(t)
Gmeasured
Gmodelled
+
-Update parameterspG and SI
pG
SI
t
• 4 years prior trials and research• Models mature• Adaptive Control• Short specific trials
Overall AIC control system concept is well established
)(1
tPQ
QGGSGpG
GeIG
V
tuIInI b
)(

)(1
tPQ
QGGSGpG
GeIG
The only ways to reduce glucose levels are:
increase insulin (Q) which saturates decrease feed (P)
Glucose = GInsulin = QFeed = P

Insulin-only (AIC3) control of a patient
Dextrose feed and Insulin input
Time (minutes)
Tight control target = 4-6 mmol/l
Insulin bolusesFeed rate
Glucose level mmol/l

Insulin-feed (AIC4) control of a patient
Time (minutes)
Dextrose feed and Insulin input
Tight control target = 4-6 mmol/l
Glucose level mmol/l
Feed rate Insulin boluses

Patient 5 = textbook case
Wong, XW, Chase, JG, Shaw, GM, Hann, CE, Lotz, T, Lin, J, Singh-Levett, I, Hollingsworth, L, Wong, OS and Andreassen, S (2006). “Model Predictive Glycaemic Regulation in Critical Illness using Insulin and Nutrition Input: a Pilot Study,” Medical Engineering and Physics, In Press

SPRINT Specialised Relative Insulin and Nutrition Table
Optimises both insulin and nutrition rates to control glycaemic levels
Developed through extensive computer simulationEnsures safe protocol before clinical implementation
Simple interface for ease of use by nursing staff
Combines the very tight control of computerised simulations with minimal implementation cost (no bedside computer required…)

SPRINT Step 1 = Feed Rate Table
Requires current glucose measurement and last hour change in glucose

SPRINT Step 2 = Insulin Table
If feed rate = 0 use only insulin wheel
Requires current glucose measurement, last hour change and last hours insulin bolus

Patient 5008
• Time = 163 hours• Mean = 5.4 mmol/L• 4-6.1 = 85%• 4-7.75 = 97%• Avg Feed = 85%• Avg Insulin = 3.4 U/hr
Lonergan, T, LeCompte, A, Willacy, M, Chase, JG, Shaw, GM, Wong, XW, Lotz, T, Lin, J, and Hann, CE (2006). “A Simple Insulin-Nutrition Protocol for Tight Glycemic Control in Critical Illness: Development and Protocol Comparison,” Diabetes Technology & Therapeutics (DT&T), In Press

0
5
10
15
Ease of Use Quality Suitability
Num
ber
of r
espo
nden
ts
Very Good
Good
Satisfactory
Poor
Nursing survey: SPRINT
Results

0
1000
2000
<4 4 to 6 6 to 8 8 to 10 10 to 12 12 to 15 15 to 20 20 plus
Blood glucose [mmol/L]
Num
ber
of
mea
sure
men
ts
2005
0
500
1000
1500
<4 4 to 6 6 to 8 8 to 10 10 to 12 12 to 15 15 to 20 20 plus
Blood glucose [mmol/L]
Num
ber
of
mea
sure
men
ts
2003
16,063 hours of control on SPRINT; 11,249 measurements
118 admissions
Average APAPCHE II score = 21 (41% risk of death)
Too low (hypoglycaemia)Too low (hypoglycaemia)
Too high(hyperglycaemia)Too high(hyperglycaemia)
2003 Retrospective Data (Doran, 2004)Mean Glucose = 8.1Lognormal = outliers to high side
2003 Retrospective Data (Doran, 2004)Mean Glucose = 8.1Lognormal = outliers to high side
SPRINTSPRINT
0
1000
2000
3000
<3 3 to4
4 to5
5 to6
6 to7
7 to8
8 to9
9 to10
10 to11
11 to12
12 to13
13 to15
15 to17
18 to20
20plus
Num
ber
of
mea
sure
men
ts
Reduction in incidence of high blood glucoseReduction in incidence of high blood glucose
Results
Mean
Mean
Normal distribution -- 90% in desired bandNormal distribution -- 90% in desired band
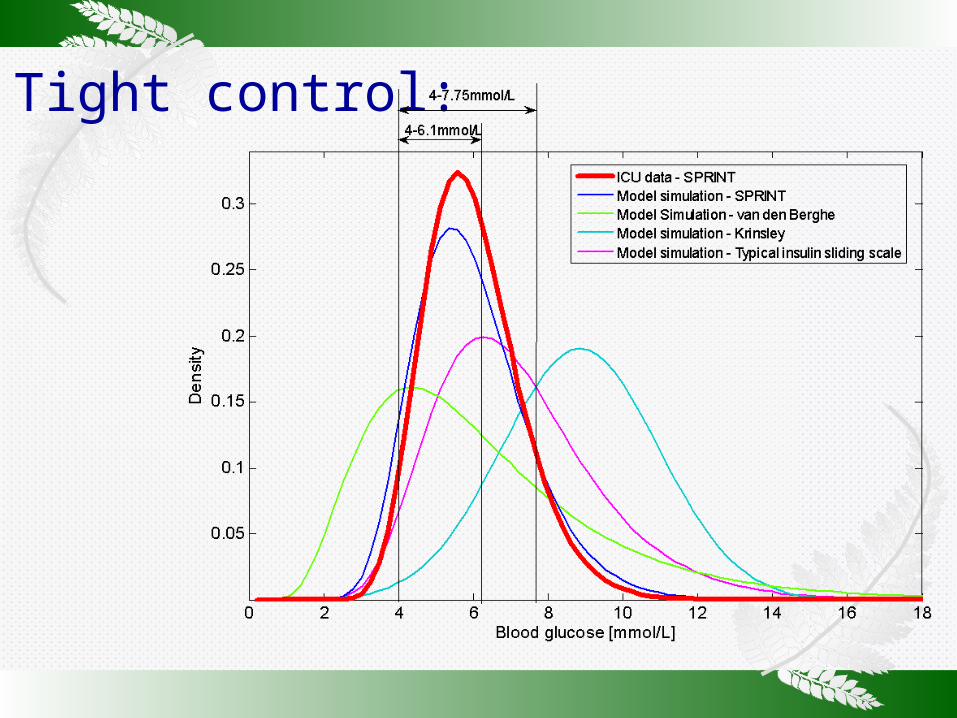
Tight control:

Areas under all fitted curves are equal
Tight control within target bands
Tight control:

Poor control:
BG less than 2.5mmol/L = harmful!!
3.5% of simulated van den Berghe measurements less than 2.5mmol/L

Poor control:
10% of SPRINT ICU measurements > 7.75 mmol/L
70% of simulated Krinsley measurements > 7.75 mmol/L
38% of simulated sliding scale measurements > 7.75 mmol/L

Cumulative distribution function for all blood glucose measurements
Glucose mmol/ L
Cu
mu
lati
ve p
rob
abil
ity
Percentiles for ICU data- SPRINT
2.5mmol/L = 4.1x 10⁻⁵
3.0mmol/L = 0.001
4.0mmol/L = 0.041
6.1mmol/L = 0.59
7.0mmol/L = 0.81
7.75mmol/L =0.91
SPRINT ICU raw data- 26-04-06
ICU data- SPRINT (lognormal) 26-04-06
Model simulation- SPRINT (lognormal)
Model simulation- van den Berghe (lognormal)
Model simulation- Krinsley

Tight control 2003 retrospective data 2005-06 SPRINT
0.0 5.0 10.0 15.0 20.0
2.50
5.00
7.50
10.00
12.50
15.00Avg BGRangeRetroavgRetrorange
R Sq Linear = 0.283R Sq Linear = 0.36
Blood Glucose Range (mmol/l)
Blood Glucose
Average
(mmol/l)
5.0 10.0 15.0 20.0
2.50
5.00
7.50
10.00
12.50
15.00 Avg BG Max Retroavg Retromax
R Sq Linear = 0.459
R Sq Linear = 0.652
Peak Blood Glucose (mmol/l)
Blood Glucose
Average
(mmol/l)
Flatter is betterTighter is better
Flatter is betterTighter is better
P < 0.05 P < 0.05
SPRINT is flatter and tighter in both cases (P < 0.05)SPRINT is flatter and tighter in both cases (P < 0.05)
0%
5%
10%
15%
20%
25%
30%
2004-05 SPRINT
Mo
rta
lity
%
.
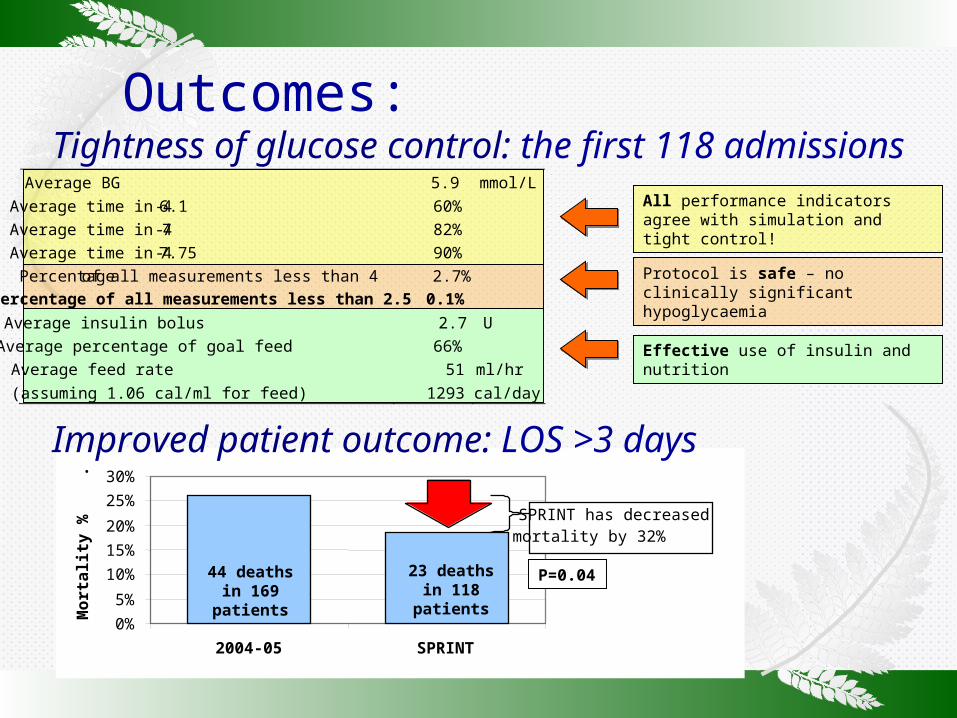
SPRINT has decreased mortality by 32%
44 deaths in 169 patients
23 deaths in 118 patients
All performance indicators agree with simulation and tight control!
Protocol is safe – no clinically significant hypoglycaemia
Effective use of insulin and nutrition
Tightness of glucose control: the first 118 admissions
Improved patient outcome: LOS >3 days
Outcomes:
Average BG 5.9 mmol/L
Average time in 4 -6.1 60%
Average time in 4 -7 82%
Average time in 4 -7.75 90%
Percentage of all measurements less than 4 2.7%
Percentage of all measurements less than 2.5 0.1%
Average insulin bolus 2.7 U
Average percentage of goal feed 66%
Average feed rate 51 ml/hr
(assuming 1.06 cal/ml for feed) 1293 cal/day
P=0.04

Tightness of glucose control*
Outcomes:
SPRINT Mortality grouped by APACHE II 2004-05APACHE II Number Mortality Number Mortality0-14 20 5% 104 1.9%15-24 44 20% 200 15.5%25-34 23 26% 48 45.8%35+ 6 67% 7 71.4%
SPRINT Sepsis data 2004-05 (% change)Total sepsis patients 21 49%Total sepsis LOS<3 3 13%Total sepsis LOS≥3 18 25%Mortality sepsis all 4 19% 35.0% -46%Mortality sepsis LOS<3 1 33% 37.0% -10%Mortality sepsis LOS≥ 3 3 17% 34.0% -51%
*
*
* Incomplete data
Average APACHE II = 21 Average APACHE II =18.3


http:/www.geocities.com/active_insulin_control

This is just the beginning…
Aim:
Tight Glycaemic control for everyone with minimal clinical effort……..
………from babies to adults…..

Acknowledgements
Intensive Care Nursing Staff, Christchurch Hospital

Maths and Stats Gurus
Dr Dom LeeDr Dom LeeDr Bob Dr Bob BroughtonBroughton Dr Chris HannDr Chris Hann
Prof Prof Graeme WakeGraeme WakeThomas LotzThomas Lotz
Jessica Lin & AIC3Jessica Lin & AIC3AIC2AIC2 Jason Wong & AIC4Jason Wong & AIC4AIC1AIC1
The Danes
Prof Steen Prof Steen AndreassenAndreassen
Dunedin
Dr Kirsten Dr Kirsten McAuleyMcAuley Prof Jim MannProf Jim Mann
Assoc. Prof. Geoff Chase
AIC5: Mike, Aaron and TimAIC5: Mike, Aaron and Tim
Acknowledgements


![Conceptualización Proceso Investigación [Goetz y Lecompte]](https://img.pdfslide.net/doc/110x75/577cc5981a28aba7119cce9f/conceptualizacion-proceso-investigacion-goetz-y-lecompte.jpg)