Embed Size (px)
Citation preview
Sbaibi, R., Aboussaleh, Y., & Ahami, A. O. T. (2014). The Standard Progressive Matrices Norms in an international context among the middle school children of the rural commune Sidi el Kamel (North-Western Morocco). WebPsychEmpiricist. Retrieved from http://wpe.info
WPE WebPsychEmpiricist
The Standard Progressive Matrices Norms in an international context among the middle school children
of the rural commune Sidi el Kamel (North-Western Morocco).
R. Sbaibi1, Y. Aboussaleh1, A.O.T. Ahami1
7/28/14
Summary:
Objectives: the present study set out to build the percentiles norms of the Standard Progressive
Matrices (SPM) (2010-2012) for the 1177 middle school children (11.8 to 17.7 years) of the rural
commune Sidi El Kamel (North-Western Morocco); to place those norms in an international
context, and to report on the reliability of the SPM test.
Material and methods: the SPM test is used to measure general intelligence; the reliabilities of
the SPM test are assessed by Cronbach’s Alpha; the SPM percentiles norms are compared to
those of other countries by the medians.
Findings: the reliabilities of the SPM test by age as assessed by Cronbach’s alpha are 0.84 to
0.9; the mean of the SPM scores of all subjects is (M=29.80/60, SD=12.92; (IQ=71.5)), the
median score is 32 (IQ=76.8); the SPM scores obtained are considerably lower than those
compared to the children at the same age in developed countries.
Conclusions: the study reconfirmed the reliability of the SPM test; a combination of the usual
suspects, including poverty, poor education family background, and rural area, impairs children’s
intellectual development.
1 Department of Biology, Behavioral Neurosciences and Nutritional Health Unit.Nutrition & Health Laboratory, Faculty of Sciences, University Ibn Tofail, BP 133 14000 Kénitra, Morocco.
E-mail: [email protected]; [email protected] ; [email protected] . Corresponding Author:Y. Aboussaleh The authors would like to thank the parents and children and the director of the middle school children Al Kindy for making the study possible.
WPE Raven 2
Introduction
Raven’s Standard Progressive Matrices (SPM) test is widely regarded as the best test of abstract
or non-verbal reasoning ability (Lynn, Allik, Pullmann, & Laidra, 2004; Mackintosh, 1996). The
figural analogies of Raven's Progressive Matrices are designed to be as free as possible from
prior knowledge, depend only on current and on-line processing, and are said to be tests of fluid
intelligence (Raven, Raven, & Court, 2000). The SPM measure the eductive ability, one of the
two main components of general cognitive ability (g) or Spearman’s g factor (Kaplan & Sacuzzo,
1997), identified by Spearman in 1923 (Spearman, 1927). The ability to make meaning out of
confusion, generate high-level, usually nonverbal, schemata makes it easy to handle complexity
as defined in Spearman’s theory of cognitive ability, as shown by Court (1983) (Raven, Raven,
& Court, 1998, updated 2003).
A huge body of published research bears on the validity of this test (Gregory, 1992). It has
gained widespread acceptance and is use in many countries all over the five continents (Irvine &
Berry, 1988). It has been widely used in clinical, occupational, educational, and research
contexts (Burke, 1985; De Lemos, 1989).
For around a century, there has been considerable interest in SPM percentiles norms and
international differences in intelligence. Data on these have been published for many countries,
but rarely have been published for Morocco. Our purpose in this paper is to contribute to the
literature on these issues by presenting some data from this country.
The present study set out to build the SPM percentiles norms (2010-2012) for the 1177 middle
school children (11.8 to 17.7 years) of the rural commune Sidi El Kamel (North-Western
Morocco), place those norms in an international context, and to report on the reliability of the
SPM test.
Place and population of study
The survey was carried out between March 2010 and October 2012 at the only middle school of
the rural commune Sidi El Kamel, in the province of Sidi Kacem (North-Western Morocco)
(figure 1). The population includes 1177 middle school children, consisting of 454 girls (38.6%)
and 723 boys (61.4%), aged 11.8 to 17.7 years (Mean= 14.88 ± SD=1.47 years). All subjects
were observed with consent of their parents and the director of middle school.

WPE Raven 3
Figure 1: the geographical situation of rural commune of Sidi El Kamel (North-Western Morocco).
Material and methods
The Raven’s Standard Progressive Matrices test (SPM) or (PM 38)
This version is published by Raven in 1938; it is intended for adults and children from 12 years,
including 60 items presented in black and white grouped into five sets, and each set containing
12 items. For each item, participants were required to indicate which of six or eight possible
symbols correctly completed a sequence of symbols (Raven, Court, & Raven, 1990). Figure 2
below shows the first items derived of five sets of SPM test.
Figure 2: the first items derived of five sets of SPM test
Measures
The SPM test was administered by a group of competent and trained testers, in two half-hour
sessions in the morning, in every class of 24–41 middle school children. Session 1 was sets
(A,B,C) and session 2 was sets (D,E.). Verbal instructions were given to them on how to do the
test.

WPE Raven 4 Data Analysis
Age group 12 years includes students aged 11(9) months to 12 (2) months, age group 12.5
consists of those aged from 12 (3) months to 12 (8) months, and similarly for the other age
groups. The raw data of the completed answer sheets were scored by the SPSS v.17. Reliability
of SPM test scores was investigated using Cronbach’s Alpha. The mean scores, standard
deviations, and medians are given in tables and figures.
Results
The reliabilities of the SPM test
The reliabilities of the SPM test, as assessed by Cronbach’s Alpha as shown in table 1 below ,
explain that the properties test are slightly stable across age groups.
Table 1: Reliabilities as assessed by Cronbach’s Alpha of the SPM test for the five sets by age groups.
Age in Years (Month)
12 12½ 13 13½ 14 14½ 15 15½ 16 16½ 17 17½ All 11(9) to 12(2)
12(3) to 12(8)
12(9) to 13(2)
13(3) to 13(8)
13(9) to 14(2)
14(3) to 14(8)
14(9) to 15(2)
15(3) to 15(8)
15(9) to 16(2)
16(3) to 16(8)
16(9) to 17(2)
17(3) to 17(8)
11(9) to 17(8)
Cronbach’s Alpha 0.85 0.86 0.86 0.84 0.87 0.89 0.90 0.88 0.86 0.83 0.88 0.84 0.88 n 38 90 86 76 94 133 154 137 137 99 81 52 1177
Means; median and standard deviations (SD) of the SPM scores.
The descriptive statistics of the SPM scores by set are given in the table 2 below.
Table 2: descriptive statistics of the SPM scores. Mean SD Median Min Max SPM test scores in sets (A, B, C) 21.55/36 ±08.50 23 2 36 SPM test scores in sets (D, E.) 08.31/24 ±05.20 09 0 24 SPM test scores in sets (A, B, C, D, E) 29.80/60 ±12.92 32 4 55
Means; median and standard deviations of the SPM scores by age groups Table 3 below shows the descriptive statistics of the SPM scores by age groups.
Table 3: descriptive statistics of the SPM scores by age groups.
Age in Years (Months)
12 12½ 13 13½ 14 14½ 15 15½ 16 16½ 17 17½ All 11(9)
to 12(2)
12(3) to
12(8)
12(9) to
13(2)
13(3) to
13(8)
13(9) to
14(2)
14(3) to
14(8)
14(9) to
15(2)
15(3) to
15(8)
15(9) to
16(2)
16(3) to
16(8)
16(9) to
17(2)
17(3) to
17(8)
11(9) to
17(8) Mean 25.0 24.79 24.43 25.25 29.10 30.39 30.27 32.30 31.47 32.70 32.09 35.69 29.80 SD 11.5 12.1 12 11.83 12.77 13.13 13.41 13.03 12.66 11.47 12.83 12.19 12.92 Median 24 24 23 25 31 35 32 37 34 35 35 39 32 Min 6 4 4 7 4 7 7 5 5 6 8 11 4 Max 49 51 50 52 50 54 55 53 54 51 52 53 55 n 38 90 86 76 94 133 154 137 137 99 81 52 1177

WPE Raven 5
Age
in
Year
s (M
onth
s)
Figure 3 below illustrates the box plots with whiskers of the SPM scores by age groups.
Figure 3: Distribution of SPM scores by age groups.
Scores in SPM of middle school children in an international context
Table 4 below presents the raw scores of the SPM corresponding to the 5th, 10th, 25th, 50th,
75th, 90th, and 95th percentiles, by age groups, for the middle school children in the rural
commune Sidi El Kamel (SK) in the context of 1979 British Data (UK) (Smoothed). The scores
obtained by all subjects are considerably lower than those achieved in the British 1979 study.
Table 4: SPM: 2010-2012 adolescent percentile norms for middle school children in the rural commune Sidi El
Kamel (North-Western Morocco) (N =1177) in the context of 1979 British Data (Smoothed). 12 12½ 13 13½ 14 14½ 15 15½ 16 16½ 17 17½
11(9) 12(3) 12(9) 13(3) 13(9) 14(3) 14(9) 15(3) 15(9) 16(3) 16(9) 17(3) to to to to to to to to to to to to 12(2) 12(8) 13(2) 13(8) 14(2) 14(8) 15(2) 15(8) 16(2) 16(8) 17(2) 17(8)
Percentile UK SK UK SK UK SK UK SK UK SK UK SK UK SK UK SK UK SK UK SK UK SK UK SK 95 th 52 43 53 46 54 44 54 44 55 46 56 47 57 51 57 49 48 48 50 52 90 th 50 40 51 42 52 39 53 42 54 46 54 46 55 46 55 46 47 47 47 50 75 th 46 35 47 36 49 35 49 35 50 40 50 42 51 42 51 43 43 42 43 46 50 th* 41 24 42 24 43 23 44 25 45 31 46 35 47 32 47 37 34 35 35 39 25 th 37 15 38 14 39 13 41 15 42 17 42 19 42 17 42 21 20 24 19 29 10 th 31 11 32 11 33 10 35 11 36 12 36 11 36 12 36 11 13 14 13 13
5 th 26 8 27 8 28 8 29 8 30 9 33 10 33 10 33 9 12 10 11 12 n 164 38 174 90 185 86 180 76 196 94 189 133 191 154 171 137 137 99 81 52
*The median
WPE Raven 6
(R (D (N
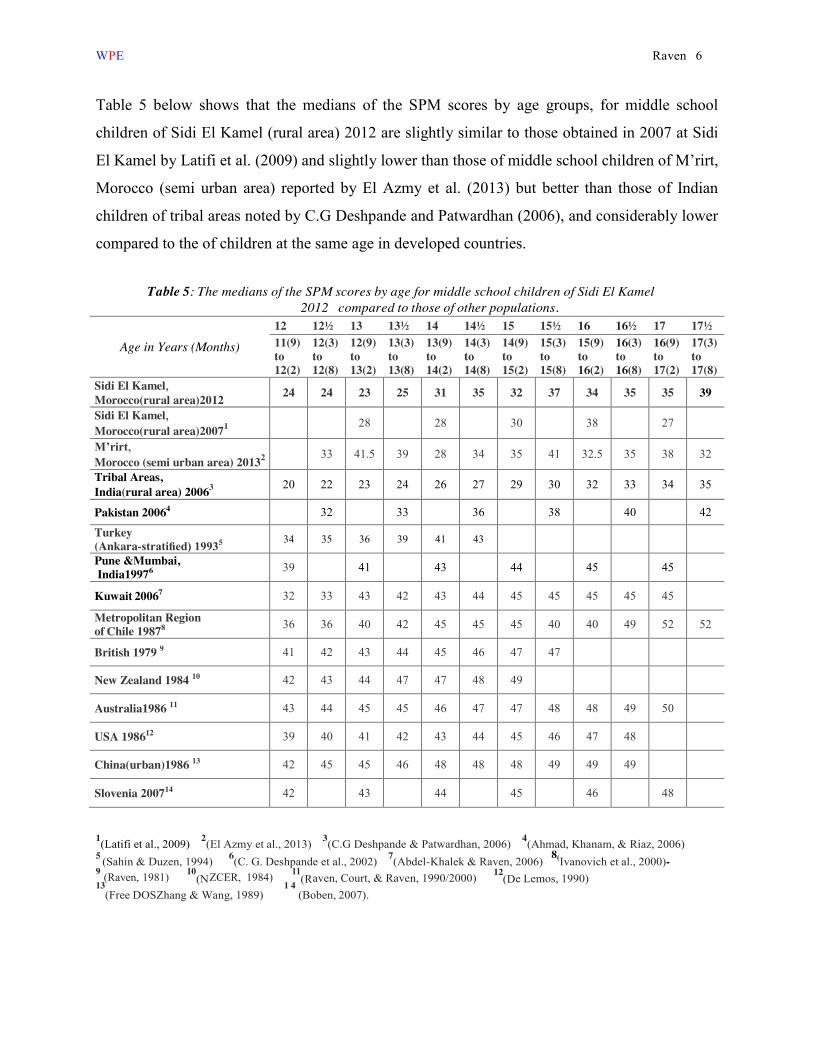
Table 5 below shows that the medians of the SPM scores by age groups, for middle school
children of Sidi El Kamel (rural area) 2012 are slightly similar to those obtained in 2007 at Sidi
El Kamel by Latifi et al. (2009) and slightly lower than those of middle school children of M’rirt,
Morocco (semi urban area) reported by El Azmy et al. (2013) but better than those of Indian
children of tribal areas noted by C.G Deshpande and Patwardhan (2006), and considerably lower
compared to the of children at the same age in developed countries.
Table 5: The medians of the SPM scores by age for middle school children of Sidi El Kamel
2012 compared to those of other populations.
Age in Years (Months) 12 12½ 13 13½ 14 14½ 15 15½ 16 16½ 17 17½ 11(9) to 12(2)
12(3) to 12(8)
12(9) to 13(2)
13(3) to 13(8)
13(9) to 14(2)
14(3) to 14(8)
14(9) to 15(2)
15(3) to 15(8)
15(9) to 16(2)
16(3) to 16(8)
16(9) to 17(2)
17(3) to 17(8)
Sidi El Kamel, Morocco(rural area)2012 24 24 23 25 31 35 32 37 34 35 35 39
Sidi El Kamel, Morocco(rural area)20071 28 28 30 38 27
M’rirt, Morocco (semi urban area) 20132 33 41.5 39 28 34 35 41 32.5 35 38 32
Tribal Areas, India(rural area) 20063 20 22 23 24 26 27 29 30 32 33 34 35
Pakistan 20064 32 33 36 38 40 42
Turkey (Ankara-stratified) 19935 34 35 36 39 41 43
Pune &Mumbai, India19976 39 41 43 44 45 45
Kuwait 20067 32 33 43 42 43 44 45 45 45 45 45
Metropolitan Region of Chile 19878 36 36 40 42 45 45 45 40 40 49 52 52
British 1979 9 41 42 43 44 45 46 47 47
New Zealand 1984 10 42 43 44 47 47 48 49
Australia1986 11 43 44 45 45 46 47 47 48 48 49 50
USA 198612 39 40 41 42 43 44 45 46 47 48
China(urban)1986 13 42 45 45 46 48 48 48 49 49 49
Slovenia 200714 42 43 44 45 46 48
1(Latifi et al., 2009) 2(El Azmy et al., 2013) 3(C.G Deshpande & Patwardhan, 2006) 4(Ahmad, Khanam, & Riaz, 2006) 5 (Sahin & Duzen, 1994) 6(C. G. Deshpande et al., 2002) 7(Abdel-Khalek & Raven, 2006) 8(Ivanovich et al., 2000)- 9 (Raven, 1981) 10
13
ZCER, 1984) 11
1 4 aven, Court, & Raven, 1990/2000) 12
e Lemos, 1990) (Free DOSZhang & Wang, 1989) (Boben, 2007).

WPE Raven 7
Discussion Firstly, the reliabilities of the SPM test by age as assessed by Cronbach’s alpha from the middle
school children of Sidi El Kamel (rural area) 2012 are between 0.84 to 0.9, similar to those found
in other countries and continents (Raven, Raven, & Court, 1999). The reliabilities improved with
age, rising from 0.85 among 12 year olds to 0.90 among 15 olds, confirming those from other
studies reported by Raven et al. (1999).
Secondly, the median scores of the SPM of the population is 32. The mean is
(M=29.80/60,SD=12.92). We note also that the mean and median of the SPM scores increase by
age groups, in agreement with Richard Lynn’s developmental theory, which proposes that
intellectual maturation proceeds in parallel with physical maturation (Lynn, 1994, 1999). Thirdly,
the median of the middle school children is equivalent to the 10th percentile of the 1979 British
standardisation sample given in Raven et al. (1990, p. 62). The scores obtained are considerably
lower than those reported in the British 1979 study, and considerably lower compared to
those of children at the same age in developed countries (Abdel-Khalek & Raven, 2006; Boben,
2007; De Lemos, 1990; C. G. Deshpande et al., 2002; Free DOSZhang & Wang, 1989; Ivanovich
et al., 2000; NZCER, 1984; Raven, 1981; Raven et al., 1990/2000), but slightly similar to those
obtained in 2007 at Sidi El Kamel by Latifi et al. (2009), and slightly lower than those of middle
school children of M’rirt, Morocco (semi urban area) reported by El Azmy et al. (2013), but better
than those of Indian children of tribal areas noted by C.G Deshpande and Patwardhan (2006).
These differences may result in unequal opportunities for parents to develop children’s abilities. In
addition, the educational level of the parents is another socio-economic factor influencing the
results.
Indeed, the differences described above could be explained by the high illiteracy rate among
parents (61.7%); (39, 1% for mothers, 22 .6% for fathers) in the rural commune Sidi El Kamel. It is
more important for mothers (78.3%) than fathers (45.1%); and the high size of household (7
persons by house), the relatively high poverty rates (17.8%) and vulnerability (27.6%)
reported by General Census of Population and Housing (RGPH) 2004 (HCP, 2004) . Furthermore,
norms for rural and isolated communities are typically lower than others. Low norms for what
appear to be good samples of the relevant populations have been reported for Brazil (Angelini,
Alves, Custódio, & Duarte, 1988), Turkey (Sahin & Duzen, 1994), Malaysia (Chaim, 1994; 1995),
Puerto Rico (Kahn, Spears, & Rivera, 1977; Raven, 1989), and a remote area in the mountains of
Peru (see Munoz in Raven, Raven, and Court (1998b)).

WPE Raven 8
As numerous studies reviewed in the Manual for Raven’s Progressive Matrices and Vocabulary
(Court & Raven, 1995; Raven et al., 1998, updated 2003; Raven, Raven, & Court, 2000, updated
2004)– and especially the Irish standardization (Raven, 1981), noted that the urban-rural
differences may have been contributing significantly to the obvious differences between higher and
lower percentiles.
Conclusions
The study reconfirmed the reliability of the SPM test; a combination of the usual suspects,
including poverty, poor education family background, and rural area, impairs children’s intellectual
development. In addition we must emphasis the importance not only of having a standarisation for
the middle school children of Sidi El Kamel (rural area), but also the need to re-evaluate the norms
periodically because the intellectual potential of this place of study may changes with its economic,
and level of education.

WPE Raven 9
References Abdel-Khalek, A. M., & Raven, J. (2006). Normative data from the standardization of ravens
standard progressive matrices in Kuwait in an international context. Social Behavior and
Personality: an international journal, 34(2), 169-180. Ahmad, R., Khanam, S. J., & Riaz, Z. (2006). The Standard Progressive Matrices in Pakistan. In
J. J. Raven (Ed.), Uses and abuses of intelligence: studies advancing Spearman and
Raven's quest for non-arbitrary metrics (pp. 404-412): Unionville, New York: Royal
Fireworks Press; Edinburgh, Scotland: Competency Motivation Project; Budapest,
Hungary: EDGE 2000; Cluj Napoca, Romania: Romanian Psychological Testing
Services SRL. Angelini, A., Alves, I., Custódio, E., & Duarte, W. (1988). Matriz descoloridas progressivas
coloridas de Raven: Escala especial (Padronização Brasileira). São Paulo: Casa do
Psicólogo. Boben, D. (2007). The standardization of all the main Raven Progressive Matrices tests in
Slovenia: WebPsychEmpiricist.
Burke, H. R. (1985). Raven's Progressive Matrices (1938): More on norms, reliability, and
validity. Journal of Clinical Psychology, 41(2), 231-235.
Chaim, H. (1994). Is the raven progressive matrices valid for Malaysians. Paper presented at the
23rd International Congress of Applied Psychology, Madrid.
Chiam, H. (1995). The standardisation of several tests in Malaysia. Unpublished manuscript,
School of Education, University of Malaya, Kuala Lumpur. Court, J. H. (1983). Sex differences in performance on Raven´s Progressive Matrices: a review.
Alberta Journal of Educational Research, 29, 5474. Court, J. H., & Raven, J. (1995). Section 7: Research and References: Summaries of
WPE Raven 10
Normative,Reliability, and Validity Studies and References to All Sections Manual for
Raven's Progressive Matrices and Vocabulary Scales. San Antonio, TX: Harcourt
Assessment. De Lemos, M. (1989). Standard Progressive Matrices, Australian Manual. The Australian
Educational Council for Research:Victoria.
De Lemos, M. (1990). The Australian re-standardisation of the Standard Progressive Matrices: A
short commentary about the lack of discrimination among the top 10% of 16–18 year
olds. ACER Psychnews, 9–12. Deshpande, C. G., Ojha, J. M., Yadav, N. S., Dolke, A. M., Patwardhan, V., Virmani, K. C., &
al., e. (2002). Indian norms for Raven’s standard progressive matrices: A normative
study in Delhi and Maharashtra. New Delhi: Manasayan.
Deshpande, C. G., & Patwardhan, V. (2006). Raven standard progressive matrices: Norms for
Indian tribal areas. In J. J. Raven (Ed.), Uses and abuses of intelligence: studies
advancing Spearman and Raven's quest for non-arbitrary metrics (pp. 392-401):
Unionville, New York: Royal Fireworks Press; Edinburgh, Scotland: Competency
Motivation Project; Budapest, Hungary: EDGE 2000; Cluj Napoca, Romania:
Romanian Psychological Testing Services SRL. El Azmy, J., Ahami, A. O. T., Badda, B., Azzaoui, F.-Z., Aboussaleh, Y., Latifi, M., & El
Hessni, A. (2013). Evaluation des performances neurocognitives des collégiens à M’rirt
(Moyen Atlas, Maroc). Antropo, 30, 33-43. Free DOSZhang, H., & Wang, X. (1989). Chinese standardisation of Raven’s Standard
Progressive Matrices. Psychological Test Bulletin, 2(2), 36-39. Gregory, R. J. (1992). Psychological Testing: History Principles, and Applications ( 2 ed.).
Boston: Ally & Bacon. HCP. (2004). Population légale du Maroc, Recensement général de la population et de l’habitat.
Irvine, S. H., & Berry, J. W. (1988). Human abilities in cultural context. Cambridge: Cambridge

WPE Raven 11
University Press. Ivanovich, R., Forno, H., Durán, M., Game, J. H., Castro, J., & Ivanovich, C. (2000). Estudio de
la capacidad intelectual (test de matrices progresivas de Raven) en escolares chilenos
de 5 a 18 años. I. Antecedentes generales, normas y Recomendaciones. Revista de
psicología general y aplicada: Revista de la Federación Española de Asociaciones de
Psicología, (53, 1). Kahn, H., Spears, J., & Rivera, L. (1977). Applicability of Raven Progressive Matrices Tests
with school children in Puerto Rico. Unpublished technical report. Kaplan, R. M., & Sacuzzo, D. P. (1997). Psychological Testing: Principles, applications and
Issues (4 ed.). Pacific Grove, Calif.: Brooks/Cole Publishing.
Latifi, M., Soulaymani, A., Ahami, A. O. T., Mokhtari, A., Aboussaleh, Y., & Rusinek, S.
(2009). Comparaison des performances cognitives chez les adolescents consanguins et
les non consanguins de la région nord Ouest marocain. Antropo(19), 57-65. Lynn, R. (1994). Sex differences in intelligence and brain size: A paradox resolved. Personality
and Individual Differences, 17(2), 257-271. Lynn, R. (1999). Sex differences in intelligence and brain size: A developmental theory.
Intelligence, 27(1), 1-12. Lynn, R., Allik, J., Pullmann, H., & Laidra, K. (2004). Sex differences on the progressive
matrices among adolescents: Some data from Estonia. Personality and Individual
Differences, 36(6), 1249-1255. Mackintosh, N. J. (1996). Sex differences and IQ. Journal of biosocial science, 28, 559-572.
NZCER. (1984). Standard Progressive Matrices: New Zealand norms supplement. Wellington,
New Zealand: New Zealand Council for Educational Research (NZCER)
Raven, J. (1981). Research Supplement No.1: The 1979 British standardisation of the standard
progressive matrices and Mill Hill vocabulary scales, together with comparative data
WPE Raven 12
from earlier studies in the UK, US, Canada, Germany, and Ireland Manual for Raven’s
Progressive Matrices and Vocabulary Scales. San Antonio, TX: Harcourt Assessment. Raven, J. (1989). The Raven Progressive Matrices: A review of national norming studies and
ethnic and socioeconomic variation within the United States. Journal of Educational
Measurement, 26(1), 1-16.
Raven, J., Court, J. H., & Raven, J. C. (1990). Standard progressive matrices: Oxford
Psychologists Press Oxford, United Kingdom. Raven, J., Court, J. H., & Raven, J. C. (1990/2000). Research supplement no. 3 (2nd/3rd
edition):A compendium of international and North American normative and validity
studies together with a review of the use of the RPM in neuropsychological assessment
Manual for Raven’s Progressive Matrices and Vocabulary Scales: Oxford, England:
Oxford Psychologists Press/ San Antonio, TX: The Psychological Corporation. Raven, J., Raven, J. C., & Court, J. H. (1998, updated 2003). Section1: General overview
Manual for Raven's progressive matrices and vocabulary scales. San Antonio, TX:
Harcourt Assessment. Raven, J., Raven, J. C., & Court, J. H. (1998b). Section 2: The Coloured Progressive Matrices
Manual for Raven's progressive matrices and vocabulary scales. San Antonio, TX:
Harcourt Assessment. Raven, J., Raven, J. C., & Court, J. H. (1999). Prironik za Ravnove progresivne matrice in
besedne lestvice. 1. zvezek: Splošni pregled Manual for Raven's Progressive Matrices
and Vocabulary Scales. Ljubljana: Center za psihodiagnosticna sredstva.
Raven, J., Raven, J. C., & Court, J. H. (2000). Section 3: Standard Progressive Matrices Manual
for Raven’s Progressive Matrices and Vocabulary Scales. San Antonio, TX: Harcourt
Assessment.
Raven, J., Raven, J. C., & Court, J. H. (2000, updated 2004). Section 3: The Standard
Progressive Matrices Manual for Raven's Progressive Matrices and Vocabulary Scales.
WPE Raven 13
San Antonio, TX: Harcourt Assessment. Sahin, N., & Duzen, E. (1994). Turkish standardization of Raven’s Standard Progressive
Matrices Test in 7-15 year-old Turkish children. Paper presented at the Paper presented
at the 23rd International Congress of Applied Psychology, July 17-22, Madrid, Spain. Spearman, C. (1927). The nature of ‘‘intelligence’’ and the principles of cognition (Macmillan
Ed. 2nd ed.). London, England.