Embed Size (px)
Citation preview

Antimicrobial Stewardship – the State Health Department Perspective
Marion A. Kainer MD, MPH, FRACP, FSHEA Healthcare Associated Infections and Antimicrobial Resistance Program
NIAA Antibiotic Stewardship: From Metrics to Management | Nov. 4, 2015

Acknowledgements • CDC
Funding support: ELC, EIP, CSTE HAI fellow
National Healthcare Surveillance Network [NHSN] infrastructure
Technical support
• Reporting partners: Laboratories, healthcare facilities, infection preventionists, pharmacists, clinicians
• Multidisciplinary Advisory Group on HAI & AMR
• Tennessee Department of Health [TDH]
Surveillance systems and informatics
Healthcare associated infections & antimicrobial resistance
No conflicts of interest
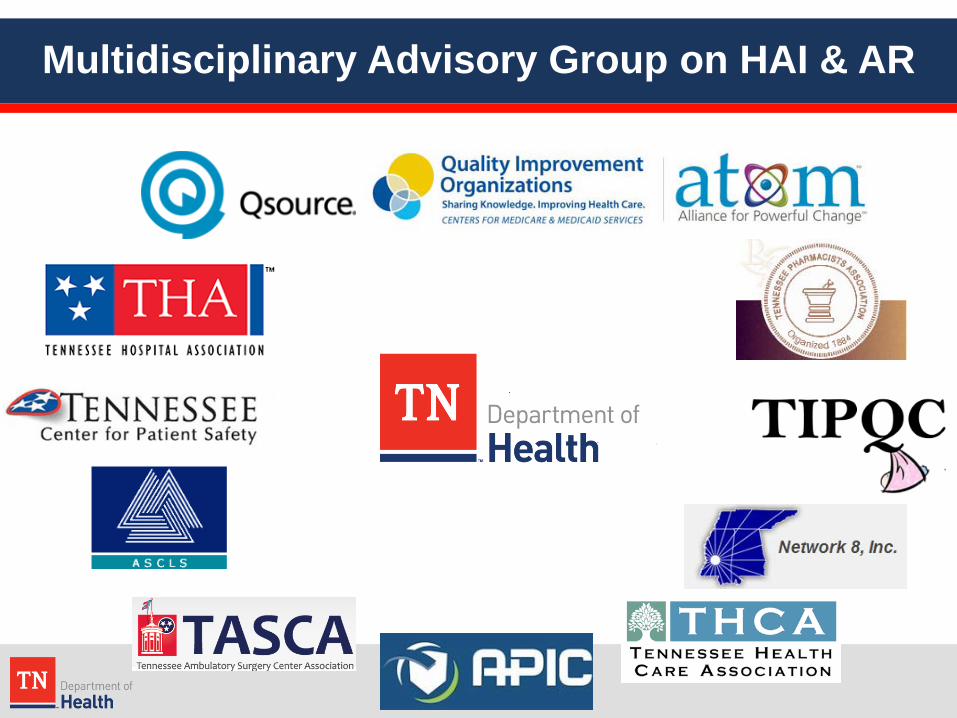
Multidisciplinary Advisory Group on HAI & AR

Every Infection/HAI Prevented, Represents:
http://www.tn.gov/health/topic/hai
One less episode of antibiotic use and thus one less opportunity for the development of resistance
One less exposure to a potentially resistant infection
CLABSI in Adult/Ped ICU, TN

Standardized Infection Ratio (SIR): Risk Adjusted Summary Measure
• SIR > 1.0: # infections are HIGHER than predicted – SIR= 1.5: # infections = 50% HIGHER than predicted
• SIR < 1.0: # infections are LOWER than predicted – SIR= 0.4: # infections = 60% LOWER than predicted
Observed (O) HAIs Predicted (P) HAIs
To calculate O, sum the # of HAIs among a group
To calculate P, requires the use of the appropriate aggregate data (risk-adjusted rates) (e.g., national NHSN data for 2006-2008)
SIR=

CLABSI* – Adult/Pediatric ICUs, TN 1/2008- 12/2014 Start CLABSI Collaborative: CUSP
HHS Goal
* Central Line Associated Blood Stream Infections [CLABSI]
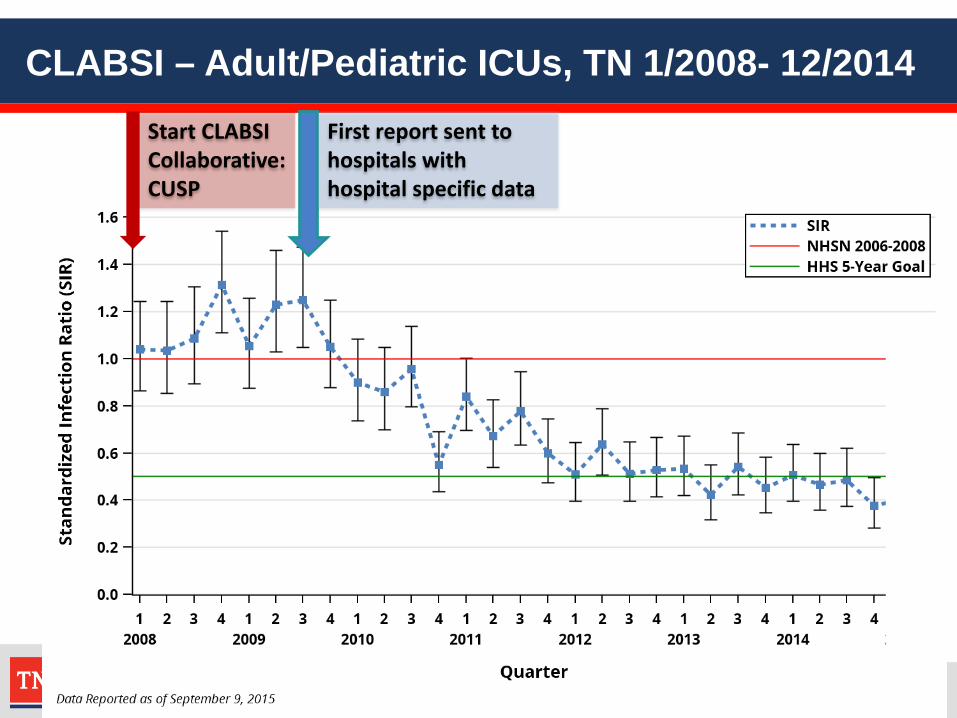
CLABSI – Adult/Pediatric ICUs, TN 1/2008- 12/2014 Start CLABSI Collaborative: CUSP
First report sent to hospitals with hospital specific data

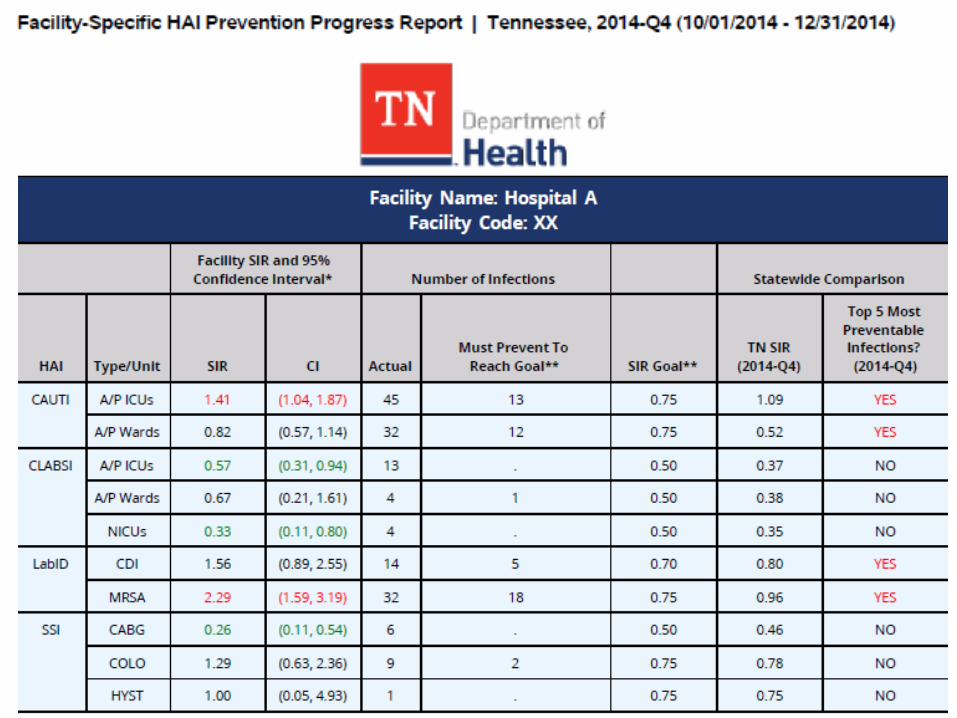
Hospital A: CLABSIs in Adult & Pediatric ICU

Targeting facilities: TAP Strategy using the CAD (or Number Needed to Prevent)
CAD = Cumulative Attributable Difference = ObsFACILITY - (ExpFACILITY*HHS Goal SIR)
2013 HHS Goals
SIR=0.75 (SSI, CAUTI, MRSA) SIR=0.50 (CLABSI) SIR=0.70 (CDI)
See also: Soe, MM et al. A Mathematical Model to Prioritize Healthcare Facilities for High Prevention Impact on Healthcare-Associated Infections. CSTE Annual Conference 2013. https://cste.confex.com/cste/2013/webprogram/Paper2070.html Soe M, Gould CV, Pollock D, Edwards J. Targeted assessment for prevention of healthcare-associated infections: a new prioritization metric. Infect Control Hosp Epidemiol 2015 (in press). http://www.cdc.gov/hai/prevent/tap.html

http://tn.gov/health/article/hai-prevention-calculator
TN HAI Prevention Calculator

CLABSI – Neonatal ICUs, TN 7/2008- 12/2014

Emerging Infections Program (EIP)

183 hospitals in 10 States (EIP) [25 hospitals in TN] 11,282 patients; HAI prevalence: 4% Most common HAI pathogen: Clostridium difficile Extrapolation: estimate 721,854 HAIs in the US in 2011

Overall Prevalence: 49.9% TN: highest: 56.3% [lowest state: 43.9%]
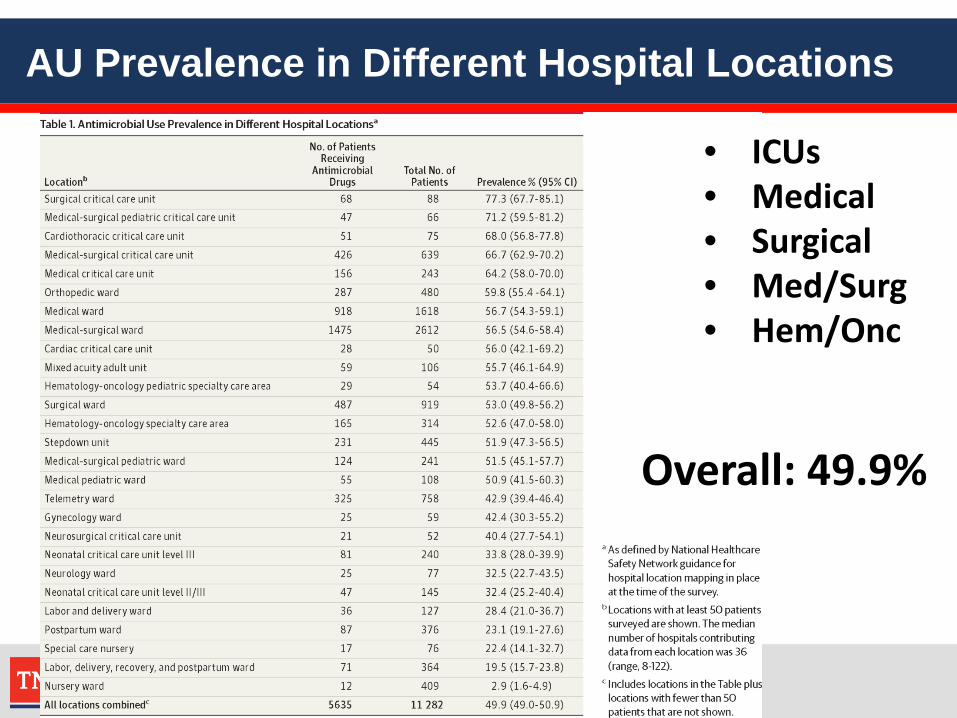
• ICUs • Medical • Surgical • Med/Surg • Hem/Onc
AU Prevalence in Different Hospital Locations
Overall: 49.9%

Lower Resp tract UTI Skin, soft tissue GI Empiric BSI
Infection Sites for Which Patients Received Antimicrobial Treatment
34.6% 22.3% 16.1% 12.6% 8.5% 9.4%

5 Most Common Antibiotics: Community Onset (CO) vs Healthcare Facility Onset (HO)
CO HO
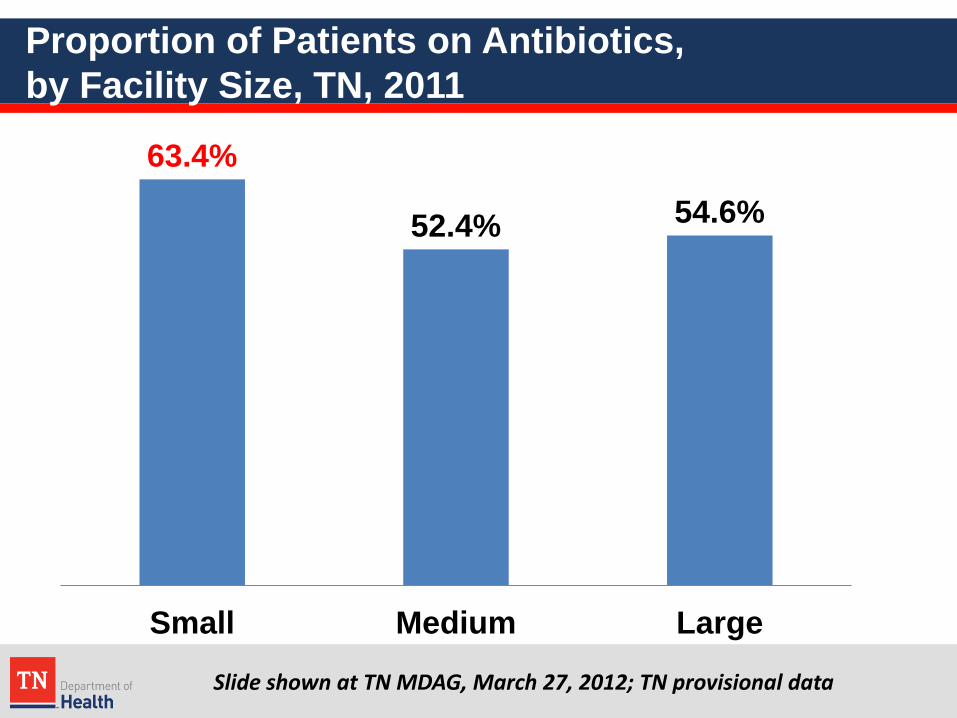
63.4%
52.4% 54.6%
Small Medium Large
Slide shown at TN MDAG, March 27, 2012; TN provisional data
Proportion of Patients on Antibiotics, by Facility Size, TN, 2011

88.8% 83.6%
67.9%
10.9% 16.1%
31.7%
Small Medium Large
IV/IM Oral Enteral
Slide shown at TN MDAG, March 27, 2012; TN provisional data
Route of Administration by Facility Size, TN, 2011

Rationale for Antimicrobial Administration at Patient Level, TN, 2011
46.0%
9.6%
1.6% 0.3% 2.4%
Treatment ofActive Infection
Surgicalprophylaxis
Medicalprophylaxis
Non infection Nonedocumented
Slide shown at TN MDAG, March 27, 2012; TN provisional data
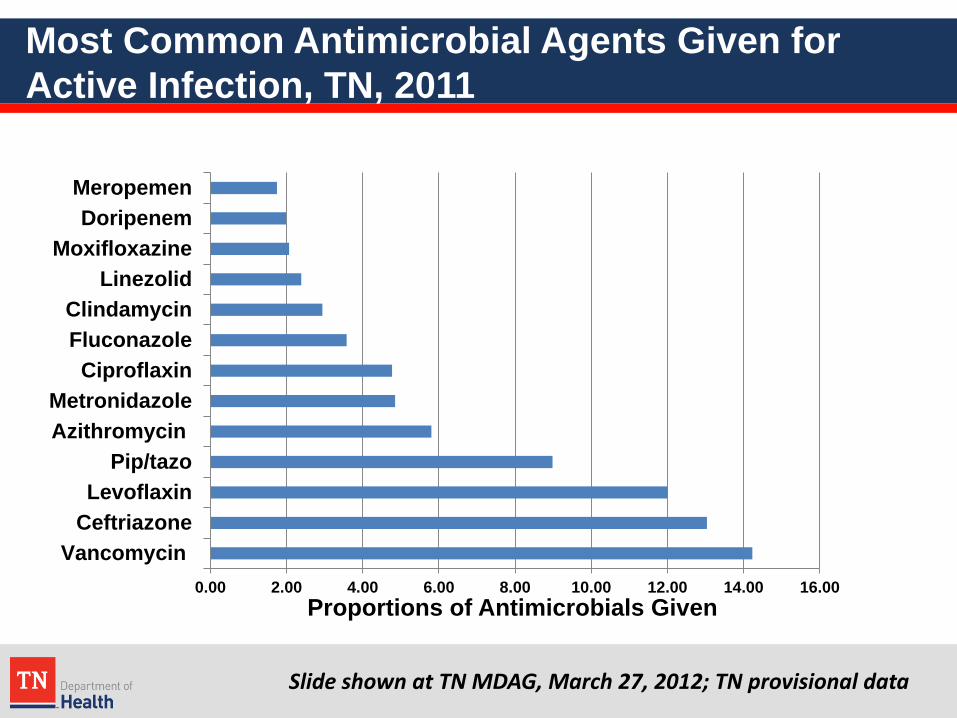
Most Common Antimicrobial Agents Given for Active Infection, TN, 2011
0.00 2.00 4.00 6.00 8.00 10.00 12.00 14.00 16.00
VancomycinCeftriazoneLevoflaxin
Pip/tazoAzithromycinMetronidazole
CiproflaxinFluconazoleClindamycin
LinezolidMoxifloxazine
DoripenemMeropemen
Proportions of Antimicrobials Given
Slide shown at TN MDAG, March 27, 2012; TN provisional data
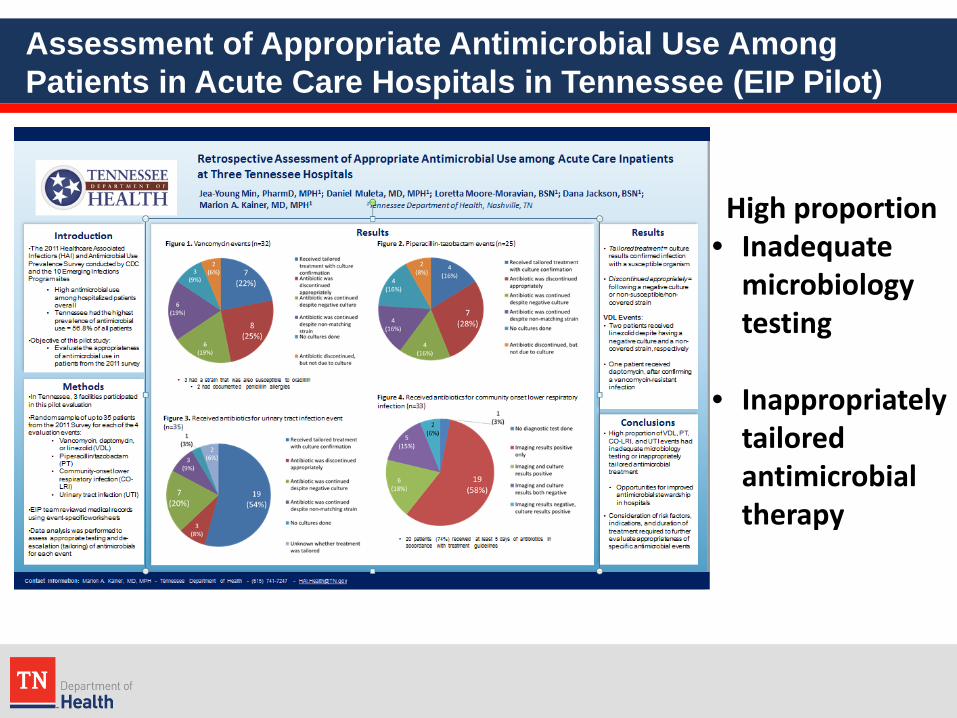
Assessment of Appropriate Antimicrobial Use Among Patients in Acute Care Hospitals in Tennessee (EIP Pilot)
High proportion • Inadequate
microbiology testing
• Inappropriately tailored antimicrobial therapy

Antimicrobial Stewardship Annual
Hospital Survey 2014
http://www.cdc.gov/getsmart/healthcare/implementation/core-elements.html
Core Elements of Hospital Antimicrobial Stewardship Programs

7 Core Elements of Antimicrobial Stewardship • Leadership commitment: Dedicate necessary human, financial, and IT
resources • Accountability: Appoint a single leader responsible for program
outcomes. • Drug expertise: Appoint a single pharmacist leader to support
improved prescribing • Act: Take at least one prescribing improvement action, such as
requiring reassessment after 48 hours to check drug choice, dose, and duration
• Track: Monitor prescribing and antibiotic resistance patterns • Report: Regularly report to staff prescribing and resistance patterns,
and steps to improve • Educate: Offer education about antibiotic resistance and improving
prescribing practices

Core Elements: TN vs US (national), 2014
0%
10%
20%
30%
40%
50%
60%
70%
80%
90%
100%
Accountability Action Drug-expertise Education Leadership Reporting Tracking
The seven elements of antibiotic stewardship in TN compared to the US.
Nationwide(N=4,091)
Tennessee(N=112)
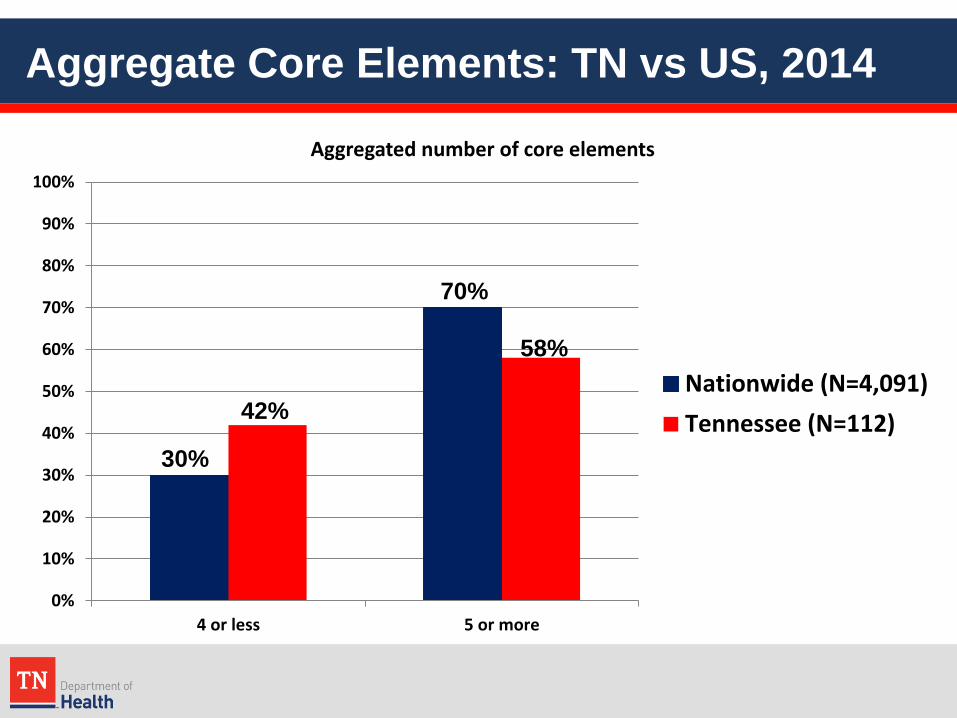
Aggregate Core Elements: TN vs US, 2014
0%
10%
20%
30%
40%
50%
60%
70%
80%
90%
100%
4 or less 5 or more
Aggregated number of core elements
Nationwide (N=4,091)Tennessee (N=112)42%
70%
30%
58%

Tennessee Healthcare Coalitions/EMS Regions and Number of Acute Care Hospitals, 2014
EMS 1 Northeast/Sullivan N=11
EMS 2 Knox/East N=20
EMS 4 Upper Cumberland N=10
EMS 3 Southeast/Hamilton N=13
EMS 5 Highland Rim N=20
EMS 6 South Central N=9
EMS 7 Region 7 N=14
EMS 8 Mid South N=15
8 EMS regions, numbered from East to West 9 to 20 hospitals per EMS Region
TN EMS-8 EMS-7 EMS-6 EMS-5 EMS-4 EMS-3 EMS-2 EMS-1
112 15 14 9 20 10 13 20 11

>5 Core Elements of Stewardship by EMS Region, 2014
TN EMS-8 EMS-7 EMS-6 EMS-5 EMS-4 EMS-3 EMS-2 EMS-1
58%
47%
50%
44%
60%
50%
61%
100%
18%
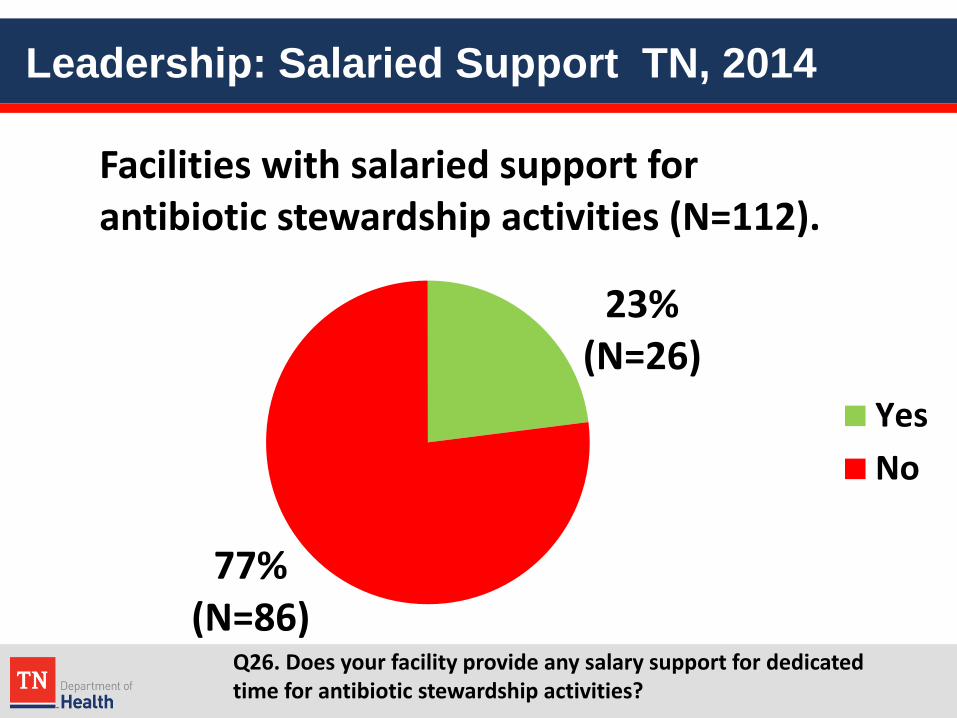
Leadership: Salaried Support TN, 2014
23% (N=26)
77% (N=86)
Facilities with salaried support for antibiotic stewardship activities (N=112).
YesNo
Q26. Does your facility provide any salary support for dedicated time for antibiotic stewardship activities?

Leadership: Written Support TN, 2014
45% (N=50) 55%
(N=62)
Facilities with a written statement designed to improve antibiotic use
(N=112).
YesNo
Q23. Does your facility have a written statement of support from leadership that supports efforts to improve antibiotic use (antibiotic stewardship)?”

Action as a Component of Antimicrobial Stewardship , Hospitals, TN, 2014
0%
10%
20%
30%
40%
50%
60%
70%
80%
90%
100%
Policies present Treatmentrecommendations
Review oftreatments
Antibioticapproval by a
physician
Antibiotic reviewby a physician
The five components of action towards antimicrobial stewardship.
Document Indication “Time out”

>3 Core Elements of Action by EMS Region, 2014
TN EMS-8 EMS-7 EMS-6 EMS-5 EMS-4 EMS-3 EMS-2 EMS-1
50% 40% 64% 33% 55% 50% 31% 65% 45%

Action-Policies: Indication Documented, 2014
27. Does your facility have a policy that requires prescribers to document an indication for all antibiotics in the medical record or during order entry?
TN EMS-8 EMS-7 EMS-6 EMS-5 EMS-4 EMS-3 EMS-2 EMS-1
21% 53% 36% 11% 5% 10%
100% 30% 18%
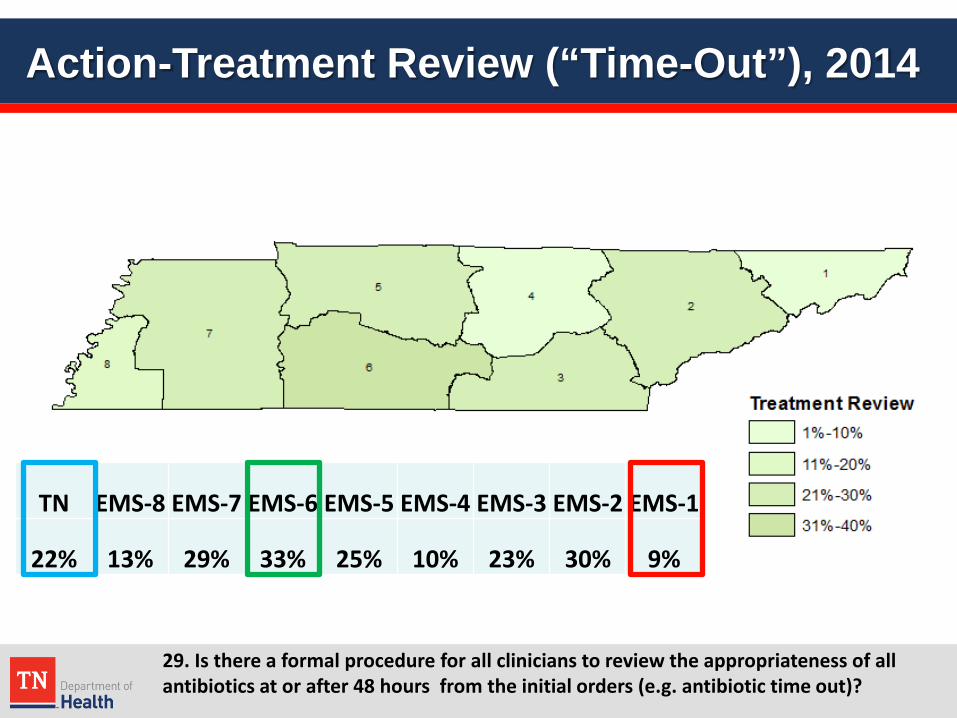
Action-Treatment Review (“Time-Out”), 2014
29. Is there a formal procedure for all clinicians to review the appropriateness of all antibiotics at or after 48 hours from the initial orders (e.g. antibiotic time out)?
TN EMS-8 EMS-7 EMS-6 EMS-5 EMS-4 EMS-3 EMS-2 EMS-1
22% 13% 29% 33% 25% 10% 23% 30% 9%

Antimicrobial Stewardship Recommendations, THA Board Adopted (October 2015) 1. Hospital demonstration of commitment to
antibiotic stewardship via a written statement of support and consideration of dedicated pharmacy, clinician and IT staff time for antibiotic stewardship activities.
2. All hospitals commit to reporting to the National Healthcare Safety Network antimicrobial use and resistance modules within specified timeframes.
3. All hospitals commit to a policy requiring documentation of indications for antibiotic therapy.

Antimicrobial Stewardship Recommendations, THA Board Adopted (October 2015) 4. All hospitals commit to implementing a policy
requiring an “antibiotic review” at 48-72 hours to allow for appropriate review of clinical indication of need, response and any therapeutic revisions that might be appropriate.
5. Participation by hospitals in an antibiotic stewardship collaborative to encourage best practice / lessons learned sharing, and development of appropriate educational programing, as well as any other steps or activities that would assist with antibiotic stewardship.

National Healthcare Safety Network (NHSN) NHSN is a surveillance system that serves multiple
users and uses NHSN is used by >17,000 healthcare facilities to track HAIs,
antimicrobial use and resistance, and adherence to prevention guidelines; guide prevention efforts; submit data for public reporting and quality measurement purposes
Health departments for surveillance, prevention, and public reporting
CMS for quality measurement and reporting, reimbursement, and prevention
HHS to measure national progress

NHSN Antimicrobial Use & Resistance Module
• Only electronic data submission using CDA (clinical document architecture).
• NO MANUAL data entry • Antimicrobial Use [AU]
– eMAR (electronic medication administration record) or
– BCMA (bar code medication administration system – ADT (admission, discharge, transfer) or registry data
• Antimicrobial Resistance [AR] – LIMS (laboratory information system) – ADT (admission, discharge, transfer) or registry data

Reporting Data to NHSN AUR Module
• Stakeholder Meeting March, 2015: – THA (Tennessee Hospital Association) – CMO Society (Chief Medical Officer) – TN Pharmacy Coalition – TDH (Tennessee Dept of Health)
• Objective: Prepare hospitals and health systems for the
expected state and federal reporting requirements on antibiotic use and resistance (AUR) to NHSN. – Data submission to NSHN is electronic only and involves
multiple sources of data (ADT, LIMS, eMAR/BCMA). – Requires lead time
• time and resources

Facilitating Reporting to NHSN AUR Module
• Sharing lessons learned from two TN hospitals reporting data to the NHSN AU module – Holston Valley Medical Center (major teaching hospital) – Maury Regional Medical Center (medium size)
• Inventory of electronic systems in use at TN healthcare facilities: – ADT – BCMA – eMAR – LIS – 3rd party software
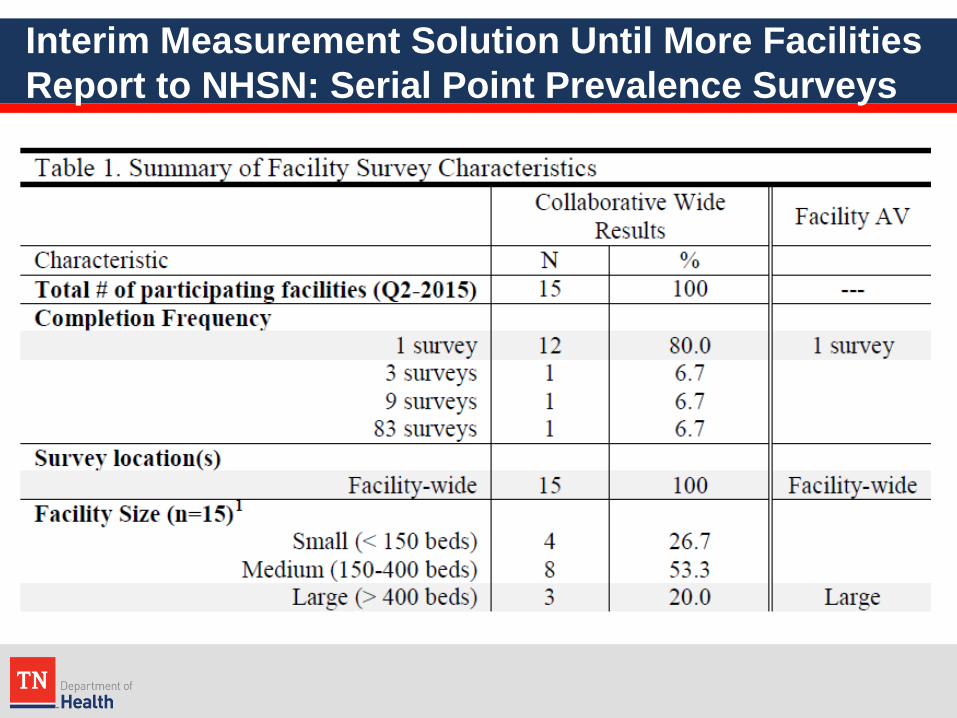
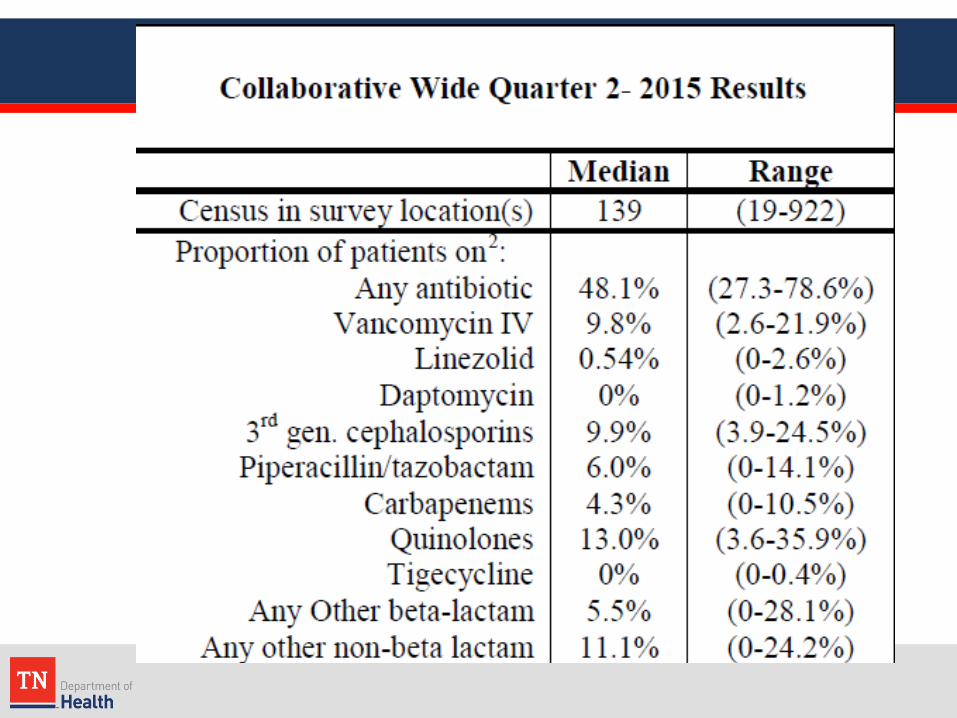
Interim Measurement Solution Until More Facilities Report to NHSN: Serial Point Prevalence Surveys
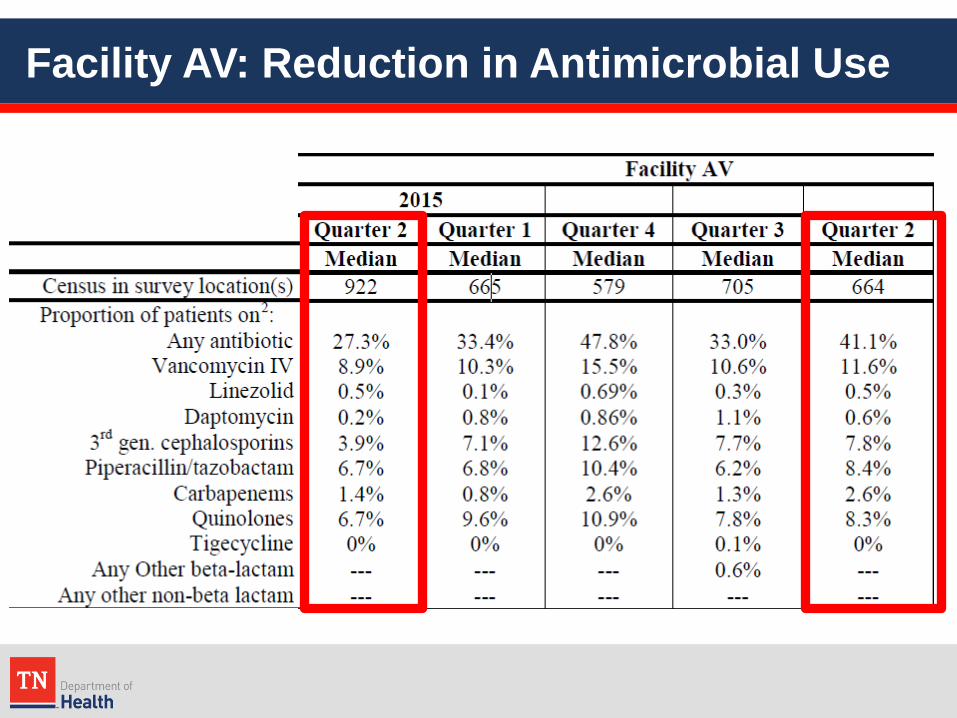
Facility AV: Reduction in Antimicrobial Use

Example Report: Facility vs Collaborative All Antibiotics and Quinolone use

Distribution of Patients on Quinolones TN, 2014-15
4% 12% 20% 28% 36%

Pharmacist Training
Antimicrobial Stewardship Training Programs
http://mad-id.org/
Basic Program http://mad-id.org/antimicrobial-stewardship-programs/antimicrobial-stewardship-programs-basic-program/ Advanced Program http://mad-id.org/antimicrobial-stewardship-programs/advanced-program/
Antimicrobial Stewardship: A Certificate Program for Pharmacists http://www.sidp.org/page-1442823

Outpatient Antibiotic Use Rates (2010)
Center for Disease Dynamics, Economics & Policy <http://www.cddep.org/node/4933> Hicks et al. U.S. Outpatient Antibiotic Prescribing, 2010. N Engl J Med 2013; 368:1461-1462
Number of dispensed outpatient antibiotic prescriptions per 1,000 inhabitants
Tennessee =1,159 per 1,000 inhabitants
Alaska =511 per 1,000 inhabitants
California =555 per 1,000 inhabitants
U.S. Average =801 per 1,000 inhabitants

Governor Proclamation: Get Smart About Antibiotics Week
Governor Haslam has declared November 16-22, 2015 as Get Smart About Antibiotics Week in Tennessee
http://tn.gov/health/topic/appropriate-antibiotic-use
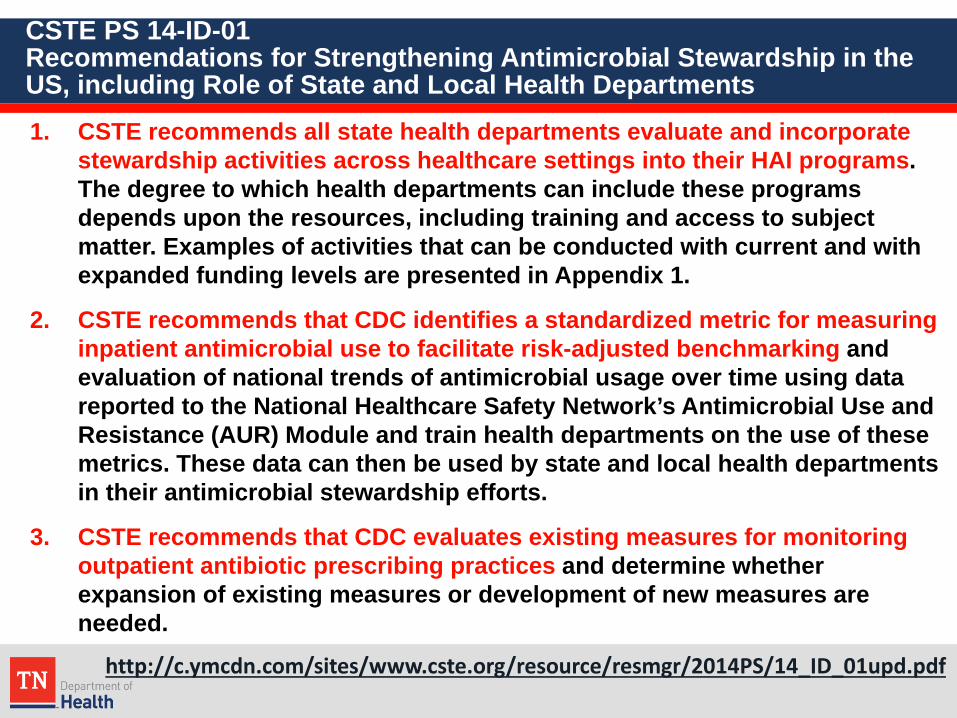
CSTE PS 14-ID-01 Recommendations for Strengthening Antimicrobial Stewardship in the US, including Role of State and Local Health Departments 1. CSTE recommends all state health departments evaluate and incorporate
stewardship activities across healthcare settings into their HAI programs. The degree to which health departments can include these programs depends upon the resources, including training and access to subject matter. Examples of activities that can be conducted with current and with expanded funding levels are presented in Appendix 1.
2. CSTE recommends that CDC identifies a standardized metric for measuring inpatient antimicrobial use to facilitate risk-adjusted benchmarking and evaluation of national trends of antimicrobial usage over time using data reported to the National Healthcare Safety Network’s Antimicrobial Use and Resistance (AUR) Module and train health departments on the use of these metrics. These data can then be used by state and local health departments in their antimicrobial stewardship efforts.
3. CSTE recommends that CDC evaluates existing measures for monitoring outpatient antibiotic prescribing practices and determine whether expansion of existing measures or development of new measures are needed.
http://c.ymcdn.com/sites/www.cste.org/resource/resmgr/2014PS/14_ID_01upd.pdf
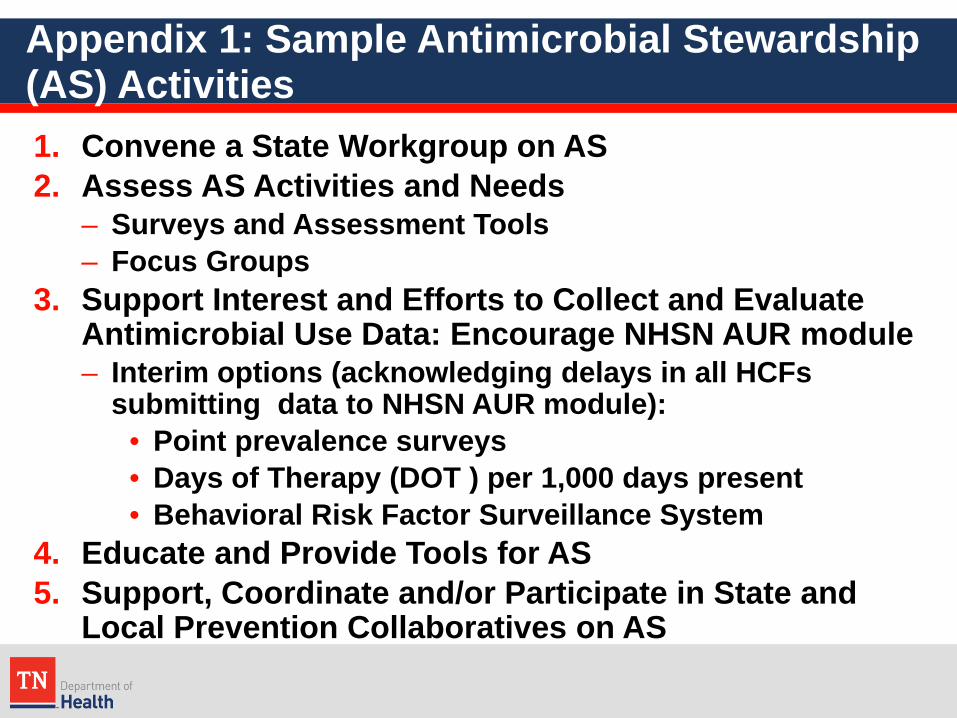
Appendix 1: Sample Antimicrobial Stewardship (AS) Activities 1. Convene a State Workgroup on AS 2. Assess AS Activities and Needs
– Surveys and Assessment Tools – Focus Groups
3. Support Interest and Efforts to Collect and Evaluate Antimicrobial Use Data: Encourage NHSN AUR module – Interim options (acknowledging delays in all HCFs
submitting data to NHSN AUR module): • Point prevalence surveys • Days of Therapy (DOT ) per 1,000 days present • Behavioral Risk Factor Surveillance System
4. Educate and Provide Tools for AS 5. Support, Coordinate and/or Participate in State and
Local Prevention Collaboratives on AS
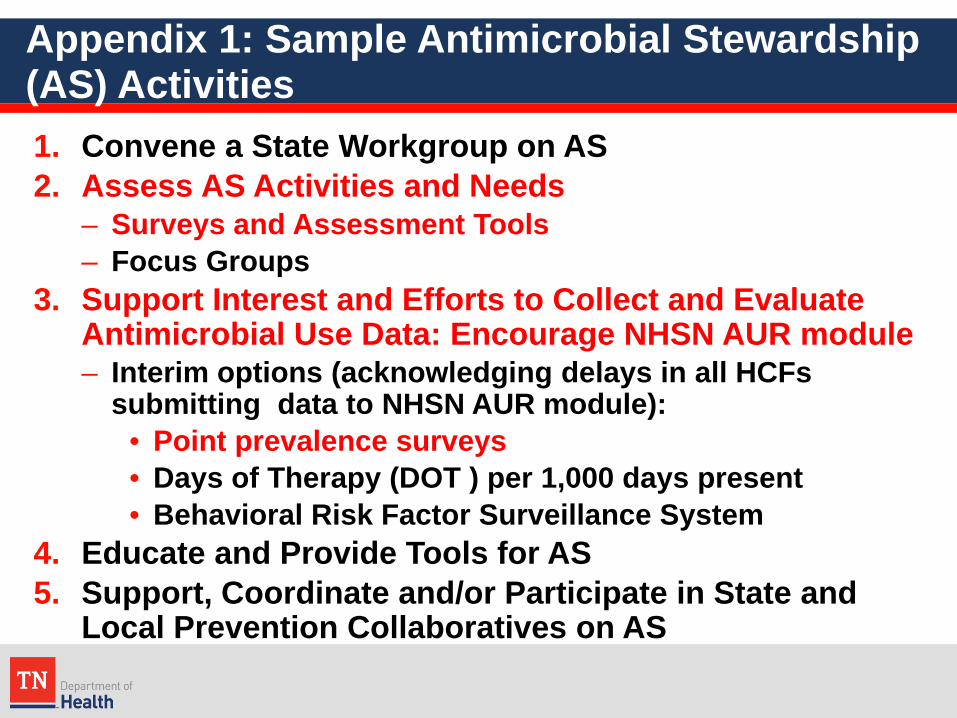

Position Statement 15-ID-02

CDC & State Health Departments Consider for Implementation Any Number of Strategies Below as Resource Allow (Appendix)