Embed Size (px)
Citation preview

2021 GLOBAL BUSINESS ETHICS SURVEY REPORT
The State of Ethics & Compliance in the WorkplaceA Look at Global Trends
March 2021
1

ABOUT THE ETHICS & COMPLIANCE INITIATIVEThe Ethics & Compliance Initiative™ (ECI™) has a mission to empower individuals and organizations to build and sustain high-quality ethics & compliance programs. Established in 1922, the organization comprises the two oldest nonprofits in the ethics & compliance industry. As an association, ECI brings together ethics & compliance professionals and academics from all over the world to share techniques, resources and exciting new ideas.
Through its research, ECI identifies the practices that improve ethics & compliance program effectiveness and build institutional culture strength. ECI also has an established track record of providing support to organizations seeking to transform their cultures, often in the wake of significant challenges with noncompliance.
Contact Information Ethics & Compliance Initiative 2650 Park Tower Drive, Suite 802Vienna, VA 22180
Tel: 703.647.2185 | FAX: 703.647.2180www.ethics.org | [email protected]
For additional copies of this report, permission and licensing contact ECI: 703-647-2185 or [email protected].
For media inquiries, contact Florence Sumaray, vice president, marketing & communications at [email protected].
All content contained in this report is for informational purposes only. ECI cannot accept responsibility for any errors or omissions or any liability resulting from the use or misuse of any information presented in this report.
©2021 Ethics Research Center, the research arm of the Ethics & Compliance Initiative.
ISBN: 978-1-7923-6391-7
All rights reserved. Printed in the United States of America.
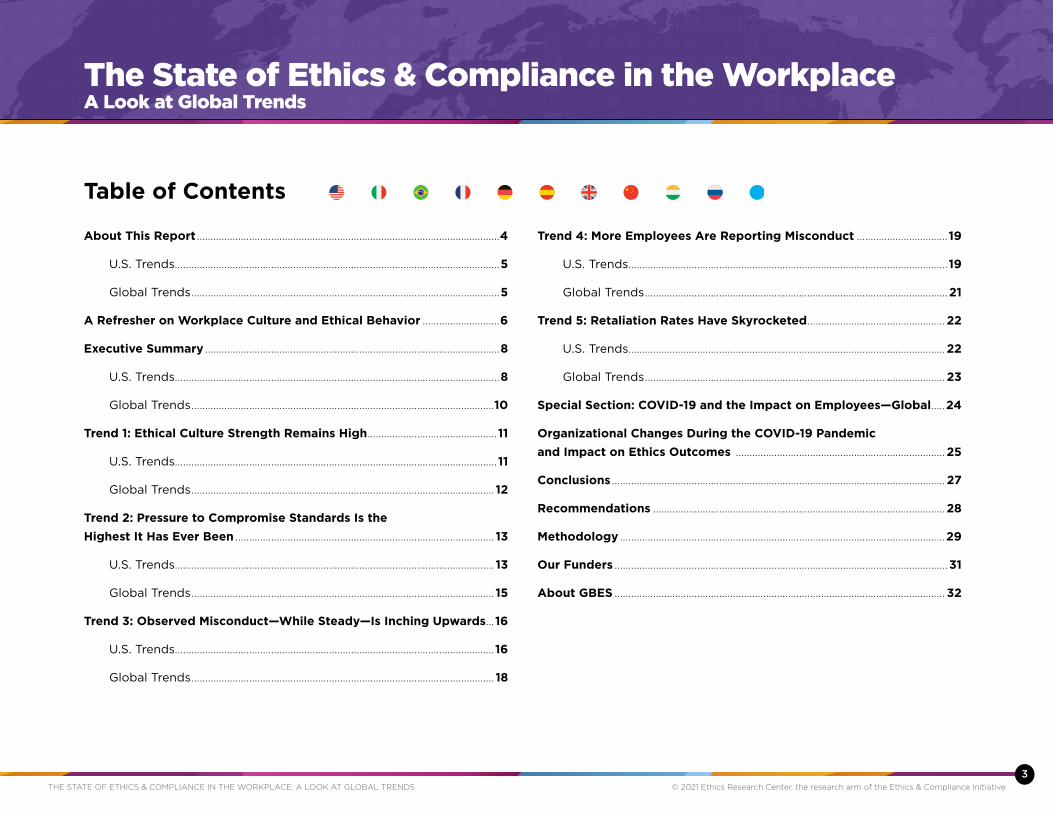
About This Report...............................................................................................................4
U.S. Trends......................................................................................................................5
Global Trends.................................................................................................................5
A Refresher on Workplace Culture and Ethical Behavior.............................6
Executive Summary............................................................................................................8
U.S. Trends......................................................................................................................8
Global Trends...............................................................................................................10
Trend 1: Ethical Culture Strength Remains High................................................11
U.S. Trends.....................................................................................................................11
Global Trends............................................................................................................... 12
Trend 2: Pressure to Compromise Standards Is the
Highest It Has Ever Been............................................................................................... 13
U.S. Trends.................................................................................................................... 13
Global Trends...............................................................................................................15
Trend 3: Observed Misconduct—While Steady—Is Inching Upwards....16
U.S. Trends....................................................................................................................16
Global Trends...............................................................................................................18
Trend 4: More Employees Are Reporting Misconduct..................................19
U.S. Trends....................................................................................................................19
Global Trends...............................................................................................................21
Trend 5: Retaliation Rates Have Skyrocketed................................................... 22
U.S. Trends................................................................................................................... 22
Global Trends.............................................................................................................. 23
Special Section: COVID-19 and the Impact on Employees—Global......24
Organizational Changes During the COVID-19 Pandemic
and Impact on Ethics Outcomes ............................................................................. 25
Conclusions.......................................................................................................................... 27
Recommendations........................................................................................................... 28
Methodology.......................................................................................................................29
Our Funders..........................................................................................................................31
About GBES......................................................................................................................... 32
Table of Contents
THE.STATE.OF.ETHICS.&.COMPLIANCE.IN.THE.WORKPLACE:.A.LOOK.AT.GLOBAL.TRENDS ©.2021.Ethics.Research.Center,.the.research.arm.of.the.Ethics.&.Compliance.Initiative
3
The State of Ethics & Compliance in the WorkplaceA Look at Global Trends
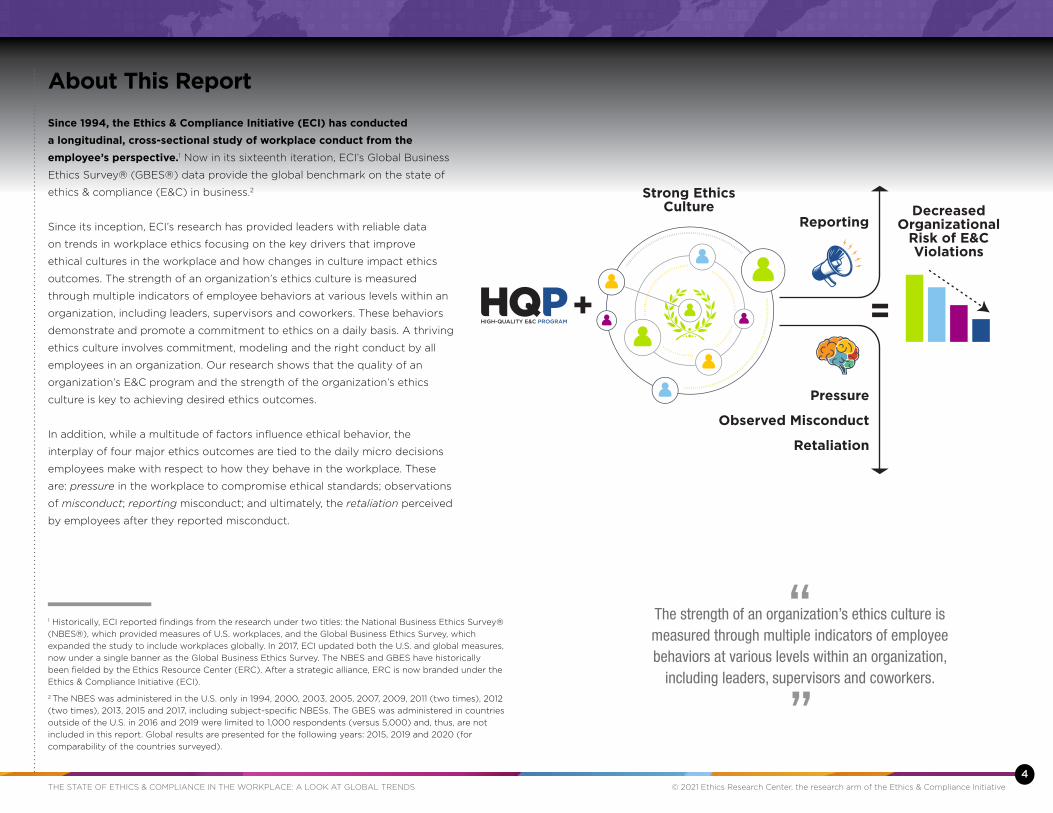
Since 1994, the Ethics & Compliance Initiative (ECI) has conducted
a longitudinal, cross-sectional study of workplace conduct from the
employee’s perspective.1.Now.in.its.sixteenth.iteration,.ECI’s.Global.Business.
Ethics.Survey®.(GBES®).data.provide.the.global.benchmark.on.the.state.of.
ethics.&.compliance.(E&C).in.business.2
Since.its.inception,.ECI’s.research.has.provided.leaders.with.reliable.data.
on.trends.in.workplace.ethics.focusing.on.the.key.drivers.that.improve.
ethical.cultures.in.the.workplace.and.how.changes.in.culture.impact.ethics.
outcomes..The.strength.of.an.organization’s.ethics.culture.is.measured.
through.multiple.indicators.of.employee.behaviors.at.various.levels.within.an.
organization,.including.leaders,.supervisors.and.coworkers..These.behaviors.
demonstrate.and.promote.a.commitment.to.ethics.on.a.daily.basis..A.thriving.
ethics.culture.involves.commitment,.modeling.and.the.right.conduct.by.all.
employees.in.an.organization..Our.research.shows.that.the.quality.of.an.
organization’s.E&C.program.and.the.strength.of.the.organization’s.ethics.
culture.is.key.to.achieving.desired.ethics.outcomes.
In.addition,.while.a.multitude.of.factors.influence.ethical.behavior,.the.
interplay.of.four.major.ethics.outcomes.are.tied.to.the.daily.micro.decisions.
employees.make.with.respect.to.how.they.behave.in.the.workplace..These.
are:.pressure.in.the.workplace.to.compromise.ethical.standards;.observations.
of.misconduct;.reporting.misconduct;.and.ultimately,.the.retaliation.perceived.
by.employees.after.they.reported.misconduct...
1.Historically,.ECI.reported.findings.from.the.research.under.two.titles:.the.National.Business.Ethics.Survey®.
(NBES®),.which.provided.measures.of.U.S..workplaces,.and.the.Global.Business.Ethics.Survey,.which.
expanded.the.study.to.include.workplaces.globally..In.2017,.ECI.updated.both.the.U.S..and.global.measures,.
now.under.a.single.banner.as.the.Global.Business.Ethics.Survey..The.NBES.and.GBES.have.historically.
been.fielded.by.the.Ethics.Resource.Center.(ERC)..After.a.strategic.alliance,.ERC.is.now.branded.under.the.
Ethics.&.Compliance.Initiative.(ECI)..
2.The.NBES.was.administered.in.the.U.S..only.in.1994,.2000,.2003,.2005,.2007,.2009,.2011.(two.times),.2012.
(two.times),.2013,.2015.and.2017,.including.subject-specific.NBESs..The.GBES.was.administered.in.countries.
outside.of.the.U.S..in.2016.and.2019.were.limited.to.1,000.respondents.(versus.5,000).and,.thus,.are.not.
included.in.this.report..Global.results.are.presented.for.the.following.years:.2015,.2019.and.2020.(for.
comparability.of.the.countries.surveyed).
THE.STATE.OF.ETHICS.&.COMPLIANCE.IN.THE.WORKPLACE:.A.LOOK.AT.GLOBAL.TRENDS ©.2021.Ethics.Research.Center,.the.research.arm.of.the.Ethics.&.Compliance.Initiative
4
About This Report
“The strength of an organization’s ethics culture is measured through multiple indicators of employee behaviors at various levels within an organization,
including leaders, supervisors and coworkers.
”
+
Strong EthicsCulture
ReportingDecreased
OrganizationalRisk of E&CViolations
Pressure
Observed Misconduct
Retaliation
=HIGH-QUALITY E&C PROGRAM

U.S. TRENDS
In.this.report,.GBES.data.collected.from.employees.in.10.countries.from.
August.to.September.2020.are.summarized.and.compared.with.previous.
data..ECI.has.been.tracking.and.reporting.on.the.four.ethics.outcomes.in.the.United.States.for.
20.years..The.20-year.U.S..trends.are.the.primary.focus.in.this.report.to.provide.a.historic.view.
of.ECI’s.research..
As.GBES.is.a.longitudinal.research.study,.most.of.the.questions.included.in.the.2020.data.
collection.remained.the.same.or.similar.to.previous.iterations..However,.new.questions.have.
been.added.over.time.and.the.way.in.which.questions.are.asked.have.evolved.across.iterations..
Relevant.modifications.are.noted.throughout.the.report..
GLOBAL TRENDS
In.2015,.data.collection.was.expanded.to.countries.outside.of.the.U.S..Global.
trend.data.were.examined.for.three.years—2015,.2019.and.2020—for.nine.
countries:.Brazil,.China,.France,.Germany,.India,.Mexico,.Russia,.Spain.and.
the.United.Kingdom..Throughout.this.report,.the.2020.global.median.(of.all.10.countries).is.
depicted.in.graphs.to.provide.a.barometer.of.the.global.outlook..Global.data.are.also.discussed.
to.provide.context,.though.the.trends.cover.a.period.of.five.years—from.2015.to.2020...
SPECIAL CONSIDERATIONS
It.is.important.to.mention.that.the.2020.GBES.data.collection.occurred.during.the.COVID-19.
pandemic,.which.has.had.a.significant.impact.on.workplaces.and.employees.across.the.globe..
COVID-19.has.led.to.employees.working.and.organizations.operating.differently.alongside.a.
backdrop.of.upheaval.in.global.and.local.economies..Within.the.context.of.these.unusual.times,.
it.is.not.unexpected.that.employee.perceptions.of.their.workplaces.and.the.behaviors.that.take.
place.within.the.workplace.have.been.impacted.by.circumstances.that.are.far.from.“regular.
business.operations.”.Many.of.the.GBES.questions.ask.employees.to.base.their.observations.
on.the.past.12.months..This.means.that.respondents.were.answering.questions.about.their.
organizations.within.the.context.of.the.COVID-19.pandemic..While.in.some.countries.the.period.
of.impact.has.been.longer.than.in.others,.workplaces.were.grappling.with.the.pandemic.during.
a.large.portion.of.the.12.months.in.which.employees.were.asked.about.in.the.survey..To.address.
this.further,.additional.COVID-19-specific.questions.were.added.to.the.2020.GBES.to.measure.
how.employees.have.been.impacted.by.the.pandemic..These.findings.are.reported.in.a.separate.
section.of.the.report..
THE.STATE.OF.ETHICS.&.COMPLIANCE.IN.THE.WORKPLACE:.A.LOOK.AT.GLOBAL.TRENDS ©.2021.Ethics.Research.Center,.the.research.arm.of.the.Ethics.&.Compliance.Initiative
5
“The 20-year U.S. trends are the primary focus in this report to provide a historic view of ECI’s research. Global trends that cover
a period of five years are also discussed.
”

In.2016,.ECI.convened.an.independent.blue-ribbon.panel.of.former.enforcement.
officials.and.E&C.practitioners.and.academics,.and.challenged.the.group.to.
identify.the.traits.that.are.common.to.“gold.standard”.E&C.programs..The.
conclusions.of.the.group.were.published.in.the.report.titled.Principles and
Practices of High-Quality Ethics & Compliance Programs..As.part.of.our.2018.
GBES.research,.ECI.explored.the.impact.of.E&C.program.quality.on.employee.
perceptions.and.behavior..Specifically,.we.asked.U.S..employees.about.the.
presence.of.E&C.program.practices.in.their.workplace..We.also.inquired.about.the.
level.of.quality.of.those.efforts,.based.on.a.framework.developed.by.the.blue-
ribbon.panel..Finally,.we.examined.the.impact.of.E&C.programs.based.on.their.
level.of.maturity,.and.on.employees’.perceptions.and.behavior..
Two.primary.findings.emerged.that.build.the.case.for.continually.improving.E&C.
practices.and.policies:.
. 1) The stronger the culture, the greater the impact:.Eighty-four.percent.of.
employees.working.for.organizations.with.an.E&C.program.performing.at.
the.“optimizing”.level.perceived.their.organization.as.having.a.strong.ethics.
culture,.compared.with.just.13%.of.employees.working.for.organizations.with.
an.“underdeveloped”.E&C.program.3
. 2) The higher the program quality, the stronger the ethics culture: Eighty-five.
percent.of.employees.working.for.organizations.with.a.strong.ethics.culture.
indicated.observing.favorable.outcomes,.compared.with.0%.of.employees.
working.for.organizations.with.a.weak.ethics.culture.”.
ECI.research.has.also.shown.that.organizations.with.high-quality.E&C.programs.
(HQPs).are.not.only.more.likely.to.have.strong.ethics.cultures,.they.also.have.an.
impact.on.the.four.major.ethics.outcomes.in.the.following.ways:.
. •.Less.pressure.to.compromise.ethics.standards;
. •.Less.observed.misconduct;
. •.More.reporting of misconduct.observed;.and,
. •.Less.retaliation.for.reporting.
In.short,.when.these.conditions.occur,.organizations.with.HQPs.and.a.strong.
ethics.culture.have.decreased.risk.for.E&C.violations..
Results.presented.in.this.report.provide.an.overview.of.the.average.strength.of.
organizations’.ethical.cultures,.which.significantly.influences.workplace.conduct..
When.the.strength.of.an.organization’s.ethics.culture.is.weak,.the.listed.outcomes.
suffer..ECI’s.research.has.consistently.demonstrated.that.when.employees.
experience.pressure.to.compromise.their.organization’s.workplace.ethics.
standards,.there.are.higher.incidences.of.misconduct,.lower.reporting.of.the.same.
and.higher.rates.of.retaliation..In.addition,.when.organizations.are.committed.to.
ethical.leadership,.shared.values.and.building.an.ethics-focused.business.culture,4.
the.organizations.are.more.likely.to.have.strong.ethics.health.5
.
THE.STATE.OF.ETHICS.&.COMPLIANCE.IN.THE.WORKPLACE:.A.LOOK.AT.GLOBAL.TRENDS ©.2021.Ethics.Research.Center,.the.research.arm.of.the.Ethics.&.Compliance.Initiative
6
A Refresher on Workplace Culture and Ethical Behavior
3.Results.based.on.the.2018.GBES.
4.Improving.Ethical.Outcomes:.The.Role.of.Ethics.Training.(Ethics.Research.Center,.2008).
5.Reducing.Perceived.Pressure.to.Behave.Unethically:.The.Role.of.Leaders.and.Coworkers.
(Ethics.Research.Center,.2008).
“In 2000, only 10% of U.S. employees worked in an environment with a strong ethical culture (21% in 2020). In addition, only 56% of employees reported misconduct
they observed in 2000 (86% in 2020).
”
THE.STATE.OF.ETHICS.&.COMPLIANCE.IN.THE.WORKPLACE:.A.LOOK.AT.GLOBAL.TRENDS ©.2021.Ethics.Research.Center,.the.research.arm.of.the.Ethics.&.Compliance.Initiative
7
A Refresher on Workplace Culture and Ethical Behavior
Underdeveloped
% w
ith
Str
on
g C
ult
ure
s
Level of Program Quality
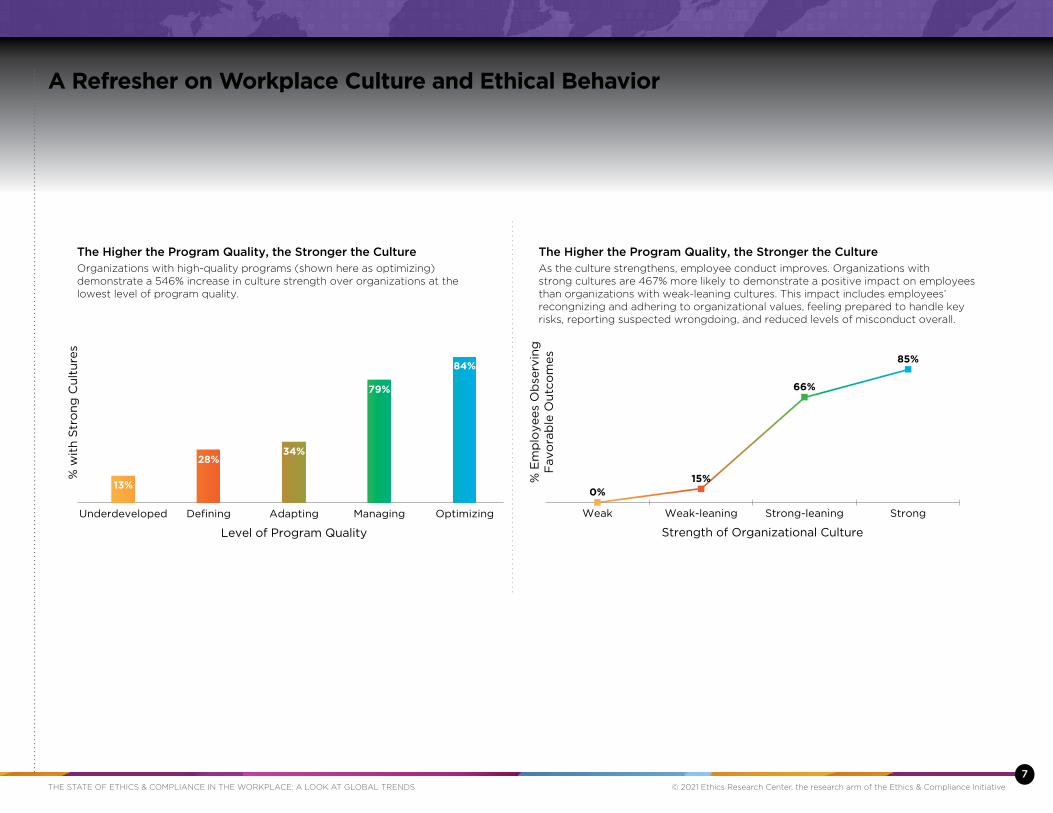
The Higher the Program Quality, the Stronger the CultureOrganizations with high-quality programs (shown here as optimizing) demonstrate a 546% increase in culture strength over organizations at the lowest level of program quality.
13%
Defining
28%
Adapting
34%
Managing
79%
Optimizing
84%
0%
% E
mp
loyees
Ob
serv
ing
Favo
rab
le O
utc
om
es
Strength of Organizational Culture
The Higher the Program Quality, the Stronger the CultureAs the culture strengthens, employee conduct improves. Organizations with strong cultures are 467% more likely to demonstrate a positive impact on employees than organizations with weak-leaning cultures. This impact includes employees’ recongnizing and adhering to organizational values, feeling prepared to handle key risks, reporting suspected wrongdoing, and reduced levels of misconduct overall.
15%
Strong-leaningWeak-leaningWeak Strong
66%
85%

Executive Summary
NOTE ON U.S. AND GLOBAL DATA:
To.compare.findings.across.survey.years,.U.S..data.in.this.report.were.based.on.
responses.from.employees.working.in.for-profit.organizations..Global.data.were.
based.on.responses.from.employees.working.in.the.for-profit,.nonprofit.and.
governmental.sectors..For.a.more.detailed.explanation.of.the.methodology,..
please.see.the.“Methodology”.section.
U.S. TRENDSAmid.the.COVID-19.pandemic,.ECI’s.2020.GBES.revealed.a.year.
of.extremes..The.promising.news.is.that.culture.strength.is.at.one.
of.its.highest.points.in.the.20-year.look.at.U.S..data,.and.employees.continued.to.
report.misconduct.they.had.observed.at.very.high.rates..Despite.the.turbulence.of.
the.pandemic,.culture.strength.and.rates.of.reporting.misconduct.remained.intact.
or.improved:.
. ..Slightly.more.than.one.in.five.U.S..employees.(21%).were.in.workplaces.with.a.
strong.ethical.culture,.mirroring.ECI’s.finding.in.2017..
. ..Continuing.a.positive.trend.that.began.after.2013,.employees.who.observed.
misconduct.in.2020.were.more.likely.to.report.their.observation.than.they.
were.in.2017.(86%.vs..69%).
These.findings.reveal.that.the.E&C.profession.in.the.United.States.continues.
to.make.substantial.progress.by.instilling.elements.that.encourage.ethical.
behavior.and.promote.ethical.culture.in.the.workplace..A.strong.ethical.culture.
is.characterized.by.accountability.for.wrongdoing,.trust.in.and.communication.
from.leadership,.and.all.employees.setting.a.good.example.of.ethical.workplace.
behavior..
However,.despite.these.positive.findings,.there.were.also.some.troubling.indicators:
. ..Employees.were.more.likely.to.feel.pressure.to.compromise.their.
organization’s.ethics.standards.(e.g.,.to.“bend.the.rules”)6.during.periods..
of.organizational.change..In.2020,.employee.pressure.was.at.the.highest..
it.has.been.in.the.United.States.since.2000,.and.it.had.more.than.doubled.
since.2017..
THE.STATE.OF.ETHICS.&.COMPLIANCE.IN.THE.WORKPLACE:.A.LOOK.AT.GLOBAL.TRENDS ©.2021.Ethics.Research.Center,.the.research.arm.of.the.Ethics.&.Compliance.Initiative
8
6.Will.the.COVID-19.Pandemic.Increase.Pressure.for.Employees.to.Bend.the.Rules?.(EthicsStat,.2020)
U.S. Trends: The Ethics Landscape (2000-2020)
STRONG ETHICAL CULTURE
PRESSURE
OBSERVED MISCONDUCT
(Based.on.Specific.Observed.
Misconduct.Index)
REPORTING(Based.on.General.
Misconduct.Reporting.Question)
RETALIATION
U.S. s21% s30% s49% s86% s79%
Source: The State of Ethics & Compliance in the Workplace: A Look at Global Trends (ECI, 2021)
. ...Based.on.ECI’s.previous.research,.we.know.that.when.there.is.increased.
pressure,.the.rate.of.observed.misconduct.also.increases..This.pattern.held.for.
2020,.although.the.rate.of.observed.misconduct.in.the.United.States.increased.
only.slightly.since.2017.and.remains.steady.in.relation.to.the.20-year.trend..
. ..Employee.perceptions.that.they.experienced.retaliation.after.reporting.
misconduct.is.also.the.highest.it.has.ever.been.in.the.United.States.and.has.
nearly.doubled.since.2017..
NOTES ON U.S. DATA
. •..The.Specific.Observed.Misconduct.Index.consists.of.16.types.of.misconduct.
that.have.been.asked.about.in.each.survey.year.since.2000..The.rate.of.
observed.misconduct.is.based.on.the.percentage.of.respondents.who.
observed.at.least.one.of.the.16.types.of.misconduct.
. •..The.percentages.for.reporting.and.retaliation.are.based.on.the.general.
observed.misconduct.question..This.is.to.allow.for.year-over-year.comparisons.
beginning.in.2000.
“Based on ECI’s previous research, we know that when there is increased pressure, the rate of observed misconduct also increases.
”

Management Level—U.S.7..
When.analyzing.the.data,.ECI.found.that.an.employee’s.level.within.their.
organization.was.associated.with.employee’s.perspectives.across.all.five.of.
the.key.indicators..The.differences.between.top.managers.and.individual.
contributors.were.particularly.pronounced..
These.findings.revealed.a.mixed.picture.regarding.management.level.and.
ethics.culture..Top.managers.were.more.likely.to.say.they.worked.in.strong.
ethical.cultures,.but.they.were.also.more.likely.to.say.they.experienced.
pressure,.observed.misconduct.and.experienced.retaliation..Some.of.this.
may.be.due.to.top.managers’.tendencies.to.ignore.issues.and.evaluate.
themselves,.their.coworkers.and.their.peers.more.favorably.than.may.be.
warranted..However,.other.factors.are.likely.at.play,.and.those.are.explored.in.
more.detail.throughout.this.report..
Ethics & Compliance Program Effectiveness
ECI.also.examined.the.extent.to.which.management.level.was.associated.
with.E&C.program.effectiveness.8.The.data.showed.that.employees.working.
in.management.positions.were.much.more.likely.to.indicate.they.worked.
in.organizations.with.effective.programs..However,.rates.of.program.
effectiveness.are.still.far.behind.where.they.need.to.be..Only.slightly.more.
than.one-half.(55%).of.top-management.employees.indicated.working.in.
an.organization.with.an.effective.E&C.program,.and.fewer.than.one.in.four.
(23%).non-management.employees.indicated.the.same..
THE.STATE.OF.ETHICS.&.COMPLIANCE.IN.THE.WORKPLACE:.A.LOOK.AT.GLOBAL.TRENDS ©.2021.Ethics.Research.Center,.the.research.arm.of.the.Ethics.&.Compliance.Initiative
9
7.Management-level.data.are.based.on.GBES.U.S..data.from.2020.or.2017..Unless.noted,.all.
management-level.data.is.based.on.GBES.U.S..data.from.2020...
8.ECI.measures.program.effectiveness.through.a.series.of.questions.about.program.elements.and.
the.extent.to.which.employees.feel.comfortable.raising.concerns.
Management Level—U.S. (2020)
STRONG ETHICAL CULTURE
PRESSURE
OBSERVED MISCONDUCT
(Based.on.Specific.Observed.
Misconduct.Index)
REPORTING(Based.on.General.
Misconduct.Reporting.Question)
RETALIATION
Top Managers 33% 51% 62% 95% 92%
Non- management 17% 12% 34% 64% 45%
Source: The State of Ethics & Compliance in the Workplace: A Look at Global Trends (ECI, 2021)
“Culture strength in the U.S. is at one of its highest points in 20 years, yet more can be done, and little progress has been made since 2017 to implement one of the most important strategies to mitigate wrongdoing.
”
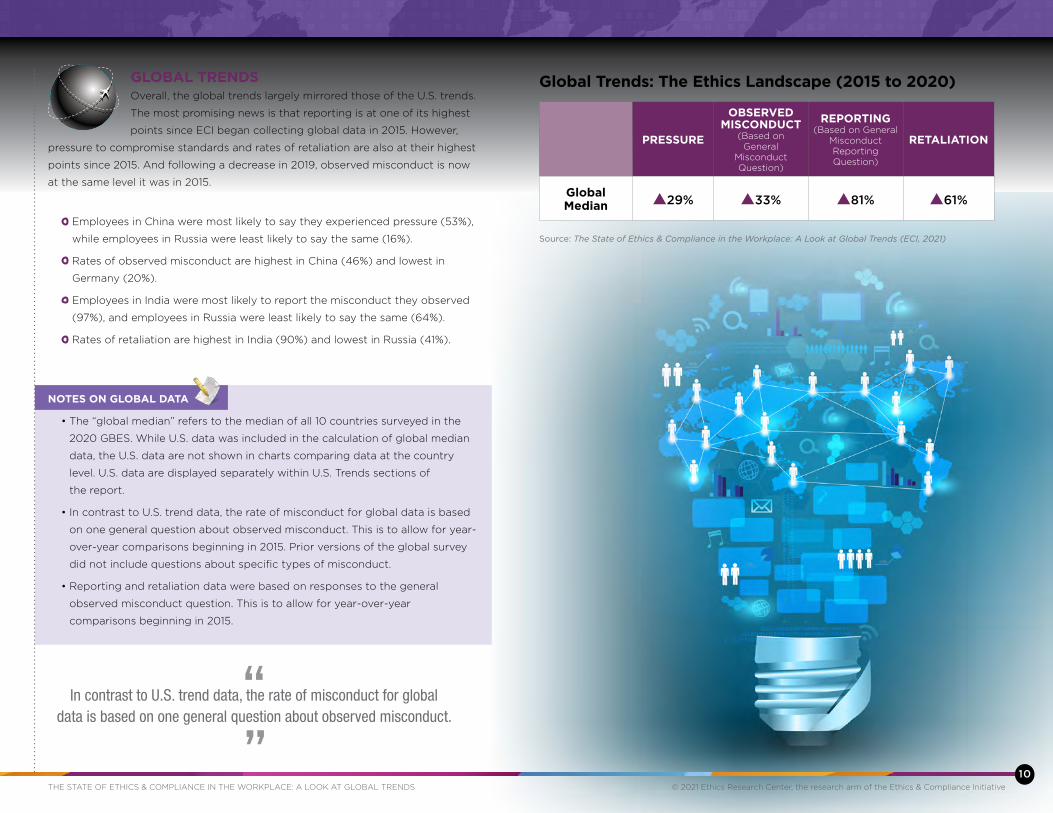
GLOBAL TRENDSOverall,.the.global.trends.largely.mirrored.those.of.the.U.S..trends..
The.most.promising.news.is.that.reporting.is.at.one.of.its.highest.
points.since.ECI.began.collecting.global.data.in.2015..However,.
pressure.to.compromise.standards.and.rates.of.retaliation.are.also.at.their.highest.
points.since.2015..And.following.a.decrease.in.2019,.observed.misconduct.is.now.
at.the.same.level.it.was.in.2015..
. ..Employees.in.China.were.most.likely.to.say.they.experienced.pressure.(53%),.
while.employees.in.Russia.were.least.likely.to.say.the.same.(16%)..
. ..Rates.of.observed.misconduct.are.highest.in.China.(46%).and.lowest.in.
Germany.(20%)..
. ..Employees.in.India.were.most.likely.to.report.the.misconduct.they.observed.
(97%),.and.employees.in.Russia.were.least.likely.to.say.the.same.(64%)..
. ..Rates.of.retaliation.are.highest.in.India.(90%).and.lowest.in.Russia.(41%)..
NOTES ON GLOBAL DATA
. •..The.“global.median”.refers.to.the.median.of.all.10.countries.surveyed.in.the.
2020.GBES..While.U.S..data.was.included.in.the.calculation.of.global.median.
data,.the.U.S..data.are.not.shown.in.charts.comparing.data.at.the.country.
level..U.S..data.are.displayed.separately.within.U.S..Trends.sections.of..
the.report..
. •..In.contrast.to.U.S..trend.data,.the.rate.of.misconduct.for.global.data.is.based.
on.one.general.question.about.observed.misconduct..This.is.to.allow.for.year-
over-year.comparisons.beginning.in.2015..Prior.versions.of.the.global.survey.
did.not.include.questions.about.specific.types.of.misconduct.
. •..Reporting.and.retaliation.data.were.based.on.responses.to.the.general.
observed.misconduct.question..This.is.to.allow.for.year-over-year.
comparisons.beginning.in.2015..
THE.STATE.OF.ETHICS.&.COMPLIANCE.IN.THE.WORKPLACE:.A.LOOK.AT.GLOBAL.TRENDS ©.2021.Ethics.Research.Center,.the.research.arm.of.the.Ethics.&.Compliance.Initiative
10
“In contrast to U.S. trend data, the rate of misconduct for global data is based on one general question about observed misconduct.
”
Global Trends: The Ethics Landscape (2015 to 2020)
PRESSURE
OBSERVED MISCONDUCT
(Based.on.General.
Misconduct.Question)
REPORTING(Based.on.General.
Misconduct.Reporting.Question)
RETALIATION
Global Median s29% s33% s81% s61%
Source: The State of Ethics & Compliance in the Workplace: A Look at Global Trends (ECI, 2021)

Higher-quality E&C programs are linked with stronger cultures.
The single most significant influence on employee conduct is
culture. In strong cultures, wrongdoing is significantly reduced.
U.S. TRENDS
Based.on.ECI’s.Culture.Strength.Index,9.more.than.
one.in.five.U.S..employees.(21%).indicated.that.their.
organization.has.such.an.environment..While culture strength is among
the highest it has been since 2000, it remained mostly unchanged over
the past decade (and since 2017). Given.that.culture.is.the.most.influential.
determinant.of.employee.conduct,10.more.work.needs.to.be.done.to.
improve.culture.strength,.especially.during.these.challenging.times..
Management Level and Culture Strength—U.S.
Top.managers.have.consistently.had.more.favorable.views.of.their.
organizations’.ethical.culture.than.all.other.employees..This.pattern.held.in.
2020;.however,.the.gap.between.top.management.and.non-management.
employees.decreased.to.its.smallest.point.since.2011..Between.2013.and.
2020,.the.percentage.of.top.management.employees.who.experienced.a.
strong.culture.decreased.by.11.percentage.points.while.there.was.only.a.
one.percentage.point.decrease.among.non-management.employees..
.
The.weakening.of.a.perceived.ethical.culture.(in.their.organization).among.
top.management.is.mirrored.by.increases.in.three.key.ethics.outcomes—
pressure,.misconduct.and.retaliation—and.these.three.areas.will.be.
explored.in.more.detail.throughout.this.report..
Source: The State of Ethics & Compliance in the Workplace: A Look at Global Trends (ECI, 2021)
Culture Strength Index—U.S.Percentage of Employees Experiencing Strong Ethical Cultures
2000
2003
2005
2007
2009
2011
2013
2017
2020
2020
Glo
bal
Med
ian
10%12%
16%
21%
24%
20%18%
21% 21%
14%
20%
40%
60%
80%
100%
2009
2011
2013
2017
2020
Source: The State of Ethics & Compliance in the Workplace: A Look at Global Trends (ECI, 2021)
Top management
Culture Strength Index—Management Level—U.S.Percentage of Employees Experiencing Strong Ethical Cultures
Middle management First-line supervisor Non-management
THE.STATE.OF.ETHICS.&.COMPLIANCE.IN.THE.WORKPLACE:.A.LOOK.AT.GLOBAL.TRENDS ©.2021.Ethics.Research.Center,.the.research.arm.of.the.Ethics.&.Compliance.Initiative
11
Trend 1 Ethical Culture Strength Remains High
9.Employee.perceptions.are.grouped.together.to.form.ECI’s.Culture.Strength.Index..Survey.items.
that.make.up.the.index.include.the.following:.(1).accountability.of.top.management,.supervisors.
and.non-management.employees;.(2).satisfaction.with.information.from.top.management.and.
supervisors.about.what.is.going.on.in.the.organization;.(3).trust.that.top.management.and.
supervisors.will.keep.their.promises.and.commitments;.and.(4).top.management,.supervisors.and.
coworkers.set.a.good.example.of.ethical.workplace.behavior.
10.See.“A.Refresher.on.Workplace.Culture”.on.page.7.
Culture Strength Index—U.S.
Culture Strength Index—Management Level—U.S.

GLOBAL TRENDS Regardless.of.the.country,.most.employees.did.not.work.
in.organizations.with.strong.ethical.cultures..The.global.
median.for.strong.cultures.was.14%..Employees.from.India.
were.the.most.likely.to.perceive.working.in.a.strong.ethics.culture.(28%);.
employees.from.France.were.the.least.likely.(8%)..
Source: The State of Ethics & Compliance in the Workplace: A Look at Global Trends (ECI, 2021)
Culture Strength Index—GlobalPercentage of Employees Experiencing Strong Ethical Cultures
Mex
ico
Brazil
Franc
e
Ger
man
y
Spain
U.K.
China
India
Russia
Glo
bal
Med
ian
23%25%
8%11%
13% 13% 14%
28%
9%
14%
THE.STATE.OF.ETHICS.&.COMPLIANCE.IN.THE.WORKPLACE:.A.LOOK.AT.GLOBAL.TRENDS ©.2021.Ethics.Research.Center,.the.research.arm.of.the.Ethics.&.Compliance.Initiative
12
“Regardless of the country, most employees did not work in organizations with strong ethical cultures.
”

THE.STATE.OF.ETHICS.&.COMPLIANCE.IN.THE.WORKPLACE:.A.LOOK.AT.GLOBAL.TRENDS ©.2021.Ethics.Research.Center,.the.research.arm.of.the.Ethics.&.Compliance.Initiative
13
Pressure to compromise standards serves as a warning signal for
both ongoing and future misconduct. Employees working in high-
pressure organizations are much more likely to observe misconduct
in their workplace.
U.S. TRENDS
In.2020,.30%.of.U.S..employees.agreed.that.they.experienced.
pressure.to.compromise.their.organization’s.workplace.ethics.standards,.a.14.
percentage.point.increase.since.2017.11.This.is.part.of.an.ongoing.trend;.pressure.
has.consistently.increased.over.the.last.decade..Some of the double-digit
increase in pressure between 2017 and 2020 was likely due to the COVID-19
pandemic (See Special Section: COVID-19 and the Impact on Employees).
In.the.U.S.,.44%.of.employees.said.they.were.experiencing.more.work-related.
pressure.compared.with.the.time.before.the.COVID-19.pandemic..
Trend 2 Pressure to Compromise Standards Is the Highest It Has Ever Been
Source: The State of Ethics & Compliance in the Workplace: A Look at Global Trends (ECI, 2021)
Percentage of Employees Experiencing Pressure—U.S.
2000
2003
2005
2007
2009
2011
2013
2017
2020
2020
Glo
bal
Med
ian
14%
11% 11%10% 8%
13% 13%
16%
30% 29%
11.Response.options.changed.from.“Yes”.and.“No”.in.2017.to.an.agreement.scale.(“Strongly.agree”.
to.“Strongly.disagree”).in.2020..The.percentage.of.employees.who.indicated.“Strongly.agree”.or.
“Agree”.in.2020.were.combined.and.compared.with.the.percentage.of.employees.who.indicated.
“Yes”.in.2017.
Management Level and Pressure to Compromise Standards—U.S.Historically,.ECI.research.has.shown.that.top.management.and.middle.
management.have.experienced.more.pressure.than.first-line.supervisors.or.
non-management.employees..Results.from.the.2020.GBES.reveal.a.similar.
relationship.between.management.level.and.pressure;.however,.the.difference.
between.non-management.and.top-management.is.much.more.pronounced.
In.2020,.12%.of.non-management.employees.said.they.experienced.pressure.
to.compromise.standards,.while.51%.of.top.managers.and.63%.of.middle.
managers.said.the.same..
..
One.reason.for.the.shift.in.2020.appears.to.be.the.increase.in.organizational.
transitions.that.are.taking.place,.largely.due.to.COVID-19.and.its.economic.
impact..Research.by.ECI.has.shown.that.organizational.change.adversely.
20%
40%
60%
80%
100%
2009
2011
2013
2017
2020
Source: The State of Ethics & Compliance in the Workplace: A Look at Global Trends (ECI, 2021)
Top management
Percentage of Employees Experiencing Pressure—Management Level—U.S.
Middle management First-line supervisor Non-management

THE.STATE.OF.ETHICS.&.COMPLIANCE.IN.THE.WORKPLACE:.A.LOOK.AT.GLOBAL.TRENDS ©.2021.Ethics.Research.Center,.the.research.arm.of.the.Ethics.&.Compliance.Initiative
14
AT LEAST ONE ORGANIZATIONAL CHANGE— MANAGEMENT LEVEL—U.S.
2017At.Least.One.
Organizational.Change
2020At.Least.One.
Organizational.Change
PERCENTAGE POINT CHANGE
SINCE 2017
Top Management 53% 63% +10
Middle Management 65% 71% +6
First-line Supervisor 66% 53% -13
Non-management 58% 40% -18
Source: The State of Ethics & Compliance in the Workplace: A Look at Global Trends (ECI, 2021)
12.Pressure.to.Bend.the.Rules?.-.EthicsStat.(ECI,.2019)
affects.ethics.outcomes,.including.pressure.to.compromise.standards.12.
When.compared.with.2017,.top.managers.and.middle.managers.in.2020.
were.more.likely.to.say.they.experienced.at.least.one.organizational.
change,.while.first-line.supervisors.and.non-managers.were.less.likely.
to.say.that.their.organization.had.undergone.at.least.one.organizational.
change.
While.not.the.only.reason.for.the.increase.in.pressure,.top.management.
and.middle.management’s.awareness.of.and/or.involvement.in.major.
organizational.changes.appears.to.be.a.key.driver.of.the.higher.rates.of.
pressure.that.occurred.in.2020..
THE.STATE.OF.ETHICS.&.COMPLIANCE.IN.THE.WORKPLACE:.A.LOOK.AT.GLOBAL.TRENDS ©.2021.Ethics.Research.Center,.the.research.arm.of.the.Ethics.&.Compliance.Initiative
15
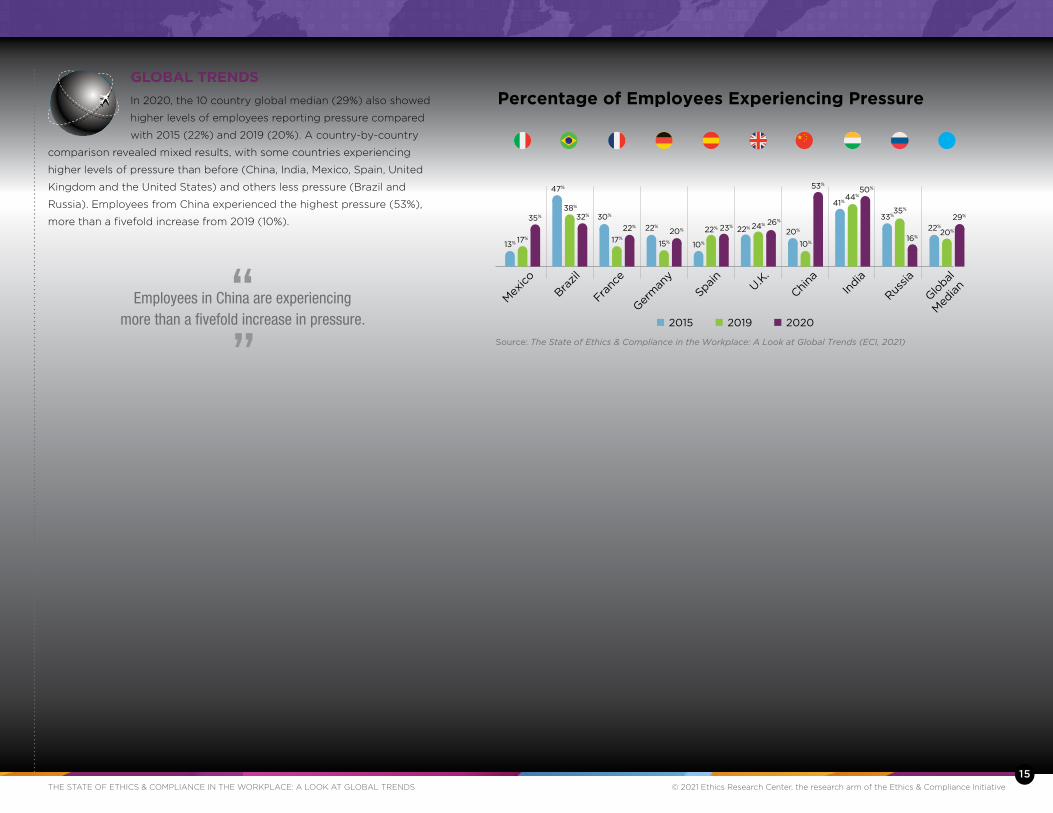
GLOBAL TRENDS.
In.2020,.the.10.country.global.median.(29%).also.showed.
higher.levels.of.employees.reporting.pressure.compared.
with.2015.(22%).and.2019.(20%)..A.country-by-country.
comparison.revealed.mixed.results,.with.some.countries.experiencing.
higher.levels.of.pressure.than.before.(China,.India,.Mexico,.Spain,.United.
Kingdom.and.the.United.States).and.others.less.pressure.(Brazil.and.
Russia)..Employees.from.China.experienced.the.highest.pressure.(53%),.
more.than.a.fivefold.increase.from.2019.(10%)..
Source: The State of Ethics & Compliance in the Workplace: A Look at Global Trends (ECI, 2021)
Percentage of Employees Experiencing Pressure
Mex
ico
Brazil
Franc
e
Ger
man
y
Spain
U.K.
China
India
Russia
Glo
bal
Med
ian
2015 2019 2020
35%
17%
13%
53%
10%
20%22%
17%
30%
16%
35%
33% 29%
20%22%20%
15%
22%26%
24%22%
50%
44%
41%
32%38%
47%
22%
10%
23%
“Employees in China are experiencing more than a fivefold increase in pressure.
”

THE.STATE.OF.ETHICS.&.COMPLIANCE.IN.THE.WORKPLACE:.A.LOOK.AT.GLOBAL.TRENDS ©.2021.Ethics.Research.Center,.the.research.arm.of.the.Ethics.&.Compliance.Initiative
16
Trend 3 Observed Misconduct—While Steady—Is Inching Upwards
The rate at which employees observe misconduct is a
fundamental indicator of the strength of an organization’s ethics
culture. Organizations with high rates of misconduct are likely
to have ineffective E&C programs, a lack of accountability, and
senior leaders that fail to communicate the importance of ethics
in the workplace.
U.S. TRENDS
In.2020,.49%.of.U.S..employees.reported.observing.
misconduct.(based.on.the.Specific.Observed.Misconduct.
Index).that.violated.their.organization’s.ethics.standards,13.an.increase.of.
two.percentage.points.from.2017..The.percentage.of.observed.misconduct.
reached.its.peak.at.54%.in.2007.(prior.to.the.Great.Recession),.and.then.
trended.downward.until.2011.(45%)..In.2013,.it.reached.another.peak.of.
51%..The.2020.finding.reveals.that.misconduct.has.begun.to.increase.again.
following.a.decline.in.2017..
Types of Observed Misconduct
The.most.frequently.observed.types.of.misconduct.rose.between.2017.and.
2020,.presenting.a.not-so-rosy.picture.for.select.kinds.of.behavior,.including.
management.lying.to.employees.(21%.in.2017.vs..25%.in.2020),14.conflicts.of.
interest.(15%.in.2017.vs..23%.in.2020),.improper.hiring.practices.(12%.in.2017.
vs..22%.in.2020),.abusive.behavior.(21%.in.2017.vs..22%.in.2020),15.and.health.
violations.(15%.in.2017.vs..22%.in.2020)..
These.five.most.common.types.of.misconduct.largely.fall.under.the.category.
of.fraud,.waste.and.abuse..When.taken.together,.nearly.one-half.(49%).of.
U.S..employees.observed.at.least.one.incident.of.fraud,.waste.and/or.abuse..
.
Source: The State of Ethics & Compliance in the Workplace: A Look at Global Trends (ECI, 2021)
Note: Due to methodological differences among survey years, it is not possible to compare U.S. and global data related to observed misconduct.
Percentage of Employees that Observed Misconduct(Based on the Specific Observed Misconduct Index)
2000
2003
2005
2007
2009
2011
2013
2017
2020
51%
45%
52% 54%49%
45%
51%47% 49%
13.Specific.misconduct.roll-up.–.Respondents.indicated.they.observed.at.least.one.of.16.specific.
types.of.misconduct.also.measured.in.2000,.2003,.2005,.2007,.2009,.2011,.2013.and.2017.
14.The.wording.of.the.item.was.slightly.different.on.the.2017.and.2020.GBESs.(“Lying.to.
employees”.and.“Management.lying.to.employees,”.respectively).
15.The.wording.of.the.item.was.slightly.different.on.the.2017.and.2020.GBESs.(“Behavior.that.is.
abusive,.intimidating,.or.creates.a.hostile.work.environment”.and.“Abusive,.intimidating.or.hostile.
behavior,”.respectively).
16.“Favoritism.toward.certain.employees”.was.not.asked.in.the.2017.GBES.
MOST COMMON TYPES OF OBSERVED MISCONDUCT—U.S.
2017 2020PERCENTAGE
POINT CHANGE SINCE 2017
Observed favoritism toward certain employees16
-- 35% -
Observed management lying to employees
21% 25% +4
Observed conflicts of interest 15% 23% +8
Observed improper hiring practices 12% 22% +10
Observed abusive behavior 21% 22% +1
Observed health violations 15% 22% +7
Source: The State of Ethics & Compliance in the Workplace: A Look at Global Trends (ECI, 2021)

Management Level and Observed Misconduct—U.S..
Historically,.GBES.surveys.have.revealed.that.non-management.and.
first-line.supervisor.employees.observe.approximately.the.same.or.
more.misconduct.than.middle.managers.or.top.managers..In.2020,.this.
relationship.reversed;.top.managers.and.middle.management.observed.
more.misconduct.than.first-line.supervisors.and.non-managers.
.
What.is.driving.this.difference?.Between.2017.and.2020,.the.rates.at.which.
non-management.employees.observed.three.of.the.four.most.common.
types.of.misconduct.decreased..In.contrast,.top.managers.observed.all.of.
the.most.common.types.of.misconduct.at.much.higher.rates.in.2020..Most.
notably,.over.one-third.(38%).of.top-management.employees.observed.
conflicts.of.interest,.while.fewer.than.one.in.ten.(9%).non-management.
employees.observed.the.same.
THE.STATE.OF.ETHICS.&.COMPLIANCE.IN.THE.WORKPLACE:.A.LOOK.AT.GLOBAL.TRENDS ©.2021.Ethics.Research.Center,.the.research.arm.of.the.Ethics.&.Compliance.Initiative
17
20%
40%
60%
80%
100%
2009
2011
2013
2017
2020
Source: The State of Ethics & Compliance in the Workplace: A Look at Global Trends (ECI, 2021)
Top management
Percentage of Employees Observing Misconduct—Management Level—U.S.
Middle management First-line supervisor Non-management
(Based on the Specific Observed Misconduct Index)
2017Top.
Management
2020Top.
Management
PERCENTAGE POINT
CHANGE SINCE 2017
Observed improper hiring practices
18% 32% +14
Observed abusive behavior
23% 32% +9
Observed conflicts of interest
22% 38% +16
Observed health violations
21% 34% +13
2017Top.
Management
2020Top.
Management
PERCENTAGE POINT
CHANGE SINCE 2017
10% 12% +2
20% 16% -4
12% 9% -3
13% 13% 0
Source: The State of Ethics & Compliance in the Workplace: A Look at Global Trends (ECI, 2021)
OBSERVED MISCONDUCT: 2017 VS. 2020—MANAGEMENT LEVEL—U.S.“Historically, GBES surveys have revealed that non-management and first-line supervisor employees observe approximately the same or more misconduct than middle
managers or top managers.
”

THE.STATE.OF.ETHICS.&.COMPLIANCE.IN.THE.WORKPLACE:.A.LOOK.AT.GLOBAL.TRENDS ©.2021.Ethics.Research.Center,.the.research.arm.of.the.Ethics.&.Compliance.Initiative
18
SPECIFIC TYPES OF MISCONDUCT
2020Global.Median
2020U.S.
Observed favoritism toward certain employees
35% 35%
Observed management lying to employees
26% 25%
Observed conflicts of interest 25% 23%
Observed improper hiring practices
27% 22%
Observed abusive behavior 25% 22%
Observed health violations 24% 22%
Source: The State of Ethics & Compliance in the Workplace: A Look at Global Trends (ECI, 2021)
Percentage of Employees Observing Misconduct—Global
Mex
ico
Brazil
Franc
e
Ger
man
y
Spain
U.K.
China
India
Russia
Glo
bal
Med
ian
2015 2019 2020
(Based on the General Misconduct Question)
33%
29%33%
25%25%
33%
20%26%26% 27%
24%21% 23%25%
29%
46%
20%
34% 33%
25%
33%34%34%
45%
39%38%40%
40%44%
43%
“France, Germany, Spain and the United Kingdom tout low rates of observed misconduct in 2020. In China, a different trend emerged. Observed misconduct in China was higher in 2020 than in 2015 and 2019.
”
GLOBAL TRENDS
The.2020.global.median.(33%).for.observed.misconduct.
(based.on.the.general.misconduct.question).is.the.same.as.
in.2015,.although.there.was.a.slight.dip.in.2019.(25%)...
The.country-by-country.comparison.shows.that.some.countries.had.a.
decrease.in.misconduct.while.others.remained.about.the.same.or.increased.
slightly..Employees.in.China.observed.misconduct.at.the.highest.level.in.
2020.(46%),.and.comparatively.higher.than.their.rates.in.2015.(34%).and.
2019.(20%)..
Overall,.the.most.common.types.of.misconduct.were.consistent.across.
employees.regardless.of.their.location..In.the.United.States,.the.most.
common.type.of.misconduct.was.favoritism.toward.certain.employees,.
and,.the.same.was.true.for.employees.in.other.countries..
Source: The State of Ethics & Compliance in the Workplace: A Look at Global Trends (ECI, 2021)
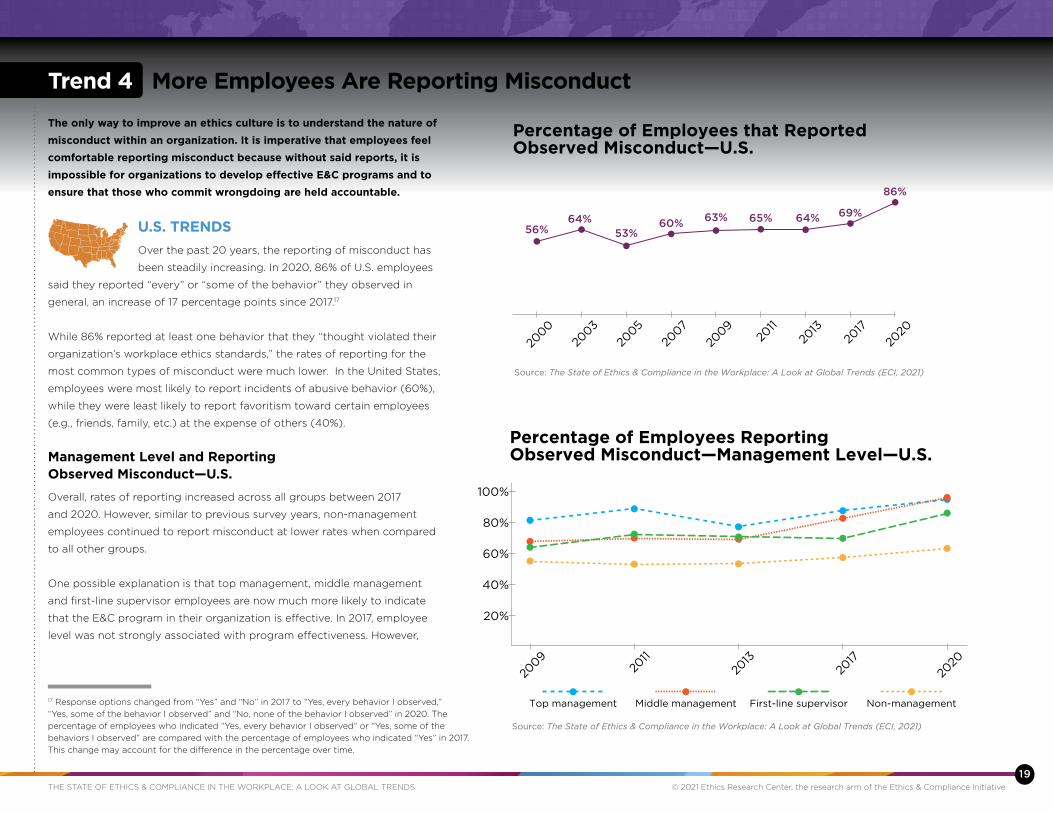
The only way to improve an ethics culture is to understand the nature of
misconduct within an organization. It is imperative that employees feel
comfortable reporting misconduct because without said reports, it is
impossible for organizations to develop effective E&C programs and to
ensure that those who commit wrongdoing are held accountable.
U.S. TRENDS
Over.the.past.20.years,.the.reporting.of.misconduct.has.
been.steadily.increasing..In.2020,.86%.of.U.S..employees.
said.they.reported.“every”.or.“some.of.the.behavior”.they.observed.in.
general,.an.increase.of.17.percentage.points.since.2017.17
.
While.86%.reported.at.least.one.behavior.that.they.“thought.violated.their.
organization’s.workplace.ethics.standards,”.the.rates.of.reporting.for.the.
most.common.types.of.misconduct.were.much.lower...In.the.United.States,.
employees.were.most.likely.to.report.incidents.of.abusive.behavior.(60%),.
while.they.were.least.likely.to.report.favoritism.toward.certain.employees.
(e.g.,.friends,.family,.etc.).at.the.expense.of.others.(40%)..
Management Level and Reporting Observed Misconduct—U.S.
Overall,.rates.of.reporting.increased.across.all.groups.between.2017.
and.2020..However,.similar.to.previous.survey.years,.non-management.
employees.continued.to.report.misconduct.at.lower.rates.when.compared.
to.all.other.groups..
..
One.possible.explanation.is.that.top.management,.middle.management.
and.first-line.supervisor.employees.are.now.much.more.likely.to.indicate.
that.the.E&C.program.in.their.organization.is.effective..In.2017,.employee.
level.was.not.strongly.associated.with.program.effectiveness..However,.
Source: The State of Ethics & Compliance in the Workplace: A Look at Global Trends (ECI, 2021)
Percentage of Employees that Reported Observed Misconduct—U.S.
2000
2003
2005
2007
2009
2011
2013
2017
2020
56%64%
53%60% 63% 65% 64% 69%
86%
20%
40%
60%
80%
100%
2009
2011
2013
2017
2020
Source: The State of Ethics & Compliance in the Workplace: A Look at Global Trends (ECI, 2021)
Top management
Percentage of Employees Reporting Observed Misconduct—Management Level—U.S.
Middle management First-line supervisor Non-management
THE.STATE.OF.ETHICS.&.COMPLIANCE.IN.THE.WORKPLACE:.A.LOOK.AT.GLOBAL.TRENDS ©.2021.Ethics.Research.Center,.the.research.arm.of.the.Ethics.&.Compliance.Initiative
19
Trend 4 More Employees Are Reporting Misconduct
17.Response.options.changed.from.“Yes”.and.“No”.in.2017.to.“Yes,.every.behavior.I.observed,”.
“Yes,.some.of.the.behavior.I.observed”.and.“No,.none.of.the.behavior.I.observed”.in.2020..The.
percentage.of.employees.who.indicated.“Yes,.every.behavior.I.observed“.or.“Yes,.some.of.the.
behaviors.I.observed”.are.compared.with.the.percentage.of.employees.who.indicated.“Yes”.in.2017..
This.change.may.account.for.the.difference.in.the.percentage.over.time.

THE.STATE.OF.ETHICS.&.COMPLIANCE.IN.THE.WORKPLACE:.A.LOOK.AT.GLOBAL.TRENDS ©.2021.Ethics.Research.Center,.the.research.arm.of.the.Ethics.&.Compliance.Initiative
20
in.2020,.all.groups—except.for.non-management.employees—were.
substantially.more.likely.to.indicate.that.there.was.an.effective.program.in.
their.organization..
In.addition.to.the.relatively.low.rates.of.program.effectiveness,.non-
management.employees.continue.to.lack.confidence.in.the.reporting.
processes.at.their.organizations..In.2020,.35%.of.non-management.
employees.indicated.that.they.did.not.report.an.incident.of.misconduct.
because.they.did.not.believe.corrective.action.would.be.taken..In.addition,.
32%.of.non-management.employees.said.that.they.did.not.trust.that.their.
report.would.be.kept.anonymous,.with.another.29%.indicating.the.same.
about.their.report.being.kept.confidential..
2017E&C.program.is.effective
2020E&C.program.is.effective
PERCENTAGE POINT CHANGE
SINCE 2017
Top management 18% 55% +37
Middle management 17% 68% +51
First-line supervisor 15% 42% +27
Non-management 16% 23% +7
Source: The State of Ethics & Compliance in the Workplace: A Look at Global Trends (ECI, 2021)
PROGRAM EFFECTIVENESS: 2017 VS. 2020— MANAGEMENT LEVEL—U.S.

THE.STATE.OF.ETHICS.&.COMPLIANCE.IN.THE.WORKPLACE:.A.LOOK.AT.GLOBAL.TRENDS ©.2021.Ethics.Research.Center,.the.research.arm.of.the.Ethics.&.Compliance.Initiative
21
Source: The State of Ethics & Compliance in the Workplace: A Look at Global Trends (ECI, 2021)
Percentage of Employees that Reported Observed Misconduct—Global
Mex
ico
Brazil
Franc
e
Ger
man
y
Spain
U.K.
China
India
Russia
Glo
bal
Med
ian
2015 2019 2020
85%
74%
63%
83%
63%
53%
78%
53%
50%
76%
58%
46%
64%
60%
37%
81%
63%
58%
77%
53%50%
82%
78%
71%
79%
64%64%
GLOBAL TRENDS
The.global.median.for.reporting.misconduct.was.81%.in.
2020,.compared.with.58%.in.2015.and.63%.in.2019..The.
reporting.of.misconduct.across.all.countries.was.highest.in.
2020.and.in.most.countries.had.been.increasing.since.2015..The.reporting.
of.misconduct.was.highest.in.India.(97%),.followed.by.the.United.States.
(86%),.Mexico.(85%),.France.(82%).and.the.United.Kingdom.(82%)..Russia.
had.the.lowest.level.of.reporting.(64%)..
PERCENTAGE OF EMPLOYEES REPORTING MOST COMMONLY
OBSERVED MISCONDUCT
2020Global.Median
2020U.S.
Reported favoritism toward certain employees
38% 40%
Reported management lying to employees
43% 46%
Reported improper hiring practices 40% 52%
Reported abusive behavior 58% 60%
Reported conflicts of interest 44% 59%
Reported health violations 59% 59%
Source: The State of Ethics & Compliance in the Workplace: A Look at Global Trends (ECI, 2021)

Retaliation against reporters is one of the most intractable issues that
organizations must address. Retaliation can take many forms, and it
is often difficult to isolate and prevent. However, it is imperative that
organizations investigate retaliation and make it clear that there is no
tolerance for it within their organization.
U.S. TRENDS
ECI.has.been.tracking.employee.perceptions.of.retaliation.
due.to.the.reporting.of.misconduct.since.2007..Since.that.
time,.retaliation.has.been.increasing,.with.a.jump.from.22%.in.2013.to.44%.
in.2017..In.2020,.the.rate.of.retaliation18.against.employees.for.reporting.
wrongdoing.in.the.U.S..was.79%.in.2020,.an.increase.of.35.percentage.
points..If.left.unaddressed,.high.rates.of.retaliation.can.erode.ethical.culture.
and.undermine.efforts.to.encourage.employees.to.speak.up.and.raise.
concerns..
MANAGEMENT LEVEL AND RETALIATION—U.S.
Retaliation.is.at.an.all-time.high.across.all.management.levels,.with.
top.managers.and.middle.managers.driving.much.of.this.increase.in.
recent.years..Between.2013.and.2020,.rates.of.retaliation.among.top.
managers.and.middle.managers.increased.by.62.and.67.percentage.
points.respectively..In.contrast,.retaliation.rates.among.non-management.
employees.increased.by.24.percentage.points..
Source: The State of Ethics & Compliance in the Workplace: A Look at Global Trends (ECI, 2021)
Percentage of Employees Experiencing Retaliation After Reporting—U.S.
2007
2020
Glo
bal
Med
ium
13%
2009
15%
2011
21%
2013
22%
2017
44%
2020
79%
61%
THE.STATE.OF.ETHICS.&.COMPLIANCE.IN.THE.WORKPLACE:.A.LOOK.AT.GLOBAL.TRENDS ©.2021.Ethics.Research.Center,.the.research.arm.of.the.Ethics.&.Compliance.Initiative
22
Trend 5 Retaliation Rates Have Skyrocketed
18.Response.options.changed.from.“Yes”.and.“No”.in.2017.to.“Yes,.after.every.report,”.“Yes,.
after.some.of.the.reports”.and.“No,.I.never.experienced.retaliation”.in.2020..The.percentage.
of.employees.who.indicated.one.of.the.“Yes”.responses.in.2020.were.combined.and.
compared.with.the.percentage.of.employees.who.indicated.“Yes”.in.2017.
20%
40%
60%
80%
100%
2009
2011
2013
2017
2020
Source: The State of Ethics & Compliance in the Workplace: A Look at Global Trends (ECI, 2021)
Top management
Percentage of Employees Experiencing Retaliation After Reporting—Management Level—U.S.
Middle management First-line supervisor Non-management
“Instances of retaliation against employees continue to increase in the U.S.
”

THE.STATE.OF.ETHICS.&.COMPLIANCE.IN.THE.WORKPLACE:.A.LOOK.AT.GLOBAL.TRENDS ©.2021.Ethics.Research.Center,.the.research.arm.of.the.Ethics.&.Compliance.Initiative
23
Source: The State of Ethics & Compliance in the Workplace: A Look at Global Trends (ECI, 2021)
Percentage of Employees Experiencing Retaliation After Reporting—Global
Mex
ico
Brazil
Franc
e
Ger
man
y
Spain
U.K.
China
India
Russia
Glo
bal
Med
ian
2015 2019 2020
43%
29%31%
53%
29%
37%
64%
47%
33%
73%
33%
50%
59%
34%
43%
74%
66%
63%
54%
26%29%
41%
26%
34%
61%
33%
40%
90%
86%
74%
PERCENTAGE OF EMPLOYEES EXPERIENCING
SPECIFIC TYPES OF RETALIATION
2020Global.Median
2020U.S.
Other employees intentionally ignored me or began treating me differently
25% 24%
My supervisor intentionally ignored me or began treating me differently
22% 23%
I was verbally abused by my supervisor or someone else in management
18% 22%
My supervisor excluded me from decisions and/or work activity 16% 20%
I was given a poor performance review 21% 19%
A manager or managers other than my supervisor excluded me from decisions and/or work activity
16% 19%
Personal or work items were stolen from me 11% 19%
I was verbally abused by other employees 18% 19%
My property was damaged 12% 19%
I was given an unfavorable work assignment(s) 23% 19%
“Retaliation for reporting was at critically high rates across all countries in 2020.
”
GLOBAL TRENDS
In.2020,.the.global.median.for.retaliation.was.61%,.a.large.
increase.from.2015.(40%).and.2019.(33%)..Employees.from.
all.countries.examined.reported.higher.rates.of.retaliation.
than.before..The.largest.jumps.in.retaliation.were.observed.in.Brazil,.China,.
France,.Germany,.Spain.and.the.U.S.,.although.employees.from.India.report.
retaliation.at.the.highest.levels...
Source: The State of Ethics & Compliance in the Workplace: A Look at Global Trends (ECI, 2021)
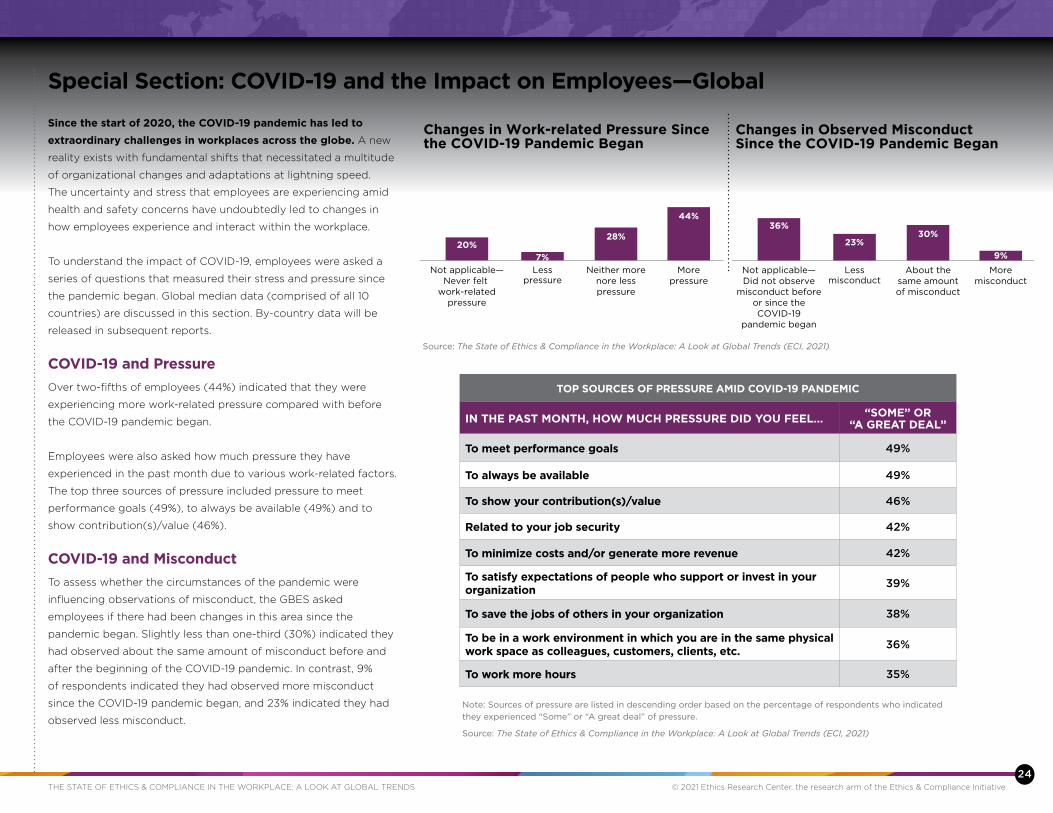
Since the start of 2020, the COVID-19 pandemic has led to
extraordinary challenges in workplaces across the globe. A.new.
reality.exists.with.fundamental.shifts.that.necessitated.a.multitude.
of.organizational.changes.and.adaptations.at.lightning.speed..
The.uncertainty.and.stress.that.employees.are.experiencing.amid.
health.and.safety.concerns.have.undoubtedly.led.to.changes.in.
how.employees.experience.and.interact.within.the.workplace...
To.understand.the.impact.of.COVID-19,.employees.were.asked.a.
series.of.questions.that.measured.their.stress.and.pressure.since.
the.pandemic.began..Global.median.data.(comprised.of.all.10.
countries).are.discussed.in.this.section..By-country.data.will.be.
released.in.subsequent.reports..
COVID-19 and Pressure
Over.two-fifths.of.employees.(44%).indicated.that.they.were.
experiencing.more.work-related.pressure.compared.with.before.
the.COVID-19.pandemic.began..
Employees.were.also.asked.how.much.pressure.they.have.
experienced.in.the.past.month.due.to.various.work-related.factors..
The.top.three.sources.of.pressure.included.pressure.to.meet.
performance.goals.(49%),.to.always.be.available.(49%).and.to.
show.contribution(s)/value.(46%)..
COVID-19 and Misconduct
To.assess.whether.the.circumstances.of.the.pandemic.were.
influencing.observations.of.misconduct,.the.GBES.asked.
employees.if.there.had.been.changes.in.this.area.since.the.
pandemic.began..Slightly.less.than.one-third.(30%).indicated.they.
had.observed.about.the.same.amount.of.misconduct.before.and.
after.the.beginning.of.the.COVID-19.pandemic..In.contrast,.9%.
of.respondents.indicated.they.had.observed.more.misconduct.
since.the.COVID-19.pandemic.began,.and.23%.indicated.they.had.
observed.less.misconduct..
Changes in Work-related Pressure Since the COVID-19 Pandemic Began
Not applicable—Never felt
work-relatedpressure
Lesspressure
Neither morenore lesspressure
Morepressure
20%7%
28%
44%
Changes in Observed Misconduct Since the COVID-19 Pandemic Began
Not applicable—Did not observe
misconduct beforeor since theCOVID-19
pandemic began
Lessmisconduct
About thesame amountof misconduct
Moremisconduct
36%
23%30%
9%
THE.STATE.OF.ETHICS.&.COMPLIANCE.IN.THE.WORKPLACE:.A.LOOK.AT.GLOBAL.TRENDS ©.2021.Ethics.Research.Center,.the.research.arm.of.the.Ethics.&.Compliance.Initiative
24
Special Section: COVID-19 and the Impact on Employees—Global
TOP SOURCES OF PRESSURE AMID COVID-19 PANDEMIC
IN THE PAST MONTH, HOW MUCH PRESSURE DID YOU FEEL… “SOME” OR “A GREAT DEAL”
To meet performance goals 49%
To always be available 49%
To show your contribution(s)/value 46%
Related to your job security 42%
To minimize costs and/or generate more revenue 42%
To satisfy expectations of people who support or invest in your organization
39%
To save the jobs of others in your organization 38%
To be in a work environment in which you are in the same physical work space as colleagues, customers, clients, etc.
36%
To work more hours 35%
Source: The State of Ethics & Compliance in the Workplace: A Look at Global Trends (ECI, 2021)
Note: Sources of pressure are listed in descending order based on the percentage of respondents who indicated
they experienced “Some” or “A great deal” of pressure.
Source: The State of Ethics & Compliance in the Workplace: A Look at Global Trends (ECI, 2021)
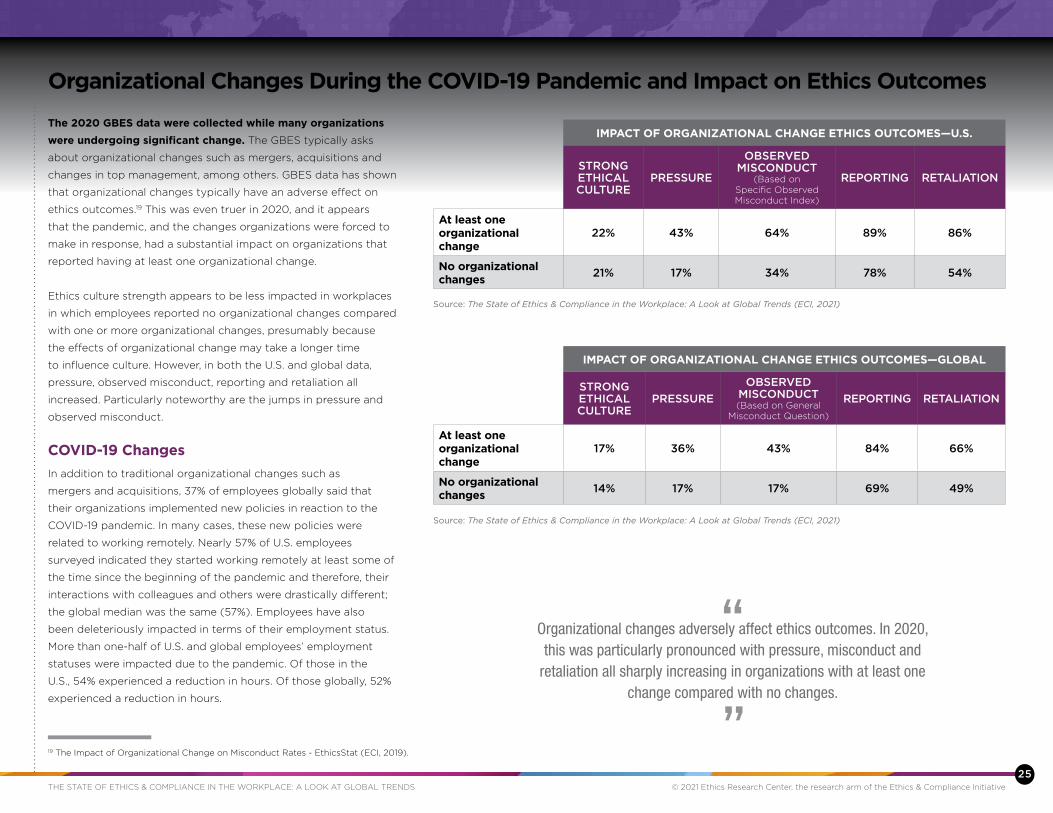
The 2020 GBES data were collected while many organizations
were undergoing significant change. The.GBES.typically.asks.
about.organizational.changes.such.as.mergers,.acquisitions.and.
changes.in.top.management,.among.others..GBES.data.has.shown.
that.organizational.changes.typically.have.an.adverse.effect.on.
ethics.outcomes.19.This.was.even.truer.in.2020,.and.it.appears.
that.the.pandemic,.and.the.changes.organizations.were.forced.to.
make.in.response,.had.a.substantial.impact.on.organizations.that.
reported.having.at.least.one.organizational.change..
Ethics.culture.strength.appears.to.be.less.impacted.in.workplaces.
in.which.employees.reported.no.organizational.changes.compared.
with.one.or.more.organizational.changes,.presumably.because.
the.effects.of.organizational.change.may.take.a.longer.time.
to.influence.culture..However,.in.both.the.U.S..and.global.data,.
pressure,.observed.misconduct,.reporting.and.retaliation.all.
increased..Particularly.noteworthy.are.the.jumps.in.pressure.and.
observed.misconduct...
COVID-19 Changes
In.addition.to.traditional.organizational.changes.such.as.
mergers.and.acquisitions,.37%.of.employees.globally.said.that.
their.organizations.implemented.new.policies.in.reaction.to.the.
COVID-19.pandemic..In.many.cases,.these.new.policies.were.
related.to.working.remotely..Nearly.57%.of.U.S..employees.
surveyed.indicated.they.started.working.remotely.at.least.some.of.
the.time.since.the.beginning.of.the.pandemic.and.therefore,.their.
interactions.with.colleagues.and.others.were.drastically.different;.
the.global.median.was.the.same.(57%)..Employees.have.also.
been.deleteriously.impacted.in.terms.of.their.employment.status..
More.than.one-half.of.U.S..and.global.employees’.employment.
statuses.were.impacted.due.to.the.pandemic..Of.those.in.the.
U.S.,.54%.experienced.a.reduction.in.hours..Of.those.globally,.52%.
experienced.a.reduction.in.hours..
THE.STATE.OF.ETHICS.&.COMPLIANCE.IN.THE.WORKPLACE:.A.LOOK.AT.GLOBAL.TRENDS ©.2021.Ethics.Research.Center,.the.research.arm.of.the.Ethics.&.Compliance.Initiative
25
Organizational Changes During the COVID-19 Pandemic and Impact on Ethics Outcomes
19.The.Impact.of.Organizational.Change.on.Misconduct.Rates.-.EthicsStat.(ECI,.2019).
“Organizational changes adversely affect ethics outcomes. In 2020, this was particularly pronounced with pressure, misconduct and
retaliation all sharply increasing in organizations with at least one change compared with no changes.
”
Source: The State of Ethics & Compliance in the Workplace: A Look at Global Trends (ECI, 2021)
STRONG ETHICAL CULTURE
PRESSURE
OBSERVED MISCONDUCT
(Based.on..Specific.Observed..Misconduct.Index)
REPORTING RETALIATION
At least one organizational change
22% 43% 64% 89% 86%
No organizational changes
21% 17% 34% 78% 54%
IMPACT OF ORGANIZATIONAL CHANGE ETHICS OUTCOMES—U.S.
Source: The State of Ethics & Compliance in the Workplace: A Look at Global Trends (ECI, 2021)
STRONG ETHICAL CULTURE
PRESSUREOBSERVED
MISCONDUCT(Based.on.General.
Misconduct.Question)
REPORTING RETALIATION
At least one organizational change
17% 36% 43% 84% 66%
No organizational changes
14% 17% 17% 69% 49%
IMPACT OF ORGANIZATIONAL CHANGE ETHICS OUTCOMES—GLOBAL

What May Be Coming Ahead: Recessionary Tactics and Impact on Culture Strength—U.S.
We.may.expect.to.see.over.time.as.the.pandemic.continues.to.
impact.organizations.in.the.long.term.are.certain.“recessionary.
tactics”—hiring.freezes.and.production.slowdowns—may.have.an.
impact.on.workplace.ethics..Looking.at.historical.NBES.U.S..data.
may.be.useful.to.understand.what.may.be.coming.(see.footnotes.
on.page.5.for.more.details.about.the.NBES.and.GBES.distinction)..
When.we.look.further.back.to.the.2007-2009.recession.and.
compare.it.with.a.more.“normal”.period.in.2011,.we.again.see.that.
organizations.are.more.likely.to.alter.their.operating.practices.
during.stressful.economic.and.social.times.
In.2009,.organizations.implemented.“recessionary.tactics”.to.a.
greater.degree.than.they.did.in.2011..Compared.with.2011,.more.
employees.were.working.in.organizations.that.had.undertaken.a.
tactic.against.the.recession,.such.as.hiring.freezes.or.production.
slowdowns.20
It.is.important.to.understand.that.as.the.pandemic’s.sustained.
impact.continues,.there.may.be.longer-term.consequences.on.
ethics.cultures..In.2009.and.2011,.culture.strength.dropped.by.
half,.demonstrating.that.“recessionary.tactics”.such.hiring.freezes.
and.production.slowdowns.were.extremely.detrimental.to.strong.
ethics.cultures.
.
The.data.suggest.that.organizations.move.cautiously.forward.
if.implementing.organizational.changes.at.this.time.or.in.the.
upcoming.months..If.the.economy.worsens.and.organizations.
react.by.implementing.recessionary.tactics,.it.is.strongly.advised.
that.they.take.precautionary.action.to.limit.increases.in.pressure,.
misconduct.and.retaliation,.and.support.behaviors.that.epitomize.
a.strong.ethics.culture.
THE.STATE.OF.ETHICS.&.COMPLIANCE.IN.THE.WORKPLACE:.A.LOOK.AT.GLOBAL.TRENDS ©.2021.Ethics.Research.Center,.the.research.arm.of.the.Ethics.&.Compliance.Initiative
26
Source: The State of Ethics & Compliance in the Workplace: A Look at Global Trends (ECI, 2021)
Percentage of Employees Experiencing Strong Ethical Cultures—U.S.
2009
No recessionary tactics
30%
15%
2011
22%
11%
One or more recessionary tactics
20.For.additional.information.about.recessionary.tactics,.see:.Ethics.Resource.Center.
(2009)..NBES.2009.National.Business.Ethics.Survey:.Ethics.in.the.Recession..ERC:.
Arlington,.VA.,.and.ERC.(2011)..National.Business.Ethics.Survey:.Workplace.Ethics.in.
Transition..ERC:.Arlington,.VA.]
21.All.data.shown.are.based.on.U.S..data..
2009(Recession.
Period)
2011(Normal.Period)
PERCENTAGE POINT
CHANGE
Undertook at least one recessionary tactic 78% 60% -18
Hiring freeze 52% 34% -18
Production slowdown 36% 30% -6
Source: The State of Ethics & Compliance in the Workplace: A Look at Global Trends (ECI, 2021)
RECESSIONARY TACTICS—U.S.21

The findings discussed in this report illustrate that employee
conduct around the world has been drastically impacted against
the backdrop of the COVID-19 pandemic. After.more.than.a.
quarter.of.a.century.studying.employee.perspectives.of.ethics.in.
the.workplace,.ECI.research.has.illustrated.that.organizations.that.
take.steps.to.improve.and.strengthen.their.workplace.cultures.
create.a.context.in.which.employee.misconduct.declines..Yet,.in.
light.of.the.worsening.of.three.key.indicators.in.2020.(pressure,.
observed.misconduct.and.retaliation).and.the.status.quo.of.
organizational.culture.strength.since.2017,.trouble.may.be.ahead..
Furthermore,.a.significant.percentage.of.employees.are.not.
working.in.organizations.with.effective.E&C.programs..Without.
an.effective.E&C.program,.senior.leaders.and.organizations.as.a.
whole.will.find.it.very.difficult,.if.not.impossible,.to.improve.their.
workplace.cultures..
These.four.areas.will.be.critical.to.abate.as.organizations.struggle.
with.the.impact.of.COVID-19.on.workplaces.and.the.economy..
Rates.of.misconduct.have.increased.slightly.while.pressure.has.
skyrocketed..In.addition,.if.retaliation.for.reporting.stays.high,.it.
may.be.a.matter.of.time.before.reporting.levels.decrease.as.well..
Reinforcing.and.protecting.employees.who.report.misconduct.
through.anti-retaliation.programs.and.monitoring.is.paramount..
Lastly,.the.data.also.show.that.there.is.a.clear.association.between.
management.level.and.each.of.the.key.areas.discussed.in.this.
report..Overall,.higher.management.levels.are.associated.with.
increased.rates.of.pressure,.observed.misconduct.and.retaliation..
Conversely,.top.managers.are.more.likely.to.work.in.strong.ethical.
cultures.and.to.report.the.misconduct.they.report..
THE.STATE.OF.ETHICS.&.COMPLIANCE.IN.THE.WORKPLACE:.A.LOOK.AT.GLOBAL.TRENDS ©.2021.Ethics.Research.Center,.the.research.arm.of.the.Ethics.&.Compliance.Initiative
27
Conclusions
The Ethics Progress Report—Global
STRENGTHS
..Mirroring.the.U.S..finding,.employees.around.
the.world.are.reporting.misconduct.at.
historic.highs..Since.ECI.began.collecting.
global.data.in.2015,.the.global.median.
for.rates.of.reporting.has.increased.by.23.
percentage.points..
OPPORTUNITIES
..The.global.data.shows.that.fewer.than.one.
in.seven.employees.are.working.in.strong.
ethical.cultures..Furthermore,.the.rate.of.
observed.misconduct.is.increasing.again.
following.a.decrease.in.2019..Lastly,.the.
global.median.for.pressure.to.compromise.
standards.and.the.rate.of.retaliation.are.both.
at.their.highest.levels.ever..
The Ethics Progress Report—U.S.
STRENGTHS
..A.strong.workplace.culture.is.a.crucial.
strategy.for.mitigating.wrongdoing,.and.U.S..
organizations.are.currently.experiencing.one.of.
the.highest.culture.strength.levels.in.20.years.
(topped.only.by.2009)..Among.all.employees,.
top.managers.continue.to.be.most.likely.to.work.
in.strong.ethical.cultures..
..Continuing.a.positive.trend.that.began.in.2013,.
reporting.of.suspected.wrongdoing.is.now.at.a.
historic.high..Compared.with.non-managers,.top.
managers.and.middle.managers.are.much.more.
likely.to.report.misconduct.they.observe..
OPPORTUNITIES
..Following.a.decrease.in.2017,.the.rate.of.
observed.misconduct.is.increasing.again..
Continuing.a.worrying.trend.that.began.in.2013,.
top.managers.and.middle.managers.are.much.
more.likely.to.observe.misconduct.than.non-
managers..This.finding.is.mirrored.by.an.increase.
in.pressure.to.compromise.standards.that.is.
largely.driven.by.higher.rates.of.pressure.among.
top.managers.and.middle.managers...
..In.addition.to.higher.rates.of.misconduct.and.
pressure.to.compromise.standards,.retaliation.
rates.are.at.historic.highs..A.vast.majority.of.top.
managers.and.managers.who.report.saying.they.
have.experienced.retaliation.for.reporting..While.
highest.among.top.managers.and.managers,.
non-management.employees.were.experiencing.
very.high.rates.of.retaliation.as.well..Lastly,.only.
slightly.over.half.(55%).of.top.managers.are.
working.in.organizations.with.effective.E&C.
programs,.while.fewer.than.one.in.four.(23%)..
of.non-management.employees.expressed..
the.same..
“The workplace is a pressure cooker right now for employees in the U.S. and around the world. While employees seem to be withstanding the pressure and reporting more than ever before, the situation is tenuous with increasing rates of misconduct and very high rates of retaliation.
There may be a breaking point.
”

The strength of an organization’s culture is pertinent in mitigating
wrongdoing..This.includes.holding.employees.accountable.for.misconduct,.
taking.the.time.for.management.to.share.information.on.what.is.going.on.in.the.
organization,.ensuring.employees.trust.that.leadership.will.keep.their.promises.
and.commitments,.and.making.sure.that.all.employees.set.a.good.example.of.
ethical.workplace.behavior.
The.strength.of.the.E&C.program.is.extremely.important.in.decreasing.the.
likelihood.of.misconduct.in.an.organization..Below.are.tools.offered.by.ECI.to.
develop.a.strong.E&C.program.that.tempers.wrongdoing.
For Business Leaders in Organizations with No or a Limited E&C Program:
The.time.is.now.to.make.E&C.a.priority..The.following.first.steps.will.make.a.
difference.for.businesses.regardless.of.size.and.industry.
. ..Implement.an.E&C.program.using.a.standard.such.as.ECI’s.resources.for.
an.HQP.(see.below),.the.U.S..Department.of.Justice’s.Guidance.of.Effective.
E&C.Programs.and.ISO.standards..These.resources.provide.guidance.on.
essential.steps.to.establishing.a.robust.ethical.culture.
. ..Develop.or.revisit.your.organization’s.core.values.and.ensure.that.they.
are.woven.into.your.E&C.activities.and/or.program..Define.the.standards.
and.behaviors.that.should.guide.employees’.actions..Regularly.promote.
values.and.expectations.about.employee.behaviors.in.organizational.
communication.
. ..Set.performance.goals.for.senior.leaders.and.managers.to.visibly.support.
the.organization’s.values.and.reinforce.the.importance.of.speaking.up.and.
listening..
ECI.offers.a.free.“tool.kit”.at.www.ethics.org.to.help.you.begin.to.formalize.your.
E&C.program.
For Business Leaders in Organizations with an E&C Program in Place:
Do.not.take.your.established.efforts.for.granted..When.organizations.undergo.
transition.or.circumstances.around.the.organization.changes,.culture.may.erode,.
leading.to.a.rise.in.misconduct.and.retaliation.for.reporting.of.misconduct..
E&C.programs.are.often.slow.to.adjust.to.new.realities.
. •..Regularly.ask.your.employees.about.the.pressure.they.feel.and.reinforce.to.
them.that.performance.without.integrity.is.unacceptable.
. •..Raise.the.bar.for.your.E&C.program..Truly.successful.programs.integrate.E&C.
across.all.aspects.of.the.business..Evaluate.the.effectiveness.and.quality.of.
your.E&C.program.relative.to.the.HQP.standard.and.industry.peers.
. •..Reinforce.the.importance.of.culture.among.managers..Assess.your.culture.
and.provide.additional.support.to.your.business.areas.where.employees.
perceive.it.to.be.weak.
ECI Resources
Details.regarding.ECI’s.High-Quality.Program.(HQP).principles,.the.HQP.
Measurement.Framework.and.our.blue-ribbon.panel.report,.Principles & Practices
of High-Quality Ethics & Compliance Programs,.are.available.to.the.public.at.
www.ethics.org/HQP.
These.resources.help.ethics.and.compliance.professionals.identify.strengths.
and.weaknesses.in.their.E&C.programs.and.track.program.improvement.over.
time..Over.100.leading.practices.categorized.into.27.supporting.objectives.are.
grouped.into.principles.that.drive.a.high-quality.E&C.program.
1. Strategy:.E&C.is.central.to.business.strategy.
2. Risk Management:.E&C.risks.are.identified,.owned,.managed.and.mitigated.
3. Culture:.Leaders.at.all.levels.across.the.organization.build.and.sustain.a.culture.
of.integrity.
4. Speaking Up:.The.organization.encourages,.protects.and.values.the.reporting.
of.concerns.and.suspected.wrongdoing.
5. Accountability:.The.organization.takes.action.and.holds.itself.accountable.
when.wrongdoing.occurs.
Visit.www.ethics.org/HQP.to.learn.more.
THE.STATE.OF.ETHICS.&.COMPLIANCE.IN.THE.WORKPLACE:.A.LOOK.AT.GLOBAL.TRENDS ©.2021.Ethics.Research.Center,.the.research.arm.of.the.Ethics.&.Compliance.Initiative
28
Recommendations

Since 1994, ECI has conducted a longitudinal, cross-sectional study of workplace
conduct from the employee’s perspective..Survey.participants.are.asked.to.provide.
insight.into.the.strength.of.the.ethics.culture.in.their.workplace,.the.instances.of.
misconduct.they.have.observed,.and.what—if.any—efforts.are.underway.in.their.
organizations.to.promote.integrity..The.data.from.the.Global.Business.Ethics.Survey®.
provide.the.international.benchmark.on.the.state.of.E&C.in.business..Historically,.ECI.
reported.findings.from.the.research.under.two.titles:.The.National.Business.Ethics.
Survey®.(NBES®),.which.provided.measures.of.U.S..workplaces;.and.the.Global.Business.
Ethics.Survey®.(GBES®),.which.expanded.the.dataset.to.include.input.from.employees.
around.the.world..In.2017,.ECI.updated.both.the.U.S..and.global.studies.and.combined.the.
research.under.the.GBES.name..
The.2020.GBES.data.collection.took.place.between.August.and.September.2020..
Employees.in.10.countries.were.included.in.the.data.collection..The.2020.GBES..
collected.data.from.14,000.employees..
Participants.in.the.2020.GBES.were.18.years.of.age.or.older,.currently.employed..
at.least.20.hours.per.week.for.a.single.employer.and.working.for.a.company.that..
employs.at.least.two.people..
ECI.established.survey.questions.and.sampling.methodology;.Ipsos.America,.Inc..
managed.data.collection..
Data.collection.mode.and.weighting:.Over.the.years,.the.data.collection.method.has.been.
modified.as.various.third-party.vendors.have.been.secured.by.ECI.to.collect.the.data..
In.2009,.information.about.education.was.not.available;.therefore,.GBES.data.were.only.
weighted.by.age.and.gender..From.2000.to.2017,.data.were.weighted.by.age,.gender.and.
education..In.2020,.data.were.weighted.by.age,.gender,.race/ethnicity.and.geographical.
region..In.2011,.data.were.collected.by.telephone.and.online,.and.data.were.weighted.to.
equalize.the.proportion.of.telephone.respondents.to.online.respondents..In.2013,.ECI.
collected.responses.from.both.telephone.and.online.respondents..Starting.in.2017,.ECI.
exclusively.collected.responses.via.an.online.survey.utilizing.vendors.with.online.panels.
Respondent Demographics
Global.demographics.include.14,000.employees.from.the.10.countries.surveyed.in.the.
2020.GBES.data.collection..U.S..demographics.include.3,320.employees.surveyed.in.the.
U.S.who.worked.at.for-profit.organizations..
THE.STATE.OF.ETHICS.&.COMPLIANCE.IN.THE.WORKPLACE:.A.LOOK.AT.GLOBAL.TRENDS ©.2021.Ethics.Research.Center,.the.research.arm.of.the.Ethics.&.Compliance.Initiative
29
Methodology
COUNTRY EMPLOYEE SAMPLE SIZE
Brazil 1,000
China 1,000
France 1,000
Germany 1,000
India 1,000
Mexico 1,000
Russia 1,000
Spain 1,000
United Kingdom 1,000
United States 5,000*
ORGANIZATION SIZE GLOBAL DEMOGRAPHICS
U.S. DEMOGRAPHICS
2.to.5 5% 5%
6.to.under.20 9% 9%
20.to.under.50 8% 7%
50.to.under.100 9% 8%
100.to.under.250 10% 9%
250.to.under.500 10% 9%
500.to.under.1,000 14% 15%
1,000.to.under.2,500 9% 8%
2,500.to.under.5,000 7% 7%
5,000.to.under.10,000 7% 6%
10,000.to.under.20,000 3% 4%
20,000.to.under.50,000 3% 4%
50,000.to.under.90,000 2% 3%
90,000.or.more 5% 8%*Note: In order to compare to historical data, all U.S. data presented in this report is based
on responses from employees working at for-profit organizations. The total sample size of
the for-profit U.S. data is 3,320.

Respondent Demographics Continued
THE.STATE.OF.ETHICS.&.COMPLIANCE.IN.THE.WORKPLACE:.A.LOOK.AT.GLOBAL.TRENDS ©.2021.Ethics.Research.Center,.the.research.arm.of.the.Ethics.&.Compliance.Initiative
30
Methodology
*Note: Percentages less than 1% are shown to one decimal place.
JOB POSITION GLOBAL DEMOGRAPHICS
U.S. DEMOGRAPHICS
Top.management.(e.g.,.CEO/
president,.C-suite)13% 12%
Middle.management.(e.g.,.director,.
persons.managing.multiple.reports)23% 24%
First-line.direct.supervisor.with.
direct.reports28% 20%
Individual.contributor/Not.a.member.
of.management37% 44%
INDUSTRY GLOBAL DEMOGRAPHICS
U.S. DEMOGRAPHICS
Technology 15% 20%
Education 9% 5%
Manufacturing 8% 8%
Retail.trade 7% 9%
Government 6% <1%
Construction 6% 5%
Medical 6% 8%
Finance.and.banking 6% 6%
Professional,.scientific.and.technical.
services4% 5%
Transportation.and.warehousing,.
waste.management3% 3%
Other.services:.personal.services,.
repairs,.civic/professional/social/
religious/etc..organizations
3% 3%
INDUSTRY GLOBAL DEMOGRAPHICS
U.S. DEMOGRAPHICS
Accommodation.and.food.services 2% 2%
Automotive 2% 2%
Insurance 2% 3%
Arts,.entertainment.and.recreation 2% 2%
Wholesaling 2% 1%
Real.estate.(commercial.and/or.
residential),.rentals.and.leasing1% 2%
Nonprofit.(other.type.not.listed) 1% <1%
Information,.media.(e.g.,.cable,.
publishing,.radio,.social.media)1% 1%
Management.of.companies.and.
enterprises1% <1%
Agriculture,.forestry,.fishing.and.
hunting1% <1%
Utilities:.electric,.gas,.water 1% <1%
Aerospace.and.defense <1% <1%
Mining:.oil,.coal,.other.materials..
and.ores<1% <1%
Other 8% 10%

ECI’s longitudinal research on workplace integrity provides insights for
evidence-based decisions by corporate, academic and other institutions across
the globe. Corporations, foundations, and individuals invest in the work of ECI
because they value the research it provides. .
We.are.grateful.for.the.generosity.of.our.funders.and.appreciate.their.ongoing.
support..Without.their.investments.in.our.research,.ECI.could.not.collect.data.
from.employees.around.the.world.and.provide.mission-critical.reports.for.business.
leaders.and.the.ethics.&.compliance.community..
With.your.ongoing.support,.ECI.will.continue.to.sustain.its.longitudinal.data.
collection.while.expanding.its.focus.on.special.topics.of.interest.to.the.ethics.&.
compliance.community..
Consider.joining.this.illustrious.group.of.funders.to.help.ECI.continue.its.research.
efforts..By.joining.this.distinguished.group.of.organizations,.you.will.demonstrate.
an.investment.to.your.stakeholders,.employees.and.customers..Additionally,.it.
reinforces.to.the.business.community.and.the.public.at.large.an.organizational.
commitment.to.ethics.&.compliance.issues...
Your.support.provides.the.opportunity.to.expand.our.reach.to.serve.others.in.
meaningful.ways..Let’s.continue.to.make.this.important.research.possible..Become.
a.funder.today!.
Contact.Information
Tel:.571-480-4417..
Email:[email protected]
www.ethics.org/donate
THE.STATE.OF.ETHICS.&.COMPLIANCE.IN.THE.WORKPLACE:.A.LOOK.AT.GLOBAL.TRENDS ©.2021.Ethics.Research.Center,.the.research.arm.of.the.Ethics.&.Compliance.Initiative
31
Our Funders
Since 1994, ECI has conducted a longitudinal, cross-sectional study of workplace conduct
from the employee’s perspective..Survey.participants.are.asked.to.provide.insight.on.a.
variety.of.topics,.including.the.strength.of.the.ethics.culture.in.their.workplace,.the.instances.
of.misconduct.that.they.have.observed.and.what,.if.any,.efforts.are.underway.in.their.
organization.to.promote.integrity..
The.data.from.the.Global.Business.Ethics.Survey®.(GBES®).provide.the.international.
benchmark.on.the.state.of.E&C.in.business.across.the.globe..The.2020.GBES.is.the.sixteenth.
iteration.of.the.GBES.(formerly.NBES)..In.2020,.the.GBES.surveyed.over.14,000.employees.
in.10.countries.(approximately.5,000.employees.in.the.United.States.and.1,000.employees.
in.each.of.the.other.nine.countries)..Research.content.from.the.GBES.is.released.through.
reports,.infographics,.EthicsStats®.and.other.formats..
For.more.information.about.GBES.research.and.to.access.previous.reports,.please.visit.our.
website.at.www.ethics.org/GBES.
THE.STATE.OF.ETHICS.&.COMPLIANCE.IN.THE.WORKPLACE:.A.LOOK.AT.GLOBAL.TRENDS ©.2021.Ethics.Research.Center,.the.research.arm.of.the.Ethics.&.Compliance.Initiative
32
About GBES

THE.STATE.OF.ETHICS.&.COMPLIANCE.IN.THE.WORKPLACE:.A.LOOK.AT.GLOBAL.TRENDS ©.2021.Ethics.Research.Center,.the.research.arm.of.the.Ethics.&.Compliance.Initiative
33
You’re busy. Stay informed.Subscribe to The Daily Brief to stay on top of the issues.
4 Cut through the clutter and focus on the top E&C articles, blogs and opinions every weekday
4 Exclusively focused on trends, regulations and enforcement issues you NEED to know as an E&C professional
4 Carefully curated each day from thousands of articles
ethics.org/subscribe
SUBSCRIBE FOR FREE TODAY!
TM
Share your expertise.Join an ECI
Working Group.
Groups are limited to ECImembers and some topics covered include:
4 E&C in Business Strategy.
4 Identifying & Mitigating Risk.
4 Building a Culture of Integrity.
4 Encouraging & Protecting the Reporting of Concerns.
4 Ensuring Accountability
NewWorking
Groups are Forming
Now.
To.join.a.working.group,contact.Dan [email protected].
TM

THE.STATE.OF.ETHICS.&.COMPLIANCE.IN.THE.WORKPLACE:.A.LOOK.AT.GLOBAL.TRENDS ©.2021.Ethics.Research.Center,.the.research.arm.of.the.Ethics.&.Compliance.Initiative
34
Assess Your Ethics & Compliance Program with Metrics that Matter.The ECI High-Quality Program Assessment Tool gives you the quantitative analysis to measure your program’s maturity and effectiveness.
4 Identify strengths and weaknesses
4 Compare benchmarks
4 Track progress over time
SCHEDULEYOUR
ASSESSMENT TODAY.
ethics.org/hqp
HQP is a benefit of ECI membership.
Fill your ethics and compliance jobs faster with ECI’s Career Center. We offer effective recruitment solutions that connect you with qualified professionals.
EMPLOYERS:Find Your Next Great Hire
Quickly connect with thousands of highly engaged professionals through same-day job postings. Questions? Contact [email protected].
EMAIL your job to E&C professionals
PLACE your job in front of highly qualified ECI members and job seekers
SEARCH our resume database of qualified candidates
MANAGE jobs and applicant activity right on our site
LIMIT applicants only to those who fit your requirements
FILL your jobs more quickly with great talent
https://careers.ethics.org

The State of Ethics & Compliance in the WorkplaceA Look at Global Trends
Ethics.&.Compliance.Initiative.
2650.Park.Tower.Drive,.Suite.802.
Vienna,.VA.22180
ETHICS.ORG